


Languages
Pages
Legal


The Accounting Consequences of Accelerated Share Repurchases (June 2009)
Victoria Dickinson
University of Florida
Paul Kimmel
University of Wisconsin – Milwaukee
Terry Warfield*
University of Wisconsin - Madison
* Corresponding author University of Wisconsin – Madison 975 University Avenue, Madison, WI 53706 Telephone: (608) 262-1028 / Fax: (608) 263-0477 Email: [email protected] The authors appreciate the helpful comments of Hollis Ashbaugh-Skaife, Mary Ellen Carter, Changling Chen, Xia Chen, Qiang Cheng, Shana Clor-Proell, Mark Kohlbeck, Ting Luo, Carol Marquardt, Nicole Thorne-Jenkins, Ray Pfeiffer, Greg Sommers and the workshop participants at the Wisconsin School of Business and session participants at the 2008 AAA Meeting in Anaheim, CA.
The Accounting Consequences of Accelerated Share Repurchases
Abstract
Structured financial transactions create many challenges for financial statement
classifications. Our study evaluates the representational faithfulness of the accounting
treatment of one rapidly growing structured transaction, Accelerated Share Repurchases
(ASRs). In an ASR, a company executes a share repurchase while concurrently entering
into a forward contract with an investment bank. ASRs are popular because accretive
earnings per share benefits are recognized immediately while any gains or losses on the
forward contract bypass income and are reported directly in equity. We examine the
accounting consequences of ASRs, based on an assessment of value relevance of assets
and liabilities and earnings response coefficients for ASR companies. We document
lower value relevance for the assets and liabilities of ASR companies compared to an
industry matched sample. ERC tests also indicate a market discount for the earnings of
ASR companies compared to the industry matched sample. Our findings indicate that the
current accounting for ASRs does not result in representative reporting of these
transactions. The current accounting treats ASRs as equity transactions, but our results
suggest that the market perceives the resulting benefits or obligations of ASRs as either
assets or liabilities. Thus, our analysis is relevant to current standard-setting projects that
address the distinction between debt and equity.
Keywords: Share repurchase; Off-balance sheet accounting; Derivative accounting
1
1. Introduction
A recent innovation in stock repurchase execution, the accelerated share repurchase
(ASR) has gained in popularity in recent years. For example, ASRs as a percentage of
aggregate repurchases have increased from approximately 0.5 percent in 2002 to
approximately 14 percent in 2007. This is an important phenomenon given that aggregate
repurchases for S&P corporations (which include the bulk of our sample) almost tripled
during this same period. The growth of ASRs is not surprising, because current
accounting for these transactions results in an immediate boost to EPS. Some have
suggested that the current accounting treatment does not result in financial statements that
accurately reflect the assets, obligations, and income effects arising from execution of the ASR.
Because of their growing popularity and their potential misrepresentation in financial
statements, the market’s interpretation of these transactions is of interest.
Rather than purchasing shares on the open market, in an ASR, companies purchase
shares from an investment bank. The investment bank borrows these shares from
investors (shorts the shares) and requires the company to enter into a forward sale
contract to protect the investment bank’s short position. At a later date, the investment
bank purchases the shares on the open market. If share prices increase, the company will
owe the investment bank money as a result of the forward contract (or it will be owed
money if stock prices fall). The company settles the forward contract with the investment
bank with either cash or shares.
As is discussed more fully below, the ASR structure is attractive because it generally
permits more immediate EPS accretion. However, while the ASR is outstanding the
company is exposed to changes in the value of its shares which create a future obligation
(receivable) if share prices increase (decrease). Under current GAAP the forward contract
2
is considered an equity instrument. As a consequence, the company’s exposure to
changes in the value of the forward sale agreement, while the contract is outstanding,
remains off balance sheet. That is, the balance sheet does not reflect the potential ASR
asset or liability prior to settlement. In addition to balance sheet misrepresentation,
earnings of the ASR company may be misrepresented since the gains and losses at
settlement of the forward sale agreement are recorded as adjustments to equity and thus
bypass income.
In this paper we investigate the accounting consequences of ASRs by examining the
market pricing of assets and liabilities of ASR companies compared to other companies
in the same industry. If the accounting for ASRs results in less representative reporting
of ASRs due to off-balance sheet assets and liabilities, then the market will likely value
the off-balance sheet amounts (as measured by their associations with prices), indicating
reduced value relevance of ASR company balance sheets. We also examine the market’s
assessment of ASR transactions based on associations between stock returns and earnings
(earnings response coefficients - ERCs), conditional on whether a company executes an
ASR. If the accounting for ASRs results in less representative reporting of earnings, we
expect ASR companies’ ERCs to be lower.
The value relevance results indicate that the off-balance sheet ASR liabilities of
ASR companies are value relevant compared to a matched sample of companies in the
same industry that execute traditional share repurchases. Thus, ASR balance sheets are
not faithful representations of these transactions. ERC tests also indicate that the market
discounts the earnings of ASR companies compared to their industry counterparts. In
3
addition to the use of a matched sample design, we control for documented determinants
of ERCs and we also perform time-series tests, based on ASR companies only.
There could be concern that our results could be attributed to characteristics of
companies executing share repurchases via an ASR. Thus, we also conduct a two-stage
least squares analysis to control for the possibility that our documented ASR effects are
due to the endogenous choice of the repurchase decision, in general. Our results are
robust to these various sensitivity tests. In summary, our findings indicate that the
financial statements of companies executing ASR treasury stock transactions are not
representationally faithful to the substance of these transactions.
The analyses in this paper are important because there is a growing trend in the use of
ASRs, as discussed earlier. We document that the aggregate dollar value of ASR
contracts has increased from $300 million in 2002 to $52.75 billion in 2007. More
importantly, individual ASR repurchase contracts have increased from an average of
$100 million to $620 million during the same time period, which suggests that potential
risk of material financial statement misrepresentation inherent in these contracts is
increasing. Our results suggest that current accounting results in off-balance sheet assets
and liabilities and unrecorded gains and losses, all of which the market finds value
relevant.1
Furthermore, ASRs and the accounting challenges associated with the financial
instruments used to execute ASRs are representative of the variety of securities with a
mix of debt and equity characteristics (e.g. redeemable preferred stock). The FASB and
IASB are working to develop an accounting framework for these securities that will
1 Unrecorded losses are of particular significance in light of the Marquardt et al. (2009) evidence that ASR usage is more prevalent in companies that use EPS in compensation contracts.
4

result in more representative reporting for these securities and address the concern that
the widespread use of structured financial transactions, such as ASRs, has diminished the
usefulness of the current reporting model. The FASB has developed a preliminary view
that redefines equity to comprise only a company’s most residual security. Under this
approach, the forward contract used in an ASR would no longer receive equity treatment.
Our findings are important because they increase our understanding of the market’s
perception of transactions such as ASRs that “straddle the line” between debt and equity,
the current reporting of which may not be representationally faithful.
While we were able to develop a measure of the off-balance sheet asset/liability and
unrealized gain/loss that result from ASR transactions, it was a costly process that
involved hand-collection of data and technical ability to digest the information that was
presented in a non-uniform manner. This is one reason why the FASB and IASB in their
Conceptual Frameworks note that disclosure is not an acceptable substitute for
recognition (FASB SFAC No. 5). Our findings are consistent with the FASB’s
preliminary view on a new general classification for structures like ASRs that would
require recognition of the liabilities/assets and gains/losses arising from ASRs.2
The remainder of the paper is organized as follows. In section 2 we provide
background, including prior literature on stock repurchases, and we describe ASRs and
the limited extant research addressing ASRs. In section 3, we describe the sample and
data. Section 4 introduces the empirical tests and reports the results of our analysis,
including sensitivity tests. Section 5 provides a summary and conclusions.
2 While this approach may eliminate a key incentive for ASR execution and result in more representative reporting of ASRs, some have concerns about the application of this approach to all securities with debt and equity features (FRPC 2009),
5

2. Background, Motivation, and Research Question
2.1 Stock Buy-Backs
Recently, stock repurchases have gained on cash dividends, as a vehicle for
distributing assets to owners. Indeed, Grullon and Michaely (2002) document that the
total value of share repurchases exceeds that of dividends. And according to a Standard
and Poors’ study, stock repurchases among the S&P 500 companies totaled more than
$367 billion in 2006 compared to just $131 billion in 2003 (Standard and Poor 2007;
Marquardt et al. 2009).
Academic research has primarily focused on studying the motivations for
treasury stock transactions. One motivation is related to providing a signal to outside
parties about the value of the company. Stock repurchases can also be used to alleviate
agency problems arising from the over-consumption of perquisites (perks). Because
treasury stock transactions reflect a distribution of assets to owners, much of the research
focuses on how treasury stock transactions can be distinguished from cash dividends.
Some research has examined the relationship between share repurchases and the
existence of stock option plans (see Skinner 2008 for a summary of extant stock
repurchase research).
Of most relevance to our study is research examining the achievement of EPS
targets through treasury stock transactions. Indeed, executives state that repurchases
have gained favor primarily because they are less “sticky” than dividends and that they
increase EPS (Brav et al. 2005, Badrinath and Varaiya, 2001). The results in Bens et al.
(2003) support this motivation and Hribar et al. (2006) investigate whether managers use
repurchases to beat analysts’ EPS forecasts. They find a disproportionately large number
6

of share repurchases among companies that would have otherwise missed analysts’
forecasts. However, the market appears to “see through” the earnings management,
discounting the repurchase-induced component of the earnings surprise.3
With respect to the motivation to use an ASR to increase EPS, Marquardt et al.
(2009) suggest that companies choose ASRs rather than open market stock repurchases
because of compensation contracts tied explicitly to EPS. They note that the EPS
increasing impact of ASRs is both more immediate and more significant than that of an
open market repurchase. They provide evidence that companies whose bonus contracts
explicitly refer to EPS are more likely to employ ASRs. The prior research on stock
repurchases (including ASRs) has focused on determining the economic incentives for
these transactions.4 However, past research of share repurchases has not focused on the
accounting treatment of share repurchases because the accounting treatment of traditional
share repurchases is uncontroversial. As noted above, the accounting for ASRs is
controversial but it has received little attention by accounting researchers. We discuss the
accounting issues surrounding ASRs in the next section.
2.2 Accelerated Share Repurchases
An accelerated share repurchase (ASR) is an innovation in treasury stock
transaction execution, which has the potential to magnify the benefits of stock
repurchases. ASRs have increased in popularity recently, with an estimated $24 billion
3 While Bens et al. (2003) posit that companies are myopic with respect to EPS, Guay (2002) argues that analysts likely incorporate the effect on EPS into their forecasts. Guay (2002) suggests that, because the Bens et al. (2003) results are in a period of economic growth, companies did not need EPS management via repurchases to sustain increases in EPS. 4 Both Marquardt et al. (2009) and Chemmanur et al. (2009) examine firms’ rationale for executing share repurchases through an ASR compared to open market repurchases. They do not provide evidence on the accounting effects of ASR’s. As part of our sensitivity analysis, we consider the variables identified in their papers as determinants of ASRs.
7

of repurchases involving 51 companies from 2002 to 2005 [see Bear Stearns (2005) and
Maremont and Ng (2006)] and we identify another 156 ASR transactions in 2006 and
2007, with ASRs representing 14 percent of aggregate repurchases in 2007 (compared to
just 0.2 percent in 2002).5
Structure of ASRs -- ASRs are stock repurchases that are combined with forward
sale agreements. A company purchases its own shares from an investment bank at the
current market price. In order to have sufficient shares to sell to the company, the
investment bank borrows shares from investors (shorts the shares). Concurrent with this
initial purchase of shares, the company enters into a forward sale contract with the
investment bank to protect the investment bank’s short position. The forward sale
contract requires the company to sell the investment bank shares at today’s market price
at an agreed-upon date in the future. In the period between the initiation of the ASR and
the settlement of the forward sale contract, the investment bank covers its short position
by buying shares on the open market to replace the borrowed shares.
On the settlement date of the forward sale contract, the company and investment
bank settle the contract for the difference between the original market price and the
weighted share price paid by the investment bank on the shares it purchased to close its
short position. If the investment bank pays more for the open market purchases than the
company’s contractual ASR price, the company must reimburse the investment bank for
the difference.6 The company can choose to reimburse the investment bank with either
5 We add another 43 ASR contracts to the initial sample published in the Bear Stearns research report, bringing the total ASR contracts between 2002 and 2005 to 94. 6 Some companies contractually cap their potential losses at settlement through “collar” agreements. Collars were used with increasing frequency over our sample period, however, the collars limit the magnitude of unrealized gains and losses and as such, will bias against finding a market reaction to the off-balance sheet amounts.
8

cash or additional shares. If the investment bank pays less than the contractual ASR
price, the investment bank must reimburse the company.
Accounting Treatment of ASRs -- Under current accounting standards, companies
account for ASRs as two separate transactions. First, an entry is made to record the
purchase of treasury stock. Second, the company accounts for a forward sale contract (a
derivative), which it treats as an equity instrument. Because the derivative is tied to the
company’s own stock and the company has the option to settle by issuing shares, under
current GAAP the company is not required to adjust the recorded value of the derivative
to its fair value (mark-to-market) over its duration. Instead, any amount paid or received
at the time of the final settlement is recorded as an adjustment to stockholders’ equity
(with no income effects).
Gains and losses resulting from transactions that may be settled with a choice of
cash or the company’s own equity shares are not reflected in earnings under current
accounting standards (EITF No. 99-3). Thus, under current accounting, the unrecorded
gains or losses on the outstanding forward contract represent potential off-balance-sheet
assets or liabilities with settlement gains and losses recorded in equity, bypassing income.
To the extent that the forward sale contract represents an asset or liability, some argue
that the forward contract should not receive equity treatment (Bear Stearns, 2005). This is
because the forward contract represents future contractual cash inflows or outflows
depending on changes in stock price subsequent to the ASR initiation. Thus, the ASR
contract should instead be recognized as an asset/liability with gains and losses recorded
9
directly in income (rather than bypassing the income statement and being recorded
directly in equity as is currently the case).7
Computation of EPS --In computing diluted EPS, management’s intended form of
settlement dictates the effect of the settlement costs on diluted EPS. If management
intends to settle an unfavorable difference with shares, the number of shares outstanding
is increased and the previously elevated EPS computed at the recording of the initial
contract number is subsequently reduced through the higher number of shares
outstanding. This means that the previous boost to EPS was temporary. On the other
hand, if management intends to pay the difference with cash, then any unrealized gains or
losses on the forward contract are reflected as a reduction in the numerator (net income)
of the diluted EPS calculation at the time of settlement (which could occur in a different
time period than the original contract execution period).8
While companies are required to disclose the details of ASRs in SEC filings, the
adequacy of these disclosures has been criticized. To quote Bear Stearns: “…clear and
understandable disclosure in this area is spotty at best.” The FASB and IASB both have a
project on their agendas with implications for the accounting for ASRs. As discussed
7 The current structure of accelerated share repurchases has emerged in response to accounting standard changes as promulgated in FAS No. 150 (FASB 2003). Prior to FAS No. 150, companies used put options rather than forward sale agreements to execute ASRs. These put options were not marked-to-market, but recorded directly in shareholders’ equity. FAS No. 150 requires companies to classify these derivatives as assets and liabilities with changes in fair value recorded in the income statement. As a consequence of this new treatment, the use of put options as vehicles for EPS improvement fell out of favor. Our study focuses on the more recent ASR structure. 8 FAS. No. 128 – “Contracts that may be Settled in Stock or Cash” discusses the computation of EPS with respect to the ASR plan. EITF 00-19 – “Accounting for derivative financial instruments indexed to and potentially settled in a company’s own stock,” discusses the intent of management in the computation of diluted EPS. The “management intent” criterion opens the door for EPS management. While most companies ultimately settle in cash (57.72 percent in our sample), virtually all companies generally assume share settlement when calculating diluted EPS (Bear Stearns, 2005). By assuming share settlement, rather than cash settlement, companies achieve higher diluted EPS in the period of contract execution.
10

earlier, in its preliminary views document related to liabilities and equity, the FASB has
proposed to restrict the types of securities that would be classified as equity. Under this
proposal, the company’s exposure on the forward contracts used in ASRs would be
recorded as assets or liabilities with the gains and losses on settlement reported in
earnings. In the conclusion to this paper we discuss the merits of this proposal in light of
our empirical findings.9
Benefits / Disadvantages of ASRs Relative to Traditional Repurchases -- As noted
above, treasury stock transactions can signal the market that management believes that
the company’s stock is under-priced while providing an increase in earnings per share.
An ASR can magnify each of these benefits relative to a traditional repurchase program.
First, the potential positive signal sent by an ASR is stronger because, rather than simply
stating that it plans to repurchase shares in the future, under an ASR, management
actually repurchases shares immediately. Under a traditional repurchase plan, companies
often announce plans to repurchase shares, but then fail to fulfill their announced
intentions.10 The ASR ensures that the company actually executes the treasury stock
repurchase. In addition, an ASR results in an immediate, positive effect on EPS via share
accretion that decreases the weighted average number of shares used in the denominator
of the EPS formula. Under a traditional plan the improvement in EPS does not occur
until the shares are actually repurchased, which is often long after the plan is announced.
9 See: http://www.fasb.org/project/liabeq.shtml. A related project addresses EPS calculations related to ASRs. In this project, the FASB and IASB have proposed to eliminate diversity in the accounting for the dilutive EPS effects of ASRs by requiring that companies assume share settlement of the forward contract (see: http://www.fasb.org/project/short-term_intl_convergence.shtml). 10 Contrary to the strength of the signaling mechanism found in prior research, Marquardt et al. (2009) find no difference in the short window market reactions to ASR and traditional stock repurchase announcements.
11

ASRs also have disadvantages. The actual cost of the share repurchase as well as
its ultimate effect on the number of shares outstanding is not known until the company
and investment bank settle the forward contract. If the company’s stock price increases,
and it settles with cash, the total cost of the share repurchase increases. If it settles by
issuing additional shares, the share accretion from the initial share repurchase is reduced.
Thus, the ASR transaction exposes existing shareholders to uncertainty in the form of
potential future costs, as well as potential EPS surprises. Another disadvantage of an
ASR relative to a traditional treasury stock transaction is that under an ASR the company
loses the flexibility to purchase its shares when market conditions are most favorable.
Instead, it is committed to settle the forward contract, even if its stock price increases
substantially.
2.3 Research Question
The discussion above raises important questions about the accounting
consequences of ASRs. In this paper we address whether the amounts reported in
financial statements reflect the company’s exposure to changes in the value of the asset or
liability arising from the ASR. We use standard value relevance tests (e.g., Landsman
1986; Barth 1991; and Pfeiffer 1998) to assess effects of ASRs on the value relevance of
the assets and liabilities of ASR companies. If the market “prices” the off-balance sheet
components associated with the ASR contracts, we assert that the balance sheet does not
12

reflect information that the market deems value relevant.11 We also examine variation in
the association between returns and earnings (ERCs) to provide evidence of the
consequences of recording gains and losses on the forward contract in equity rather than
income. If the accounting for ASRs results in less representative reporting of ASR
company earnings, we expect ASR companies’ ERCs to be lower.
3. Sample and Data
The sample is comprised of companies listed on the NYSE, AMEX, or NASDAQ
exchanges and extends from 2002 to 2007. Companies are excluded that lack the
necessary data on Compustat or CRSP to compute quarterly stock returns, earnings, book
value, and share measures. The following observations are excluded to avoid problems
with small denominators: 1) companies with total assets, common equity, or revenues
less than $1 million; 2) companies with less than 1 million shares outstanding; and 3)
companies with an ending stock price of less than $1. The final target sample consists of
101,240 company-quarter observations.
Companies in the target sample are first identified as repurchase or non-
repurchase companies. A repurchase company is identified in one of three ways: 1)
companies that have been identified as using accelerated share repurchases through
11 Note that tests based on share prices as a dependent variable can be susceptible to scale effects. Easton and Sommers (2003) find price-level regressions can be driven by firms with large share prices which causes non-linearity in the relation between market capitalization and financial statement variables. Our results are robust to using a variety of scales (number of shares, assets, and sales revenue) but we also perform returns regressions to make certain that our findings are not the result of the scale effect documented in Easton and Sommers.
13

inspection of 10-Q’s and 10-K’s12, 2) companies that use the treasury stock method to
account for stock repurchases as evidenced by an increase in the treasury stock account,
or 3) companies that use the retirement method to account for stock repurchases as
evidenced by a zero balance in the treasury stock account accompanied by a positive
value for net stock purchases (stock purchases less stock issuances) (Fama and French
2001; Skinner 2008). Of the 101,240 company-quarter observations in the total sample,
26,588 company-quarters, or 26.26 percent of the sample contained a repurchase as
defined above.13
Within the repurchase subsample, companies are further classified as ASR
companies (using the first identification method from above) or traditional repurchase
companies (using the second and third identification methods from above). Because
ASR contracts may take more than one quarter to complete, a company is flagged as an
ASR company in any quarter in which it: 1) executes the initial contract (as long as it is
still outstanding at the end of the quarter), and/or 2) the contract is outstanding (in cases
where it was executed in a previous quarter). The ASR sample contained 250 company-
quarters (0.25 percent of the total sample) representing 129 unique companies.14 While
12 A computer program was developed with an algorithm to search annual and quarterly reports for specific text substrings. The search terms used were “accelerated stock repurchase”, “accelerated share repurchase”, “accelerated stock buyback”, “accelerated share buyback”, “overnight stock repurchase”, “overnight share repurchase”, “overnight stock buyback”, “overnight share buyback”, “broker-dealer counterparty transaction” and “privately negotiated repurchase”. The flagged reports were read to collect specific details of the nature, timing, and amount of the accelerated share transaction. 13 Observations in which greater than 20 percent of the outstanding shares were repurchased are excluded from the sample because it is possible that these repurchases were executed by tender offer (Hribar, Jenkins and Johnson 2006). 14 Of the 250 ASR observations, only 130 were also identified as repurchases using the treasury stock and/or retirement method. This suggests two possibilities: 1) some companies that use ASRs also use traditional repurchase methods; or 2) common proxies used to identify companies that repurchase shares are likely to miss some companies that use accelerated contracts to execute the repurchase.
14
the overall percentage of firms using ASRs is small, the contracts continued to increase in
usage throughout 2007 (Table 1 in this study; Taub 2007).
The 250 company-quarters represented 165 different contracts, 123 of which were
settled during the sample period, and 42 of which were outstanding at the end of 2007.
The number of company-quarter observations is larger than the number of individual
contracts, because the contracts are often outstanding for more than one quarter. Of the
123 contracts that were settled during the sample period, 49 (39.8 percent) were gain
settlements, while 74 (60.2 percent) were loss settlements. Of the 49 gain settlements, 17
(34.7 percent) were settled in cash, 27 (55.1 percent) in shares, and five (10.2 percent) did
not disclose the method of settlement in their footnotes. Of the 74 loss settlements, 53
(71.6 percent) were settled in cash, 10 (13.5 percent) in shares, and 11 (14.9 percent) did
not disclose the method of settlement in their footnotes.
Because the number of ASR transactions is relatively small, a matched sample
design is utilized to improve the power of the empirical tests. Each ASR observation is
matched to two traditional repurchase and to two non-repurchase companies closest to its
size (measured by total assets) in the same industry as defined by the Fama-French
twelve-industry classifications. This procedure results in a final sample of 1,250
company-quarter observations consisting of 250 ASR observations, 500 traditional
repurchase observations and 500 non-repurchase observations. Table 1 presents the
yearly distribution of the final sample and the distribution of ASR observations across
industries. ASR contracts increased substantially over the 2005 to 2007 period. Further,
the use of ASR contracts is most prevalent in the manufacturing, utilities, and financial
services, and service sectors.
15
Table 2 provides descriptive statistics and Table 3 presents the correlation matrix
for the sample. While the companies are similar in assets by design, earnings per share
are substantially higher on average for ASR companies ($0.70 per share) than for non-
repurchase companies ($0.55 per share). This is consistent with the accretive effects of
the ASR contracts. Both ASR and traditional repurchase companies have a lower
incidence of losses (six and five percent, respectively) compared to non-repurchase
companies (13 percent).
The market to book ratio is comparable between ASR companies (2.95) and
traditional repurchase companies (2.97) but both are substantially lower than non-
repurchase companies (3.26), which indicates repurchase companies may be experiencing
less growth than companies that do not repurchase stock. Risk, as measured by market
model beta, is similar for ASR and repurchase companies (0.89 and 0.91, respectively)
but is slightly lower than that of non-repurchase companies (0.94). The degree of
leverage, captured by the debt-to-assets ratio, is highest for non-repurchase companies
(0.28); whereas ASR and traditional repurchase companies exhibit smaller debt-to-assets
ratios (0.22 for both ASRs and traditional repurchase companies). Profitability, as
measured by return on assets, is higher for repurchase companies (4.86% for traditional
repurchase companies and 6.20% for ASR companies) than for non-repurchase
companies (3.48%).
Companies that use ASR contracts generally repurchase more value than
companies using only traditional repurchase arrangements. Over our entire sample
period, the average value of traditional repurchases is $212.73 million, while companies
that use ASRs repurchase a total of $449.27 million (of the $449.27 million, $388.51
16
million is attributable to ASR repurchases and the remainder is due to traditional
repurchases). However, for the year 2007 alone, the average value of traditional
repurchases is $313.13 million, while companies that use ASRs repurchase $761.68
million. Of the total value repurchased by ASR companies, $620 million of those
repurchases were executed through ASR contracts. This finding emphasizes the
increasingly important role that ASRs play in companies’ repurchase programs.
Finally, companies that use ASRs generally lose money on the contract as
evidenced by the average unrealized holding loss of $3.14 million. The unrealized
holding loss (gain) is the amount by which the current market price per share exceeds (is
below) the ASR contract price. If the current market price is above (below) the ASR
contract price, the company will pay (receive) the difference in shares or cash upon
settlement. While the average unrealized holding loss is quite small in magnitude, the
range of unrealized losses and gains for our sample is from a loss of $1.5 billion to a gain
of $552 million.
Further, a graphical analysis of the unrealized holding gain or loss over the life of
the contract is displayed in Figure 1. Average contract unrealized gains and losses range
from +/− 10 to 40 percent of the initial contract value. Additionally, both unrealized
gains and losses grow in magnitude over time, on average. As far as contract duration,
most contracts (62.4 percent) are outstanding for one quarter beyond the initiation
quarter, with another 29.2 (6.8) percent outstanding for two (three) quarters after the
17

initiation quarter. Only 4 contracts are outstanding for four quarters beyond initiation
(and all four are loss contracts).15
4. Empirical Results
4.1 Tests of Market Valuation of Off-Balance Sheet Asset or Liability
The period in which the forward contract is outstanding gives rise to a potential
off-balance sheet asset or liability depending on the direction of stock price movements
relative to the ASR contract price. To examine whether existence of an off-balance sheet
ASR affects the value relevance of assets and liabilities, we estimate the following
market valuation model (Landsman 1986; Barth 1991; and Pfeiffer 1998):
qiqikqiqiqi
qiqiqiqiqiqi
INDEARNOBSLOBSA
ASRBVLASRBVAASRBVLBVAPrice
,,,7,6,5
,4,3,1,2,10, __
εδβββ
ββδββα
+++++
+++++= (1)
Price is the stock price per share at the end of the current quarter. BVA and BVL
represent the book value of assets and liabilities, respectively, both scaled by number of
shares outstanding. ASR is an indicator variable set to one if the company had an
outstanding ASR contract at the end of the current quarter. BVA_ASR and BVL_ASR are
the respective book values of assets and liabilities interacted with the ASR indicator
variable to capture differential pricing effects of the non-ASR assets and liabilities of
ASR companies. EARN is net income scaled by shares outstanding and IND are indicator
variables to capture industry effects.
15 Eight contracts were initiated and settled in the same quarter and are not in our sample. We require the contracts to be outstanding for at least one full quarter in order to compute unrealized gains or losses on the contract.
18

Note that the off-balance sheet ASR assets/liabilities arise from unrecognized
gains and losses on the ASR contracts. Thus, we allow for a differential market valuation
of the off-balance sheet asset or liability conditional on whether the company has an
unrealized gain or unrealized loss at the end of the current quarter. We expect that the
off-balance sheet valuation related to the ASR to be positive if the company’s current
stock price is lower than the contract price at the time of the contract execution. This
would imply that the company will receive cash or shares upon settlement of the contract
if current market price prevails. For this reason, we expect a positive market valuation in
the case of an off-balance sheet asset (OBSA) and conversely, a negative market valuation
in the case of an off-balance sheet liability (OBSL). Both OBSA and OBSL are scaled by
shares outstanding.
Table 4 (Column 1) presents the initial value relevance results. When the
existence of an ASR is included in the model as an indicator variable (Equation 1), there
is not a mean effect on price in the presence of an ASR contract (the ASR coefficient is
insignificantly different from zero). Further, the estimated coefficients for the ASR
interactions (β3, β4) are insignificant, indicating no differential pricing for ASR company
assets and liabilities that are recognized in the balance sheet. This indicates that any
differences in valuation between ASR and non-ASR companies are not due to underlying
differences in the composition of recognized assets and liabilities.
With respect to the difference in unrecognized assets and liabilities related to the
ASR contract, unrealized holding gains (OBSA) are assigned a negative but insignificant
market valuation. The coefficient on unrealized holding losses (OBSL) is significantly
19

negative (t = −3.31). Therefore, the differential market valuation of ASR versus non-
ASR companies stems from amounts omitted from the balance sheet.16
Table 4 also presents the results of estimating Equation 1 for the full sample
(Column 2) and again for a sample of repurchase companies (ASR and traditional) only
(Column 3). In both cases, the mean effect of the ASR on price is significantly positive (t
= 4.49 and t = 3.47, respectively) and the market also prices the off-balance sheet
liability, OBSL (−3.45 and –3.47, respectively), similar to the coefficient on OBSL in the
matched sample.
The number of ASR observations is small relative to the general population of
companies so the previous analyses relied on a matched sample design. However, even
though each ASR company is matched to four control companies, that proportion of ASR
companies (20 percent) is still greater than the proportion of ASR companies to the
general population. For this reason, we repeat the value relevance tests on the unmatched
sample (250 ASR company-quarters to 100,990 non-ASR company-quarters). If an
effect is still documented, then we can be more confident that the results are not driven
by our method of matching.
A second market valuation specification limits the sample to only ASR
observations and examines off-balance sheet assets or liabilities using Equation 2.
qiqik
qiqiqiqiqiqi
INDEARNOBSLOBSABVLBVAPrice
,,
,5,4,3,2,10,
εδ
βββββα
+
++++++= (2)
16 The magnitude of the coefficient on OBSL is large (−5.91) relative to the coefficients on the recognized assets and liabilities. There are several explanations which we explore in the paper: 1) the large number of zero observations for OBSL (all non-ASR firms) are skewing the coefficient values; 2) OBSL is measured with error due to potential correlated omitted variables; and 3) investors treat the OBSL as a discount to the earnings coefficient which is also large in magnitude (15.64).
20

In addition, if ASR company recognized assets and liabilities are fundamentally different
from those of non-ASR companies, then the coefficients in a model of ASR firms only
may differ from non-ASR companies indicating that those differences may be driving the
results (and the large coefficient on OBSL) in Equation 1. On the other hand, if the
coefficients on BVA and BVL are similar between Equations 1 and 2, then we can
attribute the significance of the ASR variables to the ASR contract, itself.
The results of estimating Equation 2 are presented in Table 4 – Column 4. The
coefficients on BVA and BVL are similar in magnitude to those presented in equation 1
which indicates that fundamental differences between ASR and non-ASR recorded
liabilities are not driving the negative market valuation on ASR unrealized losses. The
significant negative coefficient on the unrealized holding loss (OBSL) remains when the
sample is reduced to ASR-only company-quarters (t = −2.63).17
Another potential concern is multicollinearity due to the high degree of
correlation between the BVA and BVL variables and their interactions with the ASR
variable. One way to alleviate the problem is by estimating the value relevance using the
net book value of assets (BNA) as follows:
qiqikqiqiqiqiqi INDEARNOBSLOBSABNAPrice ,,,7,6,2,10, εδββββα ++++++= (3)
This specification is estimated for the ASR observations in Table 4 – Column 5 and the
negative valuation of the off-balance sheet liability (OBSL) remains significant (t =
−2.58).
17 Note that the magnitude of the coefficient is still large (−5.55). This finding helps to rule out the dominance of zero values and/or measurement error as an explanation for the large coefficient on OBSL. In later specifications, we examine a self-selection model to further rule out the possibility of a correlated omitted variable explanation.
21
Collins et al. (1999) demonstrate the importance of including earnings and book
value of equity in valuation models to reduce the downward bias in the price-earnings
relation that is driven by loss firms. Book value of equity is value-relevant for loss firms
since it captures the liquidation value of the firm’s net assets (Burgstahler and Dichev
1997). To test whether our results are robust to the inclusion of book value in our
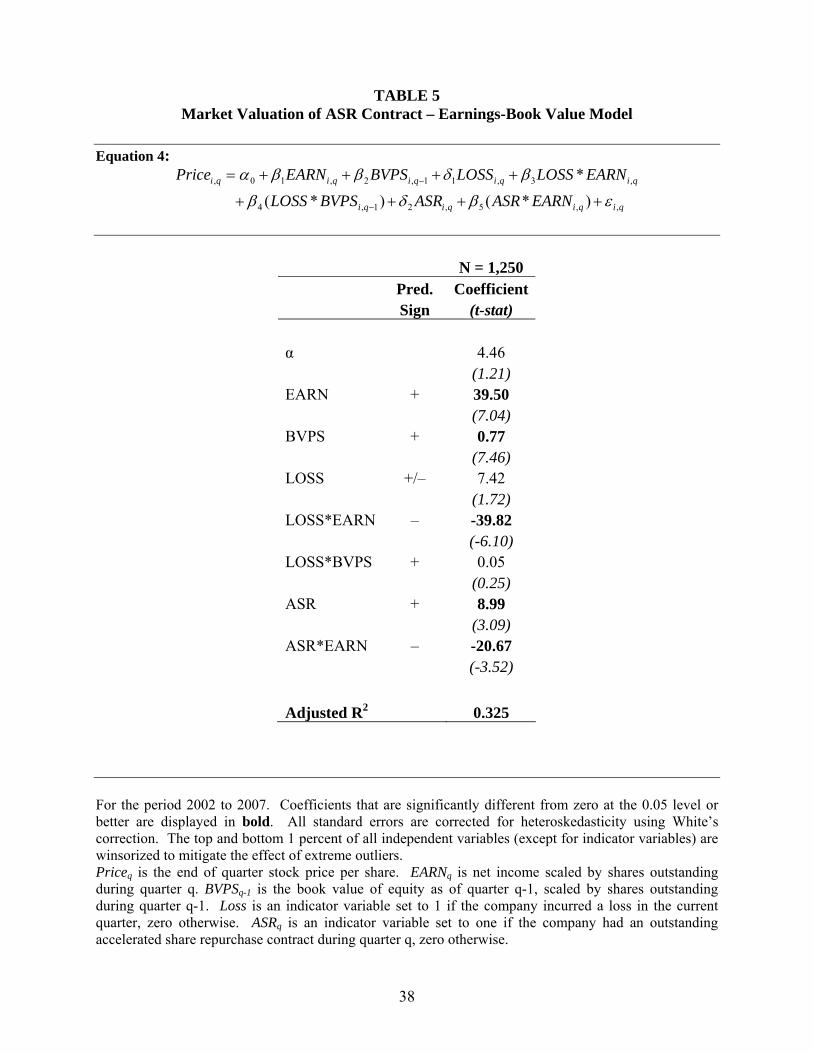
models, we estimate the following specification on the matched sample:
qiqiqiqi
qiqiqiqiqi
EARNASRASRBVPSLOSS
EARNLOSSLOSSBVPSEARNPrice
,,5,21,4
,3,11,2,10,
**
*
εβδβ
βδββα
++++
++++=
−
− (4)
where EPS is earnings per share for quarter q, BVPS is book value of equity per share at q
− 1, and LOSS is an indicator variable equal to 1 if EPS < 0. The results of this
regression are presented in Table 5. The coefficient on ASR*EARN is negative and
significant (t = −3.52); thus, the valuation of loss firms is not driving the market discount
on the ASR contract.
Overall, the results suggest that the market attributes no differential value
relevance to the recognized assets and liabilities of ASR companies, and the value
relevance increases when we include the unrecognized losses (OBSL) on the forward
contracts in the model, consistent with the market discounting share prices for companies
that engage in unprofitable transactions. In sum, the balance sheets of ASR companies
do not provide a faithful representation of these transactions as evidenced by the market’s
pricing of the unrecognized ASR liabilities.
4.2 Tests of Association between Stock Market Returns and ASR Contracts
To examine the consequences of ASRs on ERCs, we use stock returns from the
current quarter adjusted for the value-weighted market return in the same quarter as the
22
dependent variable.18 The independent variables used in the returns regression are
earnings per share scaled by stock priceq-1 (Earn) and an indicator variable set to one to
capture ASR usage. An interaction term between Earn and ASR captures any differential
response to earnings when the company uses an ASR contract to repurchase stock.
We also include several control variables, which prior research has shown to be
determinants of earnings response coefficients (ERCs). Prior research has demonstrated
a differential response to losses versus earnings (Hayn 1995, Basu 1997) so we control
for losses with an indicator variable (Loss) set to one if the company incurs a loss in the
current quarter. Collins and Kothari (1989) show that growth, size, and risk are
important control variables in returns-earnings specifications so we further augment the
estimation model to control for those factors. Growth is captured by the market to book
ratio (MB), size (Size) is captured by the natural log of the market value of equity, and
risk is captured by market model beta (Beta). We estimate beta using rolling regressions
over no more than 60 months (but a minimum of 30 months) prior to the year the ASR
contract is executed. Finally, Dhaliwal et al. (1991) show that a company’s level of
leverage affects its earnings response coefficient so we include the debt-to-assets ratio in
quarter q (Lev) in the model to control for leverage. All control variables are scaled by
stock priceq–1.
Thus, the specification of the model, including the control variables to capture
differential effects of the determinants of the ERCs is as follows:
18 All results presented throughout the paper are invariant to using market-adjusted returns from one-quarter ahead, market model abnormal returns or raw returns as the dependent variable and unexpected earnings based on a random walk expectations model as the explanatory variable.
23
qiqikqiqiqi
qiqiqiqiqi
qiqiqiqiqiqi
INDLevEarnBetaEarnSizeEarn
MBEarnLossEarnLevBetaSize
MBLossASREarnASREarnQtrRET
,,,12,11,10
,9,8,7,6,5
,4,3,2,1,10,
)*()*()*(
)*()*(
)*(
εδβββ
βββββ
βββδβα
++++
+++++
++++++= (5)
Table 6 – Column 1 presents the results of the returns tests using the matched
sample of ASR, traditional repurchase, and non-repurchase companies. The results
indicate the mean effect on returns of an ASR contract (ASR) is significantly positive (t =
2.57), but the coefficient for the ASR interaction (Earn * ASR) indicates a significant and
negative coefficient (t = −2.38). Thus, in corroboration of the value relevance tests, the
ERC results indicate that the market discounts the earnings of ASR companies, consistent
with the less representative reporting of the earning effects of the ASR contract.
We also perform a temporal analysis on ASR companies over time to ensure that
our results were not due to systematic differences between ASR and control companies.
We estimate equation (5) for only companies that have ASR contracts at some point
during the window. This method uses each company as its own control and captures the
differential market valuation in the ASR quarter and all other quarters within the sample
period. Results are reported in Table 6 – Column 2. The ERCs during the outstanding
ASR periods remain significantly negative, (t = −1.73), as compared with the non-ASR
periods.
4.3 Sensitivity Analysis
To determine whether the market response to ASR contracts changed over the
sample period, we repeat the analysis in Model 5 (Table 6) including an indicator
variable for time if the ASR contract occurred in the latter part of the sample period,
specifically the years 2005 through 2007 (results are untabulated). We also include an
24

interaction between the time variable and ASRs to determine if there is a differential
reaction to ASRs in the later time period. The interaction is insignificant; however, the
coefficient on Earn * ASR remains negative and significant.
In other, untabulated results, we examine several additional specifications to
consider potential effects associated with changes in debt, earnings-to-price ratio,
earnings volatility, and industry, to investigate whether the ASR company ERC results
are robust to conditioning on those variables. These variables were shown in prior
research to be related to share repurchase incentives. None of the variables listed above
affect the significant and negative relation between current stock returns and the ASR
contract interacted with earnings.
For example, controlling for increases in leverage, in addition to the level of
leverage may subsume the negative market reaction to ASRs conditional on earnings. To
examine this possibility, we include an indicator variable equal to one when the
company’s change in debt-to-assets is greater than the median change in debt-to-assets
for the year for the full sample (not the matched sample). Additionally, we interact the
increase in leverage with the ASR indicator variable to determine whether leverage
incentives related to ASRs and other stock repurchases affect the ERC results. This is not
the case and the negative and significant coefficient on Earn * ASR remains, which
suggests that changes in leverage do not drive the negative ASR effect.
Prior research suggests that share repurchases are accretive only when the
earnings-to-price ratio exceeds the opportunity cost of capital (Guay 2002; Bens et al.
2003; Hribar et al. 2006). In other words, management receives a boost to EPS when the
opportunity cost of the cash paid to repurchase the shares (either return on cash used or
25

borrowing rate for cash borrowed) is less than the company’s earnings-to-price ratio
(E/P). This means that companies with higher E/P ratios are more likely to benefit from
the accretive characteristic of repurchasing stock.
To examine the effect of E/P on the market’s assessment of the ASR contract, we
introduce an indicator variable equal to one when the company’s E/P ratio (using annual
earnings divided by lagged price) is greater than their annualized financing rate
(computed as yearly interest expense divided by outstanding debt). Out of the total
number of observations used (1,250), 10.32 percent (129 observations) were identified as
accretive. Of those observations, only nine were ASR contracts. Results from the E/P
enhanced model indicate that neither the E/P indicator variable nor its interaction with the
ASR indicator variable is significant. Further, the negative coefficient on Earn*ASR
remains significant.
It is also possible that the negative ERC effects are driven by earnings volatility.
Thus, we control for volatility in annual EPS by including an indicator variable when the
standard deviation of annual EPS is greater than the median standard deviation in EPS for
all companies in the expanded sample in that year. ASRs are not differentially related to
returns when interacted with earnings volatility. More importantly, the negative and
significant result on Earn * ASR is robust to controlling for earnings volatility.
Finally, we industry-adjust the variables in Equation 5 in Table 6 by subtracting
the industry medians (based on Fama-French’s twelve-industry classifications) from all
variables (except for the ASR and Loss indicator variables) to ensure that any residual
industry effects remaining after creating our industry and size-adjusted sample are not
driving the effect. The results are robust to this test.
26
In a final analysis, we control for self-selection bias associated with the
repurchase decision. In the first stage, we model the repurchase choice based on
explanatory variables proposed in extant research (Dittmar 2000; Marquardt et al. 2009;
and Chenmanur et al. 2009). In the second stage, we include the inverse Mills ratio from
the first regression to control for endogeneity related to the repurchase decision.
We use the following probit model using all observations for which we have data
in the first stage:
qiqiqiqi
qiqiqiqiqi
qiqiqiqiqiqi
hSalesgrowtOwnString
ETRNoiseDilutionLevReturns
SizePayoutMBCashCFORep
,1,131,121,11
1,101,91,81,71,6
1,51,41,31,21,11,
εβββ
βββββ
βββββα
+++
+++++
++++++=
−−−
−−−−−
−−−−−
(6)
where Rep is an indicator variable equal to one if the company repurchases shares during
the current quarter. Independent variables are computed for period q–1 and include: cash
flows from operations divided by assets (CFO); Cash, measured as the sum of cash and
cash equivalents divided by assets; market to book (MB), computed as the sum of the
market value of equity and debt divided by the book value of common equity; Payout,
measured as cash dividends divided by net income before extraordinary items; Size (log
of total assets); raw stock returns cumulated over the prior 12 months (Returns); leverage
(Lev) measured by debt minus cash all divided by assets less the median debt minus cash,
all divided by assets for the company’s two-digit SIC code; Dilution, captured by shares
used for calculating diluted EPS less shares used for calculating basic EPS, all divided by
shares used for calculating basic EPS; Noise, measured as the standard deviation of ROA
divided by the standard deviation of stock returns from the prior year; effective tax rate
(ETR), computed as tax expense divided by pre-tax income; the number of consecutive
quarters that current EPS was greater than EPS in the same quarter of the previous year
27

(String); managerial ownership (Own), computed as the percentage of common shares
owned by the top five executives; and SalesGrowth, measured as the percentage growth
in sales from year t-1 to year t.
Consistent with prior research, all first stage variables are significantly related to
the repurchase decision with the exception of cash levels (Cash) and volatility (Noise).
We then include the inverse Mills ratio (IMR) from the first stage in our estimation, as an
additional variable in both Equations 1 and 5 and re-estimate using all repurchase firms
(Heckman 1979). We estimate the second stage for value relevance (Equation 1) with the
results reported in Panel A of Table 7. The coefficient on OBSL remains negative and
significant (t = −3.37). As with the results in Panel A, the negative and significant
coefficient on Earn*ASR (Panel B of Table 7) remains (t = −2.14) indicating the market
discounts the earnings the ASR companies even after controlling for the repurchase
decision. Consistent with prior research (Marquardt et al. 2009) the IMR coefficient in
both models is significant, indicating that endogeneity was a valid concern in our
specifications.
5. Summary and Conclusions
Recently, companies have used a new form of treasury stock transaction known as
an accelerated share repurchase (ASR). In an ASR a company buys shares back from an
investment bank in a single purchase at the current market price. Relative to a traditional
treasury stock repurchase, the ASR is beneficial because of the greater increase in EPS
resulting from an immediate decrease in shares outstanding. To have shares available to
sell to the company, the investment bank borrows shares from investors. To protect the
investment bank on its short position, the company enters into to a forward sale
28
agreement. Under the provisions of the agreement, on a specified settlement date the
company reimburses (or is paid by) the investment bank for the difference between the
current price, and the price that the investment bank must pay to repurchase shares to
return to the investors.
ASRs are accounted for as two separate transactions, a treasury stock purchase
and a forward sale contract. In this paper we investigate the consequences of ASR
accounting. Under current GAAP, the forward sale contract receives equity treatment
because the company has the option of settling the contract with its own shares. As a
consequence, the company does not record its exposure to fluctuations in its stock price
while the contract is outstanding. Thus, the company’s balance sheet may be
misrepresented due to potential off-balance sheet assets and liabilities. In addition, the
gains or losses that result from settlement of the contract are recorded as direct
adjustments to equity. This creates the possibility that the company’s earnings are
misrepresented because earnings do not reflect these gains and losses.
To investigate whether the balance sheets of ASR companies are misrepresented
we compare the value relevance of the balance sheets of ASR companies to other
companies in the same industry. We document the value relevance of ASR off-balance
sheet assets and liabilities, which implies lower value relevance of ASR balance sheets
relative to nonASR companies. That is, the value relevance of ASR companies is
improved when we include unrecorded assets and liabilities arising from the companies’
exposure from its forward contract.
With respect to possible misrepresentation in the income statements of ASR
companies, we compare the ERCs of ASR companies with nonASR companies in the
29
same industry. We find that the market discounts the earnings of ASR companies,
suggesting that earnings are misrepresented due to the unreported settlement gains and
losses. This result is of particular importance in light of the evidence provided by
Marquardt et al. (2009) that ASR usage is more prevalent in companies that use EPS in
compensation contracts.
Our findings suggest the accounting for ASRs should be reexamined. In a
recently released document the FASB proposed to reduce the items that can be classified
as equity. Within this framework, ASR forward contracts would no longer receive equity
treatment. Instead, companies’ exposures arising from ASR forward contracts would be
recorded as assets or liabilities which would be marked to market. The gains and losses
resulting from marking to market, as well as settlement gains and losses would flow
through to income. Our findings indicate that ASR balance sheets and income statements
are currently not representative of the effects of ASRs; thus this proposal has the potential
to result in a better representation of the economics of ASRs. Indeed, to the extent that
companies are motivated to execute ASRs due to their accounting benefits, such a rule
may eliminate an important incentive for the use of ASRs, but also improve the reporting
of such structures when they are executed.
30
References Badrinath, S. and N. Varaiya (2001). "Share repurchase: to buy or not to buy." Financial
Executive 17: 43-48. Barth, M. (1991). "Relative measurement errors among alternative pension asset and liability
measures." The Accounting Review 66(July): 433-463. Basu, S. (1997). "The conservatism principle and the asymmetric timeliness of earnings." Journal
of Accounting and Economics 24: 3-37. Bear Stearns. “Accelerated share repurchase: Share repurchase using derivatives.” Equity
Research Report, January 2006. Bens, D., V. Nagar, D. Skinner, and M.H.F. Wong (2003). "The real investment implications of
ESO exercises." Journal of Accounting Research 40: 359-393. Brav, A., J. Graham, C. Harvey, and R. Michaely (2005). "Payout Policy in the 21st Century."
Journal of Financial Economics 77(September): 483-527. Burgstahler, D. C. and I. D. Dichev (1997). "Earnings, adaptation and equity value." The
Accounting Review 72(April): 187-215. Chemmanur, T., Y. Cheng, and T. Zhang (2009). “Why do firms undertake accelerated share
repurchase programs?” Working paper - Boston College. Collins, D. and S. P. Kothari (1989). "An analysis of intertemporal and cross-sectional
determinants of earnings response coefficients." Journal of Accounting and Economics 11(July): 143-182.
Collins, D. W., M. P. K. Pincus, and H. Xie (1999). “Equity valuation and negative earnings:
The role of book value of equity.” The Accounting Review 74(January): 29-61. Dhaliwal, D., K. Lee, and N. Fargher (1991). “The association between unexpected earnings and
abnormal security returns in the presence of financial leverage.” Contemporary Accounting Research 8: 20-41.
Dittmar, A. K. (2000). "Why do firms repurchase stock?" Journal of Business 73: 331-355. Easton, P. D. and G. A. Sommers (2003). "Scale and scale effects in market-based accounting
research." Journal of Business, Finance and Accounting(January): 25-56. Fama, E. and K. French (2001). “Disappearing dividends, changing company characteristics or
lower propensity to pay?” Journal of Financial Economics 60: 3-43. Financial Reporting Policy Committee (2009). “Response to FASB’s Preliminary Views on
financial instruments with the characteristics of equity.” Accounting Horizons Volume 23,1: 85-100.
EITF No. 99-3, “Application of Issue No. 96-13 to Derivative Instruments with Multiple
Settlement Alternatives”).
31
EITF No. 00-19, “Accounting for Derivative Financial Instruments Indexed to and Potentially
Settled in a Company’s Own Stock.” Grullon, G. and R. Michaely (2002). “Dividends, share repurchases, and the substitution
hypothesis.” Journal of Finance 57: 1649-1684. Guay, W. (2002). “Discussion of ‘Real Investment Implications of Employee Stock Option
Exercises’.” Journal of Accounting Research 40: 395-406. Hayn, C. (1995). “The information content of losses.” Journal of Accounting and Economics
20(September): 125-153. Heckman, J. (1979). "Sample selection bias as a specification error." Econometrica 47: 153-161. Hribar, S. P., N. Jenkins, and W. B. Johnson (2006). “Stock Repurchases as an Earnings
Management Device.” Journal of Accounting and Economics 41: 3-27. Landsman, W. R. (1986). “An empirical investigation of pension fund property rights.” The
Accounting Review(October): 662-691. Maremont, M. and S. Ng. “Stock buyback now may spur a big bill later.” The Wall Street
Journal, January 31, 2006; Page C1. Marquardt, C., C. Tan, and S. Young (2009). "Accelerated share repurchases, bonus
compensation, and CEO horizons.." Working paper, Baruch College – CUNY. Pfeiffer, R. J. (1998). "Market value and accounting implications of off-balance sheet items."
Journal of Accounting and Public Policy 17: 185-207. Skinner, D. (2008). “The Evolving Relation between Earnings, Dividends, and Stock
Repurchases.” Journal of Financial Economics, 87, Issue 3:582-609 Standard and Poor. (2007). “Buybacks – Hold the Applause.” The Outlook. November 14. Taub, Stephen. (20007). “Banks Back Buyback Boom.” CFO Magazine. August 31, 2007.
32

33
TABLE 1 Distribution of ASR Observations by Year and Industry
Number of
Year ASR
observations
2002 3 2003 4 2004 25 2005 62 2006 71 2007 85 Total 250
Number of
Industry ASR
observations
Agriculture, forestry and fishing 0 Mining 0 Construction 0 Manufacturing 72 Transportation and communication 14 Utilities 27 Wholesale 4 Retail 23 Financial services 81 Services 29 Public administration 0 Other 0 Total 250
For the period 2002 to 2007. Industry classifications are defined as the Fama-French 12 industry classifications.
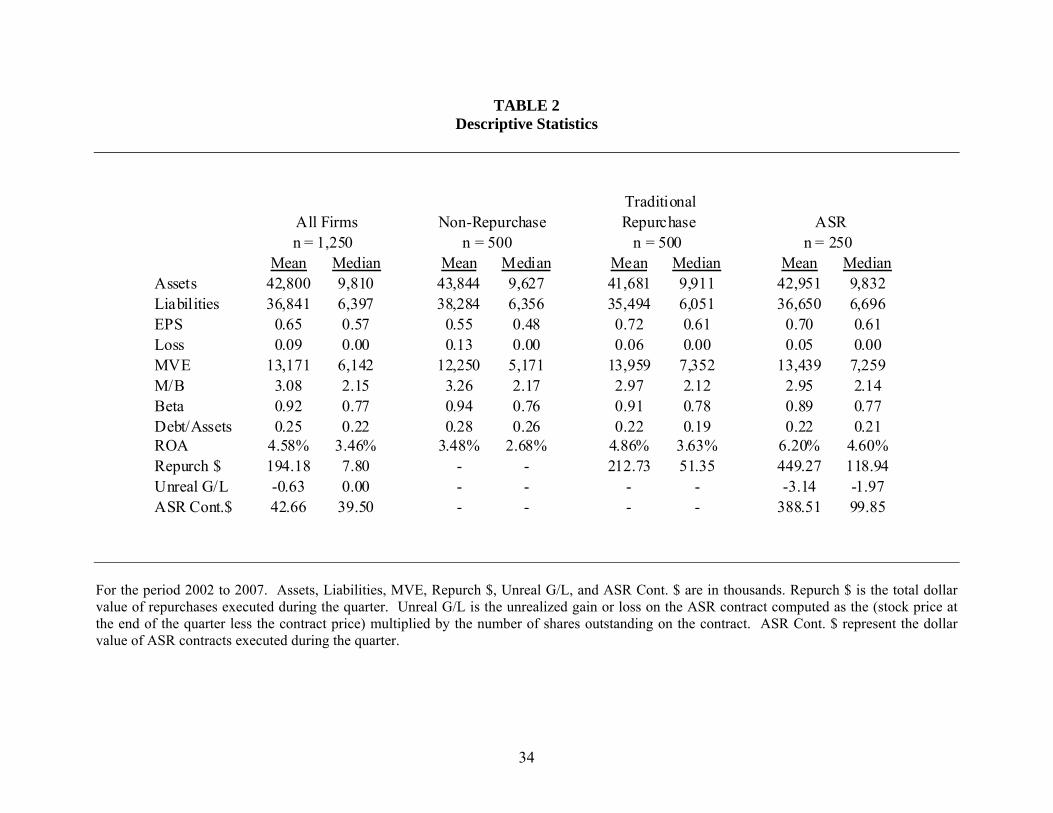
TABLE 2 Descriptive Statistics
Traditional All Firms Non-Repurchase Repurchase ASR n = 1,250 n = 500 n = 500 n = 250
Mean Median Mean Median Mean Median Mean MedianAssets 42,800 9,810 43,844 9,627 41,681 9,911 42,951 9,832Liabilities 36,841 6,397 38,284 6,356 35,494 6,051 36,650 6,696EPS 0.65 0.57 0.55 0.48 0.72 0.61 0.70 0.61Loss 0.09 0.00 0.13 0.00 0.06 0.00 0.05 0.00MVE 13,171 6,142 12,250 5,171 13,959 7,352 13,439 7,259M/B 3.08 2.15 3.26 2.17 2.97 2.12 2.95 2.14Beta 0.92 0.77 0.94 0.76 0.91 0.78 0.89 0.77Debt/Assets 0.25 0.22 0.28 0.26 0.22 0.19 0.22 0.21ROA 4.58% 3.46% 3.48% 2.68% 4.86% 3.63% 6.20% 4.60%Repurch $ 194.18 7.80 - - 212.73 51.35 449.27 118.94Unreal G/L -0.63 0.00 - - - - -3.14 -1.97ASR Cont.$ 42.66 39.50 - - - - 388.51 99.85
For the period 2002 to 2007. Assets, Liabilities, MVE, Repurch $, Unreal G/L, and ASR Cont. $ are in thousands. Repurch $ is the total dollar value of repurchases executed during the quarter. Unreal G/L is the unrealized gain or loss on the ASR contract computed as the (stock price at the end of the quarter less the contract price) multiplied by the number of shares outstanding on the contract. ASR Cont. $ represent the dollar value of ASR contracts executed during the quarter.
34
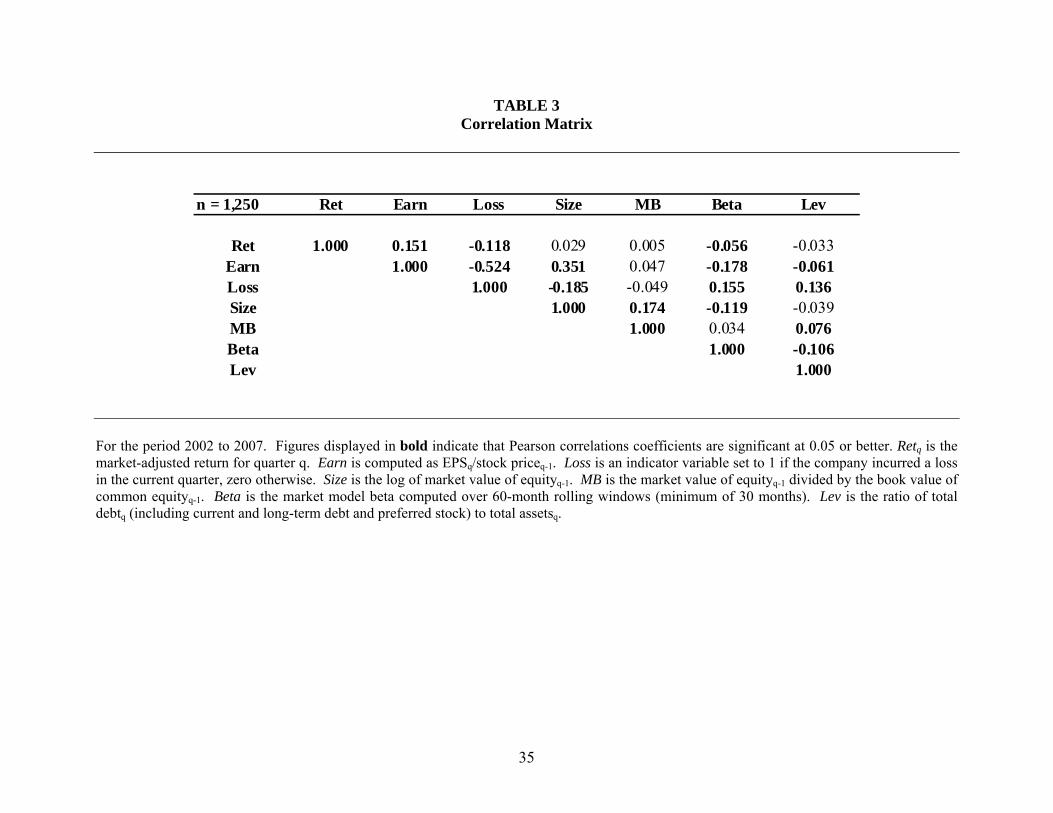
TABLE 3 Correlation Matrix
n = 1,250 Ret Earn Loss Size MB Beta Lev
Ret 1.000 0.151 -0.118 0.029 0.005 -0.056 -0.033Earn 1.000 -0.524 0.351 0.047 -0.178 -0.061Loss 1.000 -0.185 -0.049 0.155 0.136Size 1.000 0.174 -0.119 -0.039MB 1.000 0.034 0.076Beta 1.000 -0.106Lev 1.000
For the period 2002 to 2007. Figures displayed in bold indicate that Pearson correlations coefficients are significant at 0.05 or better. Retq is the market-adjusted return for quarter q. Earn is computed as EPSq/stock priceq-1. Loss is an indicator variable set to 1 if the company incurred a loss in the current quarter, zero otherwise. Size is the log of market value of equityq-1. MB is the market value of equityq-1 divided by the book value of common equityq-1. Beta is the market model beta computed over 60-month rolling windows (minimum of 30 months). Lev is the ratio of total debtq (including current and long-term debt and preferred stock) to total assetsq.
35
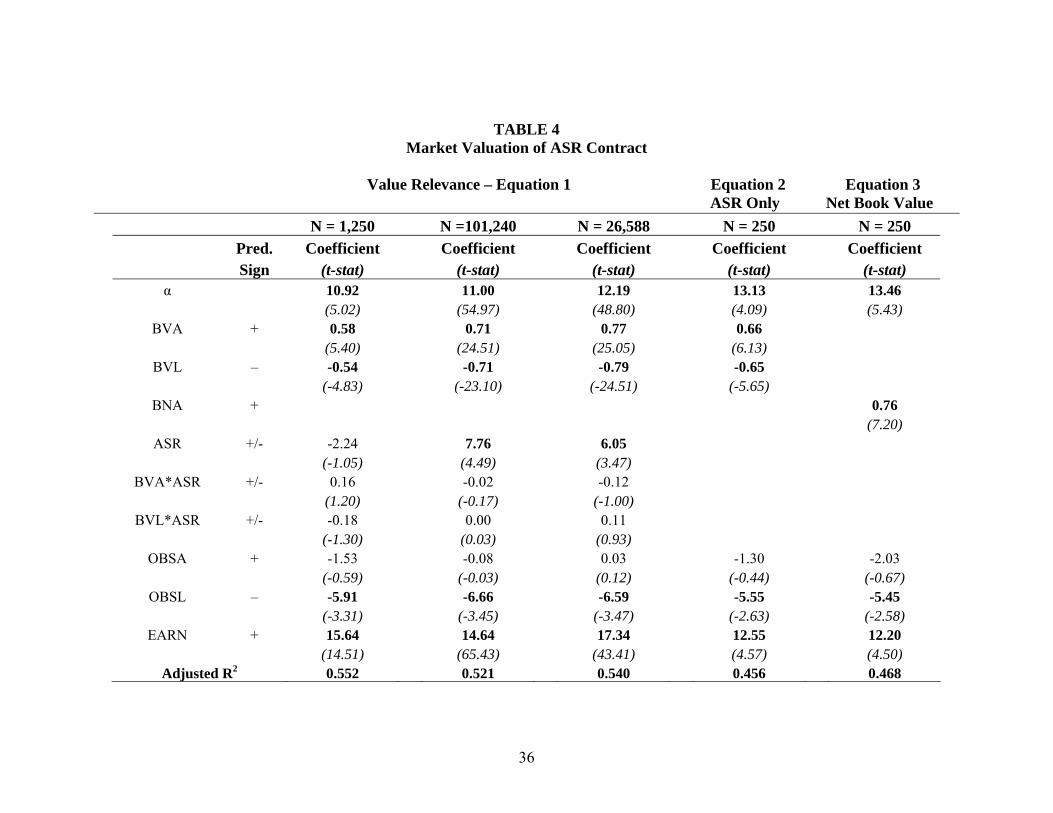
TABLE 4 Market Valuation of ASR Contract
Value Relevance – Equation 1 Equation 2 Equation 3 ASR Only Net Book Value
N = 1,250 N =101,240 N = 26,588 N = 250 N = 250 Pred. Coefficient Coefficient Coefficient Coefficient Coefficient Sign (t-stat) (t-stat) (t-stat) (t-stat) (t-stat) α 10.92 11.00 12.19 13.13 13.46 (5.02) (54.97) (48.80) (4.09) (5.43)
BVA + 0.58 0.71 0.77 0.66 (5.40) (24.51) (25.05) (6.13)
BVL – -0.54 -0.71 -0.79 -0.65 (-4.83) (-23.10) (-24.51) (-5.65)
BNA + 0.76 (7.20)
ASR +/- -2.24 7.76 6.05 (-1.05) (4.49) (3.47)
BVA*ASR +/- 0.16 -0.02 -0.12 (1.20) (-0.17) (-1.00)
BVL*ASR +/- -0.18 0.00 0.11 (-1.30) (0.03) (0.93)
OBSA + -1.53 -0.08 0.03 -1.30 -2.03 (-0.59) (-0.03) (0.12) (-0.44) (-0.67)
OBSL – -5.91 -6.66 -6.59 -5.55 -5.45 (-3.31) (-3.45) (-3.47) (-2.63) (-2.58)
EARN + 15.64 14.64 17.34 12.55 12.20 (14.51) (65.43) (43.41) (4.57) (4.50)
Adjusted R2 0.552 0.521 0.540 0.456 0.468
36

37
TABLE 4 Continued
Market Valuation of ASR Contract
Equation 1: qiqikqiqiqi
qiqiqiqiqiqi
INDEARNOBSLOBSA
ASRBVLASRBVAASRBVLBVAPrice
,,,7,6,5
,4,3,1,2,10, __
εδβββ
ββδββα
+++++
+++++=
Equation 2: qiqikqiqiqiqiqiqi INDEARNOBSLOBSABVLBVAPrice ,,,5,4,3,2,10, εδβββββα +++++++= Equation 3: qiqikqiqiqiqiqi INDEARNOBSLOBSABNAPrice ,,,7,6,2,10, εδββββα ++++++=
For the period 2002 to 2007. Coefficients that are significantly different from zero at the 0.05 level or better are displayed in bold. All standard errors are corrected for heteroskedasticity using White’s correction. The models were estimated including industry control dummies based on the Fama French 12 industry classifications, however, the industry coefficients are suppressed for brevity. The top and bottom 1 percent of all independent variables (except for indicator variables) are winsorized to mitigate the effect of extreme outliers. Priceq is the end of quarter stock price per share. BVAq are assets scaled by shares outstanding during quarter q. BVLq is equal to assets less common stockholder’s equity at quarter q all scaled by shares outstanding during quarter q. ASRq is an indicator variable set to one if the company had an outstanding accelerated share repurchase contract during quarter q, zero otherwise. OBSAq is the amount of unrealized holding gain attributable to the ASR contract during quarter q, scaled by shares outstanding during quarter q. OBSLq is the amount of unrealized holding loss attributable to the ASR contract during quarter q, scaled by shares outstanding during quarter q. EARNq is net income scaled by shares outstanding during quarter q.
38
TABLE 5 Market Valuation of ASR Contract – Earnings-Book Value Model
Equation 4:
qiqiqiqi
qiqiqiqiqi
EARNASRASRBVPSLOSS
EARNLOSSLOSSBVPSEARNPrice
,,5,21,4
,3,11,2,10,
)*()*(
*
εβδβ
βδββα
++++
++++=
−
−
N = 1,250 Pred. Coefficient Sign (t-stat) α 4.46 (1.21) EARN + 39.50 (7.04) BVPS + 0.77 (7.46) LOSS +/– 7.42 (1.72) LOSS*EARN – -39.82 (-6.10) LOSS*BVPS + 0.05 (0.25) ASR + 8.99 (3.09) ASR*EARN – -20.67 (-3.52) Adjusted R2 0.325
For the period 2002 to 2007. Coefficients that are significantly different from zero at the 0.05 level or better are displayed in bold. All standard errors are corrected for heteroskedasticity using White’s correction. The top and bottom 1 percent of all independent variables (except for indicator variables) are winsorized to mitigate the effect of extreme outliers. Priceq is the end of quarter stock price per share. EARNq is net income scaled by shares outstanding during quarter q. BVPSq-1 is the book value of equity as of quarter q-1, scaled by shares outstanding during quarter q-1. Loss is an indicator variable set to 1 if the company incurred a loss in the current quarter, zero otherwise. ASRq is an indicator variable set to one if the company had an outstanding accelerated share repurchase contract during quarter q, zero otherwise.

TABLE 6 Current Market-Adjusted Stock Return Response to ASR Contracts
Equation 5:
qiqikqiqi
qiqiqiqiqi
qiqiqiqiqiqiqi
INDLevEarnBetaEarn
SizeEarnMBEarnLossEarnLevBeta
SizeMBLossASREarnASREarnQtrRET
,,,12,11
,10,9,8,7,6
,5,4,3,2,1,10,
)*()*(
)*()*()*(
)*(
εδββ
βββββ
ββββδβα
+++
+++++
+++++++=
Matched Sample ASR Time Series
Pred. n = 1,250 n = 2,666 Sign Coefficient (t-stat) Coefficient (t-stat) α -0.045 (-3.61) -0.044 (-4.76) Earn + 0.561 (1.47) -0.131 (-0.31) ASR +/- 0.039 (2.57) 0.021 (1.62) Earn * ASR – -1.917 (-2.38) -1.210 (-1.73) Loss +/- 0.007 (0.38) 0.000 (0.01) MB +/- 0.042 (1.57) 0.017 (0.90) Size +/- -0.002 (-0.06) 0.036 (0.95) Beta +/- -0.135 (-1.73) -0.011 (-0.17) Lev +/- -0.703 (-1.45) 1.223 (1.77) Earn * Loss – -1.648 (-3.21) -0.876 (-1.53) Earn * MB + -0.072 (-0.97) -0.140 (-2.11) Earn * Size +/- 0.191 (2.55) 0.172 (2.33) Earn * Beta – -0.028 (-0.12) 0.287 (1.17) Earn * Lev – 1.232 (1.31) 1.003 (3.71) Adjusted R2 0.074 0.053
39

TABLE 6 Continued
Current Market-Adjusted Stock Return Response to ASR Contracts
For the period 2002 to 2007. Coefficients that are significantly different from zero at the 0.05 level or better are displayed in bold. All standard errors are corrected for heteroskedasticity using White’s correction. The model was estimated including industry control dummies based on the Fama French 12 industry classifications, however, the industry coefficients are suppressed for brevity. The top and bottom 1 percent of all independent variables (except for indicator variables) are winsorized to mitigate the effect of extreme outliers. QtrRET is the market-adjusted stock return for the current quarter. Earn is computed as EPSq/stock priceq-1. ASR is an indicator variable set to one if the company has an outstanding accelerated share repurchase during quarter q, zero otherwise. Loss is an indicator variable set to 1 if the company incurred a loss in the current quarter, zero otherwise. Size is the log of market value of equityq-1. MB is the market value of equityq-1 divided by the book value of common equityq-1. Beta is the market model beta computed over 60-month rolling windows (minimum of 30 months). Lev is the ratio of total debtq (including current and long-term debt and preferred stock) to total assetsq.
40
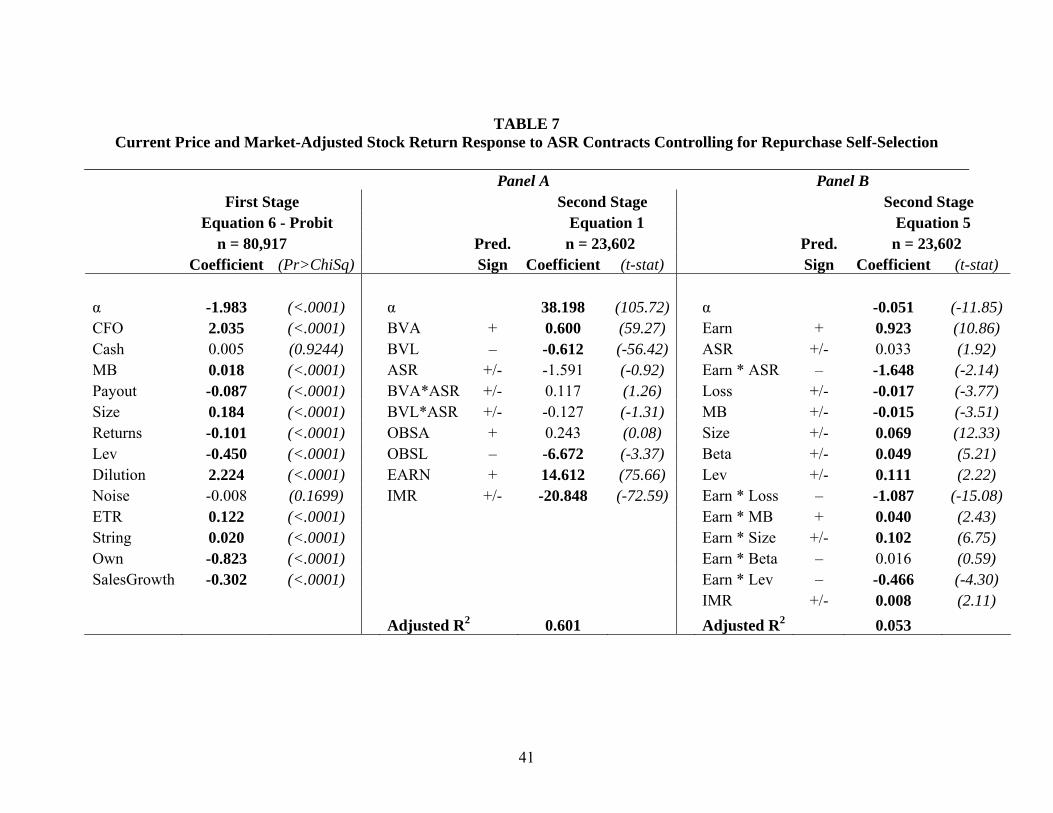
TABLE 7
Current Price and Market-Adjusted Stock Return Response to ASR Contracts Controlling for Repurchase Self-Selection
Panel A Panel B First Stage Second Stage Second Stage Equation 6 - Probit Equation 1 Equation 5 n = 80,917 Pred. n = 23,602 Pred. n = 23,602 Coefficient (Pr>ChiSq) Sign Coefficient (t-stat) Sign Coefficient (t-stat) α -1.983 (<.0001) α 38.198 (105.72) α -0.051 (-11.85) CFO 2.035 (<.0001) BVA + 0.600 (59.27) Earn + 0.923 (10.86) Cash 0.005 (0.9244) BVL – -0.612 (-56.42) ASR +/- 0.033 (1.92) MB 0.018 (<.0001) ASR +/- -1.591 (-0.92) Earn * ASR – -1.648 (-2.14) Payout -0.087 (<.0001) BVA*ASR +/- 0.117 (1.26) Loss +/- -0.017 (-3.77) Size 0.184 (<.0001) BVL*ASR +/- -0.127 (-1.31) MB +/- -0.015 (-3.51) Returns -0.101 (<.0001) OBSA + 0.243 (0.08) Size +/- 0.069 (12.33) Lev -0.450 (<.0001) OBSL – -6.672 (-3.37) Beta +/- 0.049 (5.21) Dilution 2.224 (<.0001) EARN + 14.612 (75.66) Lev +/- 0.111 (2.22) Noise -0.008 (0.1699) IMR +/- -20.848 (-72.59) Earn * Loss – -1.087 (-15.08) ETR 0.122 (<.0001) Earn * MB + 0.040 (2.43) String 0.020 (<.0001) Earn * Size +/- 0.102 (6.75) Own -0.823 (<.0001) Earn * Beta – 0.016 (0.59) SalesGrowth -0.302 (<.0001) Earn * Lev – -0.466 (-4.30) IMR +/- 0.008 (2.11) Adjusted R2 0.601 Adjusted R2 0.053
41

TABLE 7 Continued Current Price and Market-Adjusted Stock Return Response to ASR Contracts Controlling for Repurchase Self-Selection
First Stage:
qiqiqiqi
qiqiqiqiqi
qiqiqiqiqiqi
hSalesgrowtOwnString
ETRNoiseDilutionLevReturns
SizePayoutMBCashCFORep
,1,131,121,11
1,101,91,81,71,6
1,51,41,31,21,11,
εβββ
βββββ
βββββα
+++
+++++
++++++=
−−−
−−−−−
−−−−−
Second Stage – Panel A:
qiqikqiqiqi
qiqiqiqiqiqi
INDEARNOBSLOBSAASRBVLASRBVAASRBVLBVAPrice
,,,7,6,5
,4,3,1,2,10, __
εδβββ
ββδββα
+++++
+++++=
Second Stage – Panel B:
qiqiqiqi
qiqiqiqiqi
qiqiqiqiqiqiqi
IMRLevEarnBetaEarn
SizeEarnMBEarnLossEarnLevBeta
SizeMBLossASREarnASREarnQtrRET
,,13,12,11
,10,9,8,7,6
,5,4,3,2,1,10,
)*()*(
)*()*()*(
)*(
εβββ
βββββ
ββββδβα
+++
+++++
+++++++=
For the period 2002 to 2007. The first stage is a PROBIT estimation for all sample observations for which data for the first stage variables was available with the dependent variable equal to one if the company engaged in a stock repurchase during the quarter. The second stage estimated using OLS for all repurchase observations (including ASRs) for which data for the first and second stage variables was available. Coefficients that are significantly different from zero at the 0.05 level or better are displayed in bold. All standard errors are corrected for heteroskedasticity using White’s correction. The top and bottom 1 percent of all independent variables (except for indicator variables) are winsorized to mitigate the effect of extreme outliers. The first stage variables (all from period q-1) include: CFO is cash flows from operations divided by assets. CASH is the sum of cash and cash equivalents divided by assets. MB is the sum of the market value of equity and debt divided by the book value of common equity. Payout is cash dividends divided by net income before extraordinary items. Size is the log of total assets. Returns are raw stock returns cumulated over the prior 12 months. Lev is debt minus cash all divided by assets less the median debt minus cash all divided by assets for the company’s two-digit SIC code. Dilution is shares used for calculating diluted EPS less shares used for calculating basic EPS all divided by shares used for calculating basic EPS. Noise is the standard deviation of ROA divided by the standard deviation of returns from the prior year. ETR is tax expense divided by pre-tax
42

43
TABLE 7 Continued Current Price and Market-Adjusted Stock Return Response to ASR Contracts Controlling for Repurchase Self-Selection
income. String is the number of consecutive quarters that current EPS was greater than EPS in the same quarter of the previous year. Own is the percentage of common shares owned by the top five executives. SalesGrowth is the percentage growth in sales from year t-1 to year t. Priceq is the end of quarter stock price per share. BVAq are assets scaled by shares outstanding during quarter q. BVLq is equal to assets less common stockholder’s equity at quarter q all scaled by shares outstanding during quarter q. ASRq is an indicator variable set to one if the company had an outstanding accelerated share repurchase contract during quarter q, zero otherwise. OBSAq is the amount of unrealized holding gain attributable to the ASR contract during quarter q, scaled by shares outstanding during quarter q. OBSLq is the amount of unrealized holding loss attributable to the ASR contract during quarter q, scaled by shares outstanding during quarter q. EARNq is net income scaled by shares outstanding during quarter q. QtrRET is the market-adjusted stock return for the current quarter is the dependent variable in the second stage regression. The remainder of the second stage variables are: Earn is computed as EPSq/stock priceq-1. ASR is an indicator variable set to one if the company has an outstanding accelerated share repurchase during quarter q, zero otherwise. Loss is an indicator variable set to 1 if the company incurred a loss in the current quarter, zero otherwise. Size is the log of market value of equityq-1. MB is the market value of equityq-1 divided by the book value of common equityq-
1. Beta is the market model beta computed over 60-month rolling windows (minimum of 30 months). Lev is the ratio of total debtq (including current and long-term debt and preferred stock) to total assetsq. IMR is the inverse Mills ratio from the first stage regression.
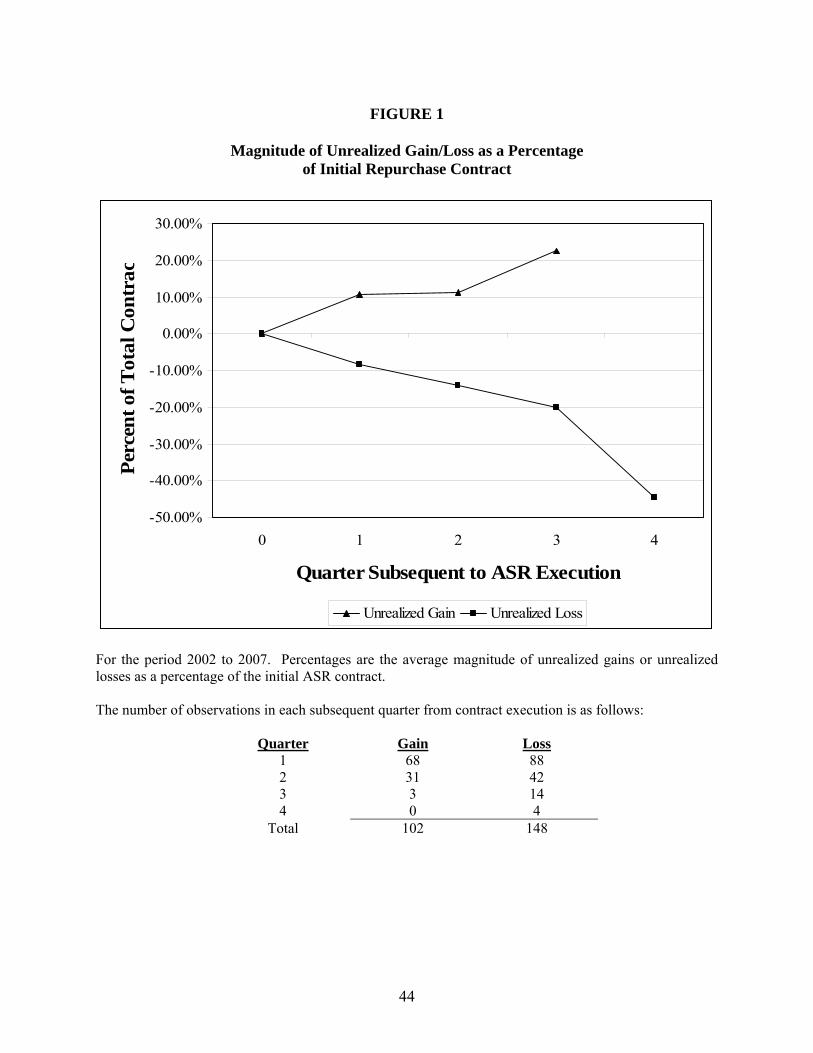
FIGURE 1
Magnitude of Unrealized Gain/Loss as a Percentage
of Initial Repurchase Contract
-50.00%
-40.00%
-30.00%
-20.00%
-10.00%
0.00%
10.00%
20.00%
30.00%
0 1 2 3 4
Quarter Subsequent to ASR Execution
Perc
ent o
f Tot
al C
ontr
ac
Unrealized Gain Unrealized Loss
For the period 2002 to 2007. Percentages are the average magnitude of unrealized gains or unrealized losses as a percentage of the initial ASR contract. The number of observations in each subsequent quarter from contract execution is as follows:
Quarter Gain Loss1 68 88 2 31 42 3 3 14 4 0 4
Total 102 148
44
Top Related