


Languages
Pages
Legal


UILU-ENG-87 -2002 NSF-ENG-87015
CIVIL ENGINEERING STUDIES STRUCTURAL RESEARCH SERIES NO. 532
ISSN: 0069-4274
THE 1985 CHILE EARTHQUAKE OBSERVATIONS ON EARTHQUAKE-RESI STANT
,....., CONSTRUCTION IN VINA DEL MAR
By
SHARON l. WOOD University of Illinois at Urbana-Champaign
JAMES K. WIGHT University of Michigan
JACK P. MOEHLE University of California at Berkeley
A Report to the NATIONAL SCIENCE FOUNDATION Research Grants ECE 86-03789, ECE 86-03624, and ECE 86-06089
UNIVERSITY OF ILLINOIS at URBANA-CHAMPAIGN URBANA, ILLINOIS FEBRUARY 1987
REPRODUCED BY
PB 88-10 1248
u.s. DEPARTMENT OF COMMERCE NATIONAL TECHNICAL
INFORMATION SERVICE SPRINGFIELD, VA 22161


THE 1985 CHILE EARTHQUAKE Observations on Earthquake-Resistant Construction
in Vina del Mar
S. L. Wood
University of Illinois at Urbana-Champaign
by
J. K. Wight
University of Michigan
A Report to the NATIONAL SCIENCE FOUNDATION
Research Grants ECE 86-03789, 86-03624, and 86-06089
University of Illinois at Urbana-Champaign
Urbana, Illinois February 1987
J. P. Moehle
University of California at Berkeley


50272 -101
REPORT DOCUMENTATION 1.1• REPORT NO. PAGE UILU-ENG-87-2002
4. Title and SubtItle NSF-ENG- 8 7015
S. RecIpient's Accnslon No.
The 1985 Chile Earthquake: Observations on EarthquakeResistant Construction in Vina del Mar
5. Repo'rt Date February 1987
.-------------... -----___ · __ ···· ___________ c--__ I ______________ ....j 7. Author(s)
S. L. Wood, J. K. Wight, and J. P. Moehle 9. Performlns Oraanlzatlon Name and Address
University of Illinois at Urbana-Champaign Department of Civil Engineering 208 North Romine Street Urbana, Illinois 61801
12. Sponsorlns Orsanlzatlon Name and Address
National Science Foundation
15. Supplementary Notes
8. Performln. Orsanlzatlon Rept. No. SRS 532
10. Project/Task/Work Unit No.
11. Contract(C) or Grant(G) No.
(C) ECE 86-03789 ECE 86-03624
ro) ECE 86-06089 13. Type of Report & Period Covered
14.
1------------------_. ------ .. -------.----..... . ·115: Abstract (LImit: 200 words)
. ._ ..... __ ._----------1
On 3 March 1985, a major earthquake occurred near the coast of central Chile. The resort city of Vina del Mar is of particular interest from an engineering standpoint because approximately 400 moderate-rise reinforced concrete buildings and a strong-motion instrument were located in the city.
The geology and seismicity of the Vina del Mar region, the development of seismic design provisions in Chile, and the ground motion records from the 1985 earthquake are described in the report. The structural characteristics of and damage in thirteen reinforced concrete buildings in Vina del Mar and Valparaiso are also described.
I---------------------------.--------------------------~ 17. Document Analysis a. Descriptors
Construction Practice, Earthquakes, Ground Motion, Reinforced Concrete Buildings, Seismic Design Codes
b. Identifiers/Open· Ended Terms
c. COSATI Field/Group
18. Availability Statement
(See ANSI-Z39.18)
19. Security Class (This Report)
UNCLASSIFIED 21. No. of Pases
~-------------~------------20. Security Class (This Page)
UNCLASSIFIED See 'nstruct/ona on Reverse
22. Price
OPTIONAL FORM 272 (4-77) (Formerly NTIS-35) Department of Commerce


Chapter
1
2
3
4
5
i
TABLE of CONTENTS
INTRODUCTION
1.1 1.2 1.3
The Earthquake of 3 March 1985 Object and Scope Acknowledgments
ENGINEERING FEATURES OF THE VINA DEL MAR REGION
2.1 History of Vina del Mar 2.2 Seismicity of the Region 2.3 Geology of the Region 2.4 Foundation Conditions in the Region 2.5 Distribution of Engineered Structures
DEVELOPMENT OF SEISMIC DESIGN PROVISIONS IN CHILE
3.1 La Ordenanza General de Construcciones y Urbanizaci6n . .
3.2 La Norma Chilena NCh 433: de Edificios . . . . . . 3.2.1 Static Analysis. 3.2.2 Dynamic Analysis
Calculo Antisismico
STRUCTURAL ENGINEERING PRACTICE IN CHILE
4.1
4.2
4.3 4.4
Building Types and Design Concepts . 4.1.1 Masonry Construction .... 4.1.2 Reinforced Concrete Construction 4.1.3 Design Concepts ...... . Structural and Nonstructural Details in RIC Buildings 4.2.1 Structural Details ... . 4.2.2 Nonstructura1 Details ... . Construction and Inspection Practices Materials Used in Building Construction 4.4.1 Concrete 4.4.2 Reinforcing Steel.
GROUND MOTION DURING THE 3 MARCH 1985 EARTHQUAKE
5.1 Strong-Motion Instrumentation 5.2 The Records ........ . 5.3 Response Spectra ...... .
5.3.1 Elastic Response Spectra 5.3.2 Inelastic Response Spectra
5.4 Intensity Measures 5.5 Summary ............ .
Page
1
1 2 3
5
5 6 8 9
12
13
13
16 17 19
20
20 20 22 23 23 24 26 28 29 29 31
33
33 34 35 36 36 37 38
Chapter
6
ii
TABLE of CONTENTS (cont.)
AVAILABLE INFORMATION ON BUILDINGS WITH STRUCTURAL DAMAGE
6.1 Acapulco. 6.2 Hanga-Roa 6.3 Coral 6.4 Tahiti. 6.5 Festival 6.6 El Faro 6.7 Summary
7 AVAILABLE INFORMATION ON UNDAMAGED OR LIGHTLY DAMAGED BUILDINGS .
8
7.1 Plaza del Mar 7.2 Marina Real 7.3 Torres de Miramar 7.4 Torres del Pacifico 7.5 Villa Real .... . 7.6 Torres del Sol .. . 7.7 Torre del Almendral 7.8 Summary
SUMMARY
TABLES
FIGURES
APPENDIX A: GEOTECHNICAL CHARACTERISTICS OF THE SOIL IN VINA DEL MAR
REFERENCES
Page
39
39 41 42 43 44 45 46
47
47 48 49 50 51 52 53 54
55
57
71
161
172
Table
2.1
2.2
2.3
2.4
5.1
5.2
5.3
6.1
6.2
7.1
7.2
iii
LIST of TABLES
Segments of Inclined Seismic Zones Along the West Coast of Central and South America
Summary of Major Earthquakes in Chile .
Summary of Earthquakes along the Chilean Coast from 1965 to 1985 . . . . . . . . . . . . . .
Typical Engineering Properties of Foundation Materials in the Vifia del Mar Region
Peak Accelerations Measured during the 1985 Earthquake
Strong-Motion Instrument Data
Housner and Arias Intensities
Physical Characteristics of Buildings with Structural Damage . . . . .
Material Properties and Description of Foundations of Buildings with Structural Damage ..... .
Physical Characteristics of Undamaged or Lightly Damaged Buildings . . . .. ..... .
Material Properties and Description of Foundations of Undamaged or Lightly Damaged Buildings . . . . .
Page
58
59
60
62
63
65
66
67
68
69
70


Figure
l.l
1.2
2.1
2.2
2.3
2.4
2.5
2.6
2.7
2.8
2.9
2.10
2.11
3.1
4.1
4.2
5.1
5.2
5.3
5.4
5.5
iv
LIST of FIGURES
Intensity Map from the 3 March 1985 Earthquake
Location of Strong-Motion Instruments during the 3 March 1985 Earthquake . . . . .
Movement of the Crustal Plates along the West Coast of South America .
Distribution of Epicenters in Chile between 1963 and 1978 . . . . . . . . . . . .
Rupture Lengths Attributed to Great Earthquakes in Central Chile . . . . . . . . . . . .
Intensity Map from the 7 November 1981 Earthquake
Topological Map of Vida del Mar and Valparaiso
Geology of Vida del Mar and Valparaiso
Development of Valparaiso Harbor
Vida del Mar
Expected Distribution of Modified Mercalli Intensities within Vida del Mar .
Distribution of Buildings in Vida del Mar with Respect to Height
Locations of Buildings with Five or More Stories in Downtown Vida del Mar
Design Acceleration Spectrum
Confined Masonry Construction
Reinforced Masonry Construction
Strong-Motion Records Obtained during the 3 March 1985 Earthquake .
Elastic Response Spectra
Comparison of Elastic Response Spectra from the 1940 El Centro and 1985 Vida del Mar Records
Elasto-Perfectly Plastic Response Spectra
Bilinear Response Spectra . . . .
Page
72
73
74
75
76
77
78
79
80
81
82
83
84
85
86
87
88
93
98
99
100

Figure
5.6
5.7
6.1
6.2
6.3
6.4
6.5
6.6
6.7
6.8
6.9
6.10
6.11
6.12
6.13
6.14
6.15
6.16
6.17
6.18
6.19
6.20
6.21
6.22
7.1
v
LIST of FIGURES (cont.)
Page
Inelastic Response Spectra from the 1940 El Centro Record 101
Arias Intensity versus Time . .
Locations of Buildings in Vifta del Mar
Locations of Buildings in Reftaca
Acapulco
Floor Plan - Acapulco
Elevation - Acapulco
Observed Damage - Acapulco
Hanga-Roa ...
Floor Plan - Hanga-Roa
Elevations - Hanga-Roa
Observed Damage - Hanga-Roa
Coral
Floor Plan - Coral
Tahiti
Festival
Floor Plan - Festival
Elevation - Festival
El Faro .
Floor Plans - El Faro
Elevations - El Faro
Architectural Plan - El Faro
Observed Damage - El Faro . .
Construction Joint - El Faro
Reinforced Concrete Buildings along the Beach in Vifta del Mar
102
103
104
105
106
107
108
109
110
111
113
114
115
116
117
118
119
120
122
124
126
127
128
....... 129

Figure
7.2
7.3
7.4
7.5
7.6
7.7
7.8
7.9
7.10
7.11
7.12
7.13
7.14
7.15
7.16
7.17
7.18
7.19
7.20
7.21
7.22
7.23
A.l
A.2
A.3
vi
LIST of FIGURES (cant.)
Plaza del Mar . . . . . . .
Floor Plan - Plaza del Mar
Elevation - Plaza del Mar
Marina Real
Floor Plans - Marina Real
Elevation - Marina Real
Torres de Miramar . . .
Floor Plans - Torres de Miramar
Elevations - Torres de Miramar
Torres del Pacifico
Floor Plans - Torres del Pacifico
Elevations - Torres del Pacifico
Villa Real
Floor Plans - Villa Real
Elevations - Villa Real
Torres del Sol
Floor Plans - Torres del Sol
Elevations - Torres del Sol
Torre del Almendral
Floor Plan - Torre del Almendral
Elevations - Torre del Almendral
Measured Periods of Buildings
Locations of Soil Borings .
Soil Profile from Boring #1
Soil Profile from Boring #2
Page
130
131
132
133
134
136
137
138
140
142
143
145
147
148
149
151
152
154
157
158
159
160
163
164
165

vii
LIST of FIGURES (cont.)
Figure Page
A.4 Soil Profile from Boring #3 166
A.5 Soil Profile from Boring #4 167
A.6 Soil Profile from Boring #5 168
A.7 Soil Profile from Boring #6 169
A.8 Soil Profile from Boring #7 170
A.9 Soil Profile from Boring #8 171

1
CHAPTER 1 INTRODUCTION
On 3 March 1985, a major earthquake occurred near the coast of central
Chile. Modified Merca11i Intensities of VII-VIII were observed in the region
from Vina del Mar to L1011eo (Fig. 1.1) [61]. The resort city of Vina del
Mar is of particular interest from an engineering standpoint because
approximately 400 moderate-rise reinforced concrete bUildings and a strong-
motion instrument were located in the city at the time of the earthquake.
1.1 The Earthquake of 3 March 1985
The earthquake occurred at 7:47 p.m. local time on Sunday, 3 March 1985.
The epicenter was located approximately 80 km (50 mi) southwest of Vina del
Mar (Fig. 1.1), and at an estimated focal depth of 33 km (20 mi) [61]. Two
separate events have been identified. The first, having a P-wave magnitude
mb = 5.2, was followed ten seconds later by a main event having a surface
wave magnitude Ms = 7.8 and a P-wave magnitude mb = 6.9 [68]. Modified
Merca11i Intensities (Fig. 1.1) were as high as VIII in the epicentra1
region, including portions of Vina del Mar. The distribution of peak
accelerations obtained from strong-motion instruments in central Chile is
shown in Fig. 1.2 [61].
The earthquake resulted in extensive damage and casualties in the
central region of Chile. Approximately 66,000 homes were destroyed and
another 127,000 were damaged throughout the region [59]. During the
earthquake, approximately 150 people were killed, and another 2,000 were
injured [59]. In the towns of Vina del Mar and Valparaiso, the number of
dead was approximately 40 and approximately 500 were injured, from a
population of 550,000 [68].

2
Damage was not uniform for all construction types. Most adobe buildings
in the epicentral region experienced some damage, with many in a state of
partial or total collapse. Wood residential construction generally performed
well, as did the majority of the low-rise masonry structures constructed with
reinforced concrete confining elements. Steel structures, which are not
common, generally did not sustain notable damage. Damage to industrial
facilities and bridges was generally light and widely spread. Although
numerous cases of damage and near collapse have been reported for modern
reinforced concrete structures [12,13,44,68], the most significant
observation may be that most such structures sustained little or no apparent
structural damage.
1.2 Object and Scope
In July 1986, J. P. Moehle (University of California at Berkeley),
J. K. Wight (University of Michigan), and S. L. Wood (University of Illinois
at Urbana-Champaign) visited Chile to obtain information about earthquake
resistant design in the country. Discussions were held with the faculty from
three universities, practicing engineers in Vifia del Mar and Santiago, and
officials at the Municipality of Vifia del Mar. The group also visited
damaged buildings in Santiago, Vifia del Mar, and Valparaiso.
The objective of this report is to present the information obtained
during that visit. Chapter 2 describes the seismicity, geology, and
foundation conditions of Vifia del Mar and Valparaiso. The development of
seismic design provisions in Chile is presented in Chapter 3. Chapter 4
contains a brief summary of structural engineering practice in Chile.
Chapter 5 deals with the ground motion records and the strong-motion arrays.
Information about thirteen specific buildings in Vifia del Mar and Valparaiso
3
is presented in Chapters 6 and 7. Six buildings that sustained structural
damage are described in Chapter 6, and seven undamaged or lightly damaged
buildings are discussed in Chapter 7. Concluding remarks are presented in
Chapter 8.
1.3 Acknowledgments
The research project is conducted as a joint project of
Pontificia Universidad Cat6lica de Chile
University of California at Berkeley
University of Illinois at Urbana-Champaign
University of Michigan
with the sponsorship of the U. S. National Science Foundation.
The writers would like to express their appreciation to the mayor of
Vifia del Mar, Eugenia Garrido Alvarez de la Rivera, for cooperating with this
project by providing access to all information on file at the Municipality.
Thanks are also extended to Hector Balbontin, Director of the Direcci6n de
Planificaci6n, and Carlos Arratia, Juan Candio, and Aldo Fossa for their
discussions of construction, inspection, and review procedures in Vifia del
Mar and for providing information on local geological conditions and maps
describing damage.
The writers are indebted to the many university faculty members in the
departments of Civil Engineering, Geology, and Geophysics at Universidad de
Chile, in Structural Engineering and Construction Engineering at Pontificia
Universidad Catolica de Chile, and in Civil Engineering at Universidad
Tecnica Federico Santa Maria for their valuable discussions.
The writers would also like to thank engineers Elias Arze, Salomon
Chornik, Fernando del Sol, Rodrigo Flores, and Guido Gonzalez for their

4
discussions of structural engineering practice in Chile, providing structural
drawings of various building, leading tours of the buildings and identifying
damage, and describing the proposed repair projects.
Special thanks are extended to Rodolfo Saragoni, Professor of Seismic
Engineering, Universidad de Chile, for providing ground motion records and
Patricio Bonelli, Professor of Civil Engineering, Universidad Tecnica
Federico Santa Maria, for arranging all appointments in Villa del Mar. This
trip could not have taken place without the help of the faculty at Pontificia
Universidad Catolica de Chile, and in particular, Rafael Riddell, Professor
of Civil Engineering, our host in Chile.
Loring Wyllie and Rafael Riddell are thanked for providing some of the
photographs used in this report.
The following students are also thanked for their help in the
preparation of this report: J. Wallace at the University of California,
F. Calabrese, M. Eberhard, R. Lopez, and R. Stark at the University of
Illinois, and M. Alama, A. Ali, J. Bolander, M. Fustok, and S.-P. Feng at the
University of Michigan.
The joint project is sponsored by the NSF with grants ECE 86-06089 at
the University of California, ECE 86-03789 at the University of Illinois, and
ECE 86-03624 at the University of Michigan. Project coordination is provided
by M. A. Sozen, Professor of Civil Engineering, University of Illinois.

5
CHAPTER 2 ENGINEERING FEATURES OF THE VINA DEL MAR REGION
The municipality of Vifia del Mar is located in central Chile (33°02' S,
71°34' W), adjacent to the city of Valparaiso and 120 km (75 mi) northwest of
Santiago. At the time of the 1985 earthquake, the population of Vina del Mar
was approximately 365,000.
This chapter briefly describes the history of the city, the seismicity
and geology of the region, typical foundation conditions, and the
distribution of engineered structures.
2.1 History of Vina del Mar
The history of Vifia del Mar is linked closely to the history of the
adjacent port of Valparaiso. The city of Valparaiso is located on a large
bay of the Pacific Ocean and was the most important port on the west coast of
South America before the opening of the Panama Canal [67].
The first inhabitants are believed to be native indians who migrated to
the region in the early 1400's. Europeans arrived in 1536 as part of an
expedition from Peru. Commercial ships arrived in Valparaiso in 1536, and in
1544 it was named the official port of Santiago [57,67].
During the sixteenth and seventeenth centuries, all imports from Europe
entered through Valparaiso and then were distributed to the other parts of
Chile. Italian, French, and British merchants established trade in
Valparaiso in the early 1700's. By the middle of the nineteenth century, 96%
of all imports and 50% of all exports passed through the port [67]. There
was little industrial activity in the region until well into the nineteenth
century.
6
The region now incorporated into Villa del Mar was divided into two large
estates in 1543 and the municipality was not established until 1874.
Although the land was used primarily for farming during this period, the
beach front had already acquired acclaim as a resort area [66].
A railway between the Villa del Mar region and Santiago was completed in
1855, and a sugar refinery was established in Villa del Mar in 1873. In 1883,
the English firm Lever and Murphy constructed a metal processing plant on the
beach, and in 1887, the first steam locomotive in South America was built
there [47,66].
Large hotels were constructed in 1874 and 1882, and the first public
bathing area was opened in 1884. In 1910, the beach was leveled to provide a
better swimming area and a casino was opened in 1930 [66].
The population of Villa del Mar grew from 28,500 in 1907 to more than
126,000 in 1960 [66]. Construction activity also increased throughout this
period and reached a peak between 1960 and 1965 [56]. The number of planned
hotels and condominiums was so great that in 1963 the Municipality passed a
law forbidding construction on the beach [66].
A second period of peak construction activity occurred between 1977 and
1982 [56].
2.2 Seismicity of the Region
The Chilean coast parallels the boundary between the Nazca and South
American Plates, and the seismic activity of the region has been attributed
to large-scale crustal movements along the boundary (Fig. 2.1) [39]. A
nearly uniform zone of seismic activity occurred in the region between
latitudes 18° and 45° south (Fig. 2.2) during the period of 1963 to 1978
[55]. Geophysical evidence indicates the eastward subduction of the Nazca

7
plate along the coast of Chile and Peru is at a rate of approximately 10 em
per year [55].
Two types of mechanisms have been suggested as the source of seismic
activity along the western coast of South America [41,42]:
1. Interplate events at the interface between the descending slab and
the overriding South American plate.
2. Intraplate events located 20~30 km inside the descending slab.
Earthquakes of magnitude 8 are likely to result from the first mechanism and
magnitudes up to 7.5 may be expected from the second [41,42].
The inclination of the Nazca plate is not constant in this subduction
zone [8]. As listed in Table 2.1, the region has been divided into five
zones with alternating steep and gentle slopes. Present volcanic activity is
high in regions of steep inclination and absent in the gently sloping
regions. Vina del Mar is located at one of the boundaries between these
zones.
Records of seismic activity in Chile date back to the arrival of
Europeans in the area. A summary of major earthquakes is presented in
Table 2.2 [40]. The apparent epicenters of approximately 80% of these
earthquakes were located near the coast or offshore. The cities of
Valparaiso and Vina del Mar were destroyed in the 1647, 1730, 1822, and 1906
events and serious damage was caused by the 1575, 1751, 1851, 1880, 1965,
1971, and 1985 earthquakes [40,23,57].
The 1985 earthquake appeared to be part of a cycle of damaging
earthquakes in the central region of Chile. Historical evidence indicates a
complete rupture of the plate boundaries from latitudes 31 0 to 36 0 south at
approximately 80 year intervals (Fig. 2.3) [23,27]. One hypothesis suggests
that another large earthquake is likely to occur in the near future south of
the 1985 earthquake to complete this cycle [23].
8
Earthquakes of magnitude 6 and greater which occurred along the Chilean
coast during the period of 1965 to 1985 are listed in Table 2.3 [65].
Modified Mercalli Intensities in the Valparaiso/Vina del Mar region are also
noted. Relatively high accelerations have been recorded in this area during
previous earthquakes. During the 7 November 1981 earthquake (Ms =6.8), a peak
horizontal acceleration of O.605g and a peak vertical acceleration of O.637g
were recorded in Papudo and the peak horizontal accelerations in La Ligua and
Ventanas exceeded O.35g (Fig. 2.4) [27]. However, the Modified Mercalli
Intensity was VII in the epicentral region, indicating that peak acceleration
is not necessarily an indication of damage from the Chilean events [27].
2.3 Geology of the Region
The orographic characteristics of Chile vary in the east-west and north
south directions. In general, three features dominate the terrain in the
east-west direction: the coastal mountain range, the central valley, and the
Andes. The central valley is not present along the entire length of the
country [28,46].
The cities of Valparaiso and Vina del Mar are located on the western
side of the coastal range. Outcrops of the Precambrian basement (primarily
amphibolite) surround the port of Valparaiso. The geosyncline which led to
the formation of the central valley developed during the Paleozoic Era, and
during that time there was an intrusion of granite into the Valparaiso/Vina
del Mar region. The present coast from Valparaiso to San Antonio emerged
from the ocean during the Triassic period. During the Tertiary period, the
ocean covered the region of Vina del Mar and sedimentary deposits were laid
down which developed into sandstones [28,46].

9
The Quaternary period was one of great geological activity in Chile,
with glaciation, volcanism, and tectonic movements combining to form the
present coast and relief features. The floor of the central valley is almost
exclusively morainic materials, but there is no evidence of these materials
along the coast. Volcanic materials are not found in the Valparaiso/Vina del
Mar region [28,46].
The present topography of Vina del Mar is typical of a receding
coastline whose most notable features are marine terraces and sedimentary
deposits (Fig. 2.5) [3,30J. Vina del Mar was founded on the marine-alluvial
deposits at the mouth of the Marga-Marga River. Recently, the city has
expanded onto the adjacent marine terraces and slopes [3]. The terraces on
either side of the Marga-Marga River are at different elevations and
unmatched sedimentary layers in the region suggest vertical motion along the
fault which follows the river [3,30].
A geological map of the Valparaiso/Vina del Mar region is shown in
Fig. 2.6.
2.4 Foundation Conditions in the Region
The foundation conditions in the Valparaiso/Vina del Mar region have
been divided into five main categories [30J:
l. Fresh rock
2. Weathered rock
3. Cemented sand and gravel
4. Uncemented sand and gravel
5. Artificial fill
The fresh rock is thought to be the best foundation material; however, it is
found primarily on vertical cliffs and steep slopes. The weathered rock is a

10
good foundation material if the moisture content is low. In the presence of
water, the weathered rock is very compressible. Weathered rock covers
approximately 80% of the Valparaiso/Vifia del Mar region. The cemented sands
and gravels are highly compacted and are an excellent foundation material.
The uncemented sands and gravels provide an adequate foundation material
under normal conditions, but they become unstable if saturated or shaken.
(Ground water is reported to have been expelled through cracks in the ground
in Vifia del Mar during the 1851 and 1906 earthquakes [40,57]). Artificial
fill has been found to be the worst foundation material in the region,
especially in regions with high organic content [30].
Four of these foundation materials are found in Vifia del Mar.
Unsaturated weathered rock, known as "maicillos", is found in the high
regions surrounding the city. The majority of Vina del Mar is founded on
uncemented sand and gravel deposits, and cemented sands are found in the
dunes around Refiaca. Artificial fill was deposited along the beach in
thicknesses ranging from 2 to 4 m. The typical characteristics of these
foundation materials are summarized in Table 2.4 [3].
Extensive soil exploration programs are generally not conducted for
residential and commercial construction projects in Vifia del Mar. Available
information from bore holes drilled near buildings of interest are documented
in Appendix A. Structures in the compacted sand region are typically founded
on mat or continuous footing foundations. Some pockets of saturated muddy
clay have been identified along the river, and pile foundations are required
for structures located in these areas. The mean water level is approximately
4 m below ground in the downtown region of Vifia del Mar [3].
A notable geological feature of Valparaiso is the large portion of the
city which is founded on artificial fill (Fig. 2.7) [2,21]. The depth of
this fill is 10 m at the coast and tapers to zero approximately 2 km inland.

11
The majority of this material was deposited during the construction of the
railroad which linked Valparaiso to Santiago in the 1880's [30]. Damage in
this region is consistently greater than the damage in the surrounding hills
[40,57] .
The strong-motion instrument in Vina del Mar was located in the basement
of a bank on the town square (Fig. 6.1). Most of the buildings examined in
this report are located along the beach, north of the river. The soil on the
south side of the Marga-Marga River is a fluvial sand whereas the sands on
the north side of the river are generally marine deposits. Site response
spectrum tests conducted during aftershocks in July and August 1985 [17]
indicated almost identical amplification on each side of the river.
Amplification may have been slightly higher on the hills in Renaca at the
site of El Faro [17], an eight-story RIC building that collapsed during the
earthquake. More important amplification occurred at the site of the Canal
Beagle housing complex on the ridges along the eastern boundary of Vina del
Mar (Fig. 2.8) [17].
The Valparaiso strong-motion instrument was located on rock at
Universidad Tecnica Federico Santa Maria, and the El Almendral instrument was
located in the Church of the Twelve Apostles which is founded on
approximately 5 m of artificial fill.
After the 1985 earthquake, the municipality of Vina del Mar began a
microzonation study to identify the parts of the city in which damage is
likely to be highest. Preliminary results indicate that if an earthquake
causes an intensity I in the surrounding marine terraces, the intensity is
likely to be I+l and I+2 on the slopes leading down to the city and I+3 in
the alluvial, fluvial, and colluvial deposits along the Marga-Marga River
(Fig. 2.9) [3].
12
2.5 Distribution of Engineered Structures
As part of the microzonation study, the Municipality of Vina del Mar
developed a variety of maps that identify the location of all existing
buildings, the distribution of damage, and the location of buildings that
were demolished as a result of the damage. According to the study,
approximately 400 buildings ranging in height from 5 to 23 stories were
located in the city at the time of the 1985 earthquake (Fig. 2.10). All
buildings in this height range were constructed from reinforced concrete.
The majority of these buildings are concentrated in the downtown area of Vina
del Mar, at the mouth of the Marga-Marga River (Fig. 2.11).
Although the buildings identified by the microzonation study were not
classified according to the structural framing system, walls comprised the
lateral-load resisting system for nearly all the reinforced concrete
buildings. Only three buildings in the downtown area were identified as
having moment-resisting frames: Emporium, a four-story retail building;
Nuevo Centro 2, a six-story commercial center; and Arcadia, a nine-story
commercial center and apartment building. A fourth building with moment
resisting frames, Euroso1 (a six-story apartment building), is located in
Refiaca. Reference 56 contains a detailed description of the building
inventory in Vina del Mar.

13
CHAPTER 3 DEVELOPMENT OF SEISMIC DESIGN PROVISIONS IN CHILE
The Talca earthquake of 1 December 1928 (Table 2.2) initiated the
development of seismic design regulations in Chile [10,26,63,64]. The first
official regulation that included seismic design provisions, La Ordenanza
General de Construcciones y Urbanizaci6n, was adopted in 1935. The current
seismic code, NCh 433-0f72: Calculo Antisismico de Edificios [16], was
adopted in 1972. The development of these codes is described in this
chapter.
3.1 La Ordenanza General de Construcciones y Urbanizaci6n
Flores and Jimenez [26] describe the development of La Ordenanza General
de Construcciones y Urbanizaci6n (referred to as the General Ordinance in
this report) as follows:
"As a consequence of [the Talca earthquake of 1928], the government named a committee of three engineers to study the subject [of seismic regulations for structural design]. The work of this committee was highly influenced by the theoretical literature of the epoch [1927-1932] in which the concept of resonance prevailed, so that the recommendations which were adopted were intended to avoid it.
They prescribed that brick masonry be built with reinforced concrete columns and beams, according to a system devised by Italian engineers after the great Sicilian earthquake of 1908 [confined masonry construction]. This construction system proved to be quite effective during the Chillan earthquake of January 1939.
A General Ordinance based on these recommendations was finally endorsed in 1931 and approved as law in 1935.
This Ordinance applied to the whole country. It not only gave rules for construction, but also for the design of structures. In its first version, the text provided a series of specifications with the purpose of obtaining monolithic action or continuity of

14
structures, whenever possible. It also limited the use of certain materials and forbid some kinds of construction which up to that date had been widely used.
With reference to seismic forces, the Ordinance required that all structures should be checked for lateral forces of 1/10 to 1/20 of the weight of the structure, as a function of ground conditions and other factors.
This General Ordinance initiated modern seismic engineering in Chile. A significant number of minor and medium-sized structures built in accordance with its provisions behaved satisfactorily during recent earthquakes.
This code began to be applied in a provisional way in 1930 and ruled construction in Chile up to the devastating Chi11an earthquake of 1939, when it became apparent that revision of this Ordinance was due."
A new General Ordinance was quickly approved in 1939 [10]. Building
height limits were established:
Reinforced Concrete 12 stories or 40 m Structural Steel 13 stories or 40 m Timber 3 stories or 12 m Masonry 2 stories or 8 m Adobe 1 story or 3.5 m
The Ordinance did not permit construction with unreinforced masonry, and
strict provisions were specified for adobe construction [10].
The seismic base-shear coefficient established in the General Ordinance
of 1939 was dependent upon the period of the structure, as well as the
foundation conditions. For buildings with calculated periods less than
0.4 sec, the base-shear coefficient ranged between 0.1 and 0.2 depending upon
the quality of the soil [10,63]. Lateral forces were distributed uniformly
over the height of the structure [10].
For buildings with calculated periods greater than 0.4 sec, the seismic
response was considered to be equivalent to forced vibration with a peak
acceleration between 0.1 and 0.2 g, a displacement amplitude between 4 and
6 cm, and a period between 1 and 2 sec [10]. The magnitude of the forcing
acceleration was a function of the soil conditions. Buildings with
calculated natural periods between 1 and 2 sec were not permitted [10].
15
Immediately after the revised General Ordinance was adopted in 1939,
engineers, architects, and contractors expressed opposition because the new
requirements led to an increase in building costs [10]. In 1945, the
government appointed a committee to write a more economical building code
[10,26].
The next revision to the General Ordinance [38], which contained less
severe seismic requirements, was adopted in 1949. Height limitations were
eliminated for reinforced concrete and structural steel buildings and the
maximum height of confined masonry construction was increased to four stories
[10].
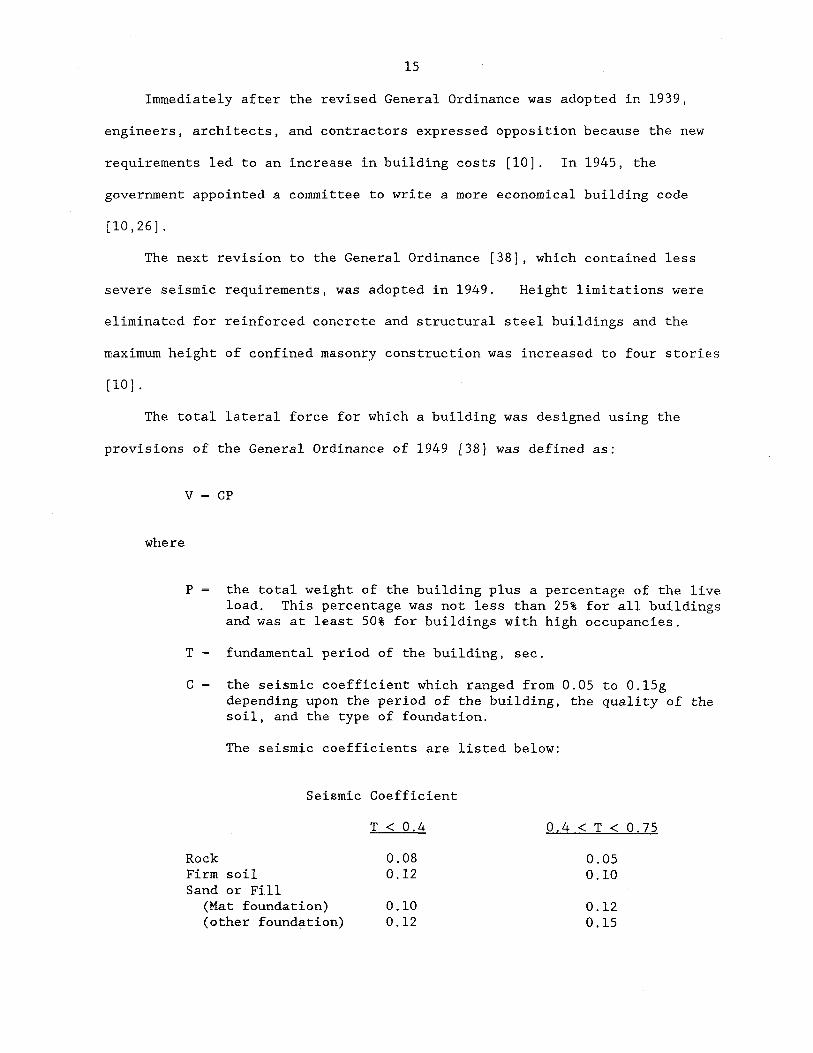
The total lateral force for which a building was designed using the
provisions of the General Ordinance of 1949 [38] was defined as:
where
v CP
P the total weight of the building plus a percentage of the live load. This percentage was not less than 25% for all buildings and was at least 50% for buildings with high occupancies.
T fundamental period of the building, sec.
C the seismic coefficient which ranged from 0.05 to 0.15g depending upon the period of the building, the quality of the soil, and the type of foundation.
The seismic coefficients are listed below:
Seismic Coefficient
T < 0.4 0.4 < T < 0.75
Rock 0.08 0.05 Firm soil 0.12 0.10 Sand or Fill
(Mat foundation) 0.10 0.12 (other foundation) 0.12 0.15

16
The forces were distributed over the height as follows:
p Z F k k
V k I(P. Z. )
1 1
where
k story level
Fk lateral force at level k
Pk weight of level k
Zk height of level k above base
The General Ordinance of 1949, with minor modifications, is essentially
still in force today. However, the sections governing seismic design of
buildings have been replaced by the current building code, NCh 433, which was
adopted in 1972 [26,64].
3.2 La Norma Chilena NCh 433: Ca1cu1o Antisismico de Edificios
Flores and Jimenez [26] described the development of the current seismic
design provisions as follows:
"In the year 1960, INDITECNOR (Instituto Naciona1 de Investigaciones Techno16gicas y Norma1izaci6n) was studying a new code to incorporate the experience and knowledge gained in Chile and abroad until that time in the field of earthquake engineering. This project was left aside when new information on the behavior of buildings during the major earthquakes of May 1960, that shook the southern part of Chile, became available.
A tentative proposal for a new code which was accepted, was submitted to the seismic studies committee of INDITECNOR in 1962 ... In May 1966, a provisional version of the NCh 433 code was approved to replace the chapters of the General Ordinance referring to seismic design of buildings. The committee appointed to study the Chilean seismic code took more than thirteen years to complete its work, until approval in 1972. The NCh 433 code became law on April 23, 1974 .
.. . It is interesting to bear in mind that the concepts involved in the NCh 433 code were applied long before its becoming law. Many buildings which successfully withstood the 1960, 1965, and 1971

17
earthquakes, were designed in accordance with its prescriptions. Reciprocally, this experience influenced the code under development."
The new code classified buildings according to the occupancy importance
and structural characteristics. Static and dynamic methods for determining
lateral forces were also included [5]. * NCh 433 [16] is summarized below.
3.2.1 Static Analysis
This method of analysis is not permitted for buildings more than 15
stories or 45 m in height with irregular distributions of mass or stiffness
along the height.
The total base shear is defined as:
where
Q base shear
Kl coefficient related to occupancy importance 1.2 for essential facilities 1.0 for buildings for general use 0.8 for provisionary construction and isolated
buildings not intended to be used as dwellings
Kz coefficient related to structural system 0.8 for ductile, moment-resisting frames 1.0 for buildings with rigid floor diaphragms 1.2 for all other structures
C seismic coefficient 0.10 for T :S To
2T T 0.10
o for T > To
T fundamental period of vibration of the structure
*Summarized and translated by R. Riddell.
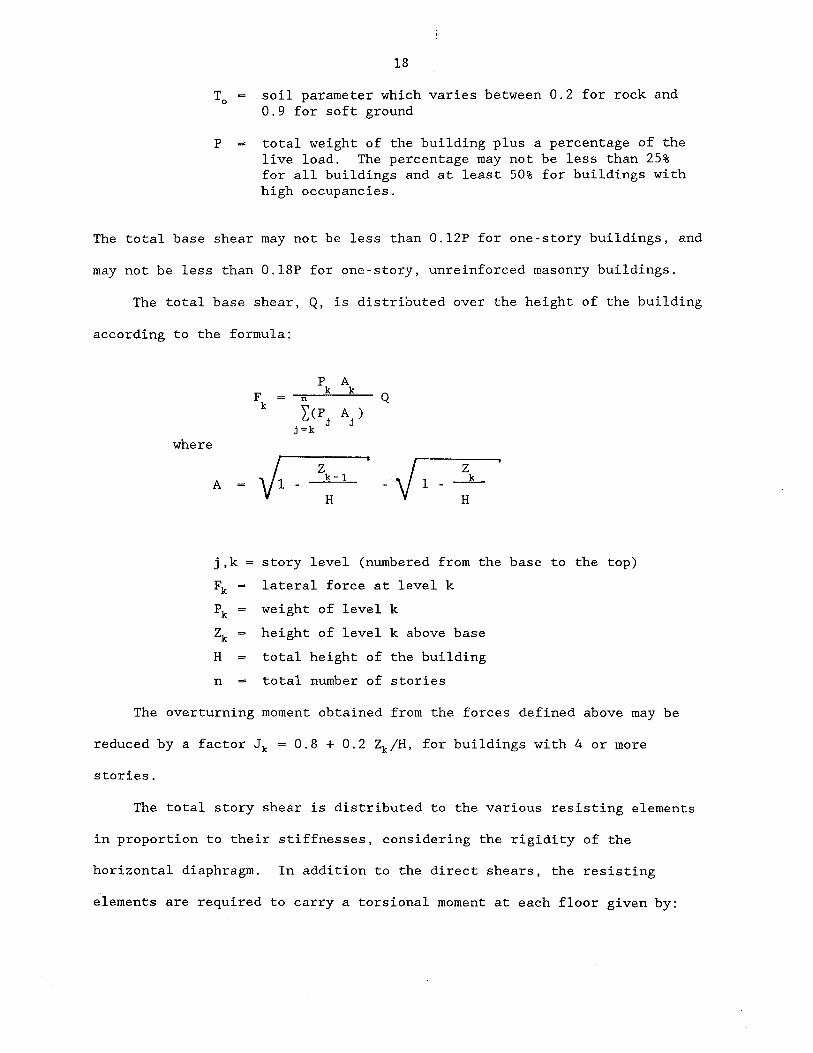
lB
T soil parameter which varies between 0.2 for rock and o 0.9 for soft ground
P total weight of the building plus a percentage of the live load. The percentage may not be less than 25% for all buildings and at least 50% for buildings with high occupancies.
The total base shear may not be less than 0.12P for one-story buildings, and
may not be less than O.lBP for one-story, unreinforced masonry buildings.
The total base shear, Q, is distributed over the height of the building
according to the formula:
P A F k k
Q n k
I(P. A.) j=k J J
where
0 Z VI Z A
k-l ___ k_
H H
j,k = story level (numbered from the base to the top)
Fk lateral force at level k
Pk weight of level k
Zk height of level k above base
H total height of the building
n total number of stories
The overturning moment obtained from the forces defined above may be
reduced by a factor J k = O.B + 0.2 Zk/H, for buildings with 4 or more
stories.
The total story shear is distributed to the various resisting elements
in proportion to their stiffnesses, considering the rigidity of the
horizontal diaphragm. In addition to the direct shears, the resisting
elements are required to carry a torsional moment at each floor given by:

where
19
n
M k
0.05 \ I F.b. j=k J J
Mk torsional moment at level k
Qk shear at level k
ek distance between the center of rigidity of level k and the line of action of the story shear Qk
Fj lateral force at level j
b j plan dimension at level j in a direction perpendicular to Fj
Ik 0 . 7 + O. 3 Zk /H
3.2.2 Dynamic Analysis
A modal superposition type of analysis is permitted with an acceleration
spectrum (Fig. 3.1) given by:
S 0.10 Kl K2 for T :S To
__ a
g 2TT 0.10 K K
0 for T > To
1 2 T2+ T2 0
The ordinates of the acceleration spectrum are equal to the product of the
seismic coefficient, C, the occupancy factor, K1 , and the structural system
factor, K2 . The total base shear may not be less than 0.06 Kl K2 P.
Each effect S shall be estimated by the superposition of the values for
each mode, Si' with the formula:
S -.L ( I IS. I +-~ ) 2 1 V L ':>i
A complete English translation of NCh 433 is contained in Reference 22.

20
CHAPTER 4 STRUCTURAL ENGINEERING PRACTICE IN CHILE
This chapter presents detailed information on typical building types,
structural and nonstructural details, construction, and material properties.
Much of the information was obtained during discussions with practicing
engineers and from observations of existing buildings.
4.1 Building Types and Design Concepts
Most buildings in Chile are constructed using masonry (reinforced and
unreinforced) or reinforced concrete. The cost of structural steel buildings
is high because the nonstructural finishing materials are not readily
available and heavy structural steel sections are not rolled in the country.
Structural steel is commonly used for bridges and industrial structures,
however. Prestressed/precast concrete construction is not typically used for
buildings, but it is used for bridges and underground parking structures.
4.1.1 Masonry Construction
Three types of masonry construction are commonly used in Chile:
unreinforced masonry, confined masonry, and reinforced masonry. The use of
unreinforced brick masonry was prohibited in the General Ordinance of 1939;
however, unreinforced brick partition walls are common. Adobe construction
is limited to one-story buildings. Adobe and unreinforced masonry
construction suffered heavy damage during the 1985 earthquake, especially in
Melipilla where hundreds of houses were destroyed [7]. Adobe structures in
Valparaiso also suffered serious damage.

21
Confined masonry was introduced in Chile in the late 1920's following
the 1928 Talca earthquake [26]. This type of construction is characterized
by reinforced concrete columns that are cast directly against previously
constructed unreinforced brick panels (Fig. 4.1). A "chain beam" is then
cast around the perimeter of the structure. This type of construction
provides a confined brick panel and a keyed surface that facilitates
composite action between the brick and surrounding reinforced concrete
members. It also provides a means of connecting perpendicular walls
(Fig. 4.1). Structures of this type are limited to four stories in height
and reinforced concrete floor slabs are required [38]. In general, confined
masonry structures performed well during the 1985 earthquake; however,
columns were observed to separate from the masonry panels in a number of
buildings. Problems were also observed in buildings with unsymmetrical
arrangements of walls [7].
There are two types of blocks used in reinforced masonry: concrete
blocks and machine fabricated clay bricks. The clay bricks are more common
and are fabricated with perforations to allow placement of the reinforcing
bars. Reinforced masonry construction with clay bricks is very lightly
reinforced. The average vertical reinforcement in walls is 8-mm diameter
bars spaced at l-m intervals. More reinforcement is placed in the corners
(Fig. 4.2). One 8-mm diameter bar is typically placed horizontally above
doors and windows. Reinforced concrete slabs are also used for this type of
construction.
Reinforced masonry construction with machine fabricated clay bricks did
not perform well during the 1985 earthquake. Extensive cracking of the
masonry walls, around openings, and at the connection with the floor slabs
was observed [7]. The General Ordinance does not have specifications for
this type of construction, and foreign codes were unofficially adopted.
22
Confined masonry and reinforced masonry is used for most of the social
housing constructed by the government.
4.1.2 Reinforced Concrete Construction
Both frame and wall construction philosophies developed in Chile during
the early 1900's. However, according to engineers at Arze, Recine y
Asociados, Ingenieros Consultores LTDA, in Santiago, construction of frame
buildings declined following failures of some early frame buildings during
earthquakes in the 1930's. The typical Chilean building constructed since
that time relies on structural walls for lateral load resistance.
The use of structural walls became a significant part of architectural
practice in Chile. Thus, when high-rise construction began to evolve in the
early 1960's, liberal use of structural walls continued. Ratios between wall
and floor areas are typically much higher in Chilean construction than in
construction in seismic zones in the United States. The moderate-rise
buildings examined in this report relied primarily on structural walls to
resist lateral loads.
Detailed design of reinforced concrete construction has been influenced
by procedures in the U.S., Germany, and Japan. The current building code for
reinforced concrete [32,33] is based on the 1952 German DIN standard [11];
however, many designers have adopted portions of the strength design
provisions of the ACI building code [14]. In general, modern reinforced
concrete construction in Chile does not follow the ductile detailing
requirements in Appendix A of the ACI building code [14].

23
4.1.3 Design Concepts
The Chilean philosophy with respect to acceptable damage and safety is
the same as that commonly expressed in the U.S.: minor damage is acceptable
in moderate earthquakes and structural failure should be avoided in severe
earthquakes [53]. However, the scales of earthquake intensity are not the
same in the U.S. and Chile. Although bounds are not explicitly established,
earthquakes with magnitudes between 6.5 and 7.0 are considered to be minor in
Chile, and structural damage is not expected during such events. A magnitude
on the order of 7.5 corresponds to a moderate earthquake.
The Chilean experience with frequent strong earthquakes has led to a
building construction form that differs from that of the U.S. Chilean
engineers, architects, and occupants prefer "rigid" structures. The rigidity
is achieved by the use of relatively large proportions of structural walls
for lateral load resistance. Experience with these structures has led to the
conclusion that careful detailing and construction inspection are, in most
cases, unnecessary. A more detailed discussion of building design and
construction practice is presented in the following section of this chapter.
4.2 Structural and Nonstructural Details in Reinforced Concrete Buildings
A brief description of typical structural and nonstructural details in
reinforced concrete construction is presented in this section. Emphasis is
placed on reinforced concrete construction because all buildings having more
than four stories in Vifia del Mar were constructed from reinforced concrete.
24
4.2.1 Structural Details
The detailing requirements for reinforced concrete elements in the
current Chilean code, NCh 429 [32] and NCh 430 [33], were not developed for
construction in seismic areas. There are no special detailing requirements
for ductility, and some requirements are specific to gravity loads. Although
not required, many engineers follow some of the detailing provisions in
Appendix A of the 1977 edition of the ACI building code [14]. The Chilean
reinforced concrete code is described in greater detail in Reference 56. A
few provisions are summarized below.
No limits are placed on the amount of flexural reinforcement placed in
beams and walls. The flexural reinforcement ratio in columns must be between
0.8 and 6%. Shear reinforcement is required in beams if the average shear
t d 1 9 ~C' h fl·· .* S ress excee s . ~L, were c ~s ~n ps~ . Bending of longitudinal
reinforcement in beams to provide shear reinforcement is recommended;
however, vertical stirrups are permitted. The minimum wall thickness is
20 cm (8 in.) and the reinforcement ratio for shear reinforcement in the
walls must not be less than 0.2%. Hooks with 180 0 bends are specified for
anchorage of reinforcement and 90 0 hooks are permitted for column steel. The
inside diameter of the bend may not be less than 2.5 bar diameters and the
bar must extend at least 4 bar diameters past the bend.
Because these detailing provisions for anchorage and transverse
reinforcement are not practical for construction in Chile, the manufacturer
of reinforcing bars, CAP, publishes a set of recommended details [9]. The
recommended details for development length, lap splices, hooks, and spacing
between bars are the same as the ACI requirements [14] for regions with low
seismic risk. One notable exception to the ACI code is the reduction of
*The Chilean reinforced concrete code [38,39] is based on working stresses.

25
cover requirements. The Chileans interpret the ACI provisions in cm rather
than in.
Because a single set of detailing recommendations is not followed
closely, it is not possible to characterize detailing practice in Chile.
However, some perspective may be gained by reviewing the structural drawings
of buildings in Chile. The following observations were made from buildings
located in Vina del Mar. The structural characteristics of these buildings
are described in Chapters 6 and 7.
Each structure considered had structural walls occupying a large portion
of the floor area. Wall thicknesses ranged from 20 cm (8 in.) in low-rise
buildings and the upper stories of moderate-rise buildings to 70 cm (28 in.)
at the base of a 22-story building. The walls were lightly reinforced,
longitudinal reinforcement ratios were typically less than 1%. In general,
there was no confinement of the boundary reinforcement in the walls. One
exception was Festival where a single hoop, formed from a 10-mm (0.4 in.)
diameter bar, spaced every 20 em (8 in.) was used around sixteen 26-mm
(1 in.) diameter bars.
The shear reinforcement in walls was also light, and typically provided
by two layers of welded wire fabric. In some cases, the shear reinforcement
was oriented at 45 0 from vertical. This arrangement was used primarily in
portions of the walls which were used as transfer girders where the locations
of openings in the shear walls changed near the base of the structure.
Lap splices were used for the longitudinal bars in walls and were
typically located immediately above the level of the slab.
Transverse reinforcement was carefully detailed for columns. The
location of each tie was shown on the structural drawings. The use of spiral
reinforcement in the columns was not observed. The locations of lap splices
for longitudinal bars in the columns occurred generally near the beam-column
26
joint, and through the joint in some cases. Details of transverse
reinforcement in the joint region were not specified on the drawings examined
in this study, although such reinforcement is recommended in the CAP manual
[9].
Bent longitudinal beam reinforcement was used for shear reinforcement in
approximately one-third of the structures. Bent bars were also observed in
slabs, but were less common. Slabs were often used as coupling beams between
structural walls. Additional longitudinal reinforcement was usually placed
in these areas.
Detailed drawings of the reinforcing bars are not prepared in Chile.
Reinforcement is fabricated at the construction site directly from the
structural drawings.
The location of construction joints are not identified on the drawings,
but left to the contractors' discretion.
4.2.2 Nonstructural Details
Seismic requirements in Chile do not cover nonstructural elements, such
as partition walls, ceilings, light fixtures, piping, elevators, stairs, and
windows. Windows are currently regarded with some concern because there are
no wind design requirements in Chile which would require special detailing of
window frames.
Structural engineers and architects agree that partitions walls should
be isolated from structural elements to avoid damage during earthquakes.
However, isolation details are not given in structural drawings so
instructions are typically given orally in the field. A considerable amount
of partition damage was observed during the 3 March 1985 earthquake. Poorly
27
designed details and improper construction are believed to be the cause of
this damage.
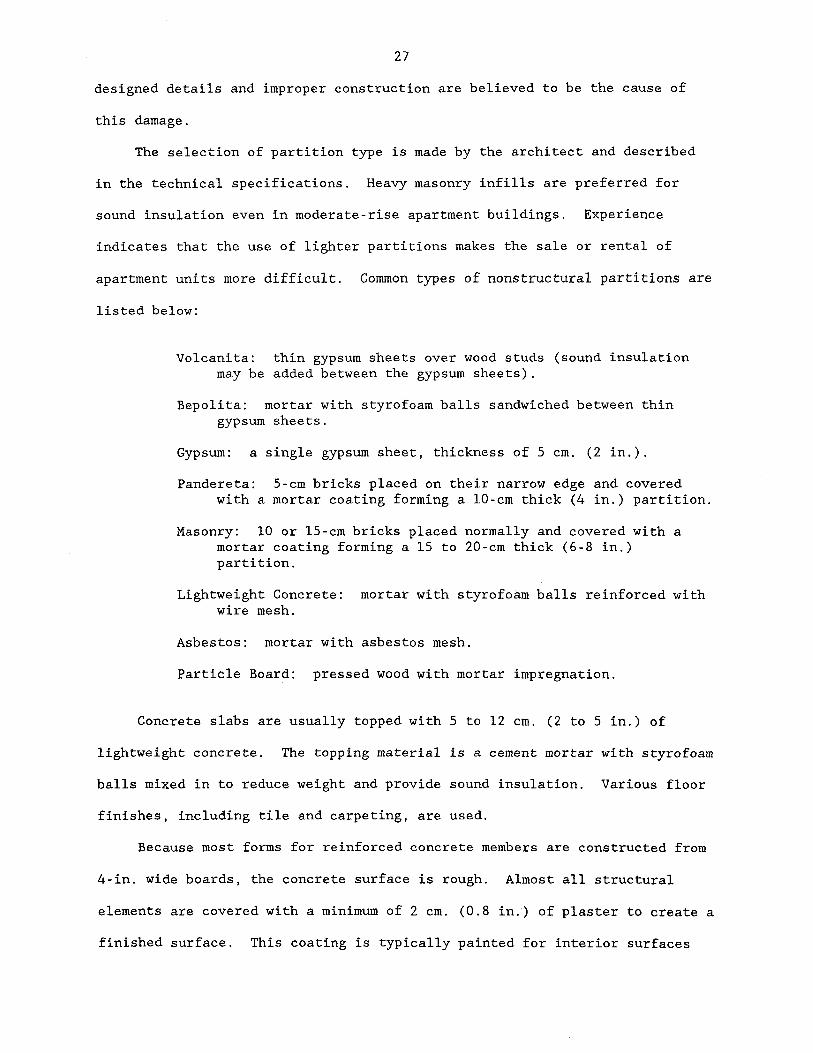
The selection of partition type is made by the architect and described
in the technical specifications. Heavy masonry infills are preferred for
sound insulation even in moderate-rise apartment buildings. Experience
indicates that the use of lighter partitions makes the sale or rental of
apartment units more difficult. Cornmon types of nonstructural partitions are
listed below:
Volcanita: thin gypsum sheets over wood studs (sound insulation may be added between the gypsum sheets).
Bepolita: mortar with styrofoam balls sandwiched between thin gypsum sheets.
Gypsum: a single gypsum sheet, thickness of 5 cm. (2 in.).
Pandereta: 5-cm bricks placed on their narrow edge and covered with a mortar coating forming a 10-cm thick (4 in.) partition.
Masonry: 10 or l5-cm bricks placed normally and covered with a mortar coating forming a 15 to 20-cm thick (6-8 in.) partition.
Lightweight Concrete: mortar with styrofoam balls reinforced with wire mesh.
Asbestos: mortar with asbestos mesh.
Particle Board: pressed wood with mortar impregnation.
Concrete slabs are usually topped with 5 to 12 cm. (2 to 5 in.) of
lightweight concrete. The topping material is a cement mortar with styrofoam
balls mixed in to reduce weight and provide sound insulation. Various floor
finishes, including tile and carpeting, are used.
Because most forms for reinforced concrete members are constructed from
4-in. wide boards, the concrete surface is rough. Almost all structural
elements are covered with a minimum of 2 cm. (0.8 in.) of plaster to create a
finished surface. This coating is typically painted for interior surfaces

28
and ceramic tile is commonly affixed to exterior walls to create a more
decorative surface.
4.3 Construction and Inspection Practices
Construction and inspection practices in Chile appear to be less
sophisticated than the design practices. Flores and Jimenez [26] summarized
the Chilean construction industry as follows:
"The design and construction of the most important projects are carried out in Chile under the best conditions, resembling very closely those being used in developed countries. Construction is performed with the most appropriate types of equipment, under well controlled conditions, [and] complying with international standards ... On the other hand, in small projects, the quality obtained is deficient, in many cases, for lack of adequate quality control and on account of mediocre designs ... Between the large and the small projects, lie the medium sized ones, which are really the most numerous and important, because of their socio-economic significance ... Many engineers maintain that [the damage from the 1985 earthquake] could have been partially avoided if adequate regulations concerning design review by qualified engineers and construction inspection by independent parties had been in force."
The following discussion of inspection practice is specific to Vina del
Mar, but may be considered representative of most of Chile.
Before 1955, inspection of construction was closely monitored by city
inspectors. Site visits were scheduled to inspect the project at three
critical times during construction.
The construction industry grew dramatically in the early 1960's and the
municipality was unable to maintain the on-site inspection. However, all
drawings and design calculations were checked before the construction permit
was issued. This procedure was also discontinued in 1981 due to a lack of
technical support at the municipality and the pressure to begin construction
projects as soon as possible. The only current requirement is that the
drawings for buildings over two stories be presented to the municipal office
with a statement that an engineer has reviewed and stamped the drawings.
29
The architect is responsible for building construction and inspection;
however, the structural engineer typically visits the site also. The
progress of the project is recorded in a log book, and all problems are
documented in that book. The book serves as the contractor's proof that the
building was constructed according to the drawings and any deviations were
approved by the architect or engineer.
The municipality requires that both the architect and structural
engineer accept the building before a certificate of occupancy is issued.
The municipality inspects the building at that time to insure that it agrees
with the drawings. The municipality keeps a file for all engineered
structures. The file contains the structural drawings, architectural
drawings, maps of utility lines, material test reports, and construction
specifications.
4.4 Materials Used in Buildin~ Construction
4.4.1 Concrete
Specifications covering cement and aggregates are given in Chilean
codes, NCh 148 [18] and NCh 163 [19], respectively. The current
specification for concrete, NCh 170 [34], defines five grades of concrete
which are classified by the minimum resistance of a 20x20x20 cm cube at an
age of 28 days, R28 . A factor of 0.85 may be used to convert from the
resistance of a cube to the compressive strength of a cylinder, f~.

30
CLASS R28 f' f'
c c kg/cm2 kg/cm2 ksi
A 120 100 1.45 B 160 140 1.90 C 180 150 2.20 D 225 190 2.75 E ~300 255 3.60
The lower strength concretes are used for slabs on grade and low-rise
structures. The higher strengths are used for taller buildings. Classes D
and E were typically specified for the moderate-rise buildings in Vina del
Mar. The concrete code is currently being revised, and a statistical
approach for acceptance of concrete strength, similar to the approach
described in Reference 54, has been proposed.
River aggregates are typically used in Chilean concretes. They are
usually rounded and of high quality. However, as gathered and stockpiled,
the properties are not consistent with respect to size and gradation.
Aggregate properties are not checked daily, and changes are not incorporated
into the mix design. However, concrete is usually made with a high margin of
safety, so that most contractors get concrete strengths well above the
specified minimum resistance. Some concrete companies have begun to use
crushed aggregates for more uniform quality. Typical Chilean concretes are
relatively impermeable. The average unit weight of concrete is approximately
2400 kg/m3 (150 pcf).
Chilean cements are not pure Portland cement. They contain 20 to 30%
pozzolan. The cement grains are usually very fine and result in high early
strengths. Concretes made using this cement exhibit problems with shrinkage
cracking. The fine grain sands contribute to this problem.
Admixtures are frequently added to reduce costs. For example, a water
reducer may be added so the cement content could be reduced without lowering
the concrete strength.

31
Quality control laboratories that monitor the concrete strength are
usually associated with a university. Concrete prisms are normally cast at
the job site and tested in the laboratory. Specifications require that one
sample be taken per 100 m3 of concrete cast or at least once a day. However,
time and location within the building are the choice of the contractor. The
concrete testing laboratory personnel are involved only with material
testing, not with general building inspection. Among the Chilean engineers
that were interviewed, there was a general feeling that although the testing
laboratories enforce good quality control on the concrete, casting practices
could be improved.
Concrete tensile strength, as measured by a flexural rupture test, is
approximately lS% of the compressive strength obtained from cube tests. The
splitting strength is approximately 70% of the flexural modulus of rupture.
4.4.2 Reinforcing Steel
Specifications regarding properties of reinforcing bars are given in
NCh 204 [1]. There are three general grades for deformed bar and one for
plain bar. The plain bars are available only in 6-rom diameter, all bars with
diameters of 8 rom and larger are deformed bars.
Grade Type fy fu fy fu kg/cmz kg/cmz ksi ksi
A44-28H plain 2,800 4,400 40 62 A44-28H deformed 2,800 4,400 40 62 AS6-3SH deformed 3,SOO S,600 SO 80 A63-42H deformed 4,200 6,300 60 90
The first number in the grade specification is the tensile strength of the
steel in hundreds of kg/cmz, and the second number is the yield stress in the
same units.
32
Ninety-five percent of the bars are rolled within Chile and are of high
quality. All iron ore comes from the same mine and only one company produces
rebars. The deformed rebars generally exhibit good ductility. Some problems
with the quality of imported steel have been observed, primarily with the
ductility of high strength bars imported from other countries in South
America. In the early 1980's, the army produced some high strength bars that
were very brittle and were subsequently discontinued.
Gold-twisted steel imported from Europe was used until 1960. Go1d
drawn bars may also be found in some older buildings, but the use of both
types of steel is prohibited now.

33
CHAPTER 5 GROUND MOTION DURING THE 3 MARCH 1985 EARTHQUAKE
The Chilean earthquake is notable in part because an array of strong-
motion instruments was in place to record the event. The network of
instruments will enable important observations to be made on source and
transmission mechanisms of the earthquake. Although studies of these
mechanisms are of great importance, no attempt will be made in this chapter to
address these issues. Rather, the chapter will be limited to analysis and
discussion of engineering features of strong motion recorded in the epicentral
region.
5.1 Strong-Motion Instrumentation
A strong-motion accelerometer has been in operation in Santiago since
approximately 1940, and has recorded seven earthquakes between 1945 and 1971
[68]. More recently, the departments of Geology and Geophysics and Civil
Engineering at the University of Chile have assembled a strong-motion
instrumentation network comprising over 60 analog strong-motion instruments
[58,68]. Most of the instruments in the network are SMA-1 accelerometers.
The instruments are typically located in small buildings and the recorded
motion closely resembles free-field motion.
Recognizing the likelihood of a strong earthquake in central Chile,
several of the instruments were positioned and in operation in the epicentral
region during the 3 March 1985 event. Approximately 15 high-quality records
were obtained from stations located within 150 km of the epicenter (Fig. 1.2).
Peak accelerations recorded during the earthquake are listed in Table 5.1.
The Santiago instrument that had recorded previous earthquakes did not
function during the 1985 event, so no direct comparison with previously
34
recorded earthquakes is possible. However, practicing engineers in Santiago
generally agreed that the motion in 1985 was stronger than the motion recorded
during the 1971 Valparaiso earthquake (0.16g peak acceleration in Santiago).
5.2 The Records
Records of the main event, obtained at five locations (L1olleo,
Melipi1la, Vifia del Mar, Valparaiso, and El Almendral), are plotted in
Fig. 5.1. No attempt was made to synchronize the records shown in Fig. 5.1.
The NS component of the record obtained at El Centro during the 1940 Imperial
Valley earthquake is plotted as the last record in the figure for comparison.
Table 5.2 describes relevant data on the instruments and soil conditions. The
Llolleo, Vifia del Mar, and Valparaiso records include two horizontal and one
vertical component. The vertical component is missing for El Almendral and
Melipilla.
The recorded acceleration histories indicate that the ground motion was
strong throughout the epicentral region. The duration of strong shaking
(horizontal accelerations exceeding O.lg) was on the order of 60 seconds for
the five records considered, and peak horizontal accelerations were 0.67g in
Melipilla and Llolleo.
Compared with the 1940 El Centro NS record, the Llolleo, Melipilla, and
Vifia del Mar records obtained during the 3 March 1985 Chilean earthquake
reveal equal or higher accelerations, with significantly longer durations of
strong shaking. It should be noted, however, that the CalTech digitization
procedure [36] is not used in Chile. The Chilean records are digitized with
unequal time increments. Therefore, peak accelerations for the Chilean and
U.S. records may not be equivalent.

35
The Llolleo, Valparaiso, and Melipilla records were dominated by high
frequency motion. The frequency content of the Vifta del Mar and El Almendral
records resembled more closely that of the El Centro record.
The motion recorded at stations in Vifta del Mar and Valparaiso (Vifta del
Mar, Valparaiso, and El Almendral) is of particular interest because numerous
engineered structures are located near the stations.
5.3 Response Spectra
Elastic and inelastic response spectra were computed for the acceleration
records* shown in Fig. 5.1. Viscous damping ratios of 0.02, 0.05, 0.10, and
0.20 were considered for the elastic spectra. For the inelastic spectra,
viscous damping in the elastic structure was 5% of critical. One set of
inelastic spectra was calculated assuming an elasto-perfectly plastic response
function and yield strengths, Cy ' ranging from O.lW to 0.5W, where W is the
weight of the single-degree-of-freedom oscillator. A second set of inelastic
response spectra was calculated for the same range of yield strengths with a
strain hardening stiffness after yield equal to 20% of the elastic stiffness.
The Newmark Beta integration scheme [48J with P=~ was used for all
analyses. For the inelastic response calculations, iterations were made in
the duration of the time step to ensure that the response did not overshoot
yield. Similar iterations were not made to determine the unloading points.
No limits were placed on the maximum resistance of the strain-hardening
systems. Therefore, unrealistic responses are likely for cases where large
ductilities and resistances several times the yield resistance are computed.
* The records used for response spectra calculations were corrected at the Universidad Catolica de Chile using the segmental baseline adjustment procedure described in Reference 43.

36
5.3.1 Elastic Response Spectra
Absolute acceleration and relative displacement spectra for the
horizontal components of the five records are shown in Fig. 5.2. For
comparison, response spectra for E1 Centro NS 1940 with a damping factor
of 0.02 are plotted with the Vina del Mar spectra in Fig. 5.3.
The shapes of the elastic spectra for the Vina del Mar and E1 Almendral
records are notably similar, and reveal a characteristic ground period of
approximately 0.7 sec (Fig. 5.2). Spectra for the two locations resemble the
spectra calculated for the EI Centro NS 1940 record for periods less than 1.5
sec (Fig. 5.3). Both displacement and acceleration ordinates of the Chilean
records exceed those for the E1 Centro record for that period range.
Acceleration response spectra for the N10E Llolleo record reveal
ordinates significantly higher than the other records in the period range less
than 0.5 sec. In the period range above 0.6 sec, spectral accelerations for
the N10E Llo1leo record are only moderately higher than those for the S20W
Vina del Mar and transverse Melipilla records. Spectral accelerations for the
EI A1mendra1 and Valparaiso records are lower still, with the Valparaiso
record being the lowest of the records considered.
5.3.2 Inelastic Response Spectra
Elasto-perfectly plastic response spectra for the Vina del Mar and EI
Almendral records are plotted in Fig. 5.4. Spectra for the strain-hardening
response functions are shown in Fig. 5.5 for the same records. Figure 5.6
contains the inelastic response spectra for the EI Centro NS 1940 record.
The elasto-perfectly plastic response spectra (Fig. 5.4) suggest that
significant inelastic responses should be generated by the records for periods

37
less than 1 sec. In some period ranges, large ductility demands are indicated
even for systems having yield strengths equal to half the weight of the
oscillator. However, as is generally accepted, spurious ductility demands
often result for perfectly plastic, yielding systems.
Computed spectra for the bilinear strain-hardening systems (Fig. 5.5)
indicate ductility demands markedly lower than those for the elasto-plastic
response functions. However, required ductilities are substantial over a
broad range of periods and strength levels.
Comparison between inelastic spectra for the Chilean records (Fig. 5.4
and 5.5) and the 1940 NS El Centro record (Fig. 5.6) suggests that ductility
demands were comparable for the Vifia del Mar, El Almendral, and El Centro
records.
5.4 Intensity Measures
As described in Chapter 1, Modified Mercalli intensities of VII and VIII
have been assigned to the Vina del Mar and Valparaiso region. Less subjective
measures, based on mathematical manipulations of the measured ground motions,
were computed for the present study and are listed in Table 5.3.
Housner Spectrum Intensities were computed as the area under the 5%
damped response spectra between periods of 0.1 and 2.5 sec [35]. The
intensities for the S20E Vina del Mar and N50E El Almendral records are
similar, and compare closely with that obtained for the 1940 NS El Centro
record. The intensity for the N10E Llolleo record is approximately 40 percent
higher. It is noted that this intensity measure does not explicitly account
for differences in duration of strong shaking.
The Arias Intensity [4] attempts to incorporate the effects of duration
of strong motion into the intensity measure. The intensity is computed
38
effectively as a constant times the integral over the duration of the
earthquake of the ground accelerations squared. A trapezoidal rule was used
to integrate the accelerations. As is apparent from the values in Table 5.3,
this intensity measure suggests that many of the Chilean records were
significantly more intense than the 1940 NS El Centro record. Figure 5.7
plots the Arias intensity versus time for the Vifia del Mar and El Centro
records. Similarity in slope for the plots suggests that intensities were
comparable for any given length of time, but that intense ground motion lasted
for a much longer period of time in the Chilean earthquake than in the 1940
Imperial Valley earthquake.
5.5 Summary
The preceding analysis suggests that, from a structural engineering point
of view, the ground motions measured during the 3 March 1985 Chilean
earthquake are similar to those measured during previous strong earthquakes on
the west coast of the United states. Frequency content varied from station to
station, but at the Vifia del Mar and El Almendral stations, frequency content
was observed to be similar to that observed in El Centro during the 1940
Imperial Valley earthquake. Spectral ordinates are comparable for these two
Chilean records and the El Centro record. Intensities for given durations of
shaking were similar for the Vifia del Mar, El Almendral, and El Centro
records, but duration of strong shaking was significantly longer for the
Chilean records.

39
CHAPTER 6 AVAILABLE INFORMATION ON BUILDINGS WITH STRUCTURAL DAMAGE
Early newspaper reports identified seven seriously damaged buildings in
Vina del Mar after the March 1985 earthquake. El Faro, an eight-story
apartment building in Renaca, and Barrios, a four-story building one block
north of the Marga-Marga River in downtown Vina del Mar, were immediately
identified for demolition. The damage in Acapulco, Hanga-Roa, Festival,
Tahiti, and Coral was significant, and the buildings were considered to be
uninhabitable [49]. Later investigations indicated that the damage in
Festival, Tahiti, and Coral was not as heavy as first diagnosed.
Six of the buildings with structural damage have been selected for
further study. Five buildings, Acapulco, Hanga-Roa, Coral, Tahiti, and
Festival, are located near the beach in Vina del Mar (Fig. 6.1). The sixth
structure, El Faro, was located atop a hill in Renaca overlooking the Pacific
Ocean (Fig. 6.2).
A brief description of each building is provided in this chapter.
Information was obtained from the structural and architectural drawings,
discussions with some of the engineers, and data on file at the
Municipality*. Numerical information is summarized in Tables 6.1 and 6.2.
6.1 Acapulco
Acapulco was constructed in 1962 and was the first high-rise building in
Vina del Mar (Fig. 6.3). The fifteen-story structure is located on the beach
along Avenida San Martin.
* In 1984, the basement of the Vina del Mar municipal building was flooded. A great deal of the local construction information was damaged or destroyed by the water.

40
A typical floor plan is shown in Fig. 6.4. The building is almost
symmetrical about the longitudinal axis, Y. In the transverse direction,
shear walls are oriented at 60 0 with respect to the central walls and
corridor, forming a herringbone pattern. This arrangement of walls provided
an unobstructed view of the ocean from each balcony. Most of the transverse
walls are coupled to the central walls with lintel beams. However, the.
transverse and longitudinal walls meet to form the elevator core. The
typical wall thickness is 20 to 25 cm in the first two stories and is reduced
to 20 cm above level 2. The slab thickness is 12 cm, and the typical story
height is 2.75 m (Fig. 6.5). The structure is supported by a 1.O-m thick mat
foundation which extends to a depth of 4 m. A two-story water tank was
located on the roof of the structure.
Damage was observed in the building after the 1965 and 1971 earthquakes
in the region [37,45,50,62]; however, cracks in the walls were considered to
be nonstructural damage. Lightweight particle-board was mounted on the walls
to cover the diagonal cracks [13,68]. No structural repairs were made.
Major damage during the 1985 earthquake occurred at the northeast end of
the building, in the wall along axis M' (Fig. 6.6). Large shear cracks,
buckling of the boundary reinforcement, and crushing of the concrete were
observed in this region in the fourth story. Wide longitudinal cracks
developed in the slabs around the elevator core (between axes E and F), where
both the longitudinal and transverse walls were discontinuous and the slab
was the only coupling element. Significant shear cracking was also observed
in the lintel beams and diagonal cracks were common in the walls. The roof
slab suffered serious damage around the water tank.
Both plain and twisted bars were used throughout the building. The
twisted bars were typically used at the boundary of the wall elements and the
41
plain bars were used inside the wall. Diagonal reinforcement, in addition to
vertical and horizontal bars, was used in the shear walls (Fig. 6.6).
The total repair cost of 180,000,000 pesos was estimated to be one-third
the commercial value of the building.
6.2 Hanga-Roa
Hanga-Roa is located immediately north of Acapulco along Avenida San
Martin (Fig. 6.7). Construction of the building began in January 1969 and
the building was officially accepted by the Municipality in June 1971, two
weeks before the July 1971 earthquake.
The building is characterized by its unusual plan of two curved walls
forming a 'Y' (Fig. 6.8). The open end of the 'Y' faces the street.
Balconies running along the other sides of the building provide views of the
ocean from all locations. The central corridor is bounded by the two main
longitudinal walls, C and I, and transverse walls run radially. The
elevators and stairs are located at the intersection of the two legs with the
stem of the 'Y'.
Continuous footings support the structure at a depth of 4.15 m. The
wall thicknesses are 30 cm in the first two stories, 25 cm in stories three
and four, and 20 cm in the upper stories. Typical slab thicknesses are 20 cm
in the corridors and 12 cm in the apartments. All stories have a height of
2.75 m. The locations of some doors are staggered in adjacent stories
(Fig. 6.9).
After the 1971 earthquake, damage was concentrated near the intersection
of longitudinal walls C and I with radial walls 4 and 18. Lintel beams were
severely damaged and cracks were observed in the longitudinal walls
[37,50,62]. The damage was concealed, but not repaired.

42
In 1985, the major damage occurred near the intersection of walls I and
10 [6]. Apartment doors were staggered in this area, and wide vertical
cracks connected the doors on alternate floors (Fig. 6.10). Damage was also
heavy at the intersection of walls C, I, 4, and 18.
Cracks were identified and measured during an inspection of the building
shortly after the earthquake [6]. Approximate lengths are listed below.:
Structural Elements: Horizontal and inclined cracks in RIC walls Vertical cracks in RIC walls Cracks in the slabs Vertical or inclined cracks in lintel beams Multiple inclined cracks in the lintel beams Vertical or inclined cracks in beams
Nonstructura1 Elements: Horizontal and inclined cracks in masonry partitions Horizontal cracks through masonry partitions
and RIC beams or slabs Vertical cracks through masonry partitions
and RIC columns or walls
1500 50
400 70
100 70
1200 300
200
m m m m m m
m m
m
Although the building is nearly symmetric about axis F, damage was noticeably
more severe in wall I than in wall C. The total cost of repair was
225,000,000 pesos.
6.3 Coral
Coral (Fig. 6.11) is a twelve-story apartment building located across
the street from Hanga-Roa. The building was constructed in 1968.
A typical floor plan is shown in Fig. 6.12. The building is nearly
rectangular with two small wings extending to the east. The typical story
height is 2.8 m and floor slabs are 16-cm thick. Structural walls are 20-cm
thick throughout the building.
Coral suffered moderate to heavy structural damage. Cracks were
observed throughout the walls and floor slabs. A column was severely damaged
43
in the first story, and lintel beams were cracked at all levels. The damage
in one lintel beam in the northeast corner of the building sustained such
large deformations that the location of the door was changed in stories 1
through 11. The damaged beams and doorways were incorporated into the
adjoining walls.
Masonry partition walls also collapsed during the earthquake. The
engineer recommended replacing the masonry partitions with lightweight
materials, such as volcanita. The cost to repair the structural elements and
replace the nonstructural partitions was less than 16,000,000 pesos.
6.4 Tahiti
Tahiti (Fig. 6.13) is a fifteen-story building and was constructed in
1970. The building is located immediately north of Coral. Drawings were not
available for the structure.
The damage caused by the 1985 earthquake was described in three main
categories: cracking of the central north-south wall in the first story,
lintel beams were severely cracked throughout the building, and masonry
partitions collapsed in the upper stories. The repairs to the building
included grouting the cracks in the structural walls, restoring the lintel
beams to their original size, and replacing the damaged masonry partitions in
the common areas. The cost associated with these repairs was less than
3,000,000 pesos. Nonstructural damage in the individual apartments was
repaired by the owner.

44
6.5 Festival
Festival is a l4-story apartment building located at Calle 9 Norte
No. 450 (Fig. 6.14-6.16). The building was designed in 1978. The building
plan has what may be described loosely as an "H" shape (Fig. 6.15). The
structural walls are arranged almost symmetrically in plan, and, with the
exception of some wall openings that are staggered from floor to floor, the
walls are effectively continuous over height.
The foundation is a mat founded 7 m below grade. The typical story
height is 2.65 m (Fig. 6.16). Slabs are typically l3-cm thick. Structural
walls are coupled by relatively deep beams at several locations. Wall
thicknesses are 30 cm for stories 1-4, 25 cm for stories 5-9, and 20 cm above
the ninth story.
Structural damage consisted of cracking in lintels along the major
longitudinal axes of the building, diagonal cracks in several shear walls
aligned parallel to the transverse direction, and crushing of a wall boundary
(axis I in Fig. 6.15) where it intersected a perimeter reinforced concrete
retaining wall. Masonry walls in bathrooms along the north side of the
building collapsed during the earthquake.
Crack lengths were measured to be:
Structural Elements: Walls 1920 m Beams 330 m Slabs 110 m
Nonstructural Elements: Partition walls 900 m Masonry walls 560 m
The cost of the structural repairs was approximately 41,000,000 pesos.

45
6.6 El Faro
El Faro was an eight-story apartment building located in Renaca
(Fig. 6.17). The building was designed in 1979 and constructed in 1980. The
structure was severely damaged during the 1985 earthquake and was demolished
on 8 March 1985.
Structural plans for the foundation and a typical story are shown in
Fig. 6.18. All levels were nearly square in plan; however, the basement and
upper stories were not aligned vertically. The typical story height was
2.63 m (Fig. 6.19) and the slab thickness was 14 cm. Structural walls in the
upper stories were 20-cm thick and 30-cm thick in the basement.
The architectural plans (Fig. 6.20) identify three bay windows at each
story level that are not shown on the structural drawings. Minor changes in
the locations of some interior walls are also found on the architectural
drawings. The as-built configuration of El Faro more closely resembled the
architectural drawings than the structural drawings. The roof of El Faro was
constructed of wood and formed a one-story penthouse. Details for the
penthouse were not shown on either the architectural or structural drawings,
and therefore, the total height of the building is not known.
The structure was supported by a continuous footing foundation. Because
the building was located on the top of a steep hill, the base of the
foundation was 3 m below grade on the southeast side and 2 m below grade on
the northwest side which overlooked the ocean.
During the earthquake, the building leaned approximately 15° to the
northwest, crushing walls A, K, and M below the first-floor slab (Fig. 6.21).
The building was demolished before an extensive investigation could be
conducted [20]. Honeycombed concrete and poorly executed construction joints

46
were observed in the foundation of the structure which remains at the site
(Fig. 6.22).
Concrete and steel samples were removed from the building after the
collapse. Test indicated that material strengths were above those specified
on the structural drawings.
6.7 Summary
Extensive damage was observed in Acapulco, Hanga-Roa, and El Faro after
the 3 March 1985 earthquake. The repair of Acapulco and Hanga-Roa was in
progress in July 1986 and focused on making the buildings stiffer and
stronger. The thicknesses of damaged walls was increased in both buildings
and lintel beams were removed, presumably to avoid coupling problems.
Pressurized grout was used to fill cracks in areas with less extensive
damage. An effort was made to reduce the weight of Acapulco by replacing all
the masonry partition walls with volcanita. The water tanks were also
relocated from the roof to the basement of Acapulco.
The repair of Coral, Tahiti, and Festival had been completed by the
summer of 1986. The repair projects in these buildings focused on returning
each building to its condition before the earthquake.

47
CHAPTER 7 AVAILABLE INFORMATION ON UNDAMAGED OR LIGHTLY DAMAGED BUILDINGS
Seven buildings that were undamaged or lightly dalnaged were selected for
study in this report. Six structures are located in the downtown area of
Vina del Mar within 1.5 km of the strong-motion instrument that was located
in the city (Fig. 6.1 and 7.1). The other building is located in Valparaiso,
approximately 300 m from the site of the El Almendral record. All of the
buildings were less than 15 years old and the 1985 earthquake represented the
first significant ground motion.
The structural framing system, observed damage, and history of each
building is described briefly in this chapter. Numerical information is
summarized in Tables 7.1 and 7.2.
7.1 Plaza del Mar
Plaza del Mar is a 23-story building located approximately 100 m south
of Acapulco on Avenida San Martin (Fig. 7.2- 7.4). The building design was
completed during 1980-81. Construction was completed in 1983 and the
building in service at the time of the 1985 earthquake. The building plan
(Fig. 7.3) comprises two similar portions connected by a relatively narrow
slab. Structural walls are aligned in pairs to form a central corridor
parallel to the longitudinal axis of the building. The majority of the
remaining walls are "L" shaped, and frame into the central corridor
(Fig. 7.3). The plan of the building is effectively unchanged over the
building height.
A 1.5-m thick cellular mat foundation is founded at 7 m below grade.
The typical story height is 2.68 m, with first story height of 4.69 m
(Fig. 7.4). The floor system comprises beams framing between columns and

48
walls, with a floor slab having typical thickness of 14 cm. Wall thicknesses
vary, but are typically 30 cm in the lower 12 stories, and 25 cm above the
twelfth floor.
Damage was reported by the structural engineer to be light. Typical
damage comprised horizontal hairline cracks in the floor slab located at the
middle of the building plan, apparently occurring as a consequence of slab
coupling of the two "halves" of the building. Cracks were also observed at
stair landings, in the nonstructural lintel beams, and in some walls. A
water tank located on the roof straddling the c~ntral corridor walls
sustained minor damage, apparently due to coupling of the walls not
anticipated during design. Damage was sufficiently light that the tank was
holding water following the earthquake.
7.2 Marina Real
Marina Real is a 20-story building located at Avenida San Martin 890
(Fig. 7.5-7.7). According to dates on the structural drawings, design was
underway in 1980. The building was constructed during 1983. The building
plan is approximately rectangular (Fig. 7.6). Lateral load resistance is
apparently provided primarily by structural walls. The plan changes between
the first and fourth stories, primarily due to a gradual reduction in plan of
some of the walls at the perimeter of the building. Above the fourth floor,
changes in plan are minor.
The foundation is a cellular mat having thickness of 200 cm at a depth
of approximately 740 cm. The typical story height is 2.7 m, with a first
story height of 3 m (Fig. 7.7). Floor framing comprises beams and slabs.
Wall thicknesses are typically 50 cm for the basement through third story,

49
40 cm through the eighth story, 30 cm through the 13th story, 25 cm through
the 17th story, and 20 cm through the 20th story.
According to the structural engineer, the only major damage occurred in
the curved portion of the perimeter walls. Examination of the damage and of
the reinforcement details suggests that this damage was initiated by
straightening, under tension, of the wall boundary reinforcement that had
been placed to follow the curve of the wall. In addition, minor damage was
observed in some of the lintels. The total cost of repairs was estimated by
the Municipality to be 5,000,000 pesos.
7.3 Torres de Miramar
The two triangular structures composing the condominium complex Torres
de Miramar are located at Avenida San Martin 1020 and 10SO (Fig. 7.S). The
buildings are one block north of Hanga-Roa on the east side of the street.
Design of the structures was completed in 1973 and the buildings were
constructed in 1975 and 1976. Each building is 21 stories in height
(Fig. 7.10). The plan is in the shape of an equilateral triangle with sides
of 34.9 m (Fig. 7.9). Four exterior columns are located along each edge and
the corners cantilever approximately 4.5 m beyond the columns. The typical
story height is 2.55 m, the first and second stories are slightly taller.
A continuous footing foundation supports the structure with the base of
the foundation located 6 m below grade. The first and second stories are
enclosed only in the core area, forming a small pedestal at the base of the
structures (Fig. 7.9). Above the second level, the floor slabs span from the
core region to the external columns and the shape of the core is changed so
that the radial walls extend to the exterior columns (Fig. 7.9). The shape
of the columns changes above the second level from a rhomboid to an
50
equilateral triangle. The locations of apartment doors leading into the
central core area are staggered at every level (Fig. 7.10). The thickness of
the central core walls varies from 40 cm at the base to 20 cm above the 15th
floor. The typical slab thickness is 20 cm.
No structural damage was reported in these buildings. The nonstructural
damage was limited to partition walls which separated from the structure in
the cantilevered corners of the plan. The soil around the perimeter of both
structures was observed to have settled as much as 30 cm following the
earthquake [68], and was attributed to settlement of the backfilled material.
7.4 Torres del Pacifico
The three identical l7-story buildings that compose Torres del Pacifico
are located one block north of Torres de Miramar and two blocks from Hanga
Roa. Construction of the buildings began in 1979 and extended through 1981.
Two of the towers, located at San Martin Avenida 1130 and 1206, were
completed at the time of the earthquake. However, economic conditions forced
the construction of the third building to be halted before any nonstructural
elements were added (Fig. 7.11). The plan of each building is a modified
equilateral triangle (Fig. 7.12). One corner of the plan is truncated to
form a 5-m edge that faces the ocean. The rear of each building cuts back
into the main portion forming a 'V' shape. A two-story entrance foyer
projects from the top of the 'V' (Fig. 7.11 and 7.12).
Continuous footings at a depth of 6 m support the structures. Four
trapezoidal columns are located along the edges which point toward the ocean
and are connected by beams. Walls run perpendicular to the exterior edges
toward a central wall which bisects the angle between the two column lines.
The typical slab thickness is 16 cm. Additional reinforcement was placed in

51
the slab to form lintel beams to couple the walls over most of door openings.
The exterior columns remain the same size over the entire height (Fig. 7.13),
and the thicknesses of the main walls vary from 30 to 20 cm. The locations
of the apartment doors are not staggered (Fig. 7.13).
Small cracks were observed in the masonry walls of the upper stories and
small diagonal cracks were observed in the edge beams. Cracks were observed
in the lintel beams and in the slabs at all levels. Compaction of the fill
material surrounding the foundation was also observed.
7.5 Villa Real
The Villa Real complex consists of a ten-story residential building, a
subterranean parking structure that surrounds the building on three sides,
and a small commercial center adjacent to the fourth side of the building.
Villa Real (Fig. 7.14) is located at 5 Norte/4 Poniente close to the downtown
area of Vina del Mar. The building design was finished in 1981 and
construction was completed in 1983.
The main structure is a slab-girder-shear wall system, the shear walls
being irregularly spaced and varying dramatically in plan from the first to
second story (Fig. 7.15). Stories two through eight are similar in plan,
while stories nine and ten again differ. Shear wall thicknesses range from
20 to 30 cm at the base of the structure. The majority of the walls in the
upper stories are 20-cm thick. Floor slabs are 12 and l6-cm thick. Typical
slab-girder-column framing systems are used for both the parking structure
and the commercial center.
The total building complex plan area is approximately 800 square meters
at the foundation level. The main building, the parking structure, and the
commercial center are connected at the foundation level by a network of

52
foundation beams. Continuous wall footings on a 70-cm mat-type foundation
support the main building, while the parking structure rests on a continuous
wall footing along its outer edges and on spread column footings within its
perimeter. The commercial center rests on square footings located at varying
depths. At the ground level, the parking structure girders are supported by
corbels extending out from the main building in order to provide expansion
relief.
Damage was concentrated near the base of the structure. Diagonal cracks
were observed in the structural walls in the first, second, and third
stories. Most cracks were less than O.2-mm wide. The concrete cover spalled
from the lintel beams along axes D and E.
7.6 Torres del Sol
Torres del Sol (Fig. 7.17) is a 22-story building located three blocks
south of Hanga-Roa at 8 Norte/4 Poniente. Construction was completed in
1982. The plan of the building is a 24.3 m square above the first level
(Fig. 7.18). At the first level, the four exterior columns are connected to
the central core and to each other by beams of varying depths. Above the
first level, the core walls are extended and incorporate the exterior columns
in the transverse direction. This change in wall location creates a
significant discontinuity in the main transverse shear walls in the first
story. The second-story walls act as a transfer girder to carry the lateral
load from the upper stories to the first-story walls.
The foundation is a 2-m thick cellular mat located 4.85 m below grade.
The typical story height is 2.65 m with the first and second stories 5.30 and
2.99 m respectively. Balconies cantilever 1.8 m past the exterior columns in
the direction of column lines A and D (Fig. 7.19). The typical slab

53
thickness is 16 cm. The thickness of the core walls varies from 50 cm at the
second level to 20 cm above level 18. The locations of apartment doors
leading into the central core at each level are staggered in walls Band C,
and remain at the same locations in walls F and G (Fig. 7.19).
Damage in the structure was concentrated in the second floor. Diagonal
cracks were observed in the walls and lintel beams. Cracks in the floor
slabs were also observed. Cracks were observed in the lintel beams at other
levels and there were some failures at the connection between the stairs and
the slab. The estimated cost of repair to the structure was 1,000,000 pesos.
7.7 Torre del Almendral
The 23-story Torre del Almendral rises to a height of 60.2 m above
ground (Fig. 7.20). Almendral is the only structure considered which is
located in Valparaiso. The date of construction was not determined.
However, the structural drawings are dated January 1972. The building's plan
is almost square (Fig. 7.21) and is made up of nine panels. The structural
system is composed of two back-to-back, channel-shaped shear walls that are
coupled with two three-bay frames through girders and the floor slabs. The
channel-shaped walls extend from the foundation level to the 21st story (Fig.
7.22). The web portions of the walls continue to the 23rd floor, where they
are joined together forming a sloping roof above the 23rd floor (Fig. 7.22).
The web portion varies in thickness from 45 cm at the first story to 30 cm
above the seventh and has staggered door openings along its elevation.
The building rests on a l-m thick mat foundation with its base located
6.18 m below grade. The typical story height is 2.55 m with the first story
being 3.87 m. The plan view of the floors above the third level is fairly
typical, although openings in the central panel of the l8-cm thick slab are

54
staggered. Column cross-sections remain rectangular and uniform along the
height.
No information was available about damage sustained during the
earthquake.
7.8 Summary
Investigation of the seven buildings described in this chapter and the
six buildings in Chapter 5 indicates that structural walls are common in
Chilean buildings and are the primary lateral-load resisting system in the
buildings. As a result, Chilean buildings are much stiffer than buildings of
the same height located in seismic regions of the U.S. The fundamental
natural periods for ten of the buildings described in this report were
determined from forced vibration tests of the buildings [15] and from
measured response during aftershocks. These data are plotted in Fig. 7.23 as
a function of the number of stories. The measured periods during low
amplitude excitation after the 1985 earthquake may be approximated as N/20,
where N is the number of stories.

55
CHAPTER 8 SUMMARY
The western coast of Chile lies along the boundary between the Nazca and
South American Plates. As a result, Chile is located in one of the most
active seismic regions of the world. The seismicity of the region has been
studied since the mid-1500's and more than twenty significant earthquakes,
M ~ 8, have been documented [40].
In the central region, the return period for an earthquake of magnitude
7.5 or greater is approximately 80 years [23]. The earthquake of 3 March
1985 was not unexpected and a network of accelerometers had been located in
the region. Thirty-one strong-motion records (Fig. 1.2) representing many
soil conditions were obtained during the earthquake [61].
The motion recorded in the coastal city of Vina del Mar was similar in
frequency content to the motion obtained during the 1940 Imperial Valley
earthquake. However, the peak ground acceleration and duration of the Vina
del Mar record exceeded that of the 1940 El Centro motion. The majority of
the reinforced concrete buildings considered in this report were located
within 1.5 km of the site of the strong-motion instrument in Vina del Mar.
The soil in this region comprises consolidated sand and gravel.
Foundation failures were not observed in this material. Damage was high in
the area surrounding the harbor in Valparaiso where artificial fill extended
to a depth of 10 m near the water. Heavy damage was also observed in the
saturated, weathered rock on the slopes around Vina del Mar and Valparaiso.
Of the 415 buildings in Vina del Mar ranging in height from 5 to 23
stories, six may be identified as having suffered substantial structural
damage (excluding Canal Beagle). In the downtown area, the two severely
damaged buildings, Acapulco and Hanga-Roa, were among the oldest buildings
above 12 stories in height and had suffered damage during previous

56
earthquakes. Tests conducted during aftershocks indicated that site
amplification may have been a problem for El Faro [17], which was located on
top of a hill in Renaca, overlooking the ocean. However, controversy
surrounds the design and construction of the building, and the collapsed
structure was destroyed a few days after the earthquake before any
investigations of the as-built conditions could be conducted. Although
structural damage did occur in Coral, Tahiti, and Festival, the damage was
concentrated in specific areas of the buildings.
In addition to the six buildings mentioned above, this report documents
conditions of six other buildings located near the strong-motion instrument
in Vina del Mar and one near the El Almendral instrument in Valparaiso.
These buildings sustained little or no structural damage during the 1985
earthquake.
A common characteristic of buildings in Chile is the relatively high
proportion of structural walls compared with typical u.s. buildings in
seismic regions. This characteristic has evolved as a consequence of good
performance of this structural system during Chile's history of frequent,
strong ground motions. Because of the large number of walls, the buildings
are comparatively stiff and redundant, and apparently develop high lateral
load strengths with relatively low amounts of reinforcement.
Although apparent deficiencies in detailing, construction, and inspection
have been identified, reinforced concrete buildings generally performed well.
An implication is that the Chilean practice in detailing, construction, and
inspection is adequate for the type of structural system prevalent in the
country. Research is continuing to determine the relationships between the
Chilean practice and the observed good performance.

57
TABLES
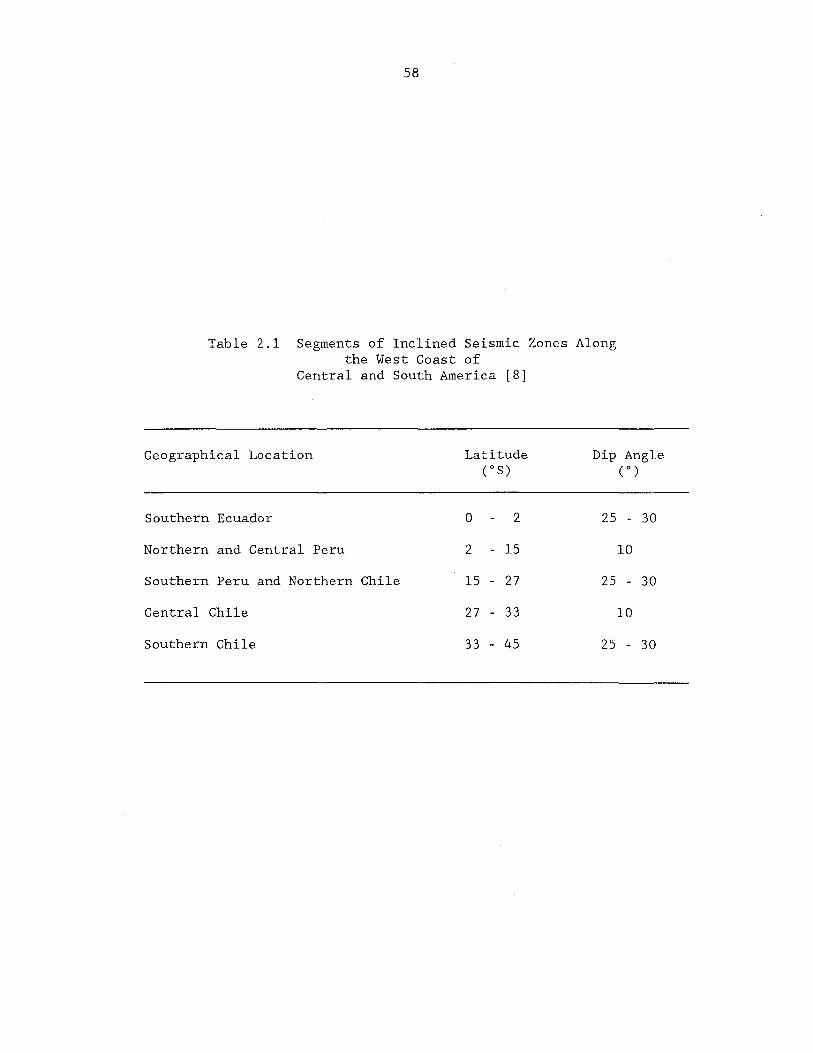
58
Table 2.1 Segments of Inclined Seismic Zones Along the West Coast of
Central and South America [8]
Geographical Location Latitude Dip Angle (0 S) CO)
Southern Ecuador 0 2 25 - 30
Northern and Central Peru 2 - 15 10
Southern Peru and Northern Chile 15 - 27 25 - 30
Central Chile 27 - 33 10
Southern Chile 33 - 45 25 - 30

59
Table 2.2 Summary of Major Earthquakes in Chile [40]
Date Epicentra1 Region Magnitude
1570 February 8 Concepcion 8 - 8l.z 1575 March 17 Santiago 7 - 7'>2 1757 December 16 Valdivia 8l.z 1604 November 24 Arica 8!-. - 8l.z 1615 September 16 Arica 7l.z 1647 May 13 Santiago 8l.z 1657 March 15 Concepci6n 8 1681 March 10 Arica 7 - 7l.z 1687 July 12 San Felipe 7 - 7l.z 1715 August 22 Arica 7l.z 1730 July 8 Valparaiso 83/4 1737 December 24 Valdivia 7'>2 - 8 1751 May 25 Concepcion 8 - 8~
1796 March 30 Copiapo 8'>2 - 8 1819 April 3,4,11 Copiapo 8~ - 8l.z 1822 November 19 Valparaiso 8l.z 1829 September 26 Valparaiso 7 1835 February 20 Concepci6n 8 - 8~
1837 November 7 Valdivia 8+ 1847 October 8 Il1ape1 7 - 7~
1849 November 17 Coquimbo 7'>2 1850 December 6 Valle de Maipo 7 - 7l.z 1851 April 2 Casablanca 7 - 7">2 1859 October 5 Copiap6 7">2 - 73/4 1868 August 13 Arica 8l.z 1869 August 24 Pisagua 7 - 73/4 1871 October 5 Iquique 7 - 7l.z 1877 May 9 Pisagua 8 - 8l.z 1879 February 2 Estrecho de Magallanes 7 - 7l.z 1880 August 15 111ape1 7l.z - 8 1906 August 16 Valparaiso 8.6 1918 December 4 Copiap6 7'>2+ 1922 November 10 Huasco 8.4 1928 December 1 Ta1ca 8.4 1939 January 24 Chillan 8.3 1943 April 6 Il1ape1 8.3 1949 December 17 Punta Arenas 7">2 1950 December 9 Chillan 8.3 1953 May 6 Chi11an 7">2 1960 May 21 Concepcion 7.5 1960 May 22 Valdivia 8.5 1965 March 28 Santiago 7.3 1971 July 8 Valparaiso 7.5 1975 May 10 Lebu 7.8 1985 March 3 San Antonio 7.8

60
Table 2.3 Summary of Earthquakes Along the Chilean Coast from 1965 to 1985 [ 65]
Date Coordinates Magnitude Intensity in oS oW Va1paraiso/Vifia
12 Jun 65 20.3 68.9 6.5 18 Jan 65 37.7 72.9 5.3 23 Feb 65 25.7 70.5 7.25 VII 22 Mar 65 3l. 9 71.5 6.0 28 Mar 65 32.4 71.2 7.0 20 Aug 65 19.0 69.1 6.5
3 Oct 65 42.9 75.4 6.0 28 Nov 65 45.6 72.4 6.0 10 Apr 66 3l. 5 71.2 6.0 12 Apr 66 38.1 83.0 6.0 22 Dec 66 25.5 70.7 7.6 13 Mar 67 40.1 74.5 7.3 11 May 67 20.3 68.5 6.75
4 Ju1 67 38.1 73.4 6.5 26 Sep 67 30.0 7l.5 6.75 15 Nov 67 28.7 71.2 6.2 21 Dec 67 2l. 8 70.0 7.0 25 Dec 67 2l. 5 70.4 6.75
6 Jan 68 27.8 71.1 6.3 26 Apr 69 30.6 71.4 6.0 26 Apr 69 30.6 71.5 6.3 13 Nov 69 27.8 7l. 6 6.0 14 Jun 70 52.0 73.8 6.6 18 Nov 70 20.9 69.8 6.0
4 Dec 70 23.1 70.1 6.7 8 Dec 70 30.7 71.2 6.7 V
17 Jun 71 25.5 69.2 7.0 9 Ju1 71 32.5 71.2 7.5 VIII-IX
11 Ju1 71 32.3 7l. 8 6.3 8 Dec 71 22.9 70.8 5.6 8 Jun 72 30.5 7l. 8 6.6 VI
29 Dec 72 30.6 71.0 6.0 31 Ju1 73 27.1 71.5 6.3
7 Aug 73 26.8 70.9 5.8 7 Aug 73 26.8 70.9 6.2 5 Oct 73 33.0 71.9 6.5 VII 5 Oct 73 32.5 71.5 6.3 VI 2 Jan 74 22.5 68.5 6.8
18 Aug 74 38.5 73.4 7.0 13 Mar 75 29.9 7l. 3 6.9 10 May 75 38.1 73.2 7.8 28 Oct 75 22.9 70.5 6.3 28 Feb 76 40.00 74.73 6.0 30 May 76 41.64 75.41 6.0 20 Aug 76 20.41 69.99 6.0 24 Aug 76 25.33 70.69 5.6

61
Table 2.3 (cont.) Summary of Earthquakes Along the Chilean Coast from 1965 to 1985 [ 65)
Date Coordinates Magnitude Intensity in oS oW Va1paraiso/Vifia
29 May 78 44.85 79.41 6.0 3 Aug 78 26.51 70.54 7.0
14 May 79 22.81 69.12 6.5 26 May 80 19.36 69.20 6.1 23 Mar 81 33.66 71.80 6.2 VI 16 Oct 81 33.l3 73.07 7.2 VI
7 Nov 81 32.20 71. 37 6.8 VII 4 Oct 83 26.54 70.56 7.4 9 Oct 83 26.14 70.52 6.2
11 Jun 84 30.71 71.18 6.3 18 Jan 85 29.37 70.79 6.0
3 Mar 85 33.14 71. 87 7.8 VIII 3 Mar 85 32.74 71. 22 7.0 4 Mar 85 33.21 71. 66 6.7 4 Mar 85 34.12 71.9l 6.2 4 Mar 85 32.93 71.79 6.6 4 Mar 85 33.83 71.93 6.0 4 Mar 85 33.14 72.00 6.3 4 Mar 85 33.84 71.25 6.0 4 Mar 85 32.88 71. 82 6.0
17 Mar 85 32.63 71. 55 6.6 VII 19 Mar 85 33.20 71. 65 6.6 VI 25 Mar 85 34.25 72 .19 6.4
3 Apr 85 32.58 71.66 6.3 9 Apr 85 34.l3 71.62 7.5 VI
28 Apr 85 39.73 75.66 6.1 V 12 Aug 85 38.38 73.5 6.0 III

62
Table 2.4 Typical Engineering Properties of Foundation Materials in the
Vina del Mar Region [3]
Maicillos: Classification Liquid Limit Plastic Limit Natural moisture content % fines passing a #200 sieve Internal angle of friction Effective cohesion
Uncemented Sands: Classification % fines passing a #200 sieve Relative density Internal angle of friction Effective cohesion
Cemented Sands: Classification % fines passing a #200 sieve Natural moisture content Internal angle of friction Effective cohesion
SM with some SC 20%
7% 7%
12% 33 0
- 54 0
0.07 - 0.35 kg/cm2
SP 1%
70% 38 0
_ 41 0
o
SP 2% 7%
39 0 - 43 0
0.04 - 0.57 kg/cm2

63
Table 5.1 Peak Accelerations Measured during the 1985 Earthquake [61)
Station Coordinates Component Maximum S W Acceleration (g)
Illapel 31°38' 71°10' N20W 0.12 S70W 0.10
Los Vilos 31°55' 71° 30' NS 0.25 EW 0.04
La Ligua 32°30' 71°06' N70W 0.19 S20W 0.13
Papudo 32°31' 71°27' N50E 0.13 S40E 0.47
Zapallar 32°34' 71°28' NS 0.32 EW 0.33
San Pedro 32°36' 71°00' NS 0.60 EW 0.57
Ventanas 32°40' 71°37' NS 0.18 EW 0.18
San Felipe 32°45' 70°44' SlOE 0.35 N80E 0.43
Llay-Llay 32°50' 70°58' N80W 0.36 SlOW 0.49
Saladillo 32°55' 70° 28' NS 0.11 EW 0.09
Valparaiso 33°01' 71° 38' NSOE 0.29 (El Almendral) S40E 0.16
Valparaiso 33°01' 71°38' S20E 0.16 N70E 0.18
Vifla del Mar 33°02' 71°35' N70W 0.23 S20W 0.36
Peldehue 33°08' 70°41' EW 0.64 NS
Quintay 33°16' 71°19' NS 0.20 EW 0.18
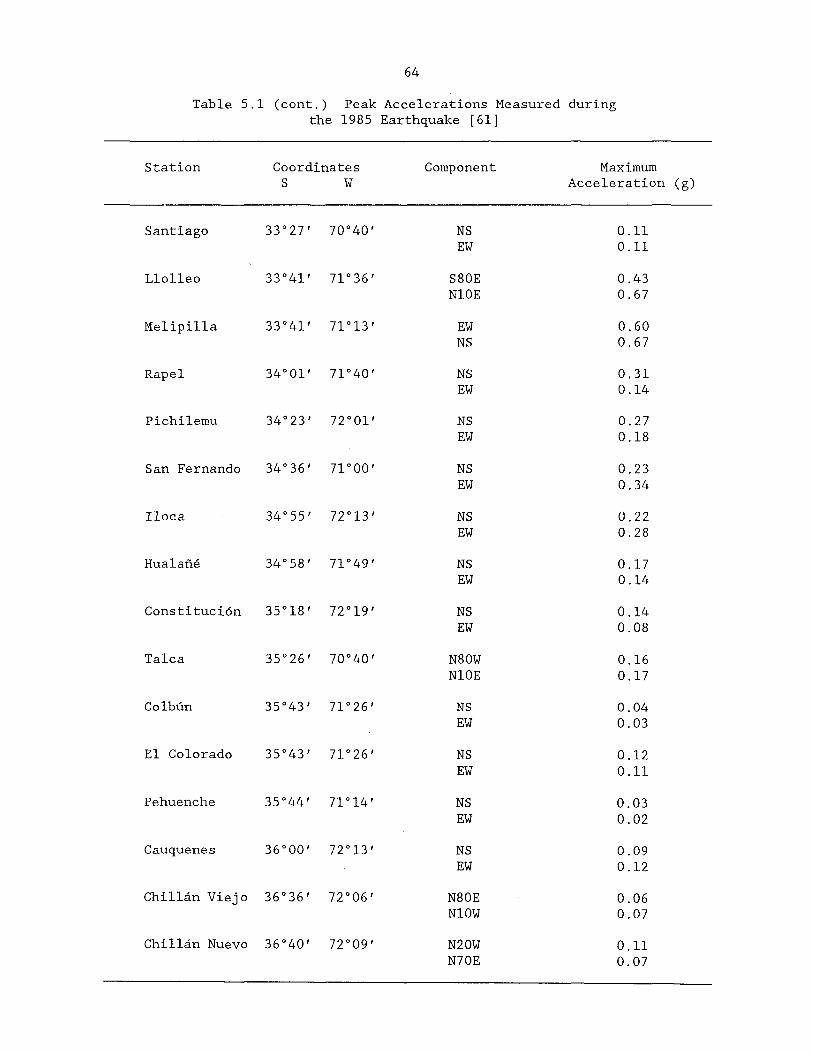
64
Table 5.1 (cont.) Peak Accelerations Measured during the 1985 Earthquake [61]
Station Coordinates Component Maximum S W Acceleration (g)
Santiago 33°27' 70°40' NS 0.11 EW 0.11
L1011eo 33°41' 71°36' S80E 0.43 N10E 0.67
Melipi11a 33°41' 71°13' EW 0.60 NS 0.67
Rape1 34°01' 71°40' NS 0.31 EW 0.14
Pichilemu 34°23' 72 ° 01' NS 0.27 EW 0.18
San Fernando 34°36' 71°00' NS 0.23 EW 0.34
Iloca 34°55' 72°13' NS 0.22 EW 0.28
Hua1afie 34°58' 71°49' NS 0.17 EW 0.14
Constituci6n 35°18' 72°19' NS 0.14 EW 0.08
Ta1ca 35°26' 70°40' N80W 0.16 NIOE 0.17
Colblin 35°43' 71°26' NS 0.04 EW 0.03
E1 Colorado 35°43' 71°26' NS 0.12 EW 0.11
Pehuenche 35°44' 71°14' NS 0.03 EW 0.02
Cauquenes 36°00' 72°13' NS 0.09 EW 0.12
Chi11an Viejo 36°36' 72 ° 06' N80E 0.06 N10W 0.07
Chi11an Nuevo 36°40' 72°09' N20W 0.11 N70E 0.07

Tab
le
5.2
S
tro
ng
-Mo
tio
n In
stru
men
t D
ata
[6
1,6
8]
Pea
k
Gro
un
d
Co
ord
inate
0
Accele
rati
on
(g
) S
ite
Inst
rum
en
t ln
0 tr
um
ent
Sta
tio
n
S W
L
T
V
G
eolo
gy
S
tru
ct
ure
L
ocati
on
M
odel
Vin
a d
el
Mar
3
3°0
2'
71
°35
' 0
.36
0
.22
0
.19
S
and
1
0-s
tory
b
uil
din
g
Bas
emen
t SM
A-1
Val
para
iso
33
°01
' 71
° 3
8'
0.1
7
0.1
9
0.1
2
Roc
k 1
-sto
ry b
uil
din
g
Gro
un
d le
vel
SMA
-1
El
Alm
end
ral
33°0
1 '
71
°38
' 0
.29
0
.16
0
\ A
rtif
icia
l F
ill
Ch
urc
h
SMA
-1
\..rt
Llo
lleo
33
°41
' 71
° 3
6'
0.6
7
0.4
3
0.8
6
San
d
1-s
tory
b
uil
din
g
Bas
emen
t SM
A-1
Mel
i p
illa
33
°41
' 71
°1
3'
0.6
7
0.6
0
0.5
9
Roc
k 1
-sto
ry
bu
ild
ing
G
rou
nd
le
vel
SMA
-1
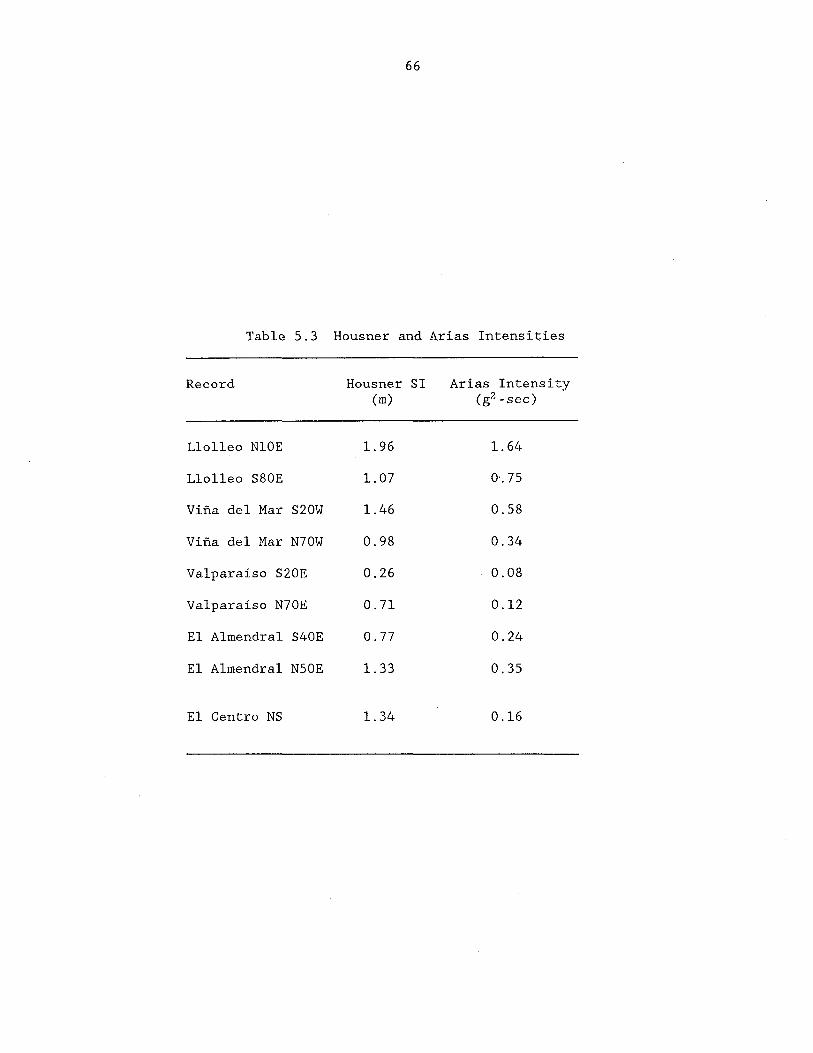
66
Table 5.3 Housner and Arias Intensities
Record Housner SI Arias Intensity (m) (g2-sec)
Llolleo N10E 1. 96 1. 64
Llolleo S80E 1. 07 0'.75
Villa del Mar S20W 1.46 0.58
Villa del Mar N70W 0.98 0.34
Valparaiso S20E 0.26 0.08
Valparaiso N70E 0.71 0.12
El Almendral S40E 0.77 0.24
El Almendral N50E 1. 33 0.35
El Centro NS 1. 34 0.16

Tab
le 6
.1
Ph
ysi
cal
Ch
ara
cte
rist
ics
of
Bu
ild
ing
s w
ith
Str
uctu
ral
Dam
age
Num
ber
Ty
pic
al
Bu
ild
ing
A
dd
ress
Y
ear
Yea
r o
f S
tory
T
ota
l W
all
Are
a *
Sla
b
Des
ign
ed
Co
nst
ructe
d
Sto
ries
Heig
ht
Hei
gh
t F
loo
r A
rea
Th
ick
ness
Aca
pu
lco
S
an
Mart
in
821
1961
19
64
15
2.7
5
m
41
.25
m
6.
8%
(1)
12
em
(9 '-0
")
(13
5.4
' )
5.8%
(2
)
Han
ga-
Ro
a S
an
Mart
in
92
5
1968
19
70
15
2.7
5
m
46
.75
m
9.
6%
(1)
12&
20
em
+2
mee
h (9
'-0
")
(15
3.4
' )
6.3%
(2
)
0-
Co
ral
San
M
art
in
92
8
1969
12
2
.80
m
3
4.8
0
m
5.2%
(1
1)
16
em
'-l
(9'-
2" )
(11
4.2
' )
Tah
i ti
San
M
art
in
97
2
1969
15
Fest
ival
9 N
ort
e
450
1978
19
79
14
2.6
5
m
37
.25
m
5.
2%
(1)
13
-14
em
(B
'-B
")
(12
2.2
' )
4.6%
(5
)
EI
Far
o
(Ren
aea)
19
79
19BO
B
2
.63
m
6.
B%
(1
) 14
em
+
p
en
t (B
'-7
" )
* T
he
flo
or
lev
el
is g
iven
w
ith
in p
are
nth
ese
s.

Tab
le 6
.2
Mat
eria
l P
rop
ert
ies
and
Des
crip
tio
n o
f F
ou
nd
atio
ns
of
Bu
ild
ing
s w
ith
Str
uctu
ral
Dam
age
Co
ncr
ete*
S
teel
**
T
ype
of
Dep
th o
f B
uil
din
g
Str
eng
th
Sp
ecif
icati
on
F
ou
nd
atio
n
Fo
un
dat
ion
(k
g/cm
2)
(m)
Aca
pulc
o 22
5 (f
y
4200
kg
/cm
2)
Cell
ula
r M
at
6.4
5
twis
ted
Han
ga-R
oa
300
A63
-42H
C
on
tin
uo
us
Fo
oti
ng
4
.15
Co
ral
300
(fy
= 4
000
kg/c
m2)
C
j\
00
Tah
iti
300
Mat
Fest
i val
30
0 A
63-4
2H
Mat
7
.0
El
Far
o
225
A63
-42H
C
on
tin
uo
us
Fo
oti
ng
2
.0
-3
.0
* S
pecif
ied
2
8-d
ay c
ub
ic r
esi
stan
ce
(R28
).
**
A63
-H42
co
rres
po
nd
s to
G
rade
60
st
eel
(See
Secti
on
4
.4.2
).

Tab
le
7.1
P
hy
sic
al
Ch
ara
cte
risti
cs
of
Un
dam
aged
o
r L
igh
tly
D
amag
ed B
uil
din
gs
Num
ber
Ty
pic
al
Bu
ild
ing
A
ddre
ss
Yea
r Y
ear
of
Sto
ry
To
tal
Wal
l A
rea *
S
lab
D
esig
ned
Co
nst
ruct
ed
Sto
ries
Hei
gh
t H
eig
ht
Flo
or
Are
a T
hic
kn
ess
Pla
za
del
M
ar
San
Mar
tin
821
19
80
1982
23
2
.68
m
68.4
2 m
6.
5%
(3)
14
cm
+2
mec
h (8
' -9
")
(22
4.5
' )
Mar
ina
Rea
l S
an
Mar
tin
890
19
80
1983
20
2
.70
m
51. 7
0 m
9.
1%
(1)
12-1
6 cm
+
mec
h (8
'-1
0")
(1
69
.6' )
7.
1%
(7)
To
rres
de
M
iram
ar
San
M
arti
n
1020
19
73
1975
21
2
.55
m
63.7
1 m
4.
7%
(3)
20
cm
San
M
arti
n
1080
19
76
+3
mec
h (8
' -4
")
(20
9.0
' )
0'
\D
San
M
arti
n
1130
19
80
To
rres
d
el
Pacif
ico
S
an
Mar
tin
12
06
1979
19
81
17
2.6
2 m
5
1.0
6 m
8.
0%
(3)
16
cm
San
Mar
tin
+2
m
ech
(8' -
7")
(1
67
.5' )
Vil
la R
eal
5 N
ort
e/4
P
on
ien
te
1981
19
83
10
2.5
5 m
28
.20
m
7.2%
(1
) 12
-16
cm
(8'-
4")
(9
2.5
' )
5.9%
(2
)
To
rres
d
el S
ol
8 N
ort
e/4
P
on
ien
te
1979
19
82
22
2.6
5
m
67.1
5 m
6.
5%
(1)
16
cm
+2
mec
h (8
' -8
")
(22
0.3
' )
5.9%
(3
)
Alm
endr
al
(Val
par
aiso
) 19
72
22
2.5
5
m
60.2
1 m
II
. 3%
(1
) 18
em
+1
m
eeh
(8' -
4")
(1
97
.5' )
3.
4%
(2)
* T
he
flo
or
lev
el
is
giv
en
wit
hin
p
aren
thes
es.
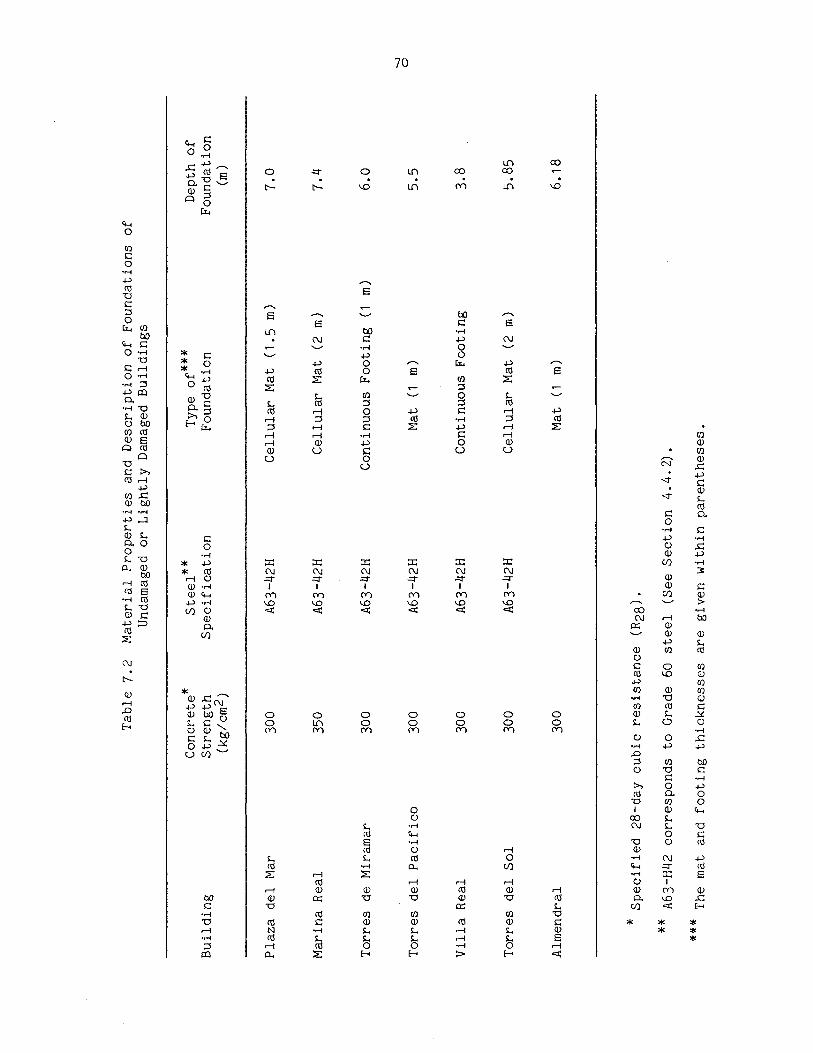
Tab
le 7
.2
Mat
eria
l P
rop
ert
ies
and
Des
crip
tio
n o
f F
ou
nd
atio
ns
of
Und
amag
ed
or
Lig
htl
y D
amag
ed
Bu
ild
ing
s
Con
cret
e*
Ste
el*
*
Typ
e o
f ***
D
epth
of
Bu
ild
ing
S
tren
gth
S
pecif
icati
on
F
ou
nd
atio
n
Fo
un
dat
ion
(k
g/c
m2
) (m
)
Pla
za
del
M
ar
300
A63
-42H
C
ellu
lar
Mat
(1
.5 m
) 7
.0
Mar
ina
Rea
l 35
0 A
63-4
2H
Cel
lula
r M
at
(2
m)
7.4
To
rres
de
M
iram
ar
300
A63
-42H
C
onti
nuou
s F
oo
tin
g
(1
m)
6.0
-....J
To
rres
d
el P
acif
ico
30
0 A
63-4
2H
Mat
(1
m
) 5
.5
0
Vil
la R
eal
300
A63
-42H
C
onti
nuou
s F
oo
tin
g
3.8
To
rres
d
el S
ol
300
A63
-42H
C
ellu
lar
Mat
(2
m
) 5
.85
Alm
endr
al
300
Mat
(1
m
) 6
.18
* S
pec
ifie
d 2
8-da
y cu
bic
resi
stan
ce
(R28
).
**
A63
-H42
co
rres
po
nd
s to
Gra
de
60
steel
(See
Sec
tio
n
4.4
.2).
***
The
m
at
and
foo
tin
g
thic
kn
esse
s ar
e g
iven
wit
hin
par
enth
eses
.

71
FIGURES

72
73" 72· 71· 70' 69·
30· U-----+---r:::;.-...-+--=-----4+-----H 30·
z ~
31· w 0 0
0 G: 0 ~ 0..
32·
V1~A DEL MAR 33· EPICENTER VALPARAISO
~VI-VII ~ARROBO
34·~~-------~,r-
IV-V
~ Z IZ W o ~ ~
31·
32·
33·
35· L--L---+-+---W7F~~~t_---1135·
36·
VI
TALCA o
o ,
/ I ,
L __ L-~~------~~L-:LlN:A:R:E:S-1~----t_--_t----------~n 36·
o CHILAN
73" 72· 71· 70· 69·
Fig. 1.1 Intensity Map from the 3 March 1985 Earthquake [61J

32'
73
73' 72' 7" 70' 69' i T------
, I I
-,-------.,-----------'11 I SCALE I I 1-- 1G --1 I
-t------------r--+---f--I --l-.---------l~ 32'
I
I
I ~II )1
I PAPUDO ~A LGUA I ! ZAP ALLAR I \ I 'I
VENTANAS, \,/-;;-;'-~ I 1
33' ~-+---VAL~~:~~~' "SAN PED:~L~__ --------.. ------i
I133•
34'
z « w u o LLOLLE~L I 6 SANTIAGO I I I
I ~ I rL MEUPILLA l' I I -- U __ ...RAPEL Ii J
I ~ --. )--------+II--II! 34'
PICHILEMU
1 i
~I I iLOCA
35' ~----T I /
s~ rrnN==-_L I I I HUAlANE -J-------+-- 35'
'I' CONI,' STIruCiON - LINES INDICATE THE -.jTALCA DIRECnON AND PEAK
ACCELERATION RECORDED
I I' .l._EL COLORADO AT THE LOCATION, I
, I
COLBUN ~ PEHUENCHE I I I I &
36' ~-r~~t;-t--,---t---J----L-- + I I -- /1 36
'
'Iv r I I CHILLAN ~ I I
L-.L-_____ L-____ --1.--L _______ --L ______ -L-. __ J
73' 72' 71' 70' 69'
Fig, 1.2 Location of Strong-Motion Instruments during the 3 March 1985 Earthquake [61]

. .
0'
Fig. 2.1
• '0 0
0
, .....
o
;. ..... o 1. .. I
74
. '. . CARIBBEAN
PLATE (-. . . '/-" ~ ...... ,~, ~.). ••• I
NAZCA PLATE
....
.. . .. . . . .... ..rI. .-. ... . - -. .... : ..... ,- ... -.' .. .. ' , , .- -. :e· , , .. -. . .... ....... : -•• PERl! .. .. ... .-: .:-:.
• • • t. -. .:,., : ... . . . ..... . . ~.~. t,
o . ,
, ,
SOUTH AMERICAN
PLATE
. ... '-. . ~ ....
.\ .. : ...... .J '. ,. ,. 0 ... .. .
00 • 00
~ .... :, -;. ;. ...... ,. ..
, o
'1 o ., O"" __ T'i"
.o[]
Movement of the Crustal Plates along the West Coast of South America [60]

75
LONG I TUD 80 79 78 73 72 71 70 69 68 67 66 65 4 63 62 0
10 10
11 11
12 12
13 13
14 14
15 15
16 16
17
18
19
20 20
21 21
22 22
23 "( 24
25
26
27
28
29
30
31
0 32
J 33
f- 34
H 35; . . ! ..
f- 36
[ 37 .
J 38 . ; .
39
40
41
42
43 : .
44
45
46
47 :.
48
49
50
51
52
53
54
55
56 56
Fig. 2.2 Distribution of Epicenters in Chile between 1963 and 1978 [55]

0::: « w
2000
1900
1800
I-t-
l-I-
I-I-r-r-l-I-r-I-I-
1939, Ms =8.0 1920, M! =8.2
I
01871 1835
1751
76
-1985, Ms=8.0 -
I----- --l 1971, ¥s=7.9 -1981, Ms=7.2° I -
I ' 943, M! =8.1 ~
1906, Ms=8.3 -I -
1873 (similar to 1971) I 1880
I 1851 I • °1876 -18470 -1822
I -I ----
I 1730 --
>- 1700 I-
I- -I-I-r-I-
1600 I-I-
I-r
l-1500
36'S
-1647 (similar to 1906) -
r--------------------~ ---1575
.... --?--?-~ ----
I I I I I 35' 34' 33' 32' 31'
LENGTH OF RUPTURE
---N .... c:==-Aftershock Region - 1985
CONSTlTUCION Aft .... "'" ReglM - 1971 ~
72"W CUREPTO' LUCO
TALCA. o CURICO QUIN~TE:;::::R::::O...L.-:::::7--....;(LO;::S VlLOS ~
o LA UGUA ILLAPEL OVALtf 71·W~ __________ L_ ________ M_EU~PLI_LLA __ o ________ L_ ___ Z_A_P_AL_~ __ ~I _____ o ______ -LI ___
36'S 35' 34' 33" 32' 31'
Fig. 2.3 Rupture Lengths Attributed to Great Earthquakes in Central Chile [23]

77
-'''''0 Ie:.
!i,I·-----------r--r~r7--71~ 70·
---r;------------"l \ I
)
ARROWS INDICATE THE. DIRECTION OF THE ACCELERATION RECORD
,)
) AND THE PEAK OVALLE / Acer,_ERA TION IN G. 0
\ (
~ '-" COMBARBALA /\, ) \ ,0 I
\' ILlA;~\ ~ \ \ SALAMANCA \ j \ 0 \
i· LOS VILOS \ -.....-,.
\
.605 0 \ I \ c;--) \ 0.472 \
f \ VI\ \ ,. VI \ V ~ IEPICENTER--V ')0.379 P, \ \ 17 fj NOV 1981 I >lJ::....A UGUA \ \ \ M ~ 6.L . .....J PAPUDO )~,:e~ )
R 0.p66'-.... "! \ . C'! 0 0.371-..J
V[NTANAS 0 I _---.j 0.277 J SAN FELlf)[
~ /LLAYLLAY i LOS ANDES')
VINA DEL MAR ,-" " , I
VALPARAISO) -1riiO PELDEH~290 (
~, /- \ 8, /')
~ r') 1rJ SANTIAGO ) 8 '(70.080 I
LLOLLEO ~~97 / (
I . ~EU~ILL: / (
SCALE r------
0.59
I I ~ 31' ,
i i I
- 32'
I ,
-I 33'
I
I I ) I~;/ [--1
! i \" RANCoAGUA \., I j -' I L_. ____________ l __ ._ ... _~" ___ ~ __ ._~_. ___ .. _~ ...... ___ ..l_' ___ " ____ ' _____ ... _ .. _~~¥ .... _.L:.~~~ __ .. --_~._ .. _,,_._. ___ i
"71· 70·
Fig. 2.4 Intensity Map from the 7 November 1981 Earthquake [27]

N 1
o 2
3 K
MS
SC
ALE
fie
p
AC
I
O
~
~~
C-
Est
ero
Ma
rga
Mo
rgol
VIN
A
DE
L M
AR
Fig
. 2
.5
To
po
log
ical
Map
o
f V
ina d
el
Mar
an
d V
alp
ara
iso
[3
0]
'-l
CXl

~{_ArtifiCial
Fill
&
_ C
ollu
viu
m
~j ~ ~{D F
luvi
al
De
po
sits
o
0"
~ ~~
rnIIIIIl
lIill M
orin
e S
ands
and
Gro
vels
6 a:: ~ E
oli
an
S
and
s (D
un
es)
'" j {_
Estu
arin
e T
err
ac
es
:.§ _
Man
ne T
erra
ces
(L
" I C [ll
I[] G
ran
ite I
ntr
usi
an
s
(L {
. .---
-J G
ne
iss-
Gra
nit
e
L-J
Tra
nsi
tio
n
§ A
mp
hib
olit
e
----F
au
lts
o 2
3K
MS
SCA
LE
cle
pile
I r
0(,
'"
~'?
N 1
Fig
. 2
.6
Geo
log
y o
f V
ina d
el
Mar
an
d V
alp
ara
iso
[3
0]
"--J
\.
D

o 200 400 600m t ' t ,
SCALE
./\
E3 COAST 1712-1790 t2l FILL 1854 DFILL 1884 ~FILL 1913 ~FILL 1947
80
o N
Fig. 2.7 Development of Valparaiso Harbor [2]

81
71°34' 71°32'
'-..
\ )
71°30'
32°56'------------i~-----_..<::r""<:;;_--_11____7"'''---------_____;>''''/-·--___t-----------32°56'
32°57'--------/------?:----t----/------------t-----------32°57°
MUNICIPALITY OF VINA DEL MAR
+ N , 32°58'--------/------'\----\-------i--+--..I.--,--------___t------------32°58'
/ ./ I i i i
32059'-------I_____-------,~----t--__+\-------_1_;Or"'"·\-=-!'----------32°59'
\... r"-'''''' i \ '-. I -. . '''. ~~ i '-',
~l'.f " ·"../""'--'1
I i
rJ 33000'-------I_____------+-----t----------_1'-----::,....,---. -----f."'--.J----33°00'
/ '-_._.J
DOWNTOWN AREA
/ j
<" '-....... -"",
\ 33°01'-------1_____:--:;t'---------t-----------f---------t------33°01'
\ \
i \. 1'.
I'> \., (
,...._._._._ . .-""
i r/
33°02'---'---------1f------------t----->.,>.."..;:----=~:_;_-:_4-----------33°02' (.
',. '\
.,.\. /A... ( \. )
'- -. // ...... <
"'-.'-''-._,{ c,. . J\ \G .. 33°03"-------t--------------'~Fd_---------1_____~~_+_-------33°03'
\\ l.i
".j
71°34' 71°32' 71°30'
Fig. 2.8 Vina del Mar

\ \
\ \
82
r-_' /,,--_J
(
/ (
I
'--- "\
\ I I \ 1'..., \.I (
Fig. 2.9 Expected Distribution of Modified Mercalli Intensities within Vina del Mar [3]
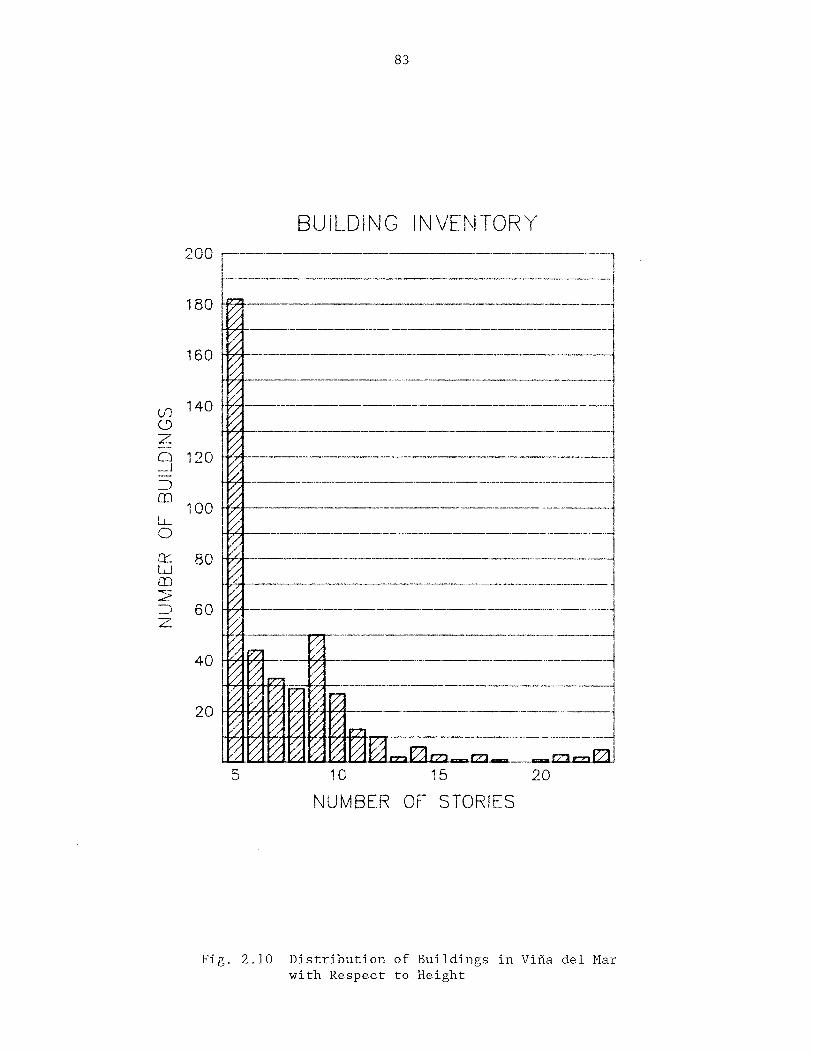
Ul (9 Z 0 _J
=, m lL. 0
et: LLl m ~-..2 -"j
z
83
BUILDING INVE~\jTORY
200 I --------------l
-------------_._-------_ .. _._--j
180 I
H77t--.-=----.--.~-----=---~~--~=--~--~----~-.-.. -~.------~ 160
140
120
100
80
60
-------~ ,
--------------- ~=--.-----~-=---~~~ ----------------------~~
/ --==----=-====-=--=----==--l , --.-~-.-~.----.-----~-------.-.--.-.----~--i
HH'~----------------------------.-.-------~ I
-.. -----------.-.-----~~-~~-------.-~ H"7":1-I7'7'1-I'7":t-=~I__------ --------------1
20 1-b-'7tt+4't"""""I'+H'>"'>+f''>4b~'''''-.----(ZJ-...... -~-.... ----.:~-.,:-~-~ 5 10 15 20
NUMBER OF STORIES
Fig. 2.10 Distribution of Buildings in Vifia del Mar with Respect to Height

84
·th Five or d · gs w~ f Buil ~n 11 Locations 0 Vina del Mar Fig. 2. in Downtown Stories More

DE
SIG
N
AC
CE
LE
RA
TIO
N
SP
EC
TR
UM
-
NC
h
43
3
0.1
2
0.1
0 I
.....
... -=:
:::::::
_
0.0
8
m
. 0
.06
o
fI)
0.0
4
0.0
2
K 1
=
K
2
=
1.0
DENS
E SA
ND
'" '"
........
.........
.........
.........
-- -
-- -
-- -
0.0
0 ~
I --~--~--~--~--~--~--~ _
_ ~ _
_ ~ _
_ ~ _
_ ~ _
_ ~ _
_ ~ _
_ ~ _
_ ~
0.0
0
.5
1.0
1
.5
PE
RIO
D.
SE
C
Fig
. 3
.1
Desi
gn
Accele
rati
on
S
pectr
um
[1
6]
00
\.J
1

86
RIC Column
PLAN
r RIC 8 (Ch r 8 eam an eam
I I I I I I 'I I I I I I
ELEVATION NOTE: Reinforcement is not drawn to scale.
Fig. 4.1 Confined Masonry Construction
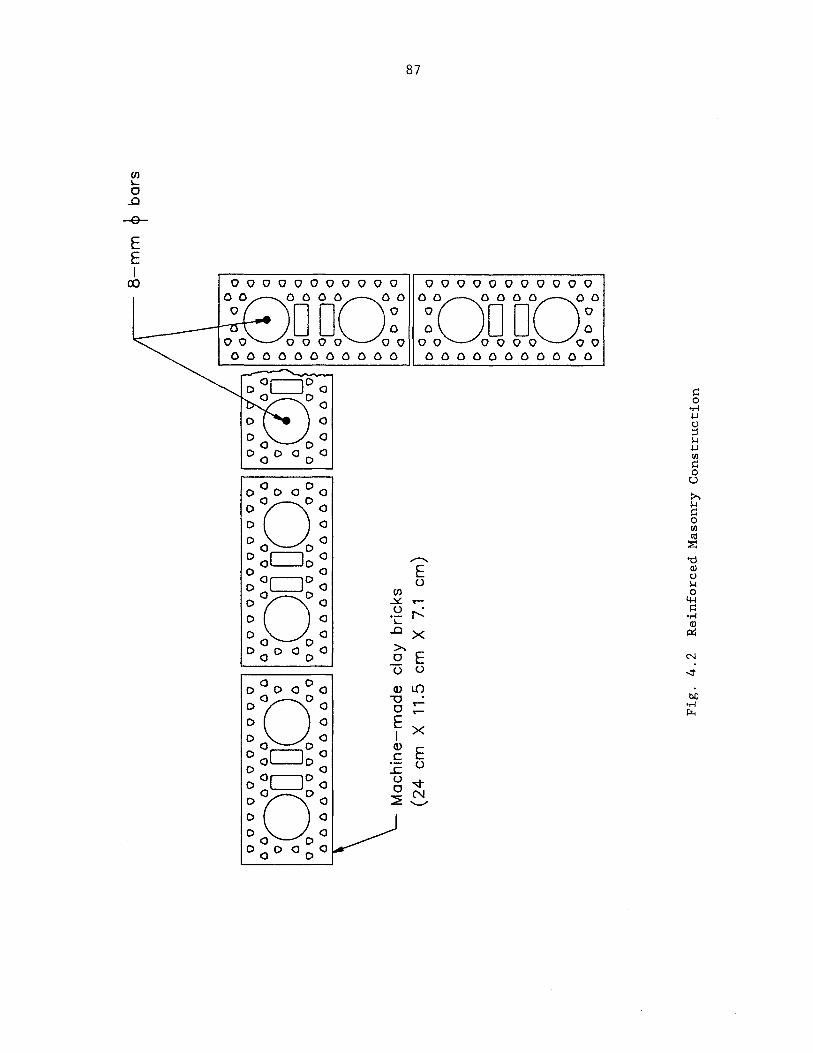
87
(fJ ~
0 ..0
~
E E I
CX) o 0 0 00000000 00000000000
°DD~a~o 0000 00
o~DDD~a~o 00 0000 00
Q Q Q Q QQQQQQQQQQQ
I::! 0
'''';
° .jJ ()
::l l-l .jJ (/)
I::! 0
0°00°0 u >-. °Do l-l I::!
° ° 0 (/)
° ° Cd
~~CJ~~ ::a:
,.-... "d E Q)
()
°CJo U l-l
°Do (fJ 0
° ° .::£ ..- 4-l U I::!
° ° 'i: l"- .,..; Q)
° ° ..0 X ~
° ° >. ° 0 °° 0 ° 0 E N
U U ..::t
0°00°0 Cl> L() bO °Do \J ..- ''''; 0 ..- ~
° ° E X
° ° I oOCJoo Cl> E c 0° ° ° ..c u oOCJoo u .q-
0 °Do ~ N '--"
° ° ° ° ° ° ° 0 °° 0 °
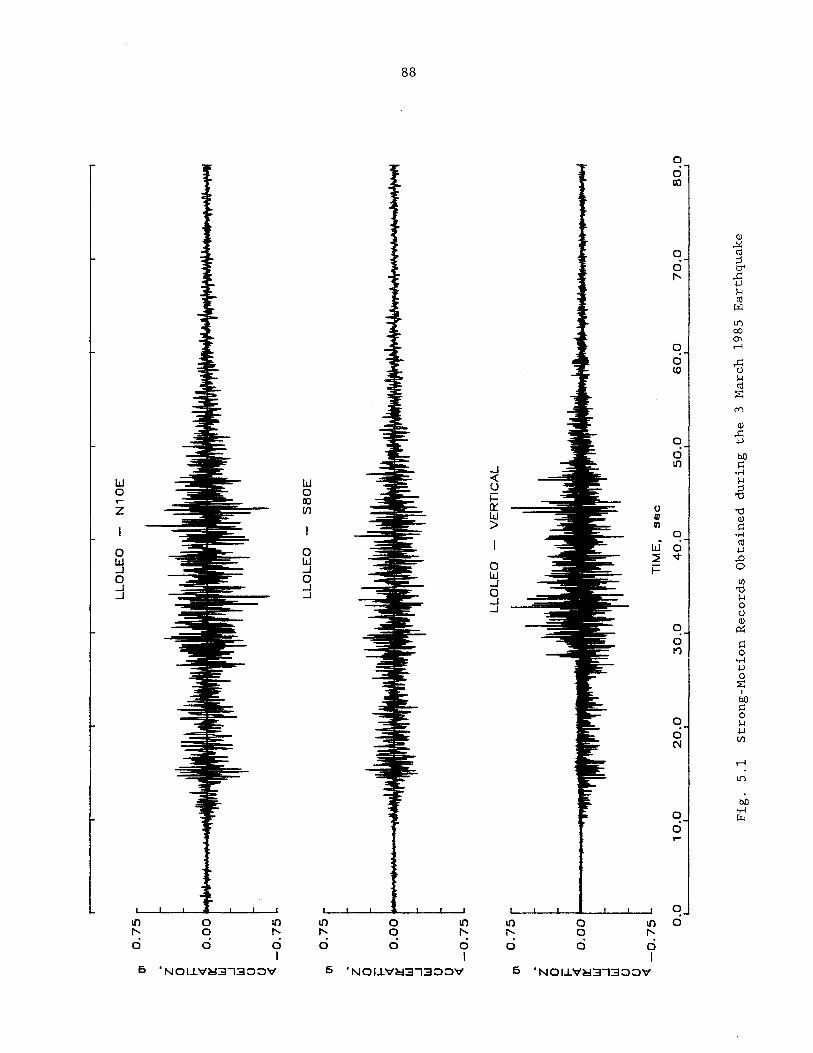
----
----
-,---
----
----
----
--y-
----
----
----
----
,----
----
----
----
--r-
----
----
----
----
r---
----
----
----
--,--
----
----
----
----
r---
----
----
----
--,
(JI z o
0.7
5
i= III "
,W"I
IIi
... "
.,,,
.,....
. <{
0
.00
..
-0:
W
-1
W
U
U
<{
-0
.75
(JI
0.7
5
. z Q
·W
f-~.
_"11
, ",
,,, •.
<{
0 0
0
....
...
..
0:
• W
-1
W
U
U
<{
-0
.75
(JI . Z o
0.7
5
-."1
1 f-
0 I
I IE
".1
<{
0
.0
0: w
-1
W
U
U
<{ -0
.75
LL
OL
EO
-
N 1
OE
LL
OL
EO
-
S8
0E
LL
OL
EO
--
VE
RT
ICA
L
TIM
E,
se
c
0.0
,
0.0
2
0.0
3
0.0
4
0.0
5
0.0
6
0.0
7
0.0
8
0.0
I
I I
J I
I I
J I
Fig
. 5
.1
Str
on
g-M
oti
on
Reco
rds
Ob
tain
ed
du
rin
g th
e
3 M
arch
1
98
5
Eart
hq
uak
e
00
0
0

IJI . Z o
0.7
5
~ 0
1
...
.. -M
....
Jr
0.0
~ w
o o « -0
.75
IJI . Z o
0.7
5
-al
' ~
0.0
01
•
t, ..
....
...
Jr
W
.J
W
o o « -0
.75
0.0
1 0
.0
20
.0
ME
LIP
ILL
A
-L
ON
GIT
UD
INA
L
ME
LIP
ILL
A
-T
RA
NS
VE
RS
E
30
.0
TIM
E.
se
c
40
.0
50
.0
60
.0
70
.0
Fig
. 5
.1
(co
nt.
) S
tro
ng
-Mo
tio
n R
eco
rds
Ob
tain
ed d
uri
ng
th
e
3 M
arch
198
5 E
arth
qu
ake
-.
80
.0
00
'"

-, ---
I --
--------.------
-----
----
r----------,--------,---------,---------,
VIN
A
DE
L
MA
R
-N
70
W
(JI
0.7
5
.&
u
....
.. A
j,+..-
lJ...
,..".
,,·1
.. AA1A~ ....
... t·\
4,.v
. \i,~ytzti"
., W
.. U~
«qi(
n •
i ~1~
\\IjI~
-,<It\
,w-~""
" o
, JA~''
'~ 111
'U
I V'
i= I
4' ..
~UII
O
r «
0.0
0
It:
W
-1
W
U
U « -0
.75
(JI
0.7
5
VIN
A
DE
L
MA
R
-S
20
W
J U
.A
hA
"WN
'4\~
A
U4
AWN'
-l.~
""'f
IlO"
'~~'
''''
'.
. u'W
lflmwu
WJtlt\
Wu~".n
to ij
....
. I'W~
rwtI
f~fl
i ,n"
, fti
~
0.0
0 I
., %
A o
Mrh
fm
u ~
0::
W
-1
W
U
U « -0
.75
(JI . z a
VIN
A
DE
L
MA
R
-V
ER
TIC
AL
0.7
5
~ 0
.00
1
••• 1'''
'':_
~~''
''.i
''IJ
.w~f
''''
''''
''''
W,Lo
''''
M'''
''h'
'''.
N~
W
-1
W
U
U « -0
.75
-T
IME
, sec
0.0
1
0.0
2
0.0
3
0.0
4
0.0
5
0.0
6
0.0
7
0.0
8
0.0
I
I I
I t
I I
I I
Fig
. 5
.1
(co
nt.
) S
tro
ng
-Mo
tio
n R
eco
rds
Ob
tain
ed d
uri
ng
th
e
3 M
arch
19
85
Ear
thq
uak
e
-0
o

,----
---
------,-
---
----------------,-
-----.------
T-
--r-----------
------.-
--------
----
.
IJI
0.7
5
. ~ 1N
V''Io
MM
IJIW
o -
~'A/i~'~""
~ 0
.00
I f""
~ ,
I( ~ W
o o 4: -
0.7
5
IJI
0.7
5
VA
LP
AR
AIS
O
-N
70
E
VA
LP
AR
AIS
O
-S
20
E
......
......
. ","
t ..
..
""
.. ' .
....
,..,..
.1IIf
'h¥)
Z
•
..... .. _
_ .I
FM
\.1 '
~
I' -1
IIIf,ltI
""",,
,iW_
... <{
0
.00
...
.
0:: W
-' W
o o 4: -0
.75
IJI
0.7
5
VA
LP
AR
AIS
O
-V
ER
TIC
AL
-te'"
,,,.
"
' "-'''
-_,
~ ...
.. --.....
.. -. -
.. "'~~4
.. ~
0.0
0 I,
I'" 'f
I4IW
••
0::
W
-' W
o o 4: -
0.7
5
0.0
,
0.0
2
0.0
TIM
E.
se
c
30
.0
40
.0
50
.0
60
.0
70
.0
Fig
, 5
,1
(can
t,)
Str
on
g-M
oti
on
Rec
ord
s O
bta
ined
du
rin
g
the
3 M
arch
19
85
Ear
thq
uak
e
80
.0
1.0
I-'
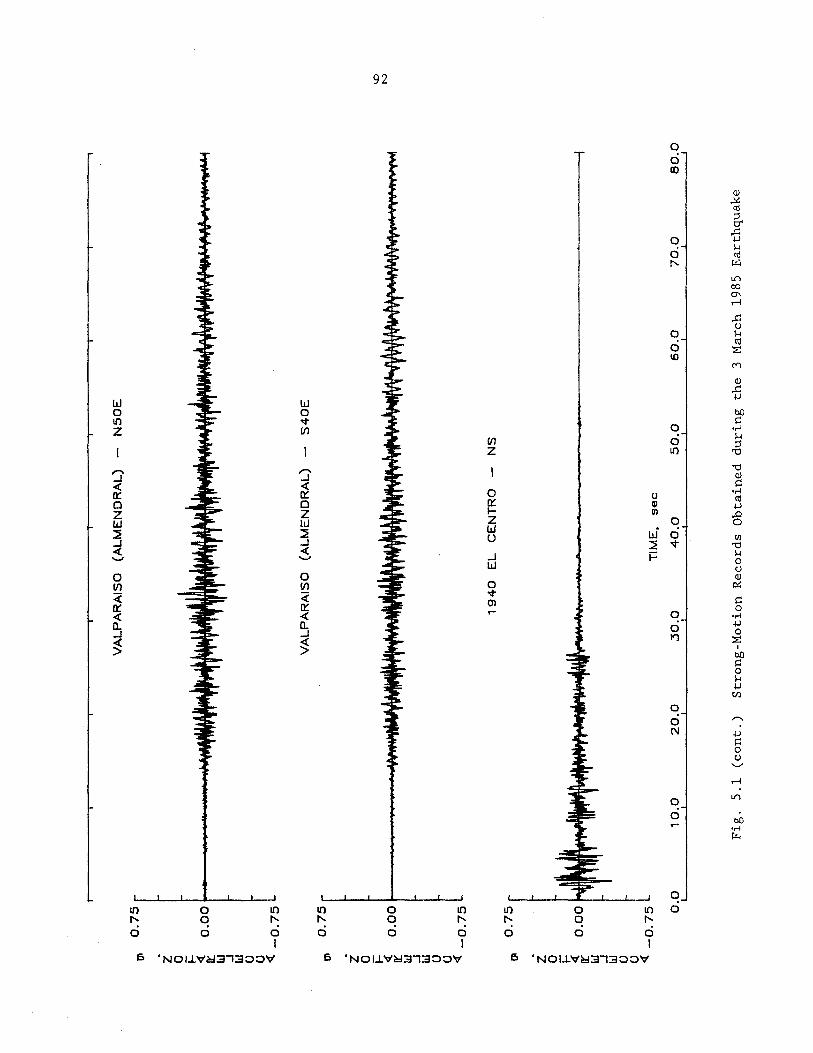
,------------.---~------~-------------r
l-----~----
-.--------
-.-
----T---~--
----,
VA
LP
AR
AIS
O
(AL
ME
ND
RA
L)
-N
50
E
!]I
0.7
5
j If'
" ''''
'W";N
"II
'/Ai
II"'MIWw·~\M~""., ,.-
.. II
~~W
-.1 ~
c," MtIM~
T'
~. j:
"
., ..
. ' ," ·\"
"....J
MJIP~
<{
0.0
0 I
• It:
W
.J
W
U
U
<{
-0
.75
!]I
0.7
5
VA
LP
AR
AIS
O
(AL
ME
ND
RA
L)
-S
40
E
I ..
ft II
A "
..
..
• ".
trJ.
Wr'
t{#t
'tr
IfI' "'
'''''A
n I.
'tP ~'
V{'JiJ''''iJ 'i~
Vi'"
.. "~u..
\(1
1" ,\
10
iii
Z
, "'M
I' ''\I
/\WII\
IIiIIM
"" r
.. "
Q
, .4
""-·
'l·~
~,.
III
I-••
,.
l'+1.
Y?l
<{
0
.00
I It:
W
.J
W
U
U
<{
-0
.75
!]I
0.7
5
19
40
E
L
CE
NT
RO
-
NS
. .
Z
u....
N
'
o .... ~Wl
"'f*r'
w'"
j:
~·IIIY\I~
, <{
0
.00
t-dIlM~
.\ It:
W
.J
W
U
U
<{
-0
.75
T
IME
. sec
0.0
1
0.0
2
0.0
3
0.0
4
0.0
5
0.0
6
0.0
7
0.0
8
0.0
l
I I
I I
I I
I I
Fig
. 5
.1
(can
t.)
Str
on
g-M
oti
on
Rec
ord
s O
bta
ined
du
rin
g
the
3 M
arch
198
5 E
arth
qu
ake
\.0
N

LL
OL
LE
O
-N
10
E
LL
OL
LE
O
-sa
OE
35
.0
35
.0
30
.0
30
.0
E
E
u 2
5.0
u
25
.0
.: ~
z W 2
0.0
z W
20
.0
~
~
w
U
15
.0
w
U
15
.0
~ :5
~
10
.0
~
10
.0
0 0
5.0
5
.0
0.0
I.,.
0.0
0
.0
0.5
1
.0
1.5
2
.0
2.5
3
.0
0.0
0
.5
1.0
1
.5
2.0
2
.5
3.0
P
ER
IOD
. sec
PE
RIO
D.
sec
1.0
l.V
LL
OL
LE
O
-N
10
E
LL
OL
LE
O
-sa
OE
3.5
3
.5
3.0
3
.0
(JI
2";
; 2
.5 t
2";
.2.5
-_
._-
5";
--'--
5";
Z 0
------
1O
";
L ------
1O
";
~ 2
.0
------
2O
";
~ 2
.0
------
2O
";
<{
<{
Ir
Ir
~
1.5
W
1.5
..J
W
W
U
U
1
.0
U
U 1
.0
<{
« 0
.5
0.5
0.0
0
.0
0.0
0
.5
1.0
1
.5
2.0
2
.5
3.0
0
.0
0.5
1
.0
1 .5
2
.0
2.5
3
.0
PE
RIO
D.
sec
PE
RIO
D.
sec
Fig
. 5
.2
Ela
sti
c R
esp
on
se
Sp
ectr
a

ME
LIP
ILL
A
-L
ON
GIT
UD
INA
L
35
.0 ~r-------r-----r------r----.-------.------~
30
.0
E
u 2
5.0
..: Z W 2
0.0
~
W
o 1
5.0
~ ~
10
.0
----
--o
5.0
0.0
'~~~ __
__ ~ __
____
__ -L
__
__
__
__
~ _
__
__
__
_ ~ _
__
__
__
_ L
-_
__
__
_ ~
0.0
0
.5
1.0
1
.5
2.0
2
.5
3.0
P
ER
IOD
, sec
ME
LIP
ILL
A
-L
ON
GIT
UD
INA
L
3.5
rr--
----
-,,-
----
--,-
----
---r
----
----
.---
----
,---
----
-,
3.0
01 .2
.5
Z o f= 2
.0
4: It: ~
1.5
W
o o
1.0
4:
0.5
2~
---.---
5~
--
--
--
10~
------
20~
0.0
I ~--=.~.
0.0
~
-:;;
;: j
0.5
1
.0
1.5
2
.0
2.5
P
ER
IOD
, sec
3.0
ME
LIP
ILL
A
-T
RA
NS
VE
RS
E
35.0r----~---_r---_r-----~-----r_--~
30
.0
E
u 2
5.0
~
Z
W 2
0.0
~
W
o 1
5.0
:5 ~
10
.0
o 5
.0
J~~~
--.....
_"
----
--------~--
0.0
~r • .e
=~ __
__ ~ __
____
__ ~ __
____
__ ~ __
____
__ ~ __
____
__ ~ __
____
~
0.0
0
.5
1.0
1
.5
2.0
2
.5
3.0
P
ER
IOD
, sec
ME
LIP
ILL
A
-T
RA
NS
VE
RS
E
3.5
.----.---,------.-----.---,-----,
3.0
01 .2
.5
Z o f= 2
.0
4:
It: ~
1.5
W
o o
1.0
4:
0.5
2~
---.--
5~
--
--
--
10~
------
20~
I --~~~
0.0
j
-==.~
0.0
0
.5
1.0
1
.5
2.0
2
.5
PE
RIO
D,
sec
3.0
Fig
. 5
.2
(co
nt.
) E
last
ic R
esp
on
se S
pectr
a
\0 ~

VIN
A
DE
L
MA
R -
N7
0W
V
INA
D
EL
M
AR
-
S2
0W
35
.0
35
.0
30
.0
30
.0
E
E
0 2
5.0
0
25
.0
I-~
Z
W 2
0.0
Z
W
20
.0
~
~
W
W
o 1
5.0
o
15
.0
~ ~
~
10
.0
n. 1
0 0
(II
•
0 0
5.0
5
.0
0.0
0
.0
0.0
0
.5
1.0
1
.5
2.0
2
.5
3.0
0
.0
0.5
1
.0
1.5
2
.0
2.5
3
.0
PE
RIO
D,
sec
PE
RIO
D,
sec
\.0
U
1
VIN
A
DE
L
MA
R
-N
70
W
VIN
A
DE
L
MA
R
-S
20
W
3.5
3
.5
3.0
3
.0
[/I
2"
; 2.st
2"
.2.5
-_
._-
5"
--.--
5"
Z 0
------
10
"
------
10
"
i= 2
.0
------
20
"
i= 2
.0
------
20
"
« «
It::
It::
~
1.5
~
1.5
W
W
0
0 o
1.0
o
1.0
«
« 0
.5
0.5
0.0
0
.0
0.0
0
.5
1.0
1
.5
2.0
2
.5
3.0
0
.0
0.5
1
.0
1.5
2
.0
2.5
3
.0
PE
RIO
D,
sec
PE
RIO
D,
sec
Fig
. 5
.2
(co
nt.
) E
lasti
c
Resp
on
se
Sp
ectr
a

VA
LP
AR
AIS
O -
N7
0E
V
AL
PA
RA
ISO
-
S2
0E
35
.0
35
.0
30
.0
30
.0
E
E
u 2
5.0
o
25
.0
J-:'
I-Z
W
20
.0
Z
W 2
0.0
~
~
W
() 1
5.0
W
()
1
5.0
~ ~
~ 1
0.0
~
10
.0
0 0
5.0
5
.0
0.0
0
.0
0.0
0
.5
1.0
1
.5
2.0
2
.5
3.0
0
.0
0.5
1
.0
1.5
2
.0
2.5
3
.0
PE
RIO
D,
sec
PE
RIO
D,
sec
\0 '"
VA
LP
AR
AIS
O
-N
70
E
VA
LP
AR
AIS
O
-S
20
E
3.5
3
.5
3.0
3
.0
IJl
2~
~ 2.5~
2~
• 2
.5
-_
._-
5~
-_
._-
57
-Z
0 ------
10
7.
------
10
7.
i= 2
.0
------
20
7.
i= 2
.0
------
20
7-
« «
0::
0::
~
1.5
~
1.5
W
W
()
o 1
.0
()
()
1.0
«
« 0
.5
0.5
0.0
0
.0
0.0
0
.5
1.0
1
.5
2.0
2
.5
3.0
0
.0
0.5
1
.0
1.5
2
.0
2.5
3
.0
PE
RIO
D,
sec
PE
RIO
D,
sec
Fig
. 5
.2
(co
nt.
) E
last
ic R
esp
on
se
Sp
ectr
a

EL
A
LM
EN
DR
AL
-
N5
0E
E
L
AL
ME
ND
RA
L
-S
40
E
35
.0
35
.0
30
.0
30
.0
E
E
u 2
5.0
u
25
.0
.-.-
Z
W 2
0.0
Z
W
20
.0
~
~
W
U
15
.0
W
U
15
.0
~ ~
~ 1
0.0
D.
1
0.0
Ul
0
0 5
.0
5.0
0.0
0
.0
0.0
0
.5
1.0
1
.5
2.0
2
.5
3.0
0
.0
0.5
1
.0
1.5
2
.0
2.5
3
.0
PE
RIO
D,
sec
PE
RIO
D,
sec
~
-....J
EL
A
LM
EN
DR
AL
-
N5
0E
E
L
AL
ME
ND
RA
L
-S
40
E
3.5
3
.5
3.0
3
.0
01
2~
i 2.st
2~
.2.5
--'--
5~
-_
._-
5~
Z
0 ------
10~
------
10~
i= 2
.0
------
20~
i= 2
.0
------
20~
« «
It:
It:
~
1.5
~
1.5
W
W
U
U
1
.0
U
U
1.0
«
« 0
.5
0.5
0.0
0
.0
0.0
0
.5
1 .0
1
.5
2.0
2
.5
3.0
0
.0
0.5
1
.0
1 .5
2
.0
2.5
3
.0
PE
RIO
D,
sec
PE
RIO
D,
sec
Fig
. 5
.2
(co
nt.
) E
lasti
c
Resp
on
se
Sp
ectr
a
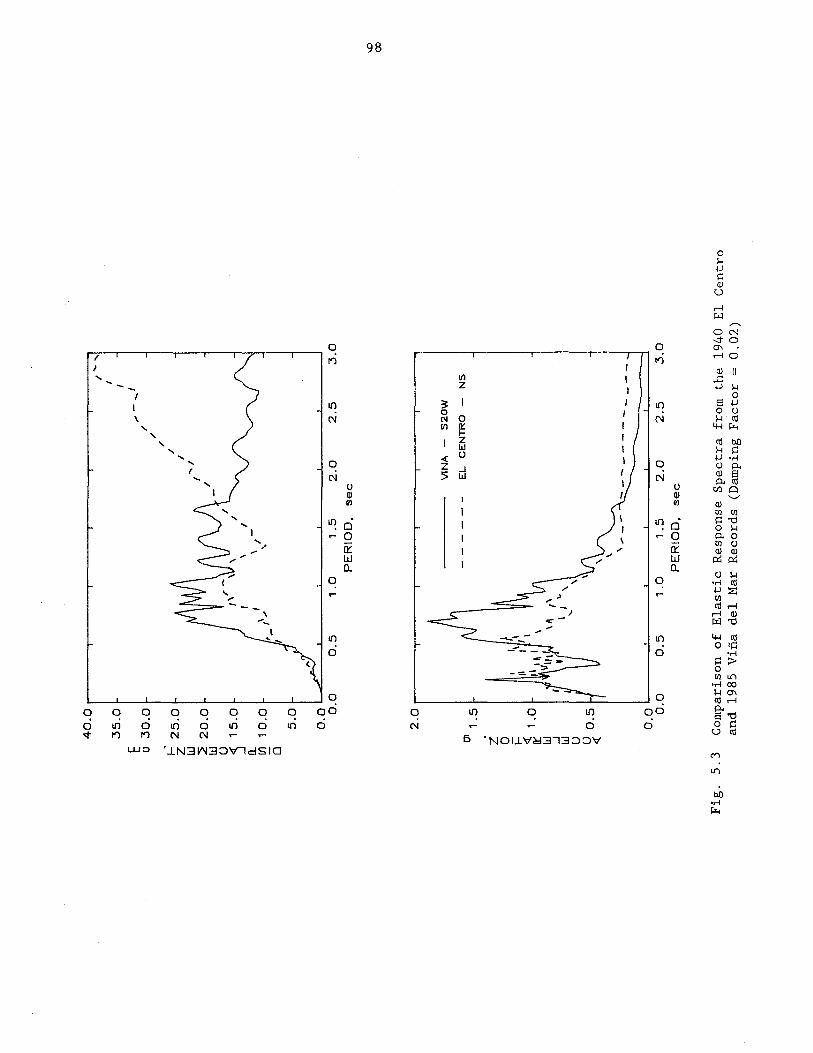
40
.0 I
, ....
"' I
.35
.0
E
u .3
0.0
~. 2
5.0
W
~
20
.0
W
U
~
15
.0
n. fIl
10
.0
o 5
.0
0.0
I .
E-
0.0
0
.5
, .... /
/
1.0
,
.5
2.0
P
ER
IOD
. sec
" /
/ ,
'" -.
... ' /
2.5
, ,
.3.0
2.0
I ----~--~---.----~--~--~
01 1
.5
. Z o i= ~
1.0
W
.J
W
U
~ 0
.5
VIN
A
-S
20
W
--
--
--
EL
C
EN
TR
O
-N
S
---~
o.oLI-----J------L-----~-----L----~~--~
0.0
0
.5
, .0
,
.5
2.0
2
.5
.3.0
P
ER
IOD
. sec
Fig
. 5
.3
Co
mp
aris
on
of
Ela
stic
Res
po
nse
S
pectr
a f
rom
th
e
1940
E
l C
entr
o
and
198
5 V
ina
del
Mar
R
eco
rds
(Dam
ping
F
acto
r =
0
.02
)
\0
CfJ

Vin
e
de
l M
ar
S20
W
EI
Airr"~f"ldr'QI
S4
0E
1
0 •
1
0 •
~=5~
Cy
=O
.1
1 ~=5~
Cy
=O
.1
Cy
=O
.2
Cy
=O
.2
Cy
=O
.3
Cy
=O
.3
~
Cy
=O
.4
>..
\ C
y=
O.4
C
y=
O.5
.-<
::: :;:
; :;:
:; u
U
::J
::J
o 1
0
o 1
0
.....
+-'
C
C
Q
) Q
)
E
E
Q)
<l)
(,
) (,
)
0 0
D..
a..
(Il
Ul
0 0
1 1
0.0
0
.5
1.0
1
.5
2.0
0
:0
0.5
1.
0 1
.5
2.0
P
eri
od
(s
ec)
Peri
od
(s
ec)
Vin
a
de
l M
ar
N70
W
EI
Alm
en
dra
l N
50
E
\0
10
•
10
•
\0
~=5%
Cy
=O
.1
~
~=5%
Cy
=O
.1
Cy
=O
.2
Cy
=O
.2
Cy
=O
.3
Cy
=O
.3
~
Cy
=O
.4
g C
y=
O.4
C
y=
O.5
C
y=
O.5
:;:
; :;::
::; (,
) (,
) :::
:I :::
:I
Cl
10
C
l 1
0
--.-
c s:::
(j
) <
l)
E
E
Q)
Q)
u u
0 .2
D
.. 0
...
CIl
Ul
0 0
1 1
0.0
0
.5
1.0
1
.5
2.0
0.
'0
0:5
1.
'0 1
:5
2:0
P
eri
od
(s
ec)
Pe
rio
d
(se
c)
Fig
. 5
.4
Ela
sto
-Perf
ectl
y P
lasti
c
Resp
on
se
Sp
ectr
a
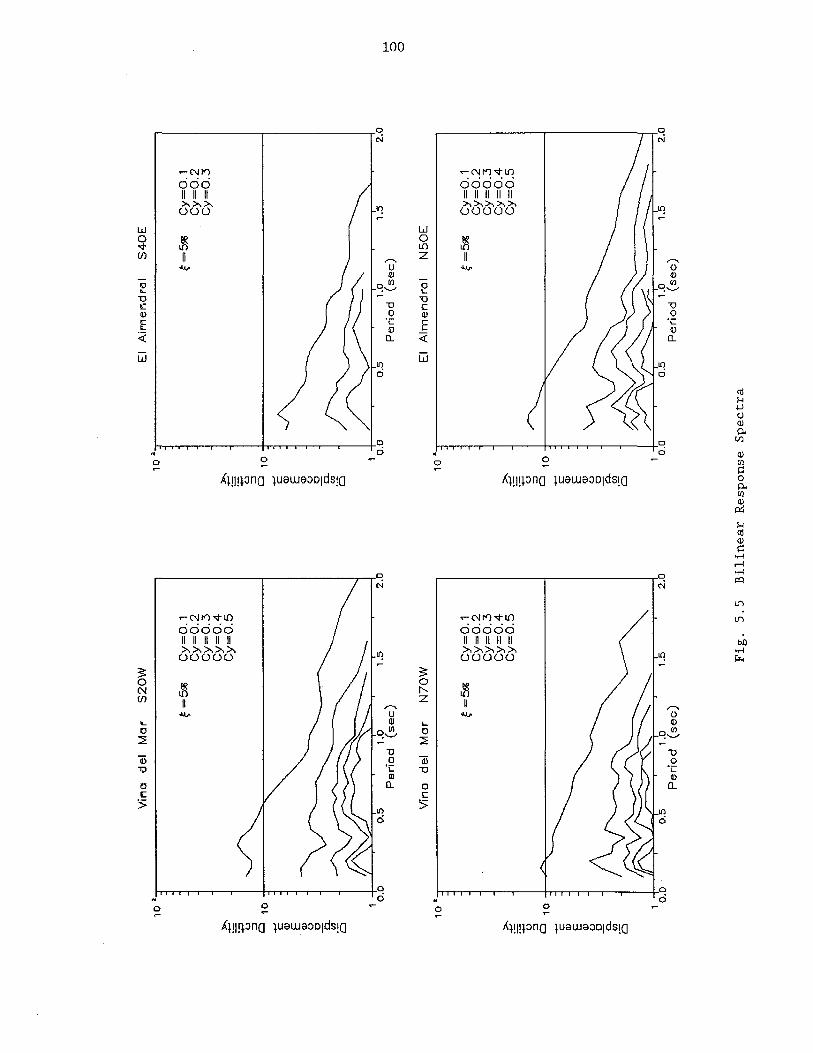
Vin
CI
de
l M
ar
S2
0W
E
I A
irTH
H",d
ra
l S
40
E
10
'
10
~
~=5~
Cy
=O
.1
1 ~=5~
Cy
=O
.1
Cy
=O
.2
Cy
=O
.2
Cy
=O
.3
Cy
=O
.3
>-C
y=
O.4
:>
, ~
Cy
=O
.5
~
:;::.;
:;::.;
u (j
:::I
::J
o 1
0
o 1
0
.... .....
. c
c Q
) Q
)
E
E
Q)
Q)
(.)
<.)
0 0
15..
15..
~ ~
v.o
CIl
(5
(5
I -
~
1 I
' -r
)
=
I 1
, i
i ,
i ,
i ,
i ,
0.0
0
.5
1.0
1
.5
2.0
0
.0
0.5
1
.0
1.5
2
.0
Peri
od
(s
ec)
Peri
od
(s
ec)
I-'
0 0
Vin
o
de
l M
ar
N70
W
EI
Alm
en
dra
l N
50
E
10
•
10
•
~ =5
91;
Cy
=O
.1
~=5%
Cy
=O
.1
Cy
=O
.2
Cy
=O
.2
Cy
=O
.3
Cy
=O
.3
g C
y=
O.4
»
Cy
=O
.4
Cy
=O
.5
~
Cy
=O
.5
:;::.;
:;:::;
(.)
(.)
::::I
:::I
o 1
0
Cl
10
.....
--
c c
Q)
Q)
E
E
Q)
Q)
u (j
..!2
.2
0..
0
..
III
Cfl
(5
~
Ci
I 1
i 0
:0
0:5
1.
0 1.
"5
2.0
1
.5
2.0
P
eri
od
(s
ec)
Fig
. 5
.5
Bil
inear
Resp
on
se
Sp
ectr
a

Ine
lasti
c
Re
sp
on
se
S
pe
.oir
o
-EI
C
en
tr·c
N
S
Ela
sti
c-
Pe
rfe
ctl
y
Pia
sti
c
10
'l \
~=5%
Cy
=O
.1
Cy
=O
.2
Cy
=O
.3
>,
~ \
Cy
=O
.4
~
Cy
=O
.5
+- u ::::J
o 1
0
......
C
<lJ E
<lJ
U
00
a.
(IJ
0
1 0
:0
0.5
1
.0
1.5
2
.0
Pe
rio
d
(se
c)
t-'
0
Ine
lasti
c
Re
sp
on
se
S
pe
ctr
a
EI
Ce
ntr
o
NS
t-
' -
Bilin
ea
r 20
9b
Str
ain
H
ard
en
ing
10
.~
~=5%
Cy
=O
.1
Cy
=O
.2
Cy
=O
.3
>,
~ C
y=
O.4
~
------
-. C
y=
O.5
:;:
:; ()
::::J
o 1
0
-C <lJ E
<lJ
U
0 a.
(Il
CS
1 0
:0
0:5
1.0
1.
"5
2:0
P
eri
od
(s
ec)
Fig
. 5
.6
Inela
sti
c R
esp
on
se
Sp
ectr
a f
rom
th
e
19
40
E
l C
entr
o
Rec
ord

.P
.U) c <J)
-&
--'
C
0.6
0
0.4
0
-
0.2
0
-
/ {
/ t'
I
/
J I
/ I
I ./
/ I
I I
r (
/
" I
/ ~ ,
I'
I ,~
-'
/ , :
/ /
" /
I ,
/
: V
I
I ./ r
/
--..
.---
.-
-------
Vin
a
de
l M
ar
S2
0W
V
ina
d
el
Ma
r N
70
W
EI
Ce
ntr
o
-0
.33
9
, ;J
0.0
0
I' i
--
I I
I I
I 0
.0
20
.0
40
.0
60
.0
80
.0
10
0.0
T
ime
(sec.)
Fig
. 5
.7
Ari
as
Inte
nsi
ty v
ers
us
Tim
e 12
0.0
,....
o N

103
OEL PAC\f\CO TORRES
ACAPULCO
PLAZA OEL MAR
TORRES 0 EL SO\...
fig. 6.1
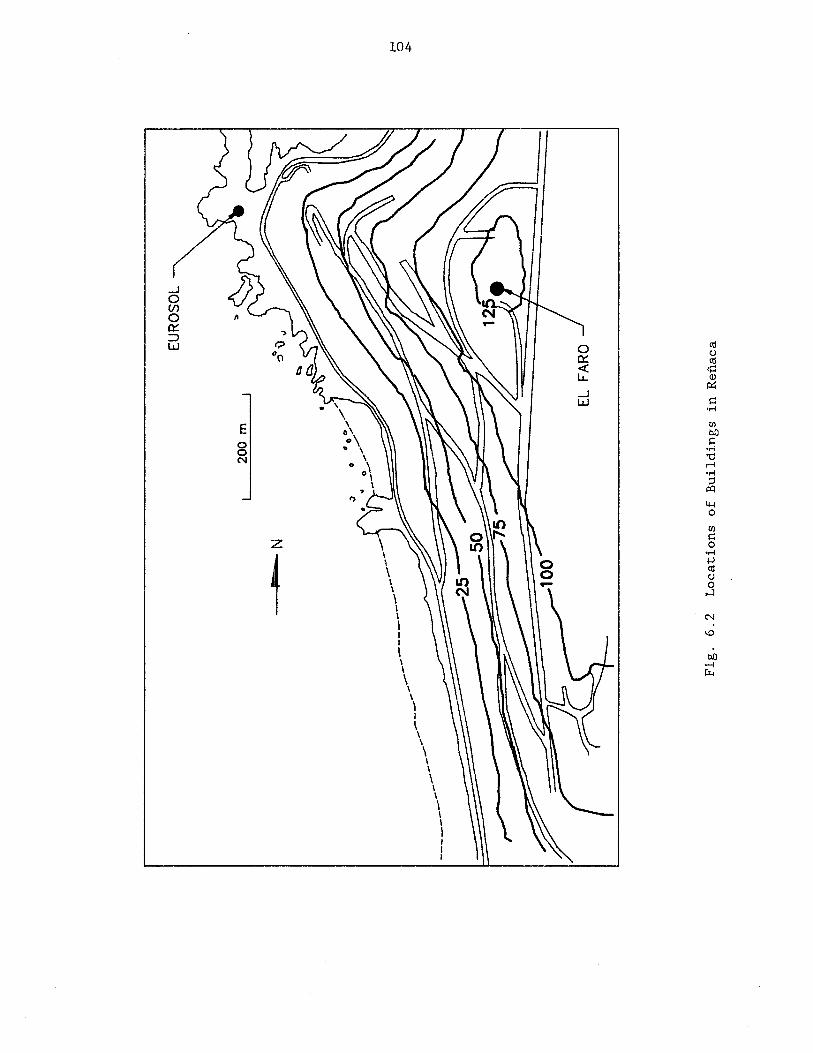
...J o (/)
o ~ ::J W
E g N
z
1 \ \ \
104
\ \ \ \ I I I I I I \
\ \ I
\ \
\ \ \ \ \ \ \ \
I I I I

105

106
II Z--

107
'f-- 768.75 -t- 768.75 ~ 15
14
13
12
11
10
t=20 9
8 15 @ 275
7
6
5
4
3 --b-------"1==~t_t ------~-
2 "t=25
1 _______ ~~~ &.-.1,;---'1.. ______ _
lS 295 t=40 -t
2S 350
J. DIMENSIONS IN em.
ACAPULCO ELEV ATION AXIS Q) - 0
Fig. 6.5 Elevation - Acapulco

108

109

t z
I
llO
H o o
r-1 rz..

111
Story No.
17
0 DO 16
0 0 DO 0 15
0 0 0 0 0 14
0 0 DO 0 13
0 0 0 0 0 12
0 0 DO D II
0 0 0 0 0 10
0 0 DO 0 9
0 0 0 0 0 8
0 0 DO 0 7
0 0 0 0 0 6
0 0 DO 0 5
0 0 0 0 4
0 0 0 0 0 3
0 0 0 0 2
ground level
C WALL
Fig. 6.9 Elevations - Hanga-Roa
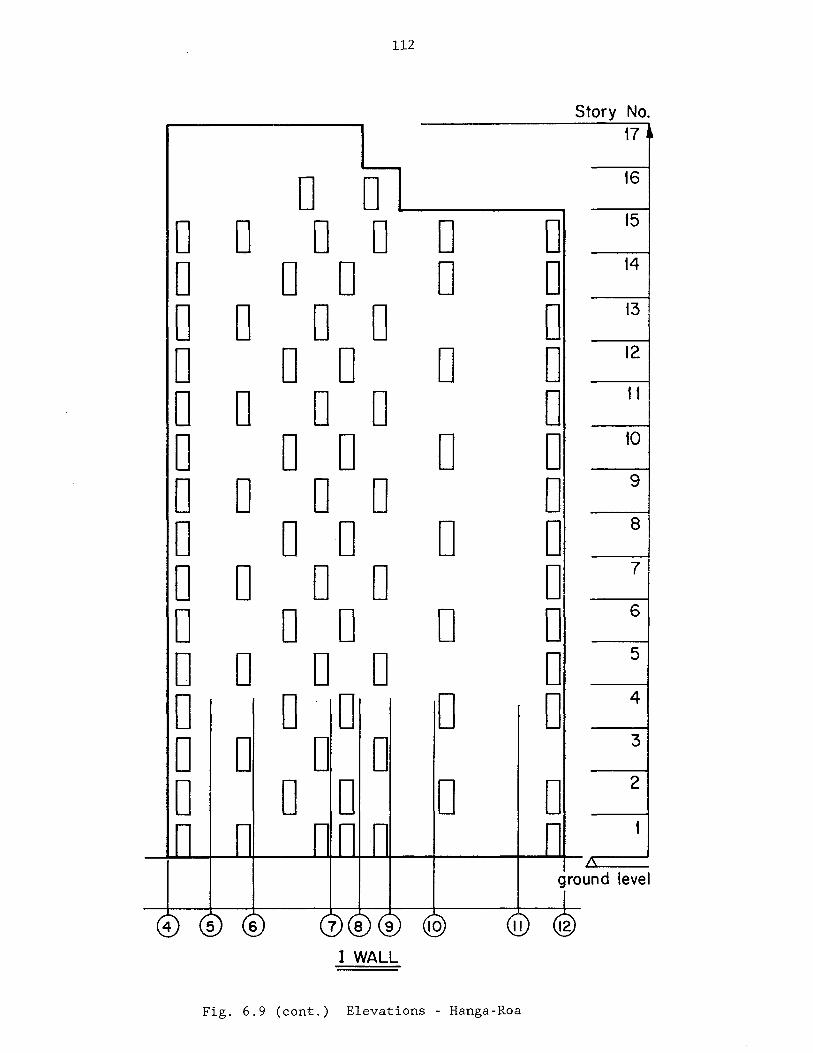
112
Story No. 17
D 0 16
0 0 0 0 0 0 15
0 0 D D 0 14
0 0 D 0 0 13
D D D D D 12
0 0 0 0 D II
0 0 D D 0 10
0 0 0 0 0 9
0 0 D D D 8
0 D 0 0 0 7
0 0 0 0 D 6
D 0 D 0 0 5
D 0 D D D 4
D 0 D 0 3
D 0 0 D 0 2
I WALL
Fig. 6.9 (cont.) Elevations - Hanga-Roa

CO
LLA
PS
ED
LI
NTE
LS
~
~
C?~S
P ~
~
I~ 0 ~r07X/\ 7
01
-11
\ flO
II;
--Y-
-. k/
/~/\
D Jk
I
X
--'H
u
i//D
x'f
f ><X~
u-/
f\
\xD
x -:j<
~ X
D
lXtJ7
Y d:x~ X~/ d
""(
D })
( ?
tf X
x
X[f;(
/,tD ?
f< ~
Xix
)} 0
IT ~ x'
D)(
~ ))
( D
\'L
*b ~ O
f I~
;J*
0
u~
X I ~ b
J\ I
X x
0
?<Jt 1-
U
0 (;(
r rP6
< D
/
U \
K' 0 ~
0';J
f\ D
! "-~tfr 11--~r rX~Y'D
-/
b rW
~ 1
1'< 0
~ I
J 'f 1
: 'f 0
GE
NE
RA
L C
RA
CK
ING
(T
YP
ICA
L)
Fig
. 6
.10
O
bse
rved
Dam
age
-H
ang
a-R
oa
[6]
VE
RTI
CA
L C
RA
CK
S
IN
CU
RV
ED
W
ALL
AN
D
HO
RIZ
ON
TAL
CR
AC
KS
IN
S
LAB
f-
' f-
' W

114
.-I
.-I
\0
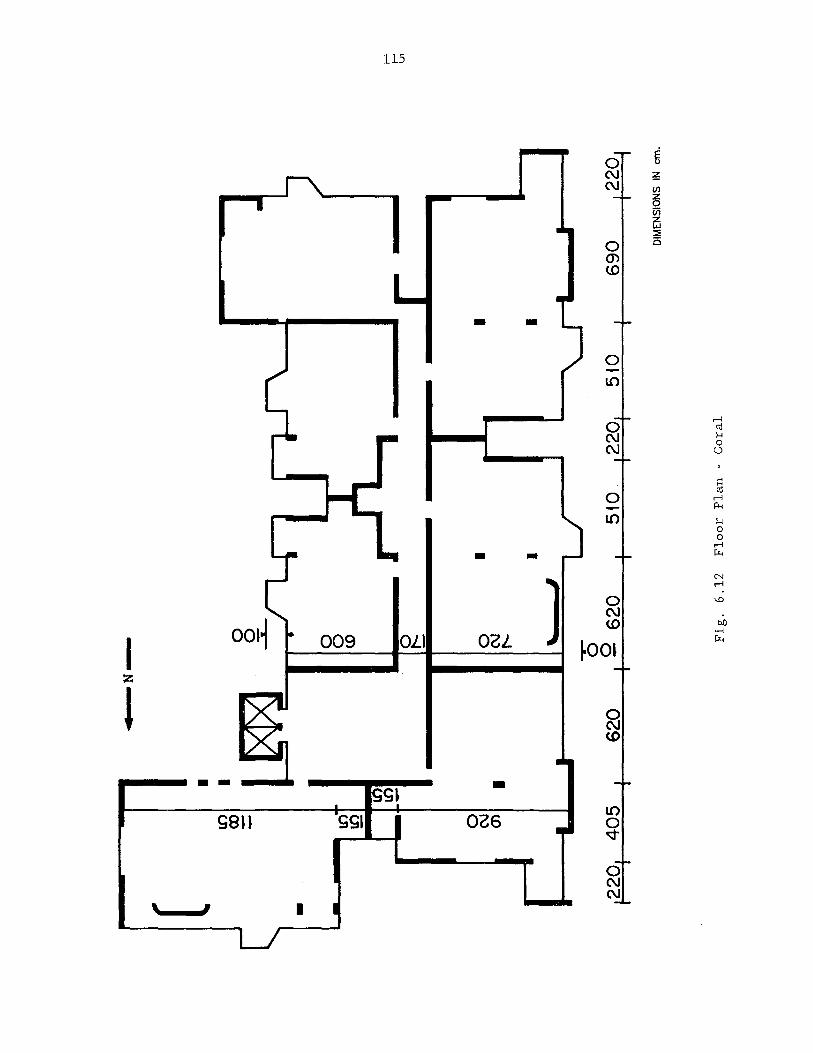
115
E 0
~ en z 0 iii z w ::;
0 0
en (0
- -0 l!)
r-1 <Il H 0
<:..)
I::! <Il
0 r-1 p...
l!) H 0 0
r-1 - - ~
N
] r-1
0 '-" C\.I (0 b.O
.,-4
I 009 OLI 02L ~OOI ~
z
1 ~ (0
• - SS~ -026
l!)
S8B SSI 0 ~
, , •

116
Fig. 6.13 Tahiti

117

f 73
1 ~ 3
72
~
601 ~ 30
6~
64
0
l' 30
6~
601 ~ 3
72
~
7S1
l' I-
lSS
170 4=
r---
----
--,
I I
---..
....
. ---
----~----
32
6
-i-
III
2t1~
III
III
__
__
_
~ i
3/)=;
;;--
J-H
'-"
II
I II
I II
I
----
r---
---
-.......
. ---
I I
L_
_
~
• N
-
II II II II
FEST
IVA
L
FIR
ST
FLO
OR
Fig
. 6
.15
F
loo
r P
lan
-
Fest
ival
.i!
. II
,n
II
==
__
+:
1 __
=
-ll
20
TYP.
-, I I I I I
=__
I
:-f-nl
l
;HO-~P' iii-
" I
i
".
! I I 111
1 II
t<D
3
36
-r 62
2
~
37
7
~
DIM
EN
SIO
NS
IN
em
.
I-'
I-'
<Xl

119
t
85 609
FESTIVAL ELEVA TION AXIS ©
Fig. 6.16 Elevation - Festival
14
13
12
11
10
9
8 13 e 265
7
6
5
3
2
1
18
28
280 ---It I-- ELEV. -40
375
--+ 320 , DIMENSIONS IN em.

120
Fig. 6.17 E1 Faro (a) After the Earthquake [49]

121
o HO tIlN
r.... r-I ~ til 0
• ..-1 .IJ
r-. • ..-1 r-I
.IJ 0 .:: s:: o Q) ()Q
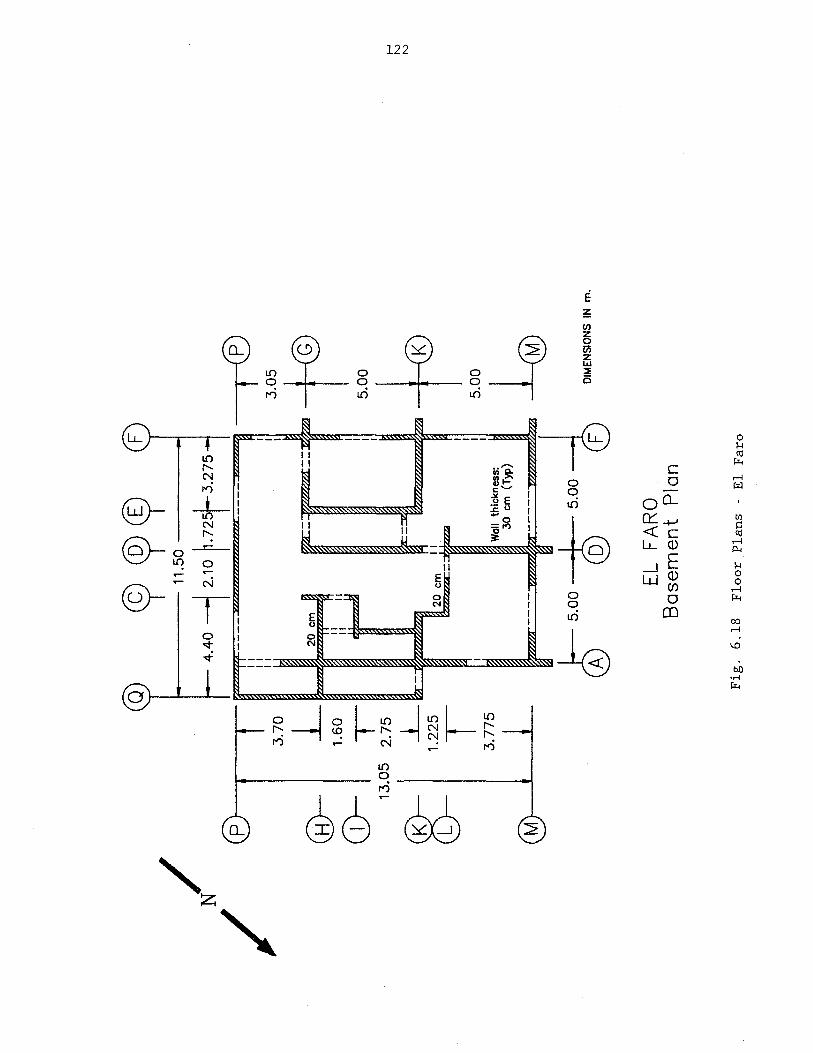
N/
/ 3
.70
@-
L CD
-1.
60
,-13
.05
2.7
5
~
L 1.
225 I 3
.77
5
M)
, ,
~ ~~
I-11
.50 -----I
4.4
0 -
-\2
.10
11.
725!
--3.
275
t®
3.0
5
20
em
II
II
II
r 5.0
0
~/H~
I (K
5.0
0
Wal
l th
ickn
ess
: ~ ~
30 e
m
(TW
) ~
----
----
----
-~.
EL
FAR
O
Ba
se
me
nt
Pla
n
Fig
. 6
.18
F
loo
r P
lan
s -
E1
Far
o
I-'
N
N

N/
© ®12~---
/
2.75
t ~r=t=
~ l!
J?al
taa2
2?l?
????
????
????
???a
~ t-
' N
1.22
5 "
w
L 12
.70 II
==r
3.77
5
@-I
t-~
~ W
all
thic
knes
s:
20
cm
(T
yp)
2.70
J D
IME
NS
ION
S
IN
m.
EL
FAR
O
Flo
or
Pla
n -
Typ
ica
l S
tory
Fig
. 6
.18
(c
on
t.)
Flo
or
Pla
ns
-E
l F
aro

8 @ 2.62 5
2.20
t 3.00
L
124
~
\
~~~ ~~~ ~~~ ~~~ ~~~ ~ ~ C8:J ~~~ 18II:8J
~ I:8J
~9.35~ ~ ~ cbdD
EL FARO ELEVATION ®
Fig. 6.19 Elevations - El Faro
S· S
TS
6· S
5· S
4· S
3· S
2· S
1· S
l8J ~ DIMENSIONS IN m.

3.20
L 2.00
!
125
1><1 1><1
I----60~ DIMENSIONS IN m.
@ ®® ([) EL FARO
ELEVATION @
Fig. 6.19 (cont.) Elevations - El Faro

12
.70
1-
12.7
0 .1
Bo
th
Clo
set
#1
Utn
lty
Bo
th ~Clo .. t
~
JUla
.-tI
I . ~;;;
#2
-#3
r ..
. B
oth
DIM
ENSI
ON
S IN
m
.
EL
FAR
O
Typ
ical
A
rch
ite
ctu
ral
Pla
n
Fig
. 6
.20
A
rch
itectu
ral
Pla
n
-E
l F
aro
t-'
N
0\

127
Fig. 6.21 Observed Damage - El Faro [49]

128
N N
\.0

Fig
. 7
.1
Rein
forc
ed
C
on
cre
te B
uil
din
gs
alo
ng
th
e
Bea
ch in
Vin
a
del
Mar
(le
ft
to
rig
ht:
T
orr
es
de
Mir
amar
(2
),
Tah
iti,
C
ora
l,
Mari
na R
eal,
T
orr
es
del
So
l,
Han
ga-
Ro
a,
Acap
ulc
o,
Pla
za d
el
Mar
)
r-'
tv
\D

130
Fig. 7.2 Plaza del Mar
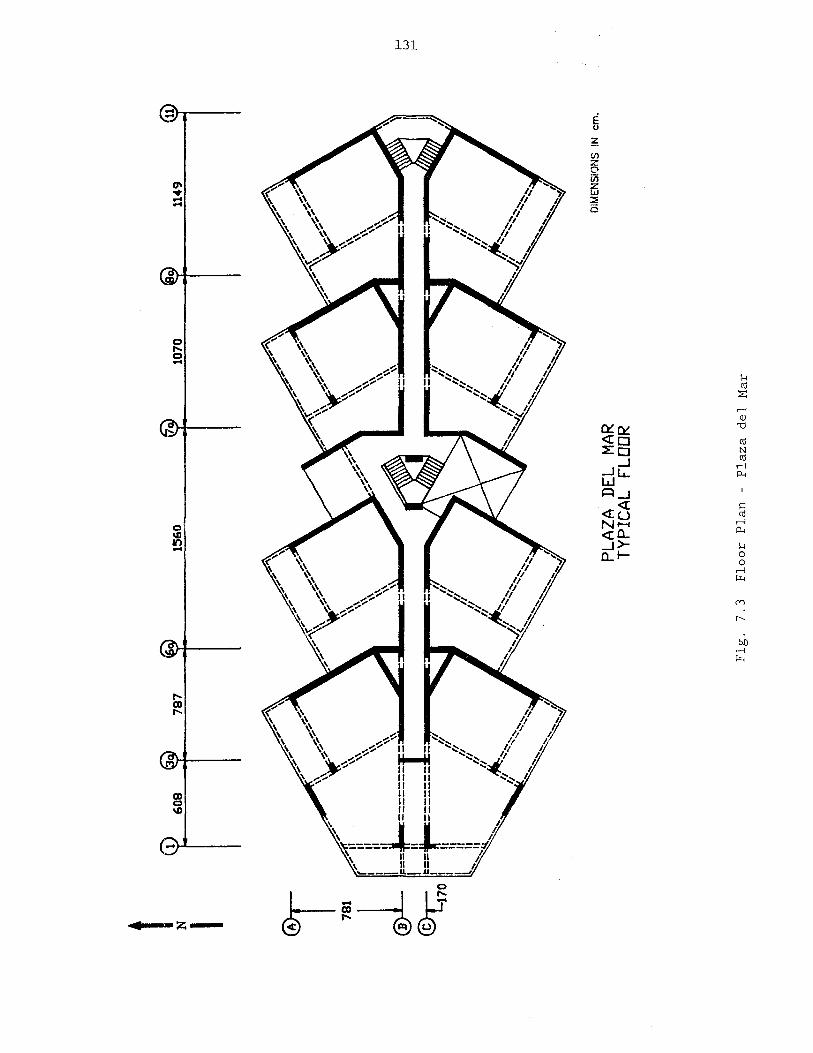
t N
78
7
I i 781 J- ~o
~
...,
~ ~'"
\\
~
\¥
\~\
......
-II
\~
\ -r'"
II
\\
II
~~"",,
"~c~~ .
... ..c
i
U
---==
==1-
\~\ «
· ~-=~---
I -~I
I _===
=== =
" •
_ 1:=
= _
II
I "
I II
"
I II
"
I 'I
1
/ l
II
" . "
" II
1
/
""""~"
4-
'~""-
II~"
II
'~" "'~
Fig
. 7
.3
1560
PLAZ
A DE
L TY
PICA
L MA
R FL
OOR
Flo
or
Pla
n
-P
laza d
el
Mar
1070
11
49
11
DIM
EN
SIO
NS
!N
em
.
I-'
W
I-'
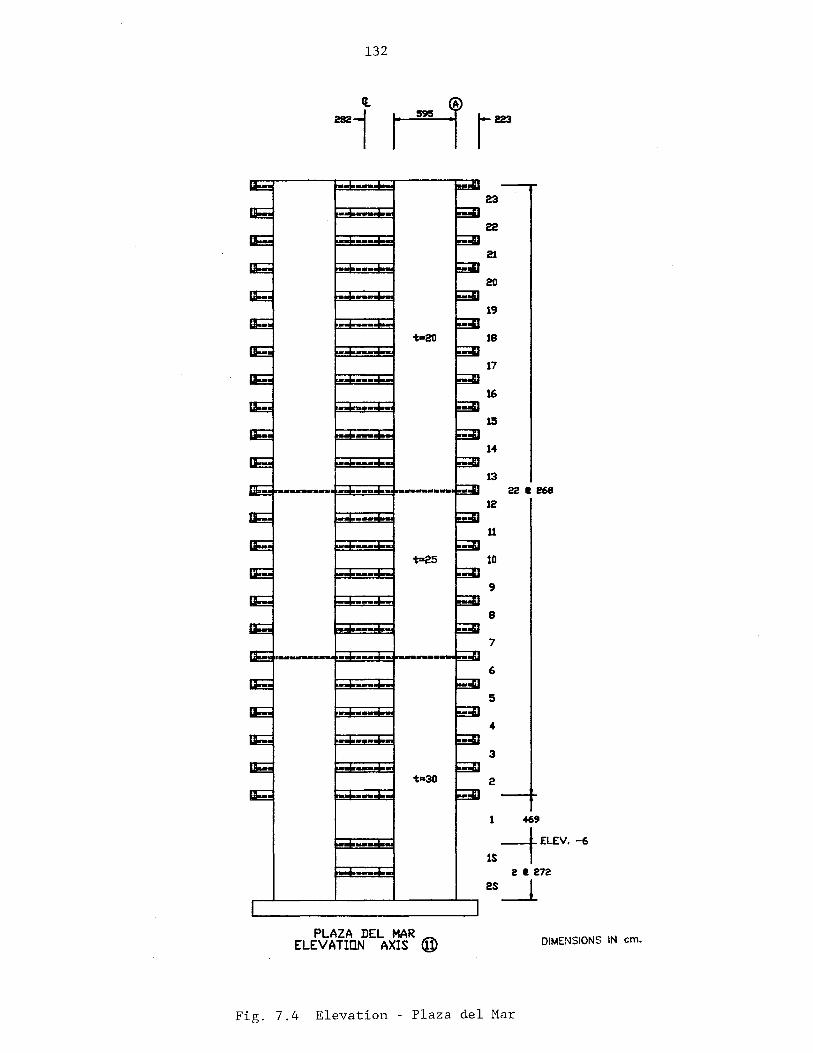
132
23
22
21
20
19
'too2O 18
17
- --16
15 -- -14
--- -13
22 I 268 12
--- U
't-25 10
9
8
7
6
5
4
3
't"30 2
1 469
is --tELEV. -6
2 I 272
2S~
PLAZA DEL MAR ELEVA TlaN AXIS @ DIMENSIONS IN em.
Fig. 7.4 Elevation - Plaza del Mar
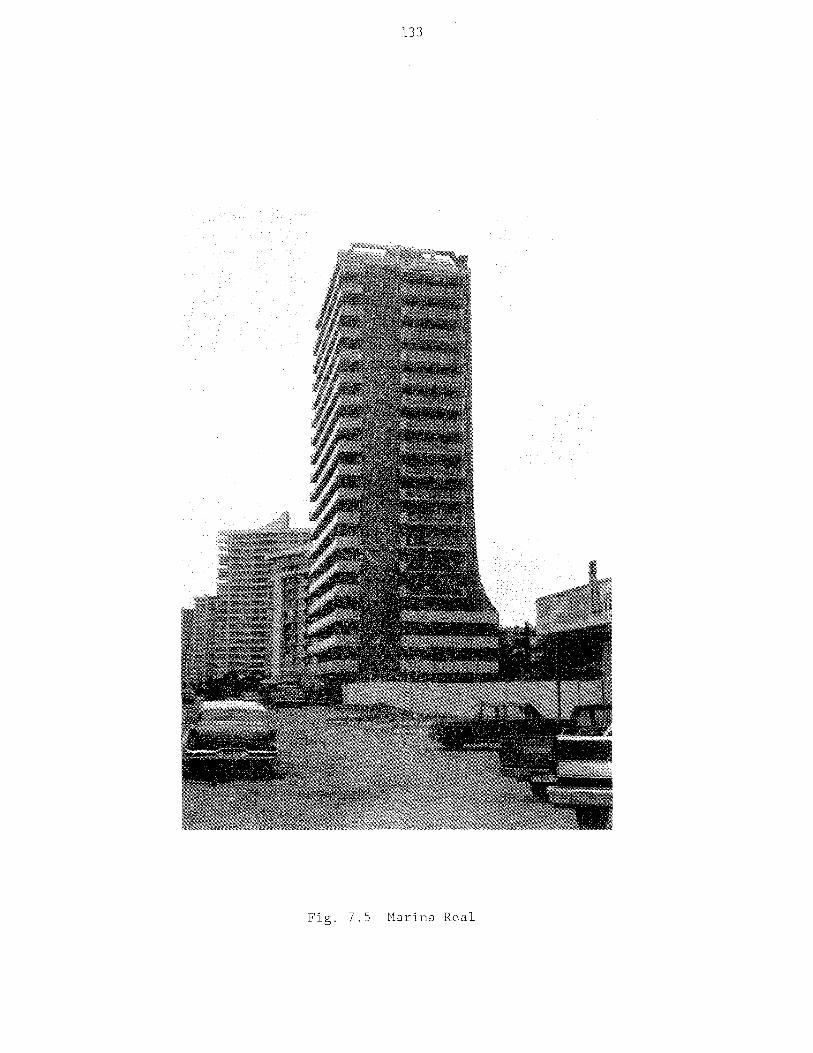
133
Fig. 7.5 Marina Real
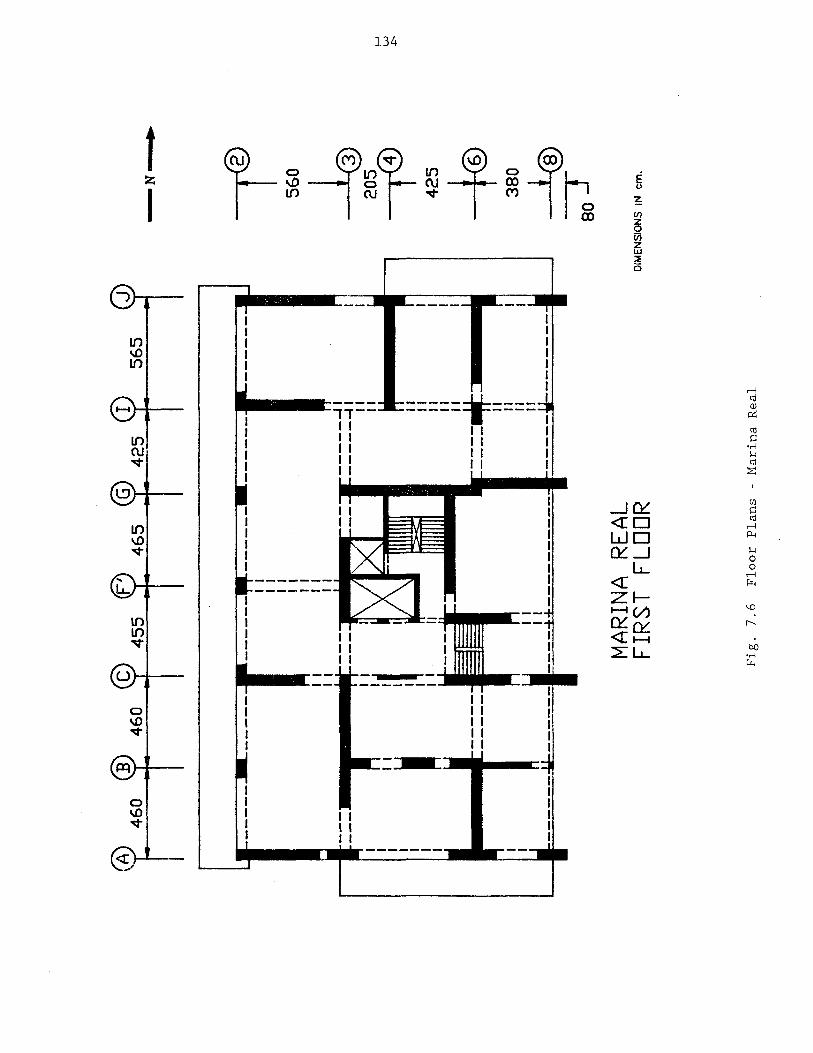
~ 12
t r
12 :
46
0
_ 4
60
4
55
_
46
5
I I
I I
1 1
1 I
I I
1 1
I I
1 I
1 I II
• II
I I
! ~ ~
I I
~ -----
Ifij
---
r---
---.
.... --
----~ _
:..=-=-~
±:z:I.:z
:l======
MAR
INA
REA
L FI
RST
FL
OO
R
42
5
------J
I
------1
1
II
II
II
II
II
II
II
56
5
==
==
-If=
---
II
II
II
II
Fig
. 7
.6
Flo
or
Pla
ns
-M
ari
na R
eal
-N
•
7 560
~
205
to
42
5
-i®
380
~
80 ]
DIM
EN
SIO
NS
IN
em
.
f-'
W ~

fA)
®
CcJ
lfi)
©
m
(j
) y
460_~
_ 46Q~ __
45
5
::c_ 4
65
_ y
_ 42
5 ~
56
5 ~
,---T -
--l--
-T
-----,-
---1---,
r---rr
II
I~
II
I I I II
I I
-==
==1=
=41:=
=1
((
((
II
II
II
II
II
__
_ -
__
U _
__
_ L
L _
__
__
__
_ _
II
====
=::11
II
II
II
II
II
II
II
II
MA
RIN
A
RE
AL
FLO
OR
S
4)
5)
6)
7)
&c
8
Fig
. 7
.6
(co
nt.
) F
loo
r P
lan
s -
Mari
na R
eal
-N
•
~
560
~
205
~
42
5
~
[ 28
0
DIM
EN
SIO
NS
IN
em
.
f-'
W
lJl
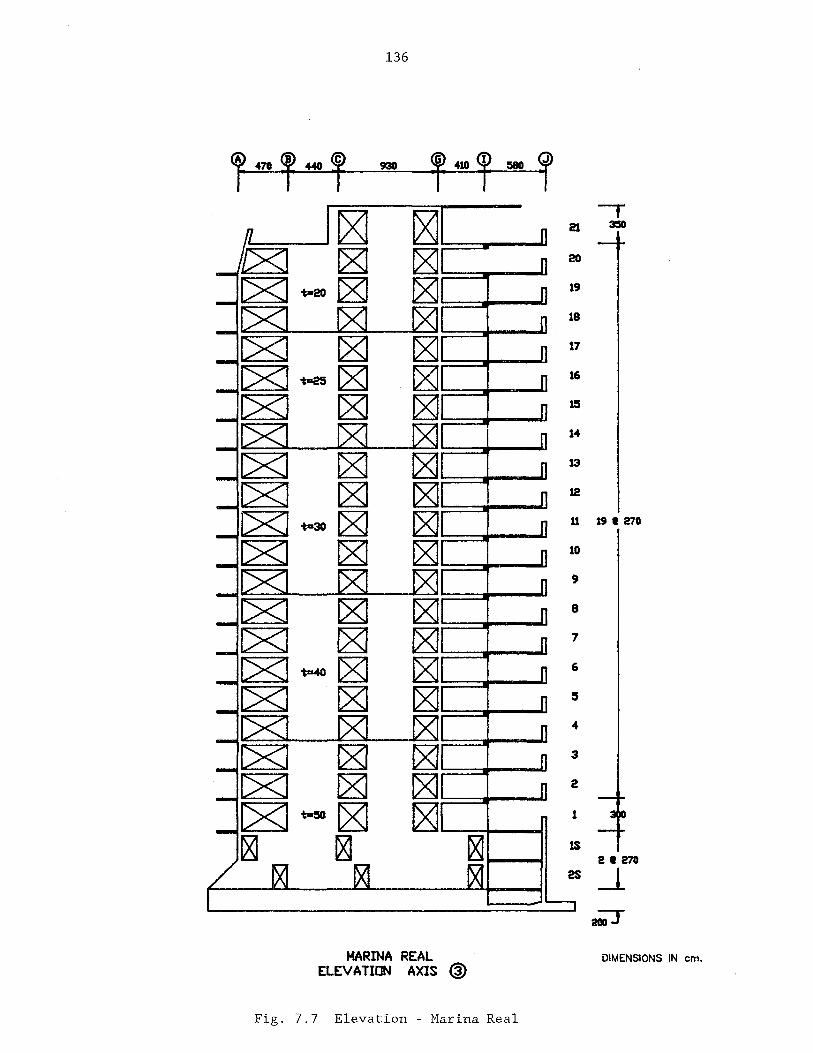
136
MARINA REAL ELEVATION AXIS ®
Fig. 7.7 Elevation - Marina Real
t 21 3:50
20
19
18
17
16
13
14
13
12
11 19 t 270
10
8
7
6
3
2
1
2 t 270
2S-.l
DIMENSIONS IN em.

137
Fig. 7.8 Torres de Miramar
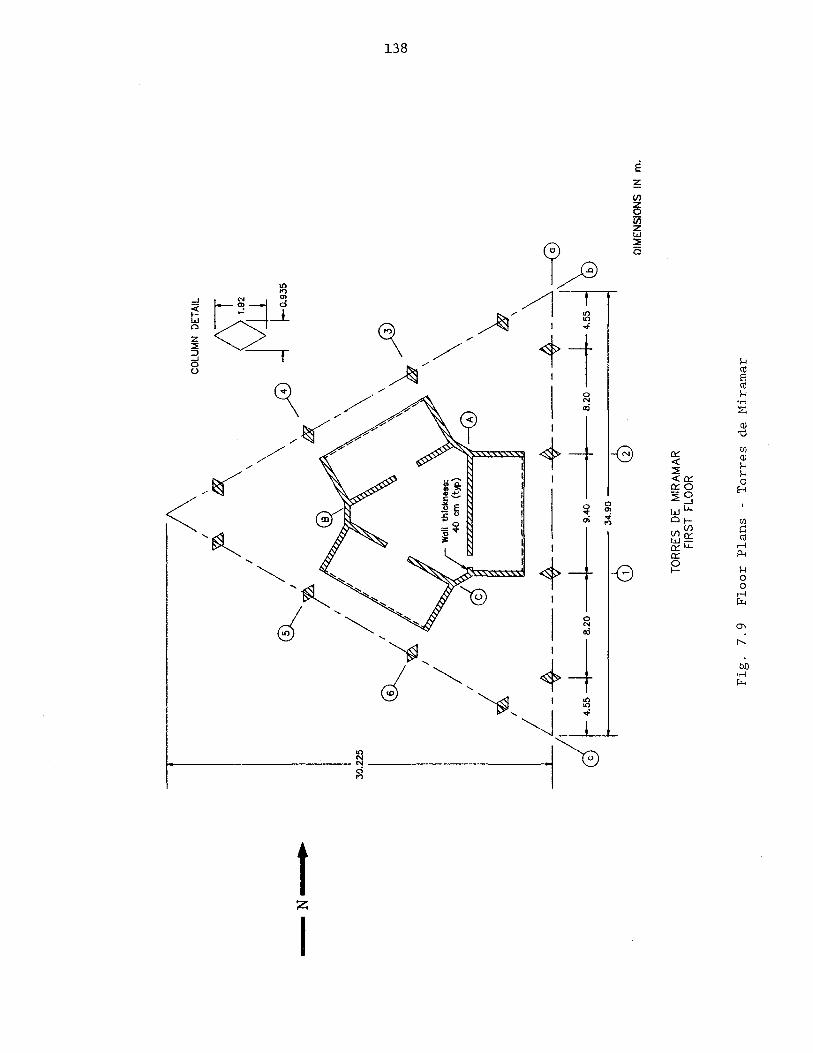
-N
•
30.2
25
I
I
/\
, \
? ~ \
\fl
~ \ .\
CO
LUM
N
DE
TAIL
M~
J ~9~
')yfl
Wal
l th
ickn
ess:
4
0 c
m
(t}'P
)
TOR
RES
D
E M
IRA
MA
R
FIR
ST
FLO
OR
, \
Fig
. 7
.9
Flo
or
Pla
ns
-T
orr
es
de
Mir
amar
, ~ \
I
DIM
EN
SIO
NS
IN
m
.
t-'
W
CIJ
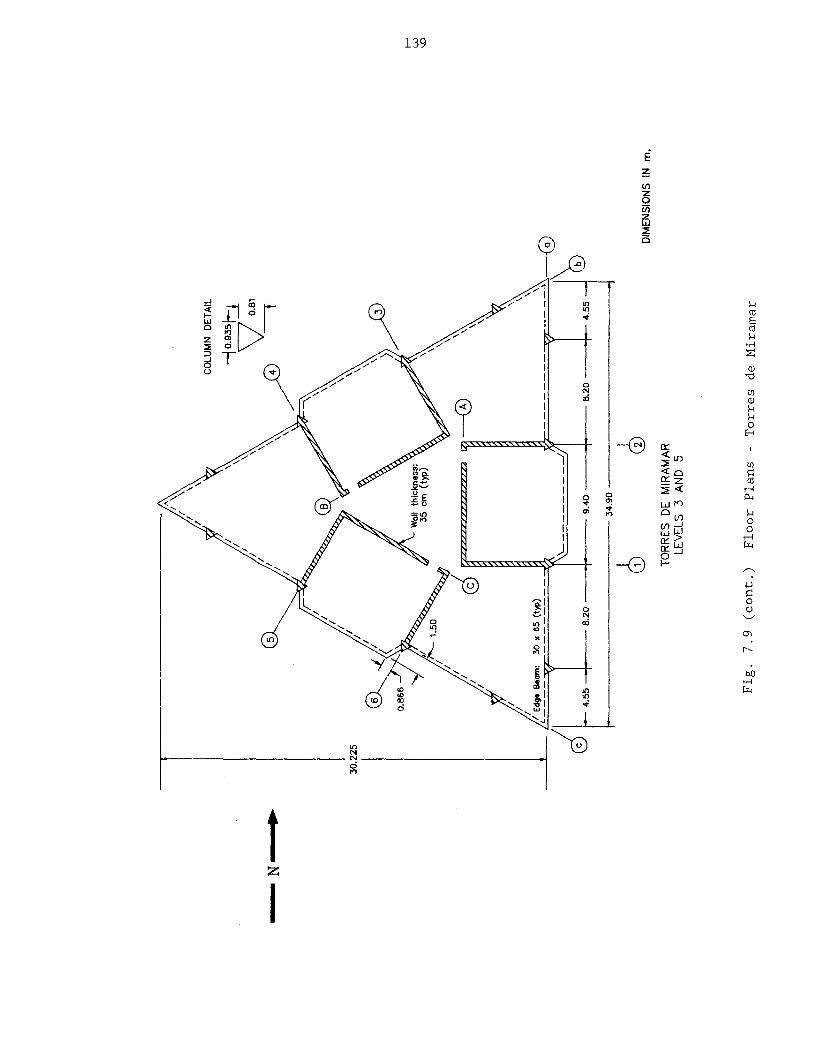
-N
•
30
.22
5
~ C
(ZZ
llZ
IZZ
ZZ
ZZ
lzZ
ld
CO
LUM
N
DE
TAIL
--I0 .9
35b
i<) V
~8'
/'~
-,
-0
'\ "
~
\ ---'~
!~~':. ~eam:
30 x 65_~
2 --~===
='=':===
~I c.=---
-~I~
'l I
B.2
0 • .
• 4
.55
~ c
_.
B.2
0
~55 cb
3<
.90
cb
TO
RR
ES
D
E
MIR
AM
AR
LE
VE
LS
3 A
ND
5
Fig
. 7
.9
(co
nt.
) F
loo
r P
lan
s -
To
rres
de
Mir
amar
DIM
EN
SIO
NS
IN
m
.
I-'
W ""

21° S
20° S
19° 5
18° S
17° S
16° S
15° S
14° S
13" S
12° S
1,° S
10° 5
9° S
8° 5
7"S
6° S
5° S
4° 5
3"S
2° S
1° S
1° B
140
ELEV. 55.91
....
=:
-
=,
19 02.55
-
-
...:'
F==== i=-----~= -------- I=-----~= ===,,;;; 2.72
2.89
3.20 t '"' 30 ""v/"'" 'Y///,"" ELEV. 0.0
======== F======== ======== 2.80
_..--__ +-_L-I __________________ --.l1 ELEV. -6.00
1.00 f------------ 34.90 ------------1./
TORRES DE MIRAMAR
ELEVATION @
Figo 7010 Elevations - Torres de Miramar
DIMENSIONS IN m.
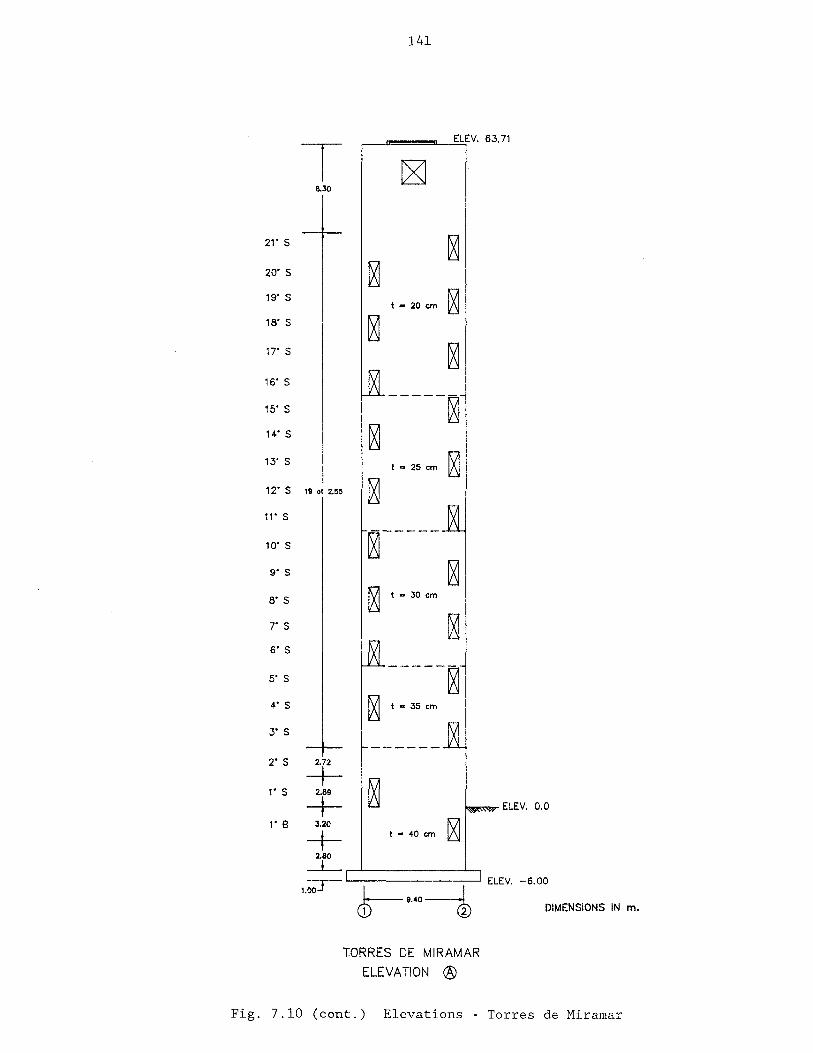
141
T r---u!===t..--.J:E~LEV. 63.71
8.30
21· S ~ 20· S ~ 19· S ~ t - 20 em
18· S ~ 17· S ~ 16· S
15· S -----0 14· S ~ 13· S
t a 25 em ~ 12· S 19 .t 2.55 0 11· S
10· S ~-----
9· S ~ 8· S ~ t - 30 em
7· S ~ 6· S
S· S -----0 4· S ~ t • 35 em
3"S
------2· S 2.72
-+-~ 1· S 2.89
-+- ELEV. 0.0
1· B 3.20
~ -+- t "' 40 em
2.80
....L-ELEV. -6.00 1.;::r- r e
.40-i DIMENSIONS IN m.
TORRES DE MIRAMAR ELEVATION ®
Fig. 7.10 (cant.) Elevations - Torres de Miramar

142
Fig. 7.11 Torres del Pacifico (Towers 2 & 3)

CO
LUM
N
DET
AIL
I:-J~
'Lu'
\ N \
'I
'I
'I 'I 'I \\
@
®.--."
'~
/ "
9.~
,,~
@@
>~
/ /~~
fI _
/ ,/
'/
\.-@
---
-~/
,/
---/' --
u--
-,(;
) 2.
825
J II II
II
j II
II
Ii Ii
j j
j t 1
3" !i
~
11.6
05
~~\ ,\1
~ "
---.
J '"
, --
-<\. ,
\ ----
-(b.--
-----
I 'M
~
'~ .,
~'--
... fj
Y
\ ~/
F I
".
I.!.
) Y
\ ,,
,, ~
'£"
®
E
J@
Fig
. 7
.12
TOR
RES
D
EL
PA
CIF
ICO
FI
RS
T FL
OO
R
Flo
or
Pla
ns
-T
orr
es
del
Pacif
ico
DIM
ENSI
ON
S IN
m
.
i-'
+>
w

\ N
CO
LUM
N
DE
TA
IL
Ir--J~
1'~VJII
Lr-
,."
\ r
WaU
th
!cIa
1 ...
..
, 30
em
(t~
)
~----~-------~~3----~------------~
7,31
6.
46
7.46
=1
©
cl; E
@
TO
RR
ES
D
EL
PA
CIF
ICO
FL
OO
RS
3
, 4
, &
5
,(1
) 2.
825 1@ 9.
6O!S
J@ DIM
EN
SIO
NS
IN
m
.
Fig
. 7
.12
(c
on
t.)
Flo
or
Pla
ns
-T
orr
es
del
Pacif
ico
I-' ~
~

17' S
16' S
15' S
14' S
13" S
12' S
11' S
10' 5
9' 5
8' 5
rs
6' 5
5' S
4' S
3"5
2' S
l' 5
l' B
2' B
145
ELEV.46.72
-=
17 al 2.62
6.-F~':--=-~ ======= 2.. I I t = 40
~======
t-ELEV.O.O
~========= ~===== 2.88 I
1- d
======;;:= t-1.00 1.,--------------------1" ELEV. -5.50
r- 1-1.--------28.273 ---------1
TORRES DEL PACIFICO
ELEVATION ®
cO
Fig. 7.13 Elevations - Torres del Pacifico
DIMENSiONS IN m,

146
2 crt 2.82
ELEV. 45.82
17' S
16' S
15' S
t - 20 em 14' S
13' S
12' S
11' S
10' S
11 crt 2.82 9' S
~ t-",. 8' S
7' S
6' S
5' S
4' 5
t - 30 em YS
-----~--~---------2' S
l' 5
ELEV. 0.0 ~~""""'''''''
2.88
~ ~ t-40cm l' B 2.88
-t-2' B
ELEV. -5.50 ~--~~--~~----r-1 l--~"---------I....J 1.;T
C ~82---t DIMENSIONS IN m,
TORRES DEL PACIFICO
ELEVATION ®
Fig. 7.13 (cont.) Elevations - Torres del Pacifico

147
Fig. 7.14 Villa Real

148
Second Story Plan
....... -·N- - Indicales shear wall ovar story height
~"~~ Indicates beam at second level
First Story Plan
- Indicates shear wall over slory height
~,~,~ Indicates beam at first level
Fig. 7.15 Floor Plans - Villa Real
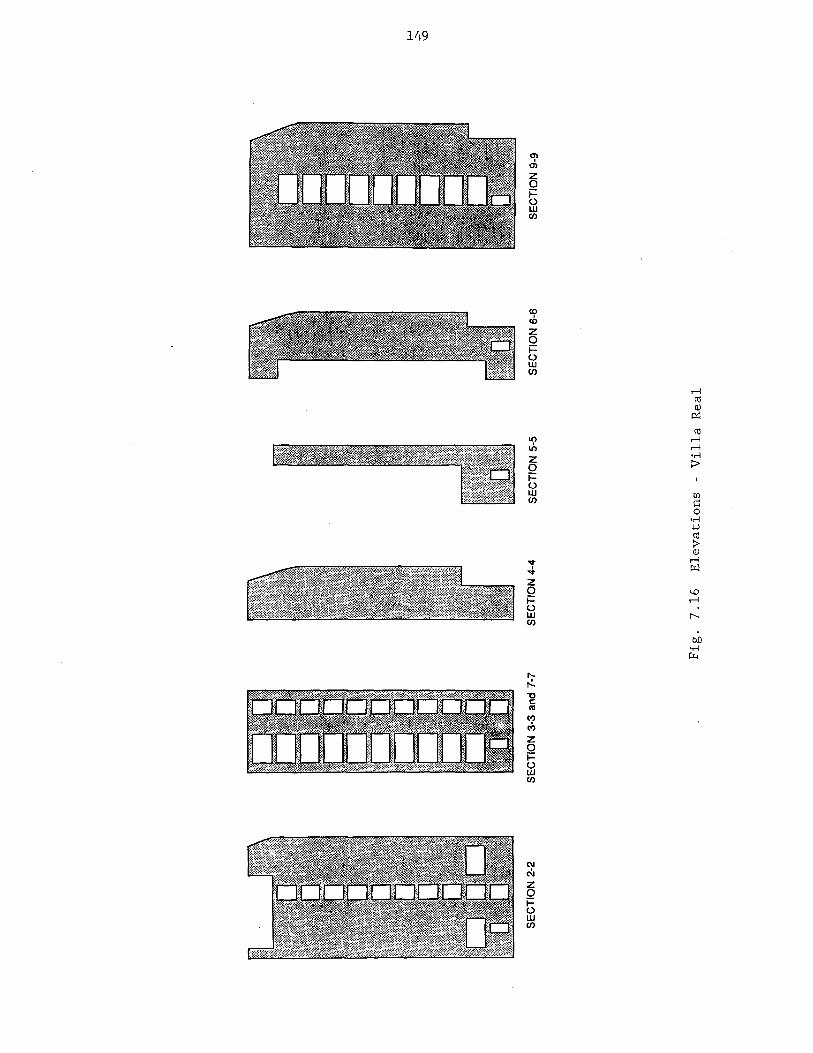
SE
CT
ION
2-2
S
EC
TIO
N 3
-3 a
nd 7
-7
SE
CT
ION
4-4
S
EC
TIO
N 5
-5
Fig
. 7
.16
E
lev
ati
on
s
-V
illa
R
eal
SE
CT
ION
6-6
S
EC
TIO
N 9
-9
I-' ..,.. '"

SE
CT
ION
C-C
S
EC
TIO
N 0
-0
SE
CT
ION
E-E
S
EC
TIO
N F
-F
Fig
. 7
.16
(c
on
t.)
Ele
vati
on
s -
Vil
la R
eal
SE
CT
ION
G-G
I--'
VI o

151
r-I o
Cf.l
r-I Q)
'D
til Q) l-l l-l o
H

N/
/
ct cr
27.9
0 --
'--~
-----I
P -t·8 °
i MO
I
7.5
0
\'
8.4
0 11
.80~
II
II ~------
----
----
-r--
---::u
zzf1
--
----
----
----
-r-
----
II
II
II
II
II
II
II
II
II
II
II
II
11 rt~~ __
II
11
11 --
-----
---
Ii II
II
II
II
II
II
II
t .
. 50J
II
II
II
II
U
---
--l'
---
.. --
" "
'--t-6
0"
,,~
m
: : : :
r-1-60
a4
5
t:====
=f~-:=
===+==
=~~~ ~
~8.40
.,
7.50
I
8.40~
f.--
-24
.30 --
----
--1
---1
TORR
ES
DEL
SOL
FIRS
T FL
OOR
Fig
. 7
.18
F
loo
r P
lan
s -
To
rres
d
el
So
l
--®
-®
24.~ -C
D
-®
DIM
EN
SIO
NS
IN
m
.
I-'
.. V
I N

N/
/
~
<p Cf
~--L
I
1.80
----
--f-
----
---r
----
-----
r t:
~---
---:~-~---
------
: I
I 6.
45
II
1/
I
Uzhn
mHU~
3=,:
~51:
:: : -1
/I
II
I I I
....
. ~
III
~ :
T
t-SO
~n=Z
ZD£=
::
;1 ==
====
Jl===
====
==1l=
====
= ~
TORR
ES D
EL S
OL
FLOO
RS 3
Be
5
1.80
-@
-®
24.3
0 -®
-®
DIM
ENSI
ON
S IN
m
.
Fig
. 7
.18
(c
on
t.)
Flo
or
Pla
ns
-T
orr
es
del
So
l
f-'
\.J1
W
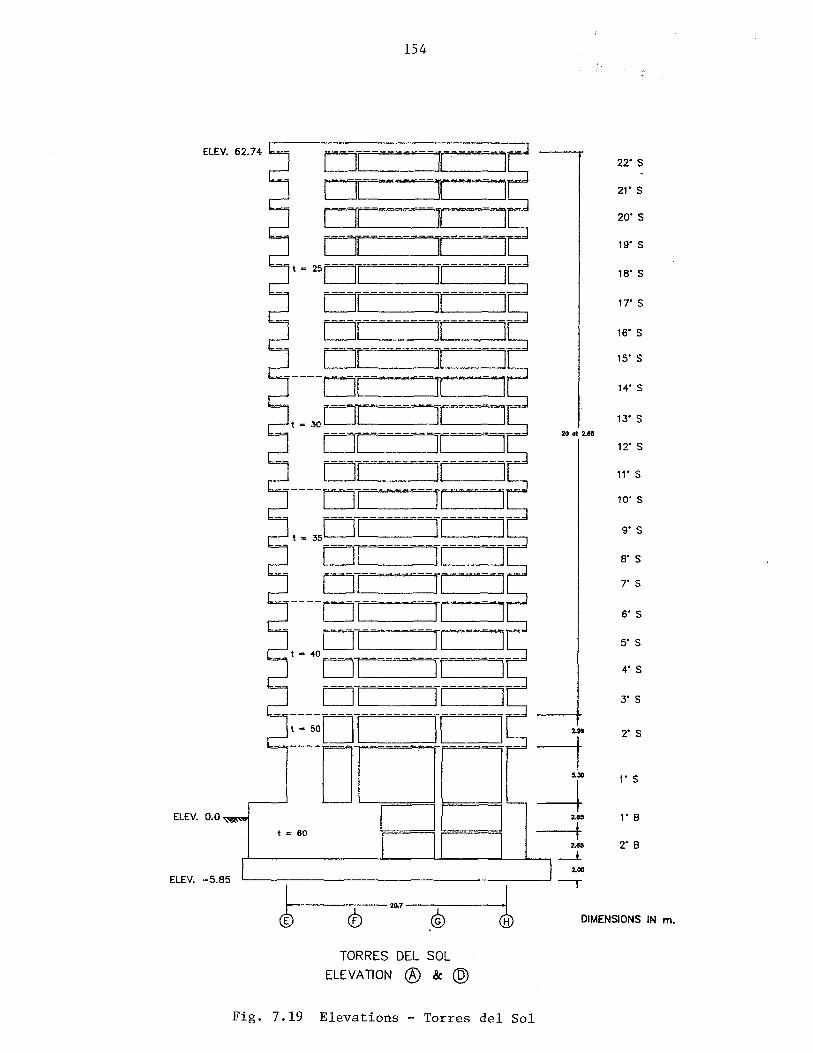
ELEV. 62.74
154
Ol -- - -Il· r---I! II 01 r --DT---------~----------
--t = 250C= - ILl -_JL-,
01 - 11----------r----II IlL-_---lL--,
01 ~'L..-I -~L......., ------01 '" -TL-I--------l - 01 -- ],1 =-----l 5 t = 30 CJI JL-I-----l
DC 111-.-----1 ------DI IL-l ____ ~
t = 35DI IlL-_---l
o I ] L--I -----' o [ TIL--------'
- ----D <--I _-_TL--I -----'
D l I L--r -----' t B 40
D I IIL-----I D1 I L--I ----I
-~:-5~Dr II I ,---J------O D D -
01 I ELEV. 0.0
t = 60
22· S
21· 5
20· 5
19· 5
18· 5
17· S
16· S
15· 5
14· S
13· 5 20 at 2.8&
12· 5
11· 5
10· S
9·5
8· 5
7· S
6· 5
5· S
4· 5
3"5
2." 2· S
-t ~JO 1· S
~ 2.85 1· B
j 2.8& 2· B
-1. 2.00
ELEV. -5.85 1.--____________ --' ~
~1----0 -2o.7-.~ -~ TORRES DEL SOL
ELEVATION ® & @
Fig. 7.19 Elevations - Torres del Sol
DIMENSIONS IN m.

155
ELEV. 67.15 ~----"------"-l
t a 20 4.41
22' S
21' S
20' S
19' S
18' S
17' S
16' S
15' S
14' S
13' S
20 at 2.85
12' S
1" S
'0' S
9' S
8' S
7' S
6' 5
5' S
4' S
3'5 ELEV. 9.74
2.99
-t 2' S
ELEV. 0.0
5.30
-+ 2.85
l' 5
" B
-15 2' B J
2.00 .
1-------29.00--------lI' cD @ ® DIMENSIONS IN m.
TORRES DEL SOL
ELEVATION ® & ©
Fig, 7.19 (cont.) Elevations - Torres del Sol
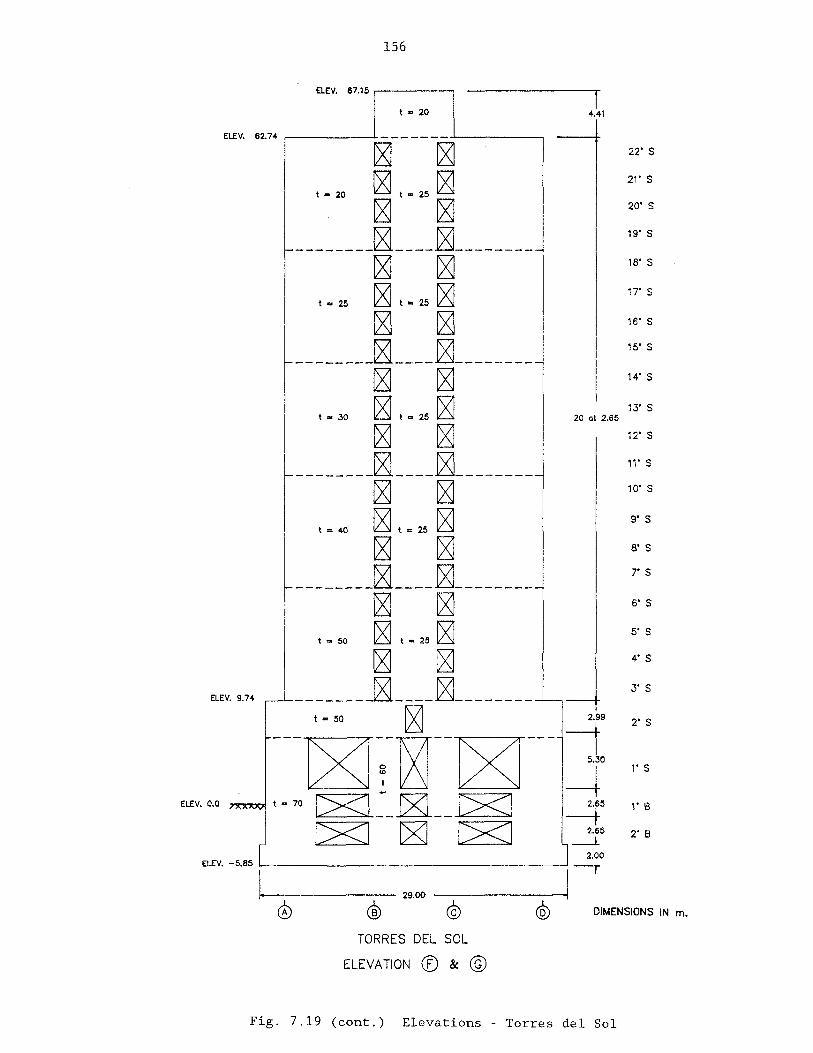
156
ELEV. 67.15,------,
t .. 20 I 4.41
ELEV. 62.74 ,-------....... -------..1..------, 1
ELEV. 9.74
ELEV. 0.0
t - 20 ~ ~ ~ t=25 ~ ~ ~
---------~----~---------
t .. 25
~ ~ ~ t-25 ~ ~ ~
~--------~----~---------
t - 30
~ ~ ~ t=25 ~ ~ ~
~--------~----~---------~ ~
t = 40 ~ t=25 ~ ~ ~
~--------~----~---------~ ~
t a 50 ~ t = 25 ~ ~ ~
20 at 2.65
--~--------~----~--------------___ ~t = 50 --0~ --~--- -i'
5.30
~ -+ t .. 70 \><J _0 __ \><J ~5
C><l C??J C><l ~5 I J 2.00
ELEV. -5.B5 l.-11-'~~~~~~~~~~=====~-29-.0-(J--__ -_-_-_-_-_-_-_-_-_-_-_-~_--'-Il-r
22' S
21' S
20' S
19' S
18' S
17' S
IS'S
IS'S
14' S
13' S
12' S
11' S
10' S
g'S
8' S
7' S
S'S
5' S
4' S
3' S
2' S
I'S
l' B
2' B
© DiMENSIONS IN m,
TORRES DEL SOL
ELEVATION ® & @
Fig. 7.19 (cont.) Elevations - Torres del Sol
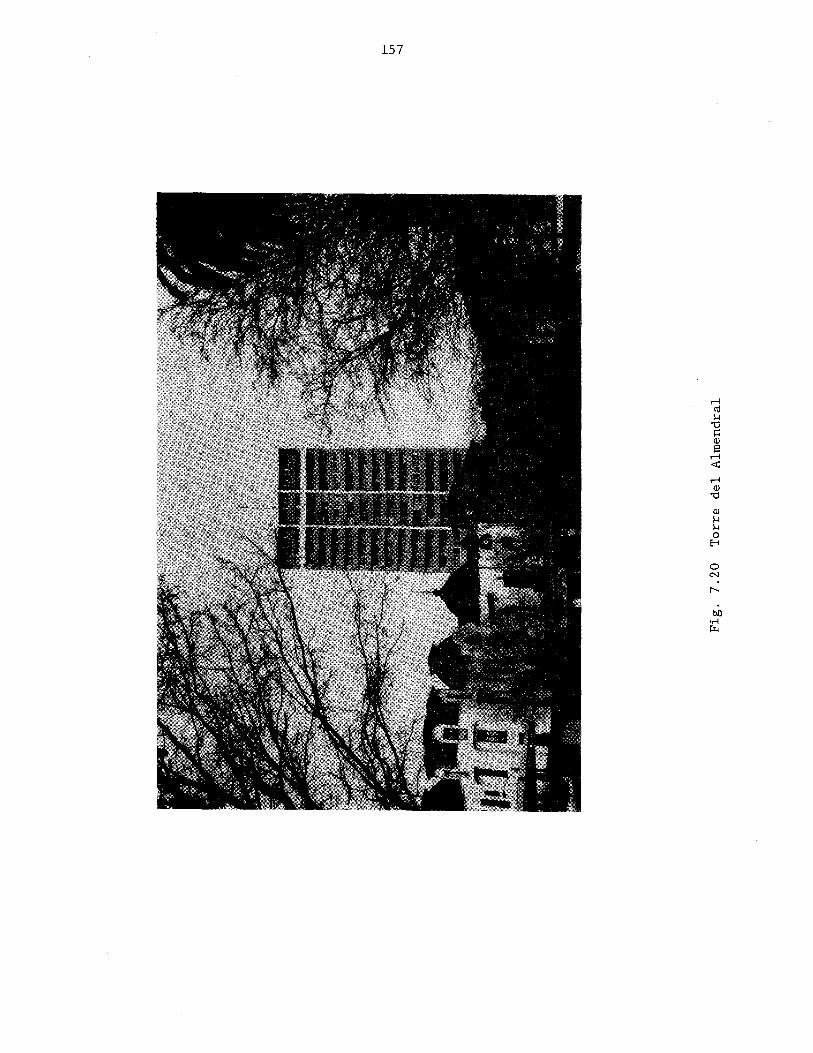
157
o N
"
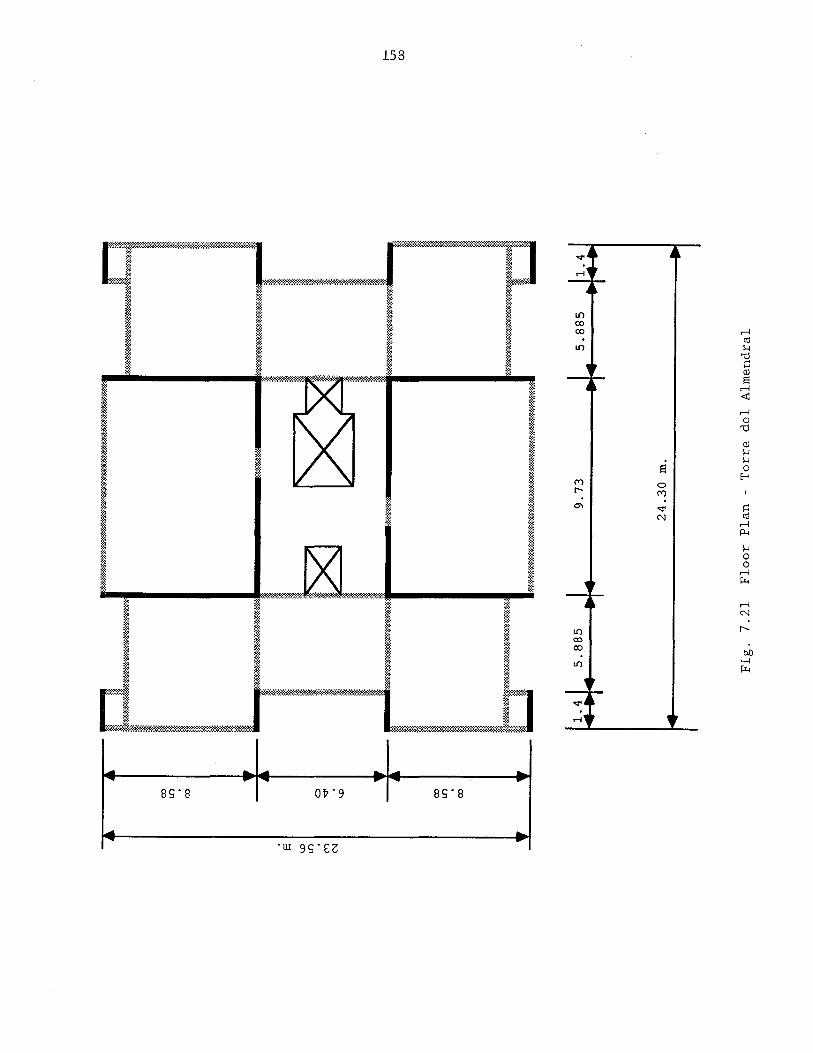
.... .... .... ... -SsoS Ovo9
L..... ....
153
........ SsoS
... .
LI) 00 00
LI)
LI)
00 00
LI)
r-l ctl H 'd s:: (j)
S r-l <C! r-l (j)
'd
(j)
H H
i:i 0 E-<
0 (Y')
'<I' s:: C\I ctl
r-l p..,
H 0 0
r-l ~
r-l N
r---
b.O orl ~

I~ 9.73 m ~
159
....I
o "5 .8 III u .;::
Q) E E >. en
GROJND
8.58 m .1
Fig. 7.22 Elevations - Torre del Almendral
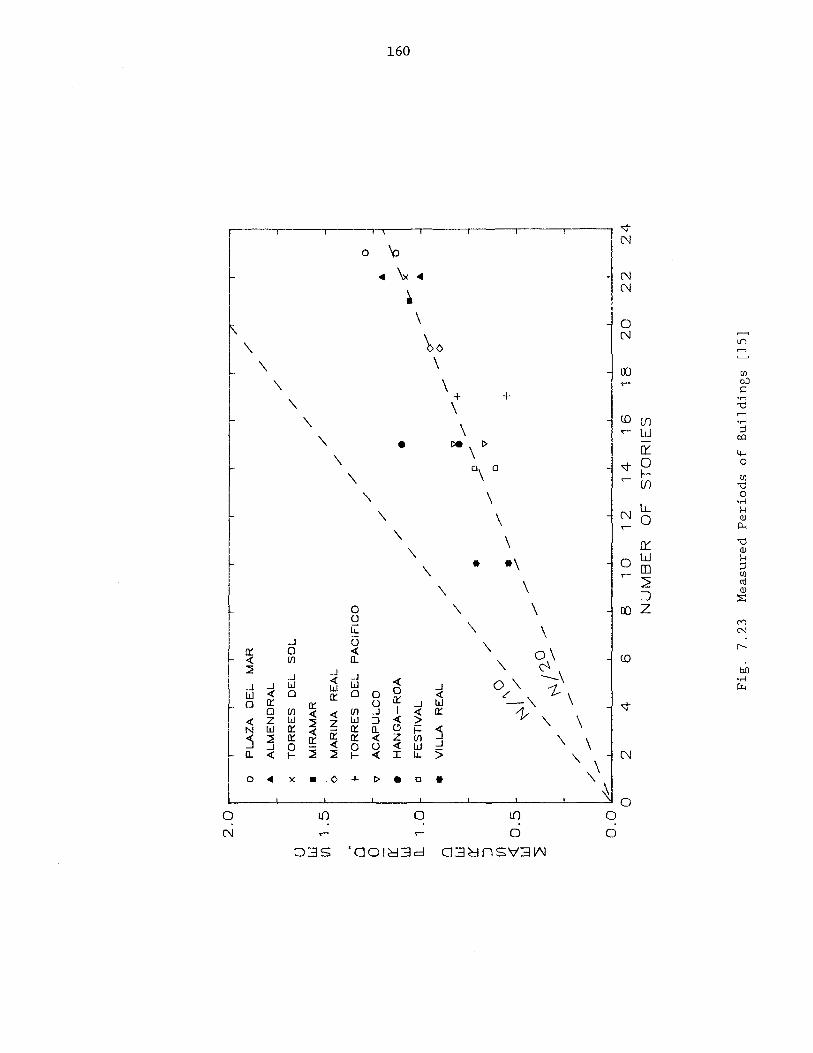
2.0
I --
-,
,---
---,
./
0 P
LA
ZA
D
EL
M
AR
/
• A
LM
EN
DR
AL
/
/
~ 1.5
l
x T
OR
RE
S
DE
L
SO
L
/
• M
IRA
MA
R
/ /
(>
MA
RIN
A
RE
AL
/
~ 1J +
T
OR
RE
S
DE
L
PA
CiF
ICO
/
/ 0
v A
CA
PU
LC
O
/ •
• H
AN
GA
-RO
A
/ ~O
......
• 0
\
/ .....
. 0
0 F
ES
TIV
AL
-
• /
<::r
0 •
VIL
LA
R
EA
L
/ -
-0
W
/ i_
-+
rr
/ •
0-
:J
/ -v
-({
) 0
/
-0
~ 0
.5
\ '\
. -+
~
/ -
/ --
:2
/ /'
2-°-
/ ~--
/ - -
/--
0.0
I/-
O
2 4
6 8
10
1
2
14
1
6 1
8
20
2
2
24
N
UM
BE
R
OF
S
TO
RIE
S
Fig
. 7
.23
M
easu
red
P
eri
od
s o
f B
uil
din
gs
[15
1
161
APPENDIX A GEOTECHNICAL CHARACTERISTICS OF THE SOIL IN VINA DEL MAR
Detailed geotechnical investigations are generally not conducted at the
site of a new buildings in Vina del Mar because the soil is considered to be
a good foundation material and fairly uniform throughout the downtown area.
Available data indicate that the following information is obtained when a
geotechnical investigation is required:
Bore holes - average depth between 10 and 20 m. Standard penetration tests - average depth between 8 and 20 m. Dynamic cone tests - average depth between 8 and 12 m. Grain size analysis.
The results from bore holes and standard penetration tests conducted at eight
sites in Vina del Mar are summarized in this Appendix. More detailed
descriptions of the soil using data from 46 borings in Vina del Mar are
presented in Reference 31.
The locations of the eight bore holes in Vina del Mar are shown in
Fig. A.l. Data obtained at these locations are presented in Fig. A.2 - A.9.
Test results were available for 4 buildings that were described in
Chapters 6 and 7: Torres del Pacifico (boring #1), Torres de Miramar (boring
#2), Hanga-Roa (boring #3), and Marina Real (boring #5). All four buildings
are located on Avenida San Martin near the beach. The results of the
standard penetration tests indicated the presence of sand with medium to
dense relative densities for depths below 2 m [51]. The elevation of the
water table varied significantly at the four locations, from 1.9 to 8.5 m
below grade. However, no information was available about tidal fluctuations
at the time of the borings.
The soil profiles were reasonably consistent at the four sites with thin
layers of artificial fill and fine sand near the surface. Layers of coarse
to medium sand and fine gravel extended to depths of approximately 20 m. The

162
deepest boring, #1 at Torres del Pacifico, identified marine deposits (shells
in the sand layers) below 32 m.
The results of the standard penetration tests performed at locations
further inland (#4, #6, #7, and #8) also indicated sand with medium to dense
relative densities for depths below 2 m. The soil profiles identified a thin
layer of artificial fill at the surface and layers of medium and coarse sand
extending to depths of approximately 10 m. A higher proportion of silt was
observed in the soil samples obtained at the inland locations compared with
the locations near the beach.
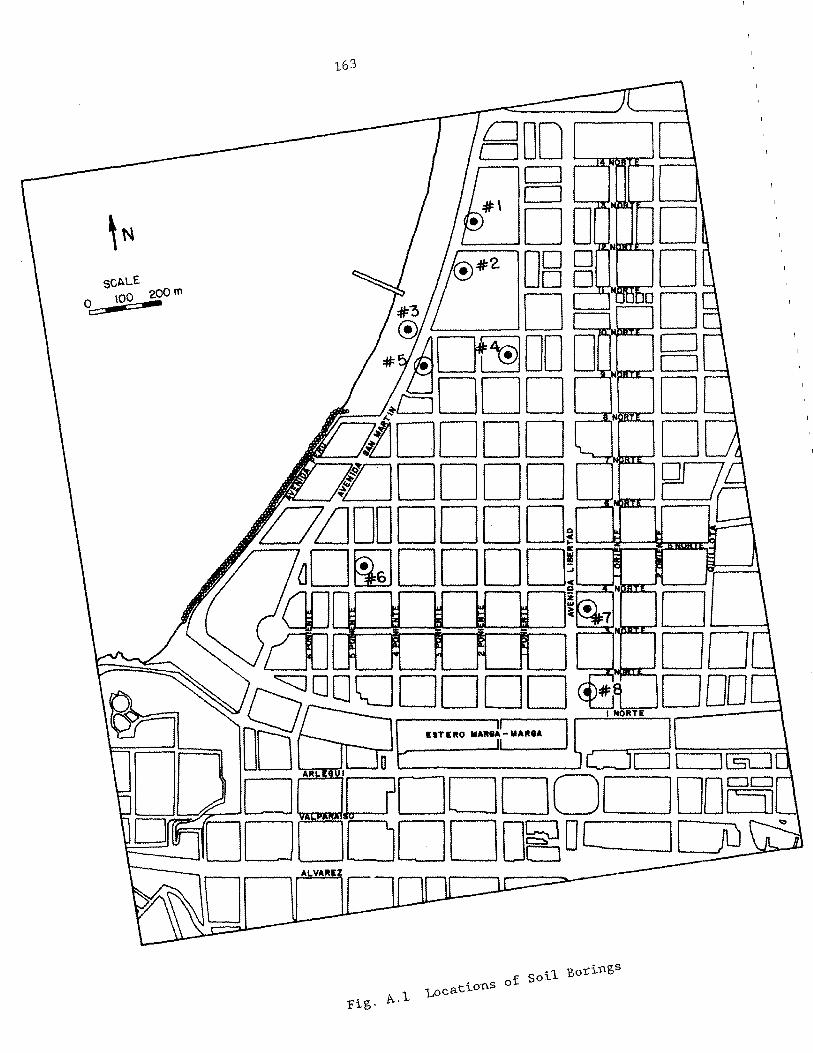
SC~LE. 100 ZOom O~
fig. A.. 1 Loca t ionS 0 '1 Bo-rings
f So~

E
~
..c
....... 0..
Q
)
o
o 5 10
15
20
25
N,
blo
ws/f
t
o 10
20
3
0
40
5
0
60
7
0
80
9
0
100
.1
") q
l'"
--t p
;;:
-!(
it
h !-
, _~ 1
. ~
\* *
\\ \
--•
..
.l.
~\
~ .
\~ • "'" , I).
l\
~ i
••
I
t=± I
-.1 _
____
____
___
o. _
_ ~'-
-~-
Bo
rin
g
#1 A
v.
be
twe
en
To
rre
s de
i P
acif
ico
S
an
Ma
rtin
1
2
an
d
14
N
ort
e
Wat
er
tab
le
(-6
.3 m
)
+
+
+
+
-to
+
+
+
+
+
+
+
+
+
+
+
+
+
+
+
+
+
+
+
-to
+
+
+
--
-I'
, ,1
I'·········
· . · .
. . .
. . .
. . .
· .
. . .
. . .
. . .
· . .
. .
. . .
. . .
....
....
...
k>:-<
:>::>:
>. I· . .
. .. . ...
. · . .
.. .,
....
· .
. . .
. ..
...
....
....
...
....
.. ..
...
I·············· ..
.... . ..
....
..
.
· . .
. . .
. ..
..
....
. ..
· . .
. . .
. . .
.........
....
....
..
..
....
. ..
.
Fig
. A
.2
So
il P
rofi
le
from
B
ori
ng
#1
[31]
Art
ific
ial
fill
Fin
e/m
ed
ium
sa
nd
Med
ium
sa
nd
Coa
rse
sand
w
ith
qu
art
z g
rain
s
Fin
e sa
nd
t-'
0\
.j::
-
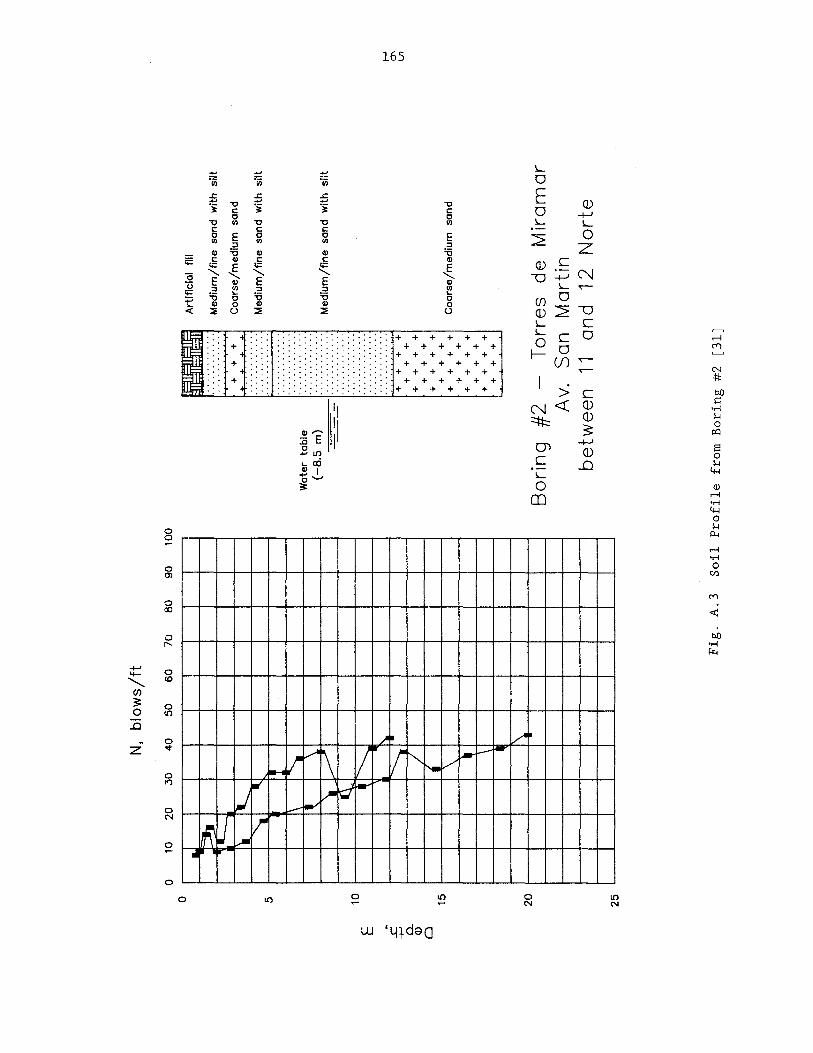
E .
-C
+'
0...
(I)
o
o 5 10
15
20
25
N,
blo
ws/f
t
o 10
2
0
30
4
0
50
6
0
70
8
0
90
1
00
.. ~
,---.
1\
l.....
"1.
...,
f 1\
~
~ \
) ~
~ ~ ~
~
/ • \ .. \ --
-"--
---
--_
._
--
'---
-----
I\, - 1\ -
-_
._
--
Wat
er
tab
le
(-8
.5 m
)
..
Art
ific
ial
fill
+
+
+
....
....
....
Me
diu
m/f
ine
sa
nd
w
ith
silt
Co
ars
e/m
ed
ium
sa
nd
Me
diu
m/f
ine
sa
nd
w
ith
silt
-==
=-1
::::
::::
:::.
M
ed
ium
/fin
e
san
d
with
si
lt
+
+
+
+
+
+
+
+
+
+
+
+
+
+
+
+
+
+
+
+
+
+
+
+
+ I
Co
ars
e/m
ed
ium
sa
nd
+
+
+
+
+
+
+
+
+
+
+
+
+
+
+
+
+
Bo
rin
g
#2
-
To
rre
s d
e
Mir
am
ar
Av.
S
an
Ma
rtin
b
etw
ee
n
11
an
d
12
N
ort
e
Fig
. A
.3
So
il P
rofi
le
from
Bo
rin
g #
2 [3
1)
f--'
0\
lJl

E
..c
+, 0..
(l.
) o
o 10
o
il
5 10
15
20
25
N,
blo
ws/f
t
20
30
40
5
0
60
70
8
0
90
100
~
-r~
I '-
-.
I
? r:.
.. c:
"-i
" tJ
J
.- ---"t
'--,..
- --.
--r---.
. II
'" /'
'J
!
J -
--------
-.:
~
---1
. --- --
---..
-- ---
I, .....
..
'" ---t-
.. .
Bo
rin
g
#3
A
v.
San
H
an
ga
-Ro
a
Ma
rtin
N
o.
92
5
Wa
ter
tab
le
(-1
.7 m
)
+
+
+
+
+
+
+
+
+
+
+
+
+
+
+
+
+
+
+
+
+
+
+
+
+
+
+
+
+
+
+
+
+
+
+
+
+
+
~.+,+i
+ +~
+
+
+
+
+
+
+
Fig
. A
.4
So
il P
rofi
le
from
B
ori
ng
#3
[31]
Art
ific
ial
fill.
sa
nd
. d
eb
ris
Co
ars
e/m
ed
ium
sa
nd
w
ith
w
ith
tr
ace
s o
f fi
ne
g
rave
l
Co
ars
e
san
d
an
d
fin
e
gro
vel
Co
ars
e/m
ed
ium
sa
nd
a
nd
fi
ne
g
rave
l
Me
diu
m/c
oa
rse
sa
nd
I-'
C]\
C
]\
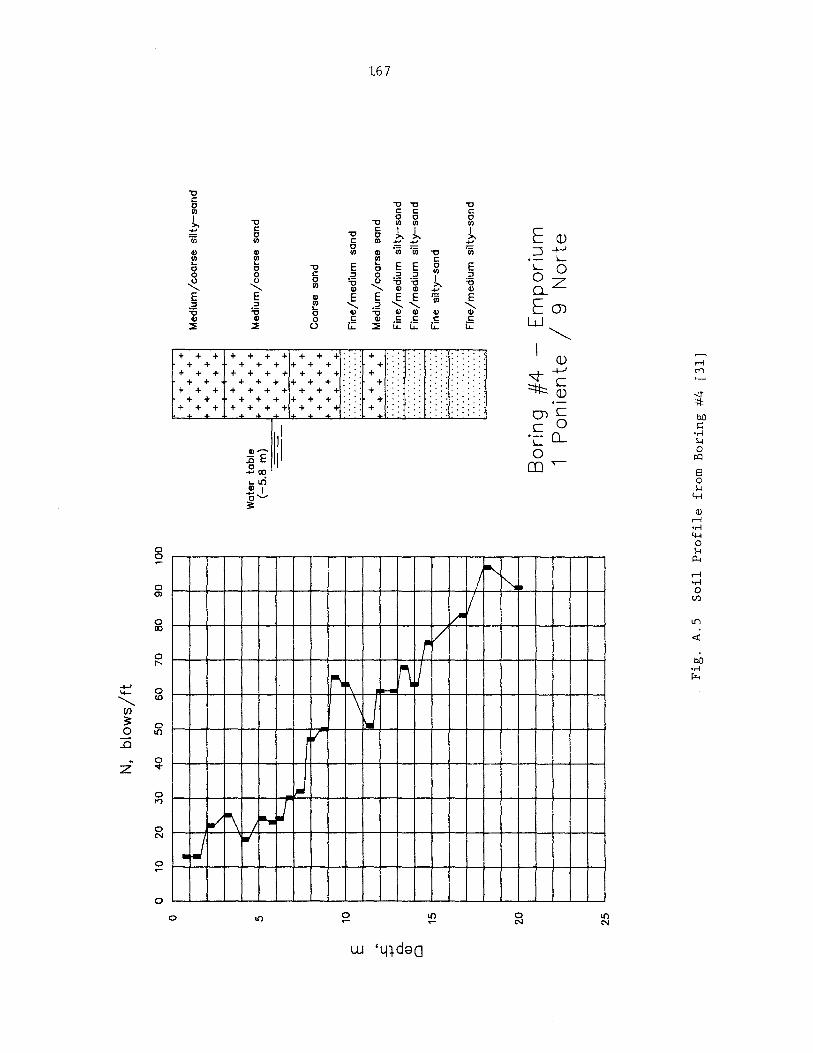
E
..c
+-'
0
..
Q)
o
o 5 10
15
20
25
o 10
--
20
3
0
• ---.~
V
.... ""- / IL
..-,
I. N.
blo
ws/f
t
40
50
60
70
80
......,
-:J
/" ,....
..
ilC
I. .:=:a ---h
'" :\
90
1
00
..........
.. :-......
, J /
+
+
+
+
+
+
+
+
+
+
+
+
+
+
+
+
+
+
+
+
+
+
+
+
+
Wat
er t~ble +
+
+
+
(-
5.8
m)
+ +
+ +
+ +
+
---'+
++
+
+
+
+
+
+
+
+
+
+
+
+
+
+
+
+
+
+
+
+
+
+
+
+
+
....
....
....
j iii
+
+
+
+
+
+
+
....
....
....
Bo
rin
g
#4
1
Po
nie
nte
Fig
. A
.S
So
il P
rofi
le
from
Bo
rin
g #
4 [3
1]
Me
diu
m/c
oa
rse
silty
-sa
nd
Me
diu
m/c
oa
rse
sa
nd
Coa
rse
san
d
Fin
e/m
ed
ium
sa
nd
Me
diu
m/c
oa
rse
sa
nd
Fin
e/m
ed
ium
silty
-sa
nd
Fin
e/m
ed
ium
silty
-sa
nd
Fin
e silty
-sa
nd
Fin
e/m
ed
ium
silty
-sa
nd
Em
po
riu
m
/ 9
No
rte
I-'
(j\
-....J

E
..c
+-'
0.
.. (l
) o
o 5 10
15
20
25
N.
blo
ws/f
t
o 1
0
20
3
0
40
5
0
60
7
0
80
9
0
10
0
-J r
• •
III!
bo
r ----
rt::
i --
,
~
, JI
~ .
•
--
--
L-
__
--------
. ...
....
...
. i
• i
i
+
+
+
+
+
+
+
+
+
+
+
;u +
+
+
W
ater
ta
ble
+
+
+
+
(-
5.2
m
) +
+
+
----
++
++
+
+
+
+
+
+
+
+
+
+
+
+
+
+
+
+
+
Art
ific
ial
fill,
be
ach
sa
nd
Fin
e
silty
-sa
nd
, b
ea
ch
san
d
an
d
fin
e
gra
vel
Me
diu
m
san
d
an
d
gra
vel
Bo
rin
g
#5
-
Ma
rin
a
Rea
l A
v.
San
M
art
in
be
twe
en
1
0
an
d
8%
No
rte
Fig
. A
.6
So
il P
rofi
le
fro
m
Bo
rin
g
#5
[3
1]
f-J
(j\
()
O

E
..c
+J
0..
Q
) o
o 5 10
15
20
25
N,
blo
ws/f
t
o 10
2
0
30
4
0
50
6
0
70
8
0
90
1
00
• -h
). ~. Il
. .v
.., I I j
I(
~
~
Art
ific
ial
fill
+
+
+
+
+
+
+
+
+
+
+
+
+
+
Wat
er
tab
le
+
+
+
+
( -4.
5
m)
II:-+
:!:..-
,.;L.
.,....
:"-:-f
+
+
+
+
+
+
+
+
+
+
+
+
+
+
+
+
+
+
+
+
+
....
....
-..
.
Med
ium
sa
nd
with
si
lt
Me
diu
m/f
ine
san
d w
ith
silt
Med
ium
si
lty-
san
d
Me
diu
m/f
ine
san
d w
ith
grav
el
Fin
e si
lty-
san
d
with
gr
avel
Te
rra
zas
No.
3
36
B
ori
n 9
#
6
-L
as
5 P
on
ien
te
Fig
. A
.7
So
il P
rofi
le
from
Bo
rin
g #
6 [5
2]
~
0'1 '"

E
~
..c
-+-' Q..
Q
)
o
N,
blo
ws/f
t
o 10
2
0
30
4
0
50
60
70
8
0
90
10
0
o I
• •
• -:J
.....
......
r---
, 1
--.:::
:::t.
I'-
... -.
-.
IL-
1..,
, 5
-411
1--
-I
... ...
-•
( --t
... I
-. .L
....
........
... J IL
1
0
..---
L-r---
.. .....
. D
.:-:
I'
~
..a-o
r ~
.......
.JI
f 15
• "I.
.
.-')
11
..
... '\.
i I
20
25
Bo
rin
g
#7
A
v.
Lib
ert
ad
b
etw
ee
n
3 a
nd
4
No
rte
Wat
er
t (-
5.9
able
m
) ---
I t::
ll t::
l :I
I 11
:::::11
t::
ll
11E
31E
31E
3IE
+
+
+
+
+
+
+
+
+
+
+
+
+
+
+
+
+
+
+
+
+
+
+
+
+
+
+
+
+
+
+
+
+
+
+
+
+
+
+
+
+
+
+
+
+
+
+
+
+
+
+
+
+
+
+
+
+
+
+
+
+
+
+
+
+
+
+
+
+
+
+
+
+
+
+
+
+
+
+
+
+
+
+
+
+
+
+
+
+
+
+
+
+
+
+
+
+
+
+
+
+
+
+
+
+
+
+
+
+
+
+
+
+
+
+
+
+
+
+
+
+
+
+
+
+
+
+
+
+
+
+
+
+
+
+
+
+
+
+
+
+
+
+
+
+
+
+
+
+
r + + +
+
+
+
+
+
+
+
+
+
+
+
+
+
+
+
+
+
+
+
+
+
,
• •
__
__
_ .1
__
__
_
Fig
. A
.8
So
il P
rofi
le
from
B
ori
ng
#7
[31]
Art
ific
ial
fill,
san
d,
de
bri
s A
rtif
icia
l fil
l, sa
nd
w
ith
gra
vel
Co
ars
e/m
ed
ium
sa
nd
Me
diu
m/c
oa
rse
sa
nd
w
ith
fin
e
gra
vel
Co
ars
e
san
d
Co
ars
e
san
d,
fin
e g
rave
l
Co
ars
e
san
d,
me
diu
m
gra
vel
(ve
ry w
et)
Co
ors
e/m
ed
ium
sa
nd
, fin
e
gro
vel
~
-....J
o
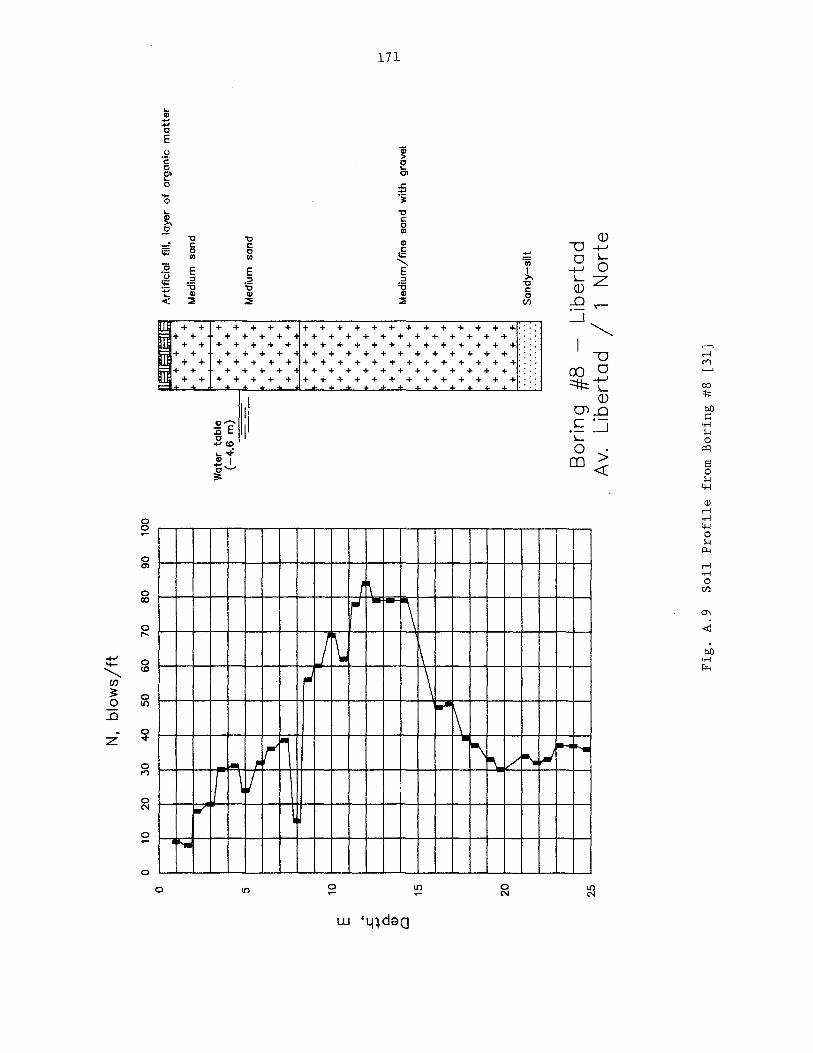
E
...c
-f-'
C
L Q
)
o
o 5 10
15
20
25
o 1
0
20
-- L "
N.
blo
ws/f
t
30
4
0
50
60
7
0
80
90
10
0
I I I
..-11
-....
. r. ~
I
..I
•
-.. I
r--.
. I
C
-... I--
.
~~
~
l.----
"
---I--
, --!
...--'
--" .... ~ /' '-- 1 l
Wat
er
t (-
4.6
lble
m
) +
+
+
+
+
+
+
+
+
+
+
+
+
+
+
+
+
+
+
+
+
+
+
+
+
+
+
+
+
+
+
+
+
+
+
+
+
+
+
+
+
+
+
+
+
+
+
+
+
+
+
+
+
+
+
+
+
+
+
+
+
+
+
+
+
+
+
+
+
+
+
+
+
+
+
+
+
+
+
+
+
+
+
+
+
+
+
+
+
+
+
+
+
+
+
+
+
+
+
+
+
+
+
+
+
+
+
+
+
I +
+
+
+1
+
+
+
+
+
+
+
..
....
, ..
...
....
, ..
.. "
. ..
...
....
...
....
....
.. -
.
Art
ific
ial
fill,
laye
r o
f o
rga
nic
m
att
er
Med
ium
sa
nd
Med
ium
sa
nd
Me
diu
m/f
ine
sa
nd
w
ith
gra
vel
Sa
nd
y-s
ilt
Bo
rin
g
#8
A
v.
Lib
ert
ad
L
ibe
rta
d
/ 1
No
rte
Fig
. A
.9
So
il P
rofi
le
from
Bo
rin
g #
8 [3
1]
l-'
-..J
l-
'

172
REFERENCES
1. "Acero - Barras Laminadas en Caliente para Hormig6n Armado -NCh 204.0f78," Instituto Naciona1 de Norma1izaci6n, Santiago, 1979.
2. Acevedo, P., and O. Orozco, "Antecedentes Generales del Subsuelo en los Sectores mas Densamente Poblados de Valparaiso y San Antonio," El Sismo del 3 de Marzo 1985 - Chile, Facu1tad de Ciencias Fisicas y Matematicas, Universidad de Chile, Santiago, 1986, pp. 169-178.
3. Aquirre, C., M. Peterson, and L. Eduardo, "Microzonificaci6n Sismica de la Ciudad de Vina del Mar," Proceedings, 4as Jornadas Chilenas Sismologia e Ingenieria Antisismica, Vol. 1, Vina del Mar, April 1986, pp. E-70 - E-84.
4. Arias, A., "A Measure of Earthquake Intensity," Seismic Design for Nuclear Power Plants, R. J. Hansen, ed., MIT Press, Cambridge, Massachusetts, 1970.
5. Arias, A., R. Husid, and J. Monge, "Comments on the New Chilean Seismic Code for Buildings," Proceedings, Fourth World Conference on Earthquake Engineering, Vol. III, Chile, 1969, pp. B-5, 41-52.
6. Arias, S., T. Guendelman, I. Kort, and F. Lazo, "Recuperaci6n Estructural de Edificio Hanga Roa Danado por el Terremoto del 3 de Marzo de 1985," Proceedings, 4as Jornadas Chi1enas de Sismo10gia e Ingenieria Antisismica, Vol. 1, Vina del Mar, April 1986, pp. C-205 - C-2l6.
7. Astroza, M., "Construcciones de Albanileria," El Sismo del 3 de Marzo 1985 - Chile, Facultad de Ciencias Fisicas y Matematicas, Universidad de Chile, Santiago, 1986, pp. 93-110.
8. Barazangi, M. and B. Isacks, "Spatial Distribution of Earthquakes and Subduction of the Nazca Plate Beneath South America," Geology, Vol. 4, November 1976, pp. 686-692.
9. "Barras para Hormig6n," Compania de Acero del Pacifico S.A., Santiago.
10. Bertling, H., "Development of Earthquake-Proof Construction in Chile," Proceedings, World Conference on Earthquake Engineering, Berkeley, 1956, pp. 20-1 - 20-10.
1l. "Bestimmungen fur Ausfuhrung von Bauwerken aus Stashbeton," Deutscher Normenausschuss, DIN 1045, July 1952.
12. Bonelli, P., "Actividades de Investigacion 1986: E1 Sismo del 3 de Marzo de 1985 en Valparaiso y Vina del Mar," Universidad Tecnica Federico Santa Maria, Valparaiso, 1986.
13. Bonelli, P., "Danos en Edificios Altos de Hormig6n Armado Provocados por el Sismo del 3 de Marzo de 1985," presented to the Instituto de Ingerieros de Chile, Universidad Tecnica Federico Santa Maria, Valparaiso, 1985.

173
14. "Building Code Requirements for Reinforced Concrete - ACI 318-83," American Concrete Institute, Detroit, 1983.
15. Calcagni, J., "Proposicion de un Espectro de Diseno para Zona Epicentral del Terremoto del 3 de Marzo de 1985," Memoria de titulo, Universidad de Chile, Santiago, April 1987.
16. "Calculo Antisismico de Edificios - NCh 433-0f.72," Instituto Nacional de Normalizacion, Santiago, 1979.
17. Celebi, M., ed., "Seismic Site-Response Experiments Following the March 3, 1985 Central Chile Earthquake (Topographical and Geological Effects)," Open-File Report, No. 86-90, United State Department of the Interior, Geological Survey, Menlo Park, California, 1986.
18. "Cemento, Terminologia, Clasificaci6n y Especificaciones Generales -NCh l48.0f68," Instituto Nacional de Investigaciones Tecnologicas y Normalizacion, Santiago, 1958.
19. "Cementos. Puzolana para Uso en Cementos. Especificaciones-NCh l63.EOf68," Instituto Nacional de Investigaciones Tecno16gicas y Normalizacion, Santiago, 1965.
20. "Con 175 kg. de Explosivos: Derribaron Edificio 'El Faro' ," El Mercurio, Santiago, 9 March 1985, pp. Al and A8.
21. De Montessus de Ballore, F., La Geologie Sismologique: Les Tremblements de Terre, Librairie Armand Colin, Paris, 1924.
22. Earthquake Resistant Regulations: A World List, International Association for Earthquake Engineering, Tokyo, 1980.
23. Eisenberg, A., C. Comte, M. Pardo, L. Ponce, S. Singh, and G. Suarez, "Sismieidad Historiea y el Terremoto del 3 de Marzo en la Zona Central de Chile," Proceedings, 4as Jornadas Chilenas de Sismologia e Ingenieria Antisismica, Vol. 1, Vifla del Mar, April 1986, pp. A-108 - A-119.
24. Eisenberg, A., R. Hus id, and J. Luco, "A Preliminary Report: The July 8, 1971 Chilean Earthquake," Bulletin, Seismological Society of America, Vol. 62, No.1, February 1972, pp. 423-430.
25. Encyclop~dia Britannica, 15th Edition, Vol. X, University of Chicago, 1983.
26. Flores, R. and J. Jimenez, "Development of Earthquake Engineering in Chile," presented at the Workshop on the Chilean Earthquake of 3 March 1985, EERI and ACHISINA, Instituto de Ingenieros, Santiago, April 1986.
27. Fresard, M. and R. Saragoni, "Analisis de los Ace1erogramas y de los Danos de los Sismos de 1981 en la Zona Central de Chile," Proceedings, 4as Jornadas Chilenas de Sismologia e Ingenieria Antisismica, Vol. 2, Vina del Mar, April 1986, pp. F-93 - F-ll1.
28. Fuller, C. "Geologia y Yacimientos Matiferos de Chile," Part 1, Instituto de Investigaciones Geologicas, Chile, 1965, pp. 1-32.

174
29. Gajardo, E. and C. Lomnitz, "Seismic Provinces of Chile," Proceedings, Second World Conference on Earthquake Engineering, Vol. III, Japan, 1960, pp. 1529-1539.
30. Grimme, K. and L. Alvarez, "El Suelo de Fundaci6n de Valparaiso y Vifla del Mar," Boletin, Instituto de Investigaciones Geo16gicas, Chile, No. 16, 1964.
31. Herrera, A., "Zonificaci6n de Suelos de Vifla del Mar," Departamento de Obras Civiles, Universidad Tecnica Federico Santa Maria, Valparaiso, Chile, 1977.
32. "Hormig6n Armado - I Parte - NCh 429.EOf57," Instituto Nacional de Normalizaci6n, Santiago, 1965.
33. "Hormig6n Armado - II Parte - NCh 430.EOf61," Instituto Nacional de Normalizaci6n, Santiago, 1965.
34. "Hormigones de Cemento - NCh l70.0f52," Instituto Nacional de Normalizaci6n, Santiago.
35. Housner, G., "Behavior of Structures During Earthquakes," Journal of Engineering Mechanics, ASCE, Vol. 85, No. EM4, October 1959, pp. 108-129.
36. Hudson, D., Reading and Interpreting Strong Motion Accelerograms, EERI, Berkeley, 1979.
37. Husid, R. and B. Blass, "Visita a Parte de la Zona Afectada," Revista del IDIEM, Universidad de Chile, Facultad de Ciencias Fisicas y Matematicas, Vol. 11, No.1, Santiago, May 1972, pp. 34-38.
38. "Ley y Ordenanza General sobre Construcciones y Urbanizaci6n," Instituto Nacional de Investigaciones Tecno16gicas y Normalizaci6n, November 1949.
39. Lomnitz, C., "An Earthquake Risk Map of Chile," Proceedings, Fourth World Conference on Earthquake Engineering, Vol. I, Chile, 1969, pp. A-I, 161-171.
40. Lomnitz, C., "Major Earthquakes and Tsunamis in Chile during the Period 1535 to 1955," Geologische Rundschau, Vol. 59, No.3, 1970, pp. 938-960.
4l. Malgrange, M., A. Deschamps, and R. Madariaga, "Thrust and Extensional Faulting Under the Chilean Coast: 1965 and 1971 Acongua Earthquakes," Geophysical Journal, Royal Astronomical Society, Vol. 66, 1981, pp. 313 - 33l.
42. Malgrange, M. and R. Madariaga, "Complex Distribution of Large Thrust and Normal Fault Earthquakes in the Chilean Subduction Zone," Geophysical Journal, Royal Astronomical Society, Vol. 73, 1983, pp. 489-505.
43. Mohraz, B., W. Hall, and N. Newmark, "A Study of Vertical and Horizontal Earthquake Spectra," U. S. Atomic Energy Commission, N. M. Newmark Consulting Engineering Services, December 1972.

175
44. Monge, J., "Edificios de Hormig6n Armado," El Sismo del 3 de Marzo 1985 - Chile, Facultad de Ciencias Fisicas y Matematicas, Universidad de Chile, Santiago, 1986, pp. 111-136.
45. Monge, J., L. Rosenberg, A. Vives, and F. Yoma, "Sismo del 28 de Marzo de 1965, Chile: Informe Sobre Dafios en Estrucuras," Anales, Facu1tad de Ciencias Fisicas y Matematicas, Universidad de Chile, Vol. 22-23, Santiago, 1965-66, pp. 68-80.
46. Munoz, J., "Chile", Chapter 6 of Handbook of South American Geology, W. F. Jenks, ed., Memoir 65, Geological Society of America, 15 June 1956, pp. 187-214.
47. Munro, G., Vifia: Una Ventana Abierta a1 Mar, Ediciones Servicios Promociona1es LTDA, Santiago, 1984.
48. Newmark, N., "A Method of Computation for Structural Dynamics," Journal of En~ineerin~ Mechanics, ASCE, Vol. 85, No. EM3, July 1959, pp. 67-94.
49. "Ordenan la Demolici6n de Dos Torres en Vina del Mar," El Mercurio, Santiago, 6 March 1985, p. Cl.
50. Ortigosa, P., P. Acevedo, R. Dobry, and C. Foncea, "Informe Preliminar Sobre Visitas a Algunas Zonas Afectadas por el Sismo del 8 de Julio 1971," Revista del IDIEM, Universidad de Chile, Facu1tad de Ciencias Fisicas y Matematicas, Vol. 11, No.1, Santiago, May 1972, pp. 24-28.
51. Peck, R., W. Hanson, and T. Thornburn, Foundation Engineering, 2nd ed., John Wiley & Sons, New York, 1974.
52. Petersen, M., and J. Donoso, "Estudio de Mechanica de Sue1os: Edificio Las Terrazas," Vifia del Mar, November 1980.
53. "Recommended Lateral Force Requirements," Structural Engineers Association of California, 1980.
54. "Recommended Practice for Evaluation of Strength Test Results of Concrete (ACI 214-77)," Reported by ACI Committee 214, American Concrete Institute, Detroit, 1977.
55. Riddell, R. and R. Villablanca, "Riesgo Sismico en Chile," Proceedings, 4as Jornadas Chilenas de Sismo1ogia e Ingenieria Antisismica, Vol. 2, Vina del Mar, April 1986, pp. F-130 - F-15l.
56. Riddell, R., S. Wood, and J. de la L1era, "The 1985 Chile Earthquake: Structural Characteristics and Damage Statistics for the Building Inventory in Viiia del Mar," Civil Engineering Studies, Structural Research Series No. 534, University of Illinois, Urbana, April 1987.
57. Rodriguez, A. and C. Gajardo, La Catastrofe del 16 Agosto de 1906 en 1a Republica de Chile, Barcelona, Santiago, 1906.
58. Saragoni, R., "Earthquake Engineering Research Program in Chile," Earthquake Information Bulletin, Vol. 14, No.1, 1982, pp. 22-25.

176
59. Saragoni, R., "Introduccion," E1 Sismo del 3 de Marzo 1985 - Chile, Facultad de Ciencias Fisicas y Matematicas, Universidad de Chile, Santiago, 1986, pp. 8-9.
60. Saragoni,. R., J. Crampien, and R. Araya, "Caracteristicas Experimentales de los Movimientos Sismicos Sudamericanos," Revista del IDIEM, Universidad de Chile, Facultad de Ciencias Fisicas y Matematicas, Vol. 21, No.2, September 1982, pp. 67-88.
61. Saragoni, R., P. Gonzalez, and M. Fresard, "Analisis de los Acelerogramas del Terremoto del 3 de Marzo de 1985," Publicacion SES I 4/1985 (199), Secci6n Estructuras, Departamento de Ingenieria Civil, Universidad de Chile, Santiago, December 1985. (reprinted in Proceedings, 4as Jornadas Chilenas de Sismologia e Ingenieria Antisismica, Vol. 1, Vina del Mar, April 1986, pp. A27 - A58.)
62. Sarrazin, M., "A1gunas Observaciones de Danos Estructurales: Impresiones Recogidas el Dia 10 de Julio de 1971," Revista del IDIEM, Universidad de Chile, Facultad de Ciencias Fisicas y Matematicas, Vol. 11, No.1, Santiago, May 1972, pp. 38-40.
63. Sarrazin, M., "Regulaciones Sismorresistentes," El Sismo del 3 de Marzo 1985 - Chile, Facultad de Ciencias Fisicas y Matematicas, Universidad de Chile, Santiago, 1986, pp. 83-92.
64. Sarrazin, M., "Regulaciones Sismorresistentes: La Experiencia Chilena," Boletin Tecnico, Universidad Central de Venezuela, Instituto de Materiales y Modelos Estructurales, No. 64, Enero-Junio 1979, pp. 85-111.
65. "Seismological Notes," Bulletin, Seismological Society of America, 1965 - 1986.
66. Silva, R. Me Llamo Vina del Mar, Vina del Mar, 1974.
67. Talbott, R., " A History of Valparaiso, Chile," Thesis, Master of Arts, Submitted to the Graduate College, University of Illinois, Urbana, 1955.
68. Wyllie, L., et a1., "The Chile Earthquake of March 3, 1985," Earthguake Spectra, Vol. 2, No.2, April 1986, pp. 249, 512.