


Languages
Pages
Legal

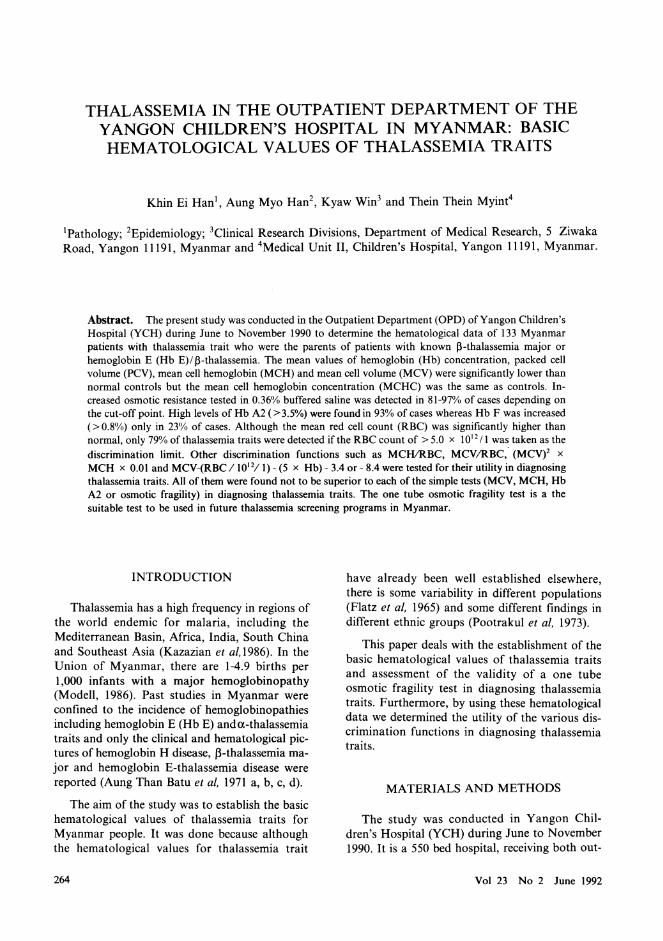
THALASSEMIA IN THE OUTPATIENT DEPARTMENT OF THE YANGON CHILDREN'S HOSPITAL IN MYANMAR: BASIC HEMATOLOGICAL VALUES OF THALASSEMIA TRAITS
Khin Ei Han1, Aung Myo Han2, Kyaw Win3 and Thein Thein Myint4
1Pathology; 2Epidemiology; 3Clinical Research Divisions, Department of Medical Research, 5 Ziwaka Road, Yangon 11191, Myanmar and 4Medical Unit II, Children's Hospital, Yangon 11191, Myanmar.
Abstract. The present study was conducted in the Outpatient Department (OPD) of Yangon Children's Hospital (YCH) during June to November 1990 to determine the hematological data of 133 Myanmar patients with thalassemia trait who were the parents of patients with known J3-thalassemia major or hemoglobin E (Hb E)/J3-thalassemia. The mean values of hemoglobin (Hb) concentration, packed cell volume (PCV), mean cell hemoglobin (MCH) and mean cell volume (MCV) were significantly lower than normal controls but the mean cell hemoglobin concentration (MCHC) was the same as controls. Increased osmotic resistance tested in 0.36% buffered saline was detected in 81-97% of cases depending on the cut-off point. High levels of Hb A2 (>3.5%) were found in 93% of cases whereas Hb F was increased (> 0.8%) only in 23% of cases. Although the mean red cell count (RBC) was significantly higher than normal, only 79% of thalassemia traits were detected if the RBC count of > 5.0 x 10¹² /1 was taken as the discrimination limit. Other discrimination functions such as MCHlRBC, MCVIRBC,- (MCV)2 x MCH x 0.01 and MCV-(RBC /1012/ I) - (5 x Hb) - 3.4 or - 8.4 were tested for their utility in diagnosing thalassemia traits. All of them were found not to be superior to each of the simple tests (M CV, M CH, Hb A2 or osmotic fragility) in diagnosing thalassemia traits. The one tube osmotic fragility test is a the suitable test to be used in future thalassemia screening programs in Myanmar.
INTRODUCTION
Thalassemia has a high frequency in regions of the world endemic for malaria, including the Mediterranean Basin, Africa, India, South China and Southeast Asia (Kazazian et al,1986). In the Union of Myanmar, there are 1-4.9 births per 1,000 infants with a major hemoglobinopathy (Modell, 1986). Past studies in Myanmar were confined to the incidence of hemoglobinopathies including hemoglobin E (Hb E) and a-thalassemia traits and only the clinical and hematological pictures of hemoglobin H disease, /3-thalassemia major and hemoglobin E-thalassemia disease were reported (Aung Than Batu et aI, 1971 a, b, c, d).
The aim of the study was to establish the basic hematological values of thalassemia traits for Myanmar people. It was done because although the hematological values for thalassemia trait
have already been well established elsewhere, there is some variability in different populations (Flatz et aI, 1965) and some different findings in different ethnic groups (Pootrakul et aI, 1973).
This paper deals with the establishment of the basic hematological values of thalassemia traits and assessment of the validity of a one tube osmotic fragility test in diagnosing thalassemia traits. Furthermore, by using these hematological data we determined the utility of the various discrimination functions in diagnosing thalassemia traits.
MATERIALS AND METHODS
The study was conducted in Yangon Children's Hospital (YCH) during June to November 1990. It is a 550 bed hospital, receiving both out-
Vol 23 No 2 June 1992 264

HEMATOLOGICAL VALUES OF THALASSEMIA TRAITS
patients and in-patients. It is also a referral hospital which covers the population both from Yangon and from other parts of the country. The Outpatient Department (OPD) has a day care room (DCR) which was established in May 1982 for patients requiring regular blood transfusion.
There were 545 patients registered at the DCR since its opening till the end of November 1990. Of these, 493 (90%) were thalassemics and the parents of 132 patients with known f3-thalassemia major and Hb E/f3-thalassemia were included in the study.
The blood samples of 133 parents heterozygous for thalassemia (40 males and 93 females) aged 22-53 years were collected in heparinized and EDTA bottles. Control samples were obtained from 30 apparently healthy individuals who came to YCH blood bank for blood donation during the study period. These 30 controls (4 females and 26 males aged 18-47 years) were enrolled in the study after excluding all the persons with positive osmotic fragility test and low hemoglobin level with either high level of hemoglobin A2 (Hb A2) or low mean cell hemoglobin level (MCH) from a total of 89 individuals. However, iron status of these controls were not estimated.
Red cell osmotic resistance was tested in 0.36 per cent buffered saline (Kattamis et ai, 1981) from heparinized blood of both test and control individuals before the hemolysate was prepared. After preparation of hemolysate according to a standard method (Dacie and Lewis, 1975), Hb A2 was quantified by elution following cellulose acetate electrophoresis in Tris-borate EDTA buffer pH 8.6 (Marengo-Rowe, 1965; Weatherall and Clegg, 1981). Hemoglobin F (Hb F) was determined according to i;llkaline denaturation method of Betke (1959). Two ml of EDTA blood were used for the determination of standard hematological tests, which were performed as described by Dacie and Lewis (1975). The red cell counts (RBC) were measured by a Coulter electronic cell counter (Coulter Counter CC VI). The differences between the test (parents) and control subjects were tested for statistical significance by using Student's t test.
The discrimination functions (methods) used were the Mentzer ratio MCV IRBC (Mentzer, 1973), the Shine and Lal product (MCV)2 x MCH x 0.01 (Shine and Lal, 1977), the Srivastava ratio
Vol 23 No 2 June 1992
MCH/RBC (Srivastava, 1973) and England and Fraser discrimination function DF' = MCVRBC-(5 x Hb) - 8.4or -3.4(Englandetal, 1973). The discrimination limits (cut-off points) which suggest heterozygous thalassemia were as follows : RBC > 5.0 x 10¹² /l (Klee et ai, 1976), MCV I RBC ratio= <13,(MCVi x MCH x 0.01 = < 1,530, MCH/RBC = < 3.8, negative value ofDF' and per cent hemolysis of < 95% (Miale, 1977) or < 85% (Kattamis et ai, 1981). These discrimination functions were applied to our hematological data.
RESULTS
The hematological findings of thalassemia traits (parents of thalassemic children) are shown in Table 1 together with those of the normal controls. The mean values of the hemoglobin concentration (Hb gldl), the packed cell volume (PCV), mean cell volume (MCV), mean cell hemoglobin (MCH) and per cent lysis were significantly (p < 0.001) lower in the heterozygotes than in controls. However, the mean value of mean cell hemoglobin concentration (MCHC) was similar in both groups.
The mean values of RBC and Hb A2 concentration were also significantly (p < 0.001) higher than in normal controls. Out of 133 heterozygote samples, 48 contained hemoglobin E (Hb E) with mean values of Hb A2 and E of 28.6%.
The mean Hb F value was higher but not significantly so than in normal controls. Only 33.8% had Hb F levels of > 0.8 per cent, while the remaining 66.2% showed low levels « 0.8 per cent).
Table 2 shows the comparison of methods used for detecting thalassemia trait. All the discrimination functions and the red cell counts had similar diagnostic accuracy (%) in detecting thalassemia trait. However, the osmotic fragility test identified more cases of thalassemia trait than the above discrimination functions when per cent hemolysis of < 95% was taken as the cut-off point or when the visual method (Kattamis et ai, 1981) was used.
DISCUSSION
Of the 133 known cases of f3-thalassemia traits (parents of f3-thalassemia major and Hb E/f3
265

SOUTHEAST ASIAN J TROP MED PUBLIC HEALTH
Table 1
Hematological data for parents (with thalassemia traits and/ or hemoglobin E) of thalassemic children taking treatment and controls at Yangon Children's Hospital, 1990.
Parents of thalassemic Controls (n = 30) children
Mean ± SD No. Mean ± SD
Hb g/dl 11.5 ± 1.6 133 12.9 ± 1.4 PCV% 38.3 ± 4.8 133 43.2 ± 4.8 RBC (x 1012 /1) 5.9 ± 1.0 133 4.4 ± 0.6 MCV fl 62.7 ± 12.1 133 94.0 ± 6.9 MCHpg 19.9 ± 3.5 133 29.5 ± 2.4 MCHC% 29.3 ± 2.2 133 29.2 ± 1.7 Osmotic fragility lysis % 55.2 ± 25.7 126 94.9 ± 5.1 HbA2&E% 34.4 ± 17.2 48 HbA2% 5.7 ± 1.3 85 3.4 ± 0.6 HbF% 1.1± 2.4 133 0.5 ± 0.3
Table 2
Comparison of methods of detecting thalassemia traits, YCH 1990.
Thalassemia Traits Method/ Discrimination formula limits Detected Missed Total
Discrimination functions : (1) MCV-RBC-5Hb-3.4 negative 83 (62.4%) 50 (37.6%) 133 (2) MCV-RBC-5Hb-8.4 negative 102 (76.7%) 31 (23.3%) 133 (3) MCV: RBC <13 95 (71.4%) 38 (28.6%) 133 (4) MCH: RBC < 3.8 89 (66.9%) 44(33.1%) 133 (5) 0.01 x MCH x (MCV)2 < 1530 118 (88.7%) 15(11.3%) 133 RBC counts (x 1012/1) > 5.0 105 (79.0%) 28 (21.0%) 133 Osmotic fragility per cent hemolysis < 95% 122 (96.8%) 4 ( 3.2%) 126
< 85% 102 (81.0%) 24 (19.0%) 126 Visual method smoky / cloudy 115 (91.3%) 11(8.7%) 126
thalassemia children) included in the study, 51 1973). Regarding the diagnosis, if the cut-off cases (38.3%) had mild to moderate degrees of points for thalassemia trait were taken as MCV < anemia « 11g / dl), including 3 males and 48 70fl,MCH < 27pgandHbA2 > 3.4%, 79.7%,97.7% females. Apart from Hb A2 and red cell count, the and 92.9% of the thalassemia traits were identified mean values of MCV, MCH, MCHC and Hb F by each test, respectively. Hence, the MCH and were slightly lower than the values of Thai and Hb A2 seemed to be the best parameters for diagChinese populations in Thailand (Pootrakul et ai, nosing thalassemia trait in our country too. How
266 Vol 23 No 2 June 1992

HEMATOLOGICAL VALUES OF THALASSEMIA TRAITS
ever, if these tests are not available, the one tube osmotic fragility test in 0.36% buffered saline can be used alternatively. With this test, 96.8% of traits were detected if the per cent hemolysis of < 95% was taken as the cut-off point. But if either the visual method was used or the per cent hemolysis of < 85% was taken as the cut-off point instead, the diagnostic accuracy decreased to 91.3% and 81% respectively.
On the whole, 3-7% of heterozygous ~-thalassemics can be missed by using either of these tests (MCH, Hb A2 and osmotic fragility test) alone. This can happen when there is a combination of .~-thalassemia with a-thalassemia trait or if there is associated G6PD or folate deficiency. Normal Hb A2 could be found in ~-thalassemia trait when there was the coincidence of a ~-with a i)-thalassemia gene (Pirastu et ai, 1984). Iron deficiency is another factor which influences the Hb A2 level (Wasi et ai, 1968).
In Myanmar, because of the high incidence of a-thalassemia (10%) and Hb E (28%) (Aung Than Batu et ai, 1971a, b, c) as well as of iron deficiency anemias, it would be better to use more than one test in carrier screening. Besides this, overlapping was noticed between the ranges of hematological parameters of normal and thalassemia trait, as sometimes there can be uncertainties in the diagnosis of thalassemia trait by using one parameter alone. When MCH was done either together with Hb A2 or osmotic fragility test (visual method) 99.2% of the cases were detected and when all 3 tests were done together, there were no missed cases at all.
Regarding erythrocytosis, others have found this in 50% to almost 100% cases of ~-thalassemia traits (Hammond et al,1964, Silvestroni and Bianco, 1949). In our cases, 79% of the heterozygotes had erythrocytosis and 21 % of the cases would be missed ifRBC > 5.0 x 10¹² II was used as the diagnostic criterion for thalassemia trait. This finding is comparable to the findings of others (Chalevelakis et ai, 1984).
In the present study, unlike others, all the discrimination functions were not superior to either of MCH, Hb A2 or the osmotic fragility test alone. This might be because our test group with ~
thalassemia traits had iron deficiency anemia, athalassemia or Hb E.
Vol 23 No 2 June 1992
We conclude that in Myanmar the simplest and least expensive test suitable for use in future screening programs for thalassemia traits is the one tube osmotic fragility test in 0.36% buffered saline using the cut-off of > 95%.
ACKNOWLEDGEMENTS
The authors are grateful to all the responsible persons from Yangon Children's Hospital, Myanmar who have helped in every way during the conduct of this study. We are also indebted to Japan International Cooperation Agency (nCA) for supplying reagents and chemicals and to Professor Yoshihiro Hamashima, leader of the nCA evaluation team for his encouragement and support.
REFERENCES
Aung-Than-Batu, Hla-Pe. Hemoglobinopathies in Burma. I. The incidence of hemoglobin E. Trop Geogr Med 1971a; 23 : 15-9.
Aung-Than-Batu, V Hla-Pe, Khin-Kyi-Nyunt. II Hemoglobin H disease. Trop Geogr Med 1971 b; 23 : 19-23.
Aung-Than-Batu, V Hla-Pe, Khin-Kyi-Nyunt. III The incidence ofa-thalassemia trait. Trop Geogr Med 1971c; 23 : 23-5.
Aung-Than-Batu, V Hla-Pe, Khin-Kyi-Nyunt, Tin-V. IV. Thalassemia-haemoglobin E disease and thalassemia major. Trop Geogr Med 1971d; 23 : 25-9.
Betke K, Marti HR, Schlicht L. Estimation of small percentages of fetal hemoglobin. Nature 1959; 184 : 1877-8.
Chalevelakis G, Tsiroyannis K, Hatziioannou J, Arapakis G. Screening for thalassemia and/or iron deficiency : evaluation of some discrimination functions. Scand J Clin Lab Invest 1984; 44 : 1-6.
Dacie JV, Lewis SM. Practical Hematology, 5th ed. Edinburgh: Churchill Livingstone, 1975.
England JM, Fraser PM. Differentiation of iron deficiency from thalassemia trait by routine blood count. Lancet 1973; 1 : 449-52.
England JM, Bain BJ, Fraser PM. Differentiation of iron deficiency from thalassemia trait. Lancet 1973; 1 : 1514.
Flatz G, Pik C, Sringam S. Hemoglobinopathies in Thailand. III Incidence and distribution of elevations of
267

SOUTHEAST ASIAN J TROP MED PUBLIC HEALTH
hemoglobin A2 and hemoglobin F; A survey of 2790 people. Br J Haematol1965; 2 : 227-36.
Hammond D, Sturgeon P, Bergren W, Caviles A Jr. Definition of Cooley's trait or thalassemia minor: classical, clinical and routine laboratory hematology. Ann NY Acad Sci 1964; 119 : 372.
Kattamis C, Efremov G, Pootrakul S. Effectiveness of one tube osmotic fragility screening in detecting l3-thalassemia trait. J Med Genet 1981; 18 : 266-70.
Kazazian HH Jr, Dowling CE, Waber PG, Huang S, Lo WHY. The spectrum of l3-thalassemia genes in China and Southeast Asia. Blood 1986; 68 : 964-6.
Klee GG, Fairbanks VF, Pierre RV, et al. Routine erythrocyte measurements in diagnosis of iron deficiency anemia and thalassemia minor. Am J Clin Patho11976; 66 : 870-7.
Marengo-Rowe AJ. Rapid electrophoresis and quatitation of hemoglobin on cellulose acetate. J Clin Pathol 1965; 18 : 790-2.
Mentzer Wc. Differentiation of iron deficiency from thalassemia trait. Lancet 1973; I : 882.
Miale lB. Laboratory methods, 5th ed. St Louis : CV Mosby, 1977.
Modell B. Thalassemia in Burma : significance of the problem and possibilities for control. Assignment report. London : University College Hospital, 1986.
Pirastu M, Kan YW, Galanello R, Cao A. Multiple mutations produce/) -13 zero thalassemia in Sardinia. Science 1984; 223 : 929-30.
Pootrakul P, Wasi P, Na-Nakorn S. Hematological data in 312 cases of l3-thalassemia trait in Thailand. Br J Haematol1973; 24 : 703-12.
Shine I, Lal S. A strategy to detect a-thalassemia minor. Lancet 1977; I : 692-4.
Silvestroni E, Bianco 1. Microcytemia constitutional microcytic anemia and Cooley's anemia (Mediterranean anemia or thalassemia). Am J Hum Genet 1949; I : 83.
Srivastava Pc. Differentiation of thalassemia minor from iron deficiency. Lancet 1973; 2 : 154-5.
Wasi P, Disthasongchan P, Na-Nakorn S. The effect of iron deficiency on the levels of hemoglobins A2 and E. J Lab Clin Med 1968; 71 : 85-91.
Weatherall DJ, Clegg lB. The Thalassemia Syndromes, 3rd ed. Oxford: Blackwell Scientific Publications 1981.
Vol 23 No 2 June 1992 268
Top Related