


Languages
Pages
Legal

Thailand Logistics Development: Yesterday, Today & Tomorrow
Ruth Banomyong (PhD)
Director, Centre for Logistics Research
Thammasat University
The author would like to acknowledge the NESDB for the data & the slides

1
2
Supply Chain Corridor Connectivity & Assessment 3
Thailand’s Logistics Costs 2011-12
Agenda
4
Thailand’s National Logistics Development Plan (2007 – 2011)
National Single Window

Capacity Building
To have a world-class logistics system to support being a center of business and trade in the Indochina Region Vision
Objectives
Strategic Agendas
1.To enhance trade facilitation with an aim to increase cost efficiency, customers’ responsiveness and reliability and security
2. To create value-added for the logistics and other supporting industries
5
Business Logistics
Improvement
Transport and Logistics Network
Optimization
Logistics Service Internationali-
zation
Trade Facilitation Enhancement
4 1 2 3
Thailand’s National Logistics Development Plan (2007 – 2011) Endorsed on February 27, 2007
Industry/ Agricultural
Mins Industrial Logistics
Development Sub-
committee
Transport Min
Education/ Labour Mins/
NESDB
Commerce Min
Finance Min
Integrated Information and
Database Development for
Export, Import and Logistics
Agricultural Logistics
Development Sub-committee
Responsible Agency
Sub-Committee
Task Force
Infrastructure and Economic
Development for the Western Gateway
Sub-committee Task Force for the 2nd National Logistics Development Strategies
and Plan

Logistics Industry’s Value Added Thailand’s Logistics Cost per GDP from
2001-2011
Thailand has a downward trend of logistics cost per GDP over the past decade; from 18.8 % in 2000 to
17.8% in 2006 and 15.2% in 2010.
The Logistics industry contributes about 10 Billion US$ to the economy, accounting for 3 percent of the total
GDP and providing 3.5 million employment
Logistics Cost Efficiency and Value Added by Logistics Industry
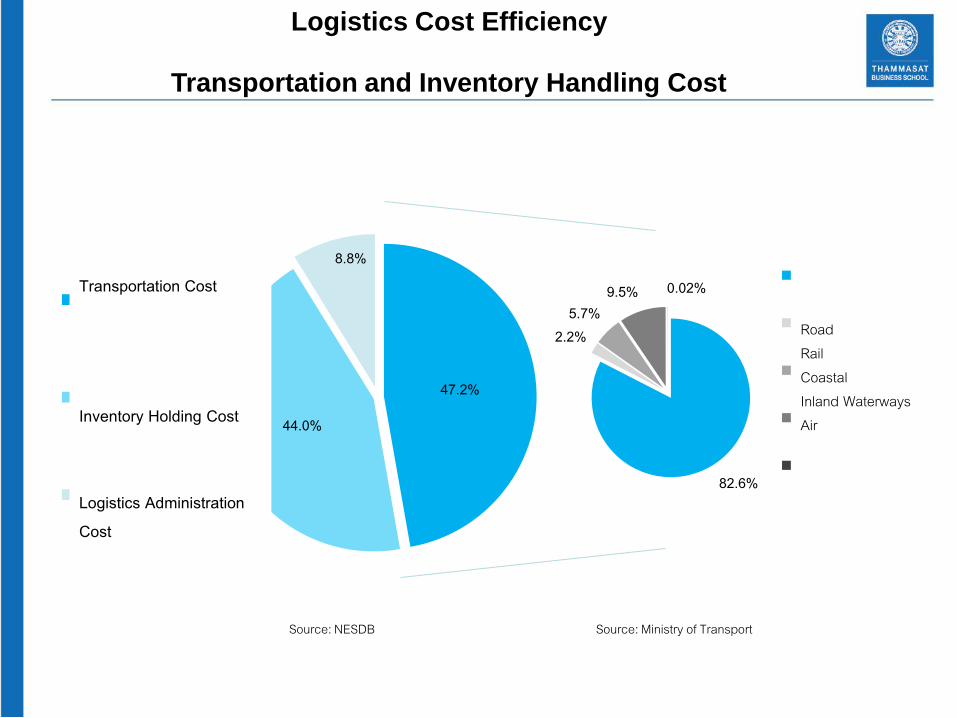
47.2%
44.0%
8.8%
ต้นทุนค่าขนส่งสินค้า
ต้นทุนการเก็บรักษาสนิค้าคงคลัง
ต้นทุนการบริหารจดัการ
Transportation Cost
Inventory Holding Cost
Logistics Administration Cost
82.6%
2.2% 5.7%
9.5% 0.02% ถนน
ราง
ชายฝ่ังทะเล
ทางน า้ในประเทศ
อากาศ
Road Rail Coastal Inland Waterways Air
Source: Ministry of Transport Source: NESDB
Logistics Cost Efficiency
Transportation and Inventory Handling Cost

Success Stories: Corridor Connectivity Development under GMS and ASEAN
High Speed Train Thailand –Laos-China Train project connecting Singapore-
China
Border Trade Development
Dawei Deep Sea Port and Industrial Zone Development
Traffic Right Exchange between Thailand-Laos-China
and 4th Friendship Bridge
ASEAN Political and Security Community
ASEAN Economic Community
ASEAN Socio-Cultural
Community
Hadyai-Sadao Motorway
ASEAN Community
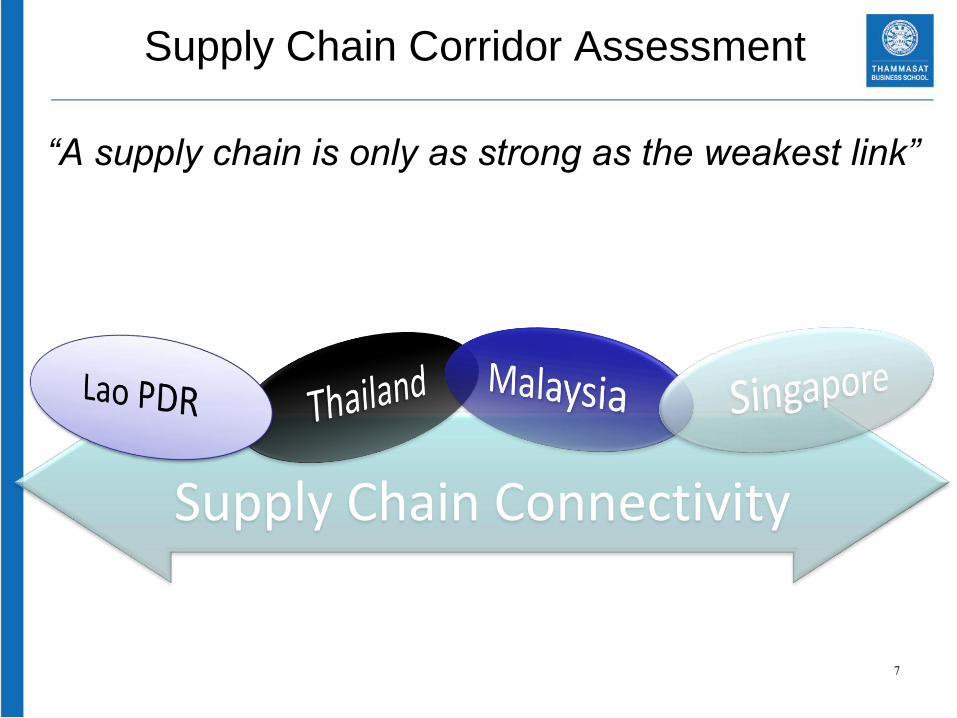
Supply Chain Connectivity
Supply Chain Corridor Assessment
“A supply chain is only as strong as the weakest link”
7

8
Transport to border
Wait at border
crossing/change
transport mode
Transport
to sea port
Wait at
sea port
Sea transport
500 km 1000 km 2000 km 1500 km
Day 4
Day 3
Day 2
Day 1
$400
$300
$200
$100
Point of Origin
Destination
The Banomyong model

Supply chain modelling: cost (2006)
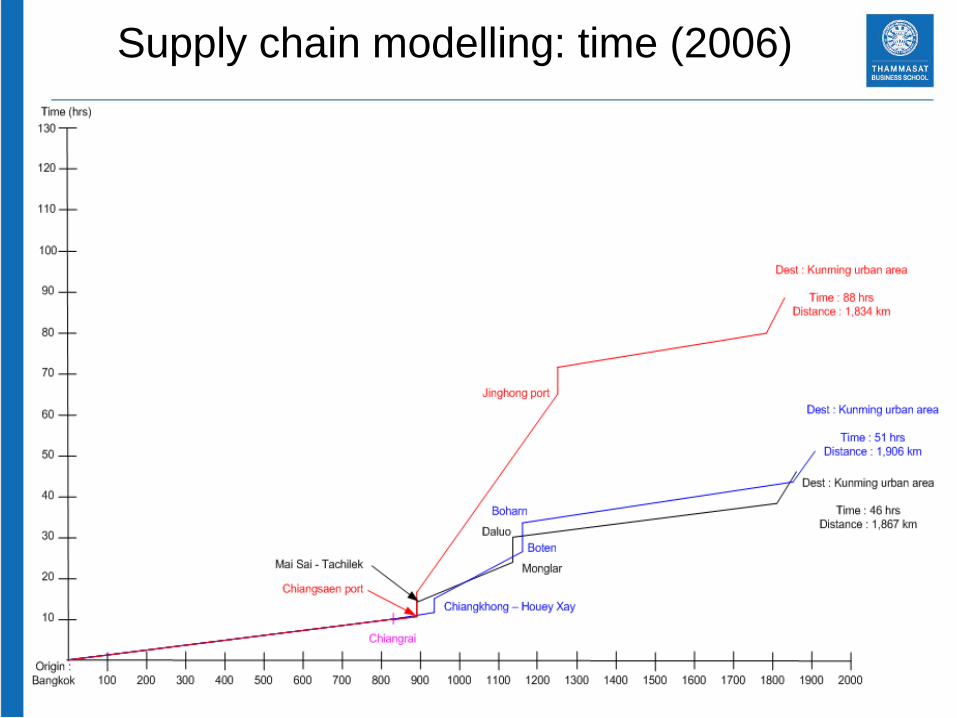
Supply chain modelling: time (2006)

Disastrous floods in late 2011
Thailand’s worst floods in 50 year-history,
devastated 33 provinces and drastically
impacted 7 industrial estates, causing a major
supply chain disruption both nation and
worldwide as well as impacting investors’
confidence
The Ratchaprasong Intersection
Closure in 2010
From 12 March to 23 April 2010 which
extensively disrupted the nation’s
administration, the public’s daily life
and tourism as well as impacted
investors’ confidence in the economy
Suvarnabhumi Airport Closure
From 24 November to 3 December 2008,
which caused a major disruption for
commercial airlines, both domestic and
international, impacting 779 flights/day
and freight transportation of 1,600
tons/day
2008 2009 2010 2011 2012
Unanticipated risk?
Domestic Factors Causing Supply Chain Disruption
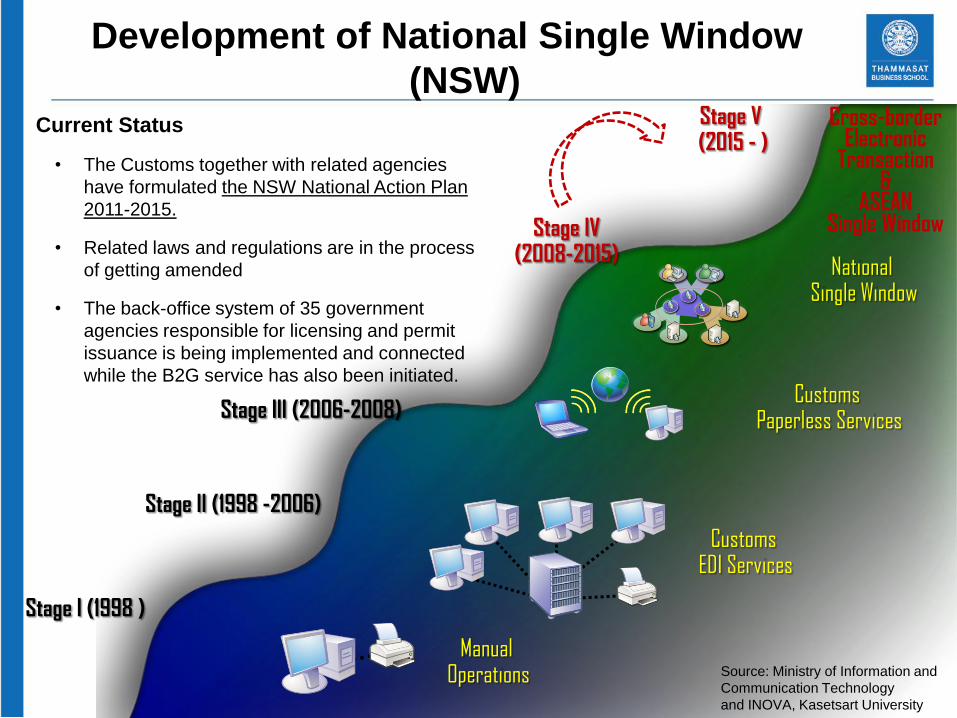
Development of National Single Window
(NSW)
Stage I (1998 )
Manual Operations
Customs EDI Services
Source: Ministry of Information and
Communication Technology
and INOVA, Kasetsart University
Stage V (2015 - )
Cross-border Electronic
Transaction &
ASEAN Single Window
Stage II (1998 -2006)
Customs Paperless Services Stage III (2006-2008)
National Single Window
Stage IV (2008-2015)
Current Status
• The Customs together with related agencies
have formulated the NSW National Action Plan
2011-2015.
• Related laws and regulations are in the process
of getting amended
• The back-office system of 35 government
agencies responsible for licensing and permit
issuance is being implemented and connected
while the B2G service has also been initiated.
Source: NESDB
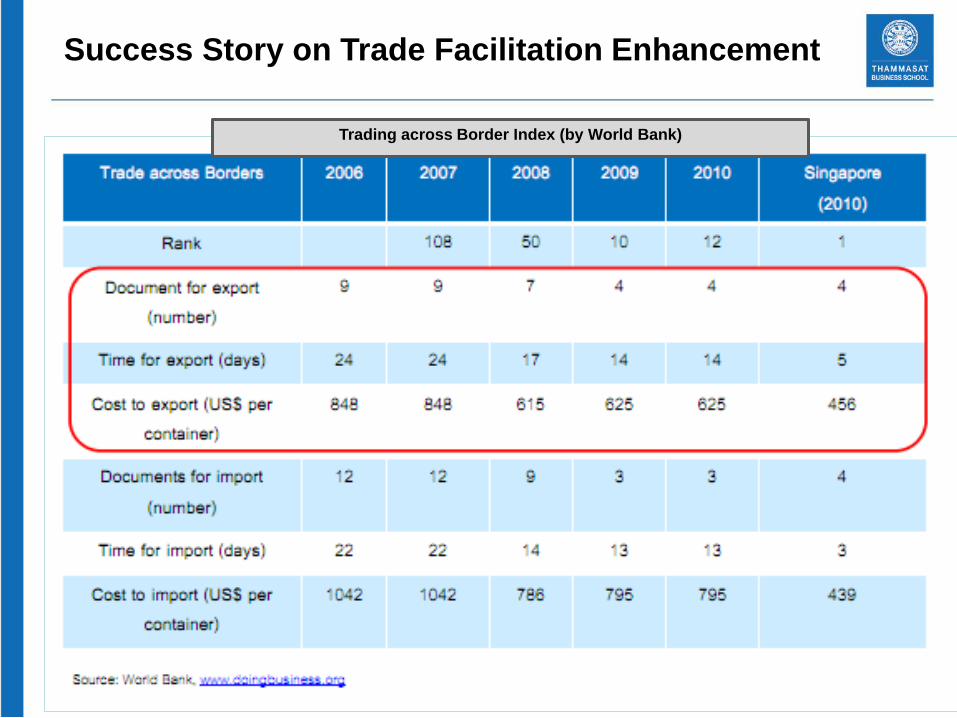
Success Story on Trade Facilitation Enhancement
Trading across Border Index (by World Bank)

Thank you for your attention
Comments & Questions are welcomed…
Top Related