


Languages
Pages
Legal


Accepted Manuscript
Textural modification of 3D printed dark chocolate by varyinginternal infill structure
Sylvester Mantihal, Sangeeta Prakash, Bhesh Bhandari
PII: S0963-9969(18)30981-5DOI: https://doi.org/10.1016/j.foodres.2018.12.034Reference: FRIN 8159
To appear in: Food Research International
Received date: 3 December 2018Revised date: 19 December 2018Accepted date: 22 December 2018
Please cite this article as: Sylvester Mantihal, Sangeeta Prakash, Bhesh Bhandari , Texturalmodification of 3D printed dark chocolate by varying internal infill structure. Frin (2018),https://doi.org/10.1016/j.foodres.2018.12.034
This is a PDF file of an unedited manuscript that has been accepted for publication. Asa service to our customers we are providing this early version of the manuscript. Themanuscript will undergo copyediting, typesetting, and review of the resulting proof beforeit is published in its final form. Please note that during the production process errors maybe discovered which could affect the content, and all legal disclaimers that apply to thejournal pertain.
ACC
EPTE
D M
ANU
SCR
IPT
Textural modification of 3D printed dark chocolate by varying internal infill structure
Sylvester Mantihal, Sangeeta Prakash, Bhesh Bhandari* [email protected]
School of Agriculture and Food Sciences, the University of Queensland, St Lucia QLD 4072, Australia
*Corresponding author.
Abstract
This study aimed to create an intricate internal structure of 3D printed chocolate by varying the
infill construction. Three intricate infill patterns designed were star, Hilbert curve and honeycomb
with infill percentage of 5%, 30%, 60% and 100%. Cadbury dark chocolate (Choc-1) and
Callebaut bittersweet dark chocolate (Choc-2) powders were used by incorporating magnesium
stearate (Mg-ST) and plant sterol (PS) powders as food additives. Printing parameters were set up
with an extrusion temperature of 32°C, nozzle size of 0.78 mm and printing speed of 70 mm/s.
The results showed that voids in printed samples of all three pattern with 5% infill density ranged
from 60.8 ± 2.1 % to 72.2 ± 1.8 %. Voids in samples with 30% infill density ranged from 20.9 ±
2.1 % to 49.2 ± 3.6 % while with 60% infill density it ranged from 11.6 ± 2.3 % to 19.4 ± 4.2 %.
Additionally, star and honeycomb infill pattern produced the most stable and tough structure at
60% infill as indicated by a higher normal force (N) to break the printed sample. Moreover, even
at 100% infill percentage, 3D printed chocolate were found less hard (ranged from 82.2 ± 2.2 N to
92.2 ± 1.3 N) as compared to cast samples (>110 N) in the snap test. The results obtained in this
study provide a useful insight in creating various internal structures of 3D printed dark chocolate
with different textural characteristic and physical stability.
Keywords: 3D food printing, Infill pattern, Infill percentage, void fraction
ACCEPTED MANUSCRIPT

ACC
EPTE
D M
ANU
SCR
IPT
1. Introduction
The application of 3D printing technology in food provides an excellent opportunity to create
complex and innovative products. The 3D printing is a layer-by-layer deposition process in which
each layer is deposited and overlap on each other to create a desired 3D shape. This technology
has the potential to personalise products either in shapes and/or nutritional requirement. Currently,
there are attempts made by different research groups in investigating various food materials as an
edible ink for 3D food printing (3DFP) such as chocolate (Hao et al., 2010), mashed potato
derived from potato flakes (Liu, Bhandari, Prakash, & Zhang, 2018), cheese (Le Tohic et al.,
2018) and cereal-based product (Severini, Derossi & Azzollini, 2016). 3DFP enables the creation
of a wide range of food items with variable textures, nutrients contents, taste and shapes by using
a limited number of raw materials/ingredients. Texture tailored foods can be achieved by
designing eccentric food structure with a computer-aided design (CAD) (Sun, Peng, Yan, Fuh, &
Hong, 2015). Furthermore, multiple ingredients (varying in flavour and nutritional value) can be
printed at once by using multiple cartridges; thus, it is a powerful tool in personalised nutrition
applications (Liu, Zhang, Bhandari, & Wang, 2017; Jie Sun et al., 2015; Wegrzyn, Golding, &
Archer, 2012; F. Yang, Zhang, & Bhandari, 2015). Cohen et al. (2009) showed the concept of
creating a more extensive range of textures and tastes by mixing small group of hydrocolloids and
flavours additives.
Altering structural properties in designing food to modify the textural properties such as
infill structure is relatively new in 3D food printing field. Infill refers to the structure that is
printed inside the 3D construct (RepRap, 2016). It is extruded in selected pattern and density and
set as a parameter in the slicing software (Sli3er). Structural properties of the 3D object by varying
infill structure has been investigated mostly in polymer and bio-printing. Acrylonitrile Butadiene
Styrene (ABS) and Polylactic Acid (PLA) are the most common polymer used in filament printing
(RepRap, 2016) and Hydrogel material (Sood, Ohdar, & Mahapatra, 2010) are commonly used in
bio-printing. In Polymer printing, the tensile strength of 3D constructs was found to be dependent
ACCEPTED MANUSCRIPT

ACC
EPTE
D M
ANU
SCR
IPT
on constructs’ infill structure (McLouth, Severino, Adams, Patel, & Zaldivar, 2017; Sood et al.,
2010). Fernandez-Vicente, Calle, Ferrandiz, and Conejero (2016) reported that honeycomb pattern
was relatively tough with an increase in infill density (20%, 50% and 100%) as compared to
rectilinear and line patterns. Fatimatuzahraa, Farahaina, and Yusoff (2011) demonstrated that
crisscross structure (45°/-45°) produces a higher mechanical strength (deflection, flexural and
impact test) as compared to axial (0°) and transverse (90°) structures. However, cross pattern
(0°/90°) showed a higher tensile strength as compared to crisscross, axial and transverse due to
cross-section structure. Moreover, the tensile strength of 3D constructs printed in 0.2 mm layer
thickness were stronger as compared to sample printed in 0.4 mm layer thickness (Rankouhi,
Javadpour, Delfanian, & Letcher, 2016). In bio-printing field, a support structure is necessary for
fabricating a stable structure for cell and tissues development (Murphy & Atala, 2014). Kang et al.
(2016) reported that cell-laden hydrogel incorporated with biodegradable polymer printed in an
integrated pattern could achieve higher mechanical stability as it can maintain a stable structure as
compared to hydrogel printed in the un-integrated pattern. A well-developed inner structure in 3D
tissues construction such as cross-link pattern was essential to maintain the mechanical properties
of the constructs (Williams, Thayer, Martinez, Gatenholm, & Khademhosseini, 2018).
Very recently, there were reports on designing internal structure of 3D constructs in order
to modify the textural properties of the printed foods. Liu et al. (2018) investigated the textural
and structural quality of mashed potato (soft material) by modifying infill percentage (10%, 40%,
70% and 100%) with different infill patterns (rectilinear, honeycomb and Hilbert curve) and
variation in shell perimeters (3, 5 and 7 shells). They reported that firmness values 25.15 g to
144.81 g and Young modulus (487.99 Pa to 43,306.50 Pa) increased and solely affected by
variation in infill density between 10% and 70%. This indicates that an increase in infill
percentage will increase the mechanical strength (firmness and Young modulus) of the 3D printed
mashed potato. Severini, Derossi, and Azzollini (2016) reported that the addition of an inner
support structure (cross and parallel) was essential to hold the 3D printed cereal-based product for
ACCEPTED MANUSCRIPT
ACC
EPTE
D M
ANU
SCR
IPT
post-processing to make the constructs more stable. In this case, the infill structure was mainly
designed to aid the stability of the construct.
However, in regards to edible material, there are only a few information available mainly
on soft materials (Le Tohic et al., 2018; Liu et al., 2018) of the infill structure on constructs’
textural properties. Textural and physical properties are essential characteristics of any edible
material as they indicate the product quality. For example, a glossy appearance and snap is a
common way to determine a good quality of the chocolate product (Beckett, 2008). A good snap is
the ability to break apart easily and related to mechanical properties of chocolate. The snap- ability
of 3D printed chocolate could be influenced by the modification textural properties by varying the
infill structure in the construct. To our knowledge, there is no information regarding the
modification of the textural properties of a 3D printed chocolate. Therefore, we aim to investigate
the effect of internal structure on the mechanical properties of 3D printed chocolate by varying
infill patterns and infill percentage. We will compare the mechanical properties of 3D printed
chocolate with conventional cast chocolate samples.
2. Materials and methods
2.1.1 Materials
Two types of dark chocolates, Cadbury dark chocolate (Choc-1) and Callebaut dark
chocolate button (Choc-2) purchased locally were used in this study. A commercial Cadbury
chocolate was used as a control without any incorporation of flow enhancer. The composition of
Cadbury dark chocolate was 53% (minimum) cocoa solids, 35% (minimum) of cocoa butter, and
0.5% lecithin. Callebaut dark chocolate button (bittersweet flavour, Lindt Piccoli) was composed
of 58% (minimum) cocoa solids. 33% (minimum) cocoa butter, 5% anhydrous milk fat, 0.5%
lecithin and vanilla. Both dark chocolates were ground to powders in a controlled temperature
room (~ 5°C). Magnesium stearate (Mg-ST) or plant sterol (PS) was added into Choc-2 samples.
5% (w/w) of Mg-ST were added into 100g grounded Choc-2 and 3% (w/w) PS were added into
100g of grounded Choc-2. It is recognised as GRAS and was also used in the previous study
ACCEPTED MANUSCRIPT
ACC
EPTE
D M
ANU
SCR
IPT
(Mantihal, Prakash, Godoi, & Bhandari, 2017). Mg-ST is an approved food additive by FDA and
FSANZ and generally considered safe for consumption at an amount of 2.5g/kg body weight per
day (FSANZ, 2016; Allen, 2009). Meanwhile, PS was added as a processing and nutritional aid.
According to FSANZ, more than 3% of PS added to food would diminish its vital purpose as
lowering LDL (FSANZ, 2016). Hence, we added approximately 3% are per the recommendation.
2.1.2 Chocolate casting procedure
Casting samples were prepared to compare the textural property of layer-by-layer
deposited 3D printed chocolate with the bulk chocolate with same dimension as that of printed
sample. Prior casting, chocolate formulations with and without flow enhancer were melted at
around 32°C using a chocolate melting machine (ChocEdge, UK). Melted chocolate samples (with
and without flow enhancer) were poured into a 3D printed cast (in house printed using
Acrylonitrile Butadiene Styrene (ABS) filament, see Figure 1) covered by a thin layer of
transparent plastic wrap. All samples were kept in refrigeration at around 15°C until the initiation
of analysis.
2.1.3 3D-chocolate printing
3D-chocolate printing consisted of 3 steps: (1) geometry design, (2) slicing and (3) printing.
Geometry design: Chocolate structures (40.0 mm diameter and 10.0 mm height)
were designed using a TinkerCad online software.
Slicing: The 3D design was uploaded into the Repetier-Host software (in STL file)
and sliced using Sli3er to generate g-code for each model. The perimeter was set at
default 3 shells approximately ~ 2.34 mm thickness considering the nozzle
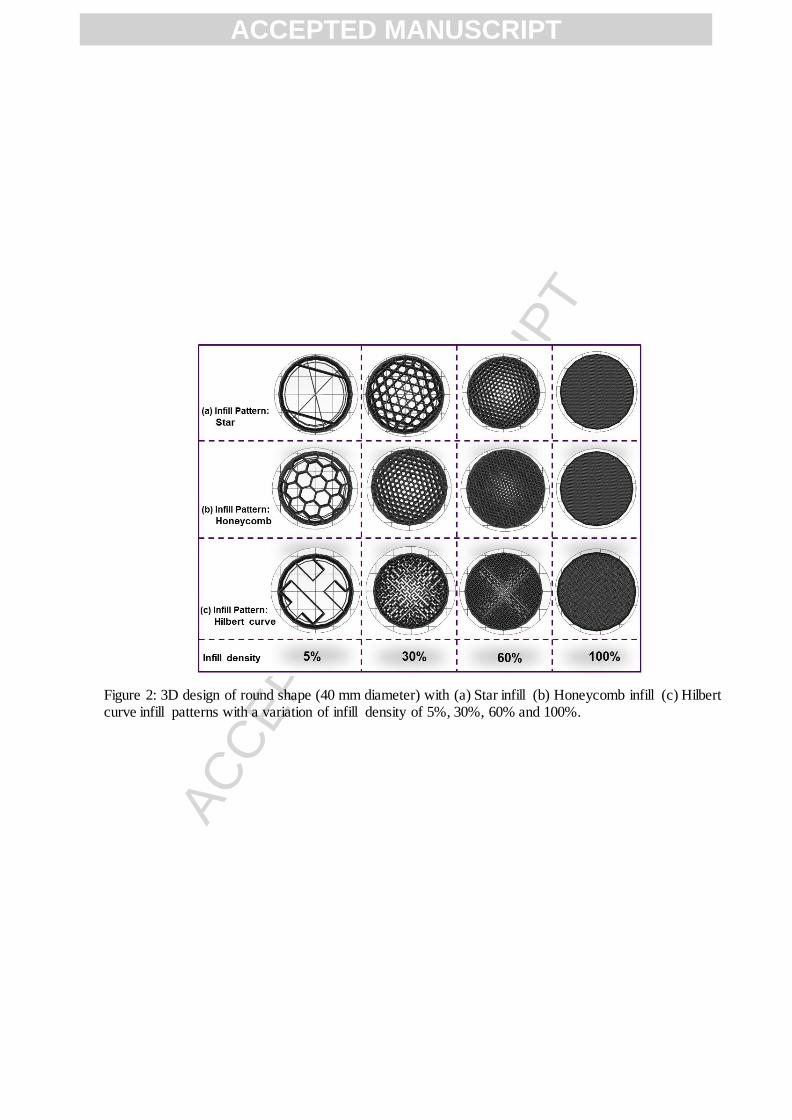
diameter is 0.78 mm. Three different infill structures (1) Star (2) Honeycomb and
(3) Hilbert curve were chosen with a variation of infill percentage 5%, 30%, 60%
and 100% for each infill pattern as shown in Figure 2. The infill structures pattern
were adapted from Liu et al. (2018) for mashed potato.
ACCEPTED MANUSCRIPT
ACC
EPTE
D M
ANU
SCR
IPT
Printing: 3D chocolate PORIMY 1.0 (PORIMY, Kunshan, China) equipped with a
rotary extrusion system used in this study is illustrated in Figure 3. Prior extrusion
process, the nozzle temperature was set at 32°C for 5 min to ensure a controlled
extrusion temperature is maintained. Printing speed set in the sli3er software was
70 mm/s. The nozzle diameter used was 0.78mm. These printing parameters were
optimized in a previous study (Mantihal et al., 2017). The printer bed temperature
was maintained between 15°C and 16°C by a recirculating water system. All
samples were sliced independently (specific g-code extracted for each 3D model)
according to each infill pattern and infill percentage using Sli3er. In between the
printing of each chocolate samples (Choc-1, Choc-2, Choc-2+ Mg-ST and Choc-
2+PS), the auger extruder was dismounted and cleaned using a cleaning detergent
and RO water and dried using compressed air. This was done to ensure the
hygienic operation of the 3D printer. A total of n=108 samples was prepared. All
printed samples were kept in refrigeration at around 15°C until the execution of
quality assessment analysis.
2.2 Shape fidelity and weight measurements of 3D printed chocolate
Digital weighing balance was used to measure the weight of each printed chocolate. A digital
calliper (0-150mm, CraftRight®, Bunnings, Australia) was used to measure the diameter and
height of 3D printed chocolate. The measurement (diameter and height) done in three different
locations on each printed samples and the average value was reported.
2.3 Textural characterisation of 3D printed chocolate
Textural properties of 3D printed chocolate were measured using a texture analyser (model TA-
XT plus, Stable microsystem, UK) and operating with Exponent version 6.1.9.0 software and a
TA-42 knife blade at room temperature around 23°C. The 3D printed chocolate was placed
vertically on the texture analyser platform as illustrated in the Figure 4 and supported with a
ACCEPTED MANUSCRIPT

ACC
EPTE
D M
ANU
SCR
IPT
custom adjustable holder to stabilise the sample on the platform. Compression mode was used to
analyse the samples at 10 mm distance. A pre-test of the speed of 1.0 mm/s and the test speed of
2.0 mm/s with 5.0g trigger force was applied. To ensure a uniform measurement, all samples
(regardless of infill pattern and percentage) were measured using the same method. The
measurement was conducted in triplicate and data of maximum force (N) force-displacement was
extracted.
2.4 Statistical analysis
Dimensional properties (weight, height and diameter), void fraction, and mechanical strength
(Force –N) were presented as mean value ± standard deviation. Minitab version 17 (statistical
software) was used to analyse the significant difference of between values using One-way
Analysis of variance (ANOVA) Tukey’s test (where applicable). The significant difference will be
determined at p-value (p) of less than 0.05.
3. Results and discussion
3.1.1 Visual appearance of 3D printed chocolate
Figure 5 illustrates, respectively, 3D-printed chocolate constructs with the variation of infill
pattern (Hilbert curve, honeycomb and Star) and infill percentage (5%, 30%, 60% and 100%). As
can be seen, the 3D-printed shapes with different infill structures were able to hold a layered
structure. Their physical properties are discussed in the subsequent sections.
3.1.2 Dimensional evaluation of 3D printed chocolate
Physical properties such as the construct diameter, height and weight are vital to determine
the precision of the 3D printer capability in constructing pre-determined chocolate design. The
weight, height and diameter of 3D printed chocolate are presented in Table 1a, 1b and 1c.
As expected, the weight of the printed chocolate was influenced by the variation (increase) in infill
percentage as the construct build a higher dimension as demonstrated in Figure 6 (weight of
ACCEPTED MANUSCRIPT
ACC
EPTE
D M
ANU
SCR
IPT
constructs as a function of infill percentage). This is because, as the infill percentage increased,
more amount of chocolate will be extruded to fill the internal structure. The relationship between
infill percentage and weight of the sample appeared non-linear with lesser weight change at higher
infill percentages. As can be seen in Table 1a, in general, the weight of printed constructs
increased from 5 % to 100% infill percentage regardless of all chocolate samples. In most cases,
chocolate samples printed in Star and Hilbert curve infill pattern were significantly different (p <
0.05) than that of samples printed in honeycomb infill pattern. This condition is possibly affected
by the extrusion of chocolate in pattern mesostructure as each pattern was different. Fernandez-
Vicente et al. (2016) also reported that the weight of polymer (acrylonitrile butadiene styrene -
ABS) printed in honeycomb infill pattern and 20% infill percentage were slight higher (15g) than
samples printed in Line and Rectilinear infill pattern (14g), respectively. This is indicating that
although the infill percentage is the same, a slight deviation in the weight may occur due to the
influence of infill pattern.
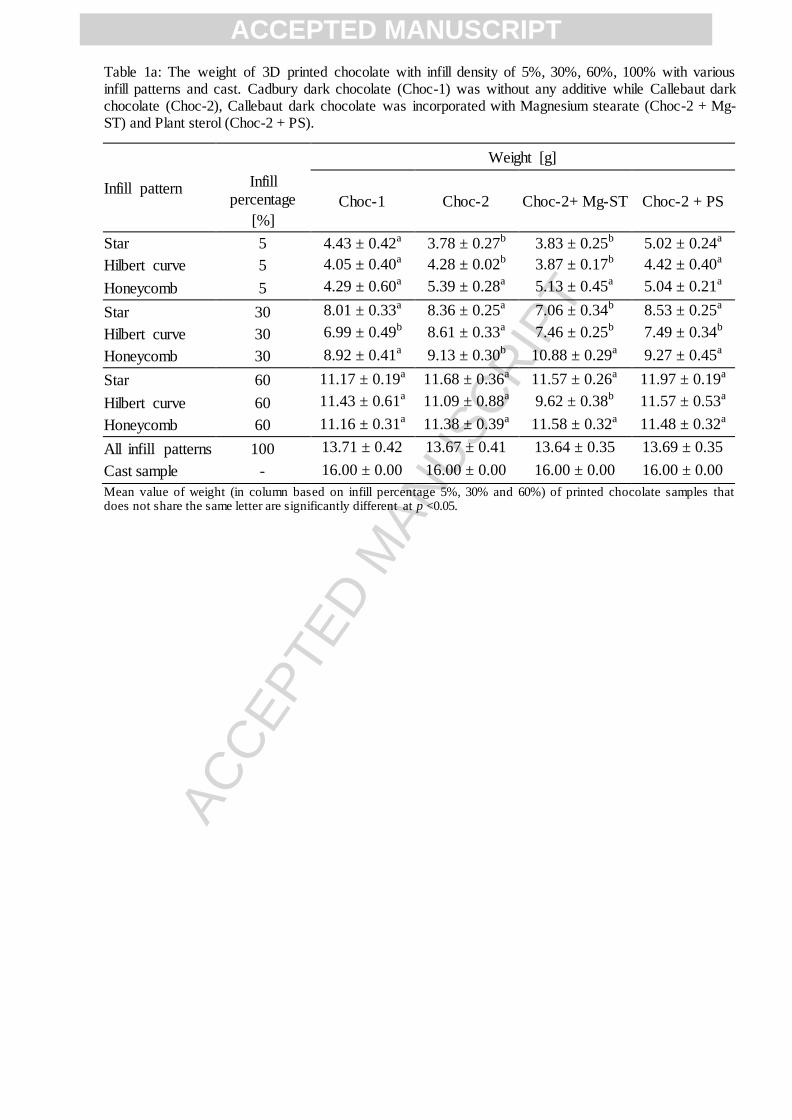
The average weight of 5% infill percentage (regardless of chocolate samples and infill
pattern) ranged from 3.83 ± 0.25 g to 5.13 ± 0.45 g. For samples with 30% infill percentage, the
weight ranged from 6.99 ± 0.49 g to 9.27 ± 0.45 g. For chocolate samples with 60% infill, the
variation of weight was from 9.62 ± 0.38 g to 12.51 ± 0.32 g. These findings were substantiated
with Liu et al. (2018) reported that an increase in infill percentage from 10% to 70%, the construct
weight significantly increased from 3 g to 9 g. Similarly, in polymer printing, Fernandez-Vicente
et al. (2016) also reported that as the infill percentage increase (rectilinear infill pattern) from 20%
to 100%, the 3D printed object weight dramatically increase from 10.6 g to 19.0 g. This clearly
indicates that variation in infill percentage (IP) influenced the constructs weight.
The height of 3D printed chocolate (regardless of infill pattern, percentage and chocolate
sample) showed similar results which ranged from 10.1mm to 10.6 mm with no significant
difference at (p < 0.05) to the pre-designed geometry as shown in Table 1b. The height of printed
constructs is probably influenced by layer height (Fanli Yang, Zhang, Bhandari, & Liu, 2018). In
ACCEPTED MANUSCRIPT

ACC
EPTE
D M
ANU
SCR
IPT
chocolate extrusion, the layer height was set to be equal to the nozzle diameter (0.78 mm) to
achieve a well-printed construct, which means, the nozzle (Z axis) will be lifted up to 0.78 mm in
every extruded layer. In this case, there are no differences in the product height, indicating
similarities with the target geometry. A similar study undertaken by Fanli Yang et al. (2018)
reported that by optimizing layer height according to nozzle diameter at 1.0 mm in printing lemon
juice gel, a better construct that are similar to the target geometry was produced.
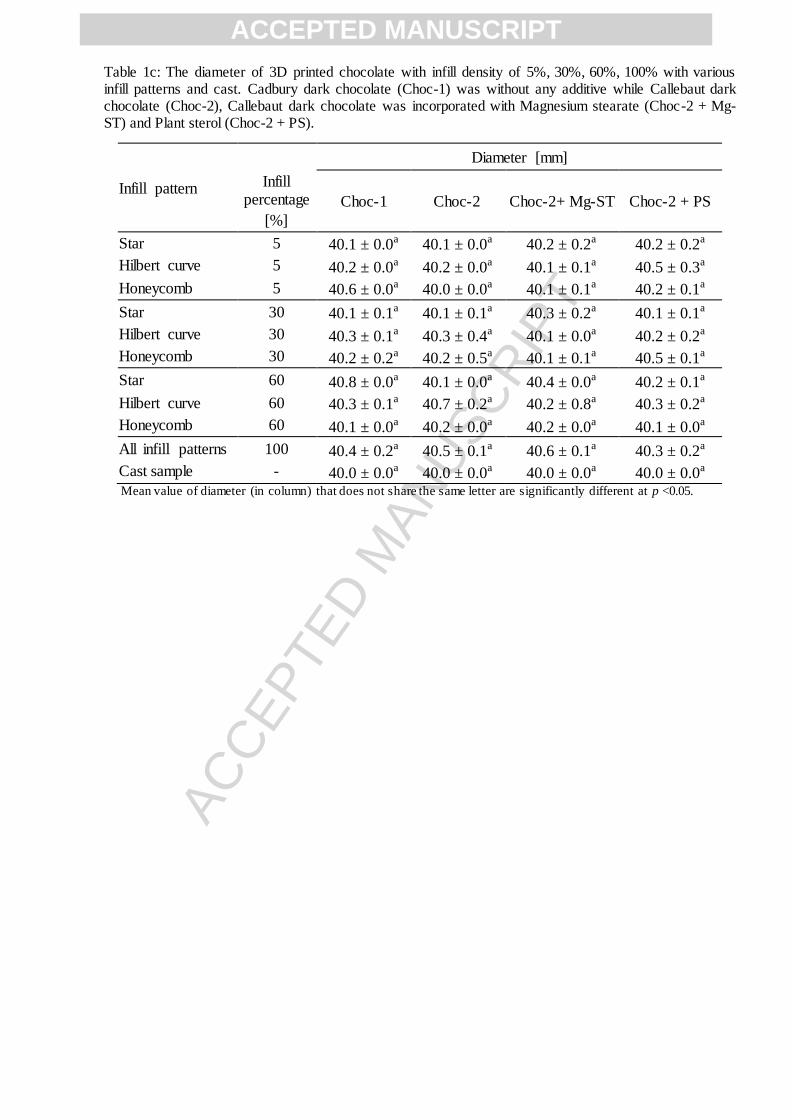
Table 1c shows the results of 3D printed chocolate diameter with infill percentage of 5%,
30%, 60%, 100% with various infill patterns and cast samples. The results suggest that regardless of
chocolate samples, infill percentage and patterns, there is no significant difference (p < 0.05) in
diameter between all printed chocolate samples. Also, there was no variation in diameter observed
for cast chocolate as the samples are moulded in a specific dimension (10.0 mm height and 40.0
mm diameter) in bulk and no significant difference at p < 0.05 was observed. These results
indicate that the diameter of the printed construct was found to be similar to the target geometry.
As can be seen in Table 1c, a marginal discrepancy on diameter is possibly because of the
influence of the weight of the product as it building a higher construct (Mantihal et al., 2017). A
similar study was done in drug-loaded tablets printing, where a small variation in the construct
diameter (10.55 mm to 10.67 mm) as it is printed from 10% to 100% infill percentage. This
marginal difference could be due to compressed deformation of printed object influenced by
gravity effect (Liu et al., 2018).
For the chocolate sample added with flow enhancer (Mg-ST and PS), the diameter, height
and weight were comparable with the dimensions of the control samples (Choc-1 and Choc-2) and
no significant difference (p < 0.05). The results show that the particulates (Mg-ST and PS) did not
affect the dimensional quality of the printed chocolate. This indicates that 3D food printing
possesses the capability of producing a good quality 3D chocolate product that is similar to pre-
designed shape. Overall, it is demonstrated that 3D food printing is able to produce a precise and
reproducible 3D printed chocolate.
ACCEPTED MANUSCRIPT

ACC
EPTE
D M
ANU
SCR
IPT
3.1.3 Voids of 3D printed chocolate
Figure 6 represents the effects of infill percentages on the total weight of printed samples.
As predicted, the increase in infill percentage would change the weight of the samples. This
suggests that the construct weight are dependant of the infill percentage. As mentioned in section
4.6.2, the increase in weight of printed chocolate was influenced by the amount of extruded
chocolate to fabricate the designated object when the infill percentage increased. This will
attribute to the fact that less voids in the object as the infill percentage of the construct increased
(Vancauwenberghe et al., 2017).
To determine the void fraction of 3D printed samples, the density of printed chocolate was
derived from density by using volume displacement method (Liu et al., 2018). The weight of 3D
printed chocolate samples and cast chocolate was obtained using a digital balance. The theoretical
volume was obtained by dividing the weight by the density (1.1 g/cm3). The void fraction of each
sample was determine by the equation “void fraction (%) = (Vde –Vth)/Vde x100” adapted from Liu
et al. (2018), where the Vde is the volume of the 3D designed geometry model (12.57cm3), and Vth
is the actual volume of the 3D printed chocolate samples. Void fraction (%) of all 3D printed
chocolate samples Choc-1, Choc-2, Choc-2+Mg-ST and Choc-2+PS are shown in Table 2.
As can be seen in Table 2, the void fraction of 5% of 3D printed chocolate was larger
ranging from 60.79 ± 2.07 % to 72.17 ± 1.84 %. Larger voids in 5% infill percentage contributed
by less amount of chocolate extruded to fill the internal structure as can be seen in Figure 5.
Therefore, greater hollow structure is visible as compared to samples printed in 30% and 60%
infill percentage (IP). As the IP increased to 30%, the voids fraction were ranging from 20.95 ±
2.13 % to 49.21 ± 3.57 %. A similar trend also can be observed when the IP increase to 60%, the
voids are reduced (ranging from 11.65 ± 2.31 % to 19.42 ± 4.22 %), respectively. For samples
printed in 100% IP, the voids are marginally ranging from 0.46 ± 1.54 % to 0.91 ± 1.38 %. No
voids were recorded for cast samples as the chocolate was compressed to construct the cast
samples.
ACCEPTED MANUSCRIPT

ACC
EPTE
D M
ANU
SCR
IPT
In most cases, the void fraction of chocolate samples printed in the same infill percentage
but different infill pattern (Star, Hilbert curve and Honeycomb) are significantly different at p <
0.05. Also, as the infill percentage increase, the mesostructure configuration of the extruded fibre
(fibre-to-fibre gap) became smaller (Rodriguez, Thomas, & Renaud, 2000). Which means, the
overlapping between extruded chocolate became narrow thus reducing the voids. Another reason
that could influence the construct voids is the irregularities of food material extruded during 3D
printing that leads to variation in product weight (Severini, Derossi, & Azzollini, 2016). In
addition, the printing path of each pattern were automated by the slicing software, and any
changes are impossible to make once the parameters are set up. Therefore, a slight difference in
product weight will occur thus affecting the voids. These results corroborated with Liu et al.,
(2018) findings reported that as the infill percentage increase from 10% to 70% the printed
mashed potato voids dramatically reduced from 59.6% to 7.24%.
Besides increasing in IP, the extrudate filament can experience a swelling (increase in
filament diameter) upon extrusion through the nozzle (Yousefi et al., 2018; Wang, 2012),
influencing the void fraction of printed product. In thermoplastic 3D printing, the elastic
behaviour of polymer led to the swelling of extrudate during deposition as reported by Nikzad,
Masood, & Sbarski, (2011). Their work reported a slight increase in the extrudate filament
diameter upon extrusion ranging from 1.78 mm to 1.85 mm than that of the die diameter 1.65 mm.
In chocolate extrusion, 3DFP is generally optimized by default using slicing software which
primarily for thermoplastic materials without any consideration in food material (Liu et al., 2018).
Therefore, a marginal swelling in the chocolate filament may occur upon deposition, causing
lesser void than the projected void in the target geometry (Figure 5). In addition, samples printed
in HNY infill pattern show lesser void fraction (Table 2), suggesting the effect of potential
swelling of extrudate filament influenced the voids. Yousefi et al., (2018) denoted that 3D-plotting
condition (including the printing pathway) can affect the diameter of the extruded filament. Thus,
the slight swelling of extruded chocolate marginally may affect the mesostructure, contributing to
ACCEPTED MANUSCRIPT

ACC
EPTE
D M
ANU
SCR
IPT
a lesser void in HNY infill than HC and Star infill pattern. The potential swelling behaviour of
food materials including chocolate during extrusion printing is one of the areas of that should be
studied further.
The results suggested that printed samples added with particulates (Mg-ST and PS) did not
influence the voids of the constructs. As only limited amount of Mg-ST and PS were added into
the chocolate mixture 5% w/w and 3% w/w, respectively (Mantihal et al., 2017), it is observed
that Mg-ST and PS did not significantly contribute to the increase in the construct weight. The
linear relationship between 3D printed chocolate weight as a function void shown in Figure 7. The
R2 of 3D printed product was (R2 = >0.96) indicating an excellent relationship between weight and
the void fraction as the weight increase, the void fraction tends to be lower. Overall, it is worth
noting that the variation in IP contributes to a different intensity of infill structure that will
influence the texture (hardness) of the printed products. The hardness of construct is related to the
mechanical strength of printed dark chocolate and will be discussed in the subsequent section.
3.1.4 Mechanical strength of the 3D printed dark chocolate
Dark chocolate contains high concentrations of suspended solid particles, including sugar
crystals, cocoa solids and milk fat dispersed in the continuous matrix of cocoa butter (Afoakwa,
2011). The composite of relatively hard particles including flow enhancer present in dark
chocolate will contribute to a higher mechanical property (Nedomova, Trnka, & Buchar, 2013).
Therefore, chocolate mixture added with flow enhancer (Mg-ST and PS) possibly will exhibit
higher mechanical properties. In this case, the mechanical properties were determined by force (N)
that needed to break the chocolate samples.
Figure 8 represents the graph of force (N) as a function of the distance of printed chocolate
in various infill percentage 5%, 30%, 60%, 100% and cast samples in different infill pattern. As
can be seen in Figure 8a - e, the increase in infill percentage also increased the force required to
break the printed samples. In all cases, the first series of peaks detected while the compression
ACCEPTED MANUSCRIPT

ACC
EPTE
D M
ANU
SCR
IPT
blade travelled from 0 to 2.5 mm followed by other negligible values observed until reaching 5
mm of displacement. It is important to note that the initial ~ 2.5 mm were the essential fracture
peaks while the second series of peak observed (from 7 to 9 mm) are the random fracture of small
pieces of the chocolate. Beckett (2008) reported that a slight displacement with a steep curve of
maximum force signifies a good snap quality of chocolate.
Table 3 shows the force (N) required to break samples printed in various patterns and infill
percentage (5%, 30%, 60% and 100%) and also the cast samples. As can be seen in Table 3, the
force required to break all printed samples (regardless of chocolate samples and infill pattern)
gradually increased as the IP increased. This indicates that the hardness of chocolate is dependent
with IP. At 5%_IP, the force required to break the printed samples ranged from 1.9 ± 0.1 N to 12.4
± 0.4 N. For samples printed in 30%_IP, the force needed to break the samples ranged from 5.5 ±
0.1 N to 35.1 ± 0.2 N. As increased in IP up to 60%, the force required to break the samples also
increase ranging from 8.8 ± 0.4 N to 47.4 ± 0.5 N. The differences in the force required to break
the samples is because of the intensity and stability of internal structure. As mentioned earlier, the
configuration of mesostructure will be more intense as the IP increases. Thus, it will contribute to
a stronger construct (Rodriguez et al., 2000). These findings were substantiated with the results
reported by Liu et al. (2018) who denoted that as the infill percentage increased from 10% to 70%,
the hardness of mashed potato increased from 101.2 g to 423.2 g. In polymer printing, Fernandez-
Vicente et al. (2016) also reported that as IP increased from 20% to 100%, the tensile strength of
ABS relatively increased from 16 MPa to 37 MPa.
Regardless of infill percentage, in most cases, the printed dark chocolate samples
containing flow enhancer (Mg-ST and PS) were significantly different at p < 0.05 than that of
control samples (Choc-1 and Choc-2). Nedomova et al., (2013) reported that the tensile strength of
dark chocolate increase as the cocoa solids increased from 70% to 90%. As suggested from
previous study, the additional of particulates did not influence the thermal and rheology properties
of chocolate (Mantihal et al., 2017). However, the presence of solids particles will influence the
ACCEPTED MANUSCRIPT

ACC
EPTE
D M
ANU
SCR
IPT
chocolate matrix, contributing to the increase of mechanical strength in dark chocolate (Nedomova
et al., 2013; Svanberg, Ahrné, Lorén, & Windhab, 2011). Therefore, the addition of particulates
also contributed to the increase in hardness of the printed dark chocolate.
A higher force to break the samples were recorded for cast samples (> 110 N) than that of
samples printed in 100% infill pattern (regardless of infill pattern). The reduced resistance to break
observed for the 3D printed constructs can be explained by weakened interactions between the
particles caused by the consecutive layering deposition. In contact with air, upon extrusion of a
chocolate filament, a new surface is generated, to ensure high adhesion between layers (and a
closer mechanical properties of a dense structure), printing speed is essential to be controlled in
combination with the nozzle diameter size. A similar comparison of the cast and printed cheese
was reported by Le Tohic et al. (2018). They found that the printed cheese exhibited a high degree
of meltability and showed a significantly less in hardness (by up to 49%) than that of casted
cheese.
Apart from the addition of particulates and IP, infill pattern also showed influence on the
mechanical strength of printed chocolate. As can be seen in Table 3, overall, there was a
significant difference (p < 0.05) of force required to break the printed samples between HC, HNY
and Star infill patterns. The discrepancy of force (N) between each infill pattern is contributed by
the differences in infill structure and interlayer bonding. HC infill pattern exhibited a less force
required to break the samples than that of HNY and Star infill pattern from 5%_IP to 60%_IP. It is
important to note that every infill pattern is different in shape and printing path (Tronvoll, Welo,
& Elverum, 2018). Figure 9 exhibit HC, HNY and Star infill patterns used in this study. As can be
seen in the Figure, HC infill pattern does not incorporate a criss-cross infill structure as compared
to HNY and Star infill structure. Criss-cross infill structure produces a stable and stronger
construct than the unintegrated pattern (Fatimatuzahraa et al., 2011; McLouth et al., 2017).
In addition to that, the trajectories and interlayer bonding zones are varied between infill
patterns (Fernandez-Vicente et al., 2016). HNY and star infill pattern exhibit more bonding zones
ACCEPTED MANUSCRIPT

ACC
EPTE
D M
ANU
SCR
IPT
than that of HC infill pattern. As a result, HNY and Star infill pattern produced a tougher printed
construct. However, in samples printed in 100% IP, most of the infill pattern exhibited almost
similar to line pattern (Figure 5). Therefore, a comparable force N required to break the samples
printed in 100% IP (irrespective of infill pattern) as shown in Table 3. Overall, the results indicate
that 3D food printing can substantively change the textural properties of printed chocolate. Also,
based on these findings, it is proposed that by modifying the infill structure (infill pattern and
percentage), the sensory perception might potentially varied, as the difference would be felt when
the chocolate bitten during oral consumption.
4. Conclusion
In this study, 3D auger extrusion was successfully used to fabricate a round geometry of chocolate
with various infill patterns and void percentages using powdered chocolate. Shape fidelity was
observed for most of the chocolate formulations tested with minimal variations in height and
diameter, in comparison with the pre-set dimensions of the shape. The density and weight of the
3D constructs were controlled by the infill percentage; feature that cannot be achieved by
conventional casting methods of melted chocolate. It is worth to highlighting that the chocolate
shape printed with 100% infill depicted a lower resistance to break than the same formulation
prepared by casting method. This was attributed to the interfacial voids formed during the
deposition of layers, causing a decay in the attraction forces between the particles (or layers)
during solidification. The mechanical properties of the 3D printed chocolate were also related to
the type of infill patterns. Star and honeycomb patterns showed a high mechanical property due to
criss-cross integrated pattern. Our findings demonstrate that 3DP is a powerful tool to control the
mechanical properties of solid-chocolate. Enhanced textural attributes can be easily controlled by
varying the infill pattern and percentage. Further study is being pursued investigating the detailed
sensory attributes of 3D printed chocolates in regard of infill percentage.
ACCEPTED MANUSCRIPT

ACC
EPTE
D M
ANU
SCR
IPT
References
Afoakwa, E. O. (2011). Chocolate science and technology: John Wiley & Sons.
Allen, L. (2009). Stearic acid. Handbook of pharmaceutical excipients. 6th ed. Pharmaceutical
Press and American Pharmacists Association.
Beckett, S. T. (2008). science of chocolate.
Cohen, D. L., Lipton, J. I., Cutler, M., Coulter, D., Vesco, A., & Lipson, H. (2009). Hydrocolloid
printing: a novel platform for customized food production. Paper presented at the
Proceedings of solid freeform fabrication symposium (SFF'09).
Fatimatuzahraa, A., Farahaina, B., & Yusoff, W. (2011). The effect of employing different raster orientations on the mechanical properties and microstructure of Fused Deposition Modeling parts. Paper presented at the Business, Engineering and Industrial Applications
(ISBEIA), 2011 IEEE Symposium on.
Fernandez-Vicente, M., Calle, W., Ferrandiz, S., & Conejero, A. (2016). Effect of infill parameters on tensile mechanical behavior in desktop 3D printing. 3D printing and additive manufacturing, 3(3), 183-192.
FSANZ. (2016). Australia New Zealand Food Standards Code - Standard 1.3.3 - Processing Aids. Retrieved from https://www.legislation.gov.au/Details/F2009C00724
FSANZ. (2016). Plant Sterols. Retrieved 19/6/2017, 2017, from
http://www.foodstandards.gov.au/consumer/nutrition/plantsterol/Pages/default.aspx Hao, L., Mellor, S., Seaman, O., Henderson, J., Sewell, N., & Sloan, M. (2010). Material
characterisation and process development for chocolate additive layer manufacturing. Virtual and Physical Prototyping, 5(2), 57-64. doi: 10.1080/17452751003753212
Kang, H.-W., Lee, S. J., Ko, I. K., Kengla, C., Yoo, J. J., & Atala, A. (2016). A 3D bioprinting
system to produce human-scale tissue constructs with structural integrity. Nature
biotechnology, 34(3), 312.
Le Tohic, C., O'Sullivan, J. J., Drapala, K. P., Chartrin, V., Chan, T., Morrison, A. P., . . . Kelly, A. L. (2018). Effect of 3D printing on the structure and textural properties of processed cheese. Journal of Food Engineering, 220, 56-64.
Liu, Z., Bhandari, B., Prakash, S., & Zhang, M. (2018). Creation of internal structure of mashed
potato construct by 3D printing and its textural properties. Food Research International, 111, 534-543.
Liu, Z., Zhang, M., Bhandari, B., & Wang, Y. (2017). 3D printing: Printing precision and application in food sector. Trends in Food Science & Technology, 69, 83-94.
ACCEPTED MANUSCRIPT
ACC
EPTE
D M
ANU
SCR
IPT
Mantihal, S., Prakash, S., Godoi, F. C., & Bhandari, B. (2017). Optimization of chocolate 3D
printing by correlating thermal and flow properties with 3D structure modeling. Innovative Food Science & Emerging Technologies, 44(Supplement C), 21-29.
McLouth, T. D., Severino, J. V., Adams, P. M., Patel, D. N., & Zaldivar, R. J. (2017). The impact of print orientation and raster pattern on fracture toughness in additively manufactured
ABS. Additive Manufacturing, 18, 103-109. Murphy, S. V., & Atala, A. (2014). 3D bioprinting of tissues and organs. Nature biotechnology,
32(8), 773-785. Nedomova, S., Trnka, J., & Buchar, J. (2013). Tensile Strength of Dark Chocolate. Acta
Technologica Agriculturae, 16(3), 71-73. Nikzad, M., Masood, S. H., & Sbarski, I. (2011). Thermo-mechanical properties of a highly filled
polymeric composites for Fused Deposition Modeling. Materials & Design, 32(6), 3448-3456. doi:https://doi.org/10.1016/j.matdes.2011.01.056
Rankouhi, B., Javadpour, S., Delfanian, F., & Letcher, T. (2016). Failure analysis and mechanical
characterization of 3D printed ABS with respect to layer thickness and orientation. Journal
of Failure Analysis and Prevention, 16(3), 467-481.
RepRap. (2016). RepRapWiki: G-code. Retrieved 2 March, 2016, from http://reprap.org/wiki/G-code
Rodriguez, J. F., Thomas, J. P., & Renaud, J. E. (2000). Characterization of the mesostructure of fused-deposition acrylonitrile-butadiene-styrene materials. Rapid Prototyping Journal,
6(3), 175-186. Severini, C., Derossi, A., & Azzollini, D. (2016a). Variables affecting the printability of foods:
Preliminary tests on cereal-based products. Innovative Food Science & Emerging Technologies.
Severini, C., Derossi, A., & Azzollini, D. (2016b). Variables affecting the printability of foods:
Preliminary tests on cereal-based products. Innovative Food Science & Emerging
Technologies, 38, 281-291.
Sood, A. K., Ohdar, R., & Mahapatra, S. (2010). Parametric appraisal of mechanical property of fused deposition modelling processed parts. Materials & Design, 31(1), 287-295. doi: 10.1016/j.matdes.2009.06.016
Sun, J., Peng, Z., Yan, L., Fuh, J., & Hong, G. (2015). 3D food printing—An innovative way of
mass customization in food fabrication. International Journal of Bioprinting, 1(1), 27-38. Sun, J., Peng, Z., Zhou, W., Fuh, J. Y., Hong, G. S., & Chiu, A. (2015). A Review on 3D Printing
for Customized Food Fabrication. Procedia Manufacturing, 1, 308-319.
Svanberg, L., Ahrné, L., Lorén, N., & Windhab, E. (2011). Effect of sugar, cocoa particles and lecithin on cocoa butter crystallisation in seeded and non-seeded chocolate model systems. Journal of Food Engineering, 104(1), 70-80. doi: 10.1016/j.jfoodeng.2010.09.023
ACCEPTED MANUSCRIPT

ACC
EPTE
D M
ANU
SCR
IPT
Tronvoll, S. A., Welo, T., & Elverum, C. W. (2018). The effects of voids on structural properties
of fused deposition modelled parts: a probabilistic approach. The International Journal of Advanced Manufacturing Technology, 97(9), 3607-3618. doi: 10.1007/s00170-018-2148-x
Vancauwenberghe, V., Katalagarianakis, L., Wang, Z., Meerts, M., Hertog, M., Verboven, P., . . . Nicolaï, B. (2017). Pectin based food-ink formulations for 3-D printing of customizable
porous food simulants. Innovative Food Science & Emerging Technologies, 42, 138-150. doi: https://doi.org/10.1016/j.ifset.2017.06.011
Wang, K. (2012). Die Swell of Complex Polymeric Systems Viscoelasticity-From Theory to Biological Applications: InTech.
Wegrzyn, T. F., Golding, M., & Archer, R. H. (2012). Food Layered Manufacture: A new process
for constructing solid foods. Trends in Food Science & Technology, 27(2), 66-72.
Williams, D., Thayer, P., Martinez, H., Gatenholm, E., & Khademhosseini, A. (2018). A
perspective on the physical, mechanical and biological specifications of bioinks and the development of functional tissues in 3D bioprinting. Bioprinting, 9, 19-36.
Yang, F., Zhang, M., & Bhandari, B. (2015). Recent Development in 3D Food Printing. Critical Review Food Science & Nutrition, 0.
Yang, F., Zhang, M., Bhandari, B., & Liu, Y. (2018). Investigation on lemon juice gel as food
material for 3D printing and optimization of printing parameters. LWT - Food Science and
Technology, 87, 67-76.
Yousefi, A.-M., Smucker, B., Naber, A., Wyrick, C., Shaw, C., Bennett, K., . . . Wood, K. A. (2018). Controlling the extrudate swell in melt extrusion additive manufacturing of 3D
scaffolds: a designed experiment. Journal of Biomaterials Science, Polymer Edition, 29(3), 195-216.
ACCEPTED MANUSCRIPT
ACC
EPTE
D M
ANU
SCR
IPT
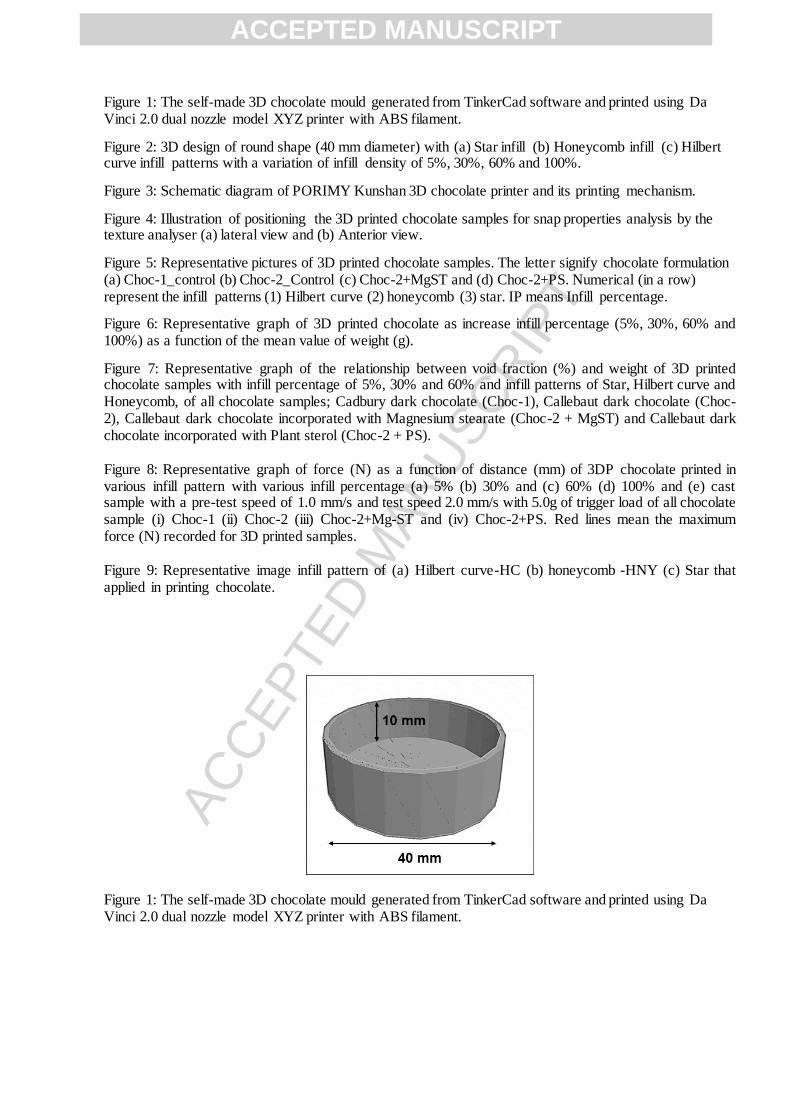
Figure 1: The self-made 3D chocolate mould generated from TinkerCad software and printed using Da Vinci 2.0 dual nozzle model XYZ printer with ABS filament.
Figure 2: 3D design of round shape (40 mm diameter) with (a) Star infill (b) Honeycomb infill (c) Hilbert curve infill patterns with a variation of infill density of 5%, 30%, 60% and 100%.
Figure 3: Schematic diagram of PORIMY Kunshan 3D chocolate printer and its printing mechanism.
Figure 4: Illustration of positioning the 3D printed chocolate samples for snap properties analysis by the texture analyser (a) lateral view and (b) Anterior view.
Figure 5: Representative pictures of 3D printed chocolate samples. The letter signify chocolate formulation (a) Choc-1_control (b) Choc-2_Control (c) Choc-2+MgST and (d) Choc-2+PS. Numerical (in a row) represent the infill patterns (1) Hilbert curve (2) honeycomb (3) star. IP means Infill percentage.
Figure 6: Representative graph of 3D printed chocolate as increase infill percentage (5%, 30%, 60% and 100%) as a function of the mean value of weight (g).
Figure 7: Representative graph of the relationship between void fraction (%) and weight of 3D printed chocolate samples with infill percentage of 5%, 30% and 60% and infill patterns of Star, Hilbert curve and Honeycomb, of all chocolate samples; Cadbury dark chocolate (Choc-1), Callebaut dark chocolate (Choc-2), Callebaut dark chocolate incorporated with Magnesium stearate (Choc-2 + MgST) and Callebaut dark chocolate incorporated with Plant sterol (Choc-2 + PS). Figure 8: Representative graph of force (N) as a function of distance (mm) of 3DP chocolate printed in various infill pattern with various infill percentage (a) 5% (b) 30% and (c) 60% (d) 100% and (e) cast sample with a pre-test speed of 1.0 mm/s and test speed 2.0 mm/s with 5.0g of trigger load of all chocolate sample (i) Choc-1 (ii) Choc-2 (iii) Choc-2+Mg-ST and (iv) Choc-2+PS. Red lines mean the maximum force (N) recorded for 3D printed samples. Figure 9: Representative image infill pattern of (a) Hilbert curve-HC (b) honeycomb -HNY (c) Star that applied in printing chocolate.
Figure 1: The self-made 3D chocolate mould generated from TinkerCad software and printed using Da Vinci 2.0 dual nozzle model XYZ printer with ABS filament.
ACCEPTED MANUSCRIPT
ACC
EPTE
D M
ANU
SCR
IPT
Figure 2: 3D design of round shape (40 mm diameter) with (a) Star infill (b) Honeycomb infill (c) Hilbert curve infill patterns with a variation of infill density of 5%, 30%, 60% and 100%.
ACCEPTED MANUSCRIPT

ACC
EPTE
D M
ANU
SCR
IPT
Figure 3: Schematic diagram of PORIMY Kunshan 3D chocolate printer and its printing mechanism.
ACCEPTED MANUSCRIPT

ACC
EPTE
D M
ANU
SCR
IPT
Figure 4: Illustration of positioning the 3D printed chocolate samples for snap properties analysis by the texture analyser (a) lateral view and (b) Anterior view.
ACCEPTED MANUSCRIPT

ACC
EPTE
D M
ANU
SCR
IPT
Figure 5: Representative pictures of 3D printed chocolate samples. The letter signify chocolate formulation (a) Choc-1_control (b) Choc-2_Control (c) Choc-2+MgST and (d) Choc-2+PS. Numerical (in a row) represent the infill patterns (1) Hilbert curve (2) honeycomb (3) star. IP means Infill percentage.
ACCEPTED MANUSCRIPT
ACC
EPTE
D M
ANU
SCR
IPT
Table 1a: The weight of 3D printed chocolate with infill density of 5%, 30%, 60%, 100% with various infill patterns and cast. Cadbury dark chocolate (Choc-1) was without any additive while Callebaut dark chocolate (Choc-2), Callebaut dark chocolate was incorporated with Magnesium stearate (Choc-2 + Mg-ST) and Plant sterol (Choc-2 + PS).
Infill pattern
Weight [g]
Infill percentage Choc-1 Choc-2 Choc-2+ Mg-ST Choc-2 + PS
[%]
Star 5 4.43 ± 0.42a 3.78 ± 0.27b 3.83 ± 0.25b 5.02 ± 0.24a
Hilbert curve 5 4.05 ± 0.40a 4.28 ± 0.02b 3.87 ± 0.17b 4.42 ± 0.40a
Honeycomb 5 4.29 ± 0.60a 5.39 ± 0.28a 5.13 ± 0.45a 5.04 ± 0.21a
Star 30 8.01 ± 0.33a 8.36 ± 0.25a 7.06 ± 0.34b 8.53 ± 0.25a
Hilbert curve 30 6.99 ± 0.49b 8.61 ± 0.33a 7.46 ± 0.25b 7.49 ± 0.34b
Honeycomb 30 8.92 ± 0.41a 9.13 ± 0.30b 10.88 ± 0.29a 9.27 ± 0.45a
Star 60 11.17 ± 0.19a 11.68 ± 0.36a 11.57 ± 0.26a 11.97 ± 0.19a
Hilbert curve 60 11.43 ± 0.61a 11.09 ± 0.88a 9.62 ± 0.38b 11.57 ± 0.53a
Honeycomb 60 11.16 ± 0.31a 11.38 ± 0.39a 11.58 ± 0.32a 11.48 ± 0.32a
All infill patterns 100 13.71 ± 0.42 13.67 ± 0.41 13.64 ± 0.35 13.69 ± 0.35
Cast sample - 16.00 ± 0.00 16.00 ± 0.00 16.00 ± 0.00 16.00 ± 0.00
Mean value of weight (in column based on infill percentage 5%, 30% and 60%) of printed chocolate samples that does not share the same letter are significantly different at p <0.05.
ACCEPTED MANUSCRIPT

ACC
EPTE
D M
ANU
SCR
IPT
Figure 6: Representative graph of 3D printed chocolate as increase infill percentage (5%, 30%, 60% and 100%) as a function of the mean value of weight (g).
ACCEPTED MANUSCRIPT

ACC
EPTE
D M
ANU
SCR
IPT
Table 1b: The height of 3D printed chocolate with infill density of 5%, 30%, 60%, 100% with various infill patterns and cast. Cadbury dark chocolate (Choc-1) was without any additive while Callebaut dark chocolate (Choc-2), Callebaut dark chocolate was incorporated with Magnesium stearate (Choc-2 + Mg-ST) and Plant sterol (Choc-2 + PS).
Infill pattern
Height [mm]
Infill percentage Choc-1 Choc-2 Choc-2 + Mg-ST Choc-2 + PS
[%]
Star 5 10.2 ± 0.1a 10.1 ± 0.1a 10.4 ± 0.3a 10.4 ± 0.5a
Hilbert curve 5 10.3 ± 0.1a 10.3 ± 0.1a 10.2 ± 0.1a 10.1 ± 0.0a
Honeycomb 5 10.1 ± 0.0a 10.1 ± 0.0a 10.1 ± 0.1a 10.4 ± 0.4a
Star 30 10.2 ± 0.2a 10.6 ± 0.2a 10.4 ± 0.1a 10.5 ± 0.3a
Hilbert curve 30 10.1 ± 0.1a 10.5 ± 0.1a 10.5 ± 0.2a 10.4 ± 0.0a
Honeycomb 30 10.3 ± 0.0a 10.6 ± 0.4a 10.6 ± 0.2a 10.6 ± 0.0a
Star 60 10.3 ± 0.0a 10.3 ± 0.0a 10.6 ± 0.7a 10.5 ± 0.1a
Hilbert curve 60 10.4 ± 0.1a 10.5 ± 0.1a 10.5 ± 0.2a 10.4 ± 0.0a
Honeycomb 60 10.5 ± 0.1a 10.4 ± 0.1a 10.2 ± 0.1a 10.1 ± 0.0a
All infill patterns 100 10.3 ± 0.2a 10.6 ± 0.2a 10.5 ± 0.3a 10.3 ± 0.3a
Cast sample - 10.0 ± 0.0a 10.0 ± 0.0a 10.0 ± 0.0a 10.0 ± 0.0a Mean value of height (in column) that does not share the same letter are significantly different at p <0.05.
ACCEPTED MANUSCRIPT
ACC
EPTE
D M
ANU
SCR
IPT
Table 1c: The diameter of 3D printed chocolate with infill density of 5%, 30%, 60%, 100% with various infill patterns and cast. Cadbury dark chocolate (Choc-1) was without any additive while Callebaut dark chocolate (Choc-2), Callebaut dark chocolate was incorporated with Magnesium stearate (Choc-2 + Mg-ST) and Plant sterol (Choc-2 + PS).
Infill pattern
Diameter [mm]
Infill percentage Choc-1 Choc-2 Choc-2+ Mg-ST Choc-2 + PS
[%]
Star 5 40.1 ± 0.0a 40.1 ± 0.0a 40.2 ± 0.2a 40.2 ± 0.2a
Hilbert curve 5 40.2 ± 0.0a 40.2 ± 0.0a 40.1 ± 0.1a 40.5 ± 0.3a
Honeycomb 5 40.6 ± 0.0a 40.0 ± 0.0a 40.1 ± 0.1a 40.2 ± 0.1a
Star 30 40.1 ± 0.1a 40.1 ± 0.1a 40.3 ± 0.2a 40.1 ± 0.1a
Hilbert curve 30 40.3 ± 0.1a 40.3 ± 0.4a 40.1 ± 0.0a 40.2 ± 0.2a
Honeycomb 30 40.2 ± 0.2a 40.2 ± 0.5a 40.1 ± 0.1a 40.5 ± 0.1a
Star 60 40.8 ± 0.0a 40.1 ± 0.0a 40.4 ± 0.0a 40.2 ± 0.1a
Hilbert curve 60 40.3 ± 0.1a 40.7 ± 0.2a 40.2 ± 0.8a 40.3 ± 0.2a
Honeycomb 60 40.1 ± 0.0a 40.2 ± 0.0a 40.2 ± 0.0a 40.1 ± 0.0a
All infill patterns 100 40.4 ± 0.2a 40.5 ± 0.1a 40.6 ± 0.1a 40.3 ± 0.2a
Cast sample - 40.0 ± 0.0a 40.0 ± 0.0a 40.0 ± 0.0a 40.0 ± 0.0a Mean value of diameter (in column) that does not share the same letter are significantly different at p <0.05.
ACCEPTED MANUSCRIPT

ACC
EPTE
D M
ANU
SCR
IPT
Table 2: Void fractions of 3D printed chocolate with infill density of 5%, 30%, 60%, 100% with various infill patterns and cast. Cadbury dark chocolate (Choc-1) was without any additive while Callebaut dark chocolate (Choc-2), Callebaut dark chocolate was incorporated with Magnesium stearate (Choc-2 + Mg-ST) and Plant sterol (Choc-2 + PS).
Infill pattern
Void Fraction [%]
Infill
percentage Choc-1 Choc-2 Choc-2 + Mg-ST Choc-2 + PS
[%]
Star 5 67.7 ± 3.1c 72.5 ± 2.0a 72.1 ± 1.8a 63.5 ± 1.7b
Hilbert curve 5 70.5 ± 2.9a 68.8 ± 0.2b 71.8 ± 1.2b 67.8 ± 2.9a
Honeycomb 5 68.7 ± 4.3b 60.7 ± 2.1c 62.7 ± 3.3c 63.4 ± 1.5b
Star 30 40.7 ± 4.3b 39.2 ± 1.8a 48.7 ± 2.50a 38.0 ± 1.8b
Hilbert curve 30 49.2 ± 3.5a 37.3 ± 2.4b 46.7 ± 2.1b 45.5 ± 2.5a
Honeycomb 30 35.1 ± 2.9c 33.6 ± 2.2c 20.9 ± 2.13c 32.5± 3.3c
Star 60 18.7 ± 1.3a 15.1 ± 2.2c 15.9 ± 1.9b 13.0 ± 1.3b
Hilbert curve 60 16.9 ± 3.7b 19.4 ± 4.2a 16.1 ± 2.7a 16.6 ± 3.9a
Honeycomb 60 11.6 ± 2.3c 17.3 ± 2.6b 15.8 ± 1.3b 16.5 ± 2.3a
All infill patterns 100 0.9 ± 1.3 0.6 ± 1.5 0.4 ± 1.5 0.5 ± 1.1
Cast sample - 0 0 0 0
R2 0.965 0.975 0.977 0.975
Mean value of void fraction (in column based on every infill percentage 5%, 30% and 60%) of printed chocolate samples that does not share the same letter are significantly different at p <0.05.
ACCEPTED MANUSCRIPT

ACC
EPTE
D M
ANU
SCR
IPT
Figure 7: Representative graph of the relationship between void fraction (%) and weight of 3D printed chocolate samples with infill percentage of 5%, 30% and 60% and infill patterns of Star, Hilbert curve and Honeycomb, of all chocolate samples; Cadbury dark chocolate (Choc-1), Callebaut dark chocolate (Choc-2), Callebaut dark chocolate incorporated with Magnesium stearate (Choc-2 + MgST) and Callebaut dark chocolate incorporated with Plant sterol (Choc-2 + PS).
ACCEPTED MANUSCRIPT

ACC
EPTE
D M
ANU
SCR
IPT
Figure 8: Representative graph of force (N) as a function of distance (mm) of 3DP chocolate printed in various infill pattern with various infill percentage (a) 5% (b) 30% and (c) 60% (d) 100% and (e) cast sample with a pre-test speed of 1.0 mm/s and test speed 2.0 mm/s with 5.0g of trigger load of all chocolate sample (i) Choc-1 (ii) Choc-2 (iii) Choc-2+Mg-ST and (iv) Choc-2+PS. Red lines mean the maximum force (N) recorded for 3D printed samples.
ACCEPTED MANUSCRIPT

ACC
EPTE
D M
ANU
SCR
IPT
Table 3: Recorded force (N) to break 3D printed chocolate with different patterns and various
infill percentage (5%, 30%, 60% and 100%), and cast samples.
Infill
Pattern
3DP
sample
Force [N]
[5%_IP] [30%_IP] [60%_IP]
[100%_IP]
[Cast]
Hilbert Curve Choc-1(Control) 1.9 ± 0.1bF
5.5 ± 0.1bF
8.8 ± 0.4bF
87.4 ± 1.6bD
113.7 ± 4.1bA
(HC) Choc-2(Control) 2.1 ± 0.2bF
5.4 ± 0.2bF
9.4 ± 0.2bF
82.2 ± 2.2aE
112.5 ± 3.7aB
Choc-2+Mg-ST 3.5 ± 0.1aE
5.5 ± 0.4bF
11.1 ± 0.1aE
90.8 ± 1.3cC
114.5 ± 3.1bA
Choc-2+PS 3.2 ± 0.3aE
6.6 ± 0.7aF
11.7 ± 0.7aE
92.8 ± 1.4cA
111.2 ± 4.6aB
Honeycomb Choc-1(Control) 9.2 ± 0.1bB
31.1 ± 0.3bD
38.2 ± 0.2bD
88.3 ± 1.8aD
110.3 ± 2.1bC
(HNY) Choc-2(Control) 7.9 ± 0.5cC
31.7 ± 0.7bD
39.3 ± 0.3bD
87.1 ± 1.2aD
111.5 ± 3.2bB
Choc-2+Mg-ST 12.4 ± 0.4aA
35.1 ± 0.2aA
47.4 ± 0.5aA
92.6 ± 1.6bA
113.1 ± 3.1aA
Choc-2+PS 9.0 ± 0.3bB
34.3 ± 1.3aB
46.3 ± 0.9bA
91.3 ± 1.3bB
113.9 ± 3.7aA
Star Choc-1(Control) 6.7 ± 0.1bD
28.8 ± 0.6bE
42.8 ± 0.4bC
87.4 ± 1.1aD
112.1 ± 3.5aB
Choc-2(Control) 5.9 ± 0.4cD
29.7 ± 0.5bE
43.2 ± 0.1bC
89.1 ± 1.8bC
111.7 ± 3.7aB
Choc-2+Mg-ST 9.2 ± 0.2aB
32.6 ± 0.2aC
45.3 ± 1.4aB
91.3 ± 1.6cB
114.7 ± 3.1bA
Choc-2+PS 6.1 ± 0.2bcD
32.0 ± 0.9aC
44.1 ± 0.3aC
92.2 ± 1.3cA
113.4 ± 3.6bA
*Mean values of Force (N) that required to break the 3D printed chocolate and cast chocolate (in column based on infill percentage) that do not share a letter are significantly different at p <0.05. IP means infill percentage.
*Mean values of Force (N) (in column based on infill pattern) that do not share a capital letter are significantly
different at p <0.05.
ACCEPTED MANUSCRIPT

ACC
EPTE
D M
ANU
SCR
IPT
Figure 9: Representative image infill pattern of (a) Hilbert curve-HC (b) honeycomb -HNY (c) Star that applied in printing chocolate.
ACCEPTED MANUSCRIPT

ACC
EPTE
D M
ANU
SCR
IPT
Highlights
Mg-ST and PS did not affect the shape fidelity of printed chocolate.
Void fraction of the printed chocolate was affected by increasing the infill percentage.
Higher force (N) is required to break 3D printed samples as infill percentage increase.
3DFP is a powerful tool to control the mechanical properties of 3D printed food.
ACCEPTED MANUSCRIPT
Top Related