


Languages
Pages
Legal


Int J Thermophys (2017) 38:95DOI 10.1007/s10765-017-2232-8
TEMPMEKO 2016
Tests of the Stability of Chinese RhFe ResistanceThermometers at Low Temperatures
A. Kowal1 · H. Manuszkiewicz1 · B. Kołodziej1 ·A. Szmyrka-Grzebyk1 · Peng Lin2 · Bo Gao2 ·Lihong Yu2
Received: 25 August 2016 / Accepted: 9 April 2017 / Published online: 25 April 2017© The Author(s) 2017. This article is an open access publication
Abstract Rhodium–iron resistance thermometers are recommended as precise ther-mometers at temperatures below 25 K. The thermometers were developed at theNational Physical Laboratory and produced by H. Tinsley and Co Ltd almost 50 yearsago. Later, they were made by other companies and institutes as well, but despite this,the availability of the thermometers decreased and a new source of supply was needed.Several years ago, the Technical Institute of Physics and Chemistry (TIPC), ChineseAcademy of Sciences, developed its own technology for making wire of Rh-0.5 at%Fe alloy which was used in the production of new thermometers. These devices havebeen tested previously at INRIM (Italy) and later at INTiBS (Poland). INTiBS has car-ried out an investigation focused on the thermometers’ stability after thermal cyclingtreatment. This paper presents the results of stability tests of about 30 thermometersproduced by TIPC in two batches. The resistance of each thermometer was measuredat temperatures of about 4.6 K and 7.2 K before and after 10, 30 and 50 thermal cyclesfrom room temperature. The methods of measurement and the design of the cryostatused for the research are also presented.
Keywords Cryogenic thermometers · Resistance thermometers · Rhodium–ironthermometers · Thermometer stability
Selected Papers of the 13th International Symposium on Temperature, Humidity, Moisture and ThermalMeasurements in Industry and Science.
B A. [email protected]
1 Instytut Niskich Temperatur i Badan Strukturalnych PAN, Wrocław, Poland
2 Technical Institute of Physics and Chemistry, Chinese Academy of Sciences, Beijing,People’s Republic of China
123

95 Page 2 of 14 Int J Thermophys (2017) 38:95
1 Introduction
The history of rhodium–iron resistance thermometers (RIRTs) extends for almost50 years [1]. Due to their anomalous resistance versus temperature characteristics,they can be used for accurate temperature measurement at low temperatures, whereplatinum resistance thermometers become unusable because of low sensitivity. RIRTswere developed by R. Rusby at National Physical Laboratory and produced by H.Tinsley and Co Ltd in the early 1970s [2,3]. Later, they were produced by othercompanies and institutes [4–6], but despite this the availability of the thermometersdecreased and a new source of supply was needed. Several years ago, the TechnicalInstitute of Physics and Chemistry (TIPC), Chinese Academy of Sciences, developedits own technology for making wire of Rh-0.5 at% Fe alloy which was used in theproduction of new thermometers [7,8]. The construction of the thermometers is thesame as capsule-type standard platinum resistance thermometers. The properties of theRIRTs were initially studied at INRIM and then at INTiBS at the end of the last decade[9,10]. Recently, after improvement of the thermometer production technology, about30 thermometers produced by TIPC in two batches were tested at INTiBS. Between2012 and 2013, RIRTs with the numbers shown in Table 1 were tested. The next batch,with the numbers shown in Table 2, was tested during the period 2014–2016.
This study is focused on measurements of the thermometer’s resistance after 50thermal cycles between room temperature and liquid helium temperatures. The resis-tance of each thermometer was measured at about 4.6 K and 7.2 K before the thermaltreatment and after 10, 30 and 50 thermal cycles.
2 Thermal Treatment
For the thermal cycling treatment, the thermometers were mounted in a sealed stainlesssteel container made of a tube with a diameter of 25 mm and a length of 130 cm. Thecontainer was pumped to about 0.1 Pa pressure and then filled with gaseous heliumto ensure a good thermal exchange between thermometers and liquid helium. Thecontainer was dipped slowly into liquid helium to cool the thermometers to 4.2 K overabout 5 min. Then, it was removed from the helium Dewar, and the thermometerswarmed to room temperature. The procedure was repeated 10 times initially and then20 times in each of two subsequent runs. After each treatment, the thermometers wereinserted into the copper block of a cryostat for measurement.
3 Cryostat Construction
A liquid helium cryostat developed at INTiBS, shown in Fig. 1, was used for theinvestigation. It was equipped with an adjustable thermal switch, a, mounted betweenthe helium container, LHe, and the copper block, b. The heat switch was based on thedependency of the thermal conductivity of gaseous helium on pressure.
Nine thermometers from TIPC and the reference rhodium–iron thermometer B178from Tinsley, which participated in the EURAMET.T-K1 key comparison [8], weremounted in the isothermal copper block, b. The copper block was surrounded by
123

Int J Thermophys (2017) 38:95 Page 3 of 14 95
Tabl
e1
Res
ults
ofR
IRT
sst
abili
tyfo
rth
efir
stba
tch
ofth
erm
omet
ers
T≈
4,36
KT
≈7,
19K
�T,m
Ku(�
T),
mK
Self
-hea
ting,
�/m
A2
�T,m
Ku(�
T),
mK
Self
-hea
ting,
�/m
A2
No.80
07
Aft
er10
cycl
es−0
.093
0.05
50.
0003
10.
042
0.06
70.
0001
8
Aft
er30
cycl
es−0
.053
0.05
20.
024
0.06
8
Aft
er50
cycl
es−0
.071
0.05
2−0
.071
0.06
7
No.20
102
Aft
er10
cycl
es−0
.022
0.05
30.
0003
30.
013
0.06
50.
0001
9
Aft
er30
cycl
es0.
023
0.05
3−0
.036
0.06
5
Aft
er50
cycl
es−0
.048
0.05
1−0
.038
0.06
5
No.20
107
Aft
er10
cycl
es−0
.016
0.06
90.
0003
7−3
.7E−0
59.
1E−0
50.
0002
2
Aft
er30
cycl
es0.
004
0.06
75.
6E−0
58.
9E−0
5
Aft
er50
cycl
es−0
.030
0.07
04.
1E−0
59.
0E−0
5
No.20
108
Aft
er10
cycl
es0.
453
0.08
90.
0009
9−0
.412
0.04
80.
0003
9
Aft
er30
cycl
es2.
373
0.08
13.
442
0.04
8
Aft
er50
cycl
es2.
317
0.07
31.
802
0.05
0
No.20
109
Aft
er10
cycl
es−0
.077
0.05
40.
0002
7−0
.153
0.06
80.
0001
5
Aft
er30
cycl
es−0
.052
0.05
6−0
.152
0.07
4
Aft
er50
cycl
es−0
.144
0.05
4−0
.165
0.06
8
No.20
0912
Aft
er10
cycl
es−0
. 119
0.05
40.
0003
6−0
.012
0.06
80.
0002
2
123

95 Page 4 of 14 Int J Thermophys (2017) 38:95
Tabl
e1
cont
inue
d
T≈
4,36
KT
≈7,
19K
�T,m
Ku(�
T),
mK
Self
-hea
ting,
�/m
A2
�T,m
Ku(�
T),
mK
Self
-hea
ting,
�/m
A2
Aft
er30
cycl
es−0
.030
0.05
1−0
.019
0.06
7
Aft
er50
cycl
es−0
.131
0.05
10.
009
0.06
9
No.20
0913
Aft
er10
cycl
es−0
.814
0.05
20.
0002
9−1
.086
0.06
70.
0001
7
Aft
er30
cycl
es−0
.875
0.05
2−1
.024
0.06
7
Aft
er50
cycl
es−0
.891
0.05
2−1
.116
0.06
7
No.20
0918
Aft
er10
cycl
es−0
.052
0.05
50.
0003
20.
014
0.06
80.
0001
7
Aft
er30
cycl
es−0
.078
0.05
2−0
.071
0.06
8
Aft
er50
cycl
es−0
.084
0.05
2−0
.064
0.06
8
No.20
0920
Aft
er10
cycl
es0.
037
0.05
30.
0003
00.
078
0.06
80.
0001
8
Aft
er30
cycl
es0.
087
0.05
30.
050
0.06
8
Aft
er50
cycl
es−0
.047
0.05
2−0
.012
0.09
7
No.20
1017
Aft
er10
cycl
es−0
.055
0.05
20.
0003
2−0
.138
0.07
10.
0001
7
Aft
er30
cycl
es−0
.066
0.05
90.
049
0.08
4
Aft
er50
cycl
es−0
.433
0.05
4−0
.143
0.07
1
No.20
1020
Aft
er10
cycl
es−0
.088
0.07
40.
0003
2−0
.066
0.09
90.
0001
9
Aft
er30
cycl
es0.
049
0.08
4−0
.008
0.09
6
Aft
er50
cycl
es− 0
.024
0.07
3−0
.012
0.09
7
123

Int J Thermophys (2017) 38:95 Page 5 of 14 95
Tabl
e2
Res
ults
ofR
IRT
sst
abili
tyfo
rth
ese
cond
batc
hof
ther
mom
eter
s
T≈
4,6K
T≈
7,2
K
�T,m
Ku(�
T),
mK
Self
-hea
ting,
�/m
A2
�T,m
Ku(�
T),
mK
Self
-hea
ting,
�/m
A2
No.LT
001
Aft
er10
cycl
es0.
122
0.04
60.
0001
30.
058
0.04
00.
0000
7
Aft
er30
cycl
es0.
055
0.05
20.
021
0.05
3
Aft
er50
cycl
es0.
044
0.05
10.
023
0.04
0
No.LT
002
Aft
er10
cycl
es0.
071
0.19
20.
0001
30.
081
0.05
20.
0000
8
Aft
er30
cycl
es−0
.061
0.04
10.
037
0.04
0
Aft
er50
cycl
es−0
.067
0.04
30.
017
0.04
1
No.LT
005
Aft
er10
cycl
es−0
.256
0.04
40.
0001
10.
188
0.21
10.
0000
7
Aft
er30
cycl
es−0
.108
0.04
3−0
.039
0.05
1
Aft
er50
cycl
es−0
.127
0.04
6−0
.037
0.05
1
No.LT
009
Aft
er10
cycl
es0.
090
0.09
20.
0001
30.
051
0.15
70.
0000
7
Aft
er30
cycl
es−0
.148
0.08
9−0
.025
0.11
8
Aft
er50
cycl
es−0
.203
0.06
8−0
.110
0.12
1
No.LT
011
Aft
er10
cycl
es−0
.018
0.03
90.
0001
6−0
.003
0.17
60.
0001
0
Aft
er30
cycl
es−0
.129
0.04
0− 0
.053
0.03
9
Aft
er50
cycl
es−0
.149
0.04
0−0
.069
0.03
9
123

95 Page 6 of 14 Int J Thermophys (2017) 38:95
Tabl
e2
cont
inue
d
T≈
4,6K
T≈
7,2
K
�T,m
Ku(�
T),
mK
Self
-hea
ting,
�/m
A2
�T,m
Ku(�
T),
mK
Self
-hea
ting,
�/m
A2
No.LT
013
Aft
er10
cycl
es0.
093
0.06
50.
0001
60.
044
0.11
50.
0001
0
Aft
er30
cycl
es0.
008
0.07
5−0
.015
0.13
1
Aft
er50
cycl
es−0
.021
0.08
3−0
.092
0.14
0
No.LT
015
Aft
er10
cycl
es0.
241
0.04
70.
0001
30.
151
0.11
40.
0000
7
Aft
er30
cycl
es−0
.086
0.05
6−0
.004
0.03
9
Aft
er50
cycl
es−0
.108
0.05
0−0
.009
0.04
5
No.LT
016
Aft
er10
cycl
es0.
142
0.04
20.
0001
60.
045
0.04
00.
0000
9
Aft
er30
cycl
es0.
082
0.07
10.
015
0.04
9
Aft
er50
cycl
es0.
032
0.04
10.
005
0.05
9
No.LT
017
Aft
er10
cycl
es0.
195
0.06
50.
0001
30.
110
0.09
90.
0000
7
Aft
er30
cycl
es−0
.126
0.03
8−0
.128
0.05
4
Aft
er50
cycl
es−0
.138
0.03
8−0
.105
0.06
7
No.LT
019
Aft
er10
cycl
es0.
114
0.04
90.
0001
10.
063
0.04
80.
0000
6
Aft
er30
cycl
es0.
029
0.04
90.
026
0.04
4
Aft
er50
cycl
es0.
044
0.05
30.
033
0.05
0
123

Int J Thermophys (2017) 38:95 Page 7 of 14 95
Tabl
e2
cont
inue
d
T≈
4,6K
T≈
7,2
K
�T,m
Ku(�
T),
mK
Self
-hea
ting,
�/m
A2
�T,m
Ku(�
T),
mK
Self
-hea
ting,
�/m
A2
No.20
101
Aft
er10
cycl
es0.
120
0.04
30.
0002
50.
115
0.10
20.
0001
6
Aft
er30
cycl
es0.
029
0.06
0−0
.024
0.05
0
Aft
er50
cycl
es0.
013
0.04
5−0
.009
0.05
0
No.20
0909
Aft
er10
cycl
es0.
125
0.05
90.
0001
1−0
.007
0.09
80.
0000
6
Aft
er30
cycl
es0.
052
0.06
70.
022
0.05
2
Aft
er50
cycl
es0.
016
0.06
1−0
.033
0.08
0
No.20
1301
Aft
er10
cycl
es0.
117
0.04
50.
0001
50.
048
0.09
50.
0000
8
Aft
er10
cycl
es0.
092
0.26
5−0
.019
0.09
6
Aft
er10
cycl
es0.
012
0.05
5−0
.005
0.10
2
123

95 Page 8 of 14 Int J Thermophys (2017) 38:95
Fig. 1 Liquid helium cryostatconstruction (a heat switch, bcopper block, c thermal shield, dcarbon thermometer, e leadsample, f mutual induction coils)
a thermal shield, c. Thermal contact between the thermometers and the block wasensured with Apiezon grease. A photograph of the copper block is presented in Fig. 2.
For controlling the temperature of the copper block near 4.6 K, a model 370 LakeShore Cryotronics temperature controller, with an Allen–Bradley carbon resistancethermometer, d (Fig. 1) was applied. The temperature of the block was stable within±0.1 mK during the thermometer tests.
At a temperature close to 7.2 K, some tests were carried out with a superconductinglead (Pb) transition (the lead sample, e, is shown in Fig. 1) used for the temperaturestabilization. The lead sample was inside mutual inductance coils, f . The signal fromthe coil was measured via a lock-in amplifier and transmitted to the PID controller.Because the accuracy of the temperature stabilization using this method was the sameas obtained with the Lake Shore Controller, the second simpler methods were usedfor most tests.
4 RIRT Resistance Measurements
The measuring system is shown in Fig. 3. A Measurements International Model MI6015 bridge (with a measurement uncertainty of 0.02 parts per million) was used
123

Int J Thermophys (2017) 38:95 Page 9 of 14 95
Fig. 2 Copper block withRIRTs
for the resistance measurements. The resistance RX of each tested thermometer wasmeasured using the standard thermometer no B178, placed in the copper block, asthe reference resistor. This method reduces the error due to the temperature drift ofthe copper block, because both RX and the resistance RT of thermometer B178 havesimilar temperature coefficients, so the ratio RX/RT is nearly independent of temper-ature [11]. The resistance RT was measured twice—before and after measuring theresistance ratios RX/RT of all of the tested thermometers. From these measurements,the values of RT and the RX can be calculated and they apply at the mean temperatureof thermometer B178.
The resistance RT was measured relative to a 10 � Tinsley standard resistor placedin a thermal enclosure outside the cryostat. The ratio resistance bridge and the standardresistor were calibrated at the Central Office of Measures (the National MeasurementInstitute in Poland).
The resistance RT and the ratios RX/RT were measured at two currents, I1 = 1 mAand I2 = √
2 mA, and extrapolated to I0 = 0. All numerical values of the resistanceswere the average of 40 measurements.
5 Tests of Thermometers Stability
To analyze the thermometer stability, we assumed that in a narrow temperature range—within about 10 mK—the dependence of R = f (T ) for the tested thermometers waslinear with sufficient accuracy:
R = aT + b.
The a and b coefficients for each thermometer were determined in the first run beforethe thermal treatments. The resistance RX was measured at three temperatures differ-
123

95 Page 10 of 14 Int J Thermophys (2017) 38:95
GPIB
PCLabVIEW
V
PID
temperature controller
generatorf=1900 Hz
lock-inV
L1
thermometer bridge
referenceresistor
switch
analog output
voltageinput
heat
er v
olta
gecryostat
L2
heater
thermometer
T0 T1...T9
copperblock
Pb sample
Fig. 3 Measuring system
ing by a few mK, and the linear regression function was applied to calculate a and bcoefficients (Fig. 4, solid line). After the thermal treatments, the resistance was mea-sured at two temperatures and the relation R1 = f (T ) was determined assuming thatthe linear relationship R1 = aT + b1 is parallel to R = aT + b. The thermometer’sstability is expressed by the temperatures difference T ′′−T ′ determined for two points
123

Int J Thermophys (2017) 38:95 Page 11 of 14 95
Fig. 4 Method of estimation ofRIRTs stability
with the same value of resistance R′ (see Fig. 4) after 10, 30 and 50 thermal cycles.The T ′′ − T ′ value was calculated from the equation:
T ′′ − T ′ = b − b1
a.
6 Measurements Results
The results obtained for the stability of the RIRTs at the temperatures of about 4.36 Kand 7.2 K for the first and 4.6 K and 7.2 K for the second batch of thermometers arepresented in Tables 1 and 2, respectively. The values of the uncertainty and self-heatingeffect are given too. The uncertainty budget included the following components:
• standard error of regression (function R = aT + b),• uncertainty of determination of the self-heating corrections,• uncertainty of ratio bridge,• standard resistor thermal drift,• standard thermometer reproducibility.
The results for some selected thermometers are presented in Figs. 5, 6, 7, 8 and 9.The thermometer numbers 20107, 200912 and 20108 were sent to INTiBS in the firstbatch, and the thermometer number 20101 and LT011 in second one, respectively.
Fig. 5 Graph of resistance versus temperature for thermometer 20107
123

95 Page 12 of 14 Int J Thermophys (2017) 38:95
Fig. 6 Graph of resistance versus temperature for thermometer 200912
Fig. 7 Graph of resistance versus temperature for thermometer 20108
Fig. 8 Graph of resistance versus temperature for thermometer 20101
Fig. 9 Graph of resistance versus temperature for thermometer LT011
123
Int J Thermophys (2017) 38:95 Page 13 of 14 95
-0,4
-0,2
0
0,2
0,4
LT00
1
LT00
2
LT00
5
LT00
9
LT01
1
LT01
3
LT01
5
LT01
6
LT01
7
LT01
9
2010
1
2009
09
2013
01
Thermometr number
T, m
K
after 10 cyclesafter 30 cyclesafter 50 cycles
Δ
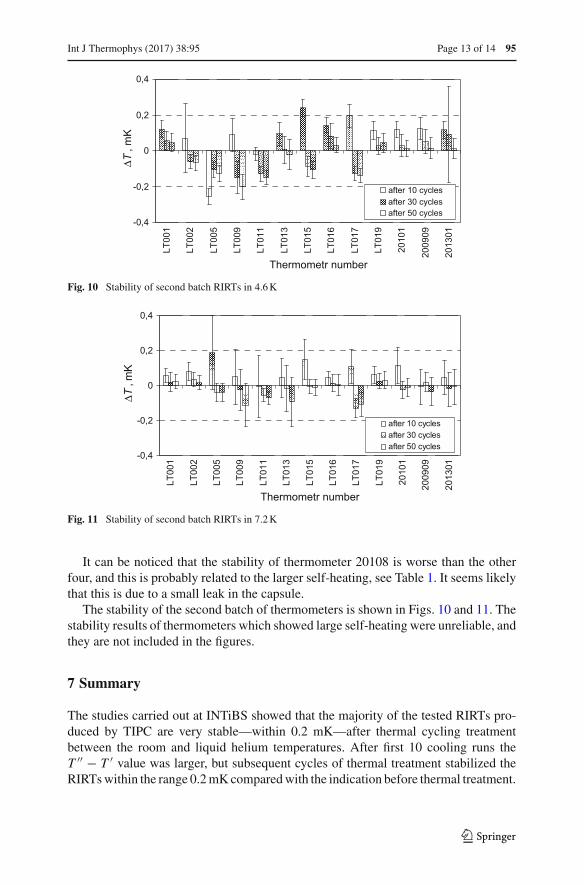
Fig. 10 Stability of second batch RIRTs in 4.6 K
-0,4
-0,2
0
0,2
0,4
LT00
1
LT00
2
LT00
5
LT00
9
LT01
1
LT01
3
LT01
5
LT01
6
LT01
7
LT01
9
2010
1
2009
09
2013
01
Thermometr number
T, m
K
after 10 cyclesafter 30 cyclesafter 50 cycles
Δ
Fig. 11 Stability of second batch RIRTs in 7.2 K
It can be noticed that the stability of thermometer 20108 is worse than the otherfour, and this is probably related to the larger self-heating, see Table 1. It seems likelythat this is due to a small leak in the capsule.
The stability of the second batch of thermometers is shown in Figs. 10 and 11. Thestability results of thermometers which showed large self-heating were unreliable, andthey are not included in the figures.
7 Summary
The studies carried out at INTiBS showed that the majority of the tested RIRTs pro-duced by TIPC are very stable—within 0.2 mK—after thermal cycling treatmentbetween the room and liquid helium temperatures. After first 10 cooling runs theT ′′ − T ′ value was larger, but subsequent cycles of thermal treatment stabilized theRIRTs within the range 0.2 mK compared with the indication before thermal treatment.
123

95 Page 14 of 14 Int J Thermophys (2017) 38:95
Acknowledgements Authors of the paper express thanks to Dr. L. Lipinski from INTiBS for his contri-bution to the elaboration of the research results.
Open Access This article is distributed under the terms of the Creative Commons Attribution 4.0 Interna-tional License (http://creativecommons.org/licenses/by/4.0/), which permits unrestricted use, distribution,and reproduction in any medium, provided you give appropriate credit to the original author(s) and thesource, provide a link to the Creative Commons license, and indicate if changes were made.
References
1. W.L. Tew, R.L. Rusby, P. Lin, L. Lipinski, P.P.M. Steur, B.W.A. Ricketson, Int. J. Thermophys. 36,2036 (2015)
2. R.L. Rusby, in Temperature, Its Measurements and Control in Science and Industry, Part 2, ed. byH.H. Plumb (ISA, Pittsburgh, 1972), p. 865
3. R.L. Rusby, in Temperature, Its Measurements and Control in Science and Industry, Part 1, ed. by J.F.Schooley (AIP, New York, 1982), p. 829
4. L.M. Besley, P. Lin, Meas. Sci. Technol. 4, 1357 (1993)5. G.A. Kytin, S.F. Vorfolomeev, Y.A. Dedikov, L.N. Ermilova, D.N. Astrov, in Proceedings of the 17th
Meeting of the CCT, Document 89-7 (BIPM, Sevres, 1989)6. O. Tamura, H. Sakurai, Jpn. J. Appl. Phys. 26, L947 (1987)7. P. Lin, Acta Metrol. Sin. 29, 171 (2008)8. P. Lin, X. Li, B. Gao, L. Yu, R. Huang, F. Li, Development of Chinese standard type of rhodium–iron
resistance thermometers, in Presented on XIII International Symposium on Temperature and Thermalmeasurements in Industry and Science TEMPMEKO 2016, Zakopane (2016)
9. F. Pavese, A. Szmyrka-Grzebyk, L. Lipinski, H. Manuszkiewicz, P. Qiu, J.T. Zhang, P. Lin, X.W. Li,Int. J. Thermophys. 29, 51 (2008)
10. L. Lipinski, A. Szmyrka-Grzebyk, P. Lin, X.W. Li, H. Manuszkiewicz, D. Jancewicz, A. Grykalowska,P.P.M. Steur, F. Pavese, Int. J. Thermophys. 31, 1696 (2010)
11. V. Batagelj, J. Bojkovski, Int. J. Thermophys. 32, 1409–1417 (2011)
123
Top Related