


Languages
Pages
Legal


1
Temporal Aggregation Effects on ITS Data
ApplicationsSustainable transportation performance measures
ITS Data Aggregation Effects – Alex Bigazzi
Alex BigazziPortland State University

2
Objective
ITS Data Aggregation Effects – Alex Bigazzi
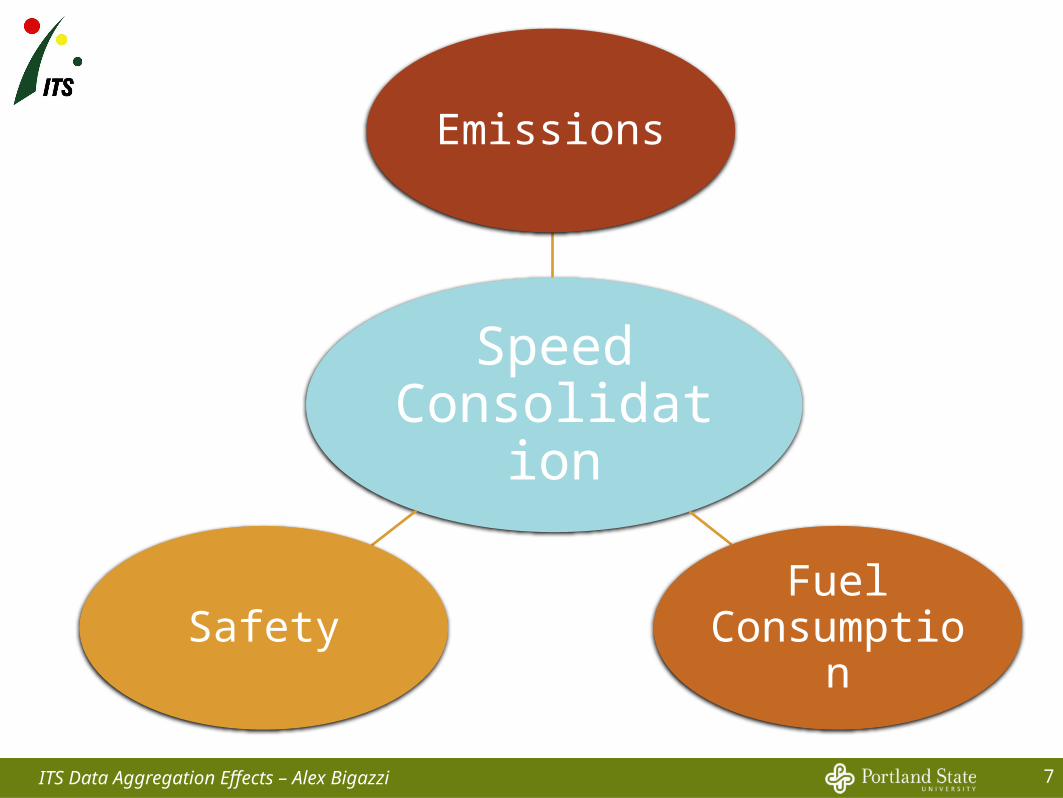
Effects of time-aggregating data on sustainability performance measures
• Emissions• Fuel Consumption
Speed distributions
• Delay
Travel time estimates

3
Data Source• ~2 miles of M4 in London• Individual arrival times and speeds• 24hr data over 5 weeks (1998)• 500 meter spacing
1 2 3 4 5 6 7 8
ITS Data Aggregation Effects – Alex Bigazzi
4
SPEED DISTRIBUTIONSand effects on related measures
ITS Data Aggregation Effects – Alex Bigazzi
6
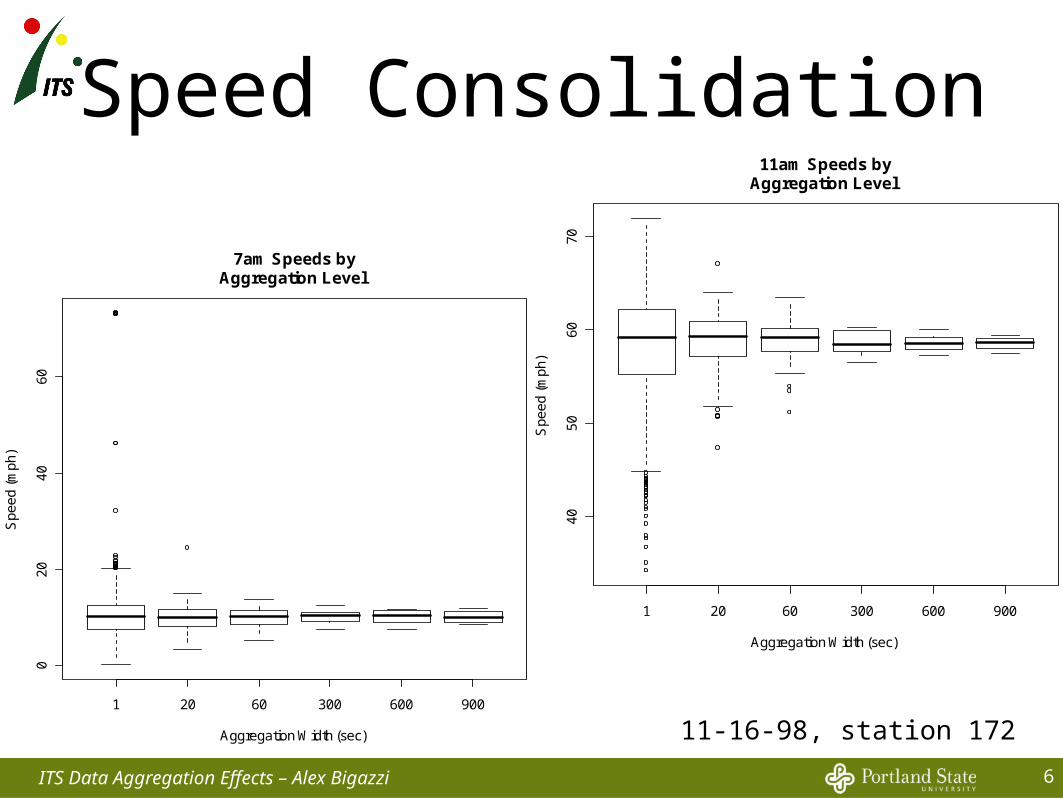
Speed Consolidation
ITS Data Aggregation Effects – Alex Bigazzi
1 20 60 300 600 900
02
04
06
0
7am Speeds byAggregation Level
Aggregation Width (sec)
Sp
ee
d (
mp
h)
1 20 60 300 600 900
40
50
60
70
11am Speeds byAggregation Level
Aggregation Width (sec)
Sp
ee
d (
mp
h)
11-16-98, station 172
7ITS Data Aggregation Effects – Alex Bigazzi
Speed Consolidation
Emissions
Fuel ConsumptionSafety
8
TRAVEL TIME
ITS Data Aggregation Effects – Alex Bigazzi

9ITS Data Aggregation Effects – Alex Bigazzi
Endpoint method of travel time estimation

10ITS Data Aggregation Effects – Alex Bigazzi
x
t
Travel
Sampling Error
True Trajectory
Speed-Estimated Trajectory
Detector
Detector
Sampling Error – neglected here
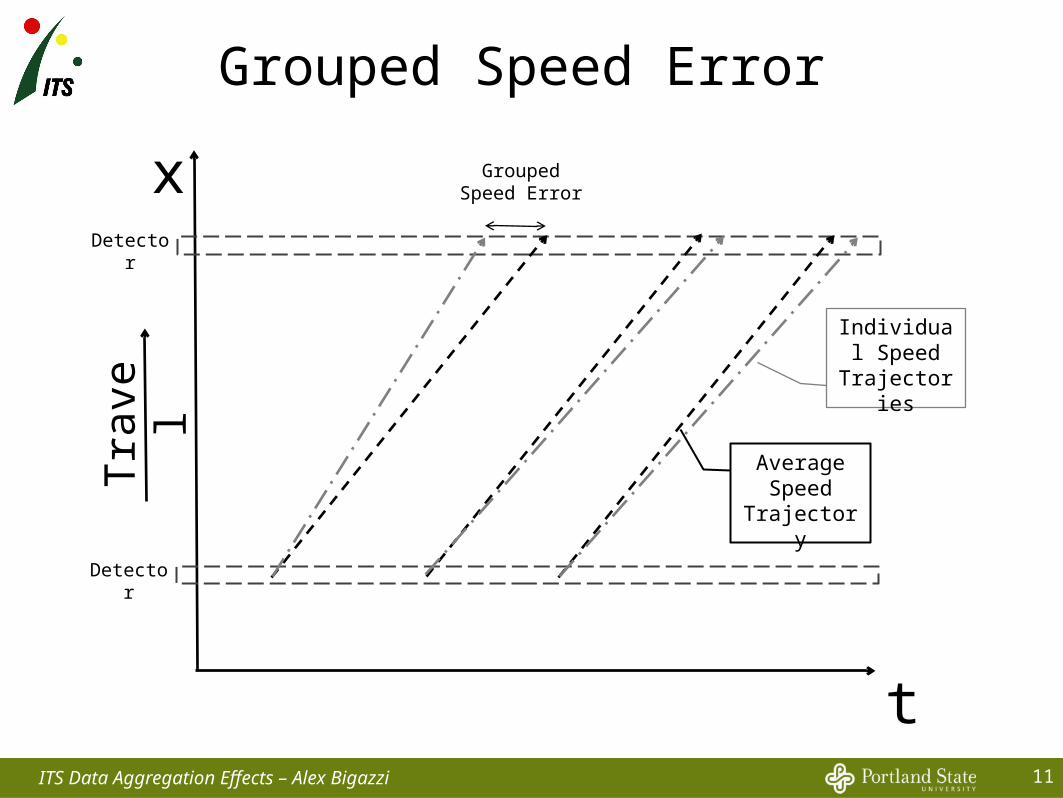
11ITS Data Aggregation Effects – Alex Bigazzi
x
t
Travel
Grouped Speed Error
Individual Speed
Trajectories
Average Speed
Trajectory
Detector
Detector
Grouped Speed Error
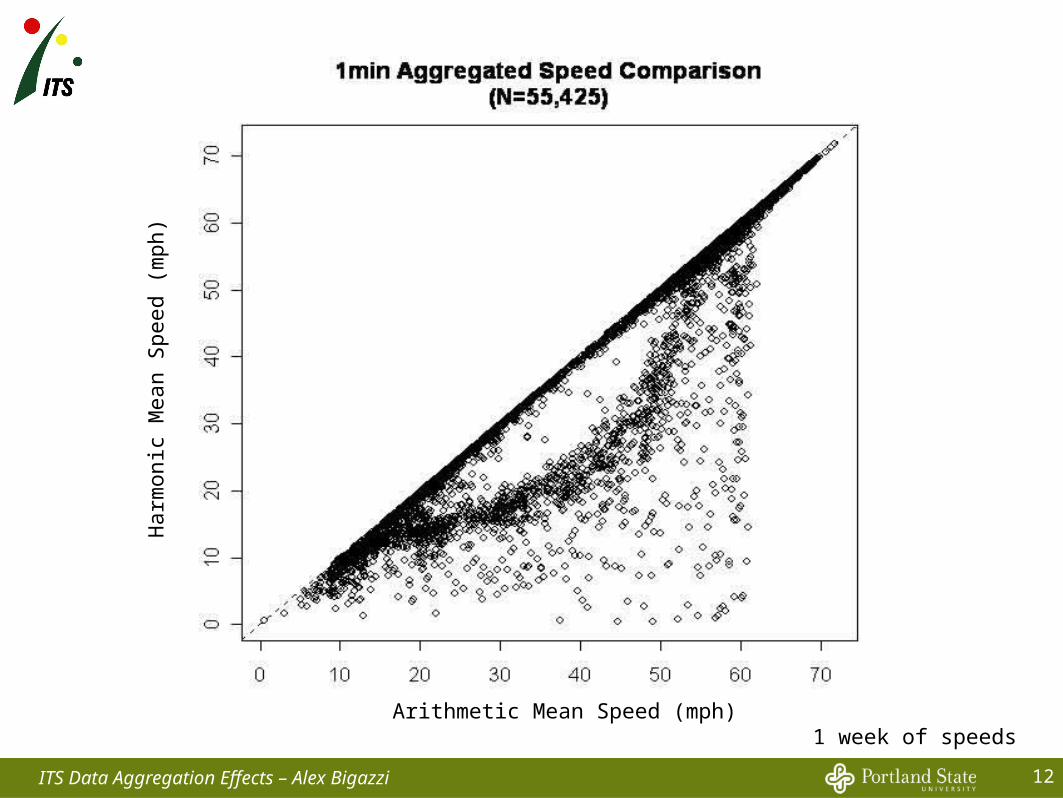
12ITS Data Aggregation Effects – Alex Bigazzi
1 week of speedsArithmetic Mean Speed (mph)
Harm
onic
Mean S
peed (
mph)

13
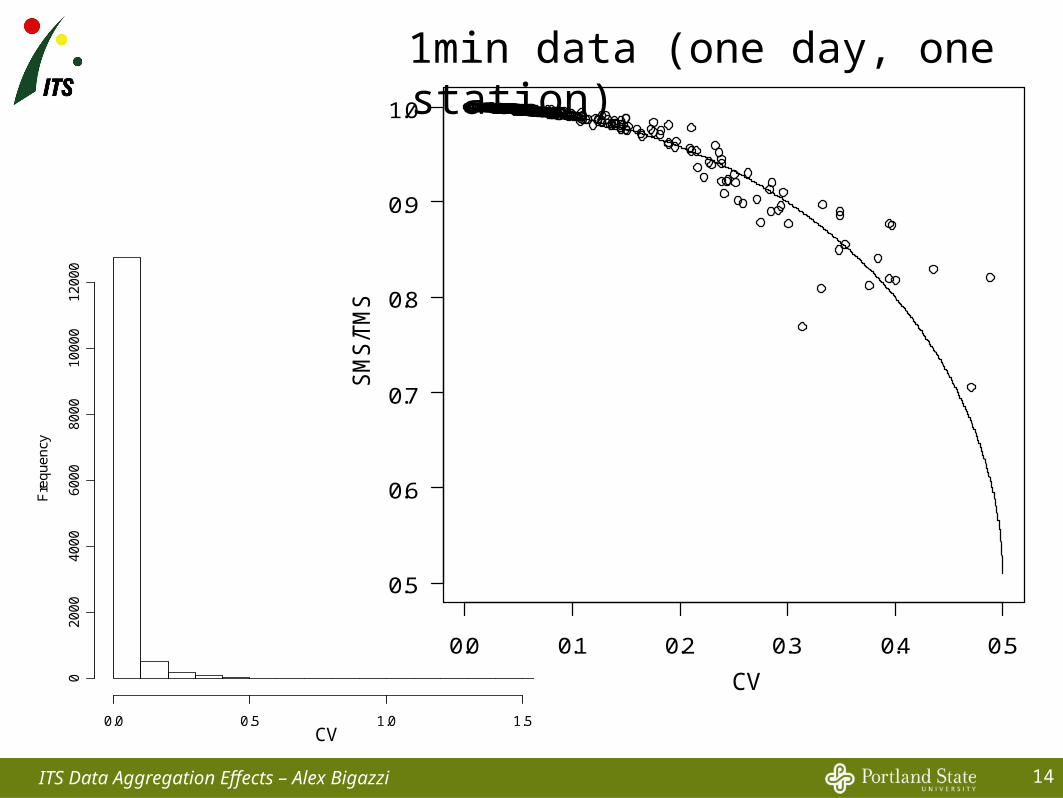
Estimate space mean speed from time mean speed
2
4 22
ttts
vvv
t
t
t
s
vCV
CVv
v
2
41
21
Rearranging:
ITS Data Aggregation Effects – Alex Bigazzi
Ref: Lindveld and Thijs
14
1min data (one day, one station)
0.0 0.1 0.2 0.3 0.4 0.5
0.5
0.6
0.7
0.8
0.9
1.0
COV
SM
S/T
MS
ITS Data Aggregation Effects – Alex Bigazzi
CV
Histogram of COV
COV
Fre
qu
en
cy
0.0 0.5 1.0 1.5
02
00
04
00
06
00
08
00
01
00
00
12
00
0
CV

15
10 20 30 60 120 300 600 900 1800 36000%
20%
40%
60%
80%
100%SMS estimates within 1% of
true value
Aggregation Width (sec)
ITS Data Aggregation Effects – Alex Bigazzi

16
DELAYCombined effects of speed distribution and travel time
errors
ITS Data Aggregation Effects – Alex Bigazzi
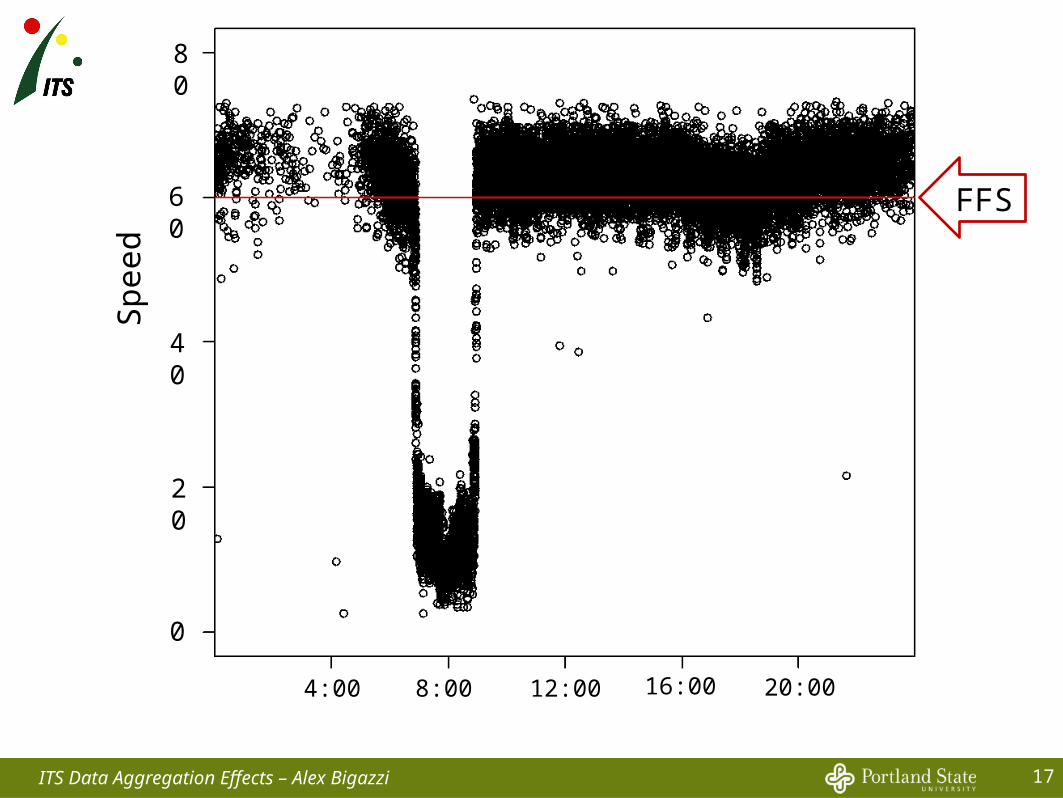
17ITS Data Aggregation Effects – Alex Bigazzi
80
60
40
20
0
Sp
eed
4:00 8:00 12:00 16:00 20:00
FFS
18
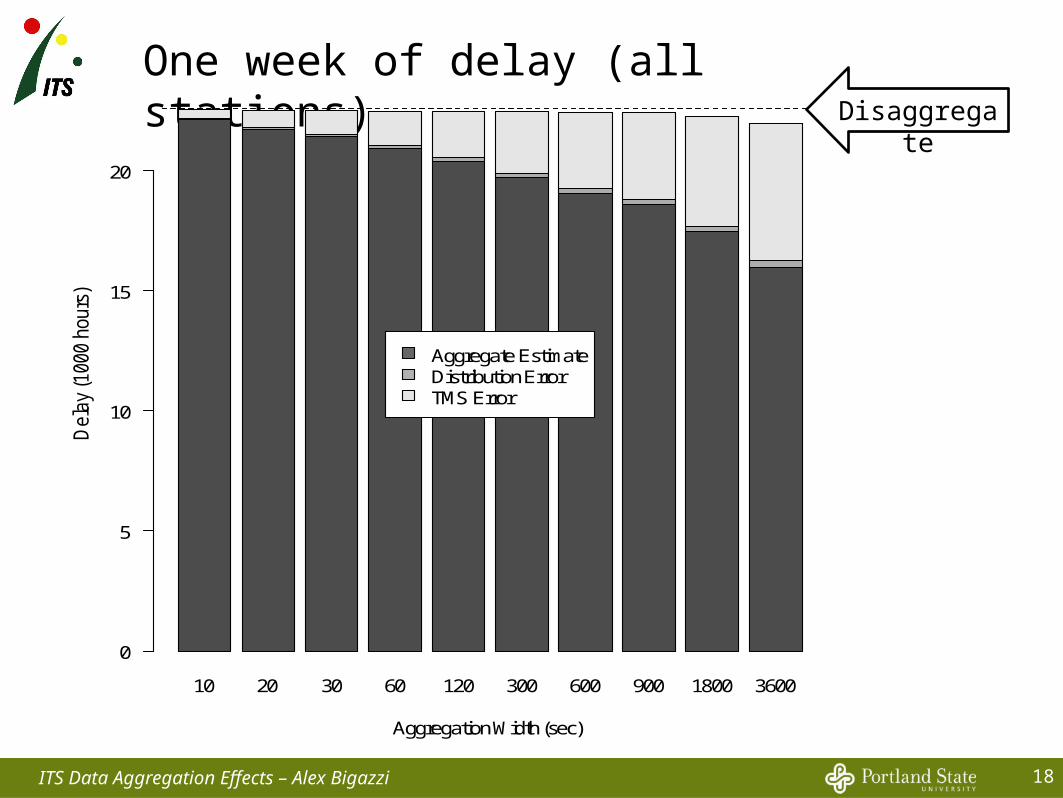
One week of delay (all stations)
10 20 30 60 120 300 600 900 1800 3600
Aggregated Delay, Calulated and Lost
Aggregation Width (sec)
Dela
y (1
000 h
ours
)
0
5
10
15
20
Aggregate EstimateDistribution ErrorTMS Error
ITS Data Aggregation Effects – Alex Bigazzi
Disaggregate
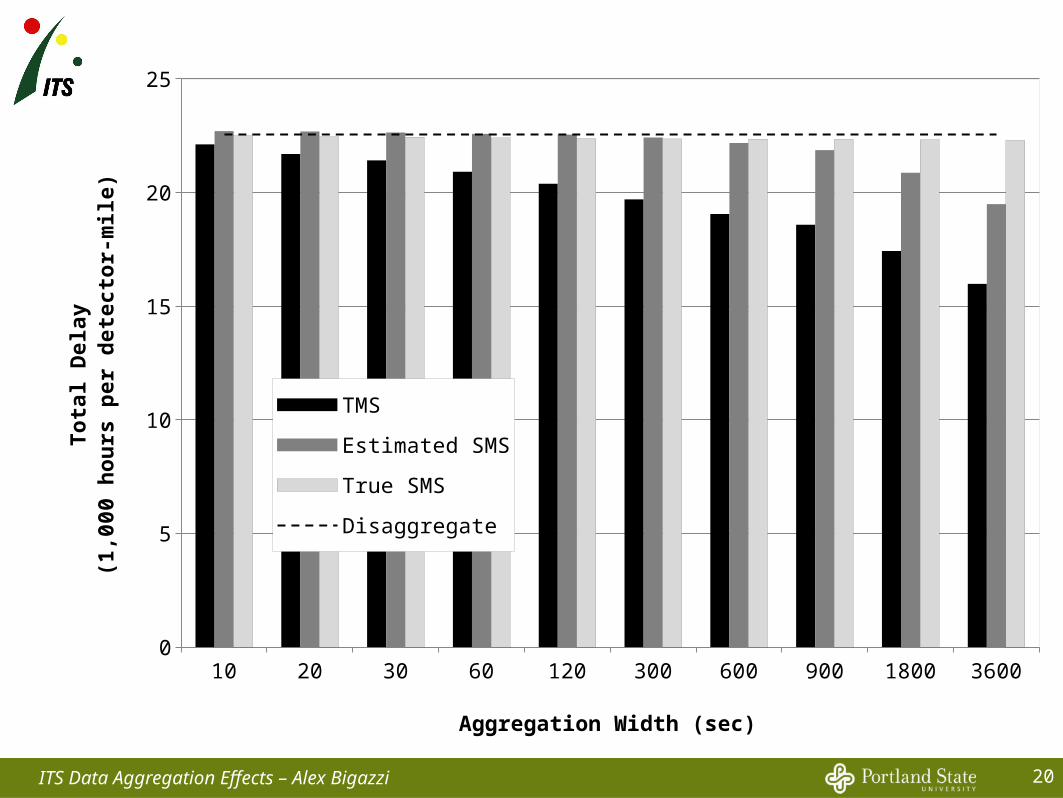
20ITS Data Aggregation Effects – Alex Bigazzi
10 20 30 60 120 300 600 900 1800 36000
5
10
15
20
25
TMS
Estimated SMS
True SMS
Disaggregate
Aggregation Width (sec)
Tota
l D
ela
y(1
,00
0 h
ou
rs p
er
dete
ctor-
mile)

21
Conclusions
ITS Data Aggregation Effects – Alex Bigazzi
With respect to disaggregate data:• Speed consolidation
- Underestimate emissions, fuel• Travel time
- TMS underestimates TT and delay
- Est. SMS from TMS and variance
22
Considerations Costs of data management Future uses for data Missing or bad data Other summary statso Varianceo Harmonic meano Median
ITS Data Aggregation Effects – Alex Bigazzi

23
Thank you!
? ? ?ITS Data Aggregation Effects – Alex Bigazzi
AcknowledgementsDr. Robert Bertini, Helene Siri, Stuart Beale, Tim Rees, and OTREC
Questions?
Top Related