


Languages
Pages
Legal

Technology M&A Report
Q3 2011
HYDE PARK CAPITAL
Member FINRA/SIPC
Investment Banking | Mergers & Acquisitions | Capital Raising
Hyde Park Capital Advisors, LLC 701 N. Franklin Street
Tampa, FL 33602 Tel: 813-383-0202
www.hydeparkcapital.com
John Hill Senior Managing Director [email protected] (813) 383-0205 John McDonald Senior Managing Director [email protected] (813) 383-0206 Keith Hodgdon Senior Vice President [email protected] (813) 383-0208 Jeffrey Bridge Vice President [email protected] (813) 383-0204 Michael Mariani Associate [email protected] (813) 597-2649
HYDE PARK CAPITAL Investment Banking | Mergers & Acquisitions | Capital Raising
Public Market Performance (LTM)
Select Equity Offerings – Technology (Q3 2011)
Public Company Market Performance by Sector
Source: Capital IQ
2
Capital Markets Overview
($ in millions)
($ in millions)
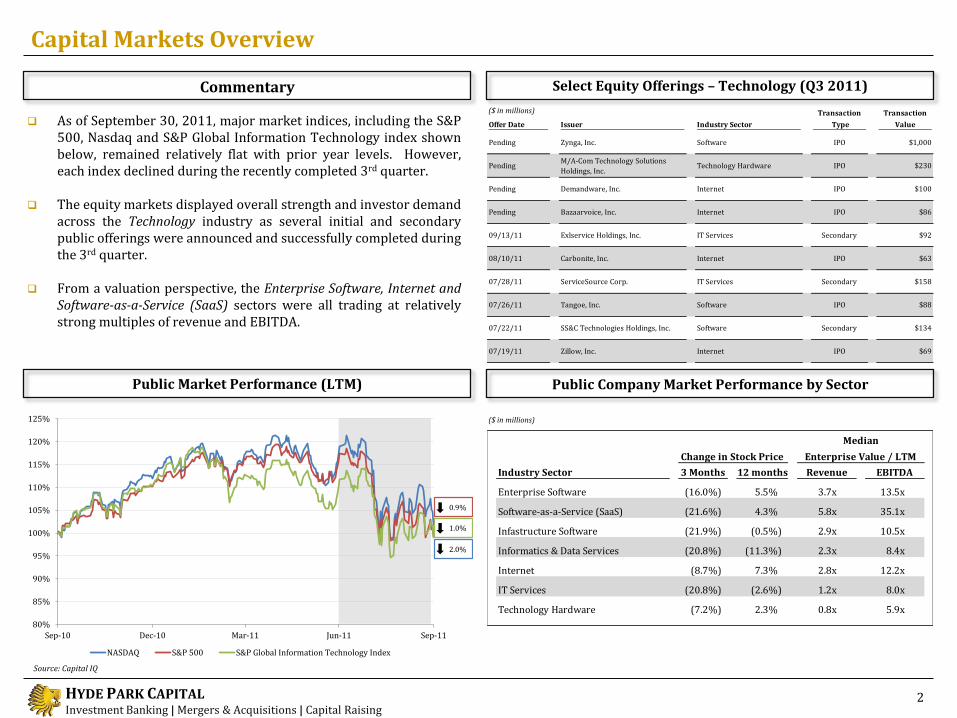
As of September 30, 2011, major market indices, including the S&P 500, Nasdaq and S&P Global Information Technology index shown below, remained relatively flat with prior year levels. However, each index declined during the recently completed 3rd quarter.
The equity markets displayed overall strength and investor demand across the Technology industry as several initial and secondary public offerings were announced and successfully completed during the 3rd quarter.
From a valuation perspective, the Enterprise Software, Internet and Software-as-a-Service (SaaS) sectors were all trading at relatively strong multiples of revenue and EBITDA.
Commentary
Offer Date Issuer Industry Sector
Transaction
Type
Transaction
Value
Pending Zynga, Inc. Software IPO $1,000
Pending M/A-Com Technology Solutions
Holdings, Inc.Technology Hardware IPO $230
Pending Demandware, Inc. Internet IPO $100
Pending Bazaarvoice, Inc. Internet IPO $86
09/13/11 Exlservice Holdings, Inc. IT Services Secondary $92
08/10/11 Carbonite, Inc. Internet IPO $63
07/28/11 ServiceSource Corp. IT Services Secondary $158
07/26/11 Tangoe, Inc. Software IPO $88
07/22/11 SS&C Technologies Holdings, Inc. Software Secondary $134
07/19/11 Zillow, Inc. Internet IPO $69
80%
85%
90%
95%
100%
105%
110%
115%
120%
125%
Sep-10 Dec-10 Mar-11 Jun-11 Sep-11
NASDAQ S&P 500 S&P Global Information Technology Index
2.0%
0.9%
1.0%
Industry Sector 3 Months 12 months Revenue EBITDA
Enterprise Software (16.0%) 5.5% 3.7x 13.5x
Software-as-a-Service (SaaS) (21.6%) 4.3% 5.8x 35.1x
Infastructure Software (21.9%) (0.5%) 2.9x 10.5x
Informatics & Data Services (20.8%) (11.3%) 2.3x 8.4x
Internet (8.7%) 7.3% 2.8x 12.2x
IT Services (20.8%) (2.6%) 1.2x 8.0x
Technology Hardware (7.2%) 2.3% 0.8x 5.9x
Median
Change in Stock Price Enterprise Value / LTM
HYDE PARK CAPITAL Investment Banking | Mergers & Acquisitions | Capital Raising
Middle Market Purchase Multiples
U.S. Middle Market M&A Activity – Annual Trends: VOLUME U.S. Middle Market M&A Activity – Annual Trends: VALUE
To
tal T
ran
sact
ion
Vo
lum
e
To
tal T
ran
sact
ion
Val
ue
($ in
bil
lio
ns)
Annual Middle Market M&A Activity – Technology
Less than $100M $100 - $499M $500 - $1,000MLess than $100M $100 - $499M $500 - $1,000M
3
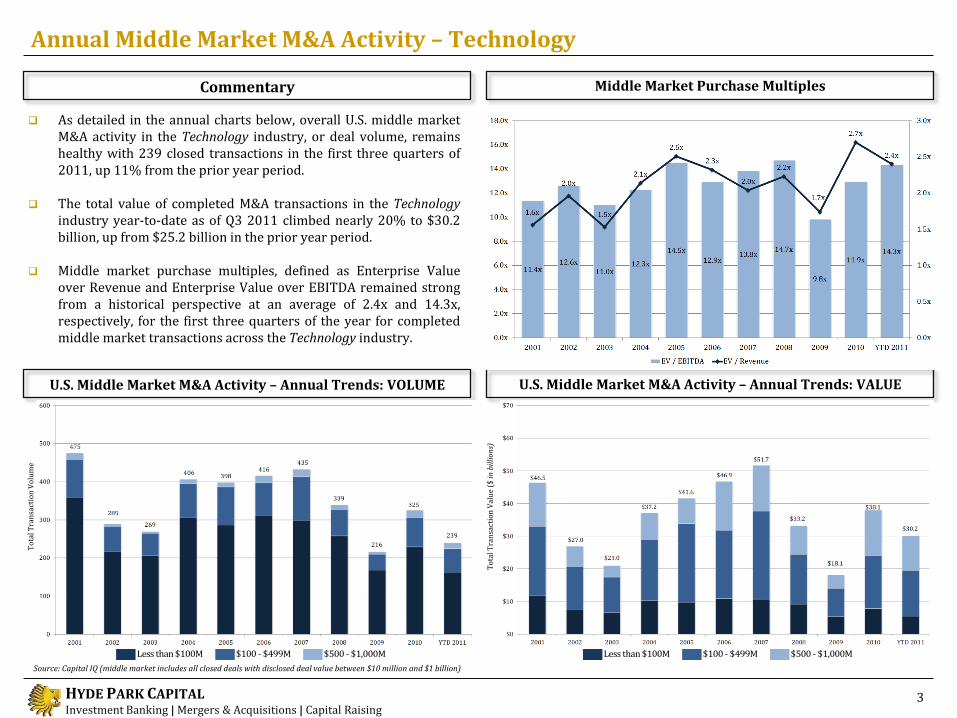
As detailed in the annual charts below, overall U.S. middle market M&A activity in the Technology industry, or deal volume, remains healthy with 239 closed transactions in the first three quarters of 2011, up 11% from the prior year period.
The total value of completed M&A transactions in the Technology industry year-to-date as of Q3 2011 climbed nearly 20% to $30.2 billion, up from $25.2 billion in the prior year period.
Middle market purchase multiples, defined as Enterprise Value over Revenue and Enterprise Value over EBITDA remained strong from a historical perspective at an average of 2.4x and 14.3x, respectively, for the first three quarters of the year for completed middle market transactions across the Technology industry.
Commentary
Source: Capital IQ (middle market includes all closed deals with disclosed deal value between $10 million and $1 billion)
HYDE PARK CAPITAL Investment Banking | Mergers & Acquisitions | Capital Raising
Quarterly Middle Market M&A Activity – Technology
U.S. Middle Market M&A Activity – Quarterly Trends: VALUE U.S. Middle Market M&A Activity – Quarterly Trends: VOLUME
Middle Market M&A Transactions by Deal Size – Technology
($ in billions)
To
tal T
ran
sact
ion
Vo
lum
e
To
tal T
ran
sact
ion
Val
ue
($ in
bil
lio
ns)
Less than $100M $100 - $499M $500 - $1,000MLess than $100M $100 - $499M $500 - $1,000M
4
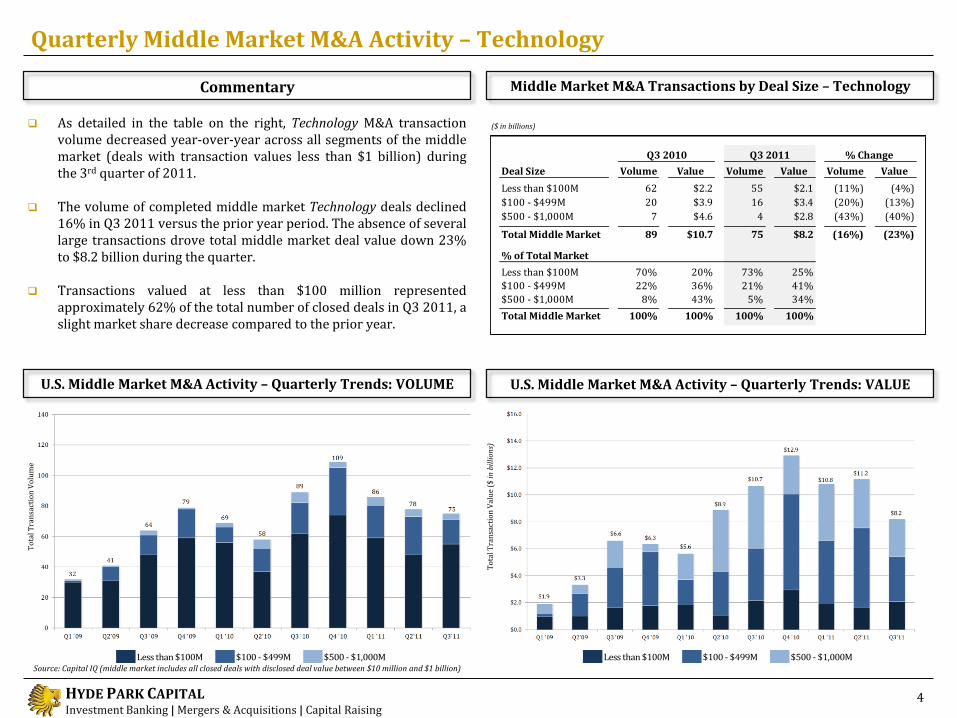
As detailed in the table on the right, Technology M&A transaction volume decreased year-over-year across all segments of the middle market (deals with transaction values less than $1 billion) during the 3rd quarter of 2011.
The volume of completed middle market Technology deals declined 16% in Q3 2011 versus the prior year period. The absence of several large transactions drove total middle market deal value down 23% to $8.2 billion during the quarter.
Transactions valued at less than $100 million represented approximately 62% of the total number of closed deals in Q3 2011, a slight market share decrease compared to the prior year.
Commentary
Source: Capital IQ (middle market includes all closed deals with disclosed deal value between $10 million and $1 billion)
Deal Size Volume Value Volume Value Volume Value
Less than $100M 62 $2.2 55 $2.1 (11%) (4%)
$100 - $499M 20 $3.9 16 $3.4 (20%) (13%)
$500 - $1,000M 7 $4.6 4 $2.8 (43%) (40%)
Total Middle Market 89 $10.7 75 $8.2 (16%) (23%)
% of Total Market
Less than $100M 70% 20% 73% 25%
$100 - $499M 22% 36% 21% 41%
$500 - $1,000M 8% 43% 5% 34%
Total Middle Market 100% 100% 100% 100%
Q3 2010 Q3 2011 % Change
HYDE PARK CAPITAL Investment Banking | Mergers & Acquisitions | Capital Raising
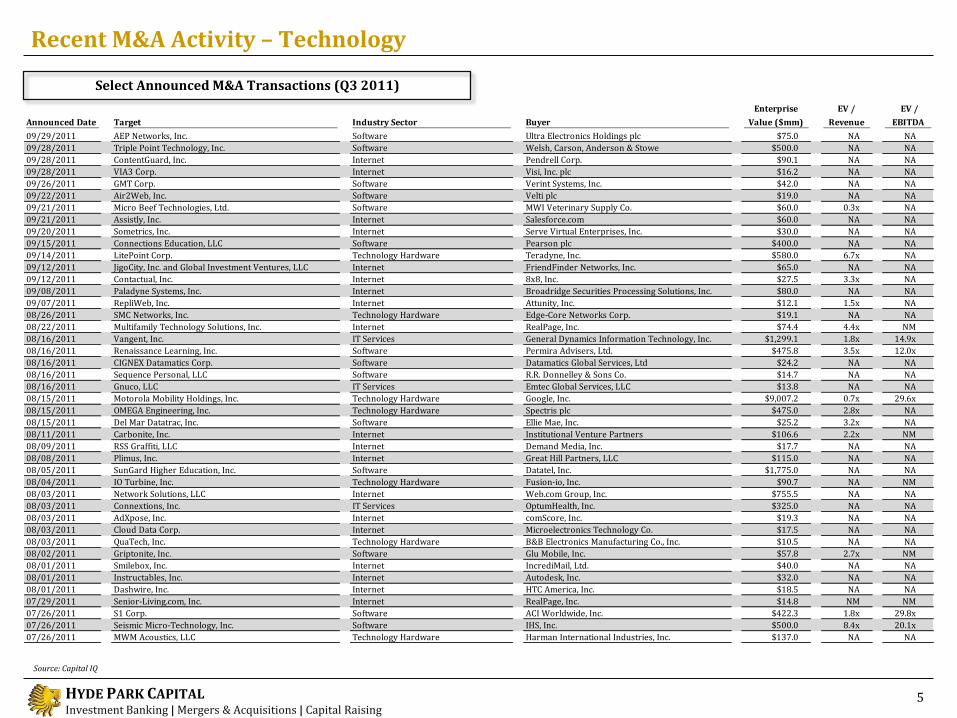
Recent M&A Activity – Technology
Select Announced M&A Transactions (Q3 2011)
5
Source: Capital IQ
Announced Date Target Industry Sector Buyer
Enterprise
Value ($mm)
EV /
Revenue
EV /
EBITDA
09/29/2011 AEP Networks, Inc. Software Ultra Electronics Holdings plc $75.0 NA NA
09/28/2011 Triple Point Technology, Inc. Software Welsh, Carson, Anderson & Stowe $500.0 NA NA
09/28/2011 ContentGuard, Inc. Internet Pendrell Corp. $90.1 NA NA
09/28/2011 VIA3 Corp. Internet Visi, Inc. plc $16.2 NA NA
09/26/2011 GMT Corp. Software Verint Systems, Inc. $42.0 NA NA
09/22/2011 Air2Web, Inc. Software Velti plc $19.0 NA NA
09/21/2011 Micro Beef Technologies, Ltd. Software MWI Veterinary Supply Co. $60.0 0.3x NA
09/21/2011 Assistly, Inc. Internet Salesforce.com $60.0 NA NA
09/20/2011 Sometrics, Inc. Internet Serve Virtual Enterprises, Inc. $30.0 NA NA
09/15/2011 Connections Education, LLC Software Pearson plc $400.0 NA NA
09/14/2011 LitePoint Corp. Technology Hardware Teradyne, Inc. $580.0 6.7x NA
09/12/2011 JigoCity, Inc. and Global Investment Ventures, LLC Internet FriendFinder Networks, Inc. $65.0 NA NA
09/12/2011 Contactual, Inc. Internet 8x8, Inc. $27.5 3.3x NA
09/08/2011 Paladyne Systems, Inc. Internet Broadridge Securities Processing Solutions, Inc. $80.0 NA NA
09/07/2011 RepliWeb, Inc. Internet Attunity, Inc. $12.1 1.5x NA
08/26/2011 SMC Networks, Inc. Technology Hardware Edge-Core Networks Corp. $19.1 NA NA
08/22/2011 Multifamily Technology Solutions, Inc. Internet RealPage, Inc. $74.4 4.4x NM
08/16/2011 Vangent, Inc. IT Services General Dynamics Information Technology, Inc. $1,299.1 1.8x 14.9x
08/16/2011 Renaissance Learning, Inc. Software Permira Advisers, Ltd. $475.8 3.5x 12.0x
08/16/2011 CIGNEX Datamatics Corp. Software Datamatics Global Services, Ltd $24.2 NA NA
08/16/2011 Sequence Personal, LLC Software R.R. Donnelley & Sons Co. $14.7 NA NA
08/16/2011 Gnuco, LLC IT Services Emtec Global Services, LLC $13.8 NA NA
08/15/2011 Motorola Mobility Holdings, Inc. Technology Hardware Google, Inc. $9,007.2 0.7x 29.6x
08/15/2011 OMEGA Engineering, Inc. Technology Hardware Spectris plc $475.0 2.8x NA
08/15/2011 Del Mar Datatrac, Inc. Software Ellie Mae, Inc. $25.2 3.2x NA
08/11/2011 Carbonite, Inc. Internet Institutional Venture Partners $106.6 2.2x NM
08/09/2011 RSS Graffiti, LLC Internet Demand Media, Inc. $17.7 NA NA
08/08/2011 Plimus, Inc. Internet Great Hill Partners, LLC $115.0 NA NA
08/05/2011 SunGard Higher Education, Inc. Software Datatel, Inc. $1,775.0 NA NA
08/04/2011 IO Turbine, Inc. Technology Hardware Fusion-io, Inc. $90.7 NA NM
08/03/2011 Network Solutions, LLC Internet Web.com Group, Inc. $755.5 NA NA
08/03/2011 Connextions, Inc. IT Services OptumHealth, Inc. $325.0 NA NA
08/03/2011 AdXpose, Inc. Internet comScore, Inc. $19.3 NA NA
08/03/2011 Cloud Data Corp. Internet Microelectronics Technology Co. $17.5 NA NA
08/03/2011 QuaTech, Inc. Technology Hardware B&B Electronics Manufacturing Co., Inc. $10.5 NA NA
08/02/2011 Griptonite, Inc. Software Glu Mobile, Inc. $57.8 2.7x NM
08/01/2011 Smilebox, Inc. Internet IncrediMail, Ltd. $40.0 NA NA
08/01/2011 Instructables, Inc. Internet Autodesk, Inc. $32.0 NA NA
08/01/2011 Dashwire, Inc. Internet HTC America, Inc. $18.5 NA NA
07/29/2011 Senior-Living.com, Inc. Internet RealPage, Inc. $14.8 NM NM
07/26/2011 S1 Corp. Software ACI Worldwide, Inc. $422.3 1.8x 29.8x
07/26/2011 Seismic Micro-Technology, Inc. Software IHS, Inc. $500.0 8.4x 20.1x
07/26/2011 MWM Acoustics, LLC Technology Hardware Harman International Industries, Inc. $137.0 NA NA
HYDE PARK CAPITAL Investment Banking | Mergers & Acquisitions | Capital Raising
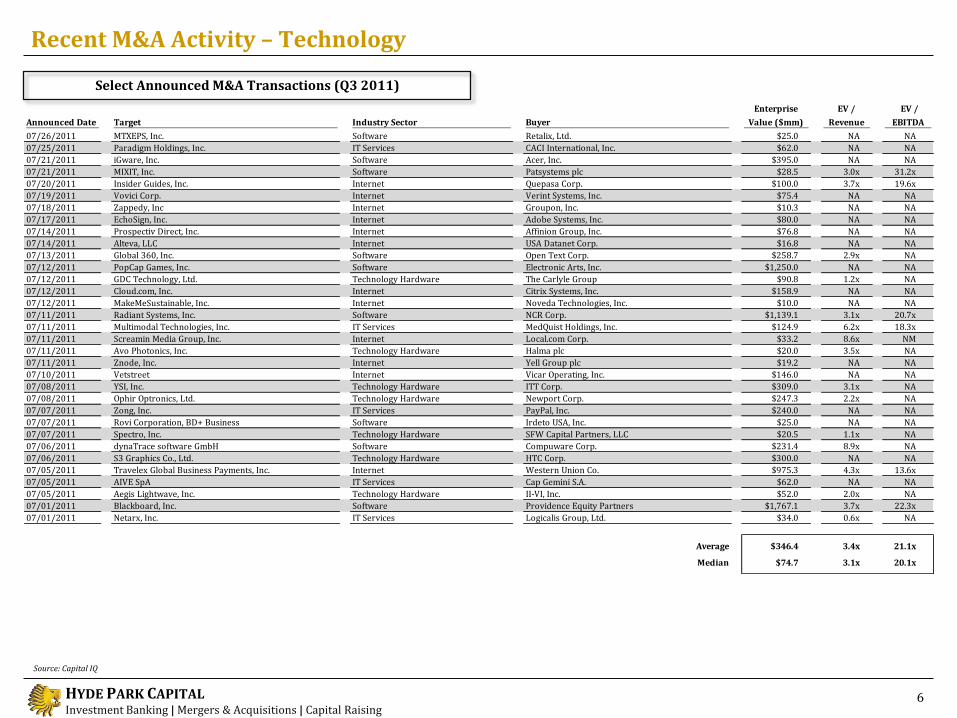
Recent M&A Activity – Technology
Select Announced M&A Transactions (Q3 2011)
6
Source: Capital IQ
Announced Date Target Industry Sector Buyer
Enterprise
Value ($mm)
EV /
Revenue
EV /
EBITDA
07/26/2011 MTXEPS, Inc. Software Retalix, Ltd. $25.0 NA NA
07/25/2011 Paradigm Holdings, Inc. IT Services CACI International, Inc. $62.0 NA NA
07/21/2011 iGware, Inc. Software Acer, Inc. $395.0 NA NA
07/21/2011 MIXIT, Inc. Software Patsystems plc $28.5 3.0x 31.2x
07/20/2011 Insider Guides, Inc. Internet Quepasa Corp. $100.0 3.7x 19.6x
07/19/2011 Vovici Corp. Internet Verint Systems, Inc. $75.4 NA NA
07/18/2011 Zappedy, Inc Internet Groupon, Inc. $10.3 NA NA
07/17/2011 EchoSign, Inc. Internet Adobe Systems, Inc. $80.0 NA NA
07/14/2011 Prospectiv Direct, Inc. Internet Affinion Group, Inc. $76.8 NA NA
07/14/2011 Alteva, LLC Internet USA Datanet Corp. $16.8 NA NA
07/13/2011 Global 360, Inc. Software Open Text Corp. $258.7 2.9x NA
07/12/2011 PopCap Games, Inc. Software Electronic Arts, Inc. $1,250.0 NA NA
07/12/2011 GDC Technology, Ltd. Technology Hardware The Carlyle Group $90.8 1.2x NA
07/12/2011 Cloud.com, Inc. Internet Citrix Systems, Inc. $158.9 NA NA
07/12/2011 MakeMeSustainable, Inc. Internet Noveda Technologies, Inc. $10.0 NA NA
07/11/2011 Radiant Systems, Inc. Software NCR Corp. $1,139.1 3.1x 20.7x
07/11/2011 Multimodal Technologies, Inc. IT Services MedQuist Holdings, Inc. $124.9 6.2x 18.3x
07/11/2011 Screamin Media Group, Inc. Internet Local.com Corp. $33.2 8.6x NM
07/11/2011 Avo Photonics, Inc. Technology Hardware Halma plc $20.0 3.5x NA
07/11/2011 Znode, Inc. Internet Yell Group plc $19.2 NA NA
07/10/2011 Vetstreet Internet Vicar Operating, Inc. $146.0 NA NA
07/08/2011 YSI, Inc. Technology Hardware ITT Corp. $309.0 3.1x NA
07/08/2011 Ophir Optronics, Ltd. Technology Hardware Newport Corp. $247.3 2.2x NA
07/07/2011 Zong, Inc. IT Services PayPal, Inc. $240.0 NA NA
07/07/2011 Rovi Corporation, BD+ Business Software Irdeto USA, Inc. $25.0 NA NA
07/07/2011 Spectro, Inc. Technology Hardware SFW Capital Partners, LLC $20.5 1.1x NA
07/06/2011 dynaTrace software GmbH Software Compuware Corp. $231.4 8.9x NA
07/06/2011 S3 Graphics Co., Ltd. Technology Hardware HTC Corp. $300.0 NA NA
07/05/2011 Travelex Global Business Payments, Inc. Internet Western Union Co. $975.3 4.3x 13.6x
07/05/2011 AIVE SpA IT Services Cap Gemini S.A. $62.0 NA NA
07/05/2011 Aegis Lightwave, Inc. Technology Hardware II-VI, Inc. $52.0 2.0x NA
07/01/2011 Blackboard, Inc. Software Providence Equity Partners $1,767.1 3.7x 22.3x
07/01/2011 Netarx, Inc. IT Services Logicalis Group, Ltd. $34.0 0.6x NA
Average $346.4 3.4x 21.1x
Median $74.7 3.1x 20.1x
HYDE PARK CAPITAL Investment Banking | Mergers & Acquisitions | Capital Raising
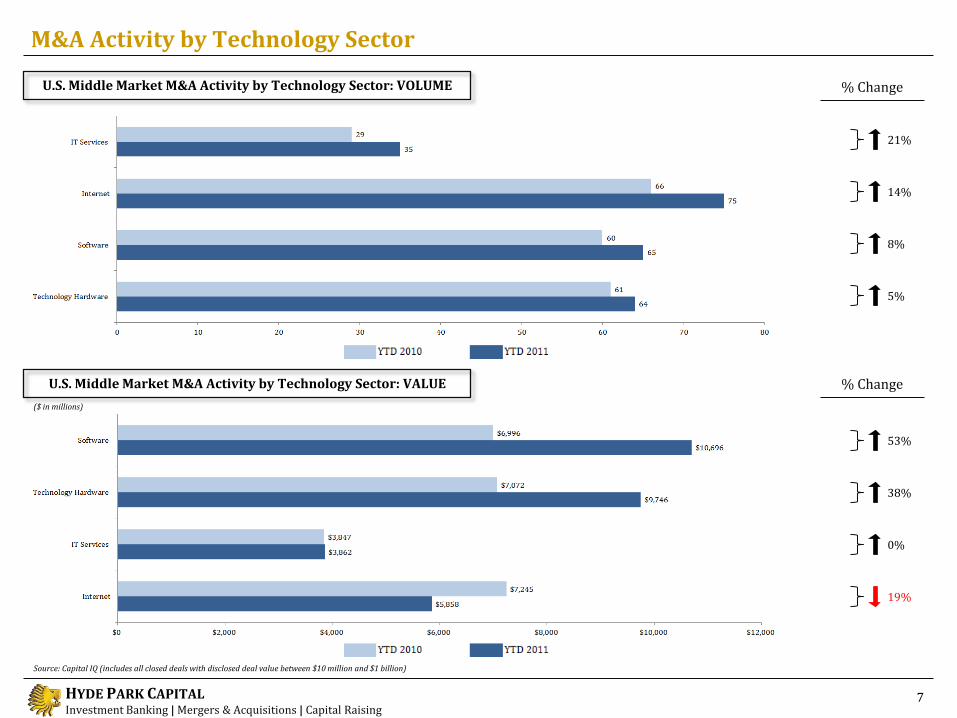
M&A Activity by Technology Sector
% Change
% Change
U.S. Middle Market M&A Activity by Technology Sector: VOLUME
7
Source: Capital IQ (includes all closed deals with disclosed deal value between $10 million and $1 billion)
($ in millions)
U.S. Middle Market M&A Activity by Technology Sector: VALUE
21%
14%
8%
5%
53%
38%
0%
19%
HYDE PARK CAPITAL Investment Banking | Mergers & Acquisitions | Capital Raising
Closed Date Target Buyer Industry Transaction Value
Pending OpenLink Financial, Inc. Hellman & Friedman Software NA
Pending ConvergEx, Inc. CVC Capital Partners Software NA
Pending Triple Point Technology, Inc. Welsh, Carson, Anderson & Stowe Software $500
09/20/11 International Asset Systems USA, Ltd. Warburg Pincus Internet NA
09/02/11 Centiv Services, LLC The Riverside Co. Internet NA
08/26/11 SMART Modular Technologies, Inc. Silver Lake Partners Technology Hardware $706
08/25/11 BServ, Inc. GTCR Internet NA
08/22/11 Gerber Scientific, Inc. Vector Capital Technology Hardware $298
08/10/11 AUTOSPLICE, Inc. J.H. Whitney & Co. Technology Hardware NA
08/08/11 Plimus, Inc. Great Hill Partners Internet $115
08/08/11 The Telx Group, Inc. ABRY Partners IT Services NA
08/05/11 Quark, Inc. Platinum Equity Software NA
08/04/11Hypercom Corp., U.S. Payment Systems
BusinessThe Gores Group Technology Hardware NA
07/07/11 Spectro, Inc. SFW Capital Partners Technology Hardware $21
Select Private Equity Transactions – Technology (Q3 2011)
Financial Sponsors vs. Strategic Buyers Recently Raised Private Equity Funds Investing in Technology
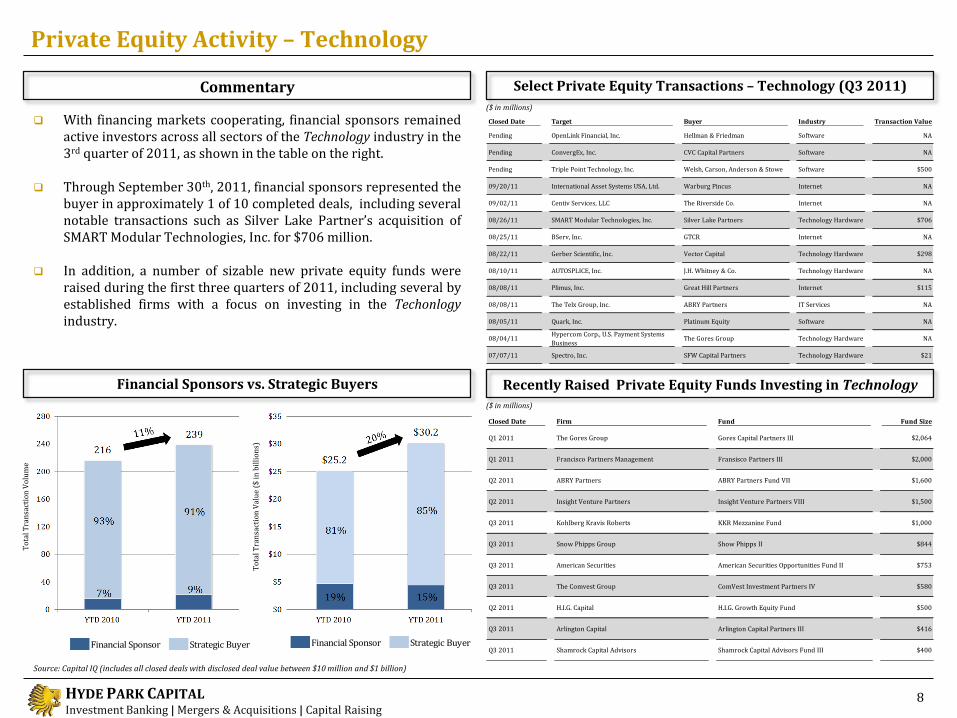
Private Equity Activity – Technology
Financial Sponsor Strategic Buyer Financial Sponsor Strategic Buyer
To
tal T
ran
sact
ion
Vo
lum
e
To
tal T
ran
sact
ion
Val
ue
($ in
bil
lio
ns)
8
($ in millions)
With financing markets cooperating, financial sponsors remained active investors across all sectors of the Technology industry in the 3rd quarter of 2011, as shown in the table on the right.
Through September 30th, 2011, financial sponsors represented the buyer in approximately 1 of 10 completed deals, including several notable transactions such as Silver Lake Partner’s acquisition of SMART Modular Technologies, Inc. for $706 million.
In addition, a number of sizable new private equity funds were raised during the first three quarters of 2011, including several by established firms with a focus on investing in the Techonlogy industry.
Commentary
Source: Capital IQ (includes all closed deals with disclosed deal value between $10 million and $1 billion)
($ in millions)
Closed Date Firm Fund Fund Size
Q1 2011 The Gores Group Gores Capital Partners III $2,064
Q1 2011 Francisco Partners Management Fransisco Partners III $2,000
Q2 2011 ABRY Partners ABRY Partners Fund VII $1,600
Q2 2011 Insight Venture Partners Insight Venture Partners VIII $1,500
Q3 2011 Kohlberg Kravis Roberts KKR Mezzanine Fund $1,000
Q3 2011 Snow Phipps Group Show Phipps II $844
Q3 2011 American Securities American Securities Opportunities Fund II $753
Q3 2011 The Comvest Group ComVest Investment Partners IV $580
Q2 2011 H.I.G. Capital H.I.G. Growth Equity Fund $500
Q3 2011 Arlington Capital Arlington Capital Partners III $416
Q3 2011 Shamrock Capital Advisors Shamrock Capital Advisors Fund III $400
HYDE PARK CAPITAL Investment Banking | Mergers & Acquisitions | Capital Raising
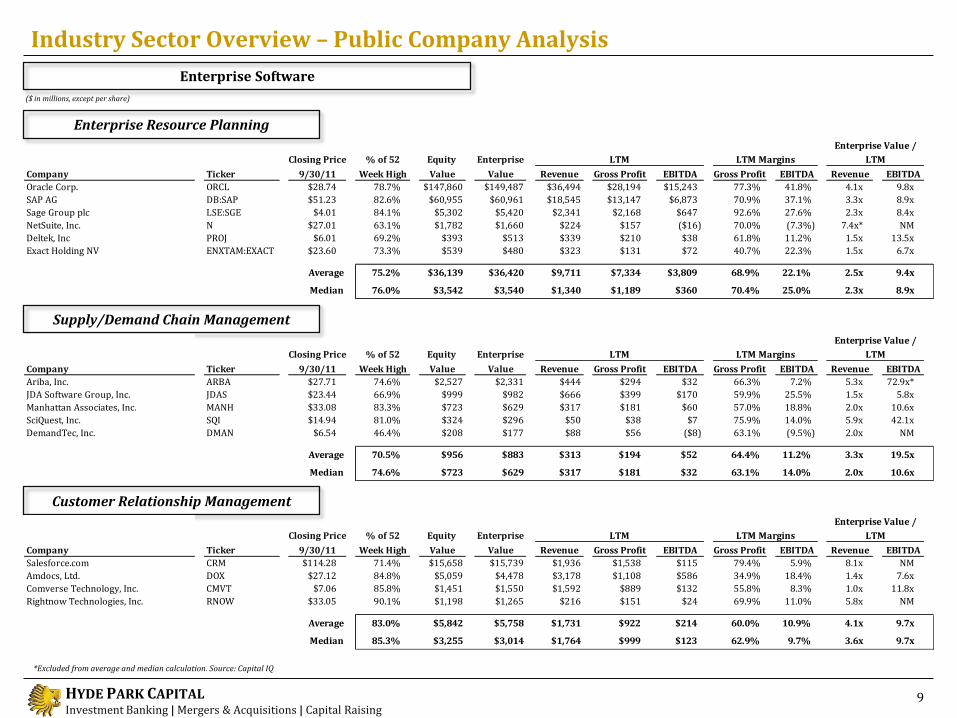
Closing Price % of 52 Equity Enterprise
Company Ticker 9/30/11 Week High Value Value Revenue Gross Profit EBITDA Gross Profit EBITDA Revenue EBITDA
Oracle Corp. ORCL $28.74 78.7% $147,860 $149,487 $36,494 $28,194 $15,243 77.3% 41.8% 4.1x 9.8x
SAP AG DB:SAP $51.23 82.6% $60,955 $60,961 $18,545 $13,147 $6,873 70.9% 37.1% 3.3x 8.9x
Sage Group plc LSE:SGE $4.01 84.1% $5,302 $5,420 $2,341 $2,168 $647 92.6% 27.6% 2.3x 8.4x
NetSuite, Inc. N $27.01 63.1% $1,782 $1,660 $224 $157 ($16) 70.0% (7.3%) 7.4x* NM
Deltek, Inc PROJ $6.01 69.2% $393 $513 $339 $210 $38 61.8% 11.2% 1.5x 13.5x
Exact Holding NV ENXTAM:EXACT $23.60 73.3% $539 $480 $323 $131 $72 40.7% 22.3% 1.5x 6.7x
Average 75.2% $36,139 $36,420 $9,711 $7,334 $3,809 68.9% 22.1% 2.5x 9.4x
Median 76.0% $3,542 $3,540 $1,340 $1,189 $360 70.4% 25.0% 2.3x 8.9x
Enterprise Value /
LTM LTM Margins LTM
Industry Sector Overview – Public Company Analysis
Enterprise Resource Planning
($ in millions, except per share)
9
*Excluded from average and median calculation. Source: Capital IQ
Supply/Demand Chain Management
Customer Relationship Management
Enterprise Software
Closing Price % of 52 Equity Enterprise
Company Ticker 9/30/11 Week High Value Value Revenue Gross Profit EBITDA Gross Profit EBITDA Revenue EBITDA
Ariba, Inc. ARBA $27.71 74.6% $2,527 $2,331 $444 $294 $32 66.3% 7.2% 5.3x 72.9x*
JDA Software Group, Inc. JDAS $23.44 66.9% $999 $982 $666 $399 $170 59.9% 25.5% 1.5x 5.8x
Manhattan Associates, Inc. MANH $33.08 83.3% $723 $629 $317 $181 $60 57.0% 18.8% 2.0x 10.6x
SciQuest, Inc. SQI $14.94 81.0% $324 $296 $50 $38 $7 75.9% 14.0% 5.9x 42.1x
DemandTec, Inc. DMAN $6.54 46.4% $208 $177 $88 $56 ($8) 63.1% (9.5%) 2.0x NM
Average 70.5% $956 $883 $313 $194 $52 64.4% 11.2% 3.3x 19.5x
Median 74.6% $723 $629 $317 $181 $32 63.1% 14.0% 2.0x 10.6x
Enterprise Value /
LTM LTM Margins LTM
Closing Price % of 52 Equity Enterprise
Company Ticker 9/30/11 Week High Value Value Revenue Gross Profit EBITDA Gross Profit EBITDA Revenue EBITDA
Salesforce.com CRM $114.28 71.4% $15,658 $15,739 $1,936 $1,538 $115 79.4% 5.9% 8.1x NM
Amdocs, Ltd. DOX $27.12 84.8% $5,059 $4,478 $3,178 $1,108 $586 34.9% 18.4% 1.4x 7.6x
Comverse Technology, Inc. CMVT $7.06 85.8% $1,451 $1,550 $1,592 $889 $132 55.8% 8.3% 1.0x 11.8x
Rightnow Technologies, Inc. RNOW $33.05 90.1% $1,198 $1,265 $216 $151 $24 69.9% 11.0% 5.8x NM
Average 83.0% $5,842 $5,758 $1,731 $922 $214 60.0% 10.9% 4.1x 9.7x
Median 85.3% $3,255 $3,014 $1,764 $999 $123 62.9% 9.7% 3.6x 9.7x
Enterprise Value /
LTM LTM Margins LTM
HYDE PARK CAPITAL Investment Banking | Mergers & Acquisitions | Capital Raising
Closing Price % of 52 Equity Enterprise
Company Ticker 9/30/11 Week High Value Value Revenue Gross Profit EBITDA Gross Profit EBITDA Revenue EBITDA
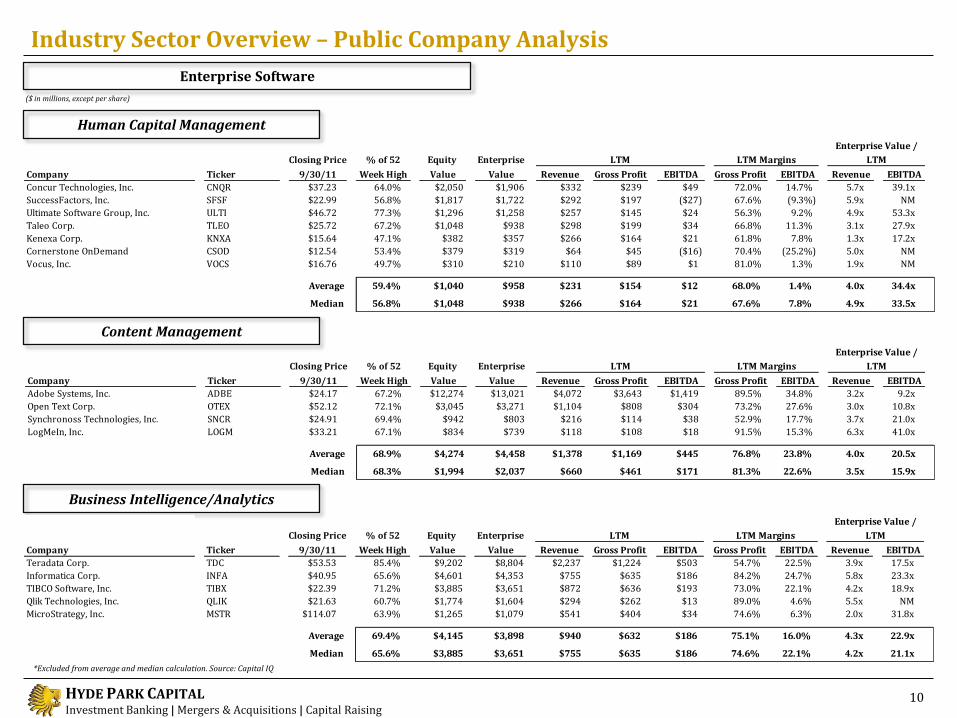
Adobe Systems, Inc. ADBE $24.17 67.2% $12,274 $13,021 $4,072 $3,643 $1,419 89.5% 34.8% 3.2x 9.2x
Open Text Corp. OTEX $52.12 72.1% $3,045 $3,271 $1,104 $808 $304 73.2% 27.6% 3.0x 10.8x
Synchronoss Technologies, Inc. SNCR $24.91 69.4% $942 $803 $216 $114 $38 52.9% 17.7% 3.7x 21.0x
LogMeIn, Inc. LOGM $33.21 67.1% $834 $739 $118 $108 $18 91.5% 15.3% 6.3x 41.0x
Average 68.9% $4,274 $4,458 $1,378 $1,169 $445 76.8% 23.8% 4.0x 20.5x
Median 68.3% $1,994 $2,037 $660 $461 $171 81.3% 22.6% 3.5x 15.9x
Enterprise Value /
LTM LTM Margins LTM
Closing Price % of 52 Equity Enterprise
Company Ticker 9/30/11 Week High Value Value Revenue Gross Profit EBITDA Gross Profit EBITDA Revenue EBITDA
Concur Technologies, Inc. CNQR $37.23 64.0% $2,050 $1,906 $332 $239 $49 72.0% 14.7% 5.7x 39.1x
SuccessFactors, Inc. SFSF $22.99 56.8% $1,817 $1,722 $292 $197 ($27) 67.6% (9.3%) 5.9x NM
Ultimate Software Group, Inc. ULTI $46.72 77.3% $1,296 $1,258 $257 $145 $24 56.3% 9.2% 4.9x 53.3x
Taleo Corp. TLEO $25.72 67.2% $1,048 $938 $298 $199 $34 66.8% 11.3% 3.1x 27.9x
Kenexa Corp. KNXA $15.64 47.1% $382 $357 $266 $164 $21 61.8% 7.8% 1.3x 17.2x
Cornerstone OnDemand CSOD $12.54 53.4% $379 $319 $64 $45 ($16) 70.4% (25.2%) 5.0x NM
Vocus, Inc. VOCS $16.76 49.7% $310 $210 $110 $89 $1 81.0% 1.3% 1.9x NM
Average 59.4% $1,040 $958 $231 $154 $12 68.0% 1.4% 4.0x 34.4x
Median 56.8% $1,048 $938 $266 $164 $21 67.6% 7.8% 4.9x 33.5x
Enterprise Value /
LTM LTM Margins LTM
Industry Sector Overview – Public Company Analysis
Human Capital Management
($ in millions, except per share)
10
*Excluded from average and median calculation. Source: Capital IQ
Content Management
Business Intelligence/Analytics
Enterprise Software
Closing Price % of 52 Equity Enterprise
Company Ticker 9/30/11 Week High Value Value Revenue Gross Profit EBITDA Gross Profit EBITDA Revenue EBITDA
Teradata Corp. TDC $53.53 85.4% $9,202 $8,804 $2,237 $1,224 $503 54.7% 22.5% 3.9x 17.5x
Informatica Corp. INFA $40.95 65.6% $4,601 $4,353 $755 $635 $186 84.2% 24.7% 5.8x 23.3x
TIBCO Software, Inc. TIBX $22.39 71.2% $3,885 $3,651 $872 $636 $193 73.0% 22.1% 4.2x 18.9x
Qlik Technologies, Inc. QLIK $21.63 60.7% $1,774 $1,604 $294 $262 $13 89.0% 4.6% 5.5x NM
MicroStrategy, Inc. MSTR $114.07 63.9% $1,265 $1,079 $541 $404 $34 74.6% 6.3% 2.0x 31.8x
Average 69.4% $4,145 $3,898 $940 $632 $186 75.1% 16.0% 4.3x 22.9x
Median 65.6% $3,885 $3,651 $755 $635 $186 74.6% 22.1% 4.2x 21.1x
Enterprise Value /
LTM LTM Margins LTM
HYDE PARK CAPITAL Investment Banking | Mergers & Acquisitions | Capital Raising
Closing Price % of 52 Equity Enterprise
Company Ticker 9/30/11 Week High Value Value Revenue Gross Profit EBITDA Gross Profit EBITDA Revenue EBITDA
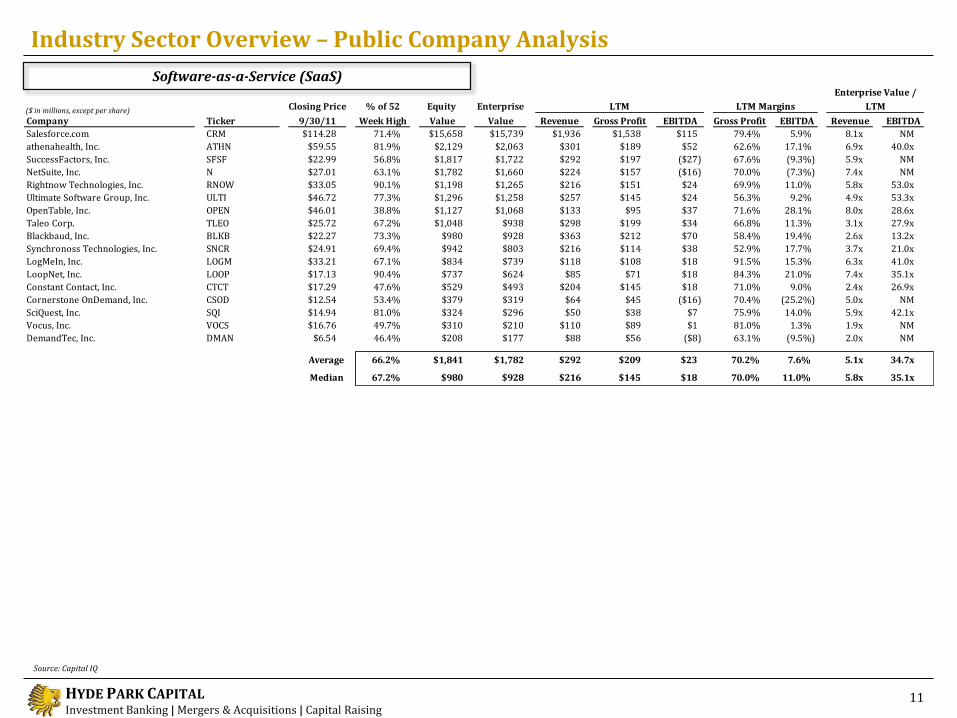
Salesforce.com CRM $114.28 71.4% $15,658 $15,739 $1,936 $1,538 $115 79.4% 5.9% 8.1x NM
athenahealth, Inc. ATHN $59.55 81.9% $2,129 $2,063 $301 $189 $52 62.6% 17.1% 6.9x 40.0x
SuccessFactors, Inc. SFSF $22.99 56.8% $1,817 $1,722 $292 $197 ($27) 67.6% (9.3%) 5.9x NM
NetSuite, Inc. N $27.01 63.1% $1,782 $1,660 $224 $157 ($16) 70.0% (7.3%) 7.4x NM
Rightnow Technologies, Inc. RNOW $33.05 90.1% $1,198 $1,265 $216 $151 $24 69.9% 11.0% 5.8x 53.0x
Ultimate Software Group, Inc. ULTI $46.72 77.3% $1,296 $1,258 $257 $145 $24 56.3% 9.2% 4.9x 53.3x
OpenTable, Inc. OPEN $46.01 38.8% $1,127 $1,068 $133 $95 $37 71.6% 28.1% 8.0x 28.6x
Taleo Corp. TLEO $25.72 67.2% $1,048 $938 $298 $199 $34 66.8% 11.3% 3.1x 27.9x
Blackbaud, Inc. BLKB $22.27 73.3% $980 $928 $363 $212 $70 58.4% 19.4% 2.6x 13.2x
Synchronoss Technologies, Inc. SNCR $24.91 69.4% $942 $803 $216 $114 $38 52.9% 17.7% 3.7x 21.0x
LogMeIn, Inc. LOGM $33.21 67.1% $834 $739 $118 $108 $18 91.5% 15.3% 6.3x 41.0x
LoopNet, Inc. LOOP $17.13 90.4% $737 $624 $85 $71 $18 84.3% 21.0% 7.4x 35.1x
Constant Contact, Inc. CTCT $17.29 47.6% $529 $493 $204 $145 $18 71.0% 9.0% 2.4x 26.9x
Cornerstone OnDemand, Inc. CSOD $12.54 53.4% $379 $319 $64 $45 ($16) 70.4% (25.2%) 5.0x NM
SciQuest, Inc. SQI $14.94 81.0% $324 $296 $50 $38 $7 75.9% 14.0% 5.9x 42.1x
Vocus, Inc. VOCS $16.76 49.7% $310 $210 $110 $89 $1 81.0% 1.3% 1.9x NM
DemandTec, Inc. DMAN $6.54 46.4% $208 $177 $88 $56 ($8) 63.1% (9.5%) 2.0x NM
Average 66.2% $1,841 $1,782 $292 $209 $23 70.2% 7.6% 5.1x 34.7x
Median 67.2% $980 $928 $216 $145 $18 70.0% 11.0% 5.8x 35.1x
Enterprise Value /
LTM LTM Margins LTM
Industry Sector Overview – Public Company Analysis
($ in millions, except per share)
11
Source: Capital IQ
Software-as-a-Service (SaaS)
HYDE PARK CAPITAL Investment Banking | Mergers & Acquisitions | Capital Raising
Closing Price % of 52 Equity Enterprise
Company Ticker 9/30/11 Week High Value Value Revenue Gross Profit EBITDA Gross Profit EBITDA Revenue EBITDA
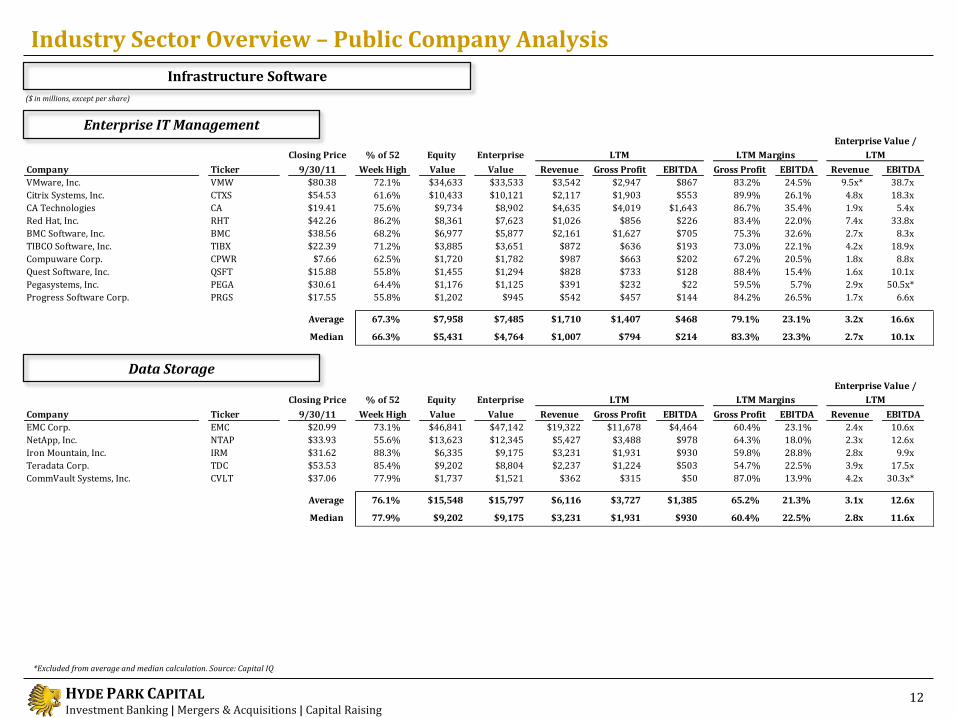
EMC Corp. EMC $20.99 73.1% $46,841 $47,142 $19,322 $11,678 $4,464 60.4% 23.1% 2.4x 10.6x
NetApp, Inc. NTAP $33.93 55.6% $13,623 $12,345 $5,427 $3,488 $978 64.3% 18.0% 2.3x 12.6x
Iron Mountain, Inc. IRM $31.62 88.3% $6,335 $9,175 $3,231 $1,931 $930 59.8% 28.8% 2.8x 9.9x
Teradata Corp. TDC $53.53 85.4% $9,202 $8,804 $2,237 $1,224 $503 54.7% 22.5% 3.9x 17.5x
CommVault Systems, Inc. CVLT $37.06 77.9% $1,737 $1,521 $362 $315 $50 87.0% 13.9% 4.2x 30.3x*
Average 76.1% $15,548 $15,797 $6,116 $3,727 $1,385 65.2% 21.3% 3.1x 12.6x
Median 77.9% $9,202 $9,175 $3,231 $1,931 $930 60.4% 22.5% 2.8x 11.6x
Enterprise Value /
LTM LTM Margins LTM
Closing Price % of 52 Equity Enterprise
Company Ticker 9/30/11 Week High Value Value Revenue Gross Profit EBITDA Gross Profit EBITDA Revenue EBITDA
VMware, Inc. VMW $80.38 72.1% $34,633 $33,533 $3,542 $2,947 $867 83.2% 24.5% 9.5x* 38.7x
Citrix Systems, Inc. CTXS $54.53 61.6% $10,433 $10,121 $2,117 $1,903 $553 89.9% 26.1% 4.8x 18.3x
CA Technologies CA $19.41 75.6% $9,734 $8,902 $4,635 $4,019 $1,643 86.7% 35.4% 1.9x 5.4x
Red Hat, Inc. RHT $42.26 86.2% $8,361 $7,623 $1,026 $856 $226 83.4% 22.0% 7.4x 33.8x
BMC Software, Inc. BMC $38.56 68.2% $6,977 $5,877 $2,161 $1,627 $705 75.3% 32.6% 2.7x 8.3x
TIBCO Software, Inc. TIBX $22.39 71.2% $3,885 $3,651 $872 $636 $193 73.0% 22.1% 4.2x 18.9x
Compuware Corp. CPWR $7.66 62.5% $1,720 $1,782 $987 $663 $202 67.2% 20.5% 1.8x 8.8x
Quest Software, Inc. QSFT $15.88 55.8% $1,455 $1,294 $828 $733 $128 88.4% 15.4% 1.6x 10.1x
Pegasystems, Inc. PEGA $30.61 64.4% $1,176 $1,125 $391 $232 $22 59.5% 5.7% 2.9x 50.5x*
Progress Software Corp. PRGS $17.55 55.8% $1,202 $945 $542 $457 $144 84.2% 26.5% 1.7x 6.6x
Average 67.3% $7,958 $7,485 $1,710 $1,407 $468 79.1% 23.1% 3.2x 16.6x
Median 66.3% $5,431 $4,764 $1,007 $794 $214 83.3% 23.3% 2.7x 10.1x
Enterprise Value /
LTM LTM Margins LTM
Industry Sector Overview – Public Company Analysis
Enterprise IT Management
($ in millions, except per share)
12
*Excluded from average and median calculation. Source: Capital IQ
Data Storage
Infrastructure Software
HYDE PARK CAPITAL Investment Banking | Mergers & Acquisitions | Capital Raising
Closing Price % of 52 Equity Enterprise
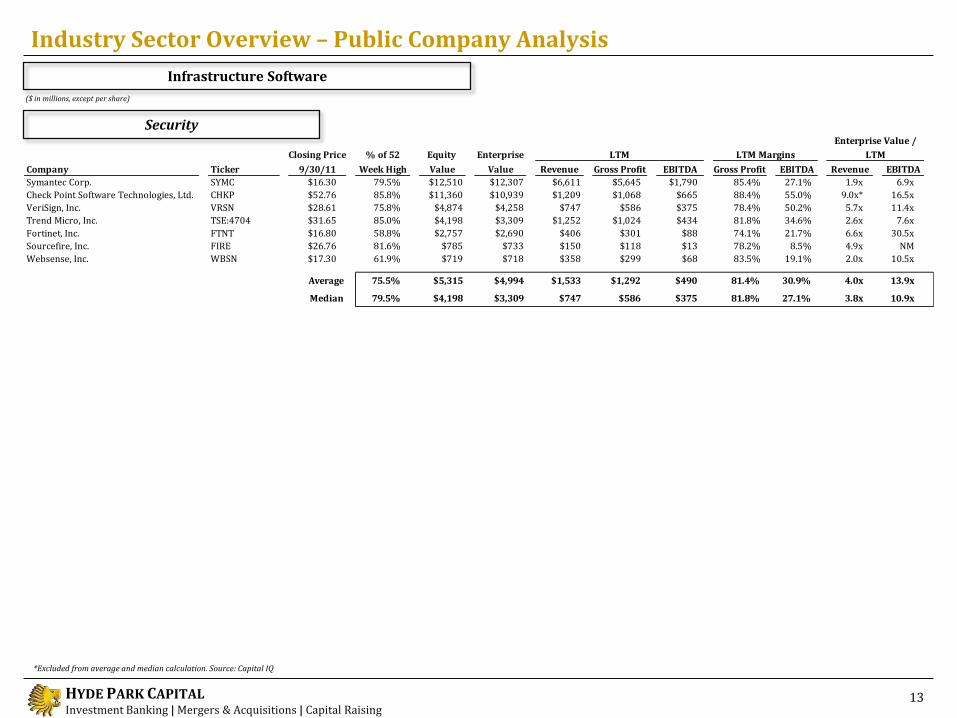
Company Ticker 9/30/11 Week High Value Value Revenue Gross Profit EBITDA Gross Profit EBITDA Revenue EBITDA
Symantec Corp. SYMC $16.30 79.5% $12,510 $12,307 $6,611 $5,645 $1,790 85.4% 27.1% 1.9x 6.9x
Check Point Software Technologies, Ltd. CHKP $52.76 85.8% $11,360 $10,939 $1,209 $1,068 $665 88.4% 55.0% 9.0x* 16.5x
VeriSign, Inc. VRSN $28.61 75.8% $4,874 $4,258 $747 $586 $375 78.4% 50.2% 5.7x 11.4x
Trend Micro, Inc. TSE:4704 $31.65 85.0% $4,198 $3,309 $1,252 $1,024 $434 81.8% 34.6% 2.6x 7.6x
Fortinet, Inc. FTNT $16.80 58.8% $2,757 $2,690 $406 $301 $88 74.1% 21.7% 6.6x 30.5x
Sourcefire, Inc. FIRE $26.76 81.6% $785 $733 $150 $118 $13 78.2% 8.5% 4.9x NM
Websense, Inc. WBSN $17.30 61.9% $719 $718 $358 $299 $68 83.5% 19.1% 2.0x 10.5x
Average 75.5% $5,315 $4,994 $1,533 $1,292 $490 81.4% 30.9% 4.0x 13.9x
Median 79.5% $4,198 $3,309 $747 $586 $375 81.8% 27.1% 3.8x 10.9x
Enterprise Value /
LTM LTM Margins LTM
Industry Sector Overview – Public Company Analysis
Security
($ in millions, except per share)
13
*Excluded from average and median calculation. Source: Capital IQ
Infrastructure Software
HYDE PARK CAPITAL Investment Banking | Mergers & Acquisitions | Capital Raising
Closing Price % of 52 Equity Enterprise
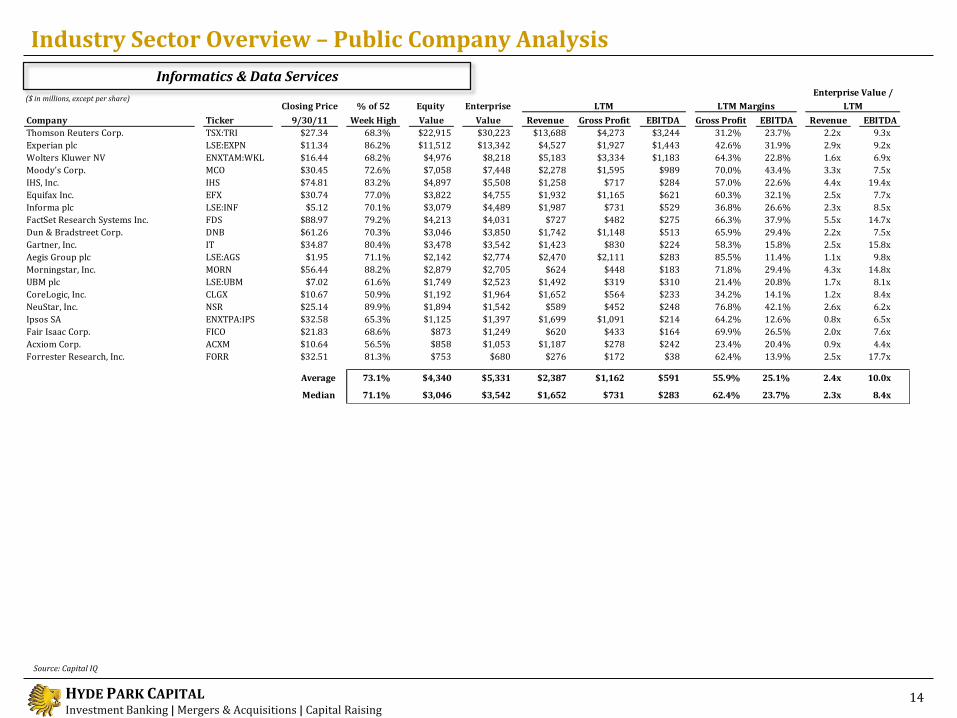
Company Ticker 9/30/11 Week High Value Value Revenue Gross Profit EBITDA Gross Profit EBITDA Revenue EBITDA
Thomson Reuters Corp. TSX:TRI $27.34 68.3% $22,915 $30,223 $13,688 $4,273 $3,244 31.2% 23.7% 2.2x 9.3x
Experian plc LSE:EXPN $11.34 86.2% $11,512 $13,342 $4,527 $1,927 $1,443 42.6% 31.9% 2.9x 9.2x
Wolters Kluwer NV ENXTAM:WKL $16.44 68.2% $4,976 $8,218 $5,183 $3,334 $1,183 64.3% 22.8% 1.6x 6.9x
Moody's Corp. MCO $30.45 72.6% $7,058 $7,448 $2,278 $1,595 $989 70.0% 43.4% 3.3x 7.5x
IHS, Inc. IHS $74.81 83.2% $4,897 $5,508 $1,258 $717 $284 57.0% 22.6% 4.4x 19.4x
Equifax Inc. EFX $30.74 77.0% $3,822 $4,755 $1,932 $1,165 $621 60.3% 32.1% 2.5x 7.7x
Informa plc LSE:INF $5.12 70.1% $3,079 $4,489 $1,987 $731 $529 36.8% 26.6% 2.3x 8.5x
FactSet Research Systems Inc. FDS $88.97 79.2% $4,213 $4,031 $727 $482 $275 66.3% 37.9% 5.5x 14.7x
Dun & Bradstreet Corp. DNB $61.26 70.3% $3,046 $3,850 $1,742 $1,148 $513 65.9% 29.4% 2.2x 7.5x
Gartner, Inc. IT $34.87 80.4% $3,478 $3,542 $1,423 $830 $224 58.3% 15.8% 2.5x 15.8x
Aegis Group plc LSE:AGS $1.95 71.1% $2,142 $2,774 $2,470 $2,111 $283 85.5% 11.4% 1.1x 9.8x
Morningstar, Inc. MORN $56.44 88.2% $2,879 $2,705 $624 $448 $183 71.8% 29.4% 4.3x 14.8x
UBM plc LSE:UBM $7.02 61.6% $1,749 $2,523 $1,492 $319 $310 21.4% 20.8% 1.7x 8.1x
CoreLogic, Inc. CLGX $10.67 50.9% $1,192 $1,964 $1,652 $564 $233 34.2% 14.1% 1.2x 8.4x
NeuStar, Inc. NSR $25.14 89.9% $1,894 $1,542 $589 $452 $248 76.8% 42.1% 2.6x 6.2x
Ipsos SA ENXTPA:IPS $32.58 65.3% $1,125 $1,397 $1,699 $1,091 $214 64.2% 12.6% 0.8x 6.5x
Fair Isaac Corp. FICO $21.83 68.6% $873 $1,249 $620 $433 $164 69.9% 26.5% 2.0x 7.6x
Acxiom Corp. ACXM $10.64 56.5% $858 $1,053 $1,187 $278 $242 23.4% 20.4% 0.9x 4.4x
Forrester Research, Inc. FORR $32.51 81.3% $753 $680 $276 $172 $38 62.4% 13.9% 2.5x 17.7x
Average 73.1% $4,340 $5,331 $2,387 $1,162 $591 55.9% 25.1% 2.4x 10.0x
Median 71.1% $3,046 $3,542 $1,652 $731 $283 62.4% 23.7% 2.3x 8.4x
Enterprise Value /
LTM LTM Margins LTM
Industry Sector Overview – Public Company Analysis
14
Source: Capital IQ
Informatics & Data Services
($ in millions, except per share)
HYDE PARK CAPITAL Investment Banking | Mergers & Acquisitions | Capital Raising
Closing Price % of 52 Equity Enterprise
Company Ticker 9/30/11 Week High Value Value Revenue Gross Profit EBITDA Gross Profit EBITDA Revenue EBITDA
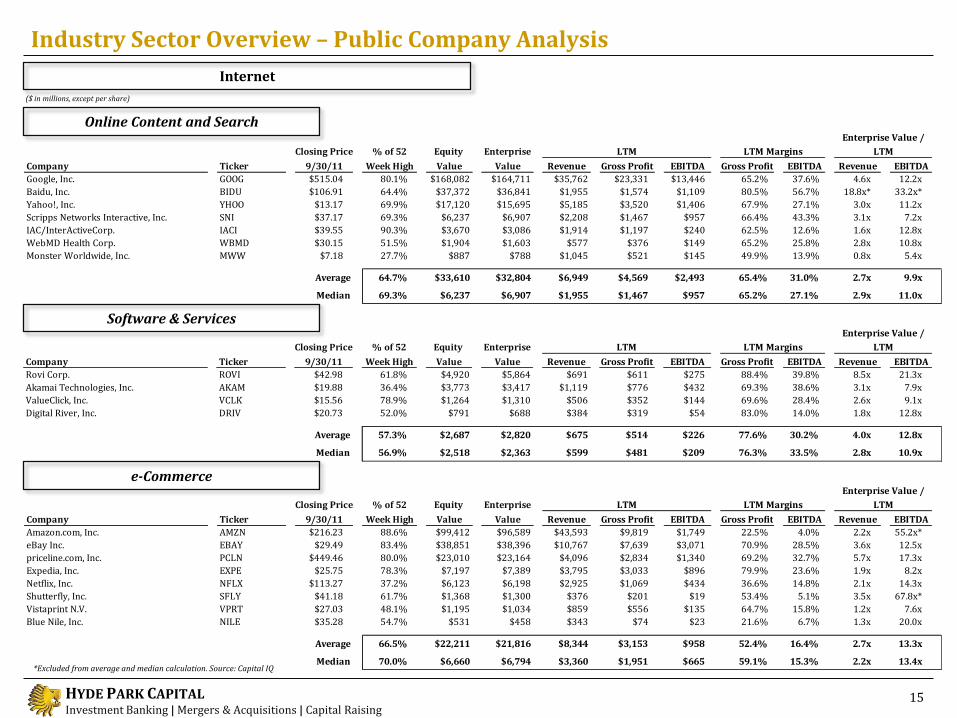
Amazon.com, Inc. AMZN $216.23 88.6% $99,412 $96,589 $43,593 $9,819 $1,749 22.5% 4.0% 2.2x 55.2x*
eBay Inc. EBAY $29.49 83.4% $38,851 $38,396 $10,767 $7,639 $3,071 70.9% 28.5% 3.6x 12.5x
priceline.com, Inc. PCLN $449.46 80.0% $23,010 $23,164 $4,096 $2,834 $1,340 69.2% 32.7% 5.7x 17.3x
Expedia, Inc. EXPE $25.75 78.3% $7,197 $7,389 $3,795 $3,033 $896 79.9% 23.6% 1.9x 8.2x
Netflix, Inc. NFLX $113.27 37.2% $6,123 $6,198 $2,925 $1,069 $434 36.6% 14.8% 2.1x 14.3x
Shutterfly, Inc. SFLY $41.18 61.7% $1,368 $1,300 $376 $201 $19 53.4% 5.1% 3.5x 67.8x*
Vistaprint N.V. VPRT $27.03 48.1% $1,195 $1,034 $859 $556 $135 64.7% 15.8% 1.2x 7.6x
Blue Nile, Inc. NILE $35.28 54.7% $531 $458 $343 $74 $23 21.6% 6.7% 1.3x 20.0x
Average 66.5% $22,211 $21,816 $8,344 $3,153 $958 52.4% 16.4% 2.7x 13.3x
Median 70.0% $6,660 $6,794 $3,360 $1,951 $665 59.1% 15.3% 2.2x 13.4x
Enterprise Value /
LTM LTM Margins LTM
Closing Price % of 52 Equity Enterprise
Company Ticker 9/30/11 Week High Value Value Revenue Gross Profit EBITDA Gross Profit EBITDA Revenue EBITDA
Google, Inc. GOOG $515.04 80.1% $168,082 $164,711 $35,762 $23,331 $13,446 65.2% 37.6% 4.6x 12.2x
Baidu, Inc. BIDU $106.91 64.4% $37,372 $36,841 $1,955 $1,574 $1,109 80.5% 56.7% 18.8x* 33.2x*
Yahoo!, Inc. YHOO $13.17 69.9% $17,120 $15,695 $5,185 $3,520 $1,406 67.9% 27.1% 3.0x 11.2x
Scripps Networks Interactive, Inc. SNI $37.17 69.3% $6,237 $6,907 $2,208 $1,467 $957 66.4% 43.3% 3.1x 7.2x
IAC/InterActiveCorp. IACI $39.55 90.3% $3,670 $3,086 $1,914 $1,197 $240 62.5% 12.6% 1.6x 12.8x
WebMD Health Corp. WBMD $30.15 51.5% $1,904 $1,603 $577 $376 $149 65.2% 25.8% 2.8x 10.8x
Monster Worldwide, Inc. MWW $7.18 27.7% $887 $788 $1,045 $521 $145 49.9% 13.9% 0.8x 5.4x
Average 64.7% $33,610 $32,804 $6,949 $4,569 $2,493 65.4% 31.0% 2.7x 9.9x
Median 69.3% $6,237 $6,907 $1,955 $1,467 $957 65.2% 27.1% 2.9x 11.0x
Enterprise Value /
LTM LTM Margins LTM
Closing Price % of 52 Equity Enterprise
Company Ticker 9/30/11 Week High Value Value Revenue Gross Profit EBITDA Gross Profit EBITDA Revenue EBITDA
Rovi Corp. ROVI $42.98 61.8% $4,920 $5,864 $691 $611 $275 88.4% 39.8% 8.5x 21.3x
Akamai Technologies, Inc. AKAM $19.88 36.4% $3,773 $3,417 $1,119 $776 $432 69.3% 38.6% 3.1x 7.9x
ValueClick, Inc. VCLK $15.56 78.9% $1,264 $1,310 $506 $352 $144 69.6% 28.4% 2.6x 9.1x
Digital River, Inc. DRIV $20.73 52.0% $791 $688 $384 $319 $54 83.0% 14.0% 1.8x 12.8x
Average 57.3% $2,687 $2,820 $675 $514 $226 77.6% 30.2% 4.0x 12.8x
Median 56.9% $2,518 $2,363 $599 $481 $209 76.3% 33.5% 2.8x 10.9x
Enterprise Value /
LTM LTM Margins LTM
Industry Sector Overview – Public Company Analysis
Online Content and Search
($ in millions, except per share)
15
*Excluded from average and median calculation. Source: Capital IQ
Software & Services
e-Commerce
Internet
HYDE PARK CAPITAL Investment Banking | Mergers & Acquisitions | Capital Raising
Closing Price % of 52 Equity Enterprise
Company Ticker 9/30/11 Week High Value Value Revenue Gross Profit EBITDA Gross Profit EBITDA Revenue EBITDA
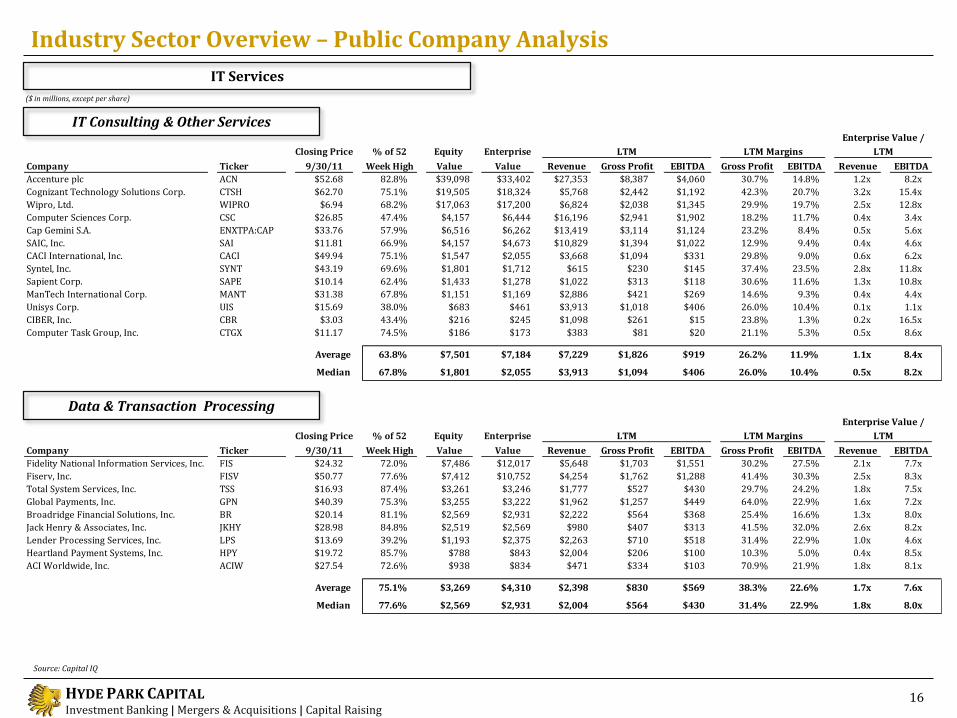
Accenture plc ACN $52.68 82.8% $39,098 $33,402 $27,353 $8,387 $4,060 30.7% 14.8% 1.2x 8.2x
Cognizant Technology Solutions Corp. CTSH $62.70 75.1% $19,505 $18,324 $5,768 $2,442 $1,192 42.3% 20.7% 3.2x 15.4x
Wipro, Ltd. WIPRO $6.94 68.2% $17,063 $17,200 $6,824 $2,038 $1,345 29.9% 19.7% 2.5x 12.8x
Computer Sciences Corp. CSC $26.85 47.4% $4,157 $6,444 $16,196 $2,941 $1,902 18.2% 11.7% 0.4x 3.4x
Cap Gemini S.A. ENXTPA:CAP $33.76 57.9% $6,516 $6,262 $13,419 $3,114 $1,124 23.2% 8.4% 0.5x 5.6x
SAIC, Inc. SAI $11.81 66.9% $4,157 $4,673 $10,829 $1,394 $1,022 12.9% 9.4% 0.4x 4.6x
CACI International, Inc. CACI $49.94 75.1% $1,547 $2,055 $3,668 $1,094 $331 29.8% 9.0% 0.6x 6.2x
Syntel, Inc. SYNT $43.19 69.6% $1,801 $1,712 $615 $230 $145 37.4% 23.5% 2.8x 11.8x
Sapient Corp. SAPE $10.14 62.4% $1,433 $1,278 $1,022 $313 $118 30.6% 11.6% 1.3x 10.8x
ManTech International Corp. MANT $31.38 67.8% $1,151 $1,169 $2,886 $421 $269 14.6% 9.3% 0.4x 4.4x
Unisys Corp. UIS $15.69 38.0% $683 $461 $3,913 $1,018 $406 26.0% 10.4% 0.1x 1.1x
CIBER, Inc. CBR $3.03 43.4% $216 $245 $1,098 $261 $15 23.8% 1.3% 0.2x 16.5x
Computer Task Group, Inc. CTGX $11.17 74.5% $186 $173 $383 $81 $20 21.1% 5.3% 0.5x 8.6x
Average 63.8% $7,501 $7,184 $7,229 $1,826 $919 26.2% 11.9% 1.1x 8.4x
Median 67.8% $1,801 $2,055 $3,913 $1,094 $406 26.0% 10.4% 0.5x 8.2x
Enterprise Value /
LTM LTM Margins LTM
Closing Price % of 52 Equity Enterprise
Company Ticker 9/30/11 Week High Value Value Revenue Gross Profit EBITDA Gross Profit EBITDA Revenue EBITDA
Fidelity National Information Services, Inc. FIS $24.32 72.0% $7,486 $12,017 $5,648 $1,703 $1,551 30.2% 27.5% 2.1x 7.7x
Fiserv, Inc. FISV $50.77 77.6% $7,412 $10,752 $4,254 $1,762 $1,288 41.4% 30.3% 2.5x 8.3x
Total System Services, Inc. TSS $16.93 87.4% $3,261 $3,246 $1,777 $527 $430 29.7% 24.2% 1.8x 7.5x
Global Payments, Inc. GPN $40.39 75.3% $3,255 $3,222 $1,962 $1,257 $449 64.0% 22.9% 1.6x 7.2x
Broadridge Financial Solutions, Inc. BR $20.14 81.1% $2,569 $2,931 $2,222 $564 $368 25.4% 16.6% 1.3x 8.0x
Jack Henry & Associates, Inc. JKHY $28.98 84.8% $2,519 $2,569 $980 $407 $313 41.5% 32.0% 2.6x 8.2x
Lender Processing Services, Inc. LPS $13.69 39.2% $1,193 $2,375 $2,263 $710 $518 31.4% 22.9% 1.0x 4.6x
Heartland Payment Systems, Inc. HPY $19.72 85.7% $788 $843 $2,004 $206 $100 10.3% 5.0% 0.4x 8.5x
ACI Worldwide, Inc. ACIW $27.54 72.6% $938 $834 $471 $334 $103 70.9% 21.9% 1.8x 8.1x
Average 75.1% $3,269 $4,310 $2,398 $830 $569 38.3% 22.6% 1.7x 7.6x
Median 77.6% $2,569 $2,931 $2,004 $564 $430 31.4% 22.9% 1.8x 8.0x
Enterprise Value /
LTM LTM Margins LTM
Industry Sector Overview – Public Company Analysis
IT Consulting & Other Services
($ in millions, except per share)
16
Source: Capital IQ
Data & Transaction Processing
IT Services
HYDE PARK CAPITAL Investment Banking | Mergers & Acquisitions | Capital Raising
Closing Price % of 52 Equity Enterprise
Company Ticker 9/30/11 Week High Value Value Revenue Gross Profit EBITDA Gross Profit EBITDA Revenue EBITDA
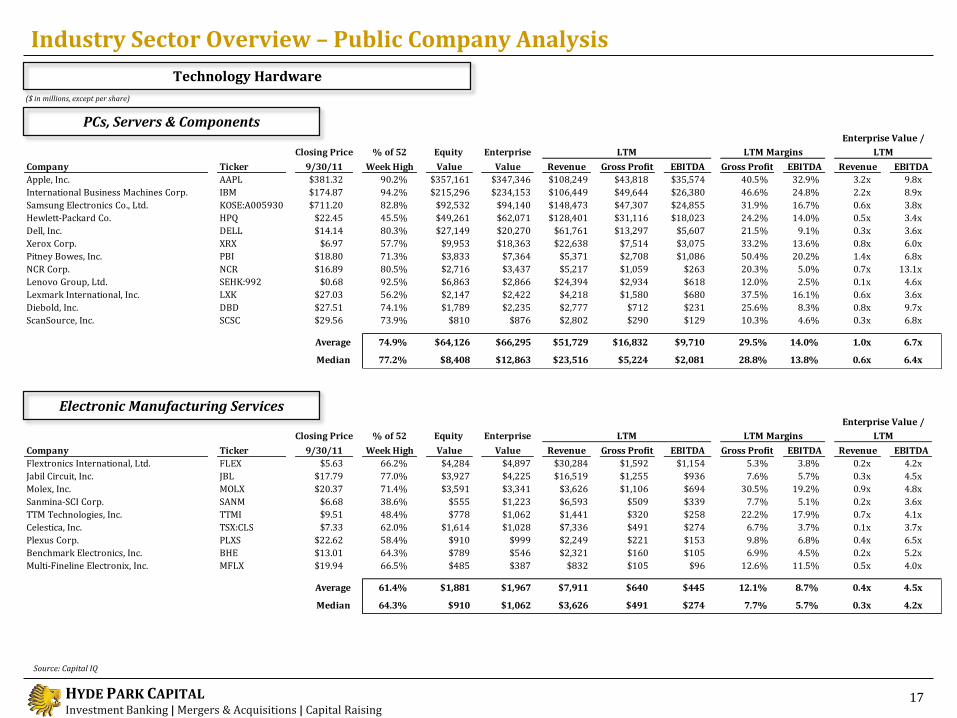
Flextronics International, Ltd. FLEX $5.63 66.2% $4,284 $4,897 $30,284 $1,592 $1,154 5.3% 3.8% 0.2x 4.2x
Jabil Circuit, Inc. JBL $17.79 77.0% $3,927 $4,225 $16,519 $1,255 $936 7.6% 5.7% 0.3x 4.5x
Molex, Inc. MOLX $20.37 71.4% $3,591 $3,341 $3,626 $1,106 $694 30.5% 19.2% 0.9x 4.8x
Sanmina-SCI Corp. SANM $6.68 38.6% $555 $1,223 $6,593 $509 $339 7.7% 5.1% 0.2x 3.6x
TTM Technologies, Inc. TTMI $9.51 48.4% $778 $1,062 $1,441 $320 $258 22.2% 17.9% 0.7x 4.1x
Celestica, Inc. TSX:CLS $7.33 62.0% $1,614 $1,028 $7,336 $491 $274 6.7% 3.7% 0.1x 3.7x
Plexus Corp. PLXS $22.62 58.4% $910 $999 $2,249 $221 $153 9.8% 6.8% 0.4x 6.5x
Benchmark Electronics, Inc. BHE $13.01 64.3% $789 $546 $2,321 $160 $105 6.9% 4.5% 0.2x 5.2x
Multi-Fineline Electronix, Inc. MFLX $19.94 66.5% $485 $387 $832 $105 $96 12.6% 11.5% 0.5x 4.0x
Average 61.4% $1,881 $1,967 $7,911 $640 $445 12.1% 8.7% 0.4x 4.5x
Median 64.3% $910 $1,062 $3,626 $491 $274 7.7% 5.7% 0.3x 4.2x
Enterprise Value /
LTM LTM Margins LTM
Closing Price % of 52 Equity Enterprise
Company Ticker 9/30/11 Week High Value Value Revenue Gross Profit EBITDA Gross Profit EBITDA Revenue EBITDA
Apple, Inc. AAPL $381.32 90.2% $357,161 $347,346 $108,249 $43,818 $35,574 40.5% 32.9% 3.2x 9.8x
International Business Machines Corp. IBM $174.87 94.2% $215,296 $234,153 $106,449 $49,644 $26,380 46.6% 24.8% 2.2x 8.9x
Samsung Electronics Co., Ltd. KOSE:A005930 $711.20 82.8% $92,532 $94,140 $148,473 $47,307 $24,855 31.9% 16.7% 0.6x 3.8x
Hewlett-Packard Co. HPQ $22.45 45.5% $49,261 $62,071 $128,401 $31,116 $18,023 24.2% 14.0% 0.5x 3.4x
Dell, Inc. DELL $14.14 80.3% $27,149 $20,270 $61,761 $13,297 $5,607 21.5% 9.1% 0.3x 3.6x
Xerox Corp. XRX $6.97 57.7% $9,953 $18,363 $22,638 $7,514 $3,075 33.2% 13.6% 0.8x 6.0x
Pitney Bowes, Inc. PBI $18.80 71.3% $3,833 $7,364 $5,371 $2,708 $1,086 50.4% 20.2% 1.4x 6.8x
NCR Corp. NCR $16.89 80.5% $2,716 $3,437 $5,217 $1,059 $263 20.3% 5.0% 0.7x 13.1x
Lenovo Group, Ltd. SEHK:992 $0.68 92.5% $6,863 $2,866 $24,394 $2,934 $618 12.0% 2.5% 0.1x 4.6x
Lexmark International, Inc. LXK $27.03 56.2% $2,147 $2,422 $4,218 $1,580 $680 37.5% 16.1% 0.6x 3.6x
Diebold, Inc. DBD $27.51 74.1% $1,789 $2,235 $2,777 $712 $231 25.6% 8.3% 0.8x 9.7x
ScanSource, Inc. SCSC $29.56 73.9% $810 $876 $2,802 $290 $129 10.3% 4.6% 0.3x 6.8x
Average 74.9% $64,126 $66,295 $51,729 $16,832 $9,710 29.5% 14.0% 1.0x 6.7x
Median 77.2% $8,408 $12,863 $23,516 $5,224 $2,081 28.8% 13.8% 0.6x 6.4x
Enterprise Value /
LTM LTM Margins LTM
Industry Sector Overview – Public Company Analysis
PCs, Servers & Components
($ in millions, except per share)
17
Source: Capital IQ
Electronic Manufacturing Services
Technology Hardware
HYDE PARK CAPITAL Investment Banking | Mergers & Acquisitions | Capital Raising
Closing Price % of 52 Equity Enterprise
Company Ticker 9/30/11 Week High Value Value Revenue Gross Profit EBITDA Gross Profit EBITDA Revenue EBITDA
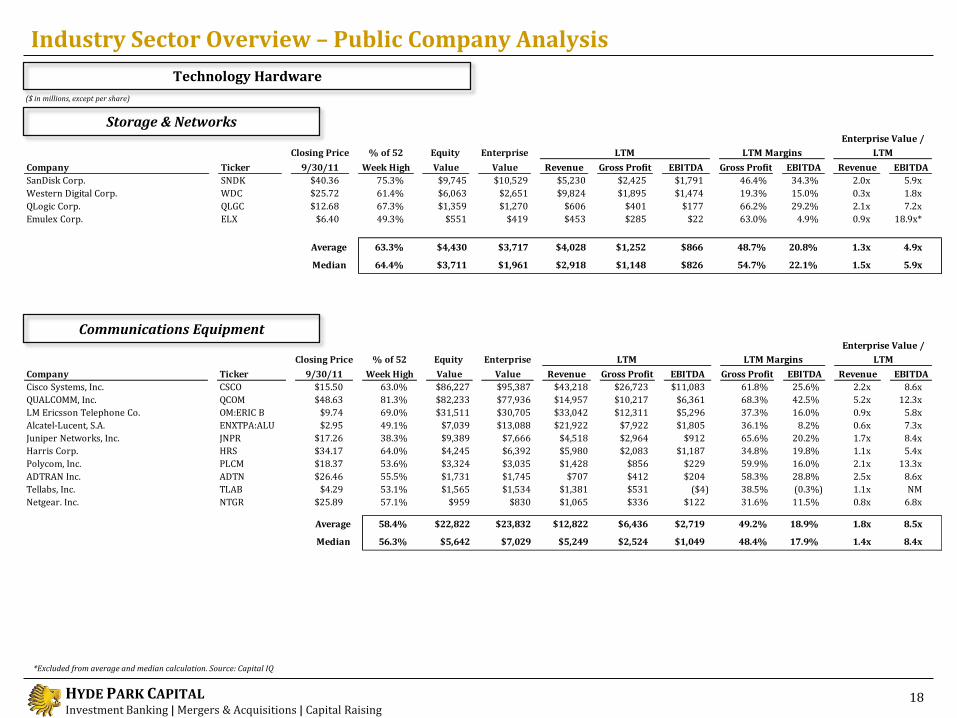
SanDisk Corp. SNDK $40.36 75.3% $9,745 $10,529 $5,230 $2,425 $1,791 46.4% 34.3% 2.0x 5.9x
Western Digital Corp. WDC $25.72 61.4% $6,063 $2,651 $9,824 $1,895 $1,474 19.3% 15.0% 0.3x 1.8x
QLogic Corp. QLGC $12.68 67.3% $1,359 $1,270 $606 $401 $177 66.2% 29.2% 2.1x 7.2x
Emulex Corp. ELX $6.40 49.3% $551 $419 $453 $285 $22 63.0% 4.9% 0.9x 18.9x*
Average 63.3% $4,430 $3,717 $4,028 $1,252 $866 48.7% 20.8% 1.3x 4.9x
Median 64.4% $3,711 $1,961 $2,918 $1,148 $826 54.7% 22.1% 1.5x 5.9x
Enterprise Value /
LTM LTM Margins LTM
Closing Price % of 52 Equity Enterprise
Company Ticker 9/30/11 Week High Value Value Revenue Gross Profit EBITDA Gross Profit EBITDA Revenue EBITDA
Cisco Systems, Inc. CSCO $15.50 63.0% $86,227 $95,387 $43,218 $26,723 $11,083 61.8% 25.6% 2.2x 8.6x
QUALCOMM, Inc. QCOM $48.63 81.3% $82,233 $77,936 $14,957 $10,217 $6,361 68.3% 42.5% 5.2x 12.3x
LM Ericsson Telephone Co. OM:ERIC B $9.74 69.0% $31,511 $30,705 $33,042 $12,311 $5,296 37.3% 16.0% 0.9x 5.8x
Alcatel-Lucent, S.A. ENXTPA:ALU $2.95 49.1% $7,039 $13,088 $21,922 $7,922 $1,805 36.1% 8.2% 0.6x 7.3x
Juniper Networks, Inc. JNPR $17.26 38.3% $9,389 $7,666 $4,518 $2,964 $912 65.6% 20.2% 1.7x 8.4x
Harris Corp. HRS $34.17 64.0% $4,245 $6,392 $5,980 $2,083 $1,187 34.8% 19.8% 1.1x 5.4x
Polycom, Inc. PLCM $18.37 53.6% $3,324 $3,035 $1,428 $856 $229 59.9% 16.0% 2.1x 13.3x
ADTRAN Inc. ADTN $26.46 55.5% $1,731 $1,745 $707 $412 $204 58.3% 28.8% 2.5x 8.6x
Tellabs, Inc. TLAB $4.29 53.1% $1,565 $1,534 $1,381 $531 ($4) 38.5% (0.3%) 1.1x NM
Netgear. Inc. NTGR $25.89 57.1% $959 $830 $1,065 $336 $122 31.6% 11.5% 0.8x 6.8x
Average 58.4% $22,822 $23,832 $12,822 $6,436 $2,719 49.2% 18.9% 1.8x 8.5x
Median 56.3% $5,642 $7,029 $5,249 $2,524 $1,049 48.4% 17.9% 1.4x 8.4x
Enterprise Value /
LTM LTM Margins LTM
Industry Sector Overview – Public Company Analysis
Storage & Networks
($ in millions, except per share)
18
*Excluded from average and median calculation. Source: Capital IQ
Communications Equipment
Technology Hardware
HYDE PARK CAPITAL Investment Banking | Mergers & Acquisitions | Capital Raising
80%
90%
100%
110%
120%
130%
140%
Sep-10 Dec-10 Mar-11 Jun-11 Sep-11
S&P 500 Enterprise Software
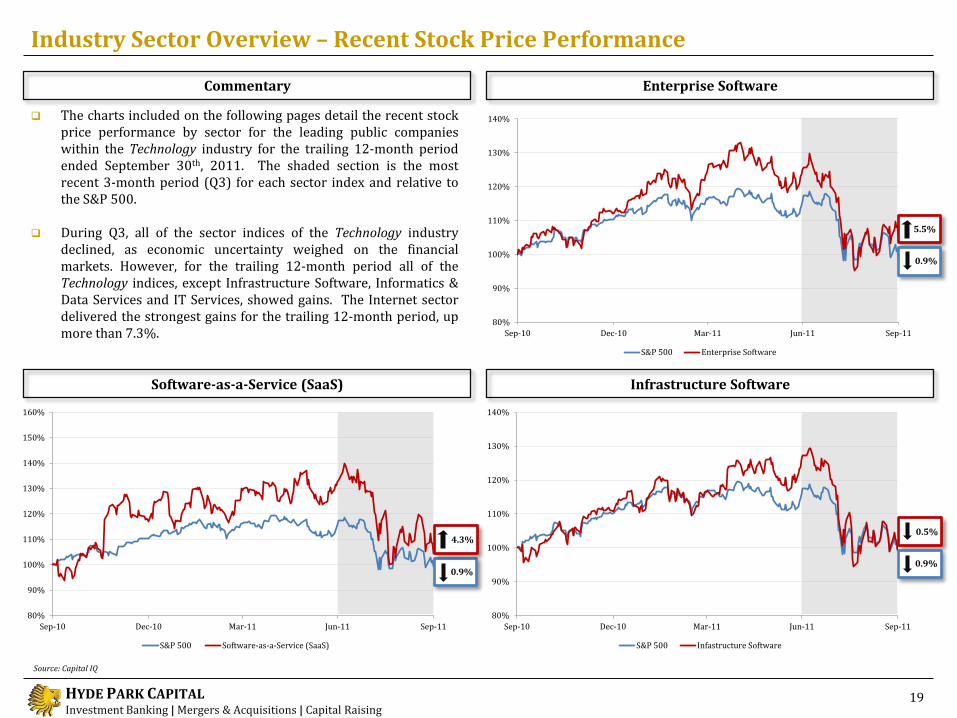
Industry Sector Overview – Recent Stock Price Performance
Software-as-a-Service (SaaS)
Commentary
19
Enterprise Software
Infrastructure Software
Source: Capital IQ
The charts included on the following pages detail the recent stock price performance by sector for the leading public companies within the Technology industry for the trailing 12-month period ended September 30th, 2011. The shaded section is the most recent 3-month period (Q3) for each sector index and relative to the S&P 500.
During Q3, all of the sector indices of the Technology industry declined, as economic uncertainty weighed on the financial markets. However, for the trailing 12-month period all of the Technology indices, except Infrastructure Software, Informatics & Data Services and IT Services, showed gains. The Internet sector delivered the strongest gains for the trailing 12-month period, up more than 7.3%.
5.5%
0.9%
0.9%
4.3% 0.5%
0.9%
80%
90%
100%
110%
120%
130%
140%
Sep-10 Dec-10 Mar-11 Jun-11 Sep-11
S&P 500 Infastructure Software
80%
90%
100%
110%
120%
130%
140%
150%
160%
Sep-10 Dec-10 Mar-11 Jun-11 Sep-11
S&P 500 Software-as-a-Service (SaaS)
HYDE PARK CAPITAL Investment Banking | Mergers & Acquisitions | Capital Raising
80%
90%
100%
110%
120%
130%
140%
Sep-10 Dec-10 Mar-11 Jun-11 Sep-11
S&P 500 Tehnology Hardware
80%
90%
100%
110%
120%
130%
140%
Sep-10 Dec-10 Mar-11 Jun-11 Sep-11
S&P 500 IT Services
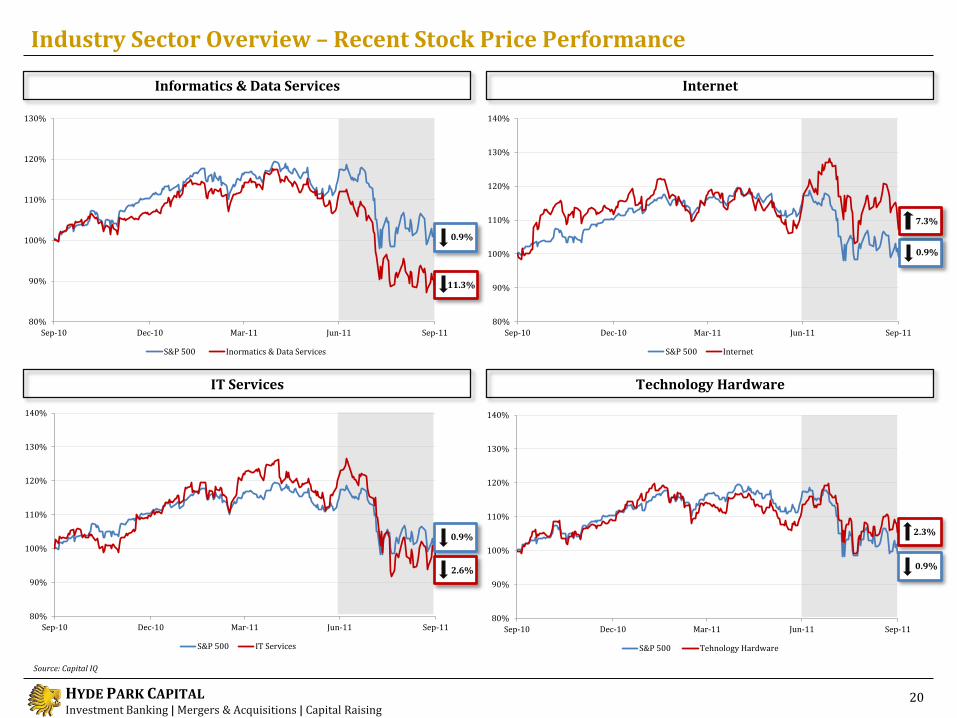
11.3%
80%
90%
100%
110%
120%
130%
Sep-10 Dec-10 Mar-11 Jun-11 Sep-11
S&P 500 Inormatics & Data Services
Industry Sector Overview – Recent Stock Price Performance
IT Services
Informatics & Data Services
20
Internet
Technology Hardware
Source: Capital IQ
0.9%
7.3%
0.9%
0.9%
2.3%
0.9%
80%
90%
100%
110%
120%
130%
140%
Sep-10 Dec-10 Mar-11 Jun-11 Sep-11
S&P 500 Internet
2.6%
HYDE PARK CAPITAL Investment Banking | Mergers & Acquisitions | Capital Raising
HYDE PARK CAPITAL Investment Banking | Mergers & Acquisitions | Capital Raising
Hyde Park Capital Advisors, LLC 701 N. Franklin Street
Tampa, FL 33602 Tel: 813-383-0202
www.hydeparkcapital.com
Member FINRA/SIPC
has been acquired by has been acquired by has been acquired by has been recapitalized by has merged with
has been recapitalized by
Sage Compliance
Services, Inc.
has acquired has been recapitalized by has been acquired by
has been recapitalized by
Harbert Mezzanine Partners
ADG Acquisition
Holdings, LLC
has been acquired by has been acquired by has acquiredhas been acquired by
has been acquired by
Recent Transactions John Hill Senior Managing Director [email protected] (813) 383-0205 John McDonald Senior Managing Director [email protected] (813) 383-0206 Keith Hodgdon Senior Vice President [email protected] (813) 383-0208 Jeffrey Bridge Vice President [email protected] (813) 383-0204 Michael Mariani Associate [email protected] (813) 597-2649
Top Related