


Languages
Pages
Legal


Technical Support Document: Energy Conservation Standards for Consumer Products: Dishwashers, Clothes Washers, and Clothes Dryers including Environmental Assessment (DOEIEA-0386) Regulatory Impact Analysis
July 1989
U.S. Department of Energy Assistant Secretary, Conservation
and Renewable Energy Building Equipment Division Washington, D.C. 20585

ENVIRONMENTAL ASSESSMENT FOR PROPOSED ENERGY CONSERVATION STANDARDS FOR THREE TYPES OF
CONSUMER PRODUCTS: DISHWASHERS, CLOTHES WASHERS AND CLOTHES DRYERS
1 INTRODUCTION AND SUMMARY
This environmental assessment (EA) evaluates the environmental impacts
resulting from new or amended energy-efficiency ,standards for dishwashers,
clothes washers and clothes dryers as mandated by the National Appliance
Energy Conservation Act of 1987 (1). A complete description of the Engineering
and Economic Analysis of the proposed standards may be found elsewhere in the
Technical Support Document (TSD) (2). All eleven of the scenarios for product
design changes described in the Engineering Analysis of the TSD are analyzed in
the environmental assessment in the form of levels of pollutant reduction. Level 1
represents the least amount of pollutant reduction, while higher numbered levels
represent increasingly more stringent standards, with correspondingly greater
reductions in pollutants. Values for energy savings that result from product
design changes are taken from the TSD. These energy savings are based on
recent data on actual usage rather than DOE test procedures.
The main environmental concern addressed is emissions from fossil fueled
electricity generation. Each of the design options for dishwashers, clothes washers
and clothes dryers result in decreased electricity use and, therefore, reduced
power plant emissions. The proposed efficiency standards will decrease air pollu-
tion by decreasing future energy demand. The greatest decreases in air pollution
, will be in sulfur oxides (listed in equivalent weight of sulfur dioxide, or SO2).
Some design options for dishwashers also reduce water consumption, resulting in
lower in-house emissions from fuel-burning water heaters.
Although the quantity of raw materials used per appliance will remain rela-
tively constant, in most scenarios increased initial cost is expected to slightly
decrease the number of appliances sold, resulting in small decreases in raw
materials used. This demand decrease is estimated by the Consumer Impact
Analysis in the TSD. The main effect of decreased appliance production is the
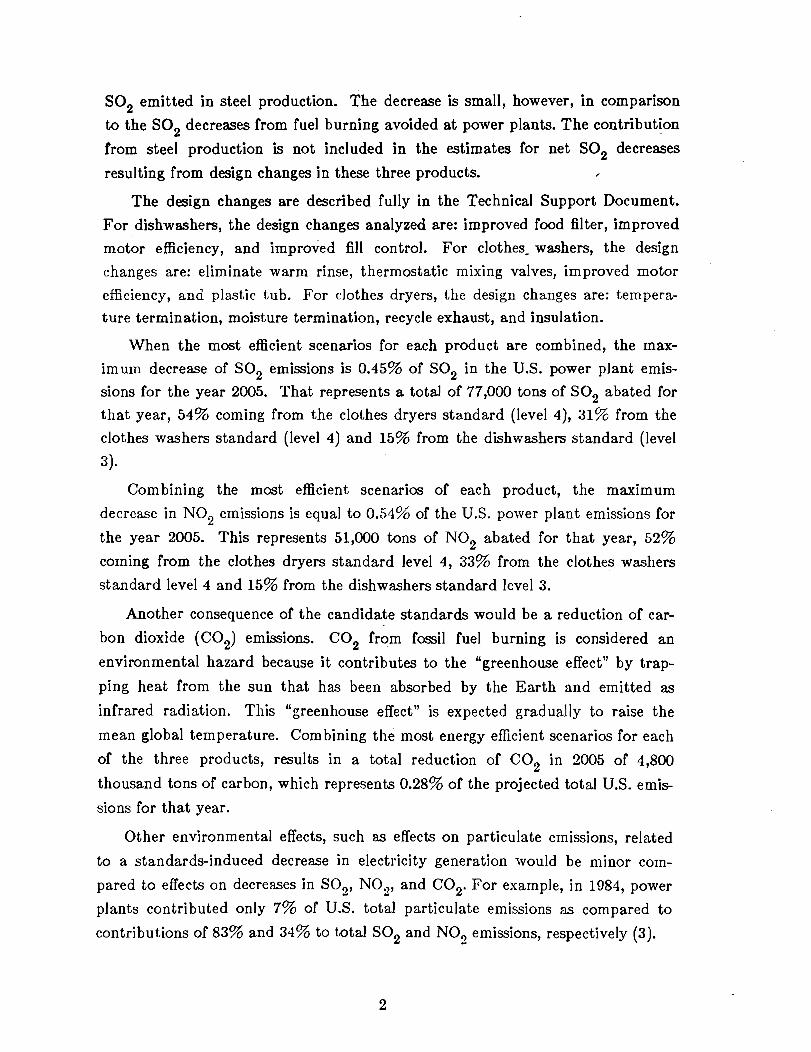
SO2 emitted in steel production. The decrease is small, however, in comparison
to the SO2 decreases from fuel burning avoided at power plants. The contribution
from steel production is not included in the estimates for net SO2 decreases
resulting from design changes in these three products.
The design changes are described fully in the Technical Support Document.
For dishwashers, the design changes analyzed are: improved food filter, improved
motor efficiency, and improved fill control. For clothes- washers, the design
changes are: eliminate warm rinse, thermostatic mixing valves, improved motor
efficiency, and plastic tub. For clothes dryers, the design changes are: tempera-
ture termination, moisture termination, recycle exhaust, and insulation.
When the most efficient scenarios for each product are combined, the max-
imum decrease of SO2 emissions is 0.45% of SO2 in the U.S. power plant emis-
sions for the year 2005. That represents a total of 77,000 tons of SO2 abated for
that year, 54% coming from the clothes dryers standard (level 4), 31% from the
clothes washers standard (level 4) and 15% from the dishwashers standard (level
3).
Combining the most efficient scenarios of each product, the maximum
decrease in NO2 emissions is equal to 0.54% of the U.S. power plant emissions for
the year 2005. This represents 51,000 tons of NO2 abated for that year, 52%
coming from the clothes dryers standard level 4, 33% from the clothes washers
standard level 4 and 15% from the dishwashers standard level 3.
Another consequence of the candidate standards would be a reduction of car-
bon dioxide (C02) emissions. C 0 2 from fossil fuel burning is considered an
environmental hazard because i t contributes to the "greenhouse effect" by trap-
ping heat from the sun that has been absorbed by the Earth and emitted as
infrared radiation. This "greenhouse effect" is expected gradually to raise the
mean global temperature. Combining the most energy efficient scenarios for each
of the three products, results in a total reduction of COP in 2005 of 4,800
thousand tons of carbon, which represents 0.28% of the projected total U.S. emis-
sions for that year.
Other environmental effects, such as effects on particulate emissions, related
to a standards-induced decrease in electricity generation would be nlinor com-
pared to effects on decreases in SO,, NO?, and CO,. For example, in 1984, power
plants contributed only 7% of U.S. total particulate emissions as compared to
contributions of 83% and 34% to total SO2 and NO, emissions, respectively (3). "

Reduced hot water use will decrease the amount of gas or oil burned within
some homes, thereby decreasing combustion effects on indoor air quality. Indoor
air problems are usually due to a combination of factors, including a tight house
envelope, insufficient ventilation for cooking appliances, presence of sources such
as cigarette smokers or formaldehyde containing products, and radon diffusion
from soil. In comparison to the above factors, and because fuel-burning water
heaters are normally vented t o the outside, the projected changes in water heater
use have little effect on indoor air quality.
2 METHODS OF ESTIMATING ENVIRONMENTAL IMPACTS
The greatest impacts of the proposed standards would be the result of gen-
erating less electricity. The main environmental effects of power plants on air
and water quality result from emissions of sulfur oxides (SOx), nitrogen oxides
(NOx), and carbon dioxide (Cot) . The symbols SO2 and NO2 represent all emis-
sions of SO; and NOx expressed in the equivalent weights of SO2 and NO2,
respectively. Carbon dioxide emissions are commonly expressed in tons of carbon.
A second source of these pollutants is fuel-burning household water heaters. The
proposed standards would also reduce these emissions. Since water heaters are
normally vented to the outside, the sum of the power plant and in-house emis-
sions are reported. Furthermore, reduced water consumption for dishwashers will
result in a lower volume of waste water to be treated and in a reduced need for
fresh water.
Table 3.1 U.S. C02, SO2 and NO2 Emissions
SO, .NO2
US US Power Plant US Power Plant
Year I Emissions
lo6 Tons
Emissions
lo6 Tons
Emissions
lo6 Tons
1995 1GOO 17.25 8.25
2000 1680 18.00 8.79
2005 1750 17.50 9.62
2010 1820 17.10 10.23
2015 1900 16.13 10.65

The estimates of emissions of SO2 and NO2 are also expressed as a percentage
of U.S. power plant emission for the year under consideration. The estimates of
emissions of C 0 2 are expressed as a percentage of U.S. total emission. Table 3.1
summarizes the U.S. emissions for the three compounds (4).
2.1 Sulfur a n d Ni t rogen Oxide Emissions
For each of the scenarios analyzed, emissions abated from fossil fuel-burning
power plants are estimated. In analyzing the impacts of design changes t o
dishwashers, clothes washers and dryers, lower sulfur emissions resulting from
decreased steel production are not considered. As mentioned earlier in this
report, these decreases in steel production result from a reduction in the number
of appliances sold. No changes in the amount of steel used per unit are expected.
Analysis of the impacts resulting from several design options for dishwashers,
clothes washers and dryers includes the consideration of SO2, NO2 and C 0 2 from
in-home combustion of gas and oil.
Estimates of energy saved by reduced electricity generation are taken from
the TSD. Primary energy saved from electricity generation a t the margin is allo-
cated among the categories of coal on the one hand, and gas plus oil on the other,
by the ratios of 0.53 and 0.47, respectively, as estimated in supporting material
for the Electric Utility Analysis, also in the TSD. This disaggregation into coal
and oil-plus-gas is depicted in Figure 1 for dishwashers. In order to capture the
effects of cleaner-burning power plants in future years, emission rates for power
plant fuel burning are calculated from projected emissions data and the projected
quantities of the corresponding fuels used, as described in a report by Placet, e t
al. Gas and oil are combined because, from an electric utility perspective, they
are often interchangeable. Linear interpolation and extrapolation are used to
derive emissions rates for years not covered in the report. -The values for reduction of SO2 and NO2 emissions from in-home gas and oil
combustion are produced by multipiying in-home fuel savings for gas and oil by
the corresponding emission rates. Emissions factors for water heaters were only
available for natural gas (5). For oil-fired water heaters, the oil-fired space heater
emission factors were used as default values (6). All of these emission factors are
consistent with theoretical emission factors from another source (7).

2.2 Carbon DioxideEmissions
Values for C0, abated are the sum of the CO, savings from coal-, gas-, and
oil-fired power plants and, for dishwashers and clothes washers, the CO, emis-
sions from in-home combustion of gas and oil. The energy saved from electricity
generation is apportioned between coal and gas or oil as in the calculation of SO,
and NO, emissions. In addition, gas and oil are disaggregated into relative shares
of 0.70 and 0.30, respectively. These shares are the averages of the relative quan-
tities of these fuels t o be used for electricity generation in the years 1990 through
1995, as estimated by the North American Electric Reliability Council (8). The
energy values of the fuels saved are translated into tons of carbon using
carbon/Btu values from the Carbon Dioxide Review ( 9 ) . The data for a more
accurate method of estimating relative gas and oil shares concerning order of
dispatch in the various NERC regions are not available. This disaggregation into
fuel shares should therefore be taken only a s a rough representation of power
plant fuel choices on the margin.
3 RESULTS
3.1 DISHWASHERS
Decreases in the amounts of CO,, SO, and NO, emitted at trial standards
levels 1 through 3 are summarized in Tables 3.2 through 3.4. The figures in the
tables include reductions in emissions from in-house Gater heaters.

(spent)) n l a uo!ll!Jpent)
Figure 1. Electricity Savings Due t o Standards on Dishwashers

- - - - --
Table 3.2 Reduction of Pollutants for Dishwashers Level 1
C 0 2 Reduction (lo3Tons of Carbon)
Abated from Abated from Abated from Net Percent of US
Year Coal Use Gas Use Oil Use Change Emissions
Cumulative C 0 2 reduction, 1993-2015 = 8,023 thousand tons of C
SO2 Reduction (Tons of SO,)
Abated from Abated from Net Percent of US SO,
Year Coal Use Gas/Oil Use Change Power Plant Emissions
Cumulative SO2 reduction, 1993-2015 = 113,561 tons
NOP Reduction (Tons of NO2)
Abated from Abated from Net Percent of US NO2
Year Coal Use Gas/Oil Use Change Power Plant Emissions
Cumulative NO2 reduction, 1993-2015 = 78,505 tons
7

Table 3.3 Reduction of Pollutants for Dishwashers Level 2
COP Reduction ( lo3 Tons of Carbon)
Abated from Abated from Abated from Net Percent of US
Year Coal Use Gas Use Oil Use Change Emissions
Cumulative C 0 2 reduction, 1993-2015 = 10,997 thousand tons of C
SO2 Reduction (Tons of SO2)
Abated from Abated from Net Percent of US SO,
Year Coal Use Gas/Oil Use Change Power Plant Emissions
Cumulative SO2 reduction, 1993-2015 = 165,308 tons
NO, ~ e d u c t i o n (Tons of NO,)
Abated from Abated from Net Percent of US NO,
Year Coal Use Gas/Oil Use Change Power Plant Emissions
Cumulative NO2 reduction, 1903-2015 = 111,807 tons

Table 3.4 Reduction of Pollutants for Dishwashers Level 3
C 0 2 Reduction (lo3 Tons of Carbon)
Abated from Abated from Abated from Net Percent of US
Year Coal Use Gas Use Oil Use Change Emissions
Cumulative CO, reduction, 1993-2015 = 13,832 thousand tons of C
SO, Reduction (Tons of SO,)
Abated from Abated from Net Percent of US SO,
Year Coal Use Gas/Oil Use Change Power Plant Emissions
Cumulative SO2 reduction, 1993-2015 =203,500 tons
NO2 Reduction (Tons of NO,)
Abated from Abated from Net Percent of US NO,
Year Coal Use Gas/Oil Use Change Power P lan t Emissions
Cumulative NO, reduction, 1993-2015 = 139,243 tons
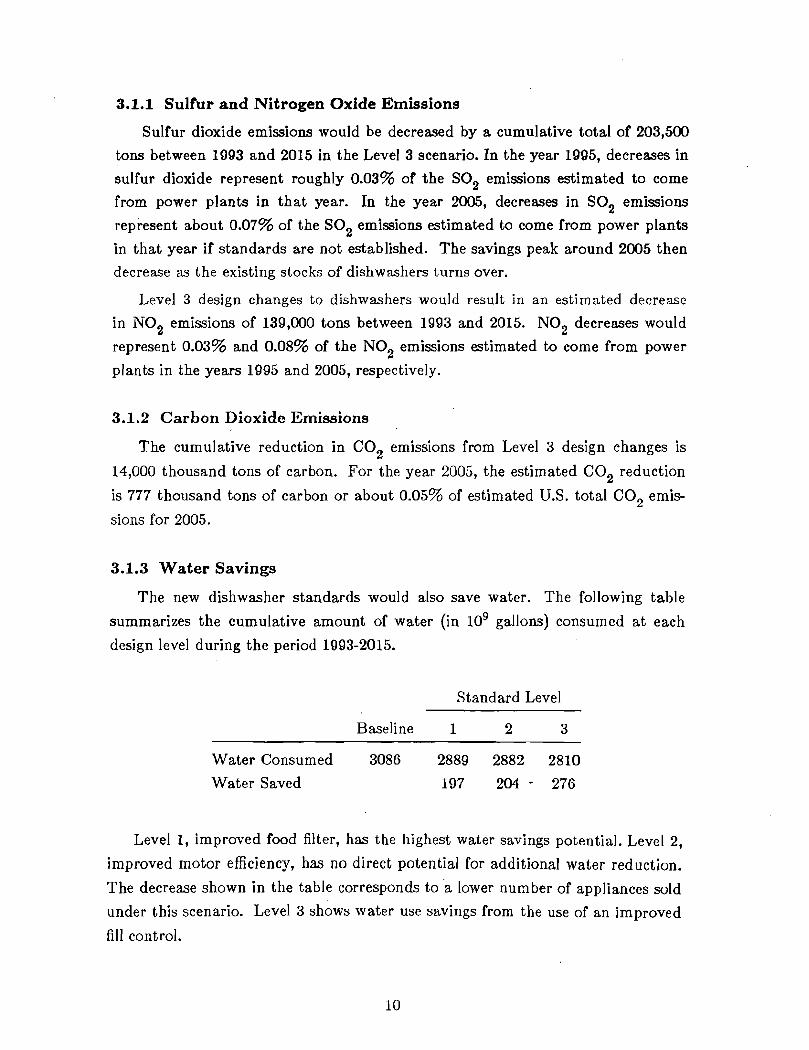
3.1.1 Sulfur and Nitrogen Oxide Emissions
Sulfur dioxide emissions would be decreased by a cumulative total of 203,500
tons between 1093 and 2015 in the Level 3 scenario. In the year 19'95, decreases in
sulfur dioxide represent roughly 0.03% of the SO2 emissions estimated to come
from power plants in that year. In the year 2005, decreases in SO2 emissions
represent about 0.07% of the SO2 emissions estimated to come from power plants
in that year if standards are not established. The savings peak around 2005 then
decrease as the existing stocks of dishwashers turns over.
Level 3 design changes to dishwashers would result in an estimated decrease
in NO2 emissions of 139,000 tons between 1993 and 2015. NO2 decreases would
represent 0.03% and 0.08% of the NO2 emissions estimated to come from power
plants in the years 1995 and 2005, respectively.
3.1.2 Carbon Dioxide Emissions
The cumulative reduction in C02 emissions from Level 3 design changes is
14,000 thousand tons of carbon. For the year 2005, the estimated C 0 2 reduction
is 777 thousand tons of carbon or about 0.05% of estimated U.S. total C02 emis-
sions for 2005.
3.1.3 Water Savings
The new dishwasher standards would also save water. The following table
summarizes the cumulative amount of water (in 10' gallons) consumed a t each
design level during the period 1993-2015.
Standard Level
Baseline 1 -
2 3 -
Water Consumed 3086 2889 2882 2810
Water Saved 197 204 - 276
Level I, improved food filter, has the highest water savings potential. Level 2,
improved motor efficiency, has no direct potential for additional water reduction.
The decrease shown in the table corresponds to 'a lower number of appliances sold
under this scenario. Level 3 shows water use savings from the use of an improved
fill control.
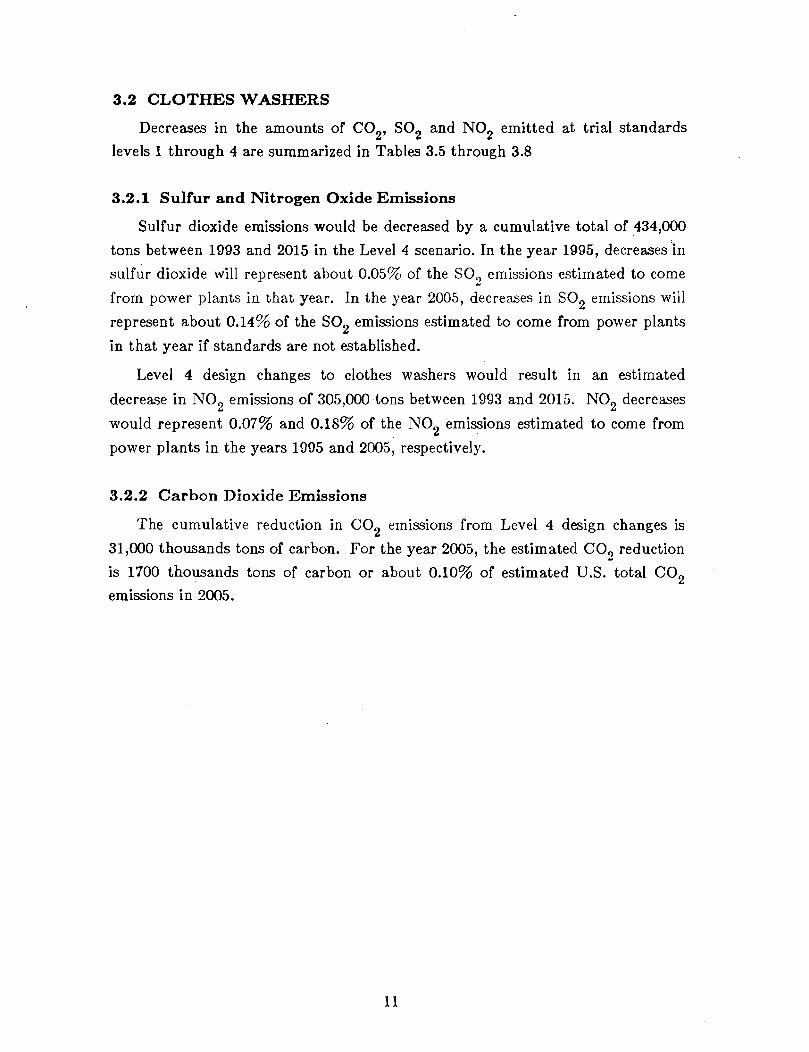
3.2 CLOTHES WASHERS
Decreases in the amounts of C02, SO2 and NOz emitted at trial standards
levels 1 through 4 are summarized in Tables 3.5 through 3.8
3.2.1 Sulfur and Nitrogen Oxide Emissions
Sulfur dioxide emissions would be decreased by a cumulative total of 434,000
tons between 1993 and 2015 in the Level 4 scenario. In the year 1995, decreases 'in
sulfur dioxide will represent about 0.05% of the SO,- emissions estimated to come
from power plants in that year. In the year 2005, decreases in SO2 emissions will
represent about 0.14% of the SO2 emissions estimated to come from power plants
in that year if standards are not established.
Level 4 design changes t o clothes washers would result in an estimated
decrease in NO2 emissions of 305,000tons between 1993 and 2015. NO2 decreases
would represent 0.07% and 0.18% of the NO2 emissions estimated t o come from
power plants in the years 1995 and 2005, respectively.
3.2.2 Carbon Dioxide Emissions
The cumulative reduction in C 0 2 emissions from Level 4 design changes is
31,000 thousands tons of carbon. For the year 2005, the estimated CO, reduction"
is 1700 thousands tons of carbon or about 0.10% of estimated U.S. total C 0 2 emissions in 2005.

-- --
Table 3.5 Reduction of Pollutants for Clothes Washers Level 1
C 0 2 Reduction (lo3 Tons of Carbon)
Abated from Abated from Abated from Net Percent of US
Year Coal Use Gas Use Oil Use Change Emissions
Cumulative C 0 2 reduction, 1993-2015 = 14,454 thousand tons of C
SO2 Reduction (Tons of SO2)
Abated from Abated from Net Percent of US SO2
Year Coal Use Gas/Oil Use Change Power Plant Emissions
1995 3789 621 4411 0.03%
2000 8916 1559 10475 0.06%
2005 8882 1933 10815 0.06%
2010 7250 1693 8943 0.05%
2015 5264 1363 6627 0.04%
Cumulative SO, reduction, 1993-2015 = 191,612 tons
NO2 Reduction (Tons of NO,)
Abated from Abated from Net Percent of US NO,
Year Coal Use Gas/Oil Use Change Power Plant Emissions
Cumulative NO2 reduction, 1993-2015 = 136,944 tons

Table 3.6 Reduction of Pollutants for Clothes Washers Level 2
COP Reduction (lo3 Tons of Carbon)
Abated from Abated from Abated from Net Percent of US
Year Coal Use Gas Use Oil Use Change Emissions
Cumulative C 0 2 reduction, 1993-2015 =24,864 thousand tons of C
SO2 Reduction (Tons of SO2)
Abated from Abated from Net Percent of US SO2
Year Coal Use Gas/Oil Use Change Power Plant Emissions
Cumulative SO2 reduction, 1993-2015 = 327,954 tons
NO2 ~ e d u c t i o n (Tons of NO2)
Abated from Abated from Net Percent of US NO2
Year Coal Use Gas/Oil Use Change Power Plant Emissions
Cumulative NO2 reduction, 1993-2015 =235,312 tons

Table 3.7 Reduction of Pollutants for Clothes Washers Level 3
C 0 2 Reduction (lo3Tons of Carbon)
Abated from Abated from Abated from Net Percent of US
Year Coal Use Gas Use Oil Use Change Emissions
Cumulative COP reduction, 1993-2015 = 28,813 thousand tons of C
SO2 Reduction (Tons of SO2)
Abated from Abated from Net Percent of US SO2
Year Coal Use Gas/Oil Use Change Power Plant Emissions
Cumulative SO2 reduction, 1903-2015 =396,498 tons
NO2 Reduction (Tons of NO2)
Abated from Abated from Net Percent of US NO, "
Year Coal Use Gas/Oil Use Change Power Plant Emissions
Cumulative NO2 reduction, 1903-2015 =279,400 tons
14

Table 3.8 Reduction of Pollutants for Clothes Washers Level 4
C 0 2 Reduction (lo3 Tons of Carbon)
Abated from Abated from Abated from Net Percent of US
Year Coal Use Gas Use Oil Use Change Emissions
Cumulative C 0 2 reduction, 1993-2015 =31,205 thousand tons of C
SO2 Reduction (Tons of SO2)
Abated from Abated from Net Percent of US SO2
Year Coal Use Gas/Oil Use Change Power Plant Emissions
Cumulative SO2 reduction, 1993-2015 =434,353 tons
NO2 Reduction (Tons of NO,)
Abated from Abated from Net Percent of US NOp
Year Coal Use Gas/Oil Use Change Power Plant Emissions
Cumulative NO2 reduction, 1993-2015 =301,640 tons

3.3 CLOTHES DRYERS -Decreases in the amounts of C02, SO2 and NO, emitted a t trial standards
levels 1through 4 are summarized in Tables 3.9 through 3.12.
3.3.1 Sulfur and Nitrogen Oxide Emissions
Sulfur dioxide emissions would be decreased by a cumulative total of 694,000
tons between 1993 and 2015 in the Level 4-scenario. In the year 1995, decreases in
sulfur dioxide will represent about 0.07% of the SO, emissions estimated to come "
from power plants in that year. In the year 2005, decreases in SO2 ,emissions will
represent about 0.24% of the SO2 emissions estimated to come from power plants
in that year if standards are not established.
Level 4 design changes to clothes dryers would result in an estimated decrease
in NO2 emissions of 446,000 tons between 1993 and 2015. NO2 decreases would
represent 0.08% and 0.28% of the NO2 emissions estimated to come from power
plants in the years 1995 and 2005, respectively.
3.3.2 Carbon Dioxide Emissions
The cumulative reduction in C 0 2 emissions from Level 4 design changes is
40,000 thousands tons of carbon. For the year 2010, the estimated C 0 2 reduction
is 2400 thousands tons of carbon or about 0.13% of estimated total U.S. C 0 2
emissions.

Table 3.9 Reduction of Pollutants for Clothes Dryers Level 1
CO, Reduction (lo3 Tons of C o p )
Abated from Abated from Abated from Net Percent of US
Year Coal Use Gas Use Oil Use Change Emissions
p p p p p p
Cumulative CO, reduction, 1993-2015 = 11,360 thousand tons of C
SO2 Reduction (Tons of SO2)
Abated from Abated from Net Percent of US SO,
Year Coal Use Gas/Oil Use Change Power Plant Emissions
Cumulative SO, reduction, 1993-2015 =205,905 tons
NO2 Reduction (Tons of NO2)
Abated from Abated from Net Percent of US NO,
Year Coal Use Gas/Oil Use Change Power Plant Emissions
Cumulative NO2 reduction, 1993-2015 = 130,146 tons

Table 3.10 Reduction of Pollutants for Clothes Dryers Level 2
CO, Reduction (lo3 Tons of C 0 2 )
Abated from Abated from Abated from Net Percent of US
Year Coal Use Gas Use Oil Use Change Emissions
Cumulative C 0 2 reduction, 1993-2015 = 19,867 thousand tons of C
SO2 Reduction (Tons of SO2)
Abated from Abated from Net Percent of US SO2
Year Coal Use Gas/Oil Use Change Power Plant Emissions
Cumulative SO2 reduction, 1993-2015 =359,843 tons
NO2 Reduction (Tons of NO2)
Abated from Abated from Net Percent of US NO, -Year Coal Use Gas/Oil Use Change Power Plant Emissions
Cumulative NO2 reduction, 1903-2015 = 227,482 tons
18

Table 3.11 Reduction of Pollutants for Clothes Dryers Level 3
COB Reduction (lo3 Tons of C 0 2 )
Abated from Abated from Abated from Net Percent of US
Year Coal Use Gas Use Oil Use Change Emissions
Cumulative C 0 2 reduction, 1993-2015 = 24,455 thousand tons of C
SO2 Reduction (Tons of SO2)
Abated from Abated from Net Percent of US SO,
Year Coal Use Gas/Oil Use Change Power Plant Emissions
Cumulative SO, reduction, 1993-2015 =435,674 tons
NO2 Reduction (Tons of NO2)
Abated from . Abated from Net Percent of US NO,
Year Coal Use Gas/Oil Use Change Power Plant Emissions
Cumulative NO2 reduction, 1903-2015 =277,029 tons

Table 3.12 Reduction of Pollutants for Clothes Dryers Level 4
C02Reduction (lo3 Tons of C02)
Abated from Abated from Abated from Net Percent of US
Year Coal Use Gas Use Oil Use Change Emissions
Cumulative CO, reduction, 1993-2015 =40,018 thousand tons of C
SO, Reduction (Tons of SO,)
Abated from Abated from Net Percent of US SO,
Year Coal Use Gas/Oil Use Change Power Plant Emissions
Cumulative SO, reduction, 1993-2015 = 693,956 tons
NO, Reduction (Tons of NO,)
Abated from Abated from Net Percent of US NO,
Year Coal Use Gas/Oil Use Change Power Plant Emissions
Cumulative NO2 reduction, 1993-2015 =445,541 tons

4 EVALUATION OF ENVZRONMENTAL IMPACTS
4.1 Effects of Acid Precipitation
Sulfur dioxide is the major contributor to acid precipitation in the U.S. After
a series of reactions with atmospheric gases and water, SO, forms sulfuric acid.
More than half of the domestic SO2 emitted as a result of human activities comes
from coal burned in power plants. The next greatest contributor to acid precipi-
tation is nitrogen dioxide. One-third of the domestic NO2 emitted from human
activities comes from electricity generating facilities (4).
Attaching values to incremental changes in acid precipitation is difficult. The
effects of acid deposition on a given lake or forest depend on a variety of factors,
including distance from pollutant source, buffering capacity, surrounding topogra-
phy, rate of snow melt, soil or sediment type, etc. Acid precipitation can have
negligible effects in buffered natural systems-those containing substances that
take up or react with acids-until the buffering capacity is used up. Continued
acid precipitation brings water and forest ecosystems closer to their buffering
capacity limits, which can greatly affect living systems. Allowing a body of water
to return to its natural state of alkalinity (buffering capacity) may require tens to
thousands of years. In attempting to quantify the effects of acid precipitation, it
is therefore important t o consider cumulative effects that may not currently be
obvious.
Some effects on humans resulting from adding acid to ecosystems are:
decreases in fishing productivity, forest productivity, farming productivity,
recreational opportunities, and the degradation of susceptible buildings and
monuments.
The impacts of implementing any of the candidate standards on the abate-
ment of SO, and NO2 would be relatively small (10). Implementing the most
efficient standards for each product would reduce, between 1993 and 2015, 0.33%
and 0.42% of cumulative U.S. power plant emissions of SO2 and NO2, respec-
tively. In the year of highest abatement, 2005, such standards would reduce U.S. SO2 and NO, power plant emissionsby 0.45% and 0.54%, respectively. This is
not considered significant in the context of total SO, - and NO2 emissions, and
would not have a significant impact on acid rain precipitation.
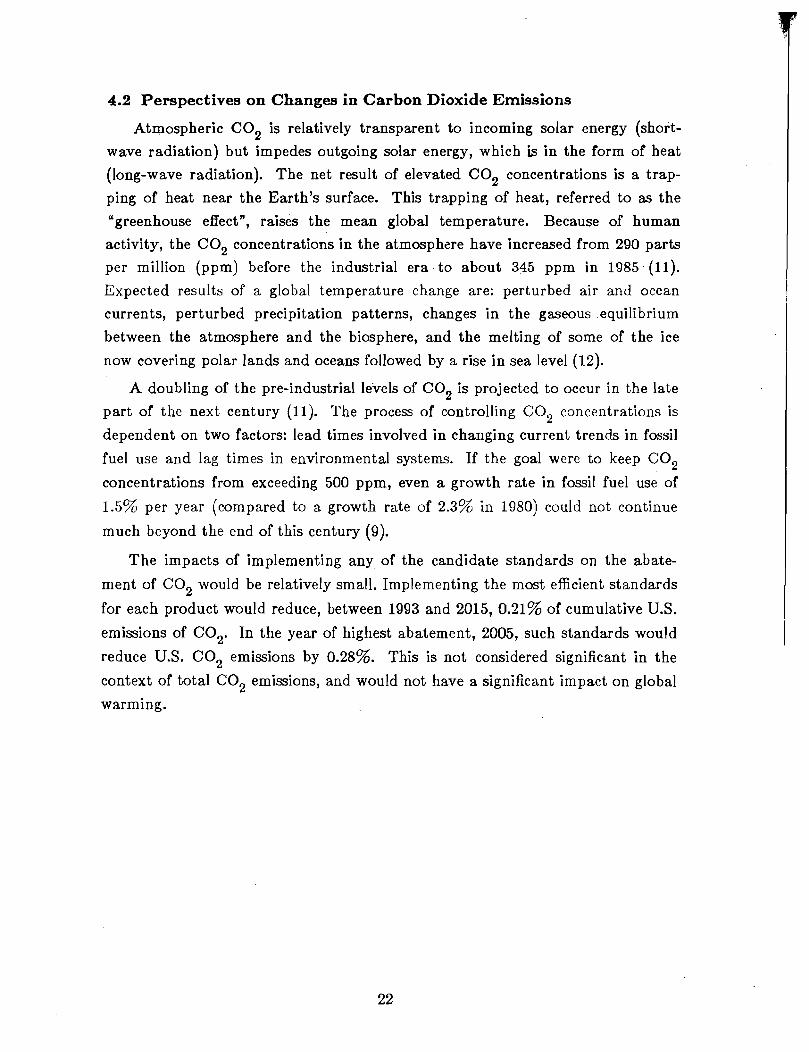
4.2 Perspectives on Changes in Carbon Dioxide Emissions
Atmospheric C 0 2 is relatively transparent to incoming solar energy (short-
wave radiation) but impedes outgoing solar energy, which is in the form of heat
(long-wave radiation). The net result of elevated C02 concentrations is a trap-
ping of heat near the Earth's surface. This trapping of heat, referred to as the
"greenhouse effect", raises the mean global temperature. Because of human
activity, the C 0 2 concentrations in the atmosphere have increased from 290 parts
per million (ppm) before the industrial era to about 345 ppm in 1985 (11).
Expected results of a global temperature change are: perturbed air and ocean
currents, perturbed precipitation patterns, changes in the gaseous equilibrium
between the atmosphere and the biosphere, and the melting of some of the ice
now covering polar lands and oceans followed by a rise in sea level (12).
A doubling of the pre-industrial levels of C02 is projected to occur in the late
part of the next century (11). The process of controlling C02 concentrations is
dependent on two factors: lead times involved in changing current trends in fossil
fuel use and lag times in environmental systems. If the goal were to keep C02
concentrations from exceeding 500 ppm, even a growth rate in fossil fuel use of
1.5% per year (compared to a growth rate of 2.3% in 1980) could not continue
much beyond the end of this century (9).
The impacts of implementing any of the candidate standards on the abate-
ment of C02 would be relatively small. Implementing the most efficient standards
for each product would reduce, between 1993 and 2015, 0.21% of cumulative U.S. emissions of C02. In the year of highest abatement, 2005, such standards would
reduce U.S. C 0 2 emissions by 0.28%. This is not considered significant in the
context of total C02 emissions, and would not have a significant impact on global
warming.

5 REFERENCES
1. NAECA 1987. National Appliance Energy Conservation Act, Public Law
100-12
2. U.S. Department of Energy. 1988. "Technical Support Document: Energy
Conservation Standards for Consumer Products: Dishwashers, Clobhes
Washers, and Clothes DryersJ', Draft Report prepared by Lawrence Berke-
ley Laboratory (November).
3. U.S. Environmental Protection Agency. 1986. "National Air Pollution Em-
ission Estimates, 1940-1984", EPA-45014-85-014.
4. Placet M., D.G. Streets, E.R. Williams. 1986. "Environmental Trends As-sociated with the Fifth National Energy Policy Plan," Argonne National
Laboratory.
5. Cole J.T., Zowaski T.S. 1985. "Emissions from Residential Gas Fired Ap-
pliances", Gas Research Institute.
6. Surprenant N.F., R.R. Hall, K.T. McGregor, A.F. Werner. 1079. "Emis-
sions kssessment of Conventional Stationary Combustion Systems, Vol. 1,
Gas & Oil-Fired Residential Heating Sources", EPA 60017-70-020.
7. U.S. Environmental Protection Agency. 1977. "Compilation of Air Pollu-
tant Emission Factors" EP-42 Par t 1.
8. North American Electric Reliability Council. 1985. "1085 Electric Power
Supply and Demand For 1984 t o 1994".
9. Clark, William C. 1982. "Carbon Dioxide Review", Oxford University
Press, New York N.Y., pp. 357, 338.
10. Oppenheimer, bl. 1983. "The Relationship of Sulfur Emissions to Sulfate
in Precipitation", Atmospheric Environment, Vol. 17.

11. Ramanathan V. 1988. "The Greenhouse Theory of Climate Change: A Test by an Inadvertent 'Global Experiment", Science Vol. 240.
12. U.S. Council on Environmental Quality. 1981. "Fossil Fuels and the Effect
of Increasing Concentrations of Carbon Dioxide", Global Energy Futures
and the Carbon Dioxide Problem, Government Printing Office.
Top Related