


Languages
Pages
Legal


TECHNICAL NOTES for the Cardiac Surgery Report
September 2013
Pennsylvania Health Care Cost Containment Council Report Period: July 1, 2011 through December 31, 2012
225 Market Street, Suite 400, Harrisburg, PA 17101 Phone: (717) 232-6787
Fax: (717) 232-3821 www.phc4.org
Joe Martin, Executive Director
PHC4 Cardiac Surgery Report July 1, 2011 through December 31, 2012 Data Technical Notes
i
TABLE OF CONTENTS
Overview ............................................................................................................................................. 1
Data Collection and Verification ...................................................................................................... 2
Hospital and Cardiothoracic Surgeon Verification of Data ............................................................ 2
Study Population ............................................................................................................................... 4
Inclusion Criteria ........................................................................................................................... 4
Exclusion Criteria .......................................................................................................................... 5
Measures Reported ........................................................................................................................... 6
Number of Cases .......................................................................................................................... 6
Risk-Adjusted In-Hospital Mortality Rating.................................................................................... 6
Risk-Adjusted 30-Day Readmissions Rating ................................................................................ 6
Case-Mix Adjusted Average Hospital Charge .............................................................................. 6
Calendar Year 2011 Average Medicare Fee-for-Service Payment .............................................. 6
Calendar Year 2011 Average Hospital Charge for Medicare Fee-for-Service Cases .................. 7
Risk-Adjustment Methodology ......................................................................................................... 8
Model Development ...................................................................................................................... 8
Calculating Statistical Ratings ..................................................................................................... 10
Determining Actual Values ................................................................................................... 10
Determining Expected Values .............................................................................................. 10
Determining Statistical Ratings ............................................................................................. 11
Assignment of Statistical Ratings ......................................................................................... 11
Case-Mix Adjustment Methodology............................................................................................... 12
Construction of Reference Database .......................................................................................... 12
Trim Methodology ....................................................................................................................... 12
Determining Actual Charges ....................................................................................................... 13
Determining Expected Charges .................................................................................................. 13
Determining Case-Mix Adjusted Charges ................................................................................... 13
Data Tables
Table 1. Statewide Utilization and Outcome Data ...................................................................... 14
Table 2. Exclusion Data.............................................................................................................. 15
Table 3. 30-Day Readmissions Data .......................................................................................... 17
Table 4. Frequency Data for Potential Risk Factors – In-Hospital Mortality .............................. 21
Table 5. Frequency Data for Potential Risk Factors – 30-Day Readmissions ........................... 25
Table 6. In-Hospital Mortality Model ........................................................................................... 30
Table 7. 30-Day Readmissions Model ....................................................................................... 31
Appendices
Appendix A. Exclusion Definitions ............................................................................................. A-1
Appendix B. Reasons for Readmissions Definitions ............................................................... A-7
Appendix C. Definitions for ICD-9-CM Code-Based Potential Risk Factors ........................... A-12
Appendix D. Example of Logistic Regression and Calculating Statistical Ratings .................. A-16
Appendix E. Example of Case-Mix Adjustment ....................................................................... A-17

PHC4 Cardiac Surgery Report July 1, 2011 through December 31, 2012 Data Technical Notes
1
OVERVIEW The Technical Notes serve as a technical supplement to the Pennsylvania Health Care Cost Containment Council’s (PHC4) report on coronary artery bypass graft (CABG) and valve surgery for discharges from July 1, 2011 through December 31, 2012. This document describes the methodology and development of the report and includes information on statewide results, cases excluded from the analysis, and risk-adjustment models.
The analysis included adult patients age 30 or older who underwent a CABG procedure, a valve procedure, or combined valve and CABG procedures in a Pennsylvania general acute care (GAC) hospital. Results are displayed for each of the following procedure groups:
CABG without Valve
Valve without CABG
Valve with CABG
Total Valve (combines Valve without CABG and Valve with CABG procedure groups)
Risk-adjusted measures for hospitals and surgeons with at least 30 cases are reported for:
In-hospital mortality
30-day readmissions with a principal diagnosis that indicated a heart-related condition or an infection or a complication
Average hospital charge (case-mix adjusted) is reported for hospitals with at least 11 cases in a particular procedure group.
Calendar year 2011 average Medicare payment is reported for hospitals with at least 11 cases in a particular procedure group. If the number of cases included in the payment analysis for either the Valve without CABG or the Valve with CABG procedure group is less than 11, payment data is only reported for the Total Valve procedure group.
Calendar year 2011 average hospital charge (case-mix adjusted) is reported for the cases in the 2011 average Medicare payment measure. Average charge for procedure groups with fewer than 11 cases is not reported.
The rigorous methodology described in this document was developed to account for the differences among individual patients that had the potential to influence the outcome of CABG and/or valve surgery. Statewide utilization and outcome data are displayed in Data Table 1.
PHC4 Cardiac Surgery Report July 1, 2011 through December 31, 2012 Data Technical Notes
2
DATA COLLECTION AND VERIFICATION The data for the Cardiac Surgery Report, obtained from the inpatient UB-04 (Uniform Billing) form, was submitted electronically to PHC4 by Pennsylvania GAC hospitals that performed CABG and/or valve surgery primarily on adults. Federal hospitals were not included. The data included demographic information, hospital charges, and International Classification of Diseases, 9th Revision, Clinical Modification (ICD-9-CM) diagnosis and procedure codes. Hospitals also submitted laboratory test results and supplemental clinical data such as ejection fraction and percent blockage in a coronary artery. Laboratory test results were submitted by hospitals to the Council for a select group of acute care inpatient records, including those used in the cardiac surgery analysis. Hospitals were required to submit the highest and/or lowest result(s) for a maximum of 29 laboratory tests as collected from patients during the initial period of their hospitalization. The requirements for submitting this data are specified elsewhere (refer to PHC4’s Laboratory Data Reporting Manual, accessible at www.phc4.org). In brief, for patients admitted prior to 6:00 p.m., only laboratory results collected on Day 1 of the admission were to be submitted. For patients admitted after 6:00 p.m., results were to be submitted for tests collected on the day of admission (Day 1) through the next calendar day (Day 2). Only results of laboratory tests drawn prior to the start date and time of anesthesia for the first CABG and/or valve surgery (and within the laboratory test collection timeframe) were used in the cardiac surgery analysis. Supplemental clinical data was submitted by hospitals to the Council for inpatient discharges of adult patients in which a CABG and/or valve surgery was performed. Hospitals were required to submit the following clinical data elements related to the first CABG and/or valve surgery of the admission: anesthesia start date and start time, American Society of Anesthesiologists (ASA) class, the ASA emergency indicator, ejection fraction, and percent stenosis in the coronary arteries and their branches. The requirements for submitting this data are specified elsewhere (refer to PHC4’s Cardiac Surgery Supplemental Clinical Data Reporting Manual, accessible at www.phc4.org). Facilities submitted data to the Council on a quarterly basis (within 90 days from the last day of each quarter). Upon receipt of the data, verification was performed to assure data were submitted in a readable format. Extensive quality assurance checks were completed and laboratory data and supplemental clinical data submissions were matched to inpatient records. Error reports for UB-04 data were then generated and returned to each facility with an opportunity to correct any problems. Similarly, laboratory test results were evaluated each quarter and summary reports indicating data anomalies were sent to each facility, again with an opportunity to make corrections.
Hospital and Cardiothoracic Surgeon Verification of Data Hospitals were asked to confirm the accuracy of discharge records, provide additional ICD-9-CM diagnosis and procedure codes as appropriate, and confirm that cases had the correct surgeon assignment. Surgeons were asked to perform a patient level review of the submitted records and then attest to the accuracy of the data and the surgeon assignment. Hospitals and/or surgeons had the opportunity to request special exclusions for cases in which the patient’s outcome was most directly associated with conditions unrelated to the CABG/valve surgical episode or the care received during that hospitalization that were not accounted for through risk adjustment. The medical records were reviewed to determine whether special requests for exclusion would be granted. In addition, because of their importance as risk factors, hospitals and surgeons had the opportunity to submit medical records for cases in which cardiogenic shock and/or acute renal failure were present at the time of or immediately prior to the first CABG and/or valve surgery. These records were reviewed to verify that the criteria for preoperative cardiogenic shock and/or preoperative acute renal failure were met. The requirements for submitting cases for medical

PHC4 Cardiac Surgery Report July 1, 2011 through December 31, 2012 Data Technical Notes
3
record review are specified elsewhere (refer to PHC4’s Guide for Review and Attestation of Cardiac Surgery Data, accessible at www.phc4.org). Hospitals were given an opportunity to verify the average Medicare payment reported for their facilities prior to the public release of the information.
PHC4 Cardiac Surgery Report July 1, 2011 through December 31, 2012 Data Technical Notes
4
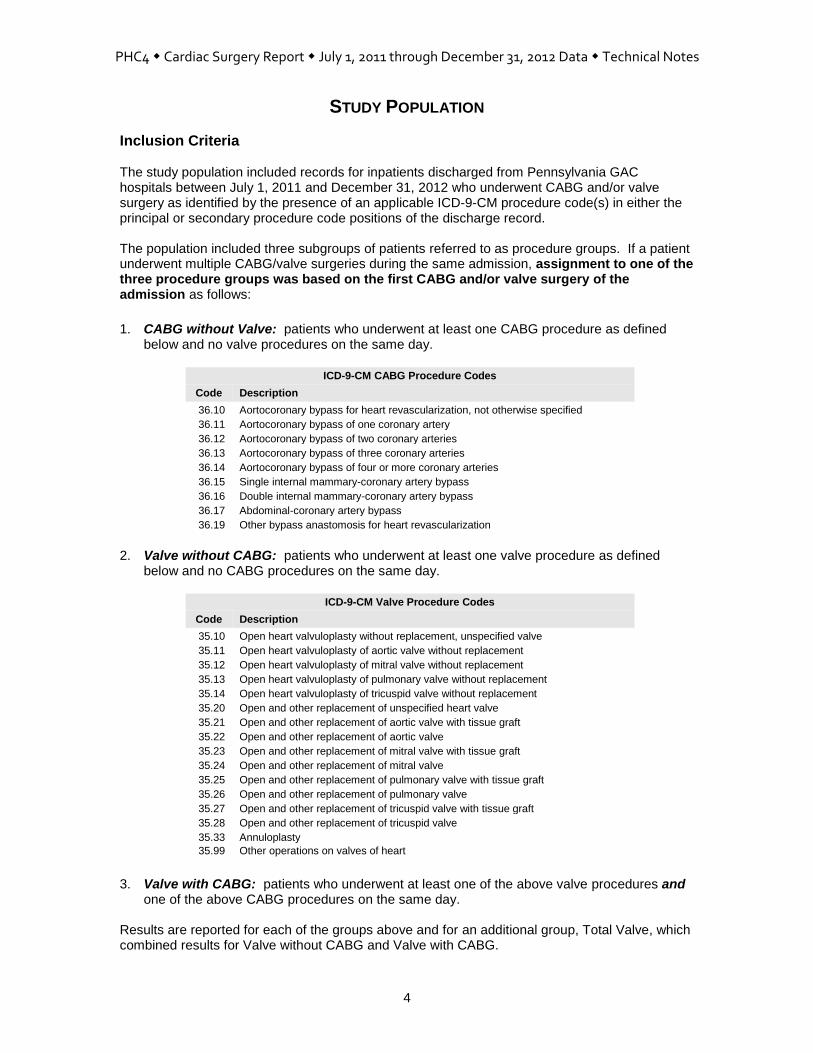
STUDY POPULATION
Inclusion Criteria The study population included records for inpatients discharged from Pennsylvania GAC hospitals between July 1, 2011 and December 31, 2012 who underwent CABG and/or valve surgery as identified by the presence of an applicable ICD-9-CM procedure code(s) in either the principal or secondary procedure code positions of the discharge record. The population included three subgroups of patients referred to as procedure groups. If a patient underwent multiple CABG/valve surgeries during the same admission, assignment to one of the three procedure groups was based on the first CABG and/or valve surgery of the admission as follows:
1. CABG without Valve: patients who underwent at least one CABG procedure as defined below and no valve procedures on the same day.
2. Valve without CABG: patients who underwent at least one valve procedure as defined
below and no CABG procedures on the same day.
ICD-9-CM Valve Procedure Codes
Code Description
35.10 Open heart valvuloplasty without replacement, unspecified valve
35.11 Open heart valvuloplasty of aortic valve without replacement
35.12 Open heart valvuloplasty of mitral valve without replacement
35.13 Open heart valvuloplasty of pulmonary valve without replacement
35.14 Open heart valvuloplasty of tricuspid valve without replacement
35.20 Open and other replacement of unspecified heart valve
35.21 Open and other replacement of aortic valve with tissue graft
35.22 Open and other replacement of aortic valve
35.23 Open and other replacement of mitral valve with tissue graft
35.24 Open and other replacement of mitral valve
35.25 Open and other replacement of pulmonary valve with tissue graft
35.26 Open and other replacement of pulmonary valve
35.27 Open and other replacement of tricuspid valve with tissue graft
35.28 Open and other replacement of tricuspid valve
35.33 Annuloplasty
35.99 Other operations on valves of heart
3. Valve with CABG: patients who underwent at least one of the above valve procedures and one of the above CABG procedures on the same day.
Results are reported for each of the groups above and for an additional group, Total Valve, which combined results for Valve without CABG and Valve with CABG.
ICD-9-CM CABG Procedure Codes
Code Description
36.10 Aortocoronary bypass for heart revascularization, not otherwise specified
36.11 Aortocoronary bypass of one coronary artery
36.12 Aortocoronary bypass of two coronary arteries
36.13 Aortocoronary bypass of three coronary arteries
36.14 Aortocoronary bypass of four or more coronary arteries
36.15 Single internal mammary-coronary artery bypass
36.16 Double internal mammary-coronary artery bypass
36.17 Abdominal-coronary artery bypass
36.19 Other bypass anastomosis for heart revascularization

PHC4 Cardiac Surgery Report July 1, 2011 through December 31, 2012 Data Technical Notes
5
Exclusion Criteria Cases meeting certain criteria were excluded from the outcome analyses. Standard exclusions were applied to the in-hospital mortality analysis and consisted of the following:
Patients less than 30 years of age
Patients who left against medical advice
Clinically complex cases* Standard exclusions and exclusions particular to the measure of interest were applied to readmissions and charge analyses. Additional exclusions for 30-day readmissions included:
Patients who died during the hospitalization in which the surgery was performed.
Cases with invalid data (i.e., social security number, date of birth, or sex), which could not be linked to subsequent hospitalizations.
Out-of-state residents, because these patients could undergo a CABG and/or valve surgery in a Pennsylvania hospital, return to their state of residence and be readmitted to a hospital in their home state. As such, readmission data would not be available for these patients.
Patients who were discharged in December 2012, because January 2013 data was not available (at the time of analysis) to identify readmissions for these discharges.
Additional exclusions for average hospital charge included:
Patients with invalid or missing charges, including cases with charges that were less than $10,000.
Cases in tracheostomy Diagnostic Related Group (MS-DRG) 003 and Major Diagnostic Category (MDC) 5.
Cases in low volume MS-DRGs, including MS-DRG groups when a particular combination of procedure group/PA region/MS-DRG group had fewer than 10 cases.
Charge outliers, which were determined using the “+/- 3.0 interquartile range” method (after accounting for differences in charges by procedure group, PA region, and MS-DRG group).
Data Table 2 displays exclusion data for each of these outcome measures.
* Clinically complex cases included cases with one of the ICD-9-CM codes in Appendix A (Tables A1, A2, A3, and A4), cases not in the
study MS-DRGs (See Appendix A: Table A5 for MS-DRGs included in the study), and cases granted special request for exclusion.
PHC4 Cardiac Surgery Report July 1, 2011 through December 31, 2012 Data Technical Notes
6
MEASURES REPORTED
Number of Cases The number of cases (after standard exclusions were removed) is reported for hospitals and surgeons for each procedure group.
Risk-Adjusted In-Hospital Mortality Rating In-hospital mortality was identified in the patient discharge record as a discharge status of “20.” The rating identifies whether the hospital’s or surgeon’s observed mortality rate was significantly higher than, significantly lower than, or not significantly different than expected based on patient risk factors. This measure is reported for each hospital and surgeon with 30 or more cases in a particular procedure group.
Risk-Adjusted 30-Day Readmissions Rating A hospital readmission was defined as a rehospitalization to a Pennsylvania GAC hospital within 1 to 30 days of discharge from the hospitalization in which the CABG/valve surgery was performed. A readmission was counted only if the patient was readmitted with a principal diagnosis that indicated a heart-related condition or an infection or complication. (Data Table 3 displays the number of readmissions for each category. Appendix B lists the diagnosis categories and their associated ICD-9-CM codes included in the readmissions analysis.) A hospitalization that resulted in more than one readmission within 30 days was counted only once even though it resulted in multiple readmissions. If, over the study period, a patient had multiple discharges for CABG/valve surgery, each discharge was independently investigated to determine whether it had a readmission within 30 days of that discharge. The readmission analysis included discharges from July 1, 2011 through November 30, 2012. December 2012 data was used to identify 30-day readmissions for patients discharged in November 2012. The rating identifies whether the hospital’s or surgeon’s observed readmission rate was significantly higher than, significantly lower than, or not significantly different than expected based on patient risk factors. This measure is reported for each hospital and surgeon with 30 or more cases in a particular procedure group.
Case-Mix Adjusted Average Hospital Charge The amount a hospital bills for a patient’s care is known as the charge. The charge includes the facility fee for the entire hospitalization during which the CABG/valve surgery was performed (not just the treatment associated with surgery). It does not include professional fees (e.g., physician fees) or other additional post-discharge costs, such as rehabilitation treatment, long-term care and/or home health care. The average charges reported were trimmed and case-mix adjusted. Average charges are reported for each hospital with 11 or more cases in a particular procedure group.
Calendar Year 2011 Average Medicare Fee-for-Service Payment The average Medicare payment is for Medicare fee-for-service (FFS) cases only and is for calendar year 2011, since this was the most recent Medicare payment data available. This timeframe differs somewhat from the cases included in the outcome analyses, which does not include discharges from Quarters 1 and 2, 2011 because hospitals did not begin reporting to PHC4 the supplemental clinical data used for risk adjustment until Quarter 3, 2011.

PHC4 Cardiac Surgery Report July 1, 2011 through December 31, 2012 Data Technical Notes
7
The Medicare payment data for 2011 was provided to PHC4 by the Centers for Medicare and Medicaid Services (CMS) and then matched by PHC4 to the 2011 cardiac surgery cases meeting the study population criteria (after standard exclusions). Only cases where the Medicare payment appeared to be valid ($10,000 or more) were included. The average payment was calculated using the dollar amount that CMS provided for the Medicare Part A hospital insurance fund payment. Patient liabilities (e.g., coinsurance and deductible dollar amounts) were not included. Also not included were payments from Medicare Advantage plans (Medicare HMOs) and any special pass-through payments facilities sometimes receive for unusual capital or other costs. The average payment was calculated by summing the Medicare FFS payment amounts for the cases in a particular procedure group and dividing the sum by the number of cases in that procedure group. Average Medicare payment (along with the number of cases included in the average payment) is reported for hospitals only. To meet current CMS privacy guidelines, average payments (and the number of cases included in the average payment) are only displayed for procedure groups with 11 or more cases. If the number of cases included in the payment analysis for either the Valve without CABG or the Valve with CABG procedure group is less than 11, the number of cases and average payment for both of these procedure groups is not reported. Hospitals were given an opportunity to verify the average Medicare payment reported for their facilities prior to the public release of the information.
Calendar Year 2011 Average Hospital Charge for Medicare Fee-for-Service Cases Case-mix adjusted average charge is reported for the Medicare cases included in the 2011 average Medicare payment. While the same cases included in the average Medicare payment were included in the charge analysis, the final case-mix adjusted average charge may include fewer cases as a result of exclusions specific to the charge analysis. Average charges are not reported when payment information is not reported for a particular procedure group or when there are fewer than 11 cases in the average charge analysis for a particular procedure group.
PHC4 Cardiac Surgery Report July 1, 2011 through December 31, 2012 Data Technical Notes
8
RISK-ADJUSTMENT METHODOLOGY In order to report fair comparisons among hospitals and surgeons, regression techniques were used to construct “risk models” for predicting the risk of mortality or readmission. Each model was a mathematical formula used to ultimately predict a patient’s probability of death or readmission based on relevant risk factors. Cases with these risk factors were given more “credit” in the calculation, leading to a higher predicted probability of mortality or readmission. A hospital’s or surgeon’s predicted rate was the average predicted probability across all its discharges in a particular procedure group. The ratings indicate whether the hospital’s or the surgeon’s mortality or readmission rates were within the expected range or higher or lower than the expected range, taking into account the risk factors that were included in the risk-adjustment models.
Model Development For modeling in-hospital mortality, the reference database included CABG/valve discharges from January 1, 2011 through December 31, 2012 (after exclusions). For 30-day readmissions, the reference database included CABG/valve discharges from January 1, 2011 through November 30, 2012 (after exclusions), because January 2013 data was not available (at the time of analysis) to identify readmissions for these discharges. Data Table 1 displays frequencies for the datasets and statewide outcomes. Identifying potential risk factors. The first step in building the models was to identify potential risk factors, that is, factors that potentially contributed to these events (mortality and readmission). These factors were identified through their importance in past models, review of scientific literature and consideration of high-risk populations. Types of risk factors included procedure group, patient demographics, clinically derived data (i.e., supplemental clinical data, results of medical record reviews for preoperative cardiogenic shock and preoperative acute renal failure, and laboratory test results), and diagnoses and procedures identified by ICD-9-CM codes. Data Tables 4 and 5 display frequency data for the potential risk factors. Definitions for ICD-9-CM code-based variables are available in Appendix C. Using the reference database, potential risk factors were subject to univariate analysis to determine which, because of their potential to predict the event of interest, should be tested for inclusion in the model. Variables were constructed and analyzed as linear (continuous), categorical, and binary as appropriate. For some factors multiple forms of variable construction were analyzed to determine which approach best fit the data (i.e., provided the highest model likelihood). For example,
Patient age was tested as a linear, linear spline with up to two knots, or quadratic factor. The linear spline approach yielded the best results for both models.
Variables representing the percent blockage in a coronary artery were analyzed in all formats—linear, categorical, and binary. Performance of the various variable constructions was compared and the form of the variable with the highest likelihood of predicting the event was selected for testing in the model.
When constructing categorical variables, data was partitioned into a maximum of five categories as appropriate:
For variables with continuous data (e.g., percent blockage in a coronary artery and laboratory test results) one category represented “typical” results with additional categories representative of abnormal results generally associated with increased risk. (In the final model, all records in a specified abnormal category would receive the same amount of credit, regardless of the value within the category.) Records with missing values were combined with records in the typical category.
PHC4 Cardiac Surgery Report July 1, 2011 through December 31, 2012 Data Technical Notes
9
For ICD-9-CM code based categorical variables, one category represented the absence of the risk factor and additional categories represented the presence of diagnosis/procedure codes indicating increased risk for that particular condition (e.g., no diabetes, diabetes with complications, and diabetes without complications).
Categorical and binary variables were selected for testing in the model based on the following criteria:
Minimum volume: For categorical variables, each category represented at least one percent of the total volume. For binary variables, cases with the risk factor were required to represent at least one percent of the total volume. Exceptions were made to this criterion when a variable had particular clinical relevance to the outcome.
Order of risk: For categorical variables, categories farther away from the “typical” category were required to have rates of increasing risk (e.g., when the typical category was defined as level A, categories B, C, D, and E were required to have increasingly higher rates of risk). For binary variables, cases with the risk factor were required to have a higher rate of risk than cases without the risk factor.
Significance: Variables were required to have significance (p<0.10). Exceptions were made to this criterion when a variable had particular clinical relevance to the outcome.
Model selection. Using binary logistic regression, risk factors selected for testing were added to the model in the following order: 1) procedure group and patient demographics (gender, race/ethnicity, age), 2) supplemental clinical data, 3) record review results, 4) laboratory test results, then 5) ICD-9-CM code-based variables. All factors within a risk factor type were evaluated before considering factors from the next type. Risk factors were considered statistically significant in a model if they met the p<0.10 significance criterion and indicated an increase in the risk of the event (in-hospital mortality or 30-day readmission). However, risk factors were evaluated for relevance by considering both mathematical (statistical significance) and clinical perspectives (clinically important populations). Bootstrap validation. Once the model variables were chosen, the model was validated using the bootstrap technique to evaluate the stability of each factor in the prepared model. Using this technique, five hundred sample datasets were randomly generated from the reference database. Records were allowed to appear multiple times in the sample datasets if they were selected repeatedly. The prepared model was then fit to each sample dataset to determine the percent of sample models in which each factor maintained significance (p<0.10). Risk factors at or above a 70% cutoff and those with particular clinical relevance to the outcome (even if below the 70% cutoff) were retained in the final model. This same approach was used to eliminate any factor that did not have a consistently positive numeric value/coefficient (reflective of an increased risk) in at least 70% of the sample models. (See the “Coefficients and Odds Ratios” section for a description of model coefficients.) Measure of Model Adequacy. The c-statistic was used to measure model adequacy. The c-statistic, the measure of “goodness of fit” used to describe a logistic regression model, is a common measure for models with binary dependent variables. For binary outcomes, the c-statistic is defined as the area under the receiver operating characteristic (ROC) curve.* The c-statistic ranges between 0.5 and 1.0, with higher values associated with better discrimination, and can be expressed as a percent ranging from 50% to 100%. In some respects, the c-statistic is similar to the R
2 (Coefficient of Determination) commonly used in linear regression. Both the c-
statistic and R2 approach 1.0 for models that perfectly discriminate. However, unlike R
2, the c-
statistic is not dependent on the frequency of the outcome. The c-statistics for the in-hospital mortality and 30-day readmissions models are listed in Data Tables 6 and 7, respectively.
* Hanley, J. A., & McNeil, B. J. (1982). The meaning and use of the area under a receiver operating characteristic (ROC) curve.
Radiology, 143(1), 29-36.

PHC4 Cardiac Surgery Report July 1, 2011 through December 31, 2012 Data Technical Notes
10
Coefficients and Odds Ratios. Coefficients are mathematical values derived from the regression analysis that correspond to a given level of risk. They are used in the mathematical formula that calculates a patient’s overall predicted risk of the event (mortality or readmission). The odds ratios are used to interpret the impact of the risk factors on the probability of the event. For a binary variable, the odds ratio is the change in the odds for a patient with the risk factor compared to a patient without it. For example, in the in-hospital mortality model, the odds ratio for ASA Class 5 is 2.474, meaning that a patient with ASA Class 5 was more than two times as likely to die during the hospital admission than patients in ASA Class 1, 2, 3, or 4. The coefficients and odds ratios for each risk factor included in the mortality and readmission models are listed in Data Tables 6 and 7, respectively.
Calculating Statistical Ratings Separate analyses were performed to determine, for each hospital and surgeon, the actual percent of in-hospital mortality and the actual percent of 30-day readmissions with a principal diagnosis that indicated a heart-related condition or complication or infection. For mortality and readmissions, significance tests were conducted to determine whether the difference between a hospital’s or surgeon’s actual and expected values was too large to be attributed solely to chance. These results were displayed as ratings. Ratings were reported for hospitals and surgeons with 30 or more cases in a particular procedure group. Determining Actual Values
In-Hospital Mortality Percent
This percent was determined by dividing the total number of hospitalizations in which the patient died by the number of hospitalizations in the mortality analysis for a particular procedure group.
30-Day Readmission Percent
This percent was determined by dividing the number of hospitalizations for which the patient was readmitted at least once (with a principal diagnosis that indicated a heart-related condition or an infection or complication*)
to any Pennsylvania GAC
hospital within 1 to 30 days of discharge, by the total number of hospitalizations included in the readmissions analysis for a particular procedure group.
Determining Expected Values The final risk models estimated the relative effects (βn) that each of the risk factors had on the relevant outcome value for each hospitalization. The model equations took the following form:
βX = β0 + β1x1 + β2x2 + β3x3 + . . . βnxn where:
βn = the relevant model coefficient (β0 is the intercept) xn = the value of the risk factor for a hospitalization
These models were then used to calculate the predicted values (e.g., predicted probability of death or readmission) for each individual hospitalization (after exclusions). The risk factor values (X) were multiplied by the model coefficients (β) and summed to determine the value βX for each hospitalization. Using logistic regression modeling, the predicted value was calculated as:
* See Appendix B for definitions.

PHC4 Cardiac Surgery Report July 1, 2011 through December 31, 2012 Data Technical Notes
11
βX
βX
e1
ep
where e 2.7182818285 The expected value for an individual hospital or surgeon was the average of these predicted values for all hospitalizations for particular hospital or surgeon. Determining Statistical Ratings Statistical evaluation was used to determine whether the difference between a hospital’s or surgeon’s observed and expected values was too large to be attributed solely to chance. Significance tests (using test statistics and p-values as described below) were performed to account for random variation. The test statistic was calculated using the following equations:
z = (Actual – Expected) / Standard Deviation
With standard deviation being calculated as follows:
Step 1: Compute the estimated variance of the event for each patient (VARPAT):
VARPAT = (p) (1-p)
Step 2: Calculate the Standard Deviation of Mortality
SUMVAR = sum of VARPAT across all cases
Standard Deviation of Mortality = square root of SUMVAR
A two-tailed p-value was calculated using the test statistic above as a normal z-score. Assignment of Statistical Ratings Differences between actual and expected values were considered to be statistically significant when p-values were <0.05. A statistical rating of higher than expected or lower than expected was assigned to each hospital or surgeon if the difference between what was observed and what was expected in a particular procedure group was statistically significant.
If the p-value was <0.05 and the test statistic was <0, then the conclusion was made that the difference between the expected and actual number of events was statistically significant and fewer than the expected number of events had occurred. The hospital or surgeon was assigned the symbol “” (as shown in the cardiac surgery report).
If the p-value was <0.05 and the test statistic was >0, then the conclusion was made that the difference between the expected and actual number of events was statistically significant and more than the expected number of events had occurred. The hospital or surgeon was assigned the symbol “” (as shown in the cardiac surgery report).
If the calculated p-value was greater than or equal to 0.05, then the conclusion was made that the difference between the expected and actual number of events was not statistically significant. In this case the hospital or surgeon was assigned the symbol “” (as shown in the cardiac surgery report).
See Appendix D for an example of logistic regression and calculation of statistical ratings.

PHC4 Cardiac Surgery Report July 1, 2011 through December 31, 2012 Data Technical Notes
12
CASE-MIX ADJUSTMENT METHODOLOGY Charges were adjusted to account for differences in charges across regions of Pennsylvania and hospital variation in the mix of cases across MS-DRGs. Average charges were trimmed for outliers and case-mix adjusted for each of the three procedure groups (CABG without Valve, Valve without CABG, and Valve with CABG) separately. A case-mix adjusted charge is reported for hospitals only, for each procedure group in which the hospital had 11 or more cases in the analysis after all exclusions satisfied.
Construction of Reference Database After standard exclusions and cases with invalid charges, cases in tracheostomy MS-DRG (003) and MDC 5, and cases in low volume MS-DRGs were removed, the reference database was constructed by assigning each case to the appropriate procedure group/PA region/MS-DRG group combination based on the hospital’s geographic location and the MS-DRG assignment for the case. Then cases in procedure group/PA region/MS-DRG group combinations with less than 10 cases were excluded. Then trimming was performed. Patients who underwent CABG without valve procedures were comprised of the following MS-DRG groups:
MS-DRG Group 1
MS-DRG 231 Coronary Bypass with PTCA with MCC
MS-DRG 232 Coronary Bypass with PTCA without MCC
MS-DRG Group 2
MS-DRG 233 Coronary Bypass with Cardiac Catheterization with MCC
MS-DRG 234 Coronary Bypass with Cardiac Catheterization without MCC
MS-DRG Group 3
MS-DRG 228 Other Cardiothoracic Procedures with MCC
MS-DRG 229 Other Cardiothoracic Procedures with CC
MS-DRG 230 Other Cardiothoracic Procedures without CC/MCC
MS-DRG Group 4
MS-DRG 235 Coronary Bypass without Cardiac Catheterization with MCC
MS-DRG 236 Coronary Bypass without Cardiac Catheterization without MCC
Patients who underwent valve procedures with or without CABG procedures were comprised of the following MS-DRG groups:
MS-DRG Group 5
MS-DRG 216 Cardiac Valve and Other Major Cardiothoracic Procedures with Cardiac Catheterization with MCC
MS-DRG 217 Cardiac Valve and Other Major Cardiothoracic Procedures with Cardiac Catheterization with CC
MS-DRG 218 Cardiac Valve and Other Major Cardiothoracic Procedures with Cardiac Catheterization without CC/MCC
MS-DRG Group 6
MS-DRG 219 Cardiac Valve and Other Major Cardiothoracic Procedures without Cardiac Catheterization with MCC
MS-DRG 220 Cardiac Valve and Other Major Cardiothoracic Procedures without Cardiac Catheterization with CC
MS-DRG 221 Cardiac Valve and Other Major Cardiothoracic Procedures without Cardiac Catheterization without CC/MCC
Trim Methodology Trimming was used to remove outlier charges from the study population. Identification of outliers eliminates extreme values that may have a significant and unrepresentative impact on the average.
PHC4 Cardiac Surgery Report July 1, 2011 through December 31, 2012 Data Technical Notes
13
Since charges varied dramatically among regions, upper and lower trim points were calculated at the regional level for each MS-DRG group within each procedure group. Cases with charges that were below the lower trim point or above the upper trim point were excluded from further analysis. For this analysis, upper and lower trim points were calculated using the “+/- 3.0 interquartile range” method. This non-parametric methodology was used because, historically, the distribution for charges does not follow a normal “bell-shaped” pattern. Trim points were determined as follows:
Q1 = the first quartile (25th percentile total charge) of all patient records from the comparative database in a particular category
Q3 = the third quartile (75th
percentile total charge) of all patient records from the comparative database in a particular category
IQR = Q3 – Q1
Lower Trim Point = Q1 – (3.0 x IQR)
Upper Trim Point = Q3 + (3.0 x IQR)
Determining Actual Charges The actual average charge (Average ActChg) was determined as the average (arithmetic mean) charge for the hospitalizations included in the hospital’s charge analysis for a particular procedure group.
Determining Expected Charges The expected charge (ExpChg) for a hospitalization was equal to the average charge for all hospitalizations in that particular region/MS-DRG group combination for a particular procedure group. The hospital’s expected charge was determined as the average (arithmetic mean) of the expected charges for the hospitalizations included in the hospital’s charge analysis for a particular procedure group:
Average ExpChg = Σ ExpChg
n
Determining Case-Mix Adjusted Charges The case-mix adjusted charge was calculated by dividing the average actual charges (Average ActChg) by the average expected charge (Average ExpChg) for the hospital, and then multiplying this quantity by the average charge for the hospital’s region for the relevant procedure group:
Average ActChg (Average Actual Charge for a particular region)
Average ExpChg
See Appendix E for an example of how case-mix adjusted charges were computed.
PHC4 Cardiac Surgery Report July 1, 2011 through December 31, 2012 Data Technical Notes
DATA TABLES
14
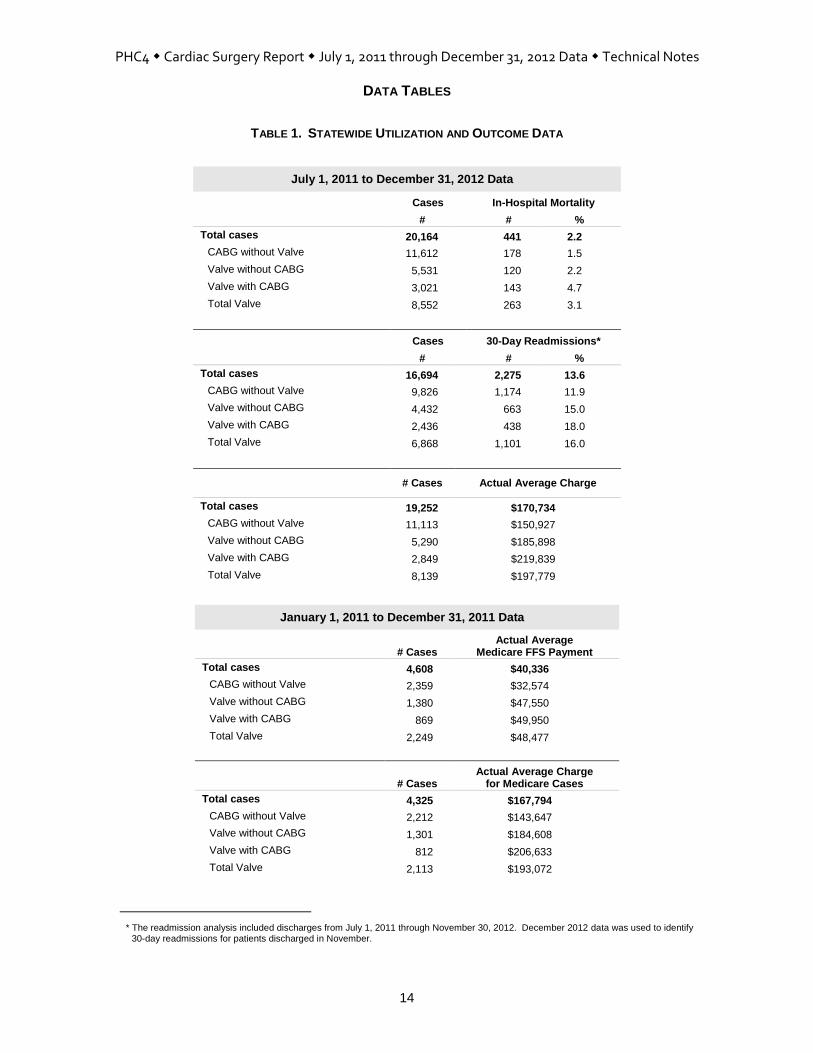
TABLE 1. STATEWIDE UTILIZATION AND OUTCOME DATA
July 1, 2011 to December 31, 2012 Data
Cases In-Hospital Mortality
# # %
Total cases 20,164 441 2.2
CABG without Valve 11,612 178 1.5
Valve without CABG 5,531 120 2.2
Valve with CABG 3,021 143 4.7
Total Valve 8,552 263 3.1
Cases 30-Day Readmissions*
# # %
Total cases 16,694 2,275 13.6
CABG without Valve 9,826 1,174 11.9
Valve without CABG 4,432 663 15.0
Valve with CABG 2,436 438 18.0
Total Valve 6,868 1,101 16.0
# Cases Actual Average Charge
Total cases 19,252 $170,734
CABG without Valve 11,113 $150,927
Valve without CABG 5,290 $185,898
Valve with CABG 2,849 $219,839
Total Valve 8,139 $197,779
January 1, 2011 to December 31, 2011 Data
# Cases Actual Average
Medicare FFS Payment
Total cases 4,608 $40,336
CABG without Valve 2,359 $32,574
Valve without CABG 1,380 $47,550
Valve with CABG 869 $49,950
Total Valve 2,249 $48,477
# Cases Actual Average Charge
for Medicare Cases
Total cases 4,325 $167,794
CABG without Valve 2,212 $143,647
Valve without CABG 1,301 $184,608
Valve with CABG 812 $206,633
Total Valve 2,113 $193,072
* The readmission analysis included discharges from July 1, 2011 through November 30, 2012. December 2012 data was used to identify
30-day readmissions for patients discharged in November.

PHC4 Cardiac Surgery Report Quarter 3, 2011 to Quarter 4, 2012 Data Technical Notes
DATA TABLES
15
TABLE 2. EXCLUSION DATA
Table 2A. In-Hospital Mortality Exclusions
Cases In-Hospital Mortality
# % # %
July 1, 2011 to December 31, 2012 Data
Total cases prior to in-hospital mortality exclusions 22,919 100.0 642 2.8
Exclusions:
Patients <30 years of age 155 0.7 6 3.9
Patients who left against medical advice 13 0.1 0 0.0
Clinically complex cases1 2,587 11.3 195 7.5
Total exclusions 2,755 12.0 201 7.3
Total cases remaining in analysis 20,164 88.0 441 2.2
1 Clinically complex cases included cases with one of the ICD-9-CM codes in Appendix A (Tables A1, A2, A3, and A4), cases not in the study MS-DRGs (See Appendix A: Table A5 for MS-DRGs included in the study), and cases granted special request for exclusion.
Table 2B. 30-Day Readmissions Exclusions
Cases 30-Day
Readmissions
# % # %
July 1, 2011 to November 30, 2012 Data
Total cases after in-hospital mortality exclusions 20,164 100.0 – –
Additional exclusions:
Patients who died during hospitalization in which surgery was performed
441 2.2 – –
Cases with invalid data1 237 1.2 – –
Out-of state residents2 1,765 8.8 – –
December 2012 Discharges3 1,027 5.1
Total exclusions 3,470 17.2 – –
Total cases remaining in analysis 16,694 82.8 2,275 13.6
1 Cases with invalid data (i.e., social security number, date of birth, or sex) could not be linked to subsequent hospitalizations.
2 Out-of-state residents were excluded because such patients could undergo a CABG and/or valve surgery in a Pennsylvania hospital, return to their state of residence and be readmitted to a hospital in their home state. Therefore, readmission data would not be available for these patients.
3 Patients who were discharged in December 2012 were excluded because January 2013 data was not available (at the time of analysis) to identify readmissions for these discharges.

PHC4 Cardiac Surgery Report Quarter 3, 2011 to Quarter 4, 2012 Data Technical Notes
DATA TABLES
16
TABLE 2. EXCLUSION DATA CONTINUED
Table 2C. Average Charge Exclusions
Cases Average Charge # %
July 1, 2011 to December 31, 2012 Data
Total cases after in-hospital mortality exclusions 20,164 100.0 $190,346
Additional exclusions:
Patients with invalid or missing charges1 0 – –
Cases in tracheostomy MS-DRG2 422 2.1 $620,985
Cases in low volume MS-DRGs3 184 0.9 $480,162
Cases that were charge outliers4 306 1.5 $656,066
Total exclusions 912 4.5 –
Total cases remaining in analysis 19,252 95.5 $170,734
Average Charge Analysis for 2011 Average Medicare Payment Cases
Total cases after in-hospital mortality exclusions 4,608 100.0 $189,701
Additional exclusions:
Patients with invalid or missing charges1 1 <0.1 $237
Cases in tracheostomy MS-DRG2 110 2.4 $613,588
Cases in low volume MS-DRGs3 80 1.7 $290,691
Cases that were charge outliers4 92 2.0 $626,977
Total exclusions 283 6.1 –
Total cases remaining in analysis 4,325 93.9% $167,794
1 Invalid/missing charges included cases with charges that were less than $10,000.
2 Tracheostomy cases were assigned to MS-DRG 003 and MDC 5.
3 MS-DRGs with low volume, including MS-DRG groups when a particular combination of procedure group/PA region/MS-DRG group had fewer than 10 cases.
4 Charge outliers were determined using the “+/- 3.0 interquartile range” method—after accounting for differences in charges by procedure group, PA region, and MS-DRG group.

PHC4 Cardiac Surgery Report Quarter 3, 2011 to Quarter 4, 2012 Data Technical Notes
DATA TABLES
17
TABLE 3. 30-DAY READMISSIONS DATA N = 2,275
# %
CIRCULATORY SYSTEM 1,045 45.9
Cardiac Dysrhythmias 270 11.9
Heart Block 6 0.3
Paroxysmal Tachycardia 15 0.7
Atrial Fibrillation and Atrial Flutter 214 9.4
Ventricular Fibrillation and Ventricular Flutter 6 0.3
Premature Heart Beats 2 0.1
Other Cardiac Dysrhythmias 27 1.2
Heart Failure 361 15.9
Functional Disturbances Follow Cardiac Surgery (Postcardiotomy Syndrome) 66 2.9
Hypertension and Hypotension 43 1.9
Hypertension 3 0.1
Hypotension 40 1.8
Myocardial Infarction and Ischemia 48 2.1
Acute Myocardial Infarction, Initial Episode 42 1.8
Acute Myocardial Infarction, Unspecified or Subsequent Episode 0 0.0
Other Forms of Myocardial Ischemia 6 0.3
Angina Pectoris and Chest Pain 53 2.3
Atherosclerosis 37 1.6
Coronary Atherosclerosis 24 1.1
Other Atherosclerosis 13 0.6
Heart Aneurysm and Dissection 0 0.0
Endocarditis, Myocarditis, and Pericarditis 56 2.5
Heart Valve Disease 1 <0.1
Mitral Valve Disease 0 0.0
Aortic Valve Disease 1 <0.1
Tricuspid Valve Disease 0 0.0
Pulmonary Valve Disease 0 0.0
Multiple Valve Disease 0 0.0
Other Endocardial Structure Disease 0 0.0
Cardiomyopathies 0 0.0
Other Aneurysm and Dissection 4 0.2
Aortic Aneurysm and Dissection 3 0.1
Other Arterial Aneurysm 1 <0.1
Other Arterial Dissection 0 0.0
Arterial Embolism and Thrombosis 4 0.2
Abdominal and Thoracic Aorta 0 0.0

PHC4 Cardiac Surgery Report Quarter 3, 2011 to Quarter 4, 2012 Data Technical Notes
DATA TABLES
18
TABLE 3. 30-DAY READMISSIONS DATA N = 2,275
# %
Arteries of the Extremities 4 0.2
Other Arteries Excluding Precerebral and Cerebral Arteries 0 0.0
Venous Embolism and Thrombosis 22 1.0
Lower Extremity Venous Embolism and Thrombosis 16 0.7
Renal Vein Embolism and Thrombosis 0 0.0
Other Venous Embolism and Thrombosis 6 0.3
Phlebitis and Thrombophlebitis 1 <0.1
Lower Extremity Phlebitis and Thrombophlebitis 1 <0.1
Upper Extremity Phlebitis and Thrombophlebitis 0 0.0
Other Vessel Phlebitis and Thrombophlebitis 0 0.0
Occlusion and Stenosis 7 0.3
Precerebral Artery Occlusion and Stenosis 2 0.1
Cerebral Artery Occlusion and Stenosis 5 0.2
Retinal Artery Occlusion and Visual Loss 0 0.0
Stroke 64 2.8
Ischemic Stroke 42 1.8
Hemorrhagic Stroke 5 0.2
Transient Cerebral Ischemia 14 0.6
Postoperative Stroke 3 0.1
Other Diseases and Symptoms of the Circulatory System 8 0.4
RESPIRATORY SYSTEM 285 12.5
Pulmonary Embolism and Infarction 73 3.2
Pulmonary Embolism and Infarction 53 2.3
Postoperative Pulmonary Embolism and Infarction 20 0.9
Pleural Effusion and Atelectasis 130 5.7
Pneumothorax 7 0.3
Pneumothorax 6 0.3
Postoperative Pneumothorax 1 <0.1
Pulmonary Edema 2 0.1
Acute Respiratory Failure 53 2.3
Other Diseases and Symptoms of the Respiratory System 20 0.9
NERVOUS SYSTEM 65 2.9
Encephalopathies 5 0.2
Cerebral Edema and Brain Compression 0 0.0
Anoxic Brain Damage 0 0.0
Coma and Stupor 2 0.1

PHC4 Cardiac Surgery Report Quarter 3, 2011 to Quarter 4, 2012 Data Technical Notes
DATA TABLES
19
TABLE 3. 30-DAY READMISSIONS DATA N = 2,275
# %
Postoperative Pain 14 0.6
Other Diseases and Symptoms of the Nervous System 44 1.9
DIGESTIVE SYSTEM 90 4.0
Ischemic Bowel and Vascular Insufficiency of the Intestine 5 0.2
Intestinal Obstruction and Ileus 8 0.4
Ulceration, Bleeding and Perforation of the Digestive System 63 2.8
Acute Liver Failure 1 <0.1
Other Diseases and Symptoms of the Digestive System 13 0.6
URINARY SYSTEM 51 2.2
Acute Glomerulonephritis and Pyelonephritis 0 0.0
Nephrotic Syndrome 0 0.0
Acute Renal Failure 48 2.1
Other Diseases and Symptoms of the Urinary System 3 0.1
COMPLICATIONS OF SURGICAL AND MEDICAL CARE 248 10.9
Mechanical Complication of Cardiac Device, Implant and Graft 7 0.3
Mechanical Complication of Cardiac Pacemaker and AICD 0 0.0
Mechanical Complication of Heart Valve Prosthesis 3 0.1
Mechanical Complication of Coronary Artery Bypass Graft 3 0.1
Other and Unspecified Mechanical Complication 1 <0.1
Other Complication of Internal Prosthetic Device, Implant and Graft 19 0.8
Other Complication of Heart Valve Prosthesis 2 0.1
Other Complication of Other Cardiac Device, Implant and Graft 13 0.6
Other Complicaton of Vascular Device, Implant and Graft 4 0.2
Shock 0 0.0
Postoperative Shock 0 0.0
Cardiogenic Shock 0 0.0
Other Shock 0 0.0
Hemorrhage and Hematoma Complicating a Procedure 26 1.1
Foreign Body Accidentally Left or Accidental Laceration During a Procedure 2 0.1
Dehiscence and Rupture of Operation Wound 40 1.8
Other Complications of Surgical and Medical Care 154 6.8
Nervous System Complication 0 0.0
Circulatory System Complication 97 4.3
Respiratory System Complication 51 2.2
Digestive System Complication 1 <0.1
Urinary System Complication 1 <0.1

PHC4 Cardiac Surgery Report Quarter 3, 2011 to Quarter 4, 2012 Data Technical Notes
DATA TABLES
20
TABLE 3. 30-DAY READMISSIONS DATA N = 2,275
# %
Other Complications 4 0.2
INFECTIONS 418 18.4
Postoperative Infections 157 6.9
Sepsis and Bacteremia 85 3.7
Pneumonia 87 3.8
Pneumonia 72 3.2
Aspiration Pneumonia 15 0.7
Empyema and Abscess of Lung 2 0.1
Infection due to Device, Implant and Graft 15 0.7
Cardiac Device, Implant and Graft 6 0.3
Vascular Device, Implant and Graft 5 0.2
Other and Unspecified Infections due to Device, Implant and Graft 4 0.2
Urinary Tract Infection 26 1.1
Cellulitis 20 0.9
Osteomyelitis 0 0.0
Intestinal Infection due to Clostridium difficile 15 0.7
Other Infection Related Conditions and Symptoms 11 0.5
FLUID AND ELECTROLYTE IMBALANCE 26 1.1
Hyperosmolality and Hyposmolality 3 0.1
Acidosis and Alkalosis 0 0.0
Dehydration and Hypovolemia 18 0.8
Fluid Overload 4 0.2
Hyperpotassemia and Hypopotassemia 1 <0.1
Other Electrolyte and Fluid Disorders 0 0.0
ANEMIA AND COAGULATION DEFECTS 47 2.1
Anemia 28 1.2
Acute Posthemorrhagic Anemia 14 0.6
Anemia 14 0.6
Coagulation Defects 19 0.8
Hemorrhagic Disorders due to Anticoagulants 0 0.0
Thrombocytopenia 11 0.5
Other Coagulation Defects 8 0.4
PHC4 Cardiac Surgery Report Quarter 3, 2011 to Quarter 4, 2012 Data Technical Notes
DATA TABLES
21
TABLE 4. FREQUENCY DATA FOR POTENTIAL RISK FACTORS – IN-HOSPITAL MORTALITY
Candidate Variable
Cases N = 20,164
In-Hospital Mortality 2.2%
Number Percent Number Percent
Variables tested and retained in the model.
Procedure Group Factor
CABG without Valve 11,612 57.6% 178 1.5%
Valve without CABG 5,531 27.4% 120 2.2%
Valve with CABG 3,021 15.0% 143 4.7%
Demographic Factors
Age (continuous) 20,164 Average Age – 67.5 (Female 69.5, Male 66.4)
Age – Number of Years >60 (continuous) 14,842 73.6% 385 2.6%
Sex
Male 13,406 66.5% 254 1.9%
Female 6,758 33.5% 187 2.8%
Clinically Derived Factors
American Society of Anesthesiologists (ASA) Class 51 137 0.7% 21 15.3%
ASA Emergency Indicator 993 4.9% 58 5.8%
Ejection Fraction
<20% 357 1.8% 24 6.7%
20 to 39% 2,707 13.4% 111 4.1%
Left Main Stenosis – Number of Percentage Points >49% (continuous)
4,395 21.8% 115 2.6%
Preoperative Acute Renal Failure 222 1.1% 24 10.8%
Preoperative Cardiogenic Shock 153 0.8% 35 22.9%
Right Coronary Artery Stenosis – Number of Percentage Points >49% (continuous)
11,245 55.8% 263 2.3%
Sodium 0 to <131 mEq/L 238 1.2% 21 8.8%
ICD-9-CM Code Factors
AMI Initial Episode of Care 3,613 17.9% 129 3.6%
Chronic Kidney Disease
Stage I to IV (mild to severe) 2,972 14.7% 119 4.0%
Stage V to End Stage Renal Disease (failure) 424 2.1% 31 7.3%
Excision of Other Lesion2 Same Day as First Valve with or
without CABG 682 3.4% 29 4.3%
Heart Failure 5,866 29.1% 255 4.3%
Heart Valve Disease 3,649 18.1% 146 4.0%
History of CABG or Valve Surgery 1,211 6.0% 48 4.0%
History of Peripheral Vascular Disease 2,996 14.9% 96 3.2%
Liver Disease 412 2.0% 29 7.0%
Malnutrition 929 4.6% 68 7.3%
Morbid Obesity 1,737 8.6% 40 2.3%
Other Open Heart Procedure Same Day as First CABG/Valve Surgery
715 3.5% 39 5.5%
Oxygen Therapy Dependence (long-term) 386 1.9% 35 9.1%
PTCA/Stent Prior to First CABG/Valve Surgery Date 296 1.5% 19 6.4%
PTCA/Stent Same Day as First CABG/Valve Surgery 170 0.8% 14 8.2%
Variables tested, but not retained in the model.
Clinically Derived Factors
Albumin 0 to <3.1 g/dL 510 2.5% 32 6.3%
Alkaline Phosphatase ≥116 U/L 531 2.6% 32 6.0%
AST ≥61 U/L 688 3.4% 29 4.2%
Bilirubin ≥1.1 mg/dL 984 4.9% 37 3.8%
BNP ≥101 pg/mL / ProBNP ≥1001 pg/mL3 1,378 6.8% 77 5.6%
BUN ≥26 mg/dL 1,943 9.6% 112 5.8%
Calcium 0 to <8.5 mg/dL 1,329 6.6% 62 4.7%
PHC4 Cardiac Surgery Report Quarter 3, 2011 to Quarter 4, 2012 Data Technical Notes
DATA TABLES
22
Candidate Variable
Cases N = 20,164
In-Hospital Mortality 2.2%
Number Percent Number Percent
TABLE 4. FREQUENCY DATA FOR POTENTIAL RISK FACTORS – IN-HOSPITAL MORTALITY CONTINUED CPK-MB ≥5 ng/mL / Troponin I ≥0.41 ng/mL
4 2,649 13.1% 90 3.4%
Creatinine ≥1.5 mg/dL 1,398 6.9% 78 5.6%
Glucose ≥241 mg/dL 1,503 7.5% 53 3.5%
Hemoglobin 0 to <11.1 g/dL 1,630 8.1% 73 4.5%
pH 0 to <7.36 (arterial) 333 1.7% 17 5.1%
Platelet Count 0 to <150.1 109/L 1,420 7.0% 50 3.5%
Potassium
0 to <3.3 mEq/L 275 1.4% 14 5.1%
≥5.0 mEq/L 526 2.6% 26 4.9%
PT ≥13.1 sec / INR ≥1.11 (ratio) 5 2,204 10.9% 92 4.2%
PTT ≥55.1 sec 1,622 8.0% 60 3.7%
WBC ≥14.2 109/L 640 3.2% 39 6.1%
ICD-9-CM Code Factors
Anemia 837 4.2% 35 4.2%
Cardiac Adhesions 200 1.0% 10 5.0%
Cardiomyopathy 1,783 8.8% 55 3.1%
Cerebrovascular Disease 1,266 6.3% 38 3.0%
Chronic Lung Disease 3,634 18.0% 104 2.9%
Chronic Pulmonary Hypertension 2,340 11.6% 91 3.9%
Coronary Artery Disease 1,989 9.9% 57 2.9%
Excision of Left Atrial Appendage (LAA)6 Same Day as First
Valve with or without CABG 651 3.2% 28 4.3%
History of Pacemaker or Defibrillator 911 4.5% 36 4.0%
Intra-Aortic Balloon Pump Prior to First CABG/Valve Surgery Date
743 3.7% 28 3.8%
Ischemic Heart Disease 1,938 9.6% 65 3.4%
Multiple Valve Same Day as First CABG/Valve Surgery 1,090 5.4% 55 5.0%
Osteoporosis 550 2.7% 17 3.1%
Type of Valve Procedure – Aortic, Same Day as First CABG/Valve Surgery
5,221 25.9% 138 2.6%
Type of Valve Procedure – Mitral, Same Day as First CABG/Valve Surgery
1,739 8.6% 55 3.2%
Valve Replacement Same Day as First CABG/Valve Surgery 6,744 33.4% 229 3.4%
Variables considered, but not tested in the initial model because initial analysis did not indicate that they were predictive of mortality for this particular data set.
Demographic Factors
Race/Ethnicity
Black 990 4.9% 24 2.4%
Hispanic 505 2.5% 14 2.8%
Other 1,068 5.3% 24 2.2%
White 17,601 87.3% 379 2.2%
Clinically Derived Factors
Circumflex (and branches) Percent Stenosis A 80%-100% 7,812 38.7% 171 2.2% B 50%-79% 3,011 14.9% 66 2.2% C 1%-49% 2,104 10.4% 42 2.0% D 0% 2,086 10.3% 39 1.9% Missing 5,151 25.5% 123 2.4%
Left Anterior Descending (and branches) Percent Stenosis A 80%-100% 9,792 48.6% 202 2.1% B 50%-79% 3,370 16.7% 74 2.2% C 1%-49% 1,869 9.3% 49 2.6% D 0% 1,458 7.2% 24 1.6% Missing 3,675 18.2% 92 2.5%
PHC4 Cardiac Surgery Report Quarter 3, 2011 to Quarter 4, 2012 Data Technical Notes
DATA TABLES
23
Candidate Variable
Cases N = 20,164
In-Hospital Mortality 2.2%
Number Percent Number Percent
TABLE 4. FREQUENCY DATA FOR POTENTIAL RISK FACTORS – IN-HOSPITAL MORTALITY CONTINUED
Base Units (mEq/L) (arterial)
A <-11.4 22 0.1% 1 4.5%
B -11.4 to <-4.9 119 0.6% 6 5.0%
C -4.9 to <-1.6 252 1.2% 8 3.2%
D -1.6 to <8.1 (typical) 1,032 5.1% 28 2.7%
E ≥8.1 23 0.1% 1 4.3%
Missing 18,716 92.8% 397 2.1%
Bicarbonate (mEq/L) (arterial)
A 0 to <18 66 0.3% 5 7.6%
B 18 to <22 247 1.2% 9 3.6%
C 22 to <27 (typical) 894 4.4% 18 2.0%
D 27 to <31 273 1.4% 8 2.9%
E ≥31 35 0.2% 2 5.7%
Missing 18,649 92.5% 399 2.1%
CPK (U/L)
A 0 to <26 46 0.2% 1 2.2%
B 26 to <36 113 0.6% 6 5.3%
C 36 to <301 (typical) 2,821 14.0% 92 3.3%
D 301 to <501 340 1.7% 6 1.8%
E ≥501 500 2.5% 19 3.8%
Missing 16,344 81.1% 317 1.9%
Neutrophils Band (%)
A 0 to <7 (typical) 402 2.0% 19 4.7%
B 7 to <14 67 0.3% 2 3.0%
C 14 to <23 14 0.1% 0 0.0%
D 23 to <33 6 <0.1% 0 0.0%
E 33 to100 7 <0.1% 1 14.3%
Missing 19,668 97.5% 419 2.1%
O2 Sat / pO2 (mmHg) (arterial) 7
O2 Sat pO2
A 0 to <79 A 0 to <45.1 76 0.4% 9 11.8%
B 79 to <86 B 45.1 to <50.1 28 0.1% 1 3.6%
C 86 to <90 C 50.1 to <55.1 36 0.2% 0 0.0%
D 90 to <99 (typical) D 55.1 to <141 (normal)
1,440 7.1% 37 2.6%
E 99 to 100 E ≥141 134 0.7% 6 4.5%
Missing Missing 18,450 91.5% 388 2.1%
pCO2 (mmHg) (arterial)
A 0 to <31 141 0.7% 10 7.1%
B 31 to <36 333 1.7% 10 3.0%
C 36 to <51 (typical) 1,063 5.3% 23 2.2%
D 51 to <61 79 0.4% 5 6.3%
E ≥61 40 0.2% 3 7.5%
Missing 18,508 91.8% 390 2.1%
ICD-9-CM Code Factors
AMI Subsequent Episode of Care 348 1.7% 8 2.3%
Alcohol-Related Disorders 493 2.4% 8 1.6%
Angina 1,059 5.3% 8 0.8%
Angina, Unstable 2,933 14.5% 33 1.1%
Cancer 589 2.9% 18 3.1%
Cancer of the Respiratory System and Intrathoracic Organs 40 0.2% 2 5.0%
Cardiac Assist Device Prior to First CABG/Valve Surgery Date 11 0.1% 0 0.0%
Cardiopulmonary Resuscitation (CPR) Prior to First CABG/Valve Surgery Date
46 0.2% 0 0.0%
PHC4 Cardiac Surgery Report Quarter 3, 2011 to Quarter 4, 2012 Data Technical Notes
DATA TABLES
24
Candidate Variable
Cases N = 20,164
In-Hospital Mortality 2.2%
Number Percent Number Percent
TABLE 4. FREQUENCY DATA FOR POTENTIAL RISK FACTORS – IN-HOSPITAL MORTALITY CONTINUED
Coagulopathy 176 0.9% 5 2.8%
Congenital Heart Anomalies 978 4.9% 18 1.8%
Dental Extraction Prior to First CABG/Valve Surgery Date 132 0.7% 7 5.3%
Diabetes 7,577 37.6% 150 2.0%
Extracorporeal Membrane Oxygenation (ECMO) Prior to First CABG/Valve Surgery Date
5 <0.1% 2 40.0%
Gastroparesis 87 0.4% 2 2.3%
History of Cancer 2,252 11.2% 35 1.6%
History of Chronic Steroid Use 144 0.7% 3 2.1%
History of Lower Extremity Amputation 153 0.8% 6 3.9%
History of PTCA/Stent 2,810 13.9% 44 1.6%
History of Stroke 1,582 7.8% 36 2.3%
History of Thrombosis or Embolism 602 3.0% 12 2.0%
Hypercholesterolemia 14,258 70.7% 216 1.5%
Hypertension 12,824 63.6% 187 1.5%
Illegal Drug-Related Disorders 206 1.0% 1 0.5%
Long-term Use of Anticoagulants and Antiplatelets 1,482 7.3% 19 1.3%
Long-term Use of Insulin 940 4.7% 14 1.5%
Lupus Erythematosus, Systemic 78 0.4% 1 1.3%
Mental Disorders 3,338 16.6% 61 1.8%
Myocardial Infarction, Old 2,660 13.2% 41 1.5%
Non-Invasive Mechanical Ventilation (NIMV) Prior to First CABG/Valve Surgery Date
78 0.4% 4 5.1%
Obstructive Sleep Apnea and Obesity-Related Hypoventilation Syndrome
2,178 10.8% 40 1.8%
Percutaneous Valve Replacement Prior to First CABG/Valve Surgery Date
0 0.0% 0 0.0%
Percutaneous Valve Replacement Same Day as First CABG/Valve Surgery
24 0.1% 3 12.5%
Type of Valve Procedure – Annuloplasty, Same Day as First CABG/Valve Surgery
515 2.6% 12 2.3%
Type of Valve Procedure – Pulmonary, Same Day as First CABG/Valve Surgery
20 0.1% 0 0.0%
Type of Valve Procedure – Tricuspid, Same Day as First CABG/Valve Surgery
46 0.2% 5 10.9%
1 ASA Class 5 refers to a moribund (state of near-death) patient who is not expected to survive without the operation.
2 Excision of Other Lesion includes procedures to treat cardiac dysrhythmias using electrical current, freezing, or cutting (cardiac
ablation) and procedures to remove cardiac lesions (tumor, cyst, or mass). 3 The BNP and pro-BNP analytes were combined to one factor. If a record had both test results, then the factor was based on
the BNP. 4 The CPK-MB and Troponin I analytes were combined to one factor. If a record had both test results, then the factor was based
on the Troponin I. 5 The PT and INR analytes were combined to one factor. If a record had both test results, then the factor was based on the INR.
6 Closure of a small pouch in the left atrium (left upper chamber in heart) to prevent strokes in patients with atrial fibrillation.
7 O2 Saturation and pO2 were combined to one factor. If a record had both test results, then the factor is based on the pO2.

PHC4 Cardiac Surgery Report Quarter 3, 2011 to Quarter 4, 2012 Data Technical Notes
DATA TABLES
25
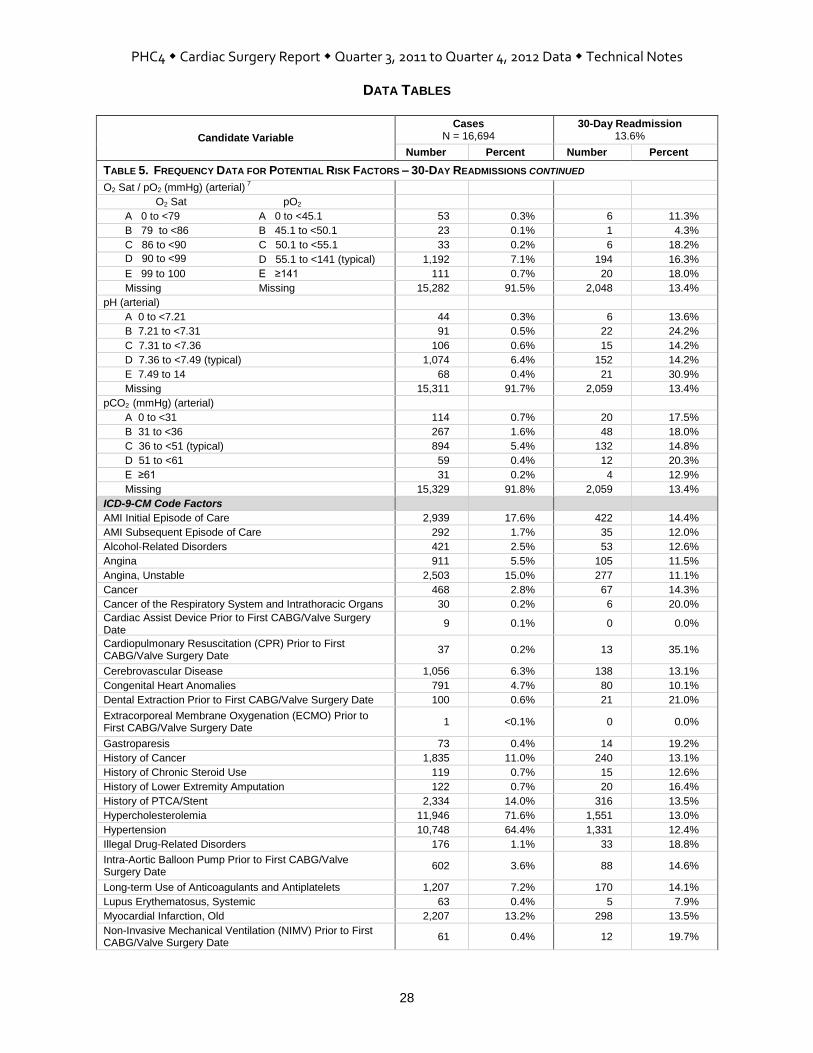
TABLE 5. FREQUENCY DATA FOR POTENTIAL RISK FACTORS – 30-DAY READMISSIONS
Candidate Variable
Cases N = 16,694
30-Day Readmission 13.6%
Number Percent Number Percent
Variables tested and retained in the model.
Procedure Group Factor
CABG without Valve 9,826 58.9% 1,174 11.9%
Valve without CABG 4,432 26.5% 663 15.0%
Valve with CABG 2,436 14.6% 438 18.0%
Demographic Factors
Age (continuous) 16,694 Average Age – 67.4 (Female 69.3, Male 66.4)
Age – Number of Years >75 (continuous) 4,425 26.5% 784 17.7%
Sex
Male 11,085 66.4% 1,352 12.2%
Female 5,609 33.6% 923 16.5%
Race/Ethnicity
Black 839 5.0% 157 18.7%
Hispanic 320 1.9% 63 19.7%
Other 750 4.5% 120 16.0%
White 14,785 88.6% 1,935 13.1%
Clinically Derived Factors
American Society of Anesthesiologists (ASA) Class 4 or 51 12,158 72.8% 1,772 14.6%
Preoperative Acute Renal Failure 178 1.1% 47 26.4%
Hemoglobin 0 to <11.1 g/dL 1,303 7.8% 298 22.9%
Sodium 0 to <136 mEq/L 1,408 8.4% 281 20.0%
ICD-9-CM Code Factors
Chronic Kidney Disease
Stage I to IV (mild to severe) 2,428 14.5% 448 18.5%
Stage V to End Stage Renal Disease (failure) 334 2.0% 101 30.2%
Chronic Lung Disease 3,012 18.0% 493 16.4%
Coagulopathy 135 0.8% 31 23.0%
Diabetes
Diabetes with Complications 1,236 7.4% 224 18.1%
Diabetes without Complications 5,105 30.6% 748 14.7%
Excision of Other Lesion2 Same Day as First Valve with or
without CABG 543 3.3% 117 21.5%
Heart Failure 4,563 27.3% 887 19.4%
History of Thrombosis or Embolism 512 3.1% 95 18.6%
Malnutrition 723 4.3% 160 22.1%
Mental Disorders 2,790 16.7% 454 16.3%
Morbid Obesity 1,459 8.7% 237 16.2%
Variables tested, but not retained in the model.
Clinically Derived Factors
Ejection Fraction <30% 1,059 6.3% 186 17.6%
Preoperative Cardiogenic Shock 93 0.6% 19 20.4%
Albumin 0 to <3.4 g/dL 1,016 6.1% 194 19.1%
Alkaline Phosphatase ≥116 U/L 432 2.6% 87 20.1%
AST ≥31 U/L 1,719 10.3% 276 16.1%
Bilirubin ≥0.9 mg/dL 1,401 8.4% 241 17.2%
BNP ≥101 pg/mL / ProBNP ≥1001 pg/mL3 1,138 6.8% 239 21.0%
BUN ≥26 mg/dL 1,546 9.3% 349 22.6%
Calcium 0 to <8.7 mg/dL 1,741 10.4% 298 17.1%
Creatinine ≥1.5 mg/dL 1,126 6.7% 256 22.7%
Glucose ≥136 mg/dL 4,138 24.8% 683 16.5%
Platelet Count 0 to <150.1 109/L 1,122 6.7% 191 17.0%

PHC4 Cardiac Surgery Report Quarter 3, 2011 to Quarter 4, 2012 Data Technical Notes
DATA TABLES
26
Candidate Variable
Cases N = 16,694
30-Day Readmission 13.6%
Number Percent Number Percent
TABLE 5. FREQUENCY DATA FOR POTENTIAL RISK FACTORS – 30-DAY READMISSIONS CONTINUED
Potassium
0 to <3.3 mEq/L 222 1.3% 40 18.0%
≥5.0 mEq/L 427 2.6% 90 21.1%
PT ≥13.1 sec / INR ≥1.11 (ratio) 4 1,731 10.4% 323 18.7%
PTT ≥35.1 sec 2,566 15.4% 394 15.4%
WBC ≥11.0 109/L 1,413 8.5% 242 17.1%
ICD-9-CM Code Factors
Anemia 684 4.1% 147 21.5%
Cardiac Adhesions 170 1.0% 37 21.8%
Cardiomyopathy 1,448 8.7% 225 15.5%
Chronic Pulmonary Hypertension 1,842 11.0% 352 19.1%
Coronary Artery Disease 1,593 9.5% 261 16.4%
Excision of Left Atrial Appendage (LAA)5 Same Day as First
Valve with or without CABG 533 3.2% 109 20.5%
Heart Valve Disease 2,919 17.5% 479 16.4%
History of CABG/Valve Surgery 1,003 6.0% 166 16.6%
History of Pacemaker or Defibrillator 719 4.3% 133 18.5%
History of Peripheral Vascular Disease 2,438 14.6% 373 15.3%
History of Stroke 1,295 7.8% 215 16.6%
Ischemic Heart Disease 1,546 9.3% 239 15.5%
Liver Disease 315 1.9% 58 18.4%
Long-term Use of Insulin 790 4.7% 129 16.3%
Multiple Valve Same Day as First CABG/Valve Surgery 860 5.2% 176 20.5%
Obstructive Sleep Apnea and Obesity-Related Hypoventilation Syndrome
1,827 10.9% 278 15.2%
Osteoporosis 459 2.7% 78 17.0%
Oxygen Therapy Dependence (long-term) 283 1.7% 64 22.6%
Type of Valve Procedure – Annuloplasty, Same Day as First CABG/Valve Surgery
417 2.5% 82 19.7%
Type of Valve Procedure – Aortic, Same Day as First CABG/Valve Surgery
4,250 25.5% 630 14.8%
Type of Valve Procedure – Mitral, Same Day as First CABG/Valve Surgery
1,359 8.1% 224 16.5%
Valve Replacement Same Day as First CABG/Valve Surgery
5,436 32.6% 865 15.9%
Variables considered, but not tested in the initial model because the initial analysis did not indicate that they were predictive of readmission for this particular data set.
Clinically Derived Factors
ASA Emergency Indicator 781 4.7% 106 13.6%
Circumflex (and branches) Percent Stenosis
A 80%-100% 6,526 39.1% 869 13.3%
B 50%-79% 2,525 15.1% 335 13.3%
C 1%-49% 1,774 10.6% 243 13.7%
D 0% 1,718 10.3% 251 14.6%
Missing 4,151 24.9% 577 13.9%
Left Anterior Descending (and branches) Percent Stenosis
A 80%-100% 8,217 49.2% 1,081 13.2%
B 50%-79% 2,829 16.9% 370 13.1%
C 1%-49% 1,555 9.3% 250 16.1%
D 0% 1,186 7.1% 155 13.1%
Missing 2,907 17.4% 419 14.4%

PHC4 Cardiac Surgery Report Quarter 3, 2011 to Quarter 4, 2012 Data Technical Notes
DATA TABLES
27
Candidate Variable
Cases N = 16,694
30-Day Readmission 13.6%
Number Percent Number Percent
TABLE 5. FREQUENCY DATA FOR POTENTIAL RISK FACTORS – 30-DAY READMISSIONS CONTINUED
Left Main Percent Stenosis
A 80%-100% 1,498 9.0% 179 11.9%
B 50%-79% 2,162 13.0% 287 13.3%
C 1%-49% 2,155 12.9% 325 15.1%
D 0% 3,499 21.0% 465 13.3%
Missing 7,380 44.2% 1,019 13.8%
Right Coronary Artery (and branches) Percent Stenosis
A 80%-100% 7,047 42.2% 974 13.8%
B 50%-79% 2,374 14.2% 337 14.2%
C 1%-49% 1,954 11.7% 261 13.4%
D 0% 1,546 9.3% 203 13.1%
Missing 3,773 22.6% 500 13.3%
Base Units (mEq/L) (arterial)
A <-11.4 17 0.1% 2 11.8%
B -11.4 to <-4.9 88 0.5% 15 17.0%
C -4.9 to <-1.6 189 1.1% 28 14.8%
D -1.6 to <8.1 (typical) 873 5.2% 136 15.6%
E ≥8.1 20 0.1% 5 25.0%
Missing 15,507 92.9% 2,089 13.5%
Bicarbonate (mEq/L) (arterial)
A 0 to <18 49 0.3% 6 12.2%
B 18 to <22 205 1.2% 34 16.6%
C 22 to <27 (typical) 774 4.6% 107 13.8%
D 27 to <31 228 1.4% 46 20.2%
E ≥31 31 0.2% 4 12.9%
Missing 15,407 92.3% 2,078 13.5%
CPK-MB ng/mL / Troponin I ng/mL6
CPK-MB Troponin I
A 0 to <5 (typical) A 0 to <0.41 (typical) 2,566 15.4% 415 16.2%
B 5 to <6 B 0.41 to <0.71 254 1.5% 37 14.6%
C 6 to <10 C 0.71 to <1.01 247 1.5% 35 14.2%
D 10 to <16 D 1.01 to <1.51 220 1.3% 29 13.2%
E ≥16 E ≥1.51 1,473 8.8% 221 15.0%
Missing Missing 11,934 71.5% 1,538 12.9%
CPK (U/L)
A 0 to <26 37 0.2% 10 27.0%
B 26 to <36 95 0.6% 25 26.3%
C 36 to <301 (typical) 2,351 14.1% 331 14.1%
D 301 to <501 287 1.7% 48 16.7%
E ≥501 405 2.4% 51 12.6%
Missing 13,519 81.0% 1,810 13.4%
Neutrophils Band (%)
A 0 to <7 (typical) 316 1.9% 51 16.1%
B 7 to <14 53 0.3% 5 9.4%
C 14 to <23 12 0.1% 4 33.3%
D 23 to <33 5 <0.1% 1 20.0%
E 33 to100 5 <0.1% 0 0.0%
Missing 16,303 97.7% 2,214 13.6%
PHC4 Cardiac Surgery Report Quarter 3, 2011 to Quarter 4, 2012 Data Technical Notes
DATA TABLES
28
Candidate Variable
Cases N = 16,694
30-Day Readmission 13.6%
Number Percent Number Percent
TABLE 5. FREQUENCY DATA FOR POTENTIAL RISK FACTORS – 30-DAY READMISSIONS CONTINUED
O2 Sat / pO2 (mmHg) (arterial) 7
O2 Sat pO2
A 0 to <79 A 0 to <45.1 53 0.3% 6 11.3%
B 79 to <86 B 45.1 to <50.1 23 0.1% 1 4.3%
C 86 to <90 C 50.1 to <55.1 33 0.2% 6 18.2%
D 90 to <99 (normal)
D 55.1 to <141 (typical) 1,192 7.1% 194 16.3%
E 99 to 100 E ≥141 111 0.7% 20 18.0%
Missing Missing 15,282 91.5% 2,048 13.4%
pH (arterial)
A 0 to <7.21 44 0.3% 6 13.6%
B 7.21 to <7.31 91 0.5% 22 24.2%
C 7.31 to <7.36 106 0.6% 15 14.2%
D 7.36 to <7.49 (typical) 1,074 6.4% 152 14.2%
E 7.49 to 14 68 0.4% 21 30.9%
Missing 15,311 91.7% 2,059 13.4%
pCO2 (mmHg) (arterial)
A 0 to <31 114 0.7% 20 17.5%
B 31 to <36 267 1.6% 48 18.0%
C 36 to <51 (typical) 894 5.4% 132 14.8%
D 51 to <61 59 0.4% 12 20.3%
E ≥61 31 0.2% 4 12.9%
Missing 15,329 91.8% 2,059 13.4%
ICD-9-CM Code Factors
AMI Initial Episode of Care 2,939 17.6% 422 14.4%
AMI Subsequent Episode of Care 292 1.7% 35 12.0%
Alcohol-Related Disorders 421 2.5% 53 12.6%
Angina 911 5.5% 105 11.5%
Angina, Unstable 2,503 15.0% 277 11.1%
Cancer 468 2.8% 67 14.3%
Cancer of the Respiratory System and Intrathoracic Organs 30 0.2% 6 20.0%
Cardiac Assist Device Prior to First CABG/Valve Surgery Date
9 0.1% 0 0.0%
Cardiopulmonary Resuscitation (CPR) Prior to First CABG/Valve Surgery Date
37 0.2% 13 35.1%
Cerebrovascular Disease 1,056 6.3% 138 13.1%
Congenital Heart Anomalies 791 4.7% 80 10.1%
Dental Extraction Prior to First CABG/Valve Surgery Date 100 0.6% 21 21.0%
Extracorporeal Membrane Oxygenation (ECMO) Prior to First CABG/Valve Surgery Date
1 <0.1% 0 0.0%
Gastroparesis 73 0.4% 14 19.2%
History of Cancer 1,835 11.0% 240 13.1%
History of Chronic Steroid Use 119 0.7% 15 12.6%
History of Lower Extremity Amputation 122 0.7% 20 16.4%
History of PTCA/Stent 2,334 14.0% 316 13.5%
Hypercholesterolemia 11,946 71.6% 1,551 13.0%
Hypertension 10,748 64.4% 1,331 12.4%
Illegal Drug-Related Disorders 176 1.1% 33 18.8%
Intra-Aortic Balloon Pump Prior to First CABG/Valve Surgery Date
602 3.6% 88 14.6%
Long-term Use of Anticoagulants and Antiplatelets 1,207 7.2% 170 14.1%
Lupus Erythematosus, Systemic 63 0.4% 5 7.9%
Myocardial Infarction, Old 2,207 13.2% 298 13.5%
Non-Invasive Mechanical Ventilation (NIMV) Prior to First CABG/Valve Surgery Date
61 0.4% 12 19.7%
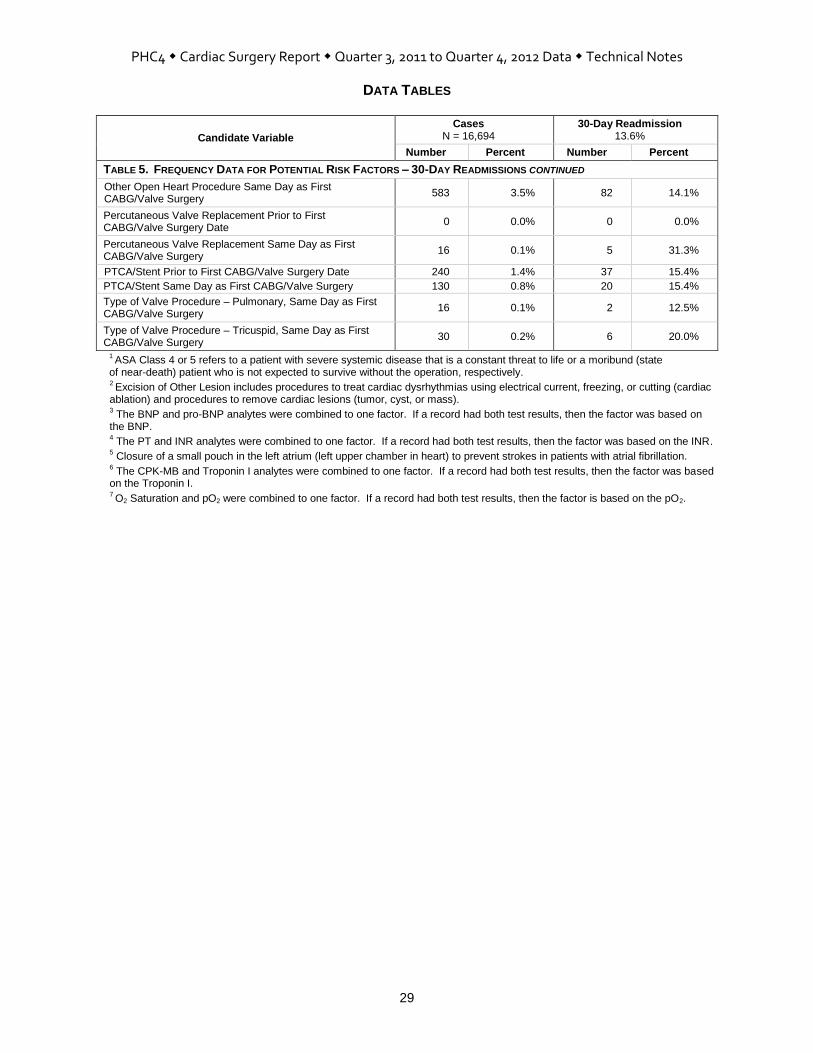
PHC4 Cardiac Surgery Report Quarter 3, 2011 to Quarter 4, 2012 Data Technical Notes
DATA TABLES
29
Candidate Variable
Cases N = 16,694
30-Day Readmission 13.6%
Number Percent Number Percent
TABLE 5. FREQUENCY DATA FOR POTENTIAL RISK FACTORS – 30-DAY READMISSIONS CONTINUED
Other Open Heart Procedure Same Day as First CABG/Valve Surgery
583 3.5% 82 14.1%
Percutaneous Valve Replacement Prior to First CABG/Valve Surgery Date
0 0.0% 0 0.0%
Percutaneous Valve Replacement Same Day as First CABG/Valve Surgery
16 0.1% 5 31.3%
PTCA/Stent Prior to First CABG/Valve Surgery Date 240 1.4% 37 15.4%
PTCA/Stent Same Day as First CABG/Valve Surgery 130 0.8% 20 15.4%
Type of Valve Procedure – Pulmonary, Same Day as First CABG/Valve Surgery
16 0.1% 2 12.5%
Type of Valve Procedure – Tricuspid, Same Day as First CABG/Valve Surgery
30 0.2% 6 20.0%
1 ASA Class 4 or 5 refers to a patient with severe systemic disease that is a constant threat to life or a moribund (state
of near-death) patient who is not expected to survive without the operation, respectively. 2 Excision of Other Lesion includes procedures to treat cardiac dysrhythmias using electrical current, freezing, or cutting (cardiac
ablation) and procedures to remove cardiac lesions (tumor, cyst, or mass). 3 The BNP and pro-BNP analytes were combined to one factor. If a record had both test results, then the factor was based on
the BNP. 4 The PT and INR analytes were combined to one factor. If a record had both test results, then the factor was based on the INR.
5 Closure of a small pouch in the left atrium (left upper chamber in heart) to prevent strokes in patients with atrial fibrillation.
6 The CPK-MB and Troponin I analytes were combined to one factor. If a record had both test results, then the factor was based
on the Troponin I. 7 O2 Saturation and pO2 were combined to one factor. If a record had both test results, then the factor is based on the pO2.

PHC4 Cardiac Surgery Report Quarter 3, 2011 to Quarter 4, 2012 Data Technical Notes
DATA TABLES
30
TABLE 6. IN-HOSPITAL MORTALITY MODEL
The c-statistic for the model is 0.82425.
Predictor Coefficient Odds Ratio* p-value
Intercept -6.1001
Procedure Group Factor <0.0001
Valve without CABG 0.3162 1.372
Valve with CABG 0.9009 2.462
Demographic Factors
Age (continuous) 0.0006 1.006 0.9726
Age – Number of Years >60 (continuous) 0.0558 1.322 0.0169
Female 0.1944 1.215 0.0698
Clinically Derived Factors
American Society of Anesthesiologists (ASA) Class 5 0.9059 2.474 0.0059
ASA Emergency Indicator 0.5671 1.763 0.0039
Ejection Fraction 0.0051
<20% 0.5989 1.820
20 to 39% 0.3497 1.419
Left Main Stenosis – Number of Percentage Points >49% (continuous)
0.0105 1.111 0.0075
Preoperative Acute Renal Failure 0.4833 1.621 0.0770
Preoperative Cardiogenic Shock 1.2334 3.433 <0.0001
Right Coronary Artery Stenosis – Number of Percentage Points >49% (continuous)
0.0027 1.027 0.3052
Sodium 0 to <131 mEq/L 0.7803 2.182 0.0050
ICD-9-CM Code Factors
AMI Initial Episode of Care 0.3970 1.487 0.0039
Chronic Kidney Disease <0.0001
Stage I to IV (mild to severe) 0.3101 1.364
Stage V to End Stage Renal Disease (failure) 1.1636 3.201
Excision of Other Lesion Same Day as First Valve with or without CABG
0.6074 1.836 0.0069
Heart Failure 0.4617 1.587 <0.0001
Heart Valve Disease 0.4185 1.520 0.0002
History of CABG or Valve Surgery 0.4687 1.598 0.0084
History of Peripheral Vascular Disease 0.2601 1.297 0.0392
Liver Disease 1.5315 4.625 <0.0001
Malnutrition 0.6185 1.856 <0.0001
Morbid Obesity 0.3902 1.477 0.0349
Other Open Heart Procedure Same Day as First CABG/Valve Surgery
0.6967 2.007 0.0005
Oxygen Therapy Dependence (long-term) 0.8499 2.339 0.0001
PTCA/Stent Prior to First CABG/Valve Surgery Date 1.3679 3.927 <0.0001
PTCA/Stent Same Day as First CABG/Valve Surgery 0.9130 2.492 0.0122
* With the exception of “Age – Number of Years >60”, which is calculated at units of 5, odds ratios for continuous variables are calculated at a unit of 10. Using “Left Main Stenosis – Number of Percentage Points >49%” as an example, the risk for death is about 11% higher for patients with 60% stenosis than for patients with 50% stenosis.

PHC4 Cardiac Surgery Report Quarter 3, 2011 to Quarter 4, 2012 Data Technical Notes
DATA TABLES
31
TABLE 7. 30-DAY READMISSIONS MODEL
The c-statistic for the model is 0.64595.
Predictor Coefficient Odds Ratio p-value
Intercept -3.2519
Procedure Group Factor 0.0002
Valve without CABG 0.1109 1.117
Valve with CABG 0.2707 1.311
Demographic Factors
Age (continuous) 0.0090 1.094 0.0031
Age – Number of Years >75 (continuous) 0.0338 1.184 0.0004
Female 0.1561 1.169 0.0016
Race/Ethnicity <0.0001
Black 0.3364 1.400
Hispanic 0.5578 1.747
Other 0.2628 1.301
Clinically Derived Factors
American Society of Anesthesiologists (ASA) Class 4 or 5 0.1963 1.217 0.0004
Preoperative Acute Renal Failure 0.3144 1.370 0.0889
Hemoglobin 0 to <11.1 g/dL 0.2385 1.269 0.0024
Sodium 0 to <136 mEq/L 0.3058 1.358 <0.0001
ICD-9-CM Code Factors
Chronic Kidney Disease <0.0001
Stage I to IV (mild to severe) 0.1709 1.186
Stage V to End Stage Renal Disease (failure) 0.7783 2.178
Chronic Lung Disease 0.1733 1.189 0.0028
Coagulopathy 0.5434 1.722 0.0154
Diabetes 0.0147
Diabetes with Complications 0.2033 1.225
Diabetes without Complications 0.1196 1.127
Excision of Other Lesion Same Day as First Valve with or without CABG
0.4783 1.613 <0.0001
Heart Failure 0.3189 1.376 <0.0001
History of Thrombosis or Embolism 0.2244 1.252 0.0681
Malnutrition 0.2657 1.304 0.0070
Mental Disorders 0.2592 1.296 <0.0001
Morbid Obesity 0.1698 1.185 0.0336
* Odds ratios for “Age” is calculated at units of 10 and odds ratios for “Age – Number of Years >75” is calculated at units of 5. Using “Age” as an example, the risk for readmission is about 9% higher for patients age 60 than for patients age 50.

APPENDICES
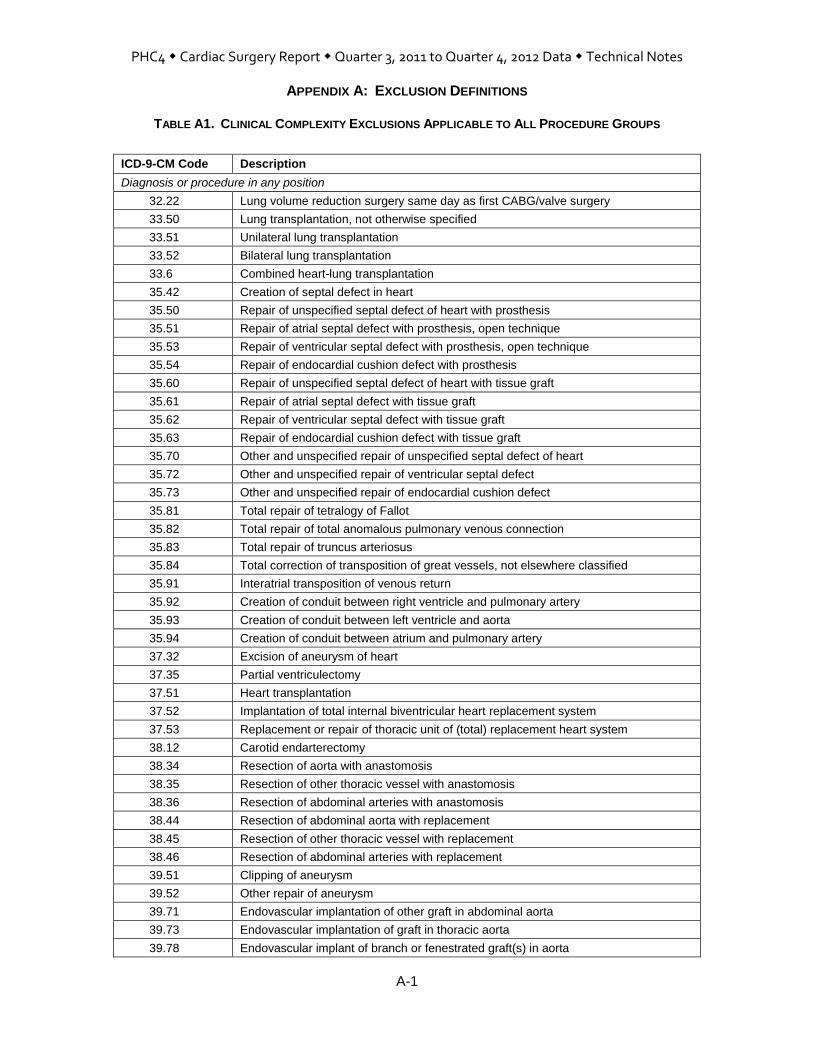
PHC4 Cardiac Surgery Report Quarter 3, 2011 to Quarter 4, 2012 Data Technical Notes
APPENDIX A: EXCLUSION DEFINITIONS
A-1
TABLE A1. CLINICAL COMPLEXITY EXCLUSIONS APPLICABLE TO ALL PROCEDURE GROUPS
ICD-9-CM Code Description
Diagnosis or procedure in any position
32.22 Lung volume reduction surgery same day as first CABG/valve surgery
33.50 Lung transplantation, not otherwise specified
33.51 Unilateral lung transplantation
33.52 Bilateral lung transplantation
33.6 Combined heart-lung transplantation
35.42 Creation of septal defect in heart
35.50 Repair of unspecified septal defect of heart with prosthesis
35.51 Repair of atrial septal defect with prosthesis, open technique
35.53 Repair of ventricular septal defect with prosthesis, open technique
35.54 Repair of endocardial cushion defect with prosthesis
35.60 Repair of unspecified septal defect of heart with tissue graft
35.61 Repair of atrial septal defect with tissue graft
35.62 Repair of ventricular septal defect with tissue graft
35.63 Repair of endocardial cushion defect with tissue graft
35.70 Other and unspecified repair of unspecified septal defect of heart
35.72 Other and unspecified repair of ventricular septal defect
35.73 Other and unspecified repair of endocardial cushion defect
35.81 Total repair of tetralogy of Fallot
35.82 Total repair of total anomalous pulmonary venous connection
35.83 Total repair of truncus arteriosus
35.84 Total correction of transposition of great vessels, not elsewhere classified
35.91 Interatrial transposition of venous return
35.92 Creation of conduit between right ventricle and pulmonary artery
35.93 Creation of conduit between left ventricle and aorta
35.94 Creation of conduit between atrium and pulmonary artery
37.32 Excision of aneurysm of heart
37.35 Partial ventriculectomy
37.51 Heart transplantation
37.52 Implantation of total internal biventricular heart replacement system
37.53 Replacement or repair of thoracic unit of (total) replacement heart system
38.12 Carotid endarterectomy
38.34 Resection of aorta with anastomosis
38.35 Resection of other thoracic vessel with anastomosis
38.36 Resection of abdominal arteries with anastomosis
38.44 Resection of abdominal aorta with replacement
38.45 Resection of other thoracic vessel with replacement
38.46 Resection of abdominal arteries with replacement
39.51 Clipping of aneurysm
39.52 Other repair of aneurysm
39.71 Endovascular implantation of other graft in abdominal aorta
39.73 Endovascular implantation of graft in thoracic aorta
39.78
Endovascular implant of branch or fenestrated graft(s) in aorta

PHC4 Cardiac Surgery Report Quarter 3, 2011 to Quarter 4, 2012 Data Technical Notes
APPENDIX A: EXCLUSION DEFINITIONS (CONTINUED)
A-2
ICD-9-CM Code Description
Diagnosis or procedure in any position
Table A1: Clinical Complexity Exclusions Applicable to All Procedure Groups continued
41.00 Bone marrow transplant, not otherwise specified
41.02 Allogeneic bone marrow transplant with purging
41.03 Allogeneic bone marrow transplant without purging
41.05 Allogeneic hematopoietic stem cell transplant without purging
41.06 Cord blood stem cell transplant
41.08 Allogeneic hematopoietic stem cell transplant with purging
41.09 Autologous bone marrow transplant with purging
41.94 Transplantation of spleen
46.97 Transplant of intestine
50.51 Auxiliary liver transplant
50.59 Other transplant of liver
52.80 Pancreatic transplant, not otherwise specified
52.82 Homotransplant of pancreas
52.83 Heterotransplant of pancreas
52.85 Allotransplantation of cells of islets of Langerhans
52.86 Transplantation of cells of islets of Langerhans, not otherwise specified
55.61 Renal autotransplantation
55.69 Other kidney transplantation
423.2 plus 37.31 Diagnosis of constrictive pericarditis and undergoing pericardiectomy
441.00 Dissection of aorta, unspecified site
441.01 Dissection of aorta, thoracic
996.81 Complications of transplanted kidney
996.82 Complications of transplanted liver
996.83 Complications of transplanted heart
996.84 Complications of transplanted lung
996.85 Complications of bone marrow transplant
996.86 Complications of transplanted pancreas
996.87 Complications of transplanted intestine
996.88 Complications of transplanted stem cell
V42.0 Kidney replaced by transplant
V42.1 Heart replaced by transplant
V42.6 Lung replaced by transplant
V42.7 Liver replaced by transplant
V42.81 Bone marrow transplant
V42.82
Peripheral stem cells replaced by transplant
V42.83 Pancreas transplant
V42.84 Intestine transplant
V43.21 Heart replacement by heart assist device
V43.22 Heart replacement by fully implantable artificial heart

PHC4 Cardiac Surgery Report Quarter 3, 2011 to Quarter 4, 2012 Data Technical Notes
APPENDIX A: EXCLUSION DEFINITIONS (CONTINUED)
A-3
TABLE A2. ADDITIONAL CLINICAL COMPLEXITY EXCLUSIONS APPLICABLE TO CABG WITHOUT VALVE
PROCEDURE GROUP
ICD-9-CM Code Description
Procedure in any position:
35.31 Operations on papillary muscle
35.32 Operations on chordae tendineae
35.34 Infundibulectomy
35.35 Operations on trabeculae carneae cordis
35.39 Operations on other structures adjacent to valves of heart
35.71 Other and unspecified repair of atrial septal defect
35.95 Revision of corrective procedure on heart
35.98 Other operations on septa of heart
36.91 Repair of aneurysm of coronary vessel
37.33 Excision or destruction of other lesion or tissue of heart, open approach
37.36 Excision, destruction or exclusion of left atrial appendage (LAA)
TABLE A3: ADDITIONAL CLINICAL COMPLEXITY EXCLUSIONS APPLICABLE TO VALVE WITHOUT CABG
PROCEDURE GROUP
ICD-9-CM Code Description
Principal diagnosis only:
036.42 Meningococcal endocarditis
038.x & 038.xx Septicemia
074.22 Coxsackie endocarditis
093.20 Syphilitic endocarditis, valve unspecified
093.21 Syphilitic endocarditis, mitral valve
093.22 Syphilitic endocarditis, aortic valve
093.23 Syphilitic endocarditis, tricuspid valve
093.24 Syphilitic endocarditis, pulmonary valve
098.84 Gonococcal endocarditis
112.81 Candidal endocarditis
115.04 Histoplasmosis capsulatum endocarditis
115.14 Histoplasmosis duboisii endocarditis
115.94 Histoplasmosis endocarditis
391.1 Acute rheumatic endocarditis
421.0 Acute and subacute bacterial endocarditis
421.1 Acute and subacute infective endocarditis in diseases classified elsewhere
421.9 Acute endocarditis, unspecified
424.90 Endocarditis, valve unspecified, unspecified cause
424.91 Endocarditis in diseases classified elsewhere
424.99 Endocarditis, valve unspecified, specified cause except rheumatic
996.02 Mechanical complication due to heart valve prosthesis
996.61 Infection and inflammatory reaction due to cardiac device/implant/graft
996.71 Other complications due to heart valve prosthesis
Diagnosis in any position:
277.30 plus 425.7 Amyloidosis, unspecified and nutritional & metabolic cardiomyopathy
277.39 plus 425.7 Other amyloidosis and plus nutritional & metabolic cardiomyopathy
414.10 Aneurysm of heart (wall)
414.19 Other aneurysm of heart

PHC4 Cardiac Surgery Report Quarter 3, 2011 to Quarter 4, 2012 Data Technical Notes
APPENDIX A: EXCLUSION DEFINITIONS (CONTINUED)
A-4
TABLE A4: ADDITIONAL CLINICAL COMPLEXITY EXCLUSIONS APPLICABLE TO VALVE WITH CABG
PROCEDURE GROUP
ICD-9-CM Code Description
Principal diagnosis only
036.42 Meningococcal endocarditis
038.x & 038.xx Septicemia
074.22 Coxsackie endocarditis
093.20 Syphilitic endocarditis, valve unspecified
093.21 Syphilitic endocarditis, mitral valve
093.22 Syphilitic endocarditis, aortic valve
093.23 Syphilitic endocarditis, tricuspid valve
093.24 Syphilitic endocarditis, pulmonary valve
098.84 Gonococcal endocarditis
112.81 Candidal endocarditis
115.04 Histoplasmosis capsulatum endocarditis
115.14 Histoplasmosis duboisii endocarditis
115.94 Histoplasmosis endocarditis
391.1 Acute rheumatic endocarditis
421.0 Acute and subacute bacterial endocarditis
421.1 Acute and subacute infective endocarditis in diseases classified elsewhere
421.9 Acute endocarditis, unspecified
424.90 Endocarditis, valve unspecified, unspecified cause
424.91 Endocarditis in diseases classified elsewhere
424.99 Endocarditis, valve unspecified, specified cause except rheumatic
996.02 Mechanical complication due to heart valve prosthesis
996.61 Infection and inflammatory reaction due to cardiac device/implant/graft
996.71 Other complications due to heart valve prosthesis
Diagnosis in any position:
277.30 plus 425.7 Amyloidosis, unspecified and nutritional & metabolic cardiomyopathy
277.39 plus 425.7 Other amyloidosis and plus nutritional & metabolic cardiomyopathy
414.10 Aneurysm of heart (wall)
414.19 Other aneurysm of heart
Procedure in any position:
35.95 Revision of corrective procedure on heart
35.98 Other operations on septa of heart
36.91 Repair of aneurysm of coronary vessel

PHC4 Cardiac Surgery Report Quarter 3, 2011 to Quarter 4, 2012 Data Technical Notes
APPENDIX A: EXCLUSION DEFINITIONS (CONTINUED)
A-5
TABLE A5. MS-DRG CRITERIA FOR STUDY POPULATION DEFINITION
MS-DRGs Not Excluded from the Study: CABG without Valve
MS-DRG 001 Heart Transplant or Implant of Heart Assist System with MCC
MS-DRG 002 Heart Transplant or Implant of Heart Assist System without MCC
MS-DRG 003 and MDC 5*
ECMO or tracheostomy with Mechanical Ventilation 96+ Hours or Principal Diagnosis Except Face, Mouth, Neck with Major O.R. Procedures
MS-DRG 215 Other Heart Assist System Implant
MS-DRG 216 Cardiac Valve and Other Major Cardiothoracic Procedures with Cardiac Catheterization with MCC
MS-DRG 217 Cardiac Valve and Other Major Cardiothoracic Procedures with Cardiac Catheterization with CC
MS-DRG 218 Cardiac Valve and Other Major Cardiothoracic Procedures with Cardiac Catheterization without CC/MCC
MS-DRG 219 Cardiac Valve and Other Major Cardiothoracic Procedures without Cardiac Catheterization with MCC
MS-DRG 220 Cardiac Valve and Other Major Cardiothoracic Procedures without Cardiac Catheterization with CC
MS-DRG 221 Cardiac Valve and Other Major Cardiothoracic Procedures without Cardiac Catheterization without CC/MCC
MS-DRG 222 Cardiac Defibrillator Implant with Cardiac Catheterization with Acute MI/Heart Failure/Shock with MCC
MS-DRG 223 Cardiac Defibrillator Implant with Cardiac Catheterization with Acute MI/Heart Failure/Shock without MCC
MS-DRG 224 Cardiac Defibrillator Implant with Cardiac Catheterization without Acute MI/Heart Failure/Shock with MCC
MS-DRG 225 Cardiac Defibrillator Implant with Cardiac Catheterization without Acute MI/Heart Failure/Shock without MCC
MS-DRG 226 Cardiac Defibrillator Implant without Cardiac Catheterization with MCC
MS-DRG 227 Cardiac Defibrillator Implant without Cardiac Catheterization without MCC
MS-DRG 228 Other Cardiothoracic Procedures with MCC
MS-DRG 229 Other Cardiothoracic Procedures with CC
MS-DRG 230 Other Cardiothoracic Procedures without CC/MCC
MS-DRG 231 Coronary Bypass with PTCA with MCC
MS-DRG 232 Coronary Bypass with PTCA without MCC
MS-DRG 233 Coronary Bypass with Cardiac Catheterization with MCC
MS-DRG 234 Coronary Bypass with Cardiac Catheterization without MCC
MS-DRG 235 Coronary Bypass without Cardiac Catheterization with MCC
MS-DRG 236 Coronary Bypass without Cardiac Catheterization without MCC
MS-DRGs Not Excluded from the Study: Valve without CABG
MS-DRG 001 Heart Transplant or Implant of Heart Assist System with MCC
MS-DRG 002 Heart Transplant or Implant of Heart Assist System without MCC
MS-DRG 003 and MDC 5*
ECMO or tracheostomy with Mechanical Ventilation 96+ Hours or Principal Diagnosis Except Face, Mouth, Neck with Major O.R. Procedures
MS-DRG 215 Other Heart Assist System Implant
MS-DRG 216 Cardiac Valve and Other Major Cardiothoracic Procedures with Cardiac Catheterization with MCC
MS-DRG 217 Cardiac Valve and Other Major Cardiothoracic Procedures with Cardiac Catheterization with CC
MS-DRG 218 Cardiac Valve and Other Major Cardiothoracic Procedures with Cardiac Catheterization without CC/MCC
MS-DRG 219 Cardiac Valve and Other Major Cardiothoracic Procedures without Cardiac Catheterization with MCC
MS-DRG 220 Cardiac Valve and Other Major Cardiothoracic Procedures without Cardiac Catheterization with CC
MS-DRG 221 Cardiac Valve and Other Major Cardiothoracic Procedures without Cardiac Catheterization without CC/MCC
MS-DRG 222 Cardiac Defibrillator Implant with Cardiac Catheterization with Acute MI/Heart Failure/Shock with MCC
MS-DRG 223 Cardiac Defibrillator Implant with Cardiac Catheterization with Acute MI/Heart Failure/Shock without MCC
MS-DRG 224 Cardiac Defibrillator Implant with Cardiac Catheterization without Acute MI/Heart Failure/Shock with MCC
MS-DRG 225 Cardiac Defibrillator Implant with Cardiac Catheterization without Acute MI/Heart Failure/Shock without MCC
MS-DRG 226 Cardiac Defibrillator Implant without Cardiac Catheterization with MCC
MS-DRG 227 Cardiac Defibrillator Implant without Cardiac Catheterization without MCC
MS-DRG 228 Other Cardiothoracic Procedures with MCC
MS-DRG 229 Other Cardiothoracic Procedures with CC

PHC4 Cardiac Surgery Report Quarter 3, 2011 to Quarter 4, 2012 Data Technical Notes
APPENDIX A: EXCLUSION DEFINITIONS (CONTINUED)
A-6
MS-DRG 230 Other Cardiothoracic Procedures without CC/MCC
TABLE A5. MS-DRG CRITERIA FOR STUDY POPULATION DEFINITION CONTINUED
MS-DRGs Not Excluded from the Study: Valve with CABG
MS-DRG 001 Heart Transplant or Implant of Heart Assist System with MCC
MS-DRG 002 Heart Transplant or Implant of Heart Assist System without MCC
MS-DRG 003 and MDC 5*
ECMO or tracheostomy with Mechanical Ventilation 96+ Hours or Principal Diagnosis Except Face, Mouth, Neck with Major O.R. Procedures
MS-DRG 215 Other Heart Assist System Implant
MS-DRG 216 Cardiac Valve and Other Major Cardiothoracic Procedures with Cardiac Catheterization with MCC
MS-DRG 217 Cardiac Valve and Other Major Cardiothoracic Procedures with Cardiac Catheterization with CC
MS-DRG 218 Cardiac Valve and Other Major Cardiothoracic Procedures with Cardiac Catheterization without CC/MCC
MS-DRG 219 Cardiac Valve and Other Major Cardiothoracic Procedures without Cardiac Catheterization with MCC
MS-DRG 220 Cardiac Valve and Other Major Cardiothoracic Procedures without Cardiac Catheterization with CC
MS-DRG 221 Cardiac Valve and Other Major Cardiothoracic Procedures without Cardiac Catheterization without CC/MCC
MS-DRG 222 Cardiac Defibrillator Implant with Cardiac Catheterization with Acute MI/Heart Failure/Shock with MCC
MS-DRG 223 Cardiac Defibrillator Implant with Cardiac Catheterization with Acute MI/Heart Failure/Shock without MCC
MS-DRG 224 Cardiac Defibrillator Implant with Cardiac Catheterization without Acute MI/Heart Failure/Shock with MCC
MS-DRG 225 Cardiac Defibrillator Implant with Cardiac Catheterization without Acute MI/Heart Failure/Shock without MCC
MS-DRG 226 Cardiac Defibrillator Implant without Cardiac Catheterization with MCC
MS-DRG 227 Cardiac Defibrillator Implant without Cardiac Catheterization without MCC
MS-DRG 228 Other Cardiothoracic Procedures with MCC
MS-DRG 229 Other Cardiothoracic Procedures with CC
MS-DRG 230 Other Cardiothoracic Procedures without CC/MCC
* Major Diagnostic Category (MDC) 5: Diseases and Disorders of the Circulatory System

PHC4 Cardiac Surgery Report Quarter 3, 2011 to Quarter 4, 2012 Data Technical Notes
APPENDIX B: REASONS FOR READMISSIONS DEFINITIONS
A-7
A readmission was counted only if the patient was readmitted with a principal diagnosis (i.e., the reason for the readmission) that indicated a heart-related condition, or an infection or a complication. The following list of categories shows the ICD-9-CM codes that were counted as readmissions, when the code was located in the principal diagnosis position.
CIRCULATORY SYSTEM Cardiac Dysrhythmias
Heart Block
426.0, 426.10, 426.11, 426.12, 426.13, 426.2, 426.3, 426.4, 426.50, 426.51, 426.52, 426.53, 426.54, 426.6, 426.7, 426.81, 426.82, 426.89, 426.9
Paroxysmal Tachycardia
427.0, 427.1, 427.2
Atrial Fibrillation and Atrial Flutter
427.31, 427.32
Ventricular Fibrillation and Ventricular Flutter
427.41, 427.42, 427.5
Premature Heart Beats
427.60, 427.61, 427.69
Other Cardiac Dysrhythmias
427.81, 427.89, 427.9
Heart Failure 398.91, 402.01, 402.11, 402.91, 404.01, 404.03, 404.11, 404.13, 404.91, 404.93, 428.0, 428.1, 428.20, 428.21, 428.22, 428.23, 428.30, 428.31, 428.32, 428.33, 428.40, 428.41, 428.42, 428.43, 428.9
Functional Disturbances Follow Cardiac Surgery (Postcardiotomy Syndrome) 429.4
Hypertension and Hypotension Hypertension
401.0, 401.1, 401.9, 402.00, 402.10, 402.90, 405.01, 405.09, 405.11, 405.19, 405.91, 405.99, 997.91
Hypotension
458.0, 458.21, 458.29, 458.8, 458.9, 796.3
Myocardial Infarction and Ischemia Acute Myocardial Infarction, Initial Episode
410.01, 410.11, 410.21, 410.31, 410.41, 410.51, 410.61, 410.71, 410.81, 410.91
Acute Myocardial Infarction, Unspecified or Subsequent Episode
410.00, 410.02, 410.10, 410.12, 410.20, 410.22, 410.30, 410.32, 410.40, 410.42, 410.50, 410.52, 410.60, 410.62, 410.70, 410.72, 410.80, 410.82, 410.90, 410.92
Other Forms of Myocardial Ischemia
411.0, 411.81, 411.89, 429.79
Angina Pectoris and Chest Pain 411.1, 413.0, 413.1, 413.9, 786.50, 786.51, 786.59
Atherosclerosis Coronary Atherosclerosis
414.00, 414.01, 414.02, 414.03, 414.04, 414.05, 414.06, 414.07, 414.2, 414.3, 414.42
Other Atherosclerosis
429.2, 440.0, 440.1, 440.20, 440.21, 440.22, 440.23, 440.24, 440.29, 440.30, 440.31, 440.32, 440.8, 440.9
Heart Aneurysm and Dissection 414.10, 414.11, 414.12, 414.19
Endocarditis, Myocarditis, and Pericarditis 112.81, 397.9, 398.0, 420.90, 420.91, 420.99, 421.0, 421.9, 422.90, 422.91, 422.92, 422.93, 422.99, 423.1, 423.2, 423.3, 423.8, 423.9, 424.90, 424.99, 429.0, 429.1
Heart Valve Disease Mitral Valve Disease
394.0, 394.1, 394.2, 394.9, 424.0
Aortic Valve Disease
395.0, 395.1, 395.2, 395.9, 424.1
Tricuspid Valve Disease
397.0, 424.2
Pulmonary Valve Disease
397.1, 424.3

PHC4 Cardiac Surgery Report Quarter 3, 2011 to Quarter 4, 2012 Data Technical Notes
APPENDIX B: REASONS FOR READMISSIONS DEFINITIONS (CONTINUED)
A-8
Multiple Valve Disease
396.0, 396.1, 396.2, 396.3, 396.8, 396.9
Other Endocardial Structure Disease
429.5, 429.6, 429.71, 429.81
Cardiomyopathies 425.0, 425.11, 425.112, 425.182, 425.3, 425.4, 425.9
Other Aneurysm and Dissection Aortic Aneurysm and Dissection
441.00, 441.01, 441.02, 441.03, 441.1, 441.2, 441.3, 441.4, 441.5, 441.6, 441.7, 441.9
Other Arterial Aneurysm
437.3, 442.0, 442.1, 442.2, 442.3, 442.81, 442.82, 442.83, 442.84, 442.89, 442.9
Other Arterial Dissection
443.21, 443.22, 443.23, 443.24, 443.29
Arterial Embolism and Thrombosis Abdominal and Thoracic Aorta
444.01, 444.012, 444.092, 444.1
Arteries of the Extremities
444.21, 444.22, 445.01, 445.02
Other Arteries Excluding Precerebral and Cerebral Arteries
444.81, 444.89, 444.9, 445.81, 445.89, 449, 593.81
Venous Embolism and Thrombosis Lower Extremity Venous Embolism and Thrombosis
453.40, 453.41, 453.42
Renal Vein Embolism and Thrombosis
453.3
Other Venous Embolism and Thrombosis
453.2, 453.6, 453.81, 453.82, 453.83, 453.84, 453.85, 453.86, 453.87, 453.89, 453.9
Phlebitis and Thrombophlebitis Lower Extremity Phlebitis and Thrombophlebitis
451.0, 451.11, 451.19, 451.2
Upper Extremity Phlebitis and Thrombophlebitis
451.82, 451.83, 451.84
Other Vessel Phlebitis and Thrombophlebitis
451.81, 451.89, 451.9
Occlusion and Stenosis Precerebral Artery Occlusion and Stenosis
433.00, 433.20, 433.30, 433.80, 433.90
Cerebral Artery Occlusion and Stenosis
433.10, 434.00, 434.10, 434.90
Retinal Artery Occlusion and Visual Loss
362.30, 362.31, 362.32, 362.33, 362.34, 362.35, 362.36, 362.37, 368.11, 368.12, 368.40
Stroke Ischemic Stroke
433.01, 433.11, 433.21, 433.31, 433.81, 433.91, 434.01, 434.11, 434.91
Hemorrhagic Stroke
430, 431, 432.0, 432.1, 432.9
Transient Cerebral Ischemia
435.0, 435.1, 435.2, 435.3, 435.8, 435.9
Postoperative Stroke
997.02
Other Diseases and Symptoms of the Circulatory System 398.90, 398.99, 414.8, 414.9, 423.0, 429.3, 429.82, 429.89, 429.9, 785.0, 785.1, 785.3, V533.1, V533.2, V533.9
RESPIRATORY SYSTEM Pulmonary Embolism and Infarction
Pulmonary Embolism and Infarction
415.0, 415.12, 415.132, 415.19
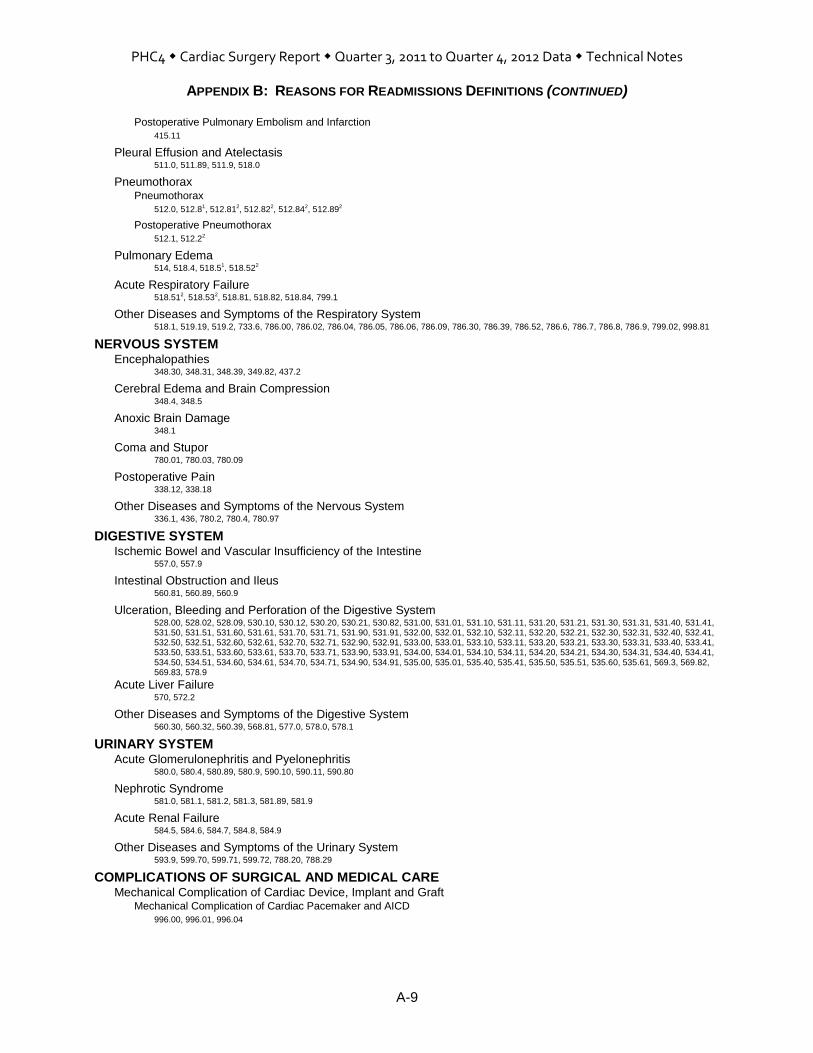
PHC4 Cardiac Surgery Report Quarter 3, 2011 to Quarter 4, 2012 Data Technical Notes
APPENDIX B: REASONS FOR READMISSIONS DEFINITIONS (CONTINUED)
A-9
Postoperative Pulmonary Embolism and Infarction
415.11
Pleural Effusion and Atelectasis 511.0, 511.89, 511.9, 518.0
Pneumothorax Pneumothorax
512.0, 512.81, 512.812, 512.822, 512.842, 512.892
Postoperative Pneumothorax
512.1, 512.22
Pulmonary Edema 514, 518.4, 518.51, 518.522
Acute Respiratory Failure 518.512, 518.532, 518.81, 518.82, 518.84, 799.1
Other Diseases and Symptoms of the Respiratory System 518.1, 519.19, 519.2, 733.6, 786.00, 786.02, 786.04, 786.05, 786.06, 786.09, 786.30, 786.39, 786.52, 786.6, 786.7, 786.8, 786.9, 799.02, 998.81
NERVOUS SYSTEM Encephalopathies
348.30, 348.31, 348.39, 349.82, 437.2
Cerebral Edema and Brain Compression 348.4, 348.5
Anoxic Brain Damage 348.1
Coma and Stupor 780.01, 780.03, 780.09
Postoperative Pain 338.12, 338.18
Other Diseases and Symptoms of the Nervous System 336.1, 436, 780.2, 780.4, 780.97
DIGESTIVE SYSTEM Ischemic Bowel and Vascular Insufficiency of the Intestine
557.0, 557.9
Intestinal Obstruction and Ileus 560.81, 560.89, 560.9
Ulceration, Bleeding and Perforation of the Digestive System 528.00, 528.02, 528.09, 530.10, 530.12, 530.20, 530.21, 530.82, 531.00, 531.01, 531.10, 531.11, 531.20, 531.21, 531.30, 531.31, 531.40, 531.41, 531.50, 531.51, 531.60, 531.61, 531.70, 531.71, 531.90, 531.91, 532.00, 532.01, 532.10, 532.11, 532.20, 532.21, 532.30, 532.31, 532.40, 532.41, 532.50, 532.51, 532.60, 532.61, 532.70, 532.71, 532.90, 532.91, 533.00, 533.01, 533.10, 533.11, 533.20, 533.21, 533.30, 533.31, 533.40, 533.41, 533.50, 533.51, 533.60, 533.61, 533.70, 533.71, 533.90, 533.91, 534.00, 534.01, 534.10, 534.11, 534.20, 534.21, 534.30, 534.31, 534.40, 534.41, 534.50, 534.51, 534.60, 534.61, 534.70, 534.71, 534.90, 534.91, 535.00, 535.01, 535.40, 535.41, 535.50, 535.51, 535.60, 535.61, 569.3, 569.82, 569.83, 578.9
Acute Liver Failure 570, 572.2
Other Diseases and Symptoms of the Digestive System 560.30, 560.32, 560.39, 568.81, 577.0, 578.0, 578.1
URINARY SYSTEM Acute Glomerulonephritis and Pyelonephritis
580.0, 580.4, 580.89, 580.9, 590.10, 590.11, 590.80
Nephrotic Syndrome 581.0, 581.1, 581.2, 581.3, 581.89, 581.9
Acute Renal Failure 584.5, 584.6, 584.7, 584.8, 584.9
Other Diseases and Symptoms of the Urinary System 593.9, 599.70, 599.71, 599.72, 788.20, 788.29
COMPLICATIONS OF SURGICAL AND MEDICAL CARE Mechanical Complication of Cardiac Device, Implant and Graft
Mechanical Complication of Cardiac Pacemaker and AICD
996.00, 996.01, 996.04

PHC4 Cardiac Surgery Report Quarter 3, 2011 to Quarter 4, 2012 Data Technical Notes
APPENDIX B: REASONS FOR READMISSIONS DEFINITIONS (CONTINUED)
A-10
Mechanical Complication of Heart Valve Prosthesis
996.02
Mechanical Complication of Coronary Artery Bypass Graft
996.03
Other and Unspecified Mechanical Complication
996.09, 996.1
Other Complication of Internal Prosthetic Device, Implant and Graft Other Complication of Heart Valve Prosthesis
996.71
Other Complication of Other Cardiac Device, Implant and Graft
996.72
Other Complicaton of Vascular Device, Implant and Graft
996.74
Shock Postoperative Shock
998.01, 998.002, 998.012, 998.022, 998.092
Cardiogenic Shock
785.51
Other Shock
785.50, 785.59
Hemorrhage and Hematoma Complicating a Procedure 459.0, 998.11, 998.12, 998.13
Foreign Body Accidentally Left or Accidental Laceration During a Procedure 998.2, 998.4, 998.7
Dehiscence and Rupture of Operation Wound 998.31, 998.32, 998.6, 998.83
Other Complications of Surgical and Medical Care Nervous System Complication
997.00, 997.01, 997.09
Circulatory System Complication
997.1, 997.2, 997.71, 997.72, 997.79, 999.1, 999.2
Respiratory System Complication
519.00, 519.02, 519.09, 997.39
Digestive System Complication
536.40, 536.42, 536.49, 997.41, 997.492
Urinary System Complication
997.5
Other Complications
998.89, 998.9, 999.60, 999.61, 999.62, 999.63, 999.69, 999.70, 999.71, 999.72, 999.73, 999.74, 999.75, 999.76, 999.77, 999.78, 999.79, 999.80, 999.82, 999.83, 999.84, 999.85, 999.88, 999.89
INFECTIONS Postoperative Infections
997.31, 998.51, 998.59, 999.31, 999.322, 999.332, 999.342, 999.39
Sepsis and Bacteremia 038.0, 038.10, 038.11, 038.12, 038.19, 038.2, 038.3, 038.40, 038.41, 038.42, 038.43, 038.44, 038.49, 038.8, 038.9, 785.52, 790.7, 995.90, 995.91, 995.92
Pneumonia Pneumonia
481, 482.0, 482.1, 482.2, 482.30, 482.31, 482.32, 482.39, 482.40, 482.41, 482.42, 482.49, 482.81, 482.82, 482.83, 482.84, 482.89, 482.9, 485, 486, 511.1
Aspiration Pneumonia
507.0, 997.322
Empyema and Abscess of Lung 510.0, 510.9, 513.0, 513.1
Infection due to Device, Implant and Graft Cardiac Device, Implant and Graft
996.61
Vascular Device, Implant and Graft
996.62

PHC4 Cardiac Surgery Report Quarter 3, 2011 to Quarter 4, 2012 Data Technical Notes
APPENDIX B: REASONS FOR READMISSIONS DEFINITIONS (CONTINUED)
A-11
Other and Unspecified Infections due to Device, Implant and Graft
519.01, 536.41
Urinary Tract Infection 590.3, 590.9, 595.0, 599.0, 996.64
Cellulitis 681.00, 681.01, 681.02, 681.10, 681.11, 681.9, 682.0, 682.1, 682.2, 682.3, 682.4, 682.5, 682.6, 682.7, 682.8, 682.9
Osteomyelitis 730.03, 730.06, 730.07, 730.08, 730.09
Intestinal Infection due to Clostridium difficile 008.45
Other Infection Related Conditions and Symptoms 567.21, 567.29, 567.9, 590.2, 780.60, 780.61, 780.62, 780.66
FLUID AND ELECTROLYTE IMBALANCE Hyperosmolality and Hyposmolality
276.0, 276.1
Acidosis and Alkalosis 276.2, 276.3, 276.4
Dehydration and Hypovolemia 276.50, 276.51, 276.52
Fluid Overload 276.61, 276.69
Hyperpotassemia and Hypopotassemia 276.7, 276.8
Other Electrolyte and Fluid Disorders 276.9
ANEMIA AND COAGULATION DEFECTS Anemia
Acute Posthemorrhagic Anemia
285.1
Anemia
280.0, 285.9
Coagulation Defects Hemorrhagic Disorders due to Anticoagulants
286.51
Thrombocytopenia
287.41, 287.49, 287.5, 289.84, 446.6
Other Coagulation Defects
286.6, 286.9, 289.82, 790.92
1 Invalid as of Oct 1, 2011 2 Valid as of Oct 1, 2011

PHC4 Cardiac Surgery Report Quarter 3, 2011 to Quarter 4, 2012 Data Technical Notes
APPENDIX C: DEFINITIONS FOR ICD-9-CM CODE-BASED POTENTIAL RISK FACTORS
A-12
TABLE C1: ALL PROCEDURE GROUPS
Potential Risk Factor ICD-9-CM Codes
Acute Myocardial Infarction (AMI) – Initial Episode of Care
Principal diagnosis (pdx) – 410.01, 410.11, 410.21, 410.31, 410.41, 410.51, 410.61, 410.71, 410.81, 410.91
Acute Myocardial Infarction (AMI) – Subsequent Episode of Care
410.02, 410.12, 410.22, 410.32, 410.42, 410.52, 410.62, 410.72, 410.82, 410.92
Alcohol-Related Disorders 291.0, 291.1, 291.2, 291.3, 291.5, 291.81, 291.82, 291.89, 291.9, 303.00, 303.01, 303.02, 303.90, 303.91, 303.92, 305.00, 305.01, 305.02
Anemia 280.1, 280.8, 280.9, 281.0, 281.1, 281.2, 281.3, 281.4, 281.8, 281.9, 282.0, 282.1, 282.2, 282.3, 282.40, 282.41, 282.42, 282.43, 282.44, 282.45, 282.46, 282.47, 282.49, 282.5, 282.60, 282.61, 282.62, 282.63, 282.64, 282.68, 282.69, 282.7, 282.8, 282.9, 283.0, 283.10, 283.11, 283.19, 283.2, 283.9, 284.01, 284.09, 284.1*,
284.11, 284.12, 284.19, 284.2, 284.81, 284.89, 284.9, 285.0, 285.21, 285.22, 285.29, 285.3, 285.8
Angina 413.0, 413.1, 413.9
Angina, Unstable 411.1
Cancer 140.0-209.36, 209.70-209.79, 230.0-239.9
Cancer of the Respiratory System and Intrathoracic Organs
162.0, 162.2, 162.3, 162.4, 162.5, 162.8, 162.9, 163.0, 163.1, 163.8, 163.9, 164.0, 164.1, 164.2, 164.3, 164.8, 164.9, 165.0, 165.8, 165.9, 170.3, 171.4, 196.1, 197.0, 197.1, 197.2, 197.3, 200.00, 200.01, 200.02, 200.12, 200.22, 200.32, 200.42, 200.52, 200.62, 200.72, 200.82, 201.02, 201.12, 201.22, 201.42, 201.52, 201.62, 201.72, 201.92, 202.02, 202.12, 202.22, 202.32, 202.42, 202.52, 202.62, 202.72, 202.82, 202.92, 209.21, 209.22, 231.0, 231.1, 231.2, 231.8, 231.9, 235.6, 235.7, 235.8, 235.9
Cardiac Adhesions 423.1, 519.3
Cardiac Assist Device Prior to First CABG/Valve Surgery Date
37.60, 37.62, 37.65, 37.66, 37.68
Cardiomyopathy 425.1*, 425.11, 425.18, 425.3, 425.4, 425.5, 425.8, 425.9, 429.3
Cardiopulmonary Resuscitation (CPR) Prior to First CABG/Valve Surgery Date
93.93, 99.60, 99.62, 99.63
Cerebrovascular Disease 433.00, 433.10, 433.20, 433.30, 433.80, 433.90, 434.00, 434.10, 434.90, 437.0, 437.1, 437.3, 437.4, 442.81, 446.5
Chronic Kidney Disease 403.00, 403.01, 403.10, 403.11, 403.90, 403.91, 404.00, 404.02, 404.10, 404.12, 404.90, 404.92, 585.1, 585.2, 585.3, 585.4, 585.5, 585.6, 585.9
Chronic Lung Disease 491.0, 491.1, 491.20, 491.21, 491.22, 492.0, 492.8, 493.20, 493.21, 493.22, 494.0, 494.1, 496, 500, 501, 502, 503, 504, 505, 506.4, 508.1, 515, 518.2, 518.83
Chronic Pulmonary Hypertension 416.0, 416.1, 416.2, 416.8, 416.9
Coagulopathy 286.0, 286.1, 286.2, 286.3, 286.4, 287.30, 287.31, 287.32, 287.33, 287.39, 289.81
Congenital Heart Anomalies 745.0, 745.10, 745.11, 745.12, 745.19, 745.2, 745.3, 745.4, 745.5, 745.60, 745.61, 745.69, 745.7, 745.8, 745.9, 746.01, 746.02, 746.09, 746.1, 746.2, 746.3, 746.4, 746.5, 746.6, 746.7, 746.81, 746.82, 746.83, 746.84, 746.85, 746.86, 746.87, 746.89, 746.9, 747.0, 747.10, 747.11, 747.20, 747.21, 747.22, 747.29, 747.3*, 747.31, 747.32, 747.39, 747.40, 747.41, 747.42, 747.49
Dental Extraction Prior to First CABG/Valve Surgery Date
23.09, 23.19
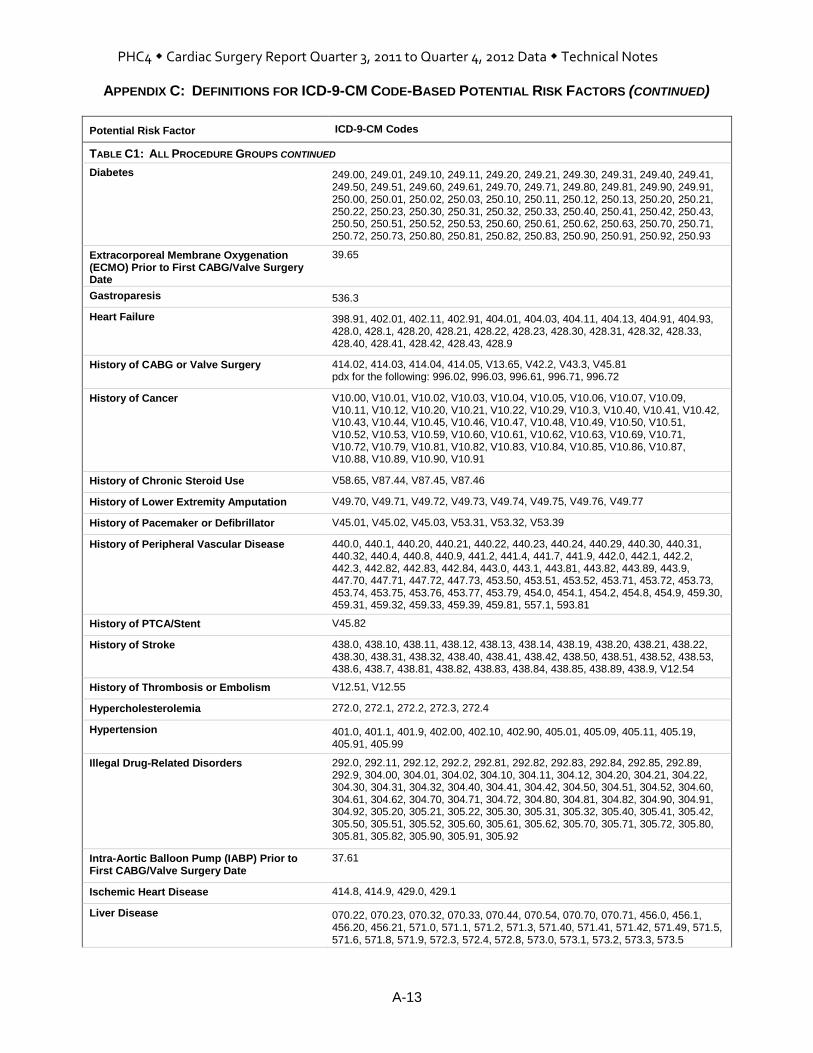
PHC4 Cardiac Surgery Report Quarter 3, 2011 to Quarter 4, 2012 Data Technical Notes
APPENDIX C: DEFINITIONS FOR ICD-9-CM CODE-BASED POTENTIAL RISK FACTORS (CONTINUED)
A-13
Potential Risk Factor ICD-9-CM Codes
TABLE C1: ALL PROCEDURE GROUPS CONTINUED
Diabetes 249.00, 249.01, 249.10, 249.11, 249.20, 249.21, 249.30, 249.31, 249.40, 249.41, 249.50, 249.51, 249.60, 249.61, 249.70, 249.71, 249.80, 249.81, 249.90, 249.91, 250.00, 250.01, 250.02, 250.03, 250.10, 250.11, 250.12, 250.13, 250.20, 250.21, 250.22, 250.23, 250.30, 250.31, 250.32, 250.33, 250.40, 250.41, 250.42, 250.43, 250.50, 250.51, 250.52, 250.53, 250.60, 250.61, 250.62, 250.63, 250.70, 250.71, 250.72, 250.73, 250.80, 250.81, 250.82, 250.83, 250.90, 250.91, 250.92, 250.93
Extracorporeal Membrane Oxygenation (ECMO) Prior to First CABG/Valve Surgery Date
39.65
Gastroparesis 536.3
Heart Failure 398.91, 402.01, 402.11, 402.91, 404.01, 404.03, 404.11, 404.13, 404.91, 404.93, 428.0, 428.1, 428.20, 428.21, 428.22, 428.23, 428.30, 428.31, 428.32, 428.33, 428.40, 428.41, 428.42, 428.43, 428.9
History of CABG or Valve Surgery 414.02, 414.03, 414.04, 414.05, V13.65, V42.2, V43.3, V45.81 pdx for the following: 996.02, 996.03, 996.61, 996.71, 996.72
History of Cancer V10.00, V10.01, V10.02, V10.03, V10.04, V10.05, V10.06, V10.07, V10.09, V10.11, V10.12, V10.20, V10.21, V10.22, V10.29, V10.3, V10.40, V10.41, V10.42, V10.43, V10.44, V10.45, V10.46, V10.47, V10.48, V10.49, V10.50, V10.51, V10.52, V10.53, V10.59, V10.60, V10.61, V10.62, V10.63, V10.69, V10.71, V10.72, V10.79, V10.81, V10.82, V10.83, V10.84, V10.85, V10.86, V10.87, V10.88, V10.89, V10.90, V10.91
History of Chronic Steroid Use V58.65, V87.44, V87.45, V87.46
History of Lower Extremity Amputation V49.70, V49.71, V49.72, V49.73, V49.74, V49.75, V49.76, V49.77
History of Pacemaker or Defibrillator V45.01, V45.02, V45.03, V53.31, V53.32, V53.39
History of Peripheral Vascular Disease 440.0, 440.1, 440.20, 440.21, 440.22, 440.23, 440.24, 440.29, 440.30, 440.31, 440.32, 440.4, 440.8, 440.9, 441.2, 441.4, 441.7, 441.9, 442.0, 442.1, 442.2, 442.3, 442.82, 442.83, 442.84, 443.0, 443.1, 443.81, 443.82, 443.89, 443.9, 447.70, 447.71, 447.72, 447.73, 453.50, 453.51, 453.52, 453.71, 453.72, 453.73, 453.74, 453.75, 453.76, 453.77, 453.79, 454.0, 454.1, 454.2, 454.8, 454.9, 459.30, 459.31, 459.32, 459.33, 459.39, 459.81, 557.1, 593.81
History of PTCA/Stent V45.82
History of Stroke 438.0, 438.10, 438.11, 438.12, 438.13, 438.14, 438.19, 438.20, 438.21, 438.22, 438.30, 438.31, 438.32, 438.40, 438.41, 438.42, 438.50, 438.51, 438.52, 438.53, 438.6, 438.7, 438.81, 438.82, 438.83, 438.84, 438.85, 438.89, 438.9, V12.54
History of Thrombosis or Embolism V12.51, V12.55
Hypercholesterolemia 272.0, 272.1, 272.2, 272.3, 272.4
Hypertension 401.0, 401.1, 401.9, 402.00, 402.10, 402.90, 405.01, 405.09, 405.11, 405.19, 405.91, 405.99
Illegal Drug-Related Disorders 292.0, 292.11, 292.12, 292.2, 292.81, 292.82, 292.83, 292.84, 292.85, 292.89, 292.9, 304.00, 304.01, 304.02, 304.10, 304.11, 304.12, 304.20, 304.21, 304.22, 304.30, 304.31, 304.32, 304.40, 304.41, 304.42, 304.50, 304.51, 304.52, 304.60, 304.61, 304.62, 304.70, 304.71, 304.72, 304.80, 304.81, 304.82, 304.90, 304.91, 304.92, 305.20, 305.21, 305.22, 305.30, 305.31, 305.32, 305.40, 305.41, 305.42, 305.50, 305.51, 305.52, 305.60, 305.61, 305.62, 305.70, 305.71, 305.72, 305.80, 305.81, 305.82, 305.90, 305.91, 305.92
Intra-Aortic Balloon Pump (IABP) Prior to First CABG/Valve Surgery Date
37.61
Ischemic Heart Disease 414.8, 414.9, 429.0, 429.1
Liver Disease 070.22, 070.23, 070.32, 070.33, 070.44, 070.54, 070.70, 070.71, 456.0, 456.1, 456.20, 456.21, 571.0, 571.1, 571.2, 571.3, 571.40, 571.41, 571.42, 571.49, 571.5, 571.6, 571.8, 571.9, 572.3, 572.4, 572.8, 573.0, 573.1, 573.2, 573.3, 573.5

PHC4 Cardiac Surgery Report Quarter 3, 2011 to Quarter 4, 2012 Data Technical Notes
APPENDIX C: DEFINITIONS FOR ICD-9-CM CODE-BASED POTENTIAL RISK FACTORS (CONTINUED)
A-14
Potential Risk Factor ICD-9-CM Codes
TABLE C1: ALL PROCEDURE GROUPS CONTINUED
Long-term Use of Anticoagulants and Antiplatelets
V58.61, V58.63
Long-term Use of Insulin V58.67
Lupus Erythematosus, Systemic 710.0
Malnutrition 261, 262, 263.0, 263.1, 263.2, 263.8, 263.9, 799.4, V85.0
Mental Disorders 295.00-295.95, 296.00-296.99, 297.0, 297.1, 297.2, 297.3, 297.8, 297.9, 298.0, 298.1, 298.4, 298.8, 298.9, 299.00, 299.01, 299.10, 299.11, 299.80, 299.81, 299.90, 299.91, 300.00, 300.01, 300.02, 300.09, 300.10, 300.11, 300.12, 300.13, 300.14, 300.15, 300.16, 300.19, 300.20, 300.21, 300.22, 300.23, 300.29, 300.3, 300.4, 300.5, 300.6, 300.7, 300.81, 300.82, 300.89, 300.9, 301.0, 301.10, 301.11, 301.12, 301.13, 301.20, 301.21, 301.22, 301.3, 301.4, 309.1, 311, 317, 318.0, 318.1, 318.2, 319, 331.0, 332.0
Myocardial Infarction, Old 412
Non-Invasive Mechanical Ventilation (NIMV) Prior to First CABG/Valve Surgery Date
93.90
Morbid Obesity 278.01, V85.39, V85.41, V85.42, V85.43, V85.44, V85.45
Obesity 278.00, 278.01, V85.30, V85.31, V85.32, V85.33, V85.34, V85.35, V85.36, V85.37, V85.38, V85.39, V85.41, V85.42, V85.43, V85.44, V85.45
Obstructive Sleep Apnea and Obesity-Related Hypoventilation Syndrome
278.03, 327.23
Osteoporosis 733.00, 733.01, 733.02, 733.03, 733.09
Other Open Heart Procedure Same Day as First CABG/Valve Surgery
35.00, 35.01, 35.02, 35.03, 35.04, 35.31, 35.32, 35.34, 35.35, 35.39, 35.71, 35.95, 35.98, 36.2, 36.31, 36.32, 36.39, 36.91, 36.99, 37.10, 37.11, 37.12, 37.31, 37.41, 37.49, 37.51, 37.52, 37.53
Oxygen Therapy Dependence (long-term) V46.11, V46.2
Percutaneous Valve Procedures Prior to First CABG/Valve Surgery Date
35.05, 35.06, 35.07, 35.08, 35.09, 35.96, 35.97
Percutaneous Valve Procedures Same Day as First CABG/Valve Surgery
35.05, 35.06, 35.07, 35.08, 35.09, 35.96, 35.97
Preoperative Acute Renal Failure 584.5, 584.6, 584.7, 584.8, 584.9 plus confirmation of acute renal failure prior to first CABG and/or valve surgery based on review of medical record documentation.
Preoperative Cardiogenic Shock 785.51 plus confirmation of cardiogenic shock prior to first CABG and/or valve surgery based on review of medical record documentation.
PTCA/Stent Prior to First CABG/Valve Surgery Date
00.66, 17.55, 36.06, 36.07, 36.09
PTCA/Stent Same Day as First CABG/Valve Surgery
00.66, 17.55, 36.06, 36.07, 36.09
1 Invalid as of October 1, 2011
TABLE C2: CABG WITHOUT VALVE PROCEDURE GROUP
Potential Risk Factor ICD-9-CM CODES
Heart Valve Disease 394.0, 394.1, 394.2, 394.9, 395.0, 395.1, 395.2, 395.9, 396.0, 396.1, 396.2, 396.3, 396.8, 396.9, 397.0, 397.1, 424.0, 424.1, 424.2, 424.3

PHC4 Cardiac Surgery Report Quarter 3, 2011 to Quarter 4, 2012 Data Technical Notes
APPENDIX C: DEFINITIONS FOR ICD-9-CM CODE-BASED POTENTIAL RISK FACTORS (CONTINUED)
A-15
TABLE C3: VALVE WITHOUT CABG PROCEDURE GROUP
Potential Risk Factor ICD-9-CM CODES
Coronary Artery Disease 414.00, 414.01
Excision of Left Atrial Appendage (LAA) Same Day as First CABG/Valve Surgery
37.36
Excision of Other Lesion Same Day as First CABG/Valve Surgery
37.33, 37.37
Multiple Valve Procedures Same Day as First CABG/Valve Surgery
Any combination of valve procedure codes (i.e., replacements and/or repairs): 35.10, 35.11, 35.12, 35.13, 35.14, 35.20, 35.21, 35.22, 35.23, 35.24, 35.25, 35.26, 35.27, 35.28, 35.33, 35.99
Heart Valve Disease (Rheumatic) (only codes
for rheumatic heart valve disease apply to valve cases) 394.0, 394.1, 394.2, 394.9, 395.0, 395.1, 395.2, 395.9, 396.0, 396.1, 396.2, 396.3, 396.8, 396.9, 397.0, 397.1
Type of Valve Procedure – Annuloplasty, Same Day as First CABG/Valve Surgery
35.33
Type of Valve Procedure – Aortic, Same Day as First CABG/Valve Surgery
35.11, 35.21, 35.22
Type of Valve Procedure – Mitral, Same Day as First CABG/Valve Surgery
35.12, 35.23, 35.24
Type of Valve Procedure – Pulmonary, Same Day as First CABG/Valve Surgery
35.13, 35.25, 35.26
Type of Valve Procedure – Tricuspid, Same Day as First CABG/Valve Surgery
35.14, 35.27, 35.28
Valve Replacement Same Day as First CABG/Valve Surgery
35.21, 35.22, 35.23, 35.24, 35.25, 35.26, 35.27, 35.28
TABLE C4: VALVE WITH CABG PROCEDURE GROUP
Potential Risk Factor ICD-9-CM CODES
Excision of Left Atrial Appendage (LAA) Same Day as First CABG/Valve Surgery
37.36
Excision of Other Lesion Same Day as First CABG/Valve Surgery
37.33, 37.37
Multiple Valve Procedures Same Day as First CABG/Valve Surgery
Any combination of valve procedure codes (i.e., replacements and/or repairs): 35.10, 35.11, 35.12, 35.13, 35.14, 35.20, 35.21, 35.22, 35.23, 35.24, 35.25, 35.26, 35.27, 35.28, 35.33, 35.99
Heart Valve Disease (Rheumatic) (only codes
for rheumatic heart valve disease apply to valve cases) 394.0, 394.1, 394.2, 394.9, 395.0, 395.1, 395.2, 395.9, 396.0, 396.1, 396.2, 396.3, 396.8, 396.9, 397.0, 397.1
Type of Valve Procedure – Annuloplasty, Same Day as First CABG/Valve Surgery
35.33
Type of Valve Procedure – Aortic, Same Day as First CABG/Valve Surgery
35.11, 35.21, 35.22
Type of Valve Procedure – Mitral, Same Day as First CABG/Valve Surgery
35.12, 35.23, 35.24
Type of Valve Procedure – Pulmonary, Same Day as First CABG/Valve Surgery
35.13, 35.25, 35.26
Type of Valve Procedure – Tricuspid, Same Day as First CABG/Valve Surgery
35.14, 35.27, 35.28
Valve Replacement Same Day as First CABG/Valve Surgery
35.21, 35.22, 35.23, 35.24, 35.25, 35.26, 35.27, 35.28

PHC4 Cardiac Surgery Report Quarter 3, 2011 to Quarter 4, 2012 Data Technical Notes
APPENDIX D: EXAMPLE OF LOGISTIC REGRESSION AND CALCULATING STATISTICAL
RATINGS
A-16
Total Cases:
Number of hospitalizations after exclusions.
Actual Deaths: Total number of deaths (death is a discharge status equal to 20).
Rate: Total number of deaths / Total number of cases.
Expected Deaths: Sum of each patient’s probability of death (PD).
Rate: Sum of each patient’s probability of death (PD) / Total number of cases.
To calculate a patient’s probability of death:
Step 1: Calculate βX:
βX = -6.1001 + 0.9009 (Valve with CABG) + 0.0006 (Age) +. . . + 1.2334 (Preoperative Cardiogenic Shock) + . . . + 1.5315 (Liver Disease) + coefficient (other variables in in-hospital mortality model) . . .
Step 2: Calculate the estimated probability of death (PD) using βX:
PD = eβX
/ (1 + eβX
) where e 2.7182818285
Test Statistic: z = (Actual Deaths – Expected Deaths) / Standard Deviation of Mortality
To compute Standard Deviation of Mortality:
Step 1: Compute the estimated variance of each patient’s probability of death (VARPAT):
VARPAT = (PD) (1-PD)
Step 2: Calculate the Standard Deviation of Mortality
SUMVAR = sum of VARPAT across all cases
Standard Deviation of Mortality = square root of SUMVAR
p-value: (two sided)
Calculated using test statistic as a normal z-score
Statistical Rating:
If p-value <0.05 and test statistic >0, then more deaths than expected (denoted as “”) If p-value <0.05 and test statistic <0, then fewer deaths than expected (denoted as “”) Otherwise, the number of deaths were within the expected range (denoted as “”)
Expected Range:
Lower limit = Expected Deaths – 1.960 (Standard Deviation of Mortality) Upper limit = Expected Deaths + 1.960 (Standard Deviation of Mortality)

PHC4 Cardiac Surgery Report Quarter 3, 2011 to Quarter 4, 2012 Data Technical Notes
APPENDIX E: EXAMPLE OF CASE-MIX ADJUSTMENT
A-17
Region 1: Southwestern PA Procedure Group: Valve without CABG
Total Cases: Number of hospitalizations for a hospital after exclusions (equal to n). Actual Charge: Average actual charges for a hospital (Average ActChg). Expected Charge: Average expected charges for a hospital (Average ExpChg). Step 1: Calculate each hospitalization’s expected charge (ExpChg):
ExpChg = the expected charge for a hospitalization, which is equal to the average charge for all hospitalizations (after exclusion) in the hospital’s same region and MS-DRG group within the procedure group.
Region 1 - Southwestern PA, valve without CABG, MS-DRG Group 5: $217,167
or Region 1 - Southwestern PA, valve without CABG, MS-DRG Group 6: $164,137
Step 2: Calculate the average ExpChg for a hospital (expected charge):
Average ExpChg = Σ ExpChg
n
Case-Mix Adjusted Charge: Average ActChg
(Region 1 Average Actual Charge) Average ExpChg

Top Related