


Languages
Pages
Legal


8/3/2019 Tech Innovation S3
http://slidepdf.com/reader/full/tech-innovation-s3 1/41
ATOA Scientific TechnologiesEngineering Simulation For Innovation
Technology and InnovationManagement:
S3Technology Tools for InnovationRaj C Thiagarajan, PhD
To
SIBM SIII MBA Students

8/3/2019 Tech Innovation S3
http://slidepdf.com/reader/full/tech-innovation-s3 2/41
Tools used from Pre history
2
• Axe

8/3/2019 Tech Innovation S3
http://slidepdf.com/reader/full/tech-innovation-s3 3/41
Primates also use tools…
3
• Female Gorilla

8/3/2019 Tech Innovation S3
http://slidepdf.com/reader/full/tech-innovation-s3 4/41
©ATOA Scientific Technologies Pvt Ltd | SIBM , III Semester MBA| Technology and Innovation Management
TIM –S3: Technology Tools for innovation
4
• Technology tools for value creation
• Innovation: Quality : Speed: Cost
• Engineering Tools
– Concurrent Engineering
– QFD
– DfX
–FMEA
– Simulation based product Development
• Innovation Tools
– TRIZ

8/3/2019 Tech Innovation S3
http://slidepdf.com/reader/full/tech-innovation-s3 5/41
©ATOA Scientific Technologies Pvt Ltd | SIBM , III Semester MBA| Technology and Innovation Management
Wealth Creation Cycle
• Tools for Wealthcreation
• Value = Benefit – Cost
• Technology and
innovation tools for
value creation
BasicResearch
AppliedResearch
IndustrialResearch
Innovation/Product
development
Commercialization
WealthCreation

8/3/2019 Tech Innovation S3
http://slidepdf.com/reader/full/tech-innovation-s3 6/41
©ATOA Scientific Technologies Pvt Ltd | SIBM , III Semester MBA| Technology and Innovation Management
Traditional Product Development
6
• Product plan to
Commercialization
• Water fall1. Product Planning
2. Concept Design
3. Concept Evaluation
4. Preliminary Design
5. Design Evaluation
6. Final Design
7. Prototyping
8. Pilot production
9. Mass production
10. Product commercialization
• Sequential process
Product
Planning
Concept
Design
ConceptEvaluation
Preliminary
Design
DesignEvaluation
Final
Design
Prototyping
Pilot
production
Mass
production
Productcommercialization
Development Cycle Time

8/3/2019 Tech Innovation S3
http://slidepdf.com/reader/full/tech-innovation-s3 7/41©ATOA Scientific Technologies Pvt Ltd | SIBM , III Semester MBA| Technology and Innovation Management
Traditional Product Development
7
• Benefits
• Easy Management and control
• Uncertainty is minimized
• Functional expertise optimization
• Drawback
–Potential to miss customerrequirements
– Design that can’t be Manufactured
– Longer cycle time
Marketing EngineeringPilot
productionTesting
Massproduction
Product Information Flow
Design Changes, Errors, Corrections
8/3/2019 Tech Innovation S3
http://slidepdf.com/reader/full/tech-innovation-s3 8/41©ATOA Scientific Technologies Pvt Ltd | SIBM , III Semester MBA| Technology and Innovation Management
Cost of Design Changes
8
• Cost of Designchanges increases
exponentially with
product development
cycle.
• 80% of the product
cost is determined or
committed at theconcept design stage
ProductPlanning
ConceptDesign
FinalDesign
PilotProduction
Massproduction
C o s t o f D e s i g n
c h
a n g e
Product
Planning
Concept
Design
Final
Design
Pilot
Production
Mass
production
P r o d u c
t C o s t
Product Development Cycle0%
100%
Committed
Actual
8/3/2019 Tech Innovation S3
http://slidepdf.com/reader/full/tech-innovation-s3 9/41©ATOA Scientific Technologies Pvt Ltd | SIBM , III Semester MBA| Technology and Innovation Management
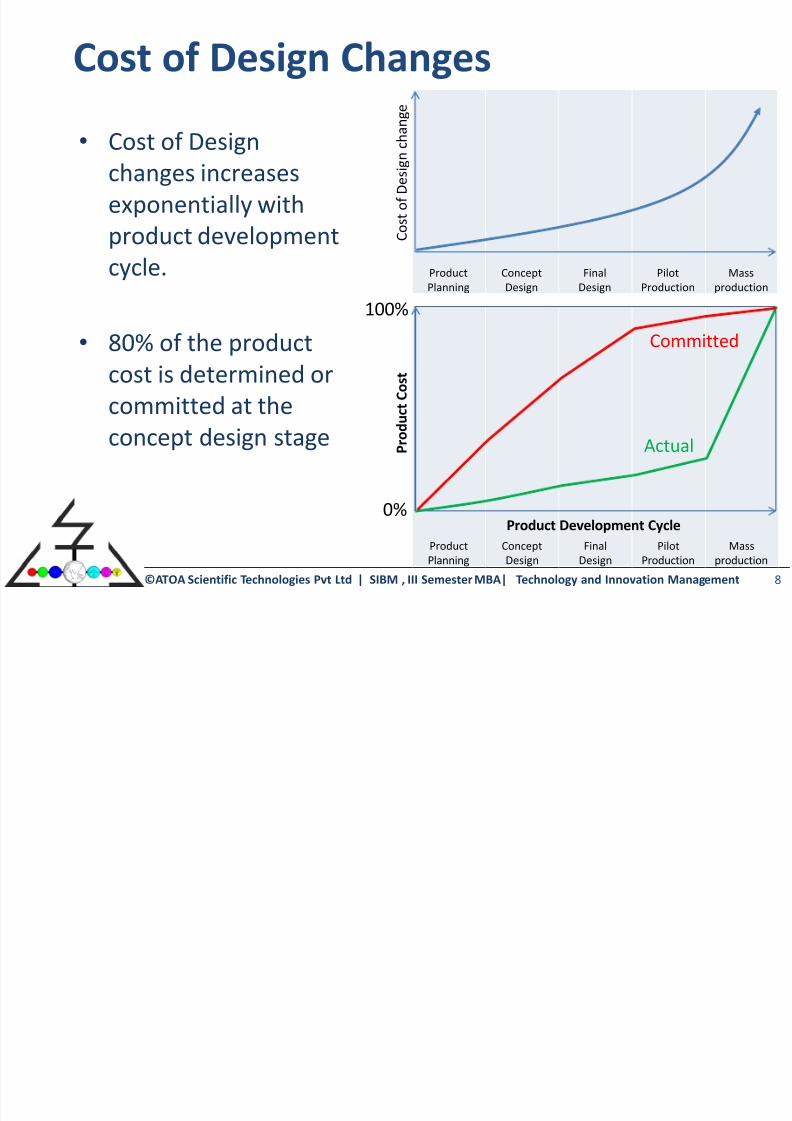
Cost of fixing
9
• Cost to find and repair defects
– @ Part 1X
– @ Sub assembly 10 X
– @ Final Assembly 100 X
– @ the Dealer 1000 X
– @ the customer 10000 X
@
Part
1X
@
Sub assembly
10 X
@Final Assembly 100 X
@
Dealer
1000 X
@
Customer
10000 X

8/3/2019 Tech Innovation S3
http://slidepdf.com/reader/full/tech-innovation-s3 10/41©ATOA Scientific Technologies Pvt Ltd | SIBM , III Semester MBA| Technology and Innovation Management
Product Management Influence
10
• Productdevelopment and
management
• Managementactivity ratio
• Management
influencepotential
Product
Planning
Concept
Design
Final
Design
Pilot
Production
Mass
production
HIGH
Low
A c t i v i t y a n d
I n f l u e n c e
I n d e x

8/3/2019 Tech Innovation S3
http://slidepdf.com/reader/full/tech-innovation-s3 11/41©ATOA Scientific Technologies Pvt Ltd | SIBM , III Semester MBA| Technology and Innovation Management
Typical Response time of Industry
11
• Aero engine: ~10 Years to 5 Years
• Pharma: Drug molecule: ~ 8 Years to 4 years
• Medical Technology: ~ 24 months to 12 months
• Renewable NPI (Wind ): ~6 months to 1 months
• Finance: ~1 week to On the spot

8/3/2019 Tech Innovation S3
http://slidepdf.com/reader/full/tech-innovation-s3 12/41©ATOA Scientific Technologies Pvt Ltd | SIBM , III Semester MBA| Technology and Innovation Management
Larger Scope of Product design
12
• ENVIRONMENTAL REGULATIONS
Waste &
Emissions
Occupational
Health & Safety
Laws
Emergency Planning
Laws
Air Quality
Laws
Contaminated Land Requirements
Water Quality Laws
Chemicals Chemical Management Laws
Hazardous MaterialTransportation Laws
Waste
Management Laws
Health & Safety
8/3/2019 Tech Innovation S3
http://slidepdf.com/reader/full/tech-innovation-s3 13/41©ATOA Scientific Technologies Pvt Ltd | SIBM , III Semester MBA| Technology and Innovation Management
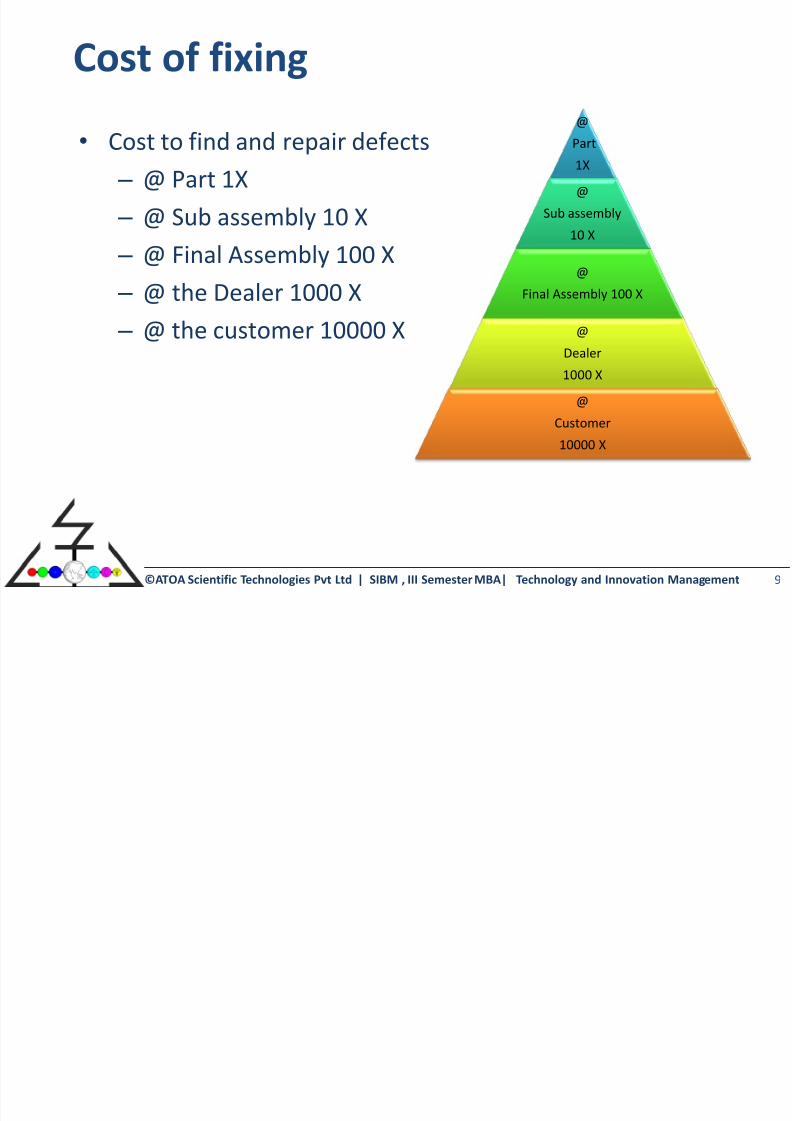
Product Development
13
We definitely need better process….
Customer
RequirementsProduct
Requirements
Product
DesignProduct
Marketing
Product
Delivery
Real Customer
Requirements
8/3/2019 Tech Innovation S3
http://slidepdf.com/reader/full/tech-innovation-s3 14/41©ATOA Scientific Technologies Pvt Ltd | SIBM , III Semester MBA| Technology and Innovation Management
Concurrent Engineering
14
• Concurrent consideration of all the product lifecyclerequirements at early stage of design.
– From functionality, manufacturability, assembly,
testing and verification, maintenance, environmental
impact, disposal, recycling and sustainability. – Converting hierarchical organizations into teams
• Overall goal of concurrent nature of the process
– significantly increase productivity and Quality
– Reduce development cost and Cycle time
– Prevention of problems
8/3/2019 Tech Innovation S3
http://slidepdf.com/reader/full/tech-innovation-s3 15/41©ATOA Scientific Technologies Pvt Ltd | SIBM , III Semester MBA| Technology and Innovation Management
Concurrent Engineering
15
• Concurrent Engineering
• Simultaneous Engineering
• Integrated Product Development

8/3/2019 Tech Innovation S3
http://slidepdf.com/reader/full/tech-innovation-s3 16/41©ATOA Scientific Technologies Pvt Ltd | SIBM , III Semester MBA| Technology and Innovation Management
Concurrent Engineering: Definition
16
•“Concurrent engineering methodologies permit the separate tasks of theproduct development process to be carried out simultaneously rather than
sequentially. Product design, testing, manufacturing and process planning
through logistics, for example, are done side-by-side and interactively.
Potential problems in fabrication, assembly, support and quality are
identified and resolved early in the design process.”
Izuchukwu, John. “Architecture and Process :The Role of Integrated Systems in Concurrent Engineering.” Industrial ManagementMar/Apr 1992: p. 19-23.
• “The simultaneous performance of product design and process design.
Typically, concurrent engineering involves the formation of cross-functional
teams. This allows engineers and managers of different disciplines to worktogether simultaneously in developing product and process design.” Foster, S. Thomas. Managing Quality: An Integrative Approach. Upper Saddle River New Jersey: Prentice Hall,
2001.

8/3/2019 Tech Innovation S3
http://slidepdf.com/reader/full/tech-innovation-s3 17/41©ATOA Scientific Technologies Pvt Ltd | SIBM , III Semester MBA| Technology and Innovation Management
Concurrent Engineering Cycle
17
• Concurrent Product Design and
Development
• Lowest overall life cycle costs
• Problem prevention from Problem Solving
DESIGN
Performance
Manufacturability
Quality and Cost
Service, Life
Environmental
Pilot
production
Testing and
Verification
Mass
Production

8/3/2019 Tech Innovation S3
http://slidepdf.com/reader/full/tech-innovation-s3 18/41©ATOA Scientific Technologies Pvt Ltd | SIBM , III Semester MBA| Technology and Innovation Management
Benefits
• Significantdevelopment time ,
defects, time to
market and failure
reduction• Improvements of
service life, Quality,
productivity and ROI.
Item Benfits
Development Time 30-50% Reduction
Engineering changes 60-95% Reduction
Scrap and Rework 75% Reduction
Defects 30-85% Reduction
Time to Market 20-90% Reduction
Field Failure Rate 60% Reduction
Service Life 100% improvement
Overall Quality 100 -600% improvement
Productivity 20 -110% improvement
Return on Assets 20 -120% improvement
BEFOREQFD
AFTER
QFD
CONCEPT DESIGNPLANNING FINAL DESIGN PRODUCTION
PLANNING PRE DESIGN FINAL DESIGN PRODUCTION
BENEFITS

8/3/2019 Tech Innovation S3
http://slidepdf.com/reader/full/tech-innovation-s3 19/41©ATOA Scientific Technologies Pvt Ltd | SIBM , III Semester MBA| Technology and Innovation Management
CE Environment
19
• People – Team
– Project
• Process
– Process modeling
– Process reengineering
– Info/ Data integration
• Technology
– Problem solving mechanisms
– DBMS
– PLM
8/3/2019 Tech Innovation S3
http://slidepdf.com/reader/full/tech-innovation-s3 20/41©ATOA Scientific Technologies Pvt Ltd | SIBM , III Semester MBA| Technology and Innovation Management
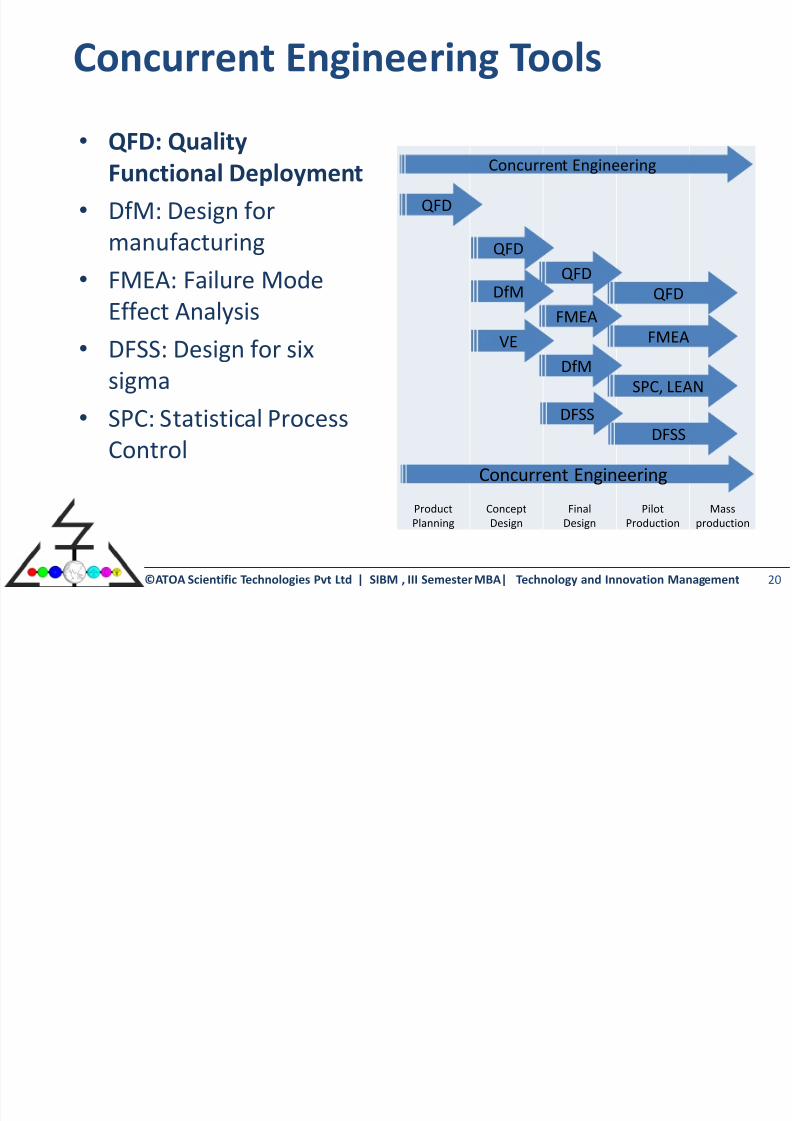
Concurrent Engineering Tools
20
• QFD: QualityFunctional Deployment
• DfM: Design for
manufacturing
• FMEA: Failure ModeEffect Analysis
• DFSS: Design for six
sigma
• SPC: Statistical ProcessControl
Product
Planning
Concept
Design
Final
Design
Pilot
Production
Mass
production
Concurrent Engineering
QFD
Concurrent Engineering
QFD
DfM
VE
QFD
FMEA
DfM
DFSS
QFD
FMEA
SPC, LEAN
DFSS

8/3/2019 Tech Innovation S3
http://slidepdf.com/reader/full/tech-innovation-s3 21/41©ATOA Scientific Technologies Pvt Ltd | SIBM , III Semester MBA| Technology and Innovation Management
QFD
21
• QFD: A tool that integrates the “voice of the customer” into
the product and service development process.
• A QFD matrix: The "house of quality".
• Customer requirements
• Engineering requirements
• Matrix of requirements relations
• Competitive benchmarks
• Engineering targets
team response and solutions
What’s What’s
vs.
How’s
How’s
P r i o r i t i e s
Trade-off opportunities
requirements
requirements flow down Technical Ranking
Product Targets
Customer Requirements
Design C o m
p e t i t i v eB e n c h m a r k i n g
8/3/2019 Tech Innovation S3
http://slidepdf.com/reader/full/tech-innovation-s3 22/41©ATOA Scientific Technologies Pvt Ltd | SIBM , III Semester MBA| Technology and Innovation Management
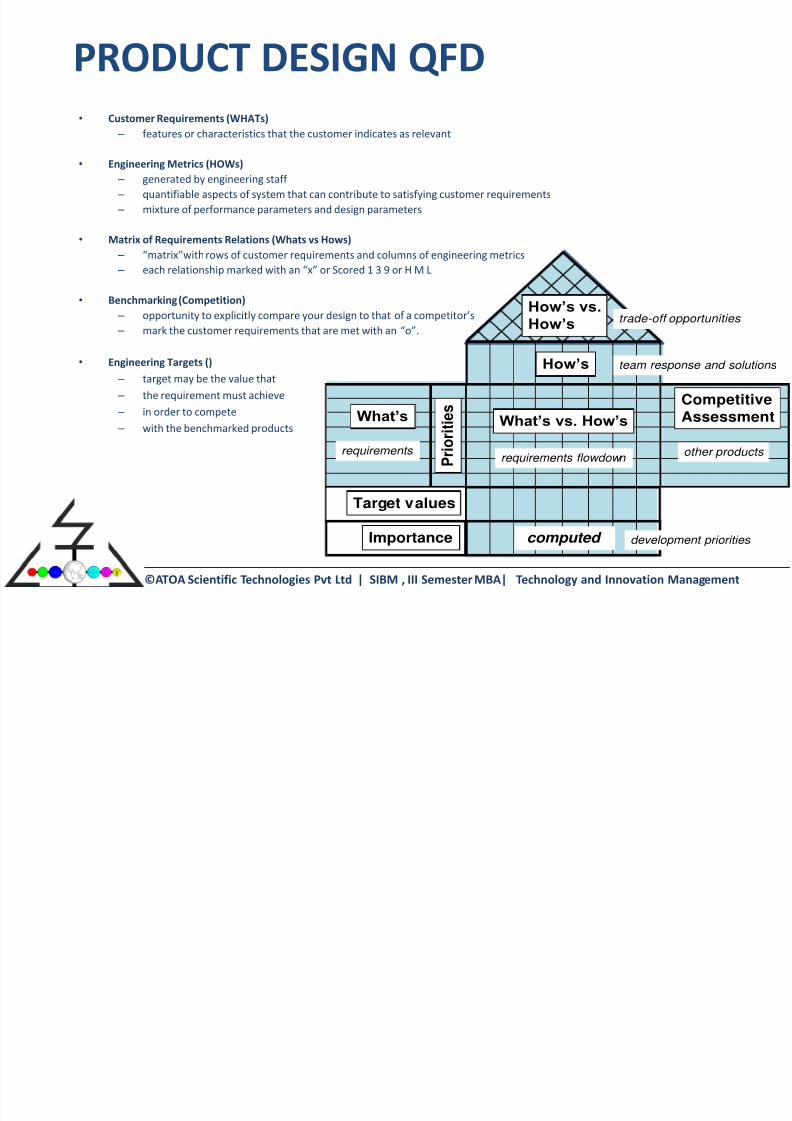
PRODUCT DESIGN QFD
• Customer Requirements (WHATs)
– features or characteristics that the customer indicates as relevant
• Engineering Metrics (HOWs)
– generated by engineering staff
– quantifiable aspects of system that can contribute to satisfying customer requirements
– mixture of performance parameters and design parameters
• Matrix of Requirements Relations (Whats vs Hows)
– “matrix”with rows of customer requirements and columns of engineering metrics
– each relationship marked with an “x” or Scored 1 3 9 or H M L
• Benchmarking (Competition)
– opportunity to explicitly compare your design to that of a competitor’s
– mark the customer requirements that are met with an “o”.
• Engineering Targets ()
– target may be the value that
– the requirement must achieve
–in order to compete
– with the benchmarked products What’s What’s vs. How’s
How’s vs.
How’s
How’s
P r i o r i t i e
s
Target values
Competitive
Assessment
Importance computed
trade-off opportunities
requirements other products
team response and solutions
requirements flowdown
development priorities
C C R i

8/3/2019 Tech Innovation S3
http://slidepdf.com/reader/full/tech-innovation-s3 23/41©ATOA Scientific Technologies Pvt Ltd | SIBM , III Semester MBA| Technology and Innovation Management
QFD Example
23
• First FRPRailway sleeper
to replace
Wood.
•IR,RDSO, DRDO,DST, IIT
• Planning to
First prototype
~ 1 year
Map Requirements to Product/Process Characteristics
(QFD: Quality Function Deployment)
Identify and Characterise
Product/Process Alternatives
Develop Product/Process
Selection Criteria,
Constraints & Goals
Address
entire life-cycle
(design
through
disposal)
Pre-selections
Selections
Compromise
Product/Process Specification
Materials
Structure
Process
Partition and Quantify Requirements
Capture Customer Requirements
Load Class: MLC 70
8/3/2019 Tech Innovation S3
http://slidepdf.com/reader/full/tech-innovation-s3 24/41
©ATOA Scientific Technologies Pvt Ltd | SIBM , III Semester MBA| Technology and Innovation Management
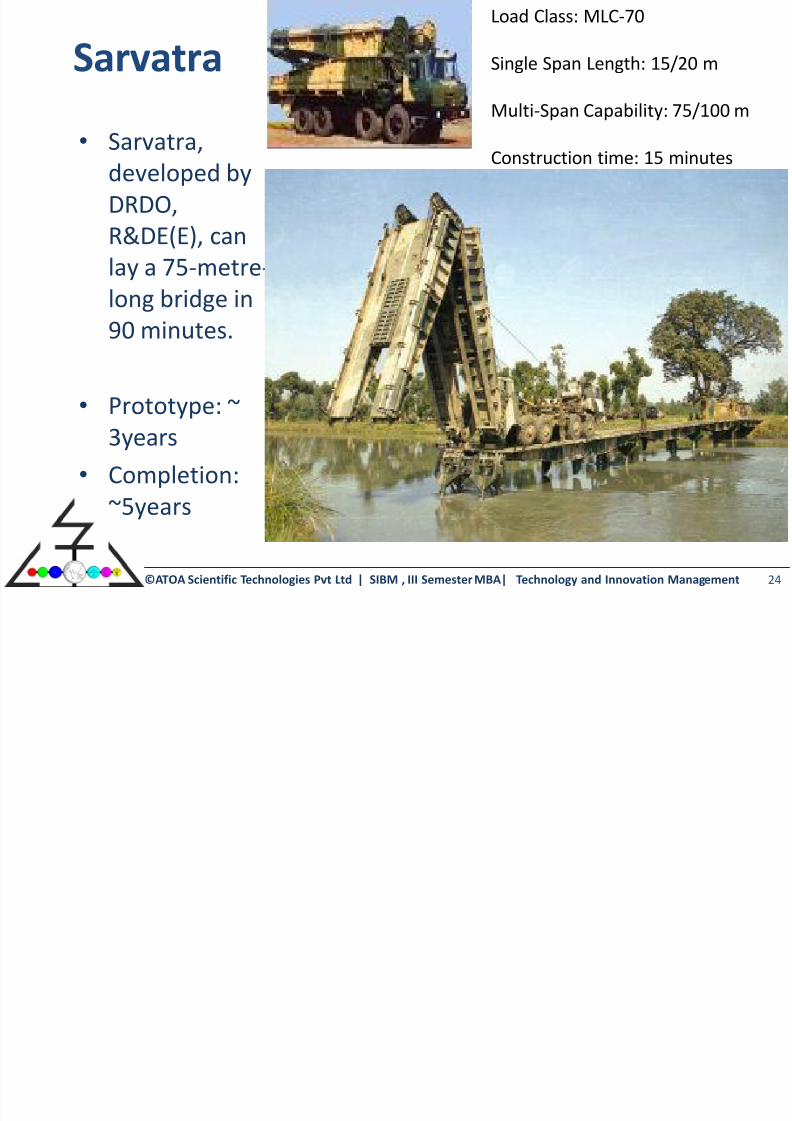
Sarvatra
24
• Sarvatra,developed by
DRDO,
R&DE(E), can
lay a 75-metre-long bridge in
90 minutes.
•Prototype: ~3years
• Completion:
~5years
Load Class: MLC-70
Single Span Length: 15/20 m
Multi-Span Capability: 75/100 m
Construction time: 15 minutes

8/3/2019 Tech Innovation S3
http://slidepdf.com/reader/full/tech-innovation-s3 25/41
©ATOA Scientific Technologies Pvt Ltd | SIBM , III Semester MBA| Technology and Innovation Management
QFD Flow down
25
• Planning Matrix
• Product Development Matrix
•Product manufacturing matrix
• Operator instruction matrix
PLANNING
PRODUCT
PROCESS
OPS

8/3/2019 Tech Innovation S3
http://slidepdf.com/reader/full/tech-innovation-s3 26/41
©ATOA Scientific Technologies Pvt Ltd | SIBM , III Semester MBA| Technology and Innovation Management
DfX
26
• Design for ‘X’.• X is a variable that can be substituted with, for,
Assembly, Cost, Environment, Fabrication,
Manufacture, Obsolescence, Procurement,
Reliability, Serviceability or Test.
• DfM: Design for Manufacturing
• DfA: Design for Assembly
• DfE: Design for Environment
• DfS: Design for Sustainability
8/3/2019 Tech Innovation S3
http://slidepdf.com/reader/full/tech-innovation-s3 27/41
©ATOA Scientific Technologies Pvt Ltd | SIBM , III Semester MBA| Technology and Innovation Management
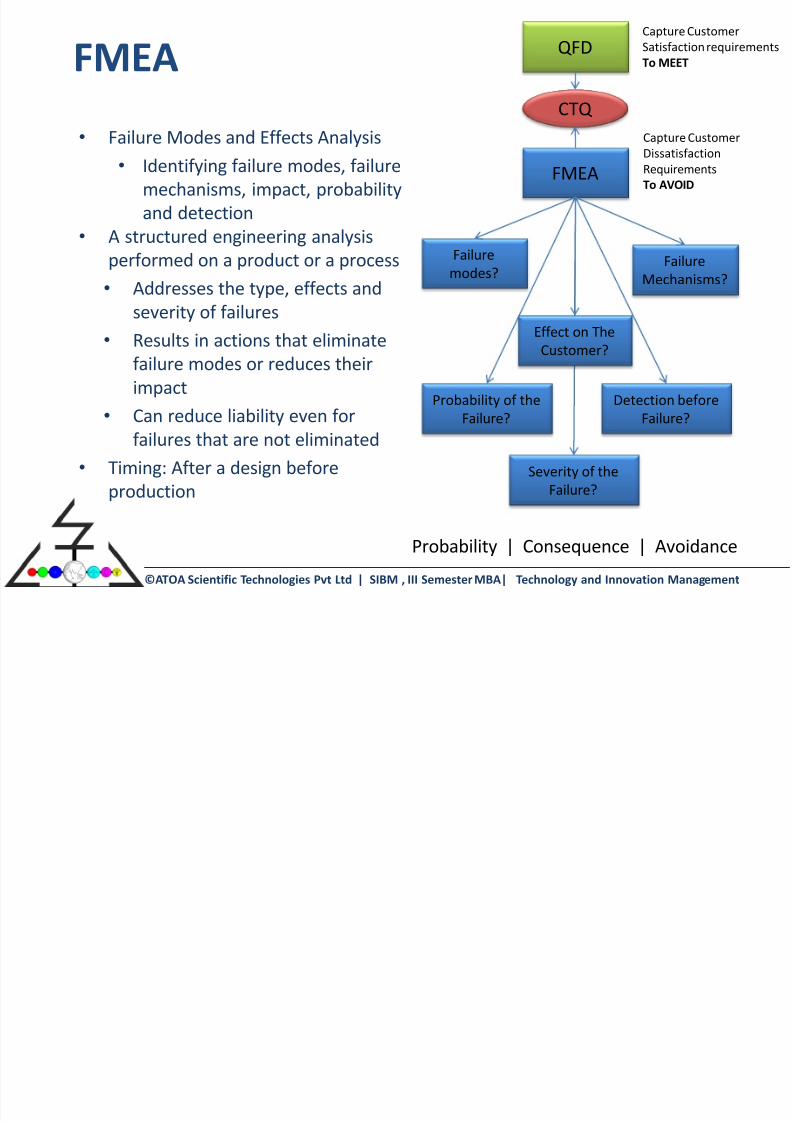
FMEA
•Failure Modes and Effects Analysis• Identifying failure modes, failure
mechanisms, impact, probability
and detection
• A structured engineering analysis
performed on a product or a process
• Addresses the type, effects and
severity of failures
• Results in actions that eliminate
failure modes or reduces their
impact
•Can reduce liability even forfailures that are not eliminated
• Timing: After a design before
production
QFD
FMEA
CTQ
Capture Customer
Satisfaction requirements
To MEET
Capture CustomerDissatisfaction
Requirements
To AVOID
Failure
modes?
Failure
Mechanisms?
Effect on The
Customer?
Probability of the
Failure?
Severity of the
Failure?
Detection before
Failure?
Probability | Consequence | Avoidance

8/3/2019 Tech Innovation S3
http://slidepdf.com/reader/full/tech-innovation-s3 28/41
©ATOA Scientific Technologies Pvt Ltd | SIBM , III Semester MBA| Technology and Innovation Management
FMEA
28
•Quality
meets the
specification
when new
• Reliability
continues to meet
the specification
through a period
of use
Quality/Reliability
intimately tied tovariability
WEAR OUT
failures
Overall
failures
Early failures
“Infant Morality”
Constant
Failure
Rate
Increasing
Failure
Rate
Decreasing
Failure
Rate
F a i l u r e
R a t e
Time
Load Strength Load Strength
WEAR OUT“Infant Morality”

8/3/2019 Tech Innovation S3
http://slidepdf.com/reader/full/tech-innovation-s3 29/41
©ATOA Scientific Technologies Pvt Ltd | SIBM , III Semester MBA| Technology and Innovation Management
Risk Priority Scores
Risk Priority Score =
Impact X Probability X
Detection
Impact: Severity of effect
Probability: Likelihood of occurrence
Detection: Difficulty of identifying failure
Effect Severity of Effect Ranking Hazardouswithout
warning Very high severity ranking when a potentialfailure mode affects safe system operation
and/or involves non compliance with
federal safety regulation without warning
10
Hazardous
with
warning Very high severity ranking when a potential
failure mode affects safe system operation
and/or involves non compliance with
federal safety regulation warning
9
Very High System/item inoperable with loss of primary function 8
High System/item operable, bit at reduced
performance level. User dissatisfied 7 Moderate System/item operable, but
comfort/convenience item inoperable 6 Low System/item operable, but
comfort/convenience item operable at
reduced level 5
Very Low Defect noticed by most customers 4 Minor Defect noticed by average customer 3 Very Minor Defect noticed by discriminating customer 2 None No effect 1

8/3/2019 Tech Innovation S3
http://slidepdf.com/reader/full/tech-innovation-s3 30/41
©ATOA Scientific Technologies Pvt Ltd | SIBM , III Semester MBA| Technology and Innovation Management
Other Tools/ Methods
30
• Value Engineering• VA/VE is an approach to productivity improvement that attempts to increase the value obtained by a
customer of a product by offering the same level of functionality at a lower cost.
• prioritise parts of the total design that are most worthy of attention.
• Configuration management•
Configuration simply refers to the arrangement of the parts or elements of something, andmanagement refers to the act or practice of managing.
• TQM• Total quality management (TQM) is a philosophy of pursuing continuous improvement in each process
through the integrated efforts of all individuals in the organization.
• DFSS, SPS, LEAN
8/3/2019 Tech Innovation S3
http://slidepdf.com/reader/full/tech-innovation-s3 31/41
©ATOA Scientific Technologies Pvt Ltd | SIBM , III Semester MBA| Technology and Innovation Management
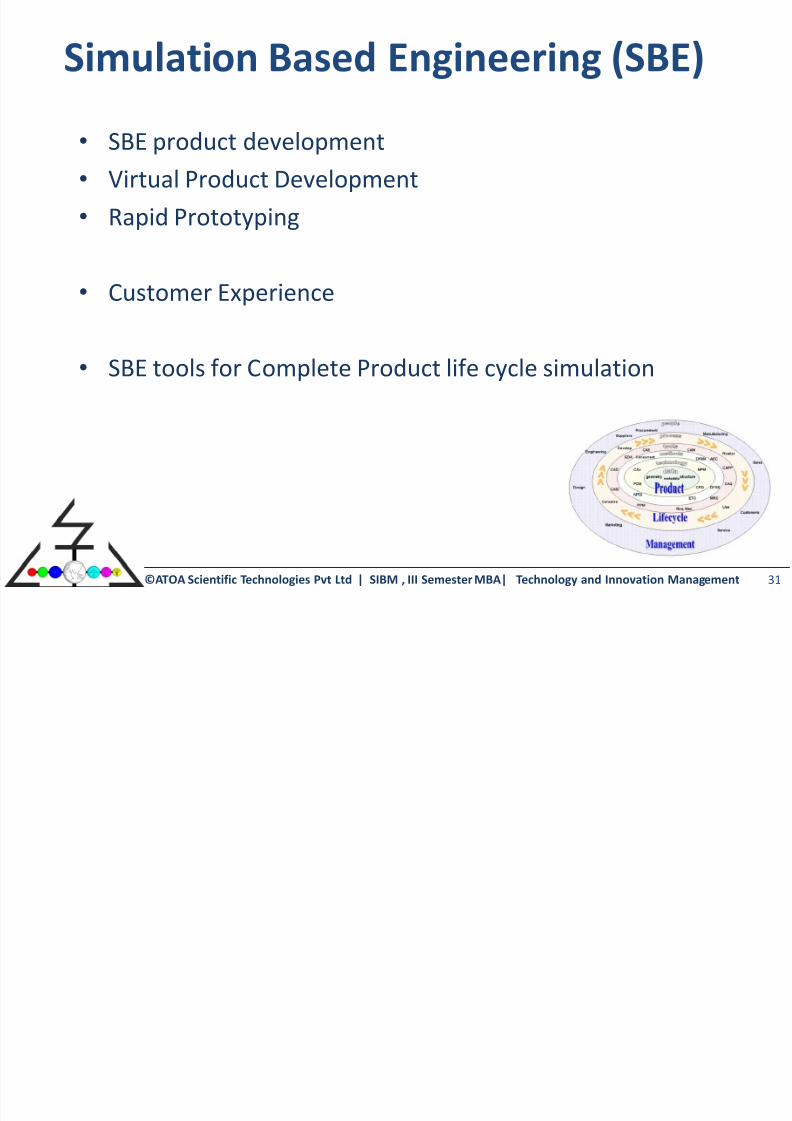
Simulation Based Engineering (SBE)
31
• SBE product development• Virtual Product Development
• Rapid Prototyping
• Customer Experience
• SBE tools for Complete Product life cycle simulation
8/3/2019 Tech Innovation S3
http://slidepdf.com/reader/full/tech-innovation-s3 32/41
©ATOA Scientific Technologies Pvt Ltd | SIBM , III Semester MBA| Technology and Innovation Management
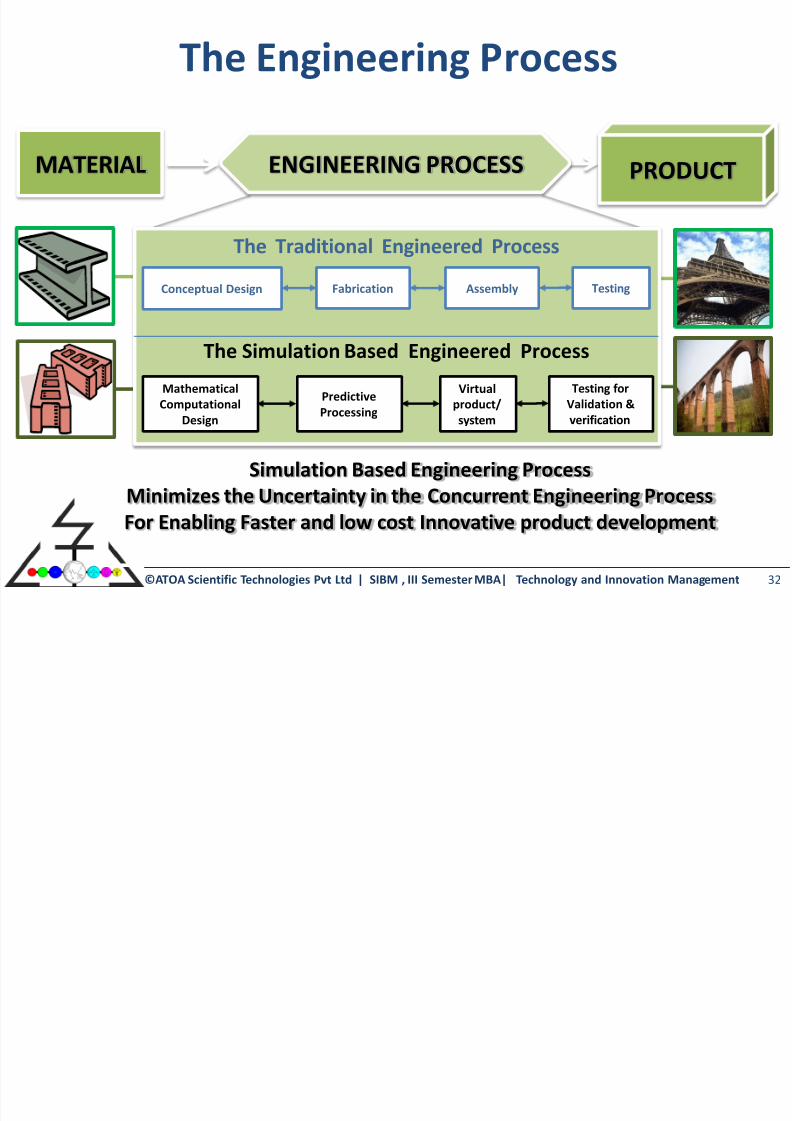
The Traditional Engineered Process
The Simulation Based Engineered Process
The Engineering Process
32
Mathematical
Computational
Design
Predictive
Processing
Testing for
Validation &
verification
Virtual
product/
system
Conceptual Design Fabrication Assembly Testing
Simulation Based Engineering Process
Minimizes the Uncertainty in the Concurrent Engineering Process
For Enabling Faster and low cost Innovative product development
ENGINEERING PROCESS PRODUCT MATERIAL

8/3/2019 Tech Innovation S3
http://slidepdf.com/reader/full/tech-innovation-s3 33/41
©ATOA Scientific Technologies Pvt Ltd | SIBM , III Semester MBA| Technology and Innovation Management
The Simulation for the First time right
33
MATHEMATICAL MODEL
• Captures the THE PHYSICS EMBEDDED IN THE ENGINEERING SCIENCES
• Simple closed-form solutions to establish essential relationships, Numerical solutions for complex problems
• Properties of different types of differential and integral equations
• Closed-form solutions only available for very simple problems
• The mathematical model only transforms the available information about the real problem into a
predictable quantity of interest
• COMPUTATIONAL MODEL
• Computers have revolutionized techniques for solving differential and integral equations
• Finite element methods,
• Availability of Fast and cheap computing power
• Accurate numerical solutions to complex problems
•Nonlinearities easily handled
• The purpose of computation to model the real system to output the quantities of interest onwhich a decision can be made
• NEW PARADIGM: Simulation based engineering Design (SBED) with Multiphysics and Multiscale depth
Real product/system
Mathematical
model
Computational
model
Prediction(Output)
It is a must to incorporate all the known Scientific and or Engineering knowledge for a
given problem solving or new product design.
Failure by not integrating the known knowledge is not professionally acceptable.

8/3/2019 Tech Innovation S3
http://slidepdf.com/reader/full/tech-innovation-s3 34/41
©ATOA Scientific Technologies Pvt Ltd | SIBM , III Semester MBA| Technology and Innovation Management
Simulation Based Engineering (SBE)
34
•Engineering is the profession in which aknowledge of the mathematical andnatural sciences gained by studyexperience, and practice is applied with judgment to develop ways to utilize,economically, the materials and forces of
nature for the benefit of the society -Accreditation Board for Engineering and Technology
• SBE to develop Virtual Innovative Products forunique customer experience with highestperformance and reliability at lowest cost .
• Studies shows that the Simulation based Productdevelopment, reduced the prototyping by 50%and increased the lead time ~60 days ahead of the competition.
Si l ti b d E i i D i

8/3/2019 Tech Innovation S3
http://slidepdf.com/reader/full/tech-innovation-s3 35/41
©ATOA Scientific Technologies Pvt Ltd | SIBM , III Semester MBA| Technology and Innovation Management
Simulation based Engineering Design
(SBED)
35
• SBED provides unparalleled access to real-world conditions
• SBED is credited with numerous success story
• SBED can be used to Predict unknown product performance for firsttime right
• Eventually can be used to predict the future outcome
• Simulations has none of the following limitations of experimentaldesigns /tests,
– Cost constraints
– harsh/unrealistic parameter ranges, and
– Environment, Health and Safety concerns.
• It has become indispensable for
– Weather prediction
– Medical diagnosis (Virtual human)
– Material modeling
– Drug synthesis – Auto design for crashworthiness
From: Research Directions In Computational Mechanics, A Report of the United States NationalCommittee on Theoretical and Applied Mechanics, September 2000
Ref: Jaroslav Mackerle Finite-element analysis and simulation of machining: a bibliography (1976 –1996), Journal of Materials Processing Technology 86 (1999) 17 –44
8/3/2019 Tech Innovation S3
http://slidepdf.com/reader/full/tech-innovation-s3 36/41
©ATOA Scientific Technologies Pvt Ltd | SIBM , III Semester MBA| Technology and Innovation Management
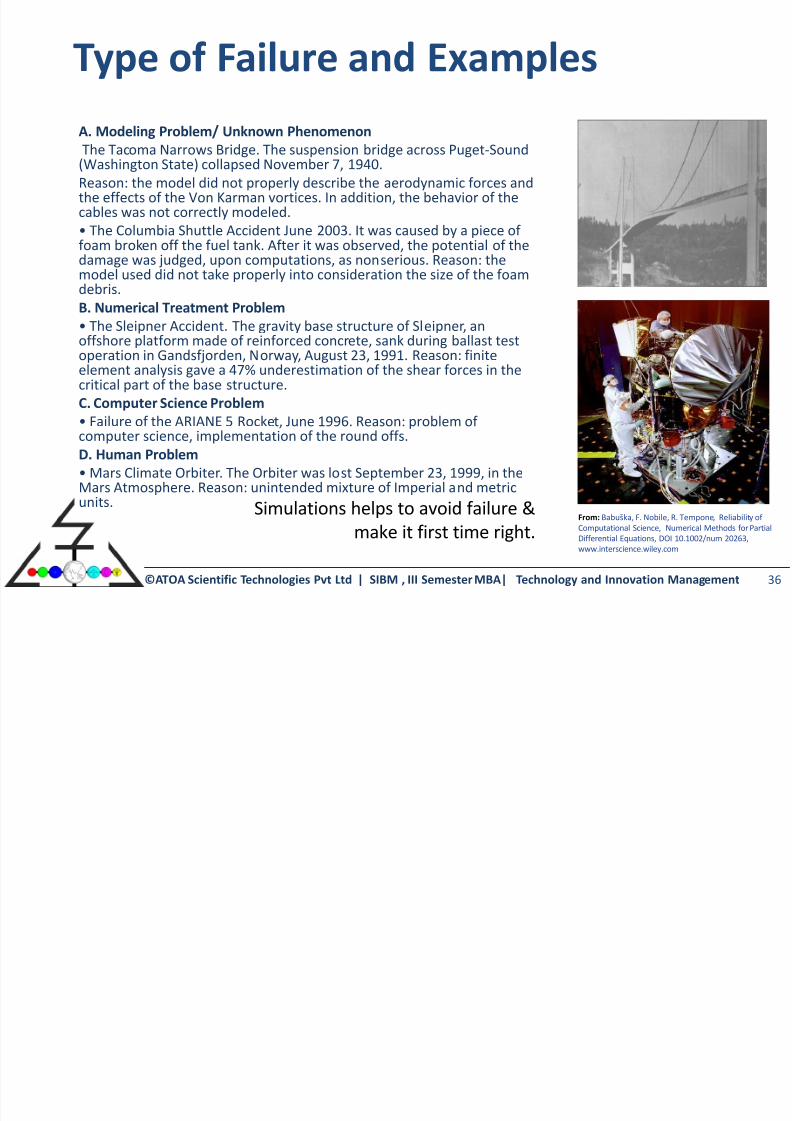
Type of Failure and Examples
36
A. Modeling Problem/ Unknown Phenomenon
The Tacoma Narrows Bridge. The suspension bridge across Puget-Sound(Washington State) collapsed November 7, 1940.
Reason: the model did not properly describe the aerodynamic forces andthe effects of the Von Karman vortices. In addition, the behavior of thecables was not correctly modeled.
• The Columbia Shuttle Accident June 2003. It was caused by a piece of foam broken off the fuel tank. After it was observed, the potential of thedamage was judged, upon computations, as nonserious. Reason: the
model used did not take properly into consideration the size of the foamdebris.
B. Numerical Treatment Problem
• The Sleipner Accident. The gravity base structure of Sleipner, anoffshore platform made of reinforced concrete, sank during ballast testoperation in Gandsfjorden, Norway, August 23, 1991. Reason: finiteelement analysis gave a 47% underestimation of the shear forces in thecritical part of the base structure.
C. Computer Science Problem
• Failure of the ARIANE 5 Rocket, June 1996. Reason: problem of computer science, implementation of the round offs.
D. Human Problem
• Mars Climate Orbiter. The Orbiter was lost September 23, 1999, in theMars Atmosphere. Reason: unintended mixture of Imperial and metricunits.
From: Babuška, F. Nobile, R. Tempone, Reliability of
Computational Science, Numerical Methods for Partial
Differential Equations, DOI 10.1002/num 20263,
www.interscience.wiley.com
Simulations helps to avoid failure &
make it first time right.

8/3/2019 Tech Innovation S3
http://slidepdf.com/reader/full/tech-innovation-s3 37/41
©ATOA Scientific Technologies Pvt Ltd | SIBM , III Semester MBA| Technology and Innovation Management
Reliability of Simulations
37
Engineering accidents can happen due to, – Modeling Error,
– the numerical treatment,
– computer science problems, and
– human errors.
Reliability of simulation depends on
• The Mathematical model.
• Resources vs performance
• Deterministic/ Probabilistic
• Prediction/quantification
– Failure probability – Confidence level/ Factor of safety
• Simulations are moving from Trend prediction toactual and accurate performance prediction
Objective is to increase the reliability of simulations.
8/3/2019 Tech Innovation S3
http://slidepdf.com/reader/full/tech-innovation-s3 38/41
©ATOA Scientific Technologies Pvt Ltd | SIBM , III Semester MBA| Technology and Innovation Management
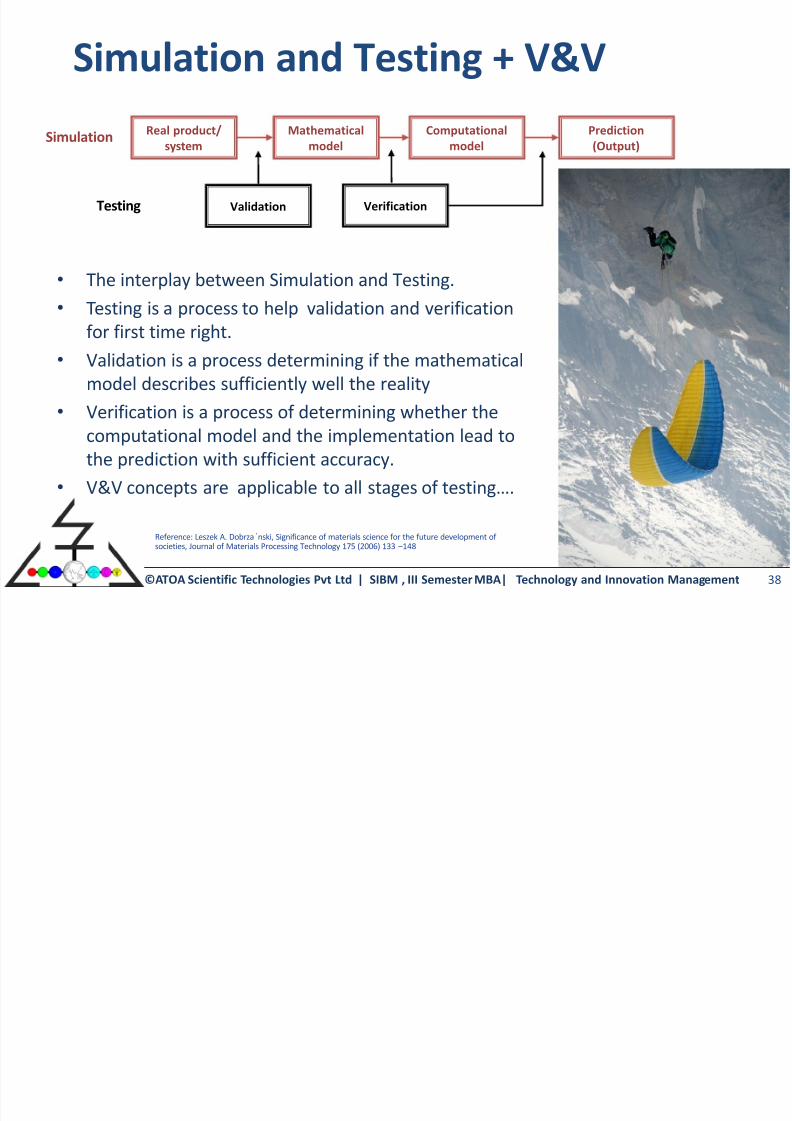
Simulation and Testing + V&V
38
•The interplay between Simulation and Testing.
• Testing is a process to help validation and verification
for first time right.
• Validation is a process determining if the mathematical
model describes sufficiently well the reality
•Verification is a process of determining whether thecomputational model and the implementation lead to
the prediction with sufficient accuracy.
• V&V concepts are applicable to all stages of testing….
Real product/
system
Mathematical
model
Computational
model
Prediction
(Output)
Validation Verification
Simulation
Testing
Reference: Leszek A. Dobrza´nski, Significance of materials science for the future development of societies, Journal of Materials Processing Technology 175 (2006) 133 –148

8/3/2019 Tech Innovation S3
http://slidepdf.com/reader/full/tech-innovation-s3 39/41
©ATOA Scientific Technologies Pvt Ltd | SIBM , III Semester MBA| Technology and Innovation Management
Virtual Testing
39
•Simulation to predict the experimental properties of systems.
• For example, It is difficult to characterize all the
anisotropic properties of composites. Numerical
models is used to predict the complimentary
anisotropic properties.
• Simulation to mimic the testing is performed to zoominto the inner working mechanism of materials and
products.
• The progressive growth, failure, damage mechanics
can help to reverse engineer the materials for
improved and optimal performance.• Virtual Testing are used to simulate and predict high
risk and costly experimental tests for cost effective
product development.
Four Stages of Complimentary Simulation and

8/3/2019 Tech Innovation S3
http://slidepdf.com/reader/full/tech-innovation-s3 40/41
©ATOA Scientific Technologies Pvt Ltd | SIBM , III Semester MBA| Technology and Innovation Management
Four Stages of Complimentary Simulation and
Testing for the Engineering Design of First Time
Right Product Development
40

8/3/2019 Tech Innovation S3
http://slidepdf.com/reader/full/tech-innovation-s3 41/41
TIM –S3: Technology Tools for innovation
•Technology tools for value creation
• Innovation: Quality : Speed: Cost
• Engineering Tools
– Concurrent Engineering
– QFD
– DfX
– FMEA
– Simulation based product Development
• Innovation Tools
Top Related