


Languages
Pages
Legal


TEAM DYNAMICS AND LEARNING BEHAVIOR IN HOSPITALS:
A STUDY OF ERROR REPORTING BY NURSES
Lindsay Thompson Munn
A dissertation submitted to the faculty at the University of North Carolina at Chapel Hill in
partial fulfillment of the requirements for the degree of Doctor of Philosophy in the School of
Nursing.
Chapel Hill
2016
Approved by:
Cheryl B. Jones
George Knafl
Mary R. Lynn
Celeste Mayer
Tina Schade Willis

ii
© 2016
Lindsay Thompson Munn
ALL RIGHTS RESERVED

iii
ABSTRACT
Lindsay Thompson Munn: Team Dynamics and Learning Behavior in Hospitals:
A Study of Error Reporting by Nurses
(Under the direction of Cheryl B. Jones)
Error reporting is the primary way that hospitals identify errors and near misses, and
it is essential for organizational learning and improvement to occur. However, it is widely
recognized that errors in hospitals are significantly underreported. As a result, there are
numerous lost opportunities for health care organizations to learn from errors and improve
the care delivered to patients.
The purpose of this study was to use the model of work-team learning as the
theoretical foundation to examine the error reporting behaviors of nurses. The study
examined the team factors of safety climate, leader inclusiveness, and psychological safety
and their effect on nurses’ error reporting.
A cross-sectional, descriptive design was used for the study. Data were collected
from nurses and nurse managers through self-administered surveys. The research questions
of the study were answered with data from up to 814 nurses and 43 nurse managers using
methods for modeling correlated outcomes. Bootstrap confidence intervals with bias
correction were used to determine the mediating effect of psychological safety.
The results of the study demonstrated that the team factors of safety climate, leader
inclusiveness, and psychological safety positively predicted nurses’ perceptions of the
frequency of error reporting on their unit. Furthermore, the results indicated that these same

iv
team factors of safety climate, leader inclusiveness, and psychological safety negatively
predicted the number of error reports that nurses reported submitting over a 12-month period.
The study findings also showed that psychological safety mediated the relationship between
the interprofessional relationships dimension of the safety climate and nurses’ perceptions of
error reporting frequency on their unit as well as the relationship between leader
inclusiveness and nurses’ perceptions of error reporting frequency on their unit.
This study’s findings underscore the complexity of error reporting in hospitals and the
need for more advanced research methods that allow for deeper investigation and explanation
of error reporting in hospitals. This study lays the groundwork for future study by
demonstrating the importance of safety climate, leader inclusiveness, and psychological
safety to help explain error reporting by nurses.

v
To my husband, Andy, and my son, George.
I could not have completed this without your love and support.
I love you both!

vi
ACKNOWLEDGEMENTS
There are so many individuals who have been integral to my success. I would like to
especially thank my committee. Cheryl, I cannot imagine a more supportive, capable, and
genuine mentor. You have challenged my thinking, encouraged me in my research, and
helped me in every way possible. I could not have persevered through this program without
your continual optimism and support. Thank you for all that you have invested in me, I look
forward to many years of collaboration as friends and colleagues. George, I am so grateful
that you were on my committee. You have taught me so much. Thank you for so kindly and
patiently answering my countless statistical questions. Mary, at the outset of this study, I had
no idea the extent to which I would rely on your expertise. Thank you for your help with
scales and unexpected factor analyses. Your humor made it a more enjoyable experience.
Celeste, your knowledge of patient safety and organizations has been invaluable. Thank you
for the many ways that you helped shape the study, especially with your practical suggestions
about data collection and help with interpreting findings. Tina, I am so appreciative to you
for serving on my committee. I have enjoyed working with you as a physician in the PICU,
on numerous quality and safety projects, and on my dissertation. Your passion for quality
and safety in patient care is inspiring, and your advice and help with this study has been
extremely valuable.
In addition to my committee, I was fortunate to have an amazing research coordinator
at the study site hospital. This person worked tirelessly, and without compensation, to garner
support for the study within the organization and to recruit study participants. This study

vii
would not have been successful without your help. I am also grateful to the nurses and nurse
managers who participated in this study. There would be no study without your
participation, thank you for your willingness to take part in this research study.
I am also grateful to my family. Sue and Cliff, I am so thankful for your love and
support. Thank you for keeping George every Thursday, almost since he was born, so that I
could go to Chapel Hill. He loves spending time with you, and it has given me peace of
mind to know that he is loved and taken care of while I was working. To my parents, you
have always encouraged me to do my best and have modeled what hard work looks like.
Thank you for your love and for continually praying for me. Thank you for driving to
Charlotte for months to keep George and take him on fun outings as well as doing the
laundry and cooking dinner. I am not sure how we would have survived without your help. I
love you both, and I am thankful that you now live in North Carolina. Andy, I would not
have completed this dissertation without your support. You have helped me in small and
large ways to accomplish this. More importantly, you have believed that I could do it and
encouraged me to “finish what I started” when I most doubted that I could. Over the course
of this doctoral program we dated long distance for over a year, planned a wedding and got
married, had a baby, and bought a house. It has been a busy but fun-filled five years, and I
am so thankful that I get to share life with you. Thank you for your love, support, and
sacrifice to help me complete this program. I love you! George, I am so happy to be your
mother. You have brought so much joy to our lives, and we love every minute of watching
you grow and learn. As I completed the dissertation, you helped me keep perspective about
what is important. We love you so much!

viii
TABLE OF CONTENTS
LIST OF TABLES ................................................................................................................. xvi
LIST OF FIGURES .............................................................................................................. xvii
Chapter
I. INTRODUCTION ................................................................................................1
Background ...........................................................................................................1
Errors and Error Reporting .......................................................................3
Error-Reporting Systems ..........................................................................4
Past Studies of Error Reporting ................................................................5
Safety climate ...............................................................................8
Leader inclusiveness ....................................................................8
Psychological safety .....................................................................9
Nurses and Error Reporting ....................................................................10
The Nursing Unit ...................................................................................11
Purpose ................................................................................................................11
Theoretical Foundation and Conceptual Model ..................................................12
Significance.........................................................................................................13
Chapter Summary and Outline of This Dissertation ...........................................13
II. REVIEW OF THE LITERATURE AND THEORETICAL
FRAMEWORK...................................................................................................15
Literature Review................................................................................................15

ix
The Nursing Unit as a Team ...................................................................16
Safety Climate .........................................................................................18
Leader Inclusiveness ...............................................................................21
Psychological Safety ...............................................................................23
Knowledge Gaps .....................................................................................25
Theoretical Foundation of the Study...................................................................26
Group and Organizational Influences on Learning from
Mistakes ..................................................................................................26
Learning Behavior in Work Teams.........................................................28
The Learning Process in Interdisciplinary Action Teams.......................30
Summary of Key Studies by Edmondson ...............................................33
The Model of Work-Team Learning...................................................................33
Antecedent Conditions: Team Structures ...............................................34
Team Beliefs: Team Safety and Team Efficacy .....................................34
Team Behaviors: Team Learning Behavior ............................................36
Outcomes ................................................................................................36
The Model of Work Team Learning Applied to This Study of Error
Reporting.............................................................................................................36
Team Structures ......................................................................................38
Context support ...........................................................................39
Team leadership behavior ...........................................................40
Team Beliefs ...........................................................................................40
Team safety belief .......................................................................41
Team Behaviors .....................................................................................41

x
Team learning behavior ..............................................................42
Relationships of the Model .....................................................................42
Context support and team leadership behavior ...........................42
Team safety belief .......................................................................44
Covariates ...............................................................................................47
Nursing characteristics ................................................................47
Nurse education ..............................................................47
Nurse experience .............................................................48
Nurse tenure ....................................................................49
Nursing unit characteristics .........................................................50
Nurse manager education ................................................51
Nursing manager tenure ..................................................51
Unit size ..........................................................................51
Type of unit .....................................................................52
Summary of the Conceptual Model ....................................................................53
Chapter Summary ...............................................................................................56
III. METHODOLOGY .............................................................................................57
Study Design .......................................................................................................57
Setting and Sample .............................................................................................58
Power Analysis .......................................................................................58
Instrumentation ...................................................................................................59
Variables and Their Measurement ..........................................................59
Error Reporting .......................................................................................60

xi
Safety Climate .........................................................................................63
Leader Inclusiveness ...............................................................................66
Psychological Safety ...............................................................................67
Covariates ...............................................................................................69
Nursing characteristics ................................................................69
Nurse education ..............................................................69
Nurse experience .............................................................70
Nurse tenure ....................................................................70
Nursing unit characteristics .........................................................70
Nurse manager education ................................................70
Nurse manager tenure .....................................................71
Unit size ..........................................................................71
Type of nursing unit ........................................................71
Study Survey ...........................................................................................72
Human Subjects Protection .................................................................................73
Procedures ...........................................................................................................74
Study Site Coordinator ............................................................................74
Recruitment Activities ...........................................................................74
Data Collection .......................................................................................75
Survey Implementation ...........................................................................76
Nurse surveys ..............................................................................76
Nurse manager surveys ...................................................78
Data Management and Analysis .........................................................................79

xii
How Do Safety Climate and Leader Inclusiveness Affect
Error Reporting? .....................................................................................80
How Do Safety Climate and Leader Inclusiveness Affect
Psychological Safety? .............................................................................81
How Does Psychological Safety Affect Error Reporting? .....................81
Do Safety Climate and Leader Inclusiveness Indirectly
Affect Error Reporting Through Psychological Safety? .........................82
Summary .............................................................................................................84
IV. FINDINGS ..........................................................................................................85
Description of the Sample ...................................................................................85
Response Rate and Sample Size .............................................................85
Missing Item Values ...............................................................................86
Description of the Variables ...............................................................................87
Sample Characteristics ............................................................................87
Descriptive Statistics of Study Variables ................................................87
Relationships Between Study Variables .................................................88
Covariate Selection .................................................................................89
Covariate analysis for psychological safety ................................89
Covariate analysis for error reporting (nurses’
perceptions) .................................................................................90
Covariate selection for error reporting (number of
reports submitted) .......................................................................91
Major Study Findings ........................................................................................92
Research Question 1: How Do Safety Climate and Leader
Inclusiveness Affect Error Reporting?....................................................93
Research Question 2: How Do Safety Climate and Leader

xiii
Inclusiveness Affect Psychological Safety? ...........................................95
Research Question 3: How Does Psychological Safety Affect
Error Reporting? .....................................................................................96
Research Question 4: Do Safety Climate and Leader
Inclusiveness Indirectly Affect Error Reporting Through
Psychological Safety? .............................................................................98
Additional Analyses ..................................................................103
Summary of Study Results........................................................103
Chapter Summary .................................................................................105
V. DISCUSSION ...................................................................................................107
Summary and Interpretation of Major Study Findings .....................................108
The Effect of Safety Climate and Leader Inclusiveness on
Error Reporting .....................................................................................108
The Effect of Safety Climate and Leader Inclusiveness on
Psychological Safety .............................................................................110
The Effect of Psychological Safety on Error Reporting .......................111
The Mediating Effect of Psychological Safety .....................................112
Study Covariates ...................................................................................114
Nurse characteristics .................................................................114
Nursing unit characteristics .......................................................115
The Relationships between the Two Measures of Error
Reporting...............................................................................................117
Summary of Major Findings .................................................................118
Limitations ........................................................................................................119
Implications for Practice and Policy .................................................................123
Implications for Future Research ......................................................................125

xiv
Implications of the Findings to Theory .............................................................128
Summary and Conclusions ...............................................................................129
APPENDIX 1: FREQUENCY OF EVENT REPORTING SCALE .....................................130
APPENDIX 2: SAFETY CLIMATE SURVEY ....................................................................131
APPENDIX 3: DIMENSIONS AND ITEMS OF THE SAFETY CLIMATE SURVEY ....133
APPENDIX 4: INCLUSIVE LEADERSHIP SCALE ..........................................................135
APPENDIX 5: PSYCHOLOGICAL SAFETY SCALE........................................................136
APPENDIX 6: NURSE CONSENT TO PARTICIPATE .....................................................137
APPENDIX 7: NURSE MANAGER CONSENT TO PARTICIPATE ................................138
APPENDIX 8: SAMPLE CHARACTERISTICS .................................................................139
APPENDIX 9: DESCRIPTIVE STATISTICS FOR VARIABLES IN THE STUDY .........140
APPENDIX 10: PEARSON CORRELATION COEFFICIENTS FOR
CONTINUOUS STUDY VARIABLES AND COVARIATES ............................................141
APPENDIX 11: PEARSON CORRELATION COEFFICIENTS FOR NURSING
UNIT LEVEL COVARIATES ..............................................................................................142
APPENDIX 12: COVARIATE ANALYSIS FOR PSYCHOLOGICAL SAFETY..............143
APPENDIX 13: COVARIATE ANALYSIS FOR NURSE PERCEPTIONS OF
ERROR REPORTING ...........................................................................................................144
APPENDIX 14: COVARIATE ANALYSIS FOR THE NUMBER OF ERROR
REPORTS SUBMITTED BY NURSES ...............................................................................145
APPENDIX 15: THE INDIRECT EFFECT OF SAFETY CLIMATE AND
LEADER INCLUSIVENESS ON ERROR REPORTING THROUGH
PSYCHOLOGICAL SAFETY ..............................................................................................146
APPENDIX 16: THE INDIRECT EFFECT OF SAFETY CLIMATE AND
LEADER INCLUSIVENESS ON ERROR REPORTING1 THROUGH
PSYCHOLOGICAL SAFETY WITH SIGNIFICANT COVARIATES ..............................147
APPENDIX 17: THE EFFECT OF NURSES’ PERCEPTIONS OF ERROR
REPORTING ON THE NUMBER OF ERROR REPORTS SUBMITTED.........................149

xv
REFERENCES ......................................................................................................................150

xvi
LIST OF TABLES
Table
1 Definitions of the Study Concepts and Variables Used in this Study
of Error Reporting ........................................................................................... 55
2 Study Variables, Level of the Variable, Type of Variable, and Source
of the Variable................................................................................................. 72
3 Details on the Implementation of the Nurse Survey ....................................... 77
4 Details for the Implementation of the Nurse Manager Survey ....................... 78
5 The Effect of Safety Climate and Leader Inclusiveness on Perceptions
of Error Reporting ........................................................................................... 93
6 The Effect of Safety Climate and Leader Inclusiveness on the Number
of Error Reports .............................................................................................. 95
7 The Effect of Leader Inclusiveness and Safety Climate on Psychological
Safety .............................................................................................................. 96
8 The Effect of Psychological Safety on Nurses’ Perceptions of Error
Reporting......................................................................................................... 97
9 The Effect of Psychological Safety on Number of Error Reports
Submitted ........................................................................................................ 98
10 Steps 1-3 of the Mediation Analysis for Psychological Safety..................... 100
11 Step 4 of the Mediation Analysis for Psychological Safety ......................... 101
12 Steps 1-3 of the Mediation Analysis for Psychological Safety with
Significant Covariates ................................................................................... 102
13 Step 4 of the Mediation Analysis for Psychological Safety with
Significant Covariate .................................................................................... 103

xvii
LIST OF FIGURES
Figure
1 A model of work-team learning (Edmondson, 1999, p. 357) ......................... 33
2 Conceptual model of error reporting, derived from Edmondson’s model
of work-team learning ..................................................................................... 38
3 Illustration of the derivation of underlying conceptual components of
this study of error reporting ............................................................................ 54
4 Conceptual model for the study with identified research questions ............... 92

1
CHAPTER 1
INTRODUCTION
The identification of errors that occur in the treatment of patients is central to the
ability of hospitals to learn from errors and thereby improve the quality and safety of care
delivered to patients (Institute of Medicine [IOM], 2000; Leape, 2002). However, research
indicates that errors in hospitals are grossly underreported (Levinson 2012; Sari, Sheldon,
Cracknell, & Turnbull, 2006). As a result, countless opportunities to improve quality and
safety in hospitals by learning from errors are missed because errors are not reported. Past
studies of error reporting have often lacked a strong theoretical foundation to inform the
relationships and variables of study examined (Holden & Karsh, 2007; Russo, Buonocore, &
Ferrara, 2015). This study will assess unit/team level factors that affect error reporting,
specifically the variables of safety climate, leader inclusiveness, and psychological safety
derived from the model of work-team learning (Edmondson, 1999). Such an approach will
enhance our understanding of clinician error reporting behaviors and help to identify
improvements that may foster better error reporting in hospitals.
Background
In 2000, the IOM released a landmark report, To Err is Human, the first in a series of
reports on quality and safety of patient care. This report brought national attention to the
number of patient care errors that occur in the U.S. health care system, particularly in
hospitals. It acknowledged that error reporting provides factual documentation of errors and

2
near misses, and gives healthcare leaders the knowledge needed to improve the safety and
quality of care delivered to patients. This report also called for the expansion of error-
reporting activities in hospitals to enhance organizational learning1 (IOM, 2000; Leape,
2002). The IOM recommendations have led to the universal adoption of error-reporting
systems in hospitals nationwide as a mechanism to facilitate clinicians’ reporting of errors as
they occur, and as a way for organizations to learn from these recorded errors (Farley,
Haviland, Haas, & Pham, 2010; Levinson, 2012; Mitchell, Schuster, Smith, Pronovost, &
Wu, 2016).
From an organizational learning perspective, error reporting is viewed as valuable
because it provides an opportunity to learn from failures and near misses (Edmondson,
2004). However, it is difficult for leaders of organizations to take actions that promote
learning from errors because organizational structures often prevent error identification and
social factors may inhibit transparent discussion and analysis of errors in a way that
facilitates collective learning by the organization (Canon & Edmondson, 2005).
Subsequently, relatively few organizations truly learn from their errors (Canon &
Edmondson, 2005). Canon and Edmondson (2005) identified three essential elements that
must exist for organizational learning to occur: organizations must identify errors, they must
evaluate them, and they must engage in purposeful experimentation to address these errors.
Formal error reporting is the foundation of organizational learning because it initiates
evaluation of errors and the development of interventions or experimentations to address
them.
1 Organizational learning is an area of organizational science that proposes organizations, like individuals, learn
from experiences (Argyris & Schön, 1996; de Feijter, de Grave, & Koopmans, 2012).

3
Errors and Error Reporting
Error-related events in patient care include both actual errors and near misses in
preventive care, diagnosis, and treatment (Garrouste-Orgeas et al., 2012; IOM, 2000; Taylor
et al., 2004). Errors are defined as the unintended outcome of care that may or may not
result in physical harm to the patient, while near misses are defined as potential errors that
could have resulted in actual harm to a patient if not intercepted by clinicians or other means
(Garrouste-Orgeas et al., 2012; IOM, 2000). Error reporting is the communication of errors
and near misses to managers and healthcare administrators (Leape, 2002). Throughout this
dissertation, the term “errors” encompass both near misses and errors because error reporting
typically captures both types of events.
Errors in healthcare are caused by both human error and system factors (Garrouste-
Orgeas et al., 2012; IOM, 2000). James Reason (2008), a noted patient safety researcher and
theorist, said the following:
Fallibility is part of the human condition. Errors cannot be eradicated but they can be
anticipated and managed accordingly. We can’t fundamentally change the human
condition, but we can change the conditions under which people work in order to
make errors less likely and more easily recoverable. (p. 34)
As Reason (2008) asserted, human error is a relatively unchangeable characteristic of
individuals that renders admonitions for increased vigilance or individual efforts by
healthcare providers ineffective in reducing error (Garrouste-Orgeas et al., 2012). Instead,
system factors, elements of the work environment, and the processes in organizational
systems must be changed in a way that shifts the culture from one of blaming and punishing
individuals to one that examines and encourages organizational learning through
introspection and analysis, and, in turn, supports individuals to do the right thing by reporting
errors (IOM, 2000; Reason, 1998, 2000).

4
Error-Reporting Systems
Error-reporting systems are put in place by organizations as a mechanism to formally
collect error reports. An estimated 90% of hospitals have such systems in place (Mitchell,
Schuster, Smith, Pronovost, & Wu, 2016). The majority of error-reporting systems are
voluntary, but some are mandatory (Robinson & Hughes, 2008). Almost all error-reporting
systems are confidential, meaning that no legal action can be taken for the reports filed.
Some systems go a step further and are anonymous, keeping the identity secret of the
individual reporting the error (Agency for Healthcare Research and Quality [AHRQ], 2014).
Medication errors and patient falls generally account for the largest number of error reports
submitted to error reporting systems (AHRQ, 2014). Ideally, the purpose of error reporting
systems is to promote organizational learning and improve the safety and quality of care. In
reality, however, error-reporting systems are often used for risk management purposes
because errors that cause harm to patients also pose the threat of substantial litigation costs to
hospitals (Helmreich, 2000).
Error-reporting systems in hospitals necessarily rely on clinicians (e.g., nurses,
physicians, pharmacists, etc.) to report errors. Because individual clinicians are directly
involved with errors by identifying them, observing them, or contributing to them, they are
the ones who must ultimately report errors. However, because most error reporting systems
are voluntary; individuals may choose whether to report an error and how to report it. Thus,
error reporting in hospitals has both an organizational component through the formal
reporting system as well as an individual component, because individuals can choose to
identify and report errors through the system.

5
Error-reporting systems are the formal, primary way through which healthcare
professionals report errors in hospitals (Garrouste-Orgeas et al., 2012; Levinson, 2012).
Unfortunately, error-reporting systems are not always used in the way or to the degree
intended. Research demonstrates that healthcare professionals sometimes engage in
“informal” reporting practices that include verbally discussing an error-related event with a
manager or team colleague instead of making a formal report, which allows clinicians the
opportunity to acknowledge that something happened while protecting themselves from
being exposed for reporting or committing an error (Espin, Lingard, Baker, & Regehr, 2006;
Espin et al., 2007; Hewitt & Chreim, 2015; Lederman, Dreyfus, Matchan, Knott, & Milton,
2013). Sometimes clinicians may forgo formal error reporting altogether if they are unsure
of what constitutes an error (Levinson, 2012; Sari et al., 2006). The reasons that individuals
engage in formal or informal reporting practices or choose not to report an error at all are
sometimes complex.
Past Studies of Error Reporting
We know that knowledge deficits related to what should be reported and the time-
consuming nature of error reporting are common reasons cited by clinicians for not reporting
errors (Hartnell, MacKinnon, Sketris, & Fleming, 2012; Jeffe et al., 2004; Kaldjian et al.,
2008; Mayo & Duncan, 2004). Past studies have also documented surprising findings related
to error reporting. In a study examining how healthcare professionals (e.g., nurses,
physicians, and pharmacists) made a choice between fixing a safety problem and moving on
with their work versus fixing the problem and then reporting it, researchers found that
healthcare professionals refrained from reporting near misses because the error was not
realized. They also found that health professionals refrained from reporting safety problems

6
they could either fix themselves or were so common that the problem was accepted as part of
the everyday work routine (Hewitt & Chreim, 2015). These findings are similar to Tucker
and Edmondson’s (2003) study of nurses in nursing units where they inferred that a lack of
organizational learning from failures may be explained, in part, by empowerment of nurses to
fix problems themselves.
In a mixed-methods case study examining the effects of an electronic error-reporting
system in two large Australian hospitals, researchers identified several barriers that inhibited
error reporting. These obstacles included the need for further training and familiarity with
the system, fear of blame from others for reporting errors, and the use of informal error
reporting (Lederman et al., 2013). The researchers also found that clinicians sometimes
engaged in error reporting system for more unexpected reasons, such as using it as a
defensive tool to justify their clinical decisions or to protect themselves from the possibility
of perceived future threats (e.g., threats of blame from the manager for clinical decisions).
These findings are consistent with other qualitative studies reporting that clinicians used
error-reporting systems as legal protection or to protect themselves from managers or
physicians who they feared (Hartnell et al., 2012). Studies have also documented that
clinicians sometimes used the reporting system as a way to complain to upper management
about problems in the work place that were not being addressed (Lederman et al., 2013).
Thus, clinicians do or do not report error-related events for reasons that seem counter-
intuitive but reflect the complicated nature of error reporting.
Similarly, the reasons that individuals forego formal error reporting in favor of
informal reporting practices or not reporting errors at all are just as convoluted. Informal
error reporting practices include verbally notifying a manager or team colleague about an

7
error, documenting the error in a clinical note in the patient’s chart, or discussing the error
with the multidisciplinary healthcare team during patient rounds (Espin et al., 2006, 2007;
Lederman et al., 2013). Studies indicate that these informal reporting practices fulfill
clinicians’ felt obligations to report errors and thus explain why they may refrain from
submitting an error report to the hospital error reporting system (Lederman et al., 2013). The
reasons that clinicians choose to engage in informal rather than formal methods differ. In
some cases, seemingly positive factors lead clinicians to forgo formal error reporting. For
example, one study (Espin et al., 2007) found that a clinician’s choice to discuss an error
with a team colleague rather than formally reporting the error was significantly influenced by
strong interpersonal dynamics within the team. In this case, positive team dynamics were
associated with informal reporting methods. However, the same researchers found in another
study that nurses were hesitant to report errors they observed by individuals with a higher
scope of practice or those with whom they perceived a greater power differential, such as
physicians (Espin et al., 2006, 2010). Instead, nurses felt more comfortable informally
reporting errors involving physicians by verbally discussing the events with a peer or nurse
manager or documenting the events in a clinical note rather than submitting an error report.
Existing research demonstrates that error reporting is a multifaceted phenomenon in
hospitals, where there are multiple diverse and complicated reasons that explain why error-
reporting processes breakdown. While much of the past research on error reporting has
sought to identify facilitators and/or barriers to error reporting, these studies have not fully
explained how more complex factors within an organization may affect error reporting by
clinicians. Theory and research from organizational and team literature may help to better
explain the more complex reasons that clinicians do or not report errors in a way that past

8
research on error reporting has failed to do. Based on past error reporting research, the
variables of safety climate, leader inclusiveness, and psychological safety are especially
relevant to understanding error reporting in hospitals, particularly in patient care units.
Safety climate. Past studies of error reporting indicate that the environment of the
patient care unit where clinicians work is an important influence on error reporting
(Edmondson, 1996); in particular, work environments where safety is prioritized encourage
more error reporting (Kagan & Barnoy, 2013). Past studies demonstrate that the safety
climate, which is defined as the shared perceptions and experience of employees about the
practices, policies, and procedures related to the safety of patients (Katz-Navon, Naveh, &
Stern, 2005; Vogus, Sutcliffe, & Weick, 2010), is a characteristic of patient care units that
have a higher incidence of error reporting. A few past studies have examined the safety
climate and similar concepts in relationship to error reporting. These studies lend support for
safety climate as an important factor to consider relative to error reporting (Naveh, Katz-
Navon, & Stern, 2006).
Leader inclusiveness. Past studies of error reporting have also demonstrated that
leadership behavior is another important influence on error reporting. In a study that
examined how the behaviors of healthcare leaders (e.g., nurse managers, physicians, etc.)
influenced error reporting and error management among their subordinates in hospital teams,
findings demonstrated that leadership behavior related to safety was a more important
influence on staff error reporting than the words they spoke (Van Dyck, Dimitrova, de
Korne, & Hiddema, 2013). Leader inclusiveness is when leaders are available, open, and
accessible to employees by inviting input and demonstrating an appreciation for their
contributions (Hirak, Peng, Carmeli, & Schaubroeck, 2012; Nembhard & Edmondson, 2006).

9
Past organizational and team research underscores that leader inclusiveness is important to
the functioning of patient care teams. In particular, a past study demonstrated that leader
inclusiveness led to greater team engagement in quality improvement intitiatives on nursing
units (Nembhard & Edmondson, 2006). Similarly, some of the key behaviors embodied in
leader inclusiveness (i.e., availability and accessibility of nurse managers) have been
demonstrated to positively affect the willingness of clinicians to report errors (Edmondson,
1996). More research is needed to determine the effect of leader inclusiveness on error
reporting, but findings from past team studies support the use of this variable to study error
reporting.
Psychological safety. Past studies of error reporting also show that fear of reporting
errors and speaking up about unsafe practices greatly inhibits error reporting. In a study
employing focus groups of clinicians to determine the facilitators and barriers to error
reporting, researchers found that fear of retribution was one of the factors inhibiting error
reporting (Hartnell et al., 2012). Similarly, another study examining the use of an electronic
error-reporting system in two hospitals in Australia found that fear of negative repercussions
over reporting was a significant barrier to error reporting (Lederman et al., 2013).
A concept similar to fear that has been explored more widely in the team and
organizational literature is that of psychological safety, the degree to which individuals feel
safe to speak up about problems or unsafe conditions in their work team (Edmondson, 1999).
Recently, researchers studying error reporting in VA hospitals found that psychological
safety was related to perceptions surrounding error reporting (Derickson, Fishman, Osatuke,
Teclaw, & Ramsel, 2015). While the study examined both psychological safety and error

10
reporting at the organizational level, the findings support the relationship between
psychological safety and error reporting as well as demonstrate the need for more study.
In summary, past research on error reporting supports numerous reasons that
clinicians do and do not report errors. Research on error reporting has not yet sufficiently
explained the complexities of error reporting in hospitals. Knowledge of this information is
critical for addressing errors and improving the quality and safety of care in hospitals.
Research from organizational and team science may help better explain the organizational
and relational factors that affect error reporting. Based on past research from these fields and
research on error reporting, the variables of safety climate, leader inclusiveness, and
psychological safety seem to be particularly important factors to consider in relationship to
error reporting.
Nurses and Error Reporting
The clinician group that most consistently uses error-reporting systems in hospitals is
nurses (Farley et al., 2010; Levinson, 2012; Robinson & Hughes, 2008). Past research also
suggests that nurses are in an important position to identify errors and intervene to keep
patients safe from harm. For example, a study that examined errors in the Intensive Care
Unit (ICU) of a hospital found that nurses intercepted as many as 62% of the errors observed
by researchers, thereby preventing harm to patients (Rothschild et al., 2006). Due to their
important role in the healthcare team and their integral involvement in patient care, nurses
have knowledge of errors and error reporting that is different from other clinicians and is
therefore essential to examine when studying error reporting. Thus, this study of error
reporting focuses on nurses.

11
The Nursing Unit
The structure of patient care delivery and work in hospitals is hierarchical in nature.
Both patients and nurses are admitted or report to work on nursing units in hospitals.
Nursing units are grouped into departments, which are then organized in clusters within the
hospital. In recent years, hospitals are often part of a larger hospital system or affiliation of
hospitals. Importantly, the fundamental work group of the hospital is the nursing unit
(Leppa, 1996). That is, the care delivered to patients is predominantly delivered within the
context of nursing units; moreover, the professional and institutional identity of nurses is tied
to the unit where they work (Leppa, 1996).
Nursing units are also unique, with distinctions that can vary from unit to unit. For
example, past studies demonstrate that error-reporting rates can vary significantly between
units in a hospital (Edmondson, 1996). In a study of learning from errors conducted in
different nursing units across several hospitals, Edmondson (1996) found that error detection
rates, which were measured in part by the number of errors reported, varied between units of
a hospital. In explaining the variation, Edmondson (1996) observed that the climate of the
unit and the leadership behaviors of the nursing unit manager were important influences on
error detection. Thus, the study findings suggested that not only can error reporting vary by
nursing unit, but the factors that affect error reporting may also vary by unit. This study
examines error reporting at the nursing unit level and conceptualizes the nursing unit as a
team.
Purpose
Building on past research and addressing the need for future research, this study
sought to determine how team dynamics influence error reporting. Specifically, the study

12
examined the team dynamics of safety climate, leader inclusiveness, and psychological safety
and their effects on error reporting by nurses. The model of work-team learning provided the
theoretical foundation by informing the development of the conceptual model used in this
study and the relationships and variables examined.
Theoretical Foundation and Conceptual Model
The theoretical foundation used in this study was the model of work-team learning
from which the study’s conceptual model was derived. The model of work-team learning
was developed and tested by Amy Edmondson (1999) to study learning behavior in work
teams and provides an explanation for how team structures (conceptualized as organizational
context and team leader coaching) and interpersonal dynamics (described as the construct of
team beliefs and conceptualized as team safety) affect the specific team behavior of learning.
The conceptual model operationalizes the concepts of organizational context, team leadership
behavior, team safety, and team learning behavior in this study as safety climate, leader
inclusiveness, and psychological safety, and examines how these factors affect the team
learning behavior of error reporting.
The model of work-team learning provided an appropriate theoretical basis for
studying error reporting for at least two reasons. First, error reporting is a necessary
condition for organizational learning and can thus be considered an indicator of learning
behavior. Second, the model of work-team learning is a team level theory and is thus
designed to explain learning behavior in teams. Nursing units can be conceptualized as
teams, and past researchers have studied them as such (Edmondson, 1996; 2003). Thus, to
the extent that error reporting is necessary for organizational learning and the factors that

13
affect error reporting are team level factors, this theoretical model is ideal for studying the
phenomenon of error reporting.
Significance
In order for organizational learning to take place in response to errors, awareness that
errors have occurred is essential. Organizational awareness of errors can only happen if
nurses, physicians, or other clinicians report that an error or near miss happened. This study
sought to identify and explain factors that influence error reporting by nurses. By identifying
factors that encourage nurses to report errors and uncovering the underlying reasons for error
reporting, nurses and healthcare leaders can begin to work in tangible ways to improve the
reporting of errors. By applying the model of work-team learning to error reporting in
hospitals, this study also further contributes to theory development and adds to the
cumulative understanding of how this theoretical model might be adapted to studying the
phenomenon of error reporting in nursing units of hospitals.
Chapter Summary and Outline of This Dissertation
This chapter described the need for the present study, developed a better
understanding of the multiple factors that influence error reporting, and outlined the general
nature and direction of the research. The study’s findings will point to important suggestions
for organizational leaders and policy makers as well as significant implications for future
research and theory.
Chapter 2 presents a literature review of the independent variables of the study and
justification for conceptualizing the nursing unit as a team. Chapter 2 also discusses the
study’s conceptual framework, including a review of literature on the major aspects of the
framework and a presentation of the research questions of the study. Chapter 3 presents the

14
methodology for the study including the research design, study setting and sample,
operationalized variables and instruments, and data analysis. Chapter 4 presents the study
findings. Chapter 5 explores study findings within the context of practice, research, and
policy-making, as well as theoretical implications and future research.

15
CHAPTER 2
REVIEW OF THE LITERATURE AND THEORETICAL FOUNDATION
This chapter presents a summary of the literature on factors affecting error reporting
in hospitals, and presents the theoretical foundation and conceptual model of the study. The
chapter begins with a discussion of the conceptualization of the nursing unit as a team
followed by a review of the literature on the key variables of the study: safety climate, leader
inclusiveness, and psychological safety. Next, there is a discussion of the theoretical
foundation of the study and the model of work-team learning (Edmondson, 1999). This is
followed by an explanation of how the conceptual model of the study was derived from the
theory with support from the literature for the operationalization of the key variables of the
study. Chapter 2 concludes with a discussion of the study covariates and rationale for their
inclusion in this study.
Literature Review
The existing body of research on error reporting indicates that error reporting in
hospitals is exceedingly complex. Much of the past research in this area has worked to
identify barriers and facilitators to error reporting and has not fully explained the complicated
nature of error reporting. Research from organizational and team sciences as well as team
theory may better explain error reporting in hospitals by identifying team characteristics that
influence error reporting. Past research from these areas as well as past studies of error
reporting indicate that the factors of safety climate, leader inclusiveness, and psychological

16
safety may be particularly important to error reporting. Past research demonstrates
variability in error reporting between units and because the factors that may affect error
reporting can differ between units of study, the team perspective is particularly important to
error reporting.
The section that follows examines the relevant literature to explain how patient care
units in hospitals relate to the context of teams. Next, key variables identified from the
literature on patient safety and errors at the unit level—safety climate, leader inclusiveness,
and psychological safety—are examined in relationship to error reporting. After a review of
the literature, gaps in past research are identified, followed by a discussion of how this study
seeks to fill these gaps through an examination of error reporting.
The Nursing Unit as a Team
Traditionally, scholars have defined teams as groups having a distinct and stable
membership, where team members have clearly-defined roles, work in close coordination to
carry out their work, and share resources to achieve common goals (Chen, Kirkman, Kanfer,
Allen, & Rosen, 2007; Wageman, Gardner, & Mortensen, 2012). More recently, scholars
have pushed for new conceptualizations of team that move beyond this strict definition of “a
bounded, stable set of individuals interdependent for a common goal” (Wageman et al., 2012,
p. 311). Broader definitions of teams have been proposed, recognizing that teams of
individuals working toward a common goal might not be as bounded or stable as traditional
definitions imply. Furthermore, researchers recognize that the changing landscape of
organizations and the way work is conducted allows for a broader definition of team
(Wageman et al., 2012).

17
Nursing units fit this broader conceptualization of team. First, nursing units are
bounded entities. As such, they have separate and distinct operating budgets, supplies, and
for the most part, permanent staff members. There is generally a single nurse manager who
leads the nursing unit, manages the budget and personnel, and oversees the day-to-day
operations of the unit. Second, current conceptualizations of teams acknowledge that
conventional definitions of stability may not necessarily apply to all teams (Wageman et al.,
2012). This is true of the nursing unit. Nurses may enter and depart from nursing units at
various times because of hiring and turnover or to “float” to other units during periods of
organizational need.
Overall, however, nursing unit leaders desire a relatively stable work group. In order
to achieve adequate staffing to care for patients 24 hours a day, seven days a week, nurses
typically work in shifts. This means that the same nurses do not work the same shift all the
time, all possible shifts, or even every day of the week. So while the traditional definitions of
stability in teams may not perfectly fit nursing units in hospitals, these entities function as a
collective and, generally, as stable groups.
Finally, members of nursing units typically share the common goal of providing safe,
high quality care to their patients, and they must work in careful coordination to achieve this
goal of patient care. Based on these criteria set forth in the literature on teams, this study
conceptualizes the nursing unit as a team, which is also supported by past research studies
(e.g., Edmondson, 2003; Van Bogaert et al., 2014). The emphasis on nursing units as teams
is important to this study because much of the supporting literature used to inform this study
is from the organizational sciences and the smaller subset of team literature.

18
Safety Climate
The environment of patient care units is important to error reporting, especially as it
relates to the safety of patients. Researchers however are divided in how to study the safety
environment, which has been described as having both a safety culture and a safety climate.
There is a great deal of overlap and even confusion in the literature regarding the use of the
terms “safety culture” and “safety climate” (Zaheer, Ginsburg, Chuang, & Grace, 2015). The
two terms are often used interchangeably, which has led to confusion on the part of
researchers and those in practice (Mearns & Flin, 1999). This confusion in terminology can
be traced back to longstanding debates in organizational research over the related but broader
concepts of organizational culture and organizational climate (Denison, 1995; Mearns &
Flin, 1999; Schneider, Ehrhart, & Macey, 2013). The fundamental difference between
culture and climate in the literature is that there are two differing, theoretical schools of
thought—organizational sociology and organizational psychology—that lead researchers to
study culture versus climate (Denison, 1995). Organizational culture typically focuses on the
organizational system, while organizational climate typically focuses on the impact of the
organization on individuals within the organization.
The literature on organizational culture is rooted in organizational sociology, which
holds a social constructivist view of organizations where employees both work in and create
the social systems of organizations (Denison, 1995). Organizational culture is defined as the
values and beliefs of an organization that are embedded in the structure of the organization
and observed in the norms, rituals, and behaviors of employees (O’Reilly, Chatman, &
Caldwell, 1991). In past studies of culture, researchers have often used qualitative
methodologies (e.g., ethnography) to study organizational culture because it is difficult to

19
separate out the employee and their perceptions from the organizational context (Denison,
1995; Glick, 1985).
In contrast, organizational climate is rooted in the field of organizational psychology
(Denison, 1995). Organizational climate is defined as the shared beliefs and perceptions of
employees about the practices, policies, and procedures of an organization, and focuses more
on the influence of the organizational system on individuals (Denison, 1995; Schneider et al.,
2013). Thus, the strength of the climate perspective is in studying the influence of
organizational context on individuals (Denison, 1995) versus culture, which tends to focus on
the values and beliefs within organizations. An additional strength of the climate perspective
is that climate is thought to be more amenable to change than culture because it is a more
surface level concept (Vogus et al., 2010). This perspective puts forth the idea that managers
and organizational leaders are the creators of the organizational climate, and employees are
subordinates in power who do not exert influence or control over the organizational climate
(Denison, 1995). As a result, organizational climate research typically focuses on
employees’ perceptions of the organizational climate (Denison, 1995).
While the present study examines safety climate in relation to error reporting, past
research on both safety culture and safety climate and their relationship to error reporting is
relevant to this study. The majority of research on error reporting has examined safety
culture rather than safety climate. In the discussion that follows, the literature on safety
culture in relationship to error reporting is reviewed first, followed by a review of the
literature on safety climate and error reporting.
Safety culture is a dimension or sub-component of organizational culture that is
specifically related to patient safety (Cooper, 2000). There is evidence from the literature

20
that safety culture is positively associated with error reporting. A study by researchers in
Israeli hospitals examined the association between its patient safety culture and the incidence
of error reporting. It found that patient safety culture was postively associated with increased
levels of error reporting (Kagan & Barnoy, 2013). Similarly, a large study that used data
from hospitals across the U.S. to determine how safety culture affected error reporting found
that dimensions of the safety culture (e.g., management support, teamwork across units, etc.)
were positively associated with clinicians’ perceptions about the frequency of error reporting
on their patient care unit (Richter, McAlearney, & Pennell, 2014).
A study of pharmacists in the United Kingdom revealed that pharmacists were more
willing to report errors when they believed that the hospitals valued and welcomed error
reports as a way to learn and improve. Conversely, a negative safety culture was seen as a
barrier to error reporting when the pharmacists believed that individuals were blamed for
errors (Williams, Phipps, & Ashcroft, 2013). Similarly, a study that examined the
perspectives of clinicians (i.e., nurses and physicians) regarding error reporting found that a
significant barrier to reporting was a culture of blame for errors (Jeffe et al., 2004). Thus,
past studies of safety culture suggest that cultures that hold systems rather than individuals
accountable for errors increase error reporting markedly.
Like safety culture, safety climate is a sub-dimension of organizational climate that is
specifically related to patient safety. Safety climate has not been studied extensively in
relationship to error reporting, and certainly not to the same degree as safety culture. Safety
climate is defined as the shared perceptions and experience of employees about the practices,
policies, and procedures related to the safety of patients (Katz-Navon et al., 2005; Vogus et
al., 2010).

21
Evidence from the literature suggests that work teams that perceive better safety
climates exhibit better error reporting behaviors (Naveh et al., 2006) and commit fewer errors
(Hoffman & Mark, 2006; Naveh, Katz-Nevon, & Stern, 2005). In a study of error reporting
by clinicians in 44 units within three hospitals in Israel, the investigators found that certain
aspects of the safety climate on the unit significantly predicted the clinicians’ readiness to
report medical treatment errors (Naveh et al., 2006). Specificially, the safety climate
dimensions of safety procedures and safety information flow were positively linked with the
total number of error reports submitted over the course of a year to the risk management
system. Based on this past evidence, coupled with the knowledge that climate is ideal for
studying the influence of the organizational context on individuals, the present study
examines the effect of safety climate on error reporting.
Leader Inclusiveness
Research indicates that leadership behavior is important to error reporting. One study
showed leadership behaviors of healthcare leaders (e.g., nurse managers, physicians, etc.)
related to safety, not the verbal directives about safety, to be a far more important influence
on error reporting by the staff they managed (Van Dyck et al., 2013). These findings are
further supported by additional studies that have established the importance of team
leadership behavior to error reporting (Ko & Yu, 2015; Pfeiffer, Briner, Wehner, & Manser,
2013). For example, Ko and Yu (2015) examined the relationships among nurses’
perceptions of the patient safety culture, nurse leader coaching behaviors, and nurses’ intent
to report errors in five Korean hospitals. The findings of the study indicated that nurse leader
coaching behaviors were positively related to nurses’ intent to report errors. In a 2013 study,
Pfeiffer and colleagues examined individual, organizational, and system-level influences on

22
clinicians’ willingness to report errors. They found that managers’ support for error
reporting positively influenced clinicians’ willingness to report errors. Thus, findings from
past studies demonstrate that leadership behavior is significantly related to error reporting,
but these studies have examined different leadership behaviors (i.e., leadership behaviors
related to safety, nurse leader coaching, and management support for error reporting).
An operationalization of leadership behavior found in more recent organizational and
team literature is that of leader inclusiveness. Leader inclusiveness is when leaders
demonstrate availability, openness, and accessibility to team members by inviting input and
offering appreciation for their employees’ contributions (Hirak et al., 2012; Nembhard &
Edmondson, 2006). Nembhard and Edmondson (2006) first introduced leader inclusiveness
in a study that examined its effects with professional status on psychological safety, and the
improvement efforts in health care teams working in neonatal intensive care units. The
researchers of the study found that leader inclusiveness positively predicted team
engagement with quality improvement work. Another study examined how leader
inclusiveness promoted employee creativity in Research and Development teams of high-
technology organizations and found that leader inclusiveness positively affected
psychological safety among employees, which in turn increased employee creativity in the
workplace (Carmeli, Reiter-Palmon, & Ziv, 2010). Hirak et al. (2012) examined the effects
of leader inclusiveness and psychological safety on team learning and team performance
among employees working in units of a large hospital in Israel. They found that leader
inclusiveness was positively associated with team psychological safety, which in turn
positively affected team learning from failure and ultimately resulted in better team
performance. These studies thus demonstrate that leader inclusive behaviors in teams

23
promote improved team functioning by engaging members in quality improvement
initiatives, workplace creativity, and team learning and performance.
Past study findings suggest that leader inclusiveness may be an important factor in
promoting team learning behaviors related to error reporting. The study of leader
inclusiveness is relatively new (Carmeli et al., 2010; Mitchell et al., 2016), so there is only a
limited number of studies that have examined leader inclusiveness. Moreover, no previous
studies have examined the relationship between leader inclusiveness and error reporting.
Despite the lack of study in this area, research that ties leader behaviors to error reporting
suggests that leader inclusiveness should also positively influence error-reporting behavior.
Psychological Safety
Psychological safety has been defined as
individuals’ perceptions about the consequences of interpersonal risks in their work
environment. It consists of taken-for-granted beliefs about how others will respond
when one puts oneself on the line, such as by asking a question, seeking feedback,
reporting a mistake, or proposing a new idea. (Edmondson, 2004, p. 241)
The ideas represented by the concept of psychological safety are seen in much of the
literature on error reporting. Specifically, much of the past research on error reporting
indicates that fear is a significant barrier to error reporting, which could be interpreted as
poor psychological safety.
Research on error reporting that has used qualitative methods indicates that fear can
significantly inhibit error reporting by nurses and other clinicians (Lederman et al., 2013).
Psychological safety conveys the extent to which team members feel safe to identify and
speak up about problems they encounter in their work (Edmondson, 1999, 2004). Thus, it
seems that fear related to error reporting is indicative of poor psychological safety on the part
of clinicians, inhibiting them from reporting errors. For example, in a study of nurses and

24
physicians who were asked to evaluate a scenario that clearly portrayed the hospital as the
source of error, not the individual, a theme emerged from the nurse focus groups of fear to
speak up and report the error (Jeffe et al., 2004). Other studies have documented that nurses
were particularly hesitant to report errors they observed physicians commit because they
perceived physicians to be more powerful (Espin et al., 2006, 2010). As a result, nurses felt
more comfortable informally reporting errors committed by physicians by verbally
discussing the events with a peer or nurse manager, or by documenting the events in the
clinical note of a patient’s chart rather than formally submitting an error report through the
voluntary error reporting system. In another study that examined error reporting by nurses
working in pediatric units of hospitals (Stratton, Blegen, Pepper, & Vaughn, 2004), nurses
indicated that fear related to reporting (e.g., fear of losing their nursing license, fear that
colleagues would think they were incompetent) were primary reasons for not reporting
errors.
In the healthcare literature, there is growing support for the role of psychological
safety as an important positive influence on error reporting and the ability to speak up about
safety concerns in healthcare (Leroy et al., 2012). A recent study conducted in the Veterans
Health Administration (VHA) demonstrated a positive relationship between psychological
safety and error reporting. Specifically, individuals working in hospitals with higher and
more positive psychological safety scores indicated a greater willingness to report errors
(Derickson et al., 2015).
Another study of healthcare professionals working in cancer hospitals in Sweden
examined a broader but similar concept to error reporting, speaking up behavior, and found
that healthcare professionals who did not feel psychologically safe were unlikely to speak up

25
about unsafe conditions they encountered (Schwappach & Gehring, 2015). Similarly, a study
conducted on nursing units of a hospital examined the relationships among nurse managers’
behavioral integrity for safety, team priority for safety, and team psychological safety, and
the number of treatment errors reported by nurses (Leroy et al., 2012). The study findings
indicated that more positive team psychological safety resulted in greater reporting of
treatment errors by nurses.
Past research indicates that there is a significant relationship between psychological
safety and error reporting (Derickson et al., 2015; Leroy et al., 2012). Therefore, this study
used existing research indicating that psychological safety inhibits error reporting by
including psychological safety in this study of error reporting.
Knowledge Gaps
A broad review of past organizational and error-reporting literature suggests that the
variables of safety climate, leader inclusiveness, and psychological safety are important in
the study of error reporting. Past research has also demonstrated that leadership behaviors
significantly affect error reporting (Ko & Yu, 2015; Van Dyck et al., 2013), but these studies
did not examine the specific behavior of leader inclusiveness, which the literature on teams
suggests may affect error reporting. While the factors of safety climate (Naveh et al., 2006)
and psychological safety (Derickson et al., 2015; Leroy et al., 2012) have been examined to
some extent in past studies of error reporting, none of the identified studies of error reporting
have assessed these factors and their relationship to error reporting within the context of
related theory. Doing so would help to elucidate the relationships among variables and error
reporting behaviors. This kind of evidence would be important information for those in
healthcare leadership positions of hospitals as they work to improve error reporting in order

26
to gain better knowledge of how to improve the hospital system in order to prevent future
errors from occurring. Therefore, this study of error reporting addresses significant gaps in
the research by examining safety climate, psychological safety, and error reporting with the
model of work-team learning.
Theoretical Foundation of the Study
The theoretical foundation for this study of error reporting is the model of work-team
learning, which emphasizes team level factors that are believed to affect error reporting. This
model reflects the work of Amy Edmondson (1999). In particular, there are three past
studies conducted by Edmondson that are relevant to a discussion of the model of work-team
learning. Each of these studies is reviewed in the following sections.
Group and Organizational Influences on Learning from Mistakes
In 1996, Edmondson explored how group and organizational factors affected learning
from mistakes in hospitals. The study used both quantitative and qualitative methods to
better understand whether some hospital work-teams were better than others at finding and
correcting errors before serious harm occurred. The study also examined which teams were
more capable of learning from the errors they identified, and thereby avoided similar
mistakes in the future. In particular, the study sought to explain what accounted for the
differences in performance between the teams. The quantitative component of the study
examined 12 variables in five organizational categories: leadership behavior, organization
context, unit characteristics, unit outcomes, and individual satisfaction. The results of the
analyses showed that higher perceptions of unit performance, the quality of unit
relationships, and nurse manager leadership behaviors were positively related to higher error
rates (recorded through daily chart review, daily visits to the unit, and a confidential error

27
reporting system). Noting that she expected to find the opposite, Edmondson questioned
whether her findings indicated that better nursing leadership led to higher error rates, or
whether units with leaders who created a climate of openness to facilitate the discussion of
errors encouraged employees to be more willing to report errors. Furthermore, the study
demonstrated considerable variability in error reporting rates among the units, which led
Edmondson to propose that there were at least two influences on detected error rates in
hospital units: the number of actual errors that occur and the willingness of unit employees to
report the actual errors made.
Qualitative data for the study were collected from clinicians (e.g., nurses, physicians,
and pharmacists) and manager interviews on eight patient care units in two different
hospitals, and provided further support for Edmondson’s quantitative findings. These data
were used to identify several factors that helped to explain the variation between units: the
climate of the unit; the characteristics of the nurse manager as perceived by staff (i.e.,
openness, attire, and trustworthiness); perceived supportiveness among nurses of each other
and of the nurse manager; and nurses’ willingness to collaborate across disciplines (e.g.,
nurses with physicians). Thus, the qualitative findings of Edmondson’s study supported the
conclusions she reached about the quantitative results, suggesting that nurse managers’
leadership behaviors were an important influence on clinicians’ beliefs about discussing
errors. Higher rates of error detection were found on units with more positive leadership
characteristics.
Edmondson’s study is relevant to the model of work-team learning for a number of
reasons. First, this study established that two structural characteristics at the team level—the
climate of the unit where clinicians worked and the leadership behavior of the nurse

28
manager—were important to clinicians’ willingness to speak up about mistakes or problems
in their unit and the ability of the team to then learn from the mistakes reported. This study
emphasizes the importance of both the climate of the unit and leadership behavior as well as
the effect of these two factors (climate and leadership behavior) on error-reporting rates.
Second, the study highlights that the climate of the unit, the leadership behaviors of nurse
managers, the error reporting rate, and team learning all varied widely between the units
studied. Edmondson recommended continued study of errors and reporting from a team level
in organizations. She found that team factors on these nursing units seemed to affect error
identification and learning in teams. Finally, Edmondson recognized that employees must
feel safe to speak up before they are willing to report mistakes and share information that
might challenge the status quo, a concept that becomes more fully articulated in the model of
work-team learning as psychological safety.
Learning Behavior in Work Teams
In 1999, Edmondson examined team learning in manufacturing organizations, using
the model of work-team learning. This study again used quantitative and qualitative methods
to explore how structural and interpersonal dynamics of the team influenced team learning
and, in turn, whether team learning influenced team performance. The study also explored
the concept of psychological safety in work teams, which was prompted by findings from her
1996 study. Prior to this study, psychological safety had been examined in the organizational
literature of the 1960s, but research on psychological safety had mostly been abandoned until
the 1990s when researchers like Edmondson began to study psychological safety within the
context of organizational teams (Edmondson & Lei, 2014).

29
Edmondson explained the concept of psychological safety by noting that there is a
natural proclivity on the part of all individuals to protect themselves from potentially
embarrassing situations, something that most individuals accomplish by not challenging
conventional practices, discussing problems, or reporting their own mistakes. However, this
natural tendency, she noted, poses a threat to organizational learning because the very
information individuals are apt to suppress (e.g., mistakes, problems, challenging
conventionality) is essential for learning and enacting improvements in teams and
organizations. She also noted that research has demonstrated that the tendency to withhold
potentially embarrassing or uncomfortable information is counteracted, to some degree, by
familiarity and comfort with the teams where individuals worked. She cited findings from
her 1996 study in support of this assertion, noting that clinicians’ willingness to report errors
was associated with the climate of the unit and the leadership behaviors of the manager.
Thus, the concept of psychological safety in teams was more purposefully explored in this
study than in her previous work.
In this study of psychological safety and learning behavior in work teams,
Edmondson introduced the model of work-team learning as the theoretical basis for the
study. The model included the constructs of team structures (operationalized as context
support and team leader coaching) and team beliefs (operationalized as team safety and team
efficacy) on team behaviors (operationalized as team learning behavior) and team outcomes
(operationalized as team performance). The model is more fully explained later in this
chapter.
This study provided support for the important role of psychological safety to team
learning behavior and the ultimate performance of the team. It also supports the use of the

30
model of work-team learning as a theoretical foundation for studying learning behaviors in
teams. The study demonstrated that the team structures of context support and team leader
coaching were important antecedents to psychological safety, and that psychological safety
positively affected team learning behavior and ultimately team performance. The only
portion of the model of work-team learning that was not supported by the study findings was
the concept of team efficacy, which Edmondson had hypothesized was related to team
learning behavior when controlling for the variable of psychological safety. She had also
hypothesized that team efficacy acted as a mediator between team structures (team leader
coaching and context support) and team learning behavior. Neither of these hypotheses were
supported by the model, and in response Edmondson wrote, “. . . the theoretical premise that
lies at the core of the team learning model does not appear to require the supplementary
effects of team efficacy” (p. 376). Based on study findings, Edmondson suggested that team
efficacy was not important in future studies using the model of work-team learning.
This 1999 study by Edmondson provided support for the concept of psychological
safety and for the importance of this variable in studying learning behavior in teams.
Furthermore, the study affirmed the utility of the model of work-team learning, with the
exclusion of team efficacy as a theoretical foundation for the study of learning behavior in
teams.
The Learning Process in Interdisciplinary Action Teams
In 2003, Edmondson returned to healthcare and conducted a study that examined
interdisciplinary work teams in the operating room and how team structural factors (team
leadership and organizational context) affected the learning processes (speaking up, practice

31
and reflection, boundary spanning), and the successful implementation of a new technology
for cardiac surgery. This study was particularly focused on how team leader behaviors and
the organizational context2 affected the team learning process and the implementation
success of the new technology. The study used multiple case comparison methods to gather
both quantitative and qualitative data and was conducted with 16 teams and 150 individuals
from hospitals across the U.S. in the process of implementing a new, minimally invasive
cardiac surgery. This new technology was implemented in interdisciplinary action teams,
and therefore provided a unique opportunity to study learning and change in a different type
of team situation.
Results of the study showed that multiple factors were important to the successful
implementation of the technology. Specifically, quantitative data demonstrated that team
leader coaching, team preparation, the ease with which team members could speak up about
problems, and the boundary spanning of team members (i.e., the ability to communicate and
coordinate both within the team context and outside the team) were all related to the
procedure’s implementation success. The study findings emphasized the important role of
team leadership behaviors in team members’ willingness to speak up and ultimately to the
successful implementation of the technology. In discussing the results, Edmondson noted
that the study findings suggested that the team leadership behaviors of engaging team
members and directing their behaviors to the goal or task were closely aligned with the
leaders’ invitations for team members to speak up. She noted that employing motivating
2 In the original model of work-team learning, Edmondson (1999) uses context support. In this particular study
of work-teams in the operating room (Edmondson, 2003), she uses the slightly different term of organizational
context. However, both terms convey the same idea of tangible and intangible supports in place for the team.
Thus, context support and organizational context are interpreted as equivalent concepts.

32
behaviors and promoting psychological safety by inviting input and downplaying power
differentials enabled leaders to promote learning within the team. Of particular note, the
study did not find a significant relationship between the organizational context and
implementation success, suggesting that the importance of the organizational context to team
outcomes may differ depending on the type of team and the nature of their work.
Interestingly, this study did not use the model of work-team learning as the theoretical
basis, but instead used some of the model constructs, particularly the constructs of team
leadership and organizational context. The findings of this study with respect to team
leadership highlight the importance of the relational aspects of leadership (e.g., emotional
and social factors) to the team members’ willingness to speak up (e.g., psychological safety).
The organizational context was therefore not important to the learning process or to the
teams’ successful implementation of the technology in this study. These findings
demonstrate that teams vary in their goals and contexts in such a way that team factors that
are important for success in one arena may not be essential in another.
In summary, Edmondson’s 2003 study contributes to our understanding of some
constructs and concepts included in the model of work-team learning. In particular, this
study emphasizes the importance of team leader behaviors to team members’ perceptions of
psychological safety. Furthermore, this study highlights that some team factors such as
context support may be important in some team situations (e.g., teams in the manufacturing
industry; Edmondson, 1999), but not in others (e.g., interdisciplinary action teams in the
operating room of hospitals; Edmondson, 2003).

33
Summary of Key Studies by Edmondson
This review of relevant studies conducted by Amy Edmondson (1996, 1999, 2003)
helps to explain the model of work-team learning from which this study’s conceptual model
was derived. In general, there is support for the use of the model of work-team learning to
study learning behavior in teams. In particular, these studies are relevant to understanding
the role of team structures in the team members’ perceptions of psychological safety and
team learning. In the section that follows, the model of work-team learning is described and
explained by examining the constructs and concepts of the model.
The Model of Work-Team Learning
The model of work-team learning (Figure 1) demonstrates how structural and
interpersonal dynamics of the team influence team learning and team performance
(Edmondson, 1999). The model of work-team learning is a mid-range or intermediate theory
that addresses the relationships between abstract and operational elements (Edmondson,
2003; Edmondson & McManus, 2007).
From “Psychological safety and learning behavior in work teams,” by A. C. Edmondson, 1999, Administrative
Science Quarterly, 44(2), p. 357. Copyright 1999 by ASQ. Reprinted with permission.
Figure 1. A model of work-team learning (Edmondson, 1999, p. 357).

34
The model reflects the major constructs of antecedent conditions, team beliefs, team
behaviors, and outcomes. Antecedent conditions are considered to be team structures while
team beliefs are team safety and team efficacy, team behaviors are team learning behavior,
and outcomes are team performance. These constructs, along with related concepts and
variables, will be discussed below using Edmondson’s three prior studies to describe the
model of work-team learning (Edmondson 1996, 1999, 2003).
Antecedent Conditions: Team Structures
The first construct in Edmondson’s model of work-team learning is antecedent
conditions. This construct is manifested as the team structures, defined as properties of the
team that inform team beliefs, team behaviors, and ultimately team outcomes (Edmondson,
1996, 1999). In the model of work-team learning, team structures are conceptualized as
context support and team leader coaching (Edmondson, 1999). Context support refers to the
shared beliefs among team members that they are supported in their work in tangible ways
(i.e., informational needs are met) and intangible ways (i.e., rewards are given for hard work)
(Edmondson, 1999). Team leader coaching refers to the way leaders behave, and whether
they are perceived to be open to team members’ ideas and supportive of the team as a whole
(Edmondson, 1999). There is support from past research that context support and team
leader coaching are important factors in creating an environment that team members believe
is safe to share their ideas or admit mistakes (Edmondson, 1996, 1999).
Team Beliefs: Team Safety and Team Efficacy
The next construct in Edmondson’s model of team learning is team beliefs, which are
postulated as a manifestation of the antecedent conditions (context support and team leader
coaching). These antecedent conditions were described as influencing the degree to which

35
team beliefs predicted team behaviors and outcomes (Edmondson, 1999). Team beliefs are
defined as the shared group perspectives that arise from individuals’ perceptions about a
group (Knott, 2009), and include team safety and team efficacy.
The concept of team safety, measured by the variable of psychological safety, reflects
team members’ shared perceptions of trust and mutual respect that enable team members to
take certain risks, such as reporting mistakes, asking questions, seeking feedback, and
challenging the status quo (Edmondson, 1999, 2004). The concept of team efficacy is team
members’ shared perceptions of the work team’s ability to accomplish team goals.
Edmondson (1999) theorized that both team safety and team efficacy influenced team
behaviors and in particular, team learning behavior. Findings from her study of team
learning behavior in the manufacturing industry supported the relationship between team
safety and team learning behavior, showing that beliefs about mutual respect in the team and
the ability of team members to speak up about unsafe practices enabled learning behavior
that ultimately influenced team performance (Edmondson, 1999). Additionally,
psychological safety was supported as a mediator between team structures (context support
and team leader coaching) and team learning behavior, with psychological safety explaining
how team context support and team leadership coaching are related to team learning and
performance. As previously discussed, Edmondson (1999) did not find support for her
hypotheses about the role of team efficacy as either an influence on team learning behavior
or as a mediator between team structures (context support and team leader coaching) and
team learning behavior. Accordingly, she recognized that team efficacy did not appear
necessary to team learning behavior.

36
Team Behaviors: Team Learning Behavior
The next construct in the model is team behaviors, which is conceptualized as the
actions of the team that allow for improvement and learning (Edmondson, 1999; Knott,
2009). Team behaviors are conceptualized as team learning behavior and viewed as the
learning process that occurs at the unit or team level of the organization (Edmondson, 1999,
2003). While some scholars of organizational learning have defined learning as an outcome,
Edmondson (1999) views learning as an ongoing process that involves seeking feedback and
information via team reflection, from clients, and from others relevant to team performance.
Information sharing has long been recognized as an essential aspect of learning (Argyris,
1976; Levitt & March, 1988), and was included by Edmondson (1999) as part of the concept
of team learning behavior. Her analysis of team learning behavior in manufacturing work
units demonstrated that team learning behavior was positively related to team performance.
Outcomes
The final construct in Edmondson’s model of work team learning is outcomes,
operationalized as team performance and conceptualized as the result of team structures,
team beliefs, and team behaviors (Edmondson, 1999). While team learning behavior is the
overall process through which the team learns, the ultimate outcome is team performance
(Edmondson, 1999). The achievements of the team might include outcomes such as
customer satisfaction or successful team implementation of a new technology (Edmondson,
1999, 2003).
The Model of Work Team Learning Applied to This Study of Error Reporting
The model of work team learning was the theoretical basis of this study to examine
the phenomenon of error reporting, and was used to develop the conceptual model used in

37
this study. Three of the four constructs from the model of work-team learning were used in
the conceptual model: team structures, team beliefs, and team behaviors. Like Edmondson’s
model, these constructs are believed to be related to one another. Team structures inform
team beliefs which in turn affect team behaviors.
The construct of outcome, conceptualized as team performance, was not examined in
this study because the utility of the work-team learning model largely depends on the
phenomenon of study, and in this study, the focus was on the team learning behavior of error
reporting. Also, it is difficult to tease out the outcomes per se that might be associated with
error reporting. For example, many studies of patient safety or quality use patient outcomes
(e.g., length of stay, infection rates, mortality rates, etc.) or nurse outcomes (e.g., nurse
satisfaction, nurse turnover, staffing mix, etc.) to reflect unit or team performance. However,
there was no support found in the literature documenting a relationship between error
reporting and any of these commonly studied outcomes. In fact, after a review of the
literature, error reporting was not found to be clearly related to any patient or nurse
outcomes, and this lack of support in the literature suggests that common outcome measures
are not linked to error reporting, and argues against including these outcome variables in this
study of error reporting. The relationship between team learning behavior and outcomes also
has not been supported through prior research. This lack of support from prior research for a
relationship between team learning behavior and outcomes of care can be explained by the
fact that team learning with respect to error reporting instead likely leads to organizational
learning, versus the outcomes of care typically studied in patient safety and quality.
The conceptual model for this study is presented in Figure 2. The section that follows
provides a discussion of how the constructs and concepts from the model of work team

38
learning were applied to develop the conceptual model, and provides an explanation of how
the concepts were operationally defined. The relationships in the conceptual model are then
discussed with a presentation of the research questions of the study. Finally, the covariates
believed to be important in the study of error reporting on patient care units are reviewed.
Figure 2. Conceptual model of error reporting, derived from Edmondson’s model of work-
team learning.
Team Structures
Similar to Edmonson (1999), team structures in this study were viewed as the
antecedent conditions of the conceptual model. Past organizational research has supported
this construct, suggesting that team structures are related to both team learning and team
beliefs about safety (Bresman & Zellmer-Bruhn, 2013; Bunderson & Boumgarden, 2010;
Edmondson, 1999). In a study of pharmaceutical research and development teams that in
part examined the effect of team structure on team learning (Bresman & Zellmer-Bruhn,
2013), the researchers found that team structures were positively associated with team
learning both internally between team members, and externally between the team and other
groups in the organization. Similarly, Bunderson and Boumgarden (2010) examined teams

39
in high-technology firms of the Fortune 100 to determine how team structure influenced team
learning. They found that team structure, by establishing psychological safety, positively
influenced team learning.
Team structure is commonly examined in the research on teams, but there is no clear
consensus among researchers and theorists on the best way to conceptualize team structure.
In Edmondson’s (1999) study of teams in manufacturing organizations, the study where she
introduced and used the model of work-team learning, she conceptualized team structure as
context support and team leader coaching. Other researchers have used the sociology and
organizational literature to conceptualize team structure as specialization (e.g., roles and
responsibilities of the team members or the vertical distribution of work), hierarchy (e.g., the
vertical relationship between the team leader and the employees), and formalization (e.g.,
priorities and procedures that regulate and govern work). Like the model of work-team
learning, this study conceptualizes team structures as context support and team leadership
behavior. This conceptualization differs slightly from Edmondson (1999), by using team
leadership behavior instead of team leader coaching.
Context support. The first element of team structure included in this conceptual
model is context support, which Edmondson (1996, 1999, 2003) has described as team goals,
team design, resources, information, and climate. The idea of context support can be
explained as the structural elements present that influence team beliefs and team behaviors
(Edmondson, 1996, 1999, 2003) or the norms and climate of the team (Bunderson &
Boumgarden, 2010). In keeping with Edmondson’s (1996) study of error reporting and
learning in hospital teams, this study operationalizes context support as climate, and more
specifically, as the safety climate of the nursing unit, also described earlier.

40
Team leadership behavior. The second element of team structure in this conceptual
model is team leadership behavior. This concept differs slightly from Edmondson (1999)
who instead used team leader coaching. Team leadership behavior was chosen for use in this
study because it is a broader definition of team structure derived from earlier work by
Edmondson (1996). In her 1996 study of learning from mistakes in hospital units,
Edmondson used both qualitative and quantitative methods to understand the differences in
teams that helped to explain why some teams identified and learned from errors better than
others. Among her findings, she identified leadership behaviors by the unit managers (i.e.,
nurse managers) that positively affected error detection and learning. These positive
behaviors included openness, accessibility, and engaging with staff, which she then seemed
to both conceptualize and operationalize as “team leader coaching” (Edmondson, 1996,
1999). While Edmondson used the term “team leader coaching,” the behaviors she described
are not limited to merely coaching. This study describes “team leadership behavior” instead,
which recognizes a wider array of leadership behaviors that can positively influence the team
belief about safety and the learning behavior of teams. Therefore, the second element of
team structure in this model is defined as team leadership behavior, which is conceptualized
as leader inclusiveness and discussed earlier in the chapter.
Team Beliefs
Team beliefs begin with the individual but emerge and are observed in shared team
attitudes, perceptions, experiences, and behaviors (Kozlowski & Klein, 2000). Team beliefs
are comprised of both cognitive and social processes (Van den Bossche, Gijselaers, Segers,
& Kirschner, 2006). Past research demonstrates that team structures influence team beliefs,
which, in turn, influence team behaviors (Edmondson, 1999). A more recent study of nurses

41
and other health professionals working in nursing teams found that team beliefs influenced
team behaviors, specifically team learning behavior (Ortega, Sanchez-Manzanares, Gil, &
Rico, 2013). In this study of error reporting, team belief is conceptualized as team safety
belief, which is in keeping with the work of past scholars (Edmondson, 1999; Ortega et al.,
2013).
Team safety belief. The concept of team safety is a shared perception among team
members of trust and mutual respect that empowers individuals in the team to take
interpersonal risks like reporting mistakes, challenging the status quo, asking questions, and
seeking feedback (Edmondson, 1999, 2004). In a study conducted in nursing units of
hospitals, Edmondson (1996) used both qualitative and survey methods to examine the
differences in medication errors detected between eight nursing work teams. Through
qualitative interviews, she discovered that shared perceptions among team members about
the consequences of making an error influenced the rate of error reporting. She identified
this notion of willingness to speak up or willingness to discuss mistakes. In later research,
Edmondson further refined this concept of willingness to speak up as team safety, and
measured as psychological safety, noting that team safety influences both team learning
behavior and team performance (Edmondson, 1999, 2003). She operationally defined team
safety as psychological safety and developed a valid measure of this variable (Edmondson,
1999). Similarly, this study of error reporting conceptualizes team safety as psychological
safety.
Team Behaviors
Team behaviors reflect the actions or conduct exhibited by teams, as a whole. Past
research has examined team behaviors manifest in a multitude of ways, including unethical

42
behaviors (Pearsall & Ellis, 2011), involvement in quality improvement (Nembhard &
Edmondson, 2006), and team learning behavior (Edmondson, 1999, 2003). In this study,
similar to the model of work-team learning, team behavior is conceptualized as team learning
behavior.
Team learning behavior. Team learning behavior is characterized by reflection and
action by team members that result in improved performance in the team (Edmondson,
1999). There is some debate among organizational learning scholars over the nature of
learning. Some have viewed learning as an ongoing process that organizations engage in
while others have viewed learning as an outcome. Similar to Edmondson’s (1999)
conceptualization, this study views learning as reflection and subsequent action taken by
team members. Specifically, this study examines how the antecedent conditions of team
structures and team safety influence the team learning behavior of error reporting in
hospitals.
Relationships of the Model
In this section, the relationships illustrated by the conceptual model and postulated in
this study are examined in detail. The discussion begins with the relationships of context
support and team leadership behavior to team learning behavior followed by an analysis of
the relationship of team leadership behavior and context support with team safety belief.
Next, the study looks at the relationship of team safety belief with team learning behavior.
Finally, there is a discussion of the mediating role of team safety belief. Each relationship in
the model is presented with related research questions.
Context support and team leadership behavior. Previous studies have
demonstrated that both context support and team leadership are important to team beliefs and

43
learning behavior. Early work by Edmondson (1996) found that organizational
characteristics of the unit, such as the climate, contributed to the detection of errors on the
unit. Additionally, the same study found that leadership behaviors were strongly tied to the
number of errors detected on the unit, with more positive leadership behaviors resulting in
greater error detection. A 2006 study by Naveh and colleagues found that certain dimensions
of the safety climate of nursing units positively affected clinicians’ readiness to report errors
so that more positive aspects of the safety climate were related to more error reports
submitted by clinicians. Another study that examined the relationship between nurses’
perceptions of the safety culture, nurse leader coaching behaviors, and nurses’ intent to report
errors found that both safety culture and nurse leader coaching behaviors were positively
related to nurses’ intent to report (Ko & Yu, 2015). Taken together, these studies
(Edmondson, 1996; Ko & Yu, 2015; Naveh et al., 2006) provide support for the importance
of context support and team leadership behaviors relative to team learning behavior (in this
study, error reporting). Thus, Research Question 1 (RQ1) seeks to determine how team
context support and leadership behavior influence team learning behavior by asking: How do
safety climate and leader inclusiveness affect error reporting?
The study conducted by Edmondson (1999) in work teams of manufacturing
organizations supports the relationship between context support and team safety belief. That
study demonstrated that context support was positively related to the team safety belief of
psychological safety. No identified past studies have examined the specific relationship of
safety climate to psychological safety, but it seems logical to expect that an organizational
environment that prioritizes safety is one where individuals would feel safe to speak out
about unsafe conditions or error-related events they observe.

44
There is past research to support the relationship between team leadership behavior
and team safety belief (operationalized as psychological safety). For example, a study that
examined improvement efforts in health care teams working in neonatal intensive care units
of hospitals first demonstrated a positive relationship between team leadership and
psychological safety (Nembhard & Edmondson, 2006). Later research has further supported
the notion that team leadership (measured as leader inclusiveness) is positively associated
with the team safety belief of psychological safety (Carmeli et al., 2010; Hirak et al., 2012).
A study by Carmeli and colleagues (2010) examined how leader inclusiveness and
psychological safety promoted team creativity in the workplace. The study findings
demonstrated that leader inclusiveness was positively related to psychological safety, which
was then positively associated with employee creativity in the workplace. Another study
conducted in nursing units of a large medical center in Israel found that leader inclusiveness
positively affected psychological safety, which subsequently resulted in team learning from
failure and the ultimate performance of the unit (Hirak et al., 2012). In Research Question 2
(RQ2), the relationships of context support and team leadership behavior with team safety
belief are explored by asking: How do safety climate and leader inclusiveness affect
psychological safety?
Team safety belief. Past studies have demonstrated a positive relationship between
the team safety belief of psychological safety and team learning (Brueller & Carmeli, 2011;
Edmondson, 1999; Kostopoulos & Bozionelos, 2011). Edmondson (1999) found that the
team safety belief of psychological safety promoted team-learning behavior in work-teams
within a manufacturing organization. Similarly, Brueller and Carmeli (2011) conducted a
study of teams in eight large organizations in Israel to determine how high quality

45
relationships in the team affected team learning and team performance. They found that
psychological safety was one of the significant predictors of both team learning and team
performance. Another study examined teams in information technology companies and
pharmaceutical organizations in three countries to determine the effect of psychological
safety on different types of team learning and team performance (Kostopoulos & Bozionelos,
2011). The researchers found that psychological safety positively affected team learning
activities or behaviors (measured as team exploratory learning and team exploitive learning),
which resulted in improved team performance. These studies illustrate and support the role
of team beliefs about safety, operationalized as psychological safety, on team learning
behavior.
There is also growing support in the healthcare literature for the role of psychological
safety as an important influence on error reporting, which is how team learning behavior is
operationalized in this study (Leroy et al., 2012). A recent study conducted in the Veterans
Health Administration (VHA) demonstrated a positive relationship between psychological
safety and error reporting. Individuals working in hospitals with more positive psychological
safety scores indicated greater willingness to report errors (Derickson et al., 2015). Another
recent study of healthcare professionals working in cancer care hospitals in Sweden found
that withholding patient safety concerns among healthcare professionals was negatively
associated with psychological safety, and that individuals who did not feel psychologically
safe were unlikely to speak up about safety concerns they encountered (Schwappach &
Gehring, 2015). In other words, the study findings demonstrated that psychological safety is
an important factor in whether individuals were willing to report error-related events. Based
on the cumulative literature on psychological safety found both in the organizational and

46
psychology and healthcare literature, there is strong empirical support for the positive
relationship between psychological safety and error reporting. Thus, Research Question 3
(RQ3) seeks to determine the effect of team safety belief on team learning behavior by
asking: How does psychological safety affect error reporting?
Additional evidence from the literature suggests that psychological safety in teams
often mediates different team factors that can affect team-learning behavior. For example, a
study that examined the effect of emotional intelligence on learning behavior in work teams
of different organizations found that psychological safety mediated the relationship between
emotional intelligence and team learning behavior (Ghosh, Shuch, & Petrosko, 2012). Thus,
psychological safety helped to explain how emotional intelligence affected learning behavior
in teams. Similarly, a study of teams in 85 different organizations in China found that
psychological safety was an important mediator between the relationship of the team leader’s
values (measured as leader’s values of participation, people, and productivity) and team
learning. Edmondson (1999) found that within work teams of a manufacturing company,
psychological safety was an important mechanism through which the team structures of
context support and leader coaching affected team learning and performance. In the context
of that study, psychological safety mediated the relationship between context support and
leader coaching with team learning behavior. Based on past research, this study seeks to
determine whether psychological safety helps to explain how safety climate and leader
inclusiveness affect error reporting. It may be that psychological safety is an important
factor in explaining the effect of the safety climate and leadership on error reporting.
Research Question 4 (RQ4) determines the mediating role of team safety belief by asking:

47
Do leader inclusiveness and safety climate indirectly affect error reporting through
psychological safety?
Covariates
Covariates are often included in studies of organizations, particularly in studies of
patient safety and outcomes in hospitals, as researchers seek to determine characteristics of
employees (e.g., nurses) or the work unit that may explain variations in responses (de
Cordova, Phibbs, Schmitt, & Stone, 2014; Needleman, Buerhaus, Pankratz, Leibson, &
Stevens, 2011). The covariates included in this study are categorized as nurse characteristics
(individual level) and nursing unit characteristics (unit level). The nurse characteristics
included nurse education, nurse experience, and nurse tenure. The nursing unit
characteristics included nurse manager education, nurse manager tenure, the size of the
nursing unit, and the type of nursing unit. Each of these covariates are discussed in greater
detail in the sections that follow.
Nursing characteristics. Nursing characteristics are individual characteristics of the
nurse. In this study, nurse education, nurse experience, and nurse tenure are the nursing
characteristics included as covariates. These covariates are briefly discussed from the
literature with an explanation for their inclusion in this study.
Nurse education. In 2012, the IOM recommended increasing the total percentage of
nurses with a baccalaureate degree to 80% by the year 2020. This group recognized that
while there is inconclusive evidence in the literature to causally link nurse education (i.e.,
academic degree) with patient outcomes, there is considerable evidence to support the
relationship between nurse education and patient outcomes such as mortality or failure to
rescue (Aiken et al., 2011; Aiken, Clarke, Cheung, Sloane, & Silber, 2003). For example,

48
Aiken and colleagues (2003) examined the association between nurse education levels and
the rate of mortality and failure to rescue in hospitals. Using data from acute care hospitals
in Pennsylvania, they found that hospitals with a higher proportion of baccalaureate degree
nurses had lower mortality and failure-to-rescue rates. Another study by Aiken and
colleagues (2011) explored the effect of nurse staffing, nurse education, and nurse work
environment on hospital mortality rates. The study further demonstrated this important
relationship by showing that even in hospitals with poor work environments, increases in the
percentage of nurses with a baccalaureate degree decreased patient mortality rates.
However, there is no evidence from past studies that nursing education is a significant
predictor of error reporting by nurses (Chlang, Lin, Hsu, & Ma, 2010; Hung, Chu, Lee, &
Hsiao , 2015; Throckmorton & Etchegaray, 2007; Vogus & Sutcliffe, 2007).
Notwithstanding previous findings, nurse education level is included in this study because it
is a common covariate in many studies of nursing and patient safety. One would anticipate
that as nurses’ educational levels increase, so too, does their knowledge of errors and the
importance of reporting errors. Furthermore, this variable also provides important
descriptive information of the study sample.
Nurse experience. There is evidence from past studies that the number of years an
individual has worked as a nurse influences patient safety outcomes. Studies of medication
errors suggest that as nurses gain nursing experience, the number and severity of errors
decreases (Fasolino & Snyder, 2012; Westbrook, Rob, Woods, & Parry, 2011). Another
study reported that nursing units with more experienced nurses had fewer medication errors
and patient falls (Blegen, Vaughn, & Goode, 2001). The relationship of nurse experience to

49
medication errors suggests that the number of years an individual has worked as a nurse may
be related to team learning behaviors (i.e., error reporting).
Researchers who have examined the relationship between nurses’ experience and
error reporting have reported mixed results. In a study of newly graduated nurses and
experienced nurses, Unver, Tastan, and Akbayrak (2012) found that there was no statistically
significant difference between newly graduated nurses’ and experienced nurses’ perceptions
of error reporting. However, there was a significant difference in understanding between
new and experienced nurses of what constitutes an error and what should be reported as an
error. More experienced nurses were better aware of what constituted an error and should be
reported. In contrast, another study found an inverse relationship between experience and
willingness to report so that nurses with less experience were more willing to report errors
and vice versa (Throckmorton & Etchegaray, 2007). The difference in these findings may be
explained by different measures of error reporting (i.e., perceptions of reporting, willingness
to report, or knowledge of what to report). Nonetheless past research suggests that nurse
experience is important in error reporting and should be considered when examining nurse
error reporting. Thus, this study included nurse experience as a covariate in the model.
Nurse tenure. Tenure, the length of time a nurse has worked on a particular nursing
unit, is important because there are skills and knowledge that are acquired over time that are
specific to a particular unit or team in which a nurse may work. Furthermore, the nature of
nursing work is highly interdependent and the relationships between workers can influence
communication and productivity practices. Therefore, nursing tenure is important, both from
depth of knowledge as well as strength of relationship, a concept that has been described as
human capital (Bartel, Beaulieu, Phibbs, & Stone, 2014). Specifically, a study investigating

50
the effects of human capital variables (i.e., nurse turnover and nurse education) on
productivity (measured as patient length of stay) found that human capital had a significant
influence on productivity (Bartel et al., 2014). Similarly, in studying error reporting, nurse
tenure may be an important variable to include because of the potential relationship between
nurses’ unit tenure and their perceptions of nurse manager inclusiveness, safety climate,
psychological safety, and error reporting. Nurses’ perceptions of these team factors may
change as they gain experience and exposure to the structural and interpersonal dynamics of
the team.
Among nursing characteristics typically included in studies of error reporting, nurse
tenure is not included as often as others (i.e., nurse education). However, three studies have
examined nurse tenure in relation to error reporting. Two studies found no significant
relationship with tenure and error reporting (Chlang et al., 2010; Vogus & Sutcliffe, 2007),
while another found that tenure was significantly associated with error reporting so that
greater tenure was associated with less fear in speaking up about errors (Castel, Ginsburg,
Zaheer, & Tamim, 2015). Based on these very limited but conflicting findings, further study
of nurse tenure and its relationship to error reporting is warranted.
Nursing unit characteristics. The nursing unit characteristics examined in this study
included nurse manager and unit specific characteristics that might help to explain error
reporting on nursing units. Much of the past research on error reporting has not been
conducted from a multilevel or unit perspective; thus, there are covariates included in this
study that were not included in past studies. However, a rationale is provided to explain why
these variables were included. The nursing unit characteristics included in this study were
nurse manager education, nurse manager tenure, unit size, and type of unit.

51
Nurse manager education. There is a growing recognition in some hospitals across
the U.S. that nurse managers should obtain advanced, graduate level degrees (e.g., Master of
Science in Nursing, Master of Healthcare Administration, etc.) to effectively manage and
lead in hospitals (Yoder-Wise, Scott, & Sullivan, 2013). However, there is a gap in the
literature that ties nursing, patient, or hospital outcomes to the educational level of nurse
managers (Thompson & Fairchild, 2013).
Because graduate level education often emphasizes system thinking, it is possible that
nurse managers with at least a master’s level education, when compared to an entry-level
degree in nursing, have a deeper understanding of safety issues on the units they manage. In
turn, error reporting may be emphasized to nurses who work on the unit as an essential
component of improving the quality and safety of care delivered to patients. Thus, nurse
manager education was included as a covariate in this study.
Nurse manager tenure. Nurse manager tenure, the amount of time the individual
nurse manager has been in his or her position was included as a covariate because the length
of time leading the unit is related to the depth and productivity of unit relationships. Also,
the extent to which nurse managers influence nurse error reporting may be in some way
associated with the amount of time they have been in the position. Almost all identified
studies of error reporting did not control for unit manager characteristics. While there is no
identified evidence from past studies for the inclusion of nurse manager tenure as a covariate,
the economic concept of human capital supports nurse manager tenure and the knowledge
and skills associated with tenure as a potentially important covariate to this of error reporting.
Unit size. There is known variability between nursing units in hospitals, so
researchers examining outcomes in nursing units often control for a number of unit-level

52
variables (Needleman et al., 2011). One such variable is unit size, which has been included
as a covariate in past studies conducted on nursing units (Bae, Kelly, Brewer, & Spencer,
2014; Shah, Mirea, Solimano, & Lee, 2015). One study examined how nurse-staffing
characteristics affected the patient outcomes of pressure ulcer rates and patient falls (Bae et
al., 2014). Researchers in the study indicated that unit size was one of the nursing unit
variables for which they controlled. However, there is no information in the article about the
significance of this control variable on the outcome measures. Shah and colleagues (2015)
examined the effect of unit size, resource allocation, and occupancy in neonatal intensive
care units in relationship to any associated morbidities of preterm infants cared for in the
respective study units. Findings from the study indicated that larger unit size was
significantly associated with an overall increase in morbidities for preterm infants. There is
some evidence that unit size has influenced unit outcomes in past studies.
In studies of error reporting, unit size has been investigated in a limited capacity.
Only one identified study included unit size as a covariate, and those researchers did not find
a significant relationship between unit size and error reporting (Vogus & Sutcliffe, 2007).
While there is limited past evidence to determine the effect of unit size on error reporting, it
is possible that larger units with more staff generate more errors and therefore more error
reports. In larger units with more staff, nurses may not feel as psychologically safe because
there is less opportunity for interactions with the manager or with colleagues, which
contributes to feelings of psychological safety. Because of these reasons, unit size was
included as a covariate in this study.
Type of unit. The type of nursing unit is an important covariate that is frequently
included in studies of nursing units within hospitals. For example, one study that examined

53
reported medication errors on nursing units found that emergency department units reported
fewer medication errors, and intensive care units reported more medication errors.
Interestingly, the number of medication errors reported by surgical units was not significant
(Vogus & Sutcliffe, 2007). Another study that examined contributing factors to medication
errors observed that medical units and intensive care units had the greatest percentage of
medication errors over surgical units, emergency units, pediatric units, and other units (Tang,
Sheu, Yu, Wei, & Chen, 2007). Thus, past evidence suggests that the type of unit is an
important covariate to include in the study because the number of errors reported can vary
depending on the type of nursing unit.
Summary of the Conceptual Model
The conceptual model for this study was derived from the model of work-team
learning and uses the constructs of team structures, team belief, and team behavior. An
illustration of how the study constructs were used to derive the concepts, variables, and
measures of this study is provided in Figure 3. In addition, Table 1 provides definitions for
the concepts and variables of the study.

54
Figure 3. Illustration of the derivation of underlying conceptual components of this study of
error reporting.

55
Table 1
Definitions of the Study Concepts and Variables Used in this Study of Error Reporting
Construct Concept: Definition Variable: Definition
TEAM
STRUCTURES
Context Support: The elements that support the
team to engage in learning behavior and also
promote trust among team members by dispelling
fear (Edmondson, 1996; Edmondson, 1999;
Edmondson, 2003).
Safety Climate: The shared perceptions and experience of
employees about the practices, policies, and procedures
related to the safety of patients (Katz-Navon et al., 2005;
Vogus et al., 2010)
Team Leadership: The behaviors whereby the
team leader conveys openness, accessibility, and
approachability to team members thereby
promoting trust within and between team members
(Edmondson, 1996, 1999, 2003).
Leader Inclusiveness: The behavior of leaders that
demonstrates availability, openness, and accessibility to
employees whereby they invite input and demonstrate an
appreciation for the contribution of employees (Hirak et al.,
2012; Nembhard & Edmondson, 2006).
TEAM
BELIEF
Team Safety: The beliefs among team members
of trust and mutual respect that empower them to
take interpersonal risks like reporting mistakes,
challenging the status quo, asking questions, and
seeking feedback (Edmondson, 1999, 2004).
Psychological Safety: The willingness of team members to
speak up about concerns without fear of negative
consequences (Edmondson, 1999, 2004).
TEAM
BEHAVIORS
Team Learning Behavior: Reflection and action
by team members that promote team learning
(Edmondson, 1999)
Error Reporting: The formal and primary way by which
healthcare professionals document and communicate to
unit managers and those at upper levels of healthcare
administration the errors and near misses that occur during
the provision of medical care to patients (Leape, 2002).

56
Chapter Summary
This chapter reviewed relevant literature on the independent variables of the study:
safety climate, leader inclusiveness, and psychological safety. From the literature review
there were two primary gaps identified. Leader inclusiveness has not been previously studied
in relationship to error reporting, and more importantly, the majority of research on error
reporting has not used a cohesive theoretical foundation to examine the factors related to
error reporting. This research study addresses both of these gaps by integrating leader
inclusiveness and by applying the model of work-team learning as the theoretical basis of the
conceptual model to investigate team factors that affect error reporting.
A synopsis of key studies conducted by Amy Edmondson (1996, 1999, 2003) was
then presented to facilitate the discussion of the model of work-team learning. The
conceptual model of the study was discussed along with theoretical and research support for
the relationships examined by the research questions of the study. This chapter concluded
with a discussion of the covariates and a rationale for their inclusion in the study. Building
on this review of literature and discussion of the conceptual model for the study, Chapter 3
presents an outline of the study methods and procedures that were used to examine the team
factors related to error reporting.

57
CHAPTER 3
METHODOLOGY
The purpose of this study was to determine the effect of context support, team
leadership behavior, and safety belief on team learning behavior. The theoretical foundation
for this study was the model of work-team learning (Edmondson, 1999), which then was used
to derive the conceptual model for examining error reporting by nurses. The study
accomplishes its purpose by examining the effects of nurses’ perceptions of safety climate,
leader inclusiveness, and psychological safety on error reporting. The research questions of
the study were answered by using methods for modeling correlated outcomes. Continuous
outcomes were examined using linear mixed models with random effects, while count
outcomes were examined using Poisson regression models and generalized estimating
equations. This chapter presents research and methodological issues germane to the conduct
of this study.
Study Design
This study used a cross-sectional, descriptive design to address the research
questions. Data were collected from nurses and nurse managers through a self-administered
survey available in paper or electronic format, depending on respondents’ preferences. The
following research questions were addressed in this study:
1. How do safety climate and leader inclusiveness affect error reporting (RQ1)?

58
2. How do safety climate and leader inclusiveness affect psychological safety
(RQ2)?
3. How does psychological safety affect error reporting (RQ3)?
4. Do safety climate and leader inclusiveness indirectly affect error reporting
through psychological safety (RQ4)?
Setting and Sample
The setting for this study was a large academic medical center in the southeastern
U.S. with 805 licensed beds (American Hospital Association, 2013). The sample was a
convenience sample of nurses and nurse managers who were employed by the hospital.
Nurses included in the study were Registered Nurses (RNs; i.e., per diem, part-time, or
fulltime) who spent the majority of their time providing direct care to patients. The nurse
sample was recruited from 50 patient care units, including 38 inpatient areas as well as short-
term or outpatient areas, including the operating room, emergency room, dialysis, procedural,
and rehabilitation units. Nurse managers are the formal organizational administrators of
nursing units providing inpatient care, as well as short-term or outpatient areas, including the
operating room, emergency room, dialysis, procedural, and rehabilitation units.
Power Analysis
Power analyses were conducted using the approach of Hauck, Gilliss, Donner, and
Gortner (1991) and were based on the effective sample size, that is, the equivalent number of
independent observations. Prior to data collection, it was estimated that 49 nursing units
would provide an average of 16 nurse responses per unit. For a small intra-unit correlation
of .05, the effective sample size would be 448; for a large correlation of .125, the effective
sample size would be 273. This latter, conservative effective sample size would be sufficient

59
to identify a very small R2 of 2.8% for a bivariate regression analysis at 5% significance with
80% power and 3.9% for a multiple regression based on three predictors (Cohen, 1992).
While nurses in 53 units responded to the survey, there were only usable data for nurses from
49 units. Actual sample sizes ranged from 736 to 814 due to missing data. Using the
conservative value of 736, or about 15 nurses per unit, and the largest observed intra-unit
correlation of .13, the effective sample size is 261. This provides 80% power at 5%
significance for identifying a small effect size of 2.9% for a bivariate regression analysis and
4.0% for a multiple regression based on three predictors. With an intra-unit correlation
of .05, the effective sample size increases to 448. Consequently, the study is very well
powered for conducting the regression analyses for the first three steps of the Baron and
Kenny (1986) approach to mediation analysis, possibly even allowing for an extra covariate.
For the fourth step of the mediation analysis, the simulation results of Fritz and MacKinnon
(2007) indicate that a sample size of n = 396 was needed for 80% power and 5% significance
based on the slopes of the data for steps 2 and 3 of the mediation analysis using the bias-
corrected bootstrap. Thus, tests for indirect effects may be underpowered for analyses
involving larger intra-unit correlation but well powered for smaller ones.
Instrumentation
Variables and Their Measurement
The dependent variable in this study was error reporting, while the independent
variables were safety climate, leader inclusiveness, and psychological safety. The covariates
examined in this study were nursing characteristics and nursing unit characteristics. The
nursing characteristics identified in the literature as being relevant to this study were: nurse
education (Aiken et al., 2011, 2003), nurse experience (Throckmorton & Etchegaray, 2007),

60
and nurse tenure (Castel et al., 2015). The nursing unit characteristics also derived from the
literature and relevant to this study included the following: nurse manager education, nurse
manager tenure, unit size (Shah et al., 2015), and type of nursing unit (Tang et al., 2007;
Vogus & Sutcliffe, 2007).
The quality of instruments used in a research study is essential to the accuracy of the
data collected and the research study itself (DeVellis, 2003). When discussing instruments,
there are two important and interrelated concepts: validity and reliability. Validity is
concerned with the extent to which items in a scale accurately measure and reflect the
underlying concept responsible for item co-variation (DeVellis, 2003; Vogt & Johnson,
2011). Reliability refers to the internal consistency or performance of the scale (Tavakol &
Dennick, 2011). The reliability of the instruments used in this study was tested using
Cronbach’s alpha to determine the internal consistency of each instrument.
The section that follows provides a more detailed discussion of the study variables,
their operational definition, and how they were measured.
Error Reporting
Error reporting was defined as nurses’ perceptions of and engagement in error
reporting on their nursing unit. Error reporting was measured in two ways. First, the
frequency of error reporting on nursing units was measured with the 3-item subscale, the
Frequency of Event Reporting Scale, from the Hospital Survey on Patient Safety Culture
(HSPSC; Agency for Healthcare Research and Quality [AHRQ], n.d.). The HSPSC is a 46-
item instrument with 12 subscales that was developed to measure patient safety culture in
hospitals (Sorra & Dyer, 2010). Respondents provided answers to scale items via multiple
choice responses with options specific to the item. Validity for the HSPSC was addressed by

61
its developers, who generated the items of the scale by conducting literature reviews and
interviewing staff in hospitals (Pinkerton, 2005). The survey was then tested, piloted, and
amended before it was widely administered in hospitals (Pinkerton, 2005). Through this
process, the researchers developed a valid tool for measuring patient safety culture in
hospitals. The psychometric properties of the scale have been evaluated by past researchers
who found evidence that overall, the dimensions of the scale and the items are
psychometrically sound (Blegen, Gearhart, O’Brien, Sehgal, & Alldredge, 2009; Sorra &
Dyer, 2010). The subscale composites had reliability scores, assessed with Cronbach’s
alpha, that ranged from .62 to .85 (Sorra & Dyer, 2010). Other than one subscale dimension,
the staffing composite, the overall Cronbach’s alpha for each of the subscales was greater
than or equal to .70, indicating good reliability (Sorra & Dyer, 2010).
The Frequency of Event Reporting Scale used in this study was originally developed
as one of 12 subscales that comprise the HSPSC. This subscale of the HSPSC has three
items that are scored with a 5-point unbalanced scale where 1 = never and 5 = always. The
Frequency of Event Reporting Scale has been used as a standalone measure in two other
identified studies of error reporting in hospitals (Hillen, Pfaff, & Hammer, 2015; Richter et
al., 2014). The study by Hillen et al. (2015) examined how the transformational leadership
of hospital directors in Germany influenced the frequency of event reporting by staff. The
authors used the Frequency of Evens Reporting Scale and reported a Cronbach’s α = .86.
Another study (Richter et al., 2014) examined the effect of safety culture on error reporting
and how those perceptions differed between managers and staff in hospitals across the U.S.,
and also used the Frequency of Event Reporting Scale; however, they did not report the
psychometric properties for the scale in their study. Past studies that have examined the

62
HSPSC have used factor analysis and inter-item correlations to assess the validity and
reliability of the scale. Those studies found that the Frequency of Event Reporting Scale had
a one-factor solution with inter-item reliabilty ranging from .69 to .85 and an overall
Cronbach’s α = .85 (Blegen et al., 2009; Sorra & Dyer, 2010).
For use in this study, slight changes were made to the original items of the Frequency
of Event Reporting Scale to improve clarity. These changes were made in consultation with
experts in the fields of survey design, psychometrics, and organizational study who also
reviewed the items for face validity. The original item wording and the changes to the items
used in this study can be viewed in Appendix 1. Each item of the 3-item scale was scored on
a 5-point unbalanced scale, with a score of 5 corresponding to greater frequency of error
reporting on the unit. In this study, factor analysis confirmed a one-factor solution and the
inter-item correlations for the Frequency of Event Reporting Scale ranged from .62 to .74.
The reliability of the scale, using Cronbach’s alpha, was .81.
The second measure of error reporting, the number of errors, was measured through a
self-reported numerical estimate reported by individual nurse respondents in the 12 months
prior to the survey administration. This numerical estimate of error reports submitted
through the error reporting system was chosen as a second measure of error reporting
because it assesses one aspect of error reporting that is distinct from nurses’ perceptions
about unit error reporting and it gets closer to the actual number of reports that nurses
submitted. This measurement is also consistent with other studies that have examined actual
error reports as a measure of error reporting (Milch et al., 2006; Naveh et al., 2006; Vogus &
Sutcliffe, 2007). While the number of reports actually submitted through the error reporting
system for each respondent would have been preferable to a self-report of errors reported, it

63
was impossible to obtain these data from the study hospital and its risk management
department. Thus, the self-report measure of error reports was used instead, as it was
believed to be the closest measure of the actual number of error reports submitted by nurses.
A similar item is used in the AHRQ HSOPSC (n.d.), but provides numeric categories for
participants from which to choose. In this survey, respondents were asked to “Estimate the
number of error reports you have completed in the last 12 months.” This allowed for a count
rather than categorical variable for the response, which provided greater flexibility in data
analysis.
Safety Climate
Safety Climate is the shared perceptions and experiences of employees about the
practices, policies, and procedures related to the safety of patients (Katz-Navon et al., 2005;
Vogus et al., 2010). The Safety Climate Survey used in this study is a 21-item scale designed
to measure individual perceptions of the unit level safety climate (Thomas, Sexton, Neilands,
Frankel, & Helmreich, 2005). Scale items were scored with a 5-point Likert scale, with 1
corresponding to poor safety climate and 5 corresponding to a very positive or very strong
safety climate.
The survey has previously been used in over 251 clinical units in 52 hospitals
(Thomas et al., 2005) and is recognized and endorsed by the Institute for Healthcare
Improvement, an organization dedicated to the improvement of healthcare (Kho, Carbone,
Lucas, & Cook, 2005). The authors of the Safety Climate Survey indicated that the survey
was developed based on similar surveys from the aviation industry (Thomas et al., 2005).
The authors of the scale conducted focus groups with healthcare workers, consulted with
subject matter experts, and conducted field testing to address the validity of the measure

64
(Thomas et al., 2005). However, they neither reported any results from a factor analysis of
the safety climate survey, nor did they provide details on the reliability of the survey. Other
researchers, who did a study comparing different measures of the safety climate, reported
that the reliability of the Safety Climate Survey in their study, using Cronbach’s alpha,
was .86 (Kho et al., 2005). No other psychometric properties of the scale were identified
from the published literature.
Prior to survey administration, psychometric and subject matter experts reviewed the
items of the scale for face validity. In consultation with these experts, some of the items in
the scale were altered for clarity or changed from a single item into two separate items. For
example, one of the items read, “The physician and nurse leaders in my areas listen to me
and care about my concerns.” Because this question referred to both physicians and nurse
leaders it was modified to be two separate items that read “The physician leaders on my unit
listen to me and care about my concerns” and “The nurse leaders on my unit listen to me and
care about my concerns.” The original scale items and the changes to the items made for this
survey of error reporting are found in Appendix 2.
Prior to data analysis, Item 21 from the Safety Climate Survey, “The staff on my unit
frequently disregards established rules or guidelines” was reverse-coded. In a search of
published literature on the Safety Climate Survey, no studies were found that reported an
analysis of the survey dimensions through factor analysis (Colla, Bracken, Kinney, & Weeks,
2005). Thus, after data collection, an exploratory factor analysis of the scale items was
conducted using principal axis factoring with Oblimin rotation. Examination of the Scree
plot suggested that this scale had four factors. The 2-, 3-, and 4-factor solutions were
reviewed. The 3-item solution was immediately eliminated because the majority of the scale

65
items (17 items) loaded on the first factor. Only two items loaded on the second factor and
two items on the third factor. The 2-factor and 4-factor solutions were then examined to
determine which was the best factor solution. The 2-factor solution was chosen because it
provided two conceptually distinct factors without a great deal of overlap. Further, the 2-
factor solution demonstrated good reliability of at least α = .70 in both factors. After
choosing the 2-factor solution, two items from Factor 1 were eliminated from the scale
because they did not meet the criteria for item retention, a factor loading of at least 0.40
(Netemeyer, Bearden, & Sharma, 2003). The items that were eliminated from the original
scale are noted in Appendix 3.
Factor 1 contained 15 items examining the support of unit leaders for safety, the
degree to which errors were handled appropriately on the unit, the culture for learning from
mistakes on the unit, and the degree to which respondents would feel safe being treated as a
patient on the unit. These items all addressed elements of the safety climate that were
specific to the environment of the nursing unit and were therefore titled Safety Climate—Unit
Environment. This dimension of the safety climate survey was scored individually on a 5-
point Likert scale, with 5 corresponding to a very positive safety climate-unit environment.
Reliability of this dimension of the safety climate survey was assessed using Cronbach’s
alpha, which was .93, and the inter-item correlations ranged from .25 to .77. See Appendix 3
for the items included in the Safety Climate—Unit Environment.
Factor 2 had five items. These items assessed safety briefings on the unit that were
generally attended by interdisciplinary team members and assessed the level of support
provided by physician and pharmacy interdisciplinary staff. Because these items addressed
the availability, interaction, and support of interdisciplinary staff on the unit, Factor 2 was

66
labeled Safety Climate—Interprofessional Relationships. Each item of the scale was scored
on a 5-point Likert scale with 1 indicating poor interprofessional relationships on the unit and
5 indicating very positive interprofessional relationships on the unit. Cronbach’s alpha
was .77. The inter-item correlations ranged from .27 to .73. See Appendix 3 for the items
included in the Safety Climate Survey—Interprofessional Relationships.
Leader Inclusiveness
Leader inclusiveness is defined as nurses’ perceptions of the degree to which the
words and actions of the unit nurse manager communicate an invitation of and appreciation
for the contribution of the individual nurse (Nembhard & Edmondson, 2006). Leader
inclusiveness was measured with the Inclusive Leadership Scale, a 9-item scale that was
developed to measure individual worker perceptions of manager inclusiveness (Carmeli et
al., 2010). Scale items were scored on a 5-point Likert scale, with 1 corresponding to low
degrees of leader inclusiveness and 5 corresponding to high degrees of leader inclusiveness
for the nurse manager of the unit.
Because the study was designed to assess team factors in nursing units, small changes
were made to the original scale items to reflect the unit level of study. For example, the first
item of the scale originally read, “The manager is open to hearing new ideas.” This item was
changed to read, “The manager on my unit is open to hearing new ideas.” The original scale
and the changes made to the items for this study are found in Appendix 4.
In creating the scale, the authors addressed the validity of the scale by first creating
items that accurately reflected the three dimensions of leader inclusiveness: openness,
availability, and accessibility (Carmeli et al., 2010). Next, they had 15 graduate students and
10 employees at the study site review the items in the scale and indicate the extent to which

67
each item reflected the construct it was designed to reflect. Any items that did not reflect the
underlying construct or reflected more than one construct were removed from the scale. This
process resulted in a 9-item scale with a one-factor solution.
To date, there are two identified published studies that have used the Inclusive
Leadership Scale. Carmeli and colleagues (2010) developed the Inclusive Leadership Scale
for a study of team engagement in creative tasks on the research and development units of
eight high-tech firms. Cronbach’s α for the scale in that study was .94. Hirak and others
(2012) also used the Inclusive Leadership Scale to examine work team performance in 67
nursing units of a hospital (Hirak et al., 2012). They reported a Cronbach’s α = .93 for the
Inclusive Leadership scale.
The factor analysis conducted in this study affirmed a one-factor solution for this
scale. The inter-item correlations ranged from .68 to .91. The high inter-item correlation
suggests that the items in the scale are redundant, highlighting a weakness of this scale
(Netemeyer et al., 2003). Internal consistency of the scale, using Cronbach’s alpha, was .98.
Psychological Safety
Psychological Safety is the degree to which a nurse feels safe to speak up about issues
or needs in the unit (Nembhard & Edmondson, 2006). The original psychological safety
scale, developed by Edmondson (1999), included seven items, which were scored on a 7-
point scale with 1 = “very inaccurate” to 7 = “very accurate.” There are examples
throughout the literature of researchers who have adapted the original 7-item scale to include
four items (Nembhard & Edmondson, 2006), five items (Carmeli, Brueller, & Dutton, 2009;
Carmeli et al., 2010), and six items (Baer & Frese, 2003; Kark & Carmeli, 2009; Lau &
Murnighan, 2005). In previous published studies, the coefficient alpha for the psychological

68
safety measure has ranged from 0.67 to 0.82 (Baer & Frese, 2003; Carmeli et al., 2009;
Edmondson, 1999; Kark & Carmeli, 2009; Lau & Murnighan, 2005; Leroy et al., 2012;
Nembhard & Edmondson, 2006; Ortega et al., 2013). Specifically, α = .74 for the Carmeli et
al. (2010) study, which used the same five items from the original 7-item scale used in this
study.
In her development of the psychological safety scale, Edmondson (1999) addressed
the validity of the scale by indicating that it was derived from theoretical constructs. Further,
she used qualitative interviews to create the scale and then tested the scale through
psychometric analysis. She indicated that discriminant validity was primarily addressed
through factor analysis, which yielded a one-factor solution for psychological safety, thus
supporting the validity of the scale to measure the concept of psychological safety. In the
published study that described and tested the psychological safety scale, study results showed
inter-item correlations that ranged from .28 to .48, with a Cronbach’s α = .82.
Consistent with other studies (Carmeli et al., 2010), this study used five items from
the original 7-item psychological safety scale (Edmondson, 1999). Prior to survey
administration, some items were changed for clarity. For example, item 5 in the scale
originally read, “No one on this team would deliberately act in a way that undermines my
efforts.” It was changed to read, “No one I work with would deliberately act in a way that
undermines my efforts.” The individual items of the scale were scored with a 5-item Likert
scale with 1 corresponding to low degrees of psychological safety and 5 corresponding to
high degrees of psychological safety.
Prior to data analysis in this study, Item 2 from the Psychological Safety scale,
“People on my unit sometimes reject or ignore others for being different” was reverse coded.

69
Each item of the scale was scored on a 5-point Likert scale, with a score of 1 corresponding
to low levels of psychological safety and a score of 5 corresponding to high levels of
psychological safety. A factor analysis was performed, which confirmed a single factor
scale. The mean inter-item correlation for the scale was poor at .30 and the inter-item
correlations ranged from .06-.49. The Cronbach’s alpha for the 5-item scale was .66. In
particular, there was one item with poor inter-item correlation, and at least 2 study
participants even commented in an open-ended section at the end of the survey that the item
was confusing. The item read, “It is safe to take a risk on my unit.” As a result, this item
was dropped from the scale. The resulting Cronbach’s alpha improved to .70, and the inter-
item correlations ranged from .29 to .49 with a mean inter-item correlation of .39. See
Appendix 5 for the original items from the Psychological Safety Scale and the items that
were used in this study of error reporting.
Covariates
Nursing characteristics. Nursing characteristics are often included in studies of
patient safety and outcomes as researchers try to determine characteristics of nurses that may
significantly affect patient outcomes. A rationale was provided in Chapter 2 to explain why
these nursing characteristics—nurse experience, nurse tenure, and nurse education—were
included as covariates.
Nurse education. In this study, nurse education was defined as the highest level of
nursing education possessed by nurses. This variable was measured as a categorical variable,
and respondents were first asked to select their highest degree in nursing from the following
choices: Diploma, associate degree in nursing (ADN), bachelor of science in nursing (BSN),
master of science in nursing (MSN), or doctorate in nursing. Second, respondents were

70
asked to indicate their highest non-nursing degree from the following choices: no degree
outside of nursing, diploma, associate degree, bachelor degree, master of business
administration, master of health administration, master of public health, other master’s
degree, doctorate, or other. Nurses’ responses were then assigned codes so that 1 = Diploma
degree in nursing, 2 = ADN, 3 = BSN, and 4 = MSN or higher.
Nurse experience. Nurse experience was operationally defined as the length of time
in years that an individual had practiced as a nurse. This variable was determined by asking
nurses for the year of their original licensure to practice as a registered nurse and subtracting
that date from the study year.
Nurse tenure. Nurse tenure was operationally defined as the length of time in years
that an individual had been employed on the nursing unit where they currently worked. This
variable was measured by asking respondents to provide the year they first began working on
their current nursing unit and subtracting that date from the study year.
Nursing unit characteristics. The nursing unit characteristics examined in this study
included nurse manager and unit specific characteristics that might help to explain error
reporting on nursing units. A rationale was provided in Chapter 2 to explain why these
covariates were included. The nursing unit characteristics included in this study were: nurse
manager tenure, nurse manager education, unit size, and type of unit.
Nurse manager education. Nurse manager education was operationally defined as a
nurse manager’s highest level of education. This variable was measured in two different
questions as a categorical variable. First, respondents were asked to select their highest
degree in nursing from the following choices: Diploma, ADN, BSN, MSN, or Doctorate in
Nursing. Second, respondents were asked to select their highest degree outside of nursing

71
from the following choices: No degree outside of nursing, diploma, associate degree,
bachelor degree, master of business administration (MBA), master of health administration
(MHA), master of public health (MPH), other master’s degrees, or doctorate. Because all
nurse managers had at least a BSN, and many had a master’s degree outside of nursing, the
data from these two questions was combined into the nurse manager education variable. The
following dummy codes were assigned for data analysis: 1 = BSN and 2 = Master’s degree or
higher.
Nurse manager tenure. Nurse manager tenure was operationally defined as the
length of time the nurse manager had served in his or her current position on the nursing unit.
This variable was measured as the year a nurse manager started working in the role of
manager on the unit. Nurse manager tenure was determined by taking the difference between
this date and the study year.
Unit size. Unit size was operationally defined as the number of RN employees on the
nursing unit. This variable was measured in two ways. First, as the number of RN
employees (i.e., head count) on the unit, as reported by the nurse manager, and secondly, as
the number of FTE RN employees on the unit, as reported by the nurse manager.
Type of nursing unit. The type of nursing unit was operationally defined as
Medical/Surgical, Intensive Care Unit (ICU), Specialty, and Other. Each of the 49 patient
care units represented in this study were assigned to these four catagories. After this initial
assignment to type of unit, an expert in quality and safety who also works at the study
hospital reviewed the assignment of units to catagories and made changes. Finally, an expert
in organizaitonal research also reviewed the categories and unit assignments for agreement.
The units were then coded so that each unit in the study was designated as a

72
Medical/Surgical (1 = yes; 0 = no), ICU (1 = yes; 0 = no), Specialty (1 = yes; 0 = no), or
Other (1 = yes; 0 = no) type of unit.
Study Survey
The survey questionnaire for the study was comprised of four different instruments
that measured the key study variables of error reporting, safety climate, leader inclusiveness,
and psychological safety. The overall survey included a total of 46 items. Table 2 provides
details on the study variables and covariates, and how they were collected.
Table 2
Study Variables, Level of the Variable, Type of Variable, and Source of the Variable
Variable
Individual
Unit
Categorical
Continuous
Nurse
Survey
NM
Survey
Error Reporting X X X
Safety Climate X X X
Leader
Inclusiveness X X X
Psychological
Safety X X X
Nurse Education X X X
Nurse
Experience X X X
Nurse Tenure X X X
Nurse Manager
Education X X X
Nurse Manager
Tenure X X X
Unit Size X X X
Unit Type X X X X X
Note. NM Survey: Nurse Manager Survey.

73
Prior to survey administration, a panel of six experts reviewed the survey for clarity
and in some cases made recommendations for wording changes to items in the survey. As a
whole, the experts represented a knowledgeable panel with extensive experience in survey
development and administration, psychometric analysis, quality and patient safety, and error
reporting. In particular, one reviewer is a survey expert who teaches instrumentation and
measurement and consults nationally and internationally as an expert on survey construction
and instrumentation. Another reviewer consults throughout the university community and
beyond on survey construction and administration. Two reviewers are experts from practice
and are highly engaged in patient safety and quality as well as the measure of quality and
safety in the hospital setting. Another reviewer is a statistician, and the final reviewer is an
expert in the field of organizational study and the nursing workforce.
Human Subjects Protection
Approval to conduct this study was obtained from the Institutional Review Board
(IRB) at the University of North Carolina at Chapel Hill as well as the nursing research
council at the study site before beginning data collection. Consent to participate in the study
was attached to both the online and paper surveys distributed to RNs (Appendix 6) and nurse
managers (Appendix 7). Study participants indicated their consent to participate by choosing
to advance to and submit the survey questions in the online survey or by completing and
returning the paper survey. The study consent notified the study participants, both individual
RN participants and nurse manager participants, that data collected were confidential.
Further, the identities of the study hospital and nursing units were kept confidential. While
nursing units were collapsed and labeled as broad specialty categories to be used for data
analysis, they were not named.

74
Procedures
After receiving approval to conduct the study from the University of North Carolina
at Chapel Hill IRB and the study site research council, the recruitment of participants and
data collection began. A number of targeted approaches were used to maximize the response
rate. These included the use of a study site coordinator, specific recruitment activities, and a
survey implementation plan. These procedures are discussed in greater detail below.
Study Site Coordinator
A study site coordinator was identified in the study site hospital to facilitate sample
recruitment and data collection. This individual was well connected in the study site, served
as the chair of the organization’s research council, and was a highly respected clinical
nursing leader. The study site coordinator played an important role in recruitment and data
collection by advising the researcher on the best ways to communicate with the
organization’s research council, staff hospital directors, nurse managers, and staff nurses in
the hospital. This individual helped to troubleshoot any problems that arose, facilitated study
communications by distributing recruitment fliers and paper surveys, and sent out all
electronic communications to staff nurses and nurse managers.
Recruitment Activities
Study recruitment activities began on April 7, 2015, when the study investigator
attended the Nurse Manager Forum Meeting, a monthly meeting of all nurse managers at the
study site. At this meeting, the purpose of the study was explained by the study investigator
to the nurse managers, who were provided time to ask questions about the study. The nurse
managers were asked to make staff aware of the study and to encourage staff nurse
participation. Nurse managers were also given a study packet for their individual unit, which

75
contained flyers to be posted on the nursing unit and in the staff break room. Paper surveys
with stamped return envelopes addressed to the researcher were also provided for any staff
nurses who preferred to complete a paper versus online survey. During this meeting, the
nurse managers asked to be informed about their unit’s response rates at regular intervals so
that they could send out weekly email updates to staff members on all units. Thus, emails
were sent to nurse managers during the recruitment period so they could communicate about
the study with their staff and remind them of the opportunity to participate in the study. In
addition to asking nurse managers to encourage staff nurses’ participation in the study, the
nurse managers themselves were also asked to participate in the study by completing the
nurse manager survey.
Data Collection
There is anecdotal and research evidence suggesting that different groups of nurses
show preference for different modes of electronic versus paper survey administration
(VanGeest & Johnson, 2011). To account for this preference, both the staff nurse and nurse
manager surveys were made available to prospective participants in paper and electronic
format. Data collection for both paper and electronic surveys began on April 7, 2015 and
ended on June 12, 2015.
Nurses who chose to complete the paper surveys were instructed to return their
surveys via the United States Postal Service directly to the researcher. Nurse managers who
chose to complete a paper survey were also instructed to return their surveys directly to the
researcher or to the study site coordinator, who then forwarded the surveys to the researcher.
Electronic surveys for both the nurse and nurse manager surveys were developed to
follow the flow of the paper surveys (including all skips and other patterns), and formatted

76
using Qualtrics, an online survey tool. Electronic responses for both nurses and nurse
managers who completed their respective online surveys were captured via separate Qualtrics
databases.
Survey Implementation
Nurse surveys. The paper surveys for the nurses at the study site were distributed
through the nurse managers, who were asked to place the paper surveys along with attached
stamped, addressed envelopes in the break room of the nursing unit. The researcher neither
had face-to-face interaction with potential respondents, nor addresses with which to contact
the respondents, either to distribute the paper surveys or to send paper reminders about the
survey. As a result, the implementation of the paper survey was done in conjunction with the
electronic version of the survey so that all reminders were sent through email to notify
participants of the opportunity to participate in the study by either paper or electronic means.
This methodology was chosen because the study site hospital routinely used email to
communicate with all of their employees. Thus, every employee had access to a personal
email account, and there were computers on all patient care units that allowed them to access
their email. Further, the hospital predominantly used electronic means to communicate with
the staff so that using only electronic communications for survey implementation was not
perceived as problematic. Further details on the implementation of the nurse survey are
provided in Table 3.
The original intent of the study investigator was to use a four-contact method of
survey implementation so that as nurse managers posted fliers and paper surveys on the units,
potential participants would also receive the first recruitment email (Dillman, Smyth, &
Christian, 2009). However, unanticipated challenges in obtaining email addresses from the

77
hospital’s Human Resources (HR) department for all nurses at the study site delayed the
distribution of initial contact emails to nurses. There was a delay of almost two weeks from
the distribution of the study fliers and paper surveys to receipt of the email of the initial
contact emails. Ultimately, the study site coordinator was able to work with the HR
department to obtain the email addresses for the staff nurses employed on study units of
interest. There were also further difficulties in obtaining the email addresses, specifically for
nurses working in the operating room (OR), delaying initial contact by an additional 1 to 1.5
weeks. These delays are reflected in the timeline shown in Table 3.
Table 3
Details on the Implementation of the Nurse Survey
Contact Date Survey Implementation
April 7, 2015
Contact 1:a Paper versions of the nurse survey were given to NMs, who
were asked to distribute them to nurses employed on the unit by making
the survey packets available in their unit’s break room.
April 21, 2015b
Contact 2: Initial recruitment email was sent to nurses at the study site,
by the study site coordinator. The recruitment email included
information on study participation and an electronic link to the survey,
as well as information on the availability of paper surveys on the unit.
April 28, 2015c
Contact 3: First reminder email was sent to nurses at the study site by
the study site coordinator and included information on study
participation and an electronic link to the survey.
May 5, 2015d
Contact 4: Second reminder email was sent to nurses at the study site
by the study site coordinator and included information on study
participation and an electronic link to the survey.
May 13, 2015e
Contact 5: Third and final reminder email was sent to nurses at the
study site by the study site coordinator and included information on
study participation and an electronic link to the survey.
Note. a Ideally, Contact 1 and 2 should have occurred simultaneously rather than at separate times, but
unanticipated events resulted in separate contacts; b April 29, 2015, was Contact 2 for nurses working in the OR; c May 5, 2015, was Contact 3 for nurses working in the OR; d May 13, 2015, was Contact 4 for nurses working
in OR; e May 20, 2015, was Contact 5 for nurses working in the OR.

78
Nurse manager surveys. Paper surveys were distributed to nurse managers present at
Nurse Manager Forum meetings in April and May 2015. The study investigator sent an
electronic invitation to participate in the nurse manager survey to any nurse managers who
did not submit a paper survey at the Nurse Manager Forum meeting in April 2015.
Additional information on the timing of the nurse manager survey is provided in Table 4.
Table 4
Details for the Implementation of the Nurse Manager Survey
Contact Date Paper Survey Electronic Survey
April 7, 2015
Contact 1: Paper surveys were
distributed at the nurse manager
(NM) forum meeting, and
completed surveys were collected.
April 10, 2015
Contact 1: Initial recruitment
email was sent to NMs by the
study investigator and included
information on study participation
and an electronic link to the
survey.
April 20, 2015
Contact 2: First reminder email
sent to NMs by the study
investigator reminding them of
the study and included an
electronic link to the survey.
April 27, 2015
Contact 3: Second reminder
email sent to NMs by the study
investigator reminding them of
the study and included an
electronic link to the survey.
May 4, 2015
Contact 4: Third and final
reminder email sent to NMs by
the study investigator reminding
them of the study and included an
electronic link to the survey.

79
Table 4
Cont.
Contact Date Paper Survey Electronic Survey
May 5, 2015
Contact 2: Paper surveys were
distributed at the NM forum
meeting by the study site
coordinator, and completed surveys
were collected and returned to the
researcher.
Note. NM: Nurse Manager.
Data Management and Analysis
Qualtrics, an online survey tool, was used for electronic survey data collection.
Nurses and nurse managers who followed the electronic link provided to them via email
completed the electronic survey. Paper surveys from both nurse managers and nurses were
entered into Qualtrics by the researcher and then responses were double-checked against the
paper version of the survey. After the paper surveys were entered into Qualtrics and double-
checked, they were destroyed by shredding.
At the end of the data collection period, data were first downloaded into Excel
spreadsheets and then imported into a SAS® dataset. Data from both the nurse and nurse
manager surveys were cleaned, recoded as needed, and then merged into a single data file for
analysis. The data analysis for this study was conducted using SAS® software, Version 9.4
(TS1M1) of the SAS System for Windows 8 [Copyright © 2002-2012 SAS Institute Inc.
SAS and all other SAS Institute Inc. product or service names are registered trademarks or
trademarks of SAS Institute Inc., Cary, NC, USA].
Descriptive statistics and correlations were conducted. The outcome variable for the
study, error reporting, was defined and measured in two ways that necessitated the use of

80
different methods of analysis to answer the research questions. The first measure of error
reporting was nurses’ perceptions of error-reporting frequency on the unit, measured with
the frequency of event reporting scale that yielded a mean score. The second measure of
error reporting was nurses’ reporting of errors on the unit, measured as nurses’ estimates of
the number of error reports submitted over the last 12 months. A discussion of how the data
were analyzed is organized by the research questions of the study and these two different
measurements of the outcome variable, error reporting.
How Do Safety Climate and Leader Inclusiveness Affect Error Reporting?
Research question 1 was first answered by using linear mixed models with random
effects. Linear mixed modeling with random effects was chosen over ordinary least squares
(OLS) linear regression because an underlying assumption of OLS regression is that
observations are statistically independent, or mutually exclusive (Cohen, Cohen, West, &
Aiken, 2003). However, because individual nurses work on nursing units in hospitals, and
the data collected from nurses is clustered or correlated due to this organizational structure,
an assumption of independence cannot be made (Liang & Zeger, 1993). Therefore, to
account for any intra-unit correlation, linear mixed models with random effects representing
the intra-unit correlation were used to analyze the data for this question.
After analyses for RQ1 were completed for nurses’ perceptions of error reporting on
their unit, an analysis of the covariates was conducted, again using linear mixed methods.
Any covariates that significantly predicted nurses’ perceptions of error reporting on their unit
were then included in the linear mixed models to answer RQ1 with the addition of significant
covariates.

81
Next, Poisson regression models with generalized estimating equations (GEE) were
used to regress the number of error reports submitted by nurses in the last 12 months on
safety climate-unit environment, safety climate-interprofessional relationships, and leader
inclusiveness. Poisson regression was chosen for these analyses because the estimate of error
reports submitted in the last 12 months was a count variable (Cohen et al., 2003), and GEE
was used to address the correlated nature of the data (Der & Everitt, 2006).
After analyses for RQ1 were completed for the number of error reports submitted by
nurses in the last 12 months, an analysis of the covariates was conducted using Poisson
regression with GEE. Any covariates that significantly predicted this measure of error
reporting were then included in the Poisson regression models to answer RQ1 with the
addition of significant covariates.
How Do Safety Climate and Leader Inclusiveness Affect Psychological Safety?
Research question 2 was answered by using linear mixed models to regress the mean
score for psychological safety on safety climate-unit environment, safety climate-
interprofessional relationships, and leader inclusiveness. Next, an analysis of covariates was
performed to determine if any covariates significantly predicted psychological safety. Since
none of the study covariates significantly predicted psychological safety, no further analyses
were conducted to address RQ2.
How Does Psychological Safety Affect Error Reporting?
Research question 3 was first answered using linear mixed models to regress the
mean score for nurses’ perceptions of frequency of error reporting on psychological safety.
Next, any significant covariates were added to the models. Research question 3 was then
answered a second time with Poisson regression models with GEE to regress the number of

82
error reports submitted by nurses in the last 12 months on psychological safety. Afterward,
any significant covariates were added to the Poisson regression models with GEE.
Do Safety Climate and Leader Inclusiveness Indirectly Affect Error Reporting Through
Psychological Safety?
Research question 4 addressed the mediating effect of psychological safety on the
relationship between safety climate-unit environment and error reporting; safety climate-
interprofessional relationships and error reporting; and leader inclusiveness and error
reporting. For both measures of error reporting, nurses’ perceptions of error reporting on the
unit, and the number of error reports submitted by nurses in the last 12 months, the same
basic steps were used to answer RQ4. However, the models used differed so that linear
mixed models were used for nurses’ perceptions of error reporting, and Poisson regression
models with GEE were used for the number of error reports submitted by nurses.
There were four steps to the mediation analysis, the four steps of the causal steps
approach of Baron and Kenny (1986) for addressing mediation. Step 1 assessed the total
effect of the individual predictor variables (safety climate-unit environment, safety climate-
interprofessional relationships, and leader inclusiveness) on the outcome variable (error
reporting). In order to establish a mediating effect, Step 1 of the mediation analysis does not
have to be significant, but the remaining steps (Step 2, Step 3, and Step 4) must all be
significant (Kraemer, Kiernan, Essex, & Kupfer, 2008). Step 2 assessed the effect of the
individual predictor variables (safety climate-unit environment, safety climate-
interprofessional relationships, and leader inclusiveness) on the mediator variable,
psychological safety. Step 3 assessed the direct effect of the individual predictor variables
(safety climate-unit environment, safety climate-interprofessional relationships, and leader

83
inclusiveness) controlling for the mediator variable (psychological safety) on the outcome
variable, nurse perceptions of error reporting. Finally, Step 4 assessed the indirect effects of
the predictor variables (safety climate-unit environment, safety climate-interprofessional
relationships, and leader inclusiveness) on the outcome variable (error reporting) through the
mediator (psychological safety).
For the outcome variable of nurses’ perceptions of frequency of error reporting on the
unit, linear mixed models were used to address Steps 1, 2, and 3 of the mediation analysis.
Step 4 was addressed by using bootstrap confidence intervals, with bias correction, to
account for the change in slope (MacKinnon, Lockwood, & Williams, 2004; Preacher &
Hayes, 2004; Shrout & Bolger, 2002). Simplified, the bootstrapping method is a process that
samples one observation from the total number of complete observations in the dataset (n =
779), and then replaces the observation in the dataset before sampling another single
observation. This process is then repeated until a resample with the same sample size as the
original sample is obtained. In this study the resampling generated 1000 bootstrap samples,
which were used with bias correction to compute confidences intervals for the indirect effect
of psychological safety. An advantage to using the bootstrapping method is that a mediation
analysis can be conducted with a smaller sample size (Shrout & Bolger, 2002). These
computations were performed using macros available at http://www.unc.edu/~gknafl/
software.html from Dr. George Knafl ([email protected], Chapel Hill, NC, USA). Once all
four steps of the mediation analysis were completed for nurses’ perceptions of frequency of
error reporting, the significant covariates were added to the models and Steps 1-4 were
repeated.

84
The same 4-step mediation analysis was used for the error-reporting measure of the
number of error reports submitted in a 12-month period. Steps 1-3 of the mediation analysis
were conducted using Poisson regression models, because of the count outcome variable,
with GEE, to account for intra-unit correlations. Step 4 of the mediation analysis was again
conducted using bootstrap confidence intervals, with bias correction, to account for the
change in slope using macros available at http://www.unc.edu/~gknafl/software.html from
Dr. George Knafl ([email protected], Chapel Hill, NC, USA). Once the 4-step mediation
analysis was completed for the number of error reports submitted by nurses, the significant
covariates were added to the models and the 4-step mediation analysis was repeated.
Summary
This chapter provided a review of the study methodology. The research study used a
cross-sectional, descriptive design to examine the effect of safety climate, leader
inclusiveness, and psychological safety on error reporting. The study was conducted in a
single academic medical center in the southeastern U.S. with a convenience sample of nurses
and nurse managers working predominantly in the inpatient setting. Data were collected with
a survey that was available to potential participants in either paper or electronic format, using
four scales to measure the dependent and independent variables of the study. Error reporting
was defined in two ways, as nurses’ perceptions about the frequency of error reporting on the
unit and as the number of error reports submitted by nurses; separate analyses were therefore
used to answer the research questions of the study. Altogether, the research questions were
answered using linear mixed models, Poisson regression with GEE, and bootstrapping
confidence intervals with bias correction. The results of the data analyses of the study are
discussed in Chapter 4.

85
CHAPTER 4
FINDINGS
This chapter presents the findings from this study that examined the effect of nursing
unit factors—safety climate, leader inclusiveness, and psychological safety—on error
reporting by nurses. The chapter begins with a description of the study sample followed by a
description of the study variables. Next, the results of the analyses are presented for each of
the study research questions. The chapter ends with a summary of the major study findings.
Description of the Sample
Response Rate and Sample Size
There were 1,922 RNs employed on 50 nursing units at the study site who were
recruited to participate in this study. Of those nurses, 924 responded to the survey, for a
response rate of 48.1%. Of the nurses who responded to the survey, 96.5% completed the
web-based version of the survey and the remaining 3.5% completed the paper version.
Nurses representing 53 units at the study hospital responded to the survey by following the
web-based link that was posted on recruitment flyers, but data were only usable from nurses
in 49 units. The sample sizes reported in analyses ranged from 687 to 924, depending on
missing data and the relationships being examined.
The 50 nursing units at the study site, which were the focus of recruitment efforts,
had one nurse manager with administrative responsibilities for overseeing patient care
delivery on each unit. Of the nurse managers on the 50 units, 43 responded to the survey,

86
which represents a response rate of 86%. Most of the nurse manager respondents (72.1%)
completed the paper version of the survey, while the remainder (27.9%) completed the web-
based version of the survey.
Missing Item Values
There were missing responses for all of the scales used in this study. Consistent with
other studies, values were imputed for individuals who had no more than 30% missing items
for any given scale (Hillen et al., 2015; Roth, Switzer, & Switzer, 1999). A number of
methods for imputing missing items exist. In this study, the individual mean approach was
used for missing items so that an individual’s mean score for the scale was used to replace no
more than 30% of missing item values from a single scale. This approach is considered
superior to other methods (e.g., single imputation, where the total mean score on the scale for
all participants is used to impute missing values) because the individual’s mean score likely
best represents their views on a phenomenon, rather than the mean value for all participants
(Newman, 2014; Peyre, Leplege, & Coste, 2011; Roth et al., 1999).
In total, values for 91 observations (2.2%) were imputed due to missing data for each
of the scales in the study. Specifically values for 5 out of 876 observations (0.6%) were
imputed in the frequency of event reporting scale (i.e. nurses’ perceptions of error reporting
frequency on the unit); 50 out of 824 observations (6.1%) were imputed for the safety
climate-unit environment (i.e., safety climate); 9 out of 822 observations (1.1%) were
imputed for the safety climate-interprofessional relationships (i.e., safety climate); 20 out of
847 observations (2.4%) were imputed for the inclusive leadership scale (i.e. leader
inclusiveness); and 7 out of 842 observations (0.8%) were imputed for the psychological
safety scale (i.e., psychological safety).

87
Description of the Variables
Sample Characteristics
The characteristics of the nurses in the study sample and the units on which they
worked are displayed in Appendix 8. The nurses who participated in the study had an
average of 11.7 years of experience as a nurse and were employed on their current unit for an
average of 6.1 years. The majority of nurses in the sample had a bachelor of science in
nursing (BSN) degree (68.4%). Because there were so few nurses with an earned doctorate
(n = 3) and the number was too small to generate meaningful results, doctorally-prepared
nurses were combined with MSN-prepared nurses (n = 48) in subsequent analyses.
For nurse manager participants, the average tenure as the nurse manager on their
current unit was 5.3 years, but their tenure ranged from less than one year to a maximum of
26 years. The educational preparation of nurse managers was almost evenly split with 54.4%
of nurse managers prepared with the highest degree of BSN and 43.5% of nurse managers
prepared with a master’s degree. Similar to the nurses in the study, the number of nurse
managers with a doctorate (n = 1) was so small that it was combined in the category of nurse
managers with a master’s degree in subsequent analyses (n = 20).
Descriptive Statistics of Study Variables
The means, standard deviations (SD), and minimum and maximum values for the
study variables are presented in Appendix 9. The mean score for nurses’ perceptions of error
reporting on their unit was 3.4 (SD = 0.9). Overall, nurses perceived that error reporting
“sometimes” occurred on their unit. The number of error reports submitted by each nurse
during a 12-month period was reported to be approximately two error reports per year (SD =
3.5), but the range in the number of error reports reported by nurses was great, from zero to

88
40 reports per year. The mean score for the safety climate-unit environment was 3.9 (SD =
0.7) while the safety climate-interprofessional relationships had a mean score of 3.7 (SD =
0.8), which means that overall the nurses on the units perceived that the unit environment and
interprofessional relationships on their unit were good. The mean score for leader
inclusiveness was 4.0 (SD = 1.0), which means that nurses working units at the study site
perceived their managers to be inclusive leaders. Finally, the mean score for nurses’
perceptions of psychological safety was 3.9 (SD = 0.7), meaning that nurses who participated
in the survey felt positive psychological safety on their units. All in all, the nurses who
responded to the survey perceived that in their units there was positive safety climate,
positive leader inclusiveness, and positive psychological safety.
Relationships between Study Variables
The Pearson correlation coefficients for the relationships between the continuous
dependent variables, independent variables, and covariates of the study are found in
Appendix 10. Nurses’ perceptions of error-reporting frequency on the unit were positively
associated with the study variables of safety climate-unit environment, safety climate-
interprofessional relationships, leader inclusiveness, and psychological safety. Safety
climate-unit environment was positively associated with safety climate-interprofessional
relationships, leader inclusiveness, and psychological safety but negatively associated with
nurse manager tenure and unit size. Safety climate-interprofessional relationships was
positively associated with leader inclusiveness and psychological safety but not with any of
the nursing characteristics or nursing unit characteristics. Leader inclusiveness was
positively related to psychological safety, nurse experience, and nurse tenure but negatively
related to nurse manager tenure and unit size. Psychological safety was negatively associated

89
with nurse manager tenure and unit size. Nurse experience was positively related to nurse
tenure. While tenure of nurses on the nursing unit was positively related to nurse manager
tenure, it was negatively related to the size of the nursing unit (number of RN employees and
number for RN FTEs).
The correlations for nurse manager tenure and unit size were analyzed separately
because both nurse manager tenure and unit size represent nursing unit characteristics
measured at the nursing unit level (Appendix 11). Nurse manager tenure was not
significantly associated with either measure of unit size (number of RN employees and
number of RN FTEs). The two measures of unit size were also positively related.
Covariate Selection
The covariates included in this study were nurse education, nurse experience, nurse
tenure, nurse manager education, nurse manager tenure, unit size, and type of unit.
Covariates were examined to select the covariates that would be used in the examination of
dependent variables for the research questions of the study. Specifically, covariates were
examined for the dependent variables of psychological safety, error reporting measured as
nurses’ perceptions of error reporting frequency on the unit, and error reporting measured as
the number of error reports submitted by nurses in the past 12 months. The process used to
examine covariates is described next.
Covariate analysis for psychological safety. A standard t-test was used to assess
whether nurse education significantly influenced nurses’ perceptions of psychological safety.
Specifically, the four types of academic degrees (diploma, ADN, BSN, and MSN or higher)
were examined individually to determine if any type of degree had a significant effect on
psychological safety. Because of the continuous nature of the variables of nurse experience

90
and tenure, and since both of these variables were measured at the individual level, Pearson
correlation coefficients were used to determine if these two covariates were significantly
related to nurses’ perceptions of psychological safety.
The remaining unit-level covariates (nurse manager education, nurse manager tenure,
unit size, and type of unit) were examined using linear mixed models with random effects to
account for within unit correlation and to assess the influence of these covariates on nurses’
perceptions of psychological safety. The types of nurse manager education (BSN or master’s
degree or higher) and the four types of nursing units (medical/surgical, ICU, specialty, or
other) were each assessed individually to determine whether type of nurse manager degree
and type of nursing unit individually predicted nurses’ psychological safety. None of the
covariates significantly predicted nurses’ psychological safety (Appendix 12).
Covariate analysis for error reporting (nurses’ perceptions). For the covariate of
nurse education, again, a standard t-test was used to assess the influence of each type of
academic degree (diploma, ADN, BSN, MSN or higher) on nurses’ perceptions of error
reporting. Pearson correlation coefficients were used to assess the covariates of nurse
experience and nurse tenure. The unit level covariates of nurse manager education, nurse
manager tenure, unit size, and type of unit were assessed using linear mixed models with
random effects to account for within unit correlations. For the categorical variables of nurse
manager education and type of unit, separate models were created for each of the categories
of the variables.
The results of the covariate analyses conducted for nurses’ perceptions of error-
reporting frequency on the unit are included in Appendix 13. There were a number of
significant covariates for error reporting. A diploma degree in nursing was positively related

91
to nurses’ perceptions of error reporting, but no other nursing degrees had a significant effect
on nurses’ perceptions of error reporting. Nurse manager education, specifically at the BSN
and at the master’s degree or higher levels, had a significant effect on nurses’ perceptions of
error reporting. However, on units led by BSN-prepared nurse managers, there was a
negative relationship between nurse manager education and nurses’ perceptions of error
reporting, such that nurses working on units with a BSN-prepared manager perceived that
fewer errors were reported. On units led by nurse managers with a master’s degree, there
was a positive relationship between nurse manager education and nurses’ perceptions of error
reporting, with nurses on these units perceiving that more errors were reported.
Covariate selection for error reporting (number of reports submitted). Because
the second measure of error reporting—number of error reports submitted by nurses in the
last 12 months—was a count variable, Poisson regression models were used to regress error
reporting on the covariates. For unit level variables, GEE was used to account for within unit
correlations. For categorical variables (i.e., nurse education, nurse manager education, and
type of nursing unit), separate models were estimated for each variable. Results for these
covariate analyses are reported in Appendix 14. Possessing a master’s degree or higher was
positively related to the number of error reports that nurses reported submitting. Nurse
tenure was also positively related to the number of error reports submitted by nurses, so that
the longer nurses worked on a specific unit, the fewer errors they reported submitting. Nurse
manager education was both positively and negatively related to the number of error reports
submitted by nurses. Nurses working on units with BSN-prepared managers submitted fewer
error reports, while those who worked on units with a nurse manager prepared at the master's
degree or higher level submitted greater numbers of error reports. Finally, working on other

92
types of nursing units (e.g., procedural units or clinics) negatively predicted the number of
error reports submitted by nurses, such that nurses working on these types of units submitted
fewer error reports.
Major Study Findings
The major findings of the study are organized by the four research questions that were
addressed in this study. Analyses were first conducted without model covariates to maximize
the sample size; the results of those analyses are reported first. Next, the significant
covariates for the corresponding outcome variables (Appendix 13 and Appendix 14) were
added to models one at a time. All remaining significant covariates were added to the
models with the respective predictor and outcome variables. If any covariates were no longer
significant, they were removed from the model so that only significant covariates remained
with the predictor and outcome variables. Where significant, the results of the analyses with
covariates included are reported below. The conceptual model for the study, which
illustrates the relationships examined by the research questions, is presented at the variable
level in Figure 4.
Figure 4. Conceptual model for the study with identified research questions.

93
Research Question 1: How Do Safety Climate and Leader Inclusiveness Affect Error
Reporting?
This question was first examined using linear mixed models with random effects to
account for within unit correlations. The results of the analyses, shown in Table 5, were all
statistically significant and demonstrated that nurses’ perceptions of safety climate, both the
unit environment and interprofessional relationships, positively affected nurses’ perceptions
of error-reporting frequency on their unit. Further, the results showed that nurses’
perceptions of the inclusiveness of their nurse managers also positively affected their
perceptions of error-reporting frequency on the nursing unit where they worked.
Table 5
The Effect of Safety Climate and Leader Inclusiveness on Perceptions of Error Reporting
n
df
Estimated
Slope
t
value
p
value
Model 1
Safety Climate-Unit Environment 788 738 0.59 12.45 < .01
Model 1 with Covariates
Safety Climate-Unit Environment 788 738 0.59 12.59 < .01
Nurse manager education: BSN 47 0.30 3.59 < .01
Model 2
Safety Climate-
Interprofessional Relationships 787 737 0.45 10.76 < .01
Model 2 with Covariates
Safety Climate-
Interprofessional Relationships 787 737 0.44 10.89 < .01
Nurse manager education: BSN 47 0.26 3.41 < .01
Model 3
Leader Inclusiveness 811 761 0.24 7.20 < .01
Model 3 with Covariate
Leader Inclusiveness 811 761 0.25 7.39 < .01
Nurse manager education: BSN 47 0.27 3.21 < .01
Note. df = Degrees of Freedom; BSN: Bachelor of Science in Nursing.

94
Research question 1 was also examined using nurses’ estimates of the number of
error reports submitted in a year. Because this was a count variable, Poisson regression
analyses with GEE was used to account for within unit correlations. The results of the
analyses are presented in Table 6 and indicated that safety climate, both the unit environment
and the interprofessional relationships, negatively predicted the number of error reports
submitted by nurses so that the more positively nurses perceived the safety climate-unit
environment and the safety climate interprofessional-relationships, the fewer error reports
they submitted. The results also demonstrated that nurses’ perceptions of the inclusiveness
of the nurse manager on their unit negatively predicted the number of error reports submitted.
Nurses working on units with higher levels of leader inclusiveness reported submitting fewer
error reports than those working on units with lower levels of leader inclusiveness.
Next, the analyses were repeated with the addition of significant covariates
(Appendix 14). The results presented in Table 6 demonstrated that safety climate-unit
environment negatively predicted the number of error reports submitted when controlling for
nurses’ tenure on the unit and nurse managers’ education (master's degree or higher). In
addition, the results demonstrated that safety climate-interprofessional relationships
negatively predicted the number of error reports submitted by nurses when controlling for the
tenure of nurses on the unit where they worked and nurse manager education (i.e., master’s
degree or higher). Finally, leader inclusiveness negatively affected the number of error
reports submitted by nurses when controlling for nurse managers’ education (master’s degree
or higher).

95
Table 6
The Effect of Safety Climate and Leader Inclusiveness on the Number of Error Reports
n
Estimated
Slope
SE
Z
score
95% CI p
value LL UL
Model 1
Safety Climate-
Unit Environment
792 -0.22 .08 -2.60 -0.38 -0.05 <.01
Model 1 with Covariates
Safety Climate-
Unit Environment
742 -0.22 .09 -2.62 -0.39 -0.06 .01
Tenure -0.02 .01 -2.23 -0.04 -0.002 .03
Nurse Manager Education:
Master’s degree or higher
0.83 .20 4.11 0.44 1.23 <.01
Model 2
Safety Climate-
Interprofessional Relationships
791
-0.33
.11
-3.18
-0.54
-0.13
<.01
Model 2 with Covariates
Safety Climate-
Interprofessional Relationships
742
-0.33
.08
-4.12
-0.49
-0.17
<.01
Tenure -0.02 .01 -2.47 -0.03 -0.004 .01
Nurse Manager Education:
Master’s degree or higher
0.86 .21 4.13 0.45 1.27 <.01
Model 3
Leader Inclusiveness 814 -0.18 .07 -2.58 -0.31 -0.04 <.01
Model 3 with Covariates
Leader Inclusiveness 814 -0.17 .06 -2.82 -0.29 -0.05 <.01
Nurse Manager Education:
Master’s degree or higher
0.81 .20 4.11 0.42 1.19 <.01
Note. SE: standard error; CI = confidence interval; LL = lower limit, UL = upper limit.
Research Question 2: How Do Safety Climate and Leader Inclusiveness Affect
Psychological Safety?
Research Question 2 was answered using linear mixed models with random effects to
model within-unit correlation and fixed effects to model psychological safety, safety climate-
unit environment, safety climate-interprofessional relationships, and leader inclusiveness.
The results, displayed in Table 7, show that nurses’ perceptions of the safety climate of their

96
unit, both the unit environment and the interprofessional relationships, predicted their
feelings of psychological safety. Additionally, nurses’ perceptions about leader inclusiveness
positively affected their feelings of psychological safety.
Table 7
The Effect of Leader Inclusiveness and Safety Climate on Psychological Safety
n
df
Estimated
Slope
t
value
p
value
Model 1
Safety Climate-Unit Environment 789 739 0.68 20.7 < .01
Model 2
Safety Climate-Interprofessional
Relationships 788 738 0.36 10.8 < .01
Model 3
Leader Inclusiveness 809 759 0.27 10.4 < .01
Note. df = Degrees of Freedom
Research Question 3: How Does Psychological Safety Affect Error Reporting?
Research question 3 assessed the effect of psychological safety on error reporting;
thus, data was analyzed in two ways to determine the effect of psychological safety on
nurses’ perceptions of error reporting frequency as well as the effect of psychological safety
on the number of error reports submitted by nurses. First, linear mixed models with random
effects were used to assess the effect of psychological safety on nurses’ perceptions of error
reporting. The results of the analysis, presented in Table 8, indicated that the psychological
safety of nurses positively affected their perceptions of error reporting on the unit. Next, the
analysis was repeated with the addition of significant covariates (Appendix 13). The results
showed that psychological safety positively affected nurses’ perceptions of error reporting
when controlling for nurse managers’ education (BSN). In other words, holding the effect of
nurse managers’ education constant (BSN), more positive levels of psychological safety by

97
nurses was associated with nurses’ perceptions of greater frequency of error reporting on the
unit.
Table 8
The Effect of Psychological Safety on Nurses’ Perceptions of Error Reporting
n
df
Estimated
Slope
t
value
p
value
Model 1
Psychological Safety 805 755 0.28 6.56 <.01
Model 1 with Covariate
Psychological Safety 805 759 0.29 6.51 <.01
Nurse Manager Education:
BSN
47 -0.24 -2.95 <.01
Note. df = Degrees of Freedom; BSN: Bachelor of Science in Nursing.
Poisson regression models with GEE were then used to determine the effect of
psychological safety on the number of error reports nurses reported submitting during a 12-
month period. These results indicated that the psychological safety of nurses negatively
affected the number of error reports they submitted. In particular, the more psychologically
safe nurses felt, the fewer error reports they indicated submitting in the past year. Next, the
analysis was repeated with the addition of significant covariates (Appendix 14). The results
of these analyses, shown in Table 9, demonstrate that psychological safety negatively
affected the number of error reports submitted by nurses when controlling for nurse tenure
and nurse manager education (master’s degree or higher). In other words, more positive
levels of psychological safety by nurses was associated with fewer numbers of error reports
by nurses when controlling for the length of time nurses worked on the unit and for the nurse
managers’ education (master’s degree or higher).
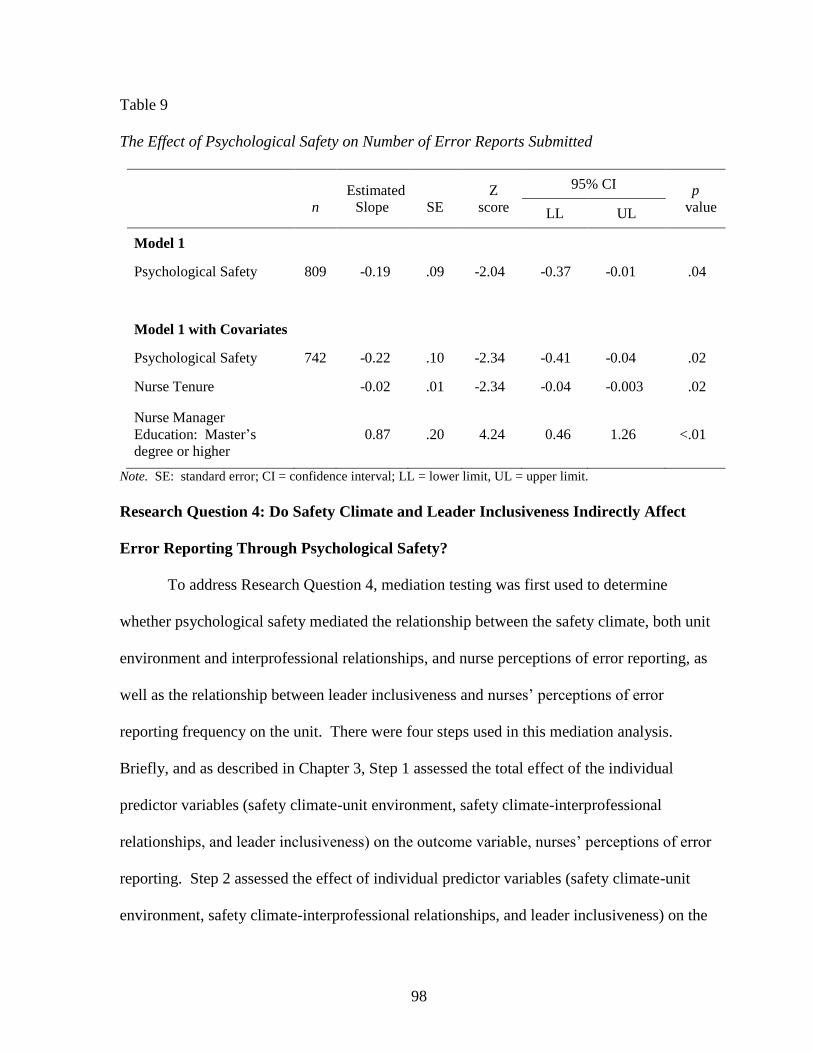
98
Table 9
The Effect of Psychological Safety on Number of Error Reports Submitted
n
Estimated
Slope
SE
Z
score
95% CI p
value LL UL
Model 1
Psychological Safety 809 -0.19 .09 -2.04 -0.37 -0.01 .04
Model 1 with Covariates
Psychological Safety 742 -0.22 .10 -2.34 -0.41 -0.04 .02
Nurse Tenure -0.02 .01 -2.34 -0.04 -0.003 .02
Nurse Manager
Education: Master’s
degree or higher
0.87 .20 4.24 0.46 1.26 <.01
Note. SE: standard error; CI = confidence interval; LL = lower limit, UL = upper limit.
Research Question 4: Do Safety Climate and Leader Inclusiveness Indirectly Affect
Error Reporting Through Psychological Safety?
To address Research Question 4, mediation testing was first used to determine
whether psychological safety mediated the relationship between the safety climate, both unit
environment and interprofessional relationships, and nurse perceptions of error reporting, as
well as the relationship between leader inclusiveness and nurses’ perceptions of error
reporting frequency on the unit. There were four steps used in this mediation analysis.
Briefly, and as described in Chapter 3, Step 1 assessed the total effect of the individual
predictor variables (safety climate-unit environment, safety climate-interprofessional
relationships, and leader inclusiveness) on the outcome variable, nurses’ perceptions of error
reporting. Step 2 assessed the effect of individual predictor variables (safety climate-unit
environment, safety climate-interprofessional relationships, and leader inclusiveness) on the

99
mediator variable, psychological safety. Step 3 assessed the direct effect of the individual
predictor variables (safety climate-unit environment, safety climate-interprofessional
relationships, and leader inclusiveness) and the mediator variable (psychological safety) on
the outcome variable, nurse perceptions of error reporting. Finally, Step 4 assessed the
indirect effects of the predictor variables (safety climate-unit environment, safety climate-
interprofessional relationships, and leader inclusiveness) on the outcome variable (nurse
perceptions of error reporting) through the mediator (psychological safety).
Steps 1, 2, and 3 were conducted using linear mixed models with random effects to
account for any within unit correlation. Step 4 of the mediation analysis was conducted
using bootstrap confidence intervals with bias correction and 1000 resamples on the change
in slope (MacKinnon et al., 2004; Preacher & Hayes, 2004; Shrout & Bolger, 2002; Knafl,
personal correspondence, http://www.unc.edu/~gknafl/software.html). In the mediation
analysis, only observations with no missing data were used to maintain consistent sample
sizes for all of the mediation models. Doing so reduced the sample size for all steps of the
mediation analysis (n = 779). The findings from the mediation analysis for Steps 1, 2, and 3
are found in Table 10, and Step 4 is found in Table 11. Taken together, these findings
indicated the following: (a) psychological safety mediated the relationship between safety
climate-interprofessional relationships and nurses’ perceptions of error reporting, (b)
psychological safety did not mediate the relationship between safety climate-unit
environment and nurses’ perceptions of error reporting, and (c) psychological safety
mediated the relationship between leader inclusiveness and nurses’ perceptions of error
reporting.

100
Table 10
Steps 1-3 of the Mediation Analysis for Psychological Safety
Mediation Analysis
n
df
Estimated
Slope
t
value
p
value
Step 1
Safety Climate-Unit Environment 779 729 0.59 12.3 < .01
Safety Climate-Interprofessional
Relationships 779 729 0.45 10.7 < .01
Leader Inclusiveness 779 729 0.03 7.02 < .01
Step 2
Safety Climate-Unit Environment 779 729 0.68 20.7 < .01
Safety Climate-Interprofessional
Relationships 779 729 0.37 10.9 < .01
Leader Inclusiveness 779 729 0.27 10.5 < .01
Step 3
Safety Climate-Unit Environment 779 728
0.61
10.3
< .01
Psychological Safety 779 728 -0.04 -0.69 .49
Safety Climate-Interprofessional
Relationships 779
728
0.40
8.94
< .01
Psychological Safety 779 728 0.14 3.03 < .01
Leader Inclusiveness 779 728 0.19 5.17 < .01
Psychological Safety 779 728 0.20 4.22 < .01
Note. df = Degrees of Freedom.

101
Table 11
Step 4 of the Mediation Analysis for Psychological Safety
Mediation Analysisa
95%
Lower
Bound
Mid-Value
95% Upper
Bound
Step 4
Leader Inclusiveness 0.03 0.05 0.08
Safety Climate—Interprofessional Relationship
0.02 0.05 0.08
Note. aBootstrap confidence intervals with bias correction and 1000 resamples were used for the analysis.
Next, the four-step mediation analysis was repeated with the addition of significant
covariates. The results of this analysis with significant covariates for each step of the
analysis are displayed in Tables 12 and 13. Despite the addition of covariates to the
mediation analysis, the effect of psychological safety on the relationship between safety
climate-unit environment and nurses’ perceptions of error reporting was not significant.
Thus, even after the addition of significant covariates, there was no evidence to support
psychological safety as a mediator between safety climate-unit environment and nurses’
perceptions of error reporting.
Another mediation analysis was conducted to determine whether psychological safety
mediated the relationship between safety climate and leader inclusiveness and the number of
error reports submitted by nurses. The results of this analysis did not support the role of
psychological safety as a mediator (Appendix 15). Next, the mediation analysis was repeated
with the addition of significant covariates. Again, no support was found for psychological
safety as a mediator of the relationship between safety climate-unit environment or
interprofessional relationships and the number of error reports submitted by nurses, or of the
relationship between leader inclusiveness and the number of error reports submitted by
nurses (Appendix 16).
102
Table 12
Steps 1-3 of the Mediation Analysis for Psychological Safety with Significant Covariates
Mediation Analysis
n
df
Estimated
Slope
t
value
p
value
Step 1
Safety Climate-Unit Environment 779 729 0.59 12.5 < .01
-Nurse Manager Education (BSN) 47 -0.29 -3.47 < .01
Safety Climate-Interprofessional
Relationships 779 729 0.45 10.8 < .01
-Nurse Manager Education (BSN) 47 -0.25 -3.20 < .01
Leader Inclusiveness 779 729 0.24 7.21 < .01
-Nurse Manager Education (BSN) 47 -0.28 -3.34 < .01
Step 2
Safety Climate-Unit Environment 779 729 0.68 20.7 < .01
Safety Climate-Interprofessional
Relationships
779 729 0.37 10.9 < .01
Leader Inclusiveness 779 729 0.27 10.5 < .01
Step 3
Safety Climate-Unit Environment
Psychological Safety
779 728
728
0.61
-0.04
10.4
-0.75
< .01
.45
-Nurse Manager Education (BSN) 47 -0.29 -3.49 < .01
Safety Climate-Interprofessional
Relationships
Psychological Safety
779 728
728
0.40
0.14
9.05
3.08
< .01
< .01
-Nurse Manager Education (BSN) 47 -0.25 -3.24 < .01
Leader Inclusiveness
Psychological Safety 779
728
728
0.19
0.19
5.33
4.18
< .01
< .01
-Nurse Manager Education (BSN) 47 -0.28 -3.25 < .01
Note. df = Degrees of Freedom; Bachelor of Science in Nursing

103
Table 13
Step 4 of the Mediation Analysis for Psychological Safety with Significant Covariate
Mediation Analysis a 95% Lower
Bound
Mid-Value
95% Upper
Bound
Step 4
Safety Climate-Interprofessional Relationships 0.02 0.05 0.07
-Nurse Manager Education (BSN)
Leader Inclusiveness 0.03 0.05 0.08
-Nurse Manager Education (BSN)
Note. BSN: Bachelor of Science in Nursing; aBootstrap confidence intervals with bias correction and
1000 resamples were used for the analysis.
Additional Analyses
Because there were two measures for the outcome variable of error reporting in this
study, and because the results for those two measures demonstrated seemingly conflicting
results, an additional analysis was conducted to determine whether nurses’ perceptions of
error reporting predicted the number of error reports they submitted over a year (Appendix
17). Poisson regression models were used with GEE to model the within unit correlations.
The results of the analyses were not statistically significant. Next, the model was repeated
with the addition of significant covariates (Appendix 14). These results also indicated that,
even after controlling for significant covariates, nurses’ perceptions of error reporting did not
predict the number of error reports they submitted (Appendix 17).
Summary of Study Results
The major findings of this study suggested that nurses’ perceptions of safety climate-
unit environment, safety climate-interprofessional relationships, and leader inclusiveness
positively affected nurses’ perceptions of error reporting frequency on the unit when

104
controlling for nurse manager degree (BSN). In contrast, safety climate-unit environment,
after controlling for nurse tenure and nurse managers’ education (master’s degree or higher),
negatively predicted the number of error reports submitted by nurses. Safety climate-
interprofessional relationships, after controlling nurse managers’ education (master’s degree
or higher), negatively predicted the number of error reports submitted by nurses. Also,
leader inclusiveness, after controlling for nurse managers’ education (master’s degree or
higher), negatively affected the number of error reports nurses submitted during the previous
12-month period. Thus, while safety climate and leader inclusiveness positively affected
nurses’ perceptions of error reporting frequency on the unit, those same variables negatively
affected the number of error reports that individual nurses reported submitting over a 12-
month period.
Study findings also demonstrated that the psychological safety of nurses was
positively affected by their perceptions of the safety climate-unit environment, their
perceptions of the safety climate-interprofessional relationships, and their perceptions of the
inclusiveness of their nurse manager. Further, nurses’ perceptions of psychological safety
positively affected their perception of error reporting on the unit when controlling for nurse
managers’ education (BSN), but negatively affected the number of error reports they
submitted when controlling for nurse tenure on the unit and nurse managers’ education
(master’s degree or higher).
The mediation analyses showed that psychological safety mediated the relationship
between safety climate-interprofessional relationships and nurses’ perceptions of error
reporting on the unit when controlling for nurse managers’ education (BSN). Psychological

105
safety also mediated the relationship between leader inclusiveness and nurses’ perceptions of
error reporting when controlling for nurse managers’ education (BSN).
Finally, additional analyses were performed to determine whether there was a
relationship between the two measures of error reporting in this study, nurses’ perceptions of
error reporting and the number of error reports submitted by nurses over a 12-month period.
The results of those analyses, even after controlling for significant covariates, indicate there
was no relationship between these two measures of error reporting.
Chapter Summary
This chapter presented the results of analyses examining the relationship between
nursing unit or team factors (safety climate, leader inclusiveness, and psychological safety)
and error reporting. With few exceptions, the regression models predicted that safety
climate, both unit environment and interprofessional relationships, leader inclusiveness, and
psychological safety positively affected nurses’ perceptions of error-reporting frequency on
the unit and negatively affected the number of error reports submitted by nurses on the unit.
Further, the mediation analyses indicated that psychological safety is an important mediator
between safety climate-interprofessional relationships and nurses’ perceptions of error
reporting frequency on the unit and also between leader inclusiveness and nurses’
perceptions of error reporting. The models allowed the most important variables affecting
nurses’ error reporting behaviors to be identified and allowed research questions to be tested.
Chapter 5 will discuss major study findings, including possible explanations of the
findings in light of current trends in nursing and health care. Specific recommendations will
be made regarding practice and policy-making, future research and data collection efforts to

106
improve our understanding of nurses’ error reporting behaviors, and foster better reporting of
errors among health care professionals.

107
CHAPTER 5
DISCUSSION
Knowledge of and about error reporting is essential for nursing and healthcare
leaders. This study was conducted to add to the existing body of knowledge by investigating
factors associated with and impacting nurses’ error reporting. The model of work-team
learning guided the selection of salient variables for study (Edmondson, 1999). Study
questions aimed to identify whether the nursing team factors of safety climate, leader
inclusiveness, and psychological safety influenced nurses’ error-reporting behaviors.
This chapter presents a discussion of major study findings. The first section contains
a summary of research findings and general conclusions drawn from these findings relative
to error reporting. The chapter is organized by the relationships examined in the study,
followed by a discussion of the significant covariates to error reporting, and additional
analyses that were completed. Next, study limitations are explored followed by an
examination of the implication of study findings for future theory, research, practice, and
policy.
Before proceeding, it should be noted that almost all of the major findings in this
study were statistically significant. However, because there was a large sample size for the
study, care should be used in interpreting these findings when the reported correlation is less
than .30. Thus, there are some findings that are statistically significant, but the practical

108
value of the findings should be interpreted with caution when only a small amount of
variance is explained by the independent variable.
Summary and Interpretation of Major Study Findings
The Effect of Safety Climate and Leader Inclusiveness on Error Reporting
The findings from this study demonstrated that nurses’ perceptions of the safety
climate on their unit (as unit environment and interprofessional relationships) and the leader
inclusiveness of their nurse manager positively predicted perceptions of the frequency of
error reporting on their unit. These findings are consistent with the model of work-team
learning, which posits that context support (i.e., safety climate in this study) and team
leadership (i.e., leader inclusiveness in this study) affect team learning behavior (i.e., error
reporting in this study). This finding is also consistent with prior research that demonstrates
a positive relationship between unit-level climate and nurse manager leadership with error
reporting by clinicians (Edmondson, 1999; Richter et al., 2014). Thus, if the nursing unit is
perceived to have a strong safety climate and nurse managers are perceived to be inclusive
leaders, nurses believe that the error-reporting practices on their unit are such that more
errors and near misses are reported.
The study also demonstrated that both dimensions of safety climate and leader
inclusiveness negatively predicted the number of error reports that nurses acknowledged
submitting. Findings suggest that a stronger safety climate and positive leader inclusiveness
result in fewer error reports submitted by nurses. This is a surprising finding, given that
these same factors positively predicted nurses’ perceptions of error reporting.
One possible explanation for this finding comes from qualitative studies that have
identified alternate reporting methods that sometimes replace the submission of formal error

109
reports by nurses. Espin and colleagues (2007) reported that nurses engaged in both formal
error reporting (i.e., error reports submitted through a hospital’s error-reporting system) and
informal error reporting (i.e., verbally discussing errors with team colleagues or manager).
They noted that when nurses chose to informally report errors across professions (e.g., to a
physician) that the behavior depended on the degree of confidence they felt in their
relationships with team colleagues. These same mechanisms may be at work on nursing
units with strong team safety climates and leadership. When nurses feel supported by the
team structures in place, they feel free to discuss errors that occur with their team colleagues
and nurse managers in a way that fulfills their obligation to formally report errors. In
contrast, nurses who work in less supportive environments, characterized by nurses’
perceptions of a weaker safety climate and lower levels of leader inclusiveness by the nurse
manager, may submit more error reports because the available reporting option allows them
the security of anonymity and confidentiality.
An alternate explanation for the findings is that nurses’ perceptions of positive safety
climates and leader inclusiveness on nursing units lead to safer care. Thus, there are fewer
error reports on these nursing units because there are actually fewer errors. There is some
evidence from the literature that this may be the case. For example, Hofmann and Mark
(2006) reported that safety climate on nursing units was negatively associated with the actual
number of medication errors, which the researchers measured as the number of errors
reported that resulted in “harm” to patients. Vogus and Sutcliffe (2007) also observed that
more positive team leadership and safety organizing on the nursing unit resulted in fewer
reported medication errors. However, error detection has been described as a confluence of
the number of actual errors that occur as well as the willingness of clinicians to report. Thus,

110
the explanation of why more positive safety climates and inclusive leadership behaviors in
nursing units predicted fewer numbers of error reports in this study is likely more complex
than just differing reporting methods or altogether safer care.
Another explanation of the difference in findings may be due to the fact that the two
measures of error reporting had a different focus. The measure of nurses’ perceptions of
error reporting was worded such that nurses were responding to their perceptions of error
reporting on their unit. In contrast, the number of error reports submitted by nurses was
worded in such a way that the item reflected individuals’ behaviors. So it could be that the
differences in findings are attributable to how the items were measured because nurses’
perceptions of reporting on the unit differed from their own, individual reporting behavior.
Ultimately, the study findings emphasize the need for better measures of error reporting and
more sophisticated research methods that can uncover and better explain how team factors
affect error reporting.
The Effect of Safety Climate and Leader Inclusiveness on Psychological Safety
The findings from this study indicate that both safety climate and leader inclusiveness
positively affected psychological safety; that is, nurses who worked in teams with a strong
safety climate and for inclusive nurse managers reported higher levels of psychological
safety. These findings provide support for the model of work-team learning and also
demonstrate that safety climate, an area of context support, and leader inclusiveness, a type
of team leadership behavior, are important elements of team structure that influence team
safety beliefs and the psychological safety of the team (Edmondson, 1999). Therefore, safety
climates in units and leader inclusiveness of nurse managers are both important influences on
nurses’ perceptions of psychological safety.

111
The Effect of Psychological Safety on Error Reporting
This study’s findings indicated that psychological safety positively affected nurses’
perceptions of error reporting on the unit, so that higher levels of psychological safety were
associated with higher levels of nurses’ perceptions of the frequency of error reporting on
their unit. These findings demonstrate that psychological safety is important in determining
how nurses perceive the reporting practices on their unit. When nurses experience greater
psychological safety, they perceive that there is more error reporting occurring on their unit.
These findings, in fact, support and are consistent with the model of work-team learning.
The study findings also indicated that psychological safety negatively affected the
number of error reports that nurses recall submitting during the past year, so that higher
levels of psychological safety was associated with nurses submitting fewer error reports.
This finding may be explained by the fact that, as nurses feel safer, they also engage in more
informal reporting such as discussing errors face-to-face with managers and peers. This
informal error reporting, in turn, is believed to take the place of error reporting through a
hospital’s formal reporting systems.
However, this explanation does not help to put into context the results that lower
levels of psychological safety were associated with nurses submitting a higher number of
error reports. These findings are difficult to explain in light of research suggesting that
psychological safety is a shared team belief stemming from team members feeling safe
talking about errors and raising concerns encountered in the work environment (Edmondson,
1996, 1999). In this context, one would expect that when psychological safety is poor,
nurses would shy away from speaking up about errors. Perhaps these findings demonstrate
that nurses who work in unhealthy work environments, characterized by a manager whose

112
behaviors do not convey the inclusive leadership behaviors of openness and accessibility to
staff and a climate in which safety is not prioritized, submit more error reports because the
error reporting systems provides them a confidential and anonymous option for reporting
errors. In other words, nurses working in settings where they do not feel psychologically
safe may choose to report errors through confidential and anonymous error reporting systems
because they feel more psychologically safe doing so. This explanation is supported by past
research demonstrating that nurses sometimes use error reporting as a defensive tool to
protect themselves from the possibility of perceived future threats (Lederman et al., 2013). It
may be inferred that in circumstances where nurses do not feel safe speaking directly with
their managers or peers about unsafe practices, they submit a greater number of anonymous
error reports through the error-reporting system because they view this as a “safe” way to
document problems and put them in the hands of others who can address problems they
observe in patient care and, at the same time, fulfill their fiduciary responsibility of reporting
the error and protecting themselves from negative repercussions.
The findings that psychological safety positively predicted nurses’ perceptions of
error reporting and negatively predicted the number of error reports submitted by nurses are
confusing. The difference in results is likely due to differences in the measurement of error
reporting. These seemingly opposing findings highlight the need for better measures of error
reporting.
The Mediating Effect of Psychological Safety
This study’s results indicated that psychological safety mediated two relationships in
the model. First, the findings demonstrated that psychological safety mediated the
relationship between one dimension of the safety climate, interprofessional relationships, and

113
nurses’ perceptions of error reporting. This is interesting because psychological safety only
mediated one aspect of safety climate (interprofessional relationships) and because the
dimension it mediated relates to relationships with and availability on the unit of physicians
and other clinicians (i.e., pharmacists). Thus, this finding emphasizes the importance of
psychological safety in explaining the relationship of interpersonal aspects of safety climate
and error reporting. Past studies examining nurses’ use of formal and informal reporting
practices also reported that many nurses feared speaking up about errors they observed,
especially when the error related to someone with higher levels of authority and scope of
practice (e.g., physicians), which points to the power differential that nurses often feel when
interacting with physicians (Espin et al., 2007, 2010). The findings from this study suggest
that psychological safety helps to explain how the interprofessional aspects of safety climate
affect nurses’ perceptions about error reporting.
Second, psychological safety mediated the relationship between leader inclusiveness
and nurses’ perceptions of error reporting frequency. In other words, leader inclusiveness
indirectly affected nurses’ perceptions of error reporting through psychological safety.
Notably, the study did not find support for psychological safety as a mediator between either
dimension of safety climate and the number of error reports submitted by nurses or the
relationship between leader inclusiveness and the number of error reports submitted by
nurses. Past studies have not examined the mediating role of psychological safety between
team factors and error reporting. This study suggests that in some cases, psychological safety
helps to explain how team factors affect error reporting. Thus, there is a need for more study
to help us better understand the situations and contexts in which psychological safety helps to
explain the relationships between team factors and error reporting.

114
Study Covariates
Nurse characteristics. Several individual-level nurse characteristics were examined
in this study based on past research: nurse education, nurse experience, and nurse tenure.
Only one of these characteristics, nurse education, was predictive of nurses’ perceptions of
error-reporting frequency on the unit. Specifically, nurses with a diploma degree perceived
that when errors occurred on their unit, they were reported with greater frequency than did
nurses with different educational preparations. Based on this study and existing research on
error reporting, it is difficult to draw meaningful conclusions about this finding. However, it
may be that nurses with a diploma degree hold more positive attitudes about the work
environment than nurses from other educational backgrounds, and/or are more aware of how
and when to report errors through their educational and practice experiences and assume that
others on their unit behave similarly.
Two nurse characteristics, nurse education and nurse tenure, were predictive of the
number of error reports submitted by nurses. First, nurses with a master’s degree or higher
reported submitting the highest number of error reports. This finding may partially be
explained because nurses, through master’s and doctoral programs, become more aware of
and knowledgeable about the importance of error reports in organizations, and in turn report
more errors. It could also mean that nurses with higher levels of education are more vigilant
in reporting errors to protect themselves and their organization from risk.
The second significant covariate for the number of error reports submitted by nurses
was nurse tenure: there was an inverse relationship between tenure and the number of error
reports nurses recalled submitting on their units. In other words, nurses employed on their
units for a longer period of time recalled submitting fewer error reports. This finding may

115
indicate that nurses who have been employed on a unit for a longer period of time have a
better understanding of what constitutes an error and report errors more appropriately. The
finding may also mean that nurses with greater unit tenure overlook many errors that occur
on the unit, prioritize the reporting of errors based on the impact to patients, or feel less
inclined to report errors to protect themselves or their unit colleagues. For these reasons, it is
difficult to draw conclusions about this finding, but further examination of nurses’ unit tenure
and error reporting is warranted.
Nursing unit characteristics. Several nursing unit characteristics were also included
as covariates in the study: nurse manager education, nurse manager tenure, unit size, and type
of unit. One of these, nurse manager education, predicted nurses’ perceptions of frequency
of error reporting on the unit. Specifically, nurses who worked on a unit where the nurse
manager had a bachelor’s degree in nursing as their highest degree perceived a lower
frequency of error reporting on their unit, while nurses who worked on a unit where the nurse
manager held a master’s degree or higher perceived a higher frequency of error reporting.
Similarly, nurse managers’ education levels significantly predicted the number of error
reports submitted by nurses on the unit. Nurses who worked on a unit led by a nurse
manager with a bachelor’s degree reported submitting fewer error reports, while nurses who
worked on a unit with a nurse manager prepared with a master’s degree or higher reported
submitting more error reports.
One explanation for these findings is that nurse managers who are prepared with a
graduate degree may have a greater understanding of error reports and foster learning from
errors throughout the unit. Thus, nurses who work on these units value error reporting in a
way that nurses working on units with managers prepared with bachelor’s degrees do not.

116
Another possibility is that nurses working on units with managers prepared with master’s
degrees are led in a way that is different than those who work on units led by nurse managers
with a bachelor’s degree. This fundamental difference in unit leadership may result in
different reporting behaviors by nurses. For example, nurses working on units led by
master’s prepared nurse managers may perceive they are empowered to participate in
decision-making regarding error reporting and the frequency of error reporting, which fosters
increased reporting of errors. Interestingly, nurse manager education was the only variable
where both measures of error reporting (nurses’ perceptions of error-reporting frequency on
the unit and the number of error reports nurses recalled submitting in a year) responded in the
same way (i.e., positively) to an independent variable.
The other significant nursing unit level covariate in the study was the type of nursing
unit on which nurses worked. There were four types of nursing units identified in the study:
medical/surgical, ICU, specialty, and other. The only type of unit that had a significant effect
on the number of error reports submitted by nurses was the unit categorized as Other. The
Other type of units included procedural units and outpatient clinics, as well as other types of
non-ICUs that were neither medical-surgical nor specialty care units. Specifically, working
on an Other unit negatively predicted the number of error reports submitted by nurses. There
are many possible reasons that nurses working in these types of units acknowledged
reporting fewer errors. For example, it is possible that these types of units have fewer errors
because of the nature of the care delivered on these units. Or perhaps the patient populations,
such as outpatient clinics where fewer activities like medication administration occur, might
create fewer opportunities for errors to actually occur. It is also possible that the teams on
these types of units function differently so that the teams communicate more face-to-face or

117
through other informal reporting practices than through the formal error-reporting system.
Ultimately, there is not enough information in the data to clearly determine why these types
of units submitted fewer error reports. However, this finding does suggest that further
research is needed to help explain the differences in error reporting between types of units.
The Relationships between the Two Measures of Error Reporting
In seeking to make sense of the study findings, further statistical analyses were
conducted to determine the relationship between nurses’ perceptions of the frequency of error
reporting on the unit and the number of error reports nurses acknowledged submitting during
the 12-month period preceding the survey. These analyses did not reveal a significant
relationship between the two measures of error reporting, even after controlling for
covariates. On the surface, this suggests that there is a disconnect between nurses’
perceptions of error reporting frequency on the nursing unit and their actual reporting
behavior, to the extent that actual behaviors can be determined via the use of a self-report
measure of error reporting. It may also be that because nurses’ perceptions of error reporting
focused on unit level reporting behaviors, and the estimate of the number of error reports
focused on the individual level of error reporting behavior, nurses viewed these two measures
of error reporting differently.
Thus, measurement issues may explain the difference in findings. Interestingly,
AHRQ (2015) recently released a statement indicating they removed several items from the
newest version 2.0 of the HSOPSC. Two of the items that were changed or removed from
the survey were from the Frequency of Event Reporting Scale (AHRQ, n.d.), used in this
study to measure nurses’ perceptions of error reporting frequency on their unit. This
suggests that there may have been measurement issues related to these two items that

118
prompted AHRQ to remove them from future versions of the survey. Altogether, the
differences in findings between the two measures of error reporting in this study are puzzling
and highlight the need for deeper study of error reporting.
Summary of Major Findings
In summary, this study’s findings demonstrated that safety climate and leader
inclusiveness on unit-level teams positively predicted nurses’ perceptions of error reporting.
Further, the study demonstrated that those same team factors of safety climate and leader
inclusiveness positively affected psychological safety, which in turn positively predicted
nurses’ perceptions of error reporting. Finally, psychological safety mediated the
relationship between the interprofessional relationships dimension of safety climate and
nurses’ perceptions of error-reporting frequency on the unit, as well as the relationship
between leader inclusiveness and nurses’ perceptions of error-reporting frequency on the
unit. Thus, psychological safety helped to explain how these two variables that reflect team
relationships, safety climate-interprofessional relationships, and leader inclusiveness affected
nurses’ perceptions of error-reporting frequency on nursing units in hospitals.
The study findings also demonstrated that the team factors of safety climate, leader
inclusiveness, and psychological safety all negatively predicted the number of error reports
that nurses submitted through error-reporting systems. These findings were surprising
because they do not support the model of work-team learning, which would lead us to believe
that these team factors should positively, not negatively, predict the number of error reports
submitted by nurses. Thus, alternate explanations for the findings were explored. First, there
is the possibility that nurses who work on nursing units with more positive team factors of
leader inclusiveness, safety climate, and psychological safety may choose more informal

119
error reporting methods over submitting error reports through the formal error-reporting
system. Another explanation might be that nursing units with more positive team factors
actually make fewer errors, and therefore they submit fewer error reports because there are
fewer errors that actually occur. Ultimately, the study findings reinforce the complex nature
of error reporting in hospitals that have been reported by others (Lederman et al., 2013).
Altogether, this study’s findings raise important implications for future research.
Limitations
There are a number of limitations in this study that must be addressed. First, the
study used a cross-sectional design to answer the study’s research questions, which means
that the findings reported represent one snapshot in time. This limitation is especially
important to highlight relative to the team factors examined in this study: safety climate,
leader inclusiveness, and psychological safety. It may be that the perceptions and beliefs
held by team members about the nursing team factors examined in the study actually change
over time and their relationship to error reporting could change as well. Thus, there is a need
for future study that investigates team factors over time to establish whether some of the
findings observed in this study remain. Further, the use of mediation analysis implies
causality that cannot be fully supported with cross-sectional, non-experimental data
(MacKinnon & Fairchild, 2009; Wong & Laschinger, 2015). At best, any conclusions about
causality from this study should be viewed cautiously and causation can only be suggested
from the theoretical framework, in combination with the study’s findings (Wong &
Laschinger, 2015). Instead, this study can be used to provide support for and further
elucidate aspects of the underlying theoretical framework and to lay the groundwork for
future study.

120
Second, the study was conducted in a single hospital. As a result, the study findings
are not widely generalizable and should be interpreted cautiously. However, the findings
demonstrate that the nursing unit factors included in this study exert an important effect on
error reporting, and that further study is needed to better tease apart how those factors work
together to influence error reporting. This study provides important information that can
inform the conduct of future study, which will be discussed in the next section.
Third, there were limitations related to measurement of study variables. At the outset
of the study, the intent was to have a perceptual measure of error reporting (i.e., nurses’
perceptions of error-reporting frequency on the unit) and an objective measure of error
reporting (i.e., the actual number of error reports submitted to the error-reporting system at
the study site). However, the study investigator was unable to obtain permission from the
study site hospital to use the actual number of error reports submitted to the error-reporting
system. As a result, the second measure of error reporting was a self-report measure from
study participants, which posed a risk for recall bias because participants were asked to
estimate the number of error reports they submitted over the last year. In addition, the two
measures of error reporting used in the study produced significant but different findings.
Further statistical analysis revealed that the two measures were not related.
There were also problems with other scales in the study. For example, there was no
identified evidence from the literature that the safety climate survey had ever been factor
analyzed. When a factor analysis was performed in this study, there was support for at least
a 2-factor solution. In addition, the 5-item psychological safety scale used in this study had
poor reliability with an initial α = .66. When a single item was removed because study
participants found it confusing and because it had poor inter-item correlation, the Cronbach’s

121
alpha improved to .70. Finally, the leader inclusiveness scale demonstrated high inter-item
correlations suggesting that scale items were redundant. Every scale used in this study was
problematic, which may have affected the study findings and highlights the need for more
valid and reliable measures of the variables of interest.
There were also a number of limitations related to the use of a survey questionnaire
for data collection. Because a survey questionnaire was used to collect data for the study,
there was no opportunity to explore, in particular, why the two measures of error reporting
generated such different results. While the survey included an open-ended question at the
end of the questionnaire that allowed study participants to provide additional information
they wanted the investigator to be aware of, this question did not provide the level of detail
needed to understand the stark difference in results between the two measures of error
reporting. This suggests that qualitative or mixed methods studies would better enable
researchers to understand and explain how team factors influenced error reporting by nurses
and why nurses’ perceptions of error reporting on the unit differ from the number of error
reports they submit.
The questionnaire was offered to participants in paper form or as a web-based survey.
Web-based surveys are an efficient and cost-effective way to collect data, but in order to
ensure anonymity, there was no way to prevent respondents from participating in the survey
multiple times or to ensure that they completed the survey before submission (Heiervang &
Goodman, 2011). As a result, there were a number of surveys in this study that only had
partial responses or missing data. This limitation was addressed in the data analysis by only
using complete responses for the statistical modeling.

122
A final limitation of this study is common method bias, defined as variance from the
method of measurement rather than from the variables themselves (Podsakoff, MacKenzie,
Lee, & Podsakoff, 2003). The greatest risk for common method bias arises from the use of
perceptual measures for both the independent and dependent variables of the study. The
three major independent variables used in the study and one measure of the dependent
variable, nurses’ perceptions of frequency of error reporting on the unit, all used perceptual
measures and all gathered data from the same source, nurses in a single hospital. As a result,
there is a risk of common method bias that represents a threat to validity (Craighead,
Ketchen, Dunn, & Hult, 2011). A number of methods were used to address the risk for
common method bias. First, the survey was anonymous, and participants were encouraged to
answer as honestly as possible. Second, study participants were told that their participation
was voluntary, and they could leave any questions they did not want to answer blank or could
stop the survey at any time. These tactics were used to address the apprehension that
individuals may feel related to participating in the study and to minimize any perceived need
to answer questions in a socially desirable way (Chang, van Witteloostuijn, & Eden, 2010).
Third, there were different measures of the dependent variable for the study, even though
responses from these measures did not come from different sources. By using different types
of measures, participants may not answer in a mindless way, but instead they have to adjust
their response to a different type of question, which may help to address common method
bias (Chang et al., 2010). Finally, more complicated regression models were used, with
some models testing for mediation. The more complex the regression models, the more
unlikely that common method bias is a threat because the relationships examined are outside
what participants would anticipate on their own (Chang et al., 2010).

123
Implications for Practice and Policy
The study findings have important implications for practice as well as policy. First,
the study findings indicated that when safety climate, leader inclusiveness, and psychological
safety were more positive, nurses reported fewer errors, but when those same team factors
were more negative, nurses reported more errors. These findings raise important questions
about how error reports are viewed and utilized by leaders in healthcare organizations. That
is, do hospital administrators view error reports as a way to learn, understand, and improve
processes and outcomes of care? Or do they single out individuals who are involved in
errors? Or do they use error reporting as a way to manage associated risks?
Hospital leaders are encouraged to embrace error reports as a way to improve the
quality and safety of care delivered, which was also advocated over a decade ago by the IOM
(2000). Leaders can do this by communicating with staff about the tangible ways that error
reports are used to improve safety in hospitals so that clinicians understand the value of error
reporting for creating safer healthcare systems and improving care to patients. When
clinicians understand how error reporting improves the safety of care for patients, they are
much more likely to engage in this activity. Hospital leaders should also assess the degree to
which error reporting in their facility is currently used for learning and improvement. It may
be that hospitals need better methods for reviewing errors and implementing changes within
the system to prevent future errors from occurring. Thus, leaders should explore how error
reports are currently used in their hospital and the extent to which this information can better
be used and applied to quality improvement efforts.
Second, it is possible that known barriers to error reporting (e.g., the time-consuming
nature of reporting, knowledge deficits about what constitutes a reportable event) frequently

124
cited by researchers (Hartnell et al., 2012; Jeffe et al., 2004; Kaldjian et al., 2008; Mayo &
Duncan, 2004; Taylor et al., 2004) may help to explain why more positive team factors
resulted in fewer error reports by nurses in this study. Organizations should work to address
known barriers to error reporting while remembering that the goal is not necessarily to
increase the number of formal error reports per se, but rather to foster the appropriate
reporting of errors so that organizational learning and improvement can occur. Thus,
hospital leaders might consider alternate methods of error reporting that work in combination
with existing error reporting systems to provide clinicians with a way to report errors that is
less time consuming and more compatible with their primary focus of patient care. In
addition to existing error reporting systems, some hospitals have successfully implemented
phone error-reporting systems that allow clinicians to call a secure phone number within the
organization and report errors (Jeffe et al., 2004; Kaprielian, Østbye, Warburton, Sangvai, &
Michener, 2008). Quality improvement specialists then review and route the error reports for
further review and analysis by groups within the organization who can create action plans to
improve the system in a way that works to prevent similar errors from reoccurring
(Kaprielian et al., 2008).
Third, this study’s findings raise important questions about the education level of
nurse managers. Specifically, nurses who worked on units where the nurse manager had a
master’s degree or higher acknowledged submitting more error reports. One explanation for
this finding is that nurses who worked for nurse managers with a graduate degree were
exposed to ideas and activities that contributed to their broader understanding of the
importance of error reporting to improving patient care, which translated to greater
perceptions of and engagement in error reporting by these nurses. More research is needed to

125
determine if this is the case, but as organizations look to establish policies that target ways
they can improve the quality and safety of care delivered to patients, considering the effect of
the education level of nurse managers on their nurses may be important in developing
strategies for enhancing safety behaviors on and improving the safety climate of the teams
they lead.
Implications for Future Research
The relationship between the team factors in this study and error reporting are not
well-explained in the current literature, and the findings of this study highlight the difficulty
in explaining exactly how safety climate, leader inclusiveness, and psychological safety
affect error reporting. In part, the inability to explain these relationships is due to the
research design used in the study—a non-experimental, cross-sectional survey design.
Future studies of error reporting should use different designs, such as mixed methods, that
allow researchers to explore and explain how these team factors influence error reporting.
Further, there is a need for studies that use a longitudinal design. By collecting data over
time, studies could minimize the risk of common method bias and help researchers determine
whether the identified effects of the team factors examined in this study are consistent over
time, especially with respect to error reporting. Longitudinal or repeated measures would
also enable mediation testing that allows researchers to better infer causality, which is
beyond the scope of a cross-sectional study.
A second implication for future research is the need for valid and reliable measures
for studying error reporting in hospitals. There were numerous issues identified in the
limitations section that pertain to the measurement scales used in this study. These problems
highlight the need for reliable and theoretically sound measures that accurately reflect error
126
reporting, as well as team factors such as safety climate, leader inclusiveness, and
psychological safety. Without sound methods of measurement, the findings from studies and
the ability of researchers to accurately draw conclusions are seriously threatened. Future
research should thus focus on meeting this need by developing theoretically based and
psychometrically robust measures for studying error reporting.
Another important implication for research is the need for greater clarity in how
errors and error reports are used and interpreted by researchers, which is closely tied to how
errors are measured. There is great diversity in how errors are measured. Some studies
measure errors as clinicians’ perceptions about error reporting frequency (Hillen et al., 2015;
Richter et al., 2014) or the number of error reports submitted to a hospital’s error-reporting
system (Katz-Navon et al., 2005; Vogus & Sutcliffe, 2007), and still others use a
combination of methods to measure errors, such as chart reviews and hospital error reporting
systems (Edmondson, 1996). The findings of this study suggest that nurses’ perceptions of
error reporting are distinct from the number of error reports they submit. Thus, future
researchers should use caution when using and interpreting perceptions of error reporting.
When more robust measures are used (i.e., multiple ways of measuring errors as advocated
by Edmondson, 1996), then stronger conclusions can be drawn that support and expand our
understanding of error reporting as well as safety in hospitals.
This study provides evidence that the nursing team factors of safety climate, leader
inclusiveness, and psychological safety are important to error reporting. However, the exact
relationships of these factors to error reporting are not fully understood based on this study’s
findings. Future research is therefore needed that builds on the findings of this study to

127
include both quantitative and qualitative methodologies, which might better explain how
team factors interact to affect error reporting.
Finally, studies are needed to determine the effects of error reports on organizational
learning and ultimately outcomes of care. While this level of examination was beyond the
scope of the current study, there is evidence to suggest that errors are underreported in
hospitals (Levinson 2012; Sari et al., 2006; Taylor et al., 2004), yet remain essential to
organizational learning in hospitals (Edmondson, 2004; IOM, 2000). Until organizational
researchers can demonstrate that error reports are a vehicle through which organizational
leaders can learn from errors to improve systems of care in a way that future errors are
prevented, there may be little emphasis on using error reporting as a way to learn from
mistakes and provide safer care. Thus, research is needed that establishes a link between
error reports, learning at the team and organizational levels, and important outcomes of care
related to safety and quality.
In summary, this study provides several implications for future research. First, there
is a need for diverse methods of research in hospitals that do not solely rely on survey data
and staff perceptions when studying organizational phenomena. Second, the validity of
measures used in this and other studies of healthcare organizational phenomena indicate a
strong need for more accurate and precise measures of complex variables. Third, this study’s
findings challenge researchers to use more robust measures of error reporting in order to
further the science and our collective understanding about error reporting and patient safety
in hospitals. Fourth, this study’s findings emphasize the importance of further investigations
of the team factors of safety climate, leader inclusiveness, and psychological safety in
relation to error reporting and suggests that different study methodologies that incorporate

128
both quantitative and qualitative data might help to better explain how team factors in
hospitals affect error reporting. Finally, research is needed that establishes a link between
error reports, learning at the team and/or organizational level, and outcomes of care.
Implications of the Findings to Theory
This study’s findings suggest that the team factors investigated in this study, rooted in
the model of work-team learning, are important to the phenomenon of error reporting. The
study findings partially support the model of work-team learning by demonstrating that there
is a positive relationship between safety climate, leader inclusiveness, and psychological
safety. These relationships are important because to the investigator’s knowledge, this is the
first time that the model of work-team learning has been applied to studying nursing teams in
hospitals. The findings of this study reinforce the supposition that team context support and
team leadership behavior are important to the team beliefs about safety purported by the
theoretical model. In addition, the results of the study further support the model by
demonstrating that psychological safety mediates the relationships between one aspect of
safety climate, interprofessional relationships, and nurses’ perceptions of error reporting, as
well as the relationship between leader inclusiveness and nurses’ perceptions of error
reporting.
However, the difference in findings between the two measures of error reporting (i.e.,
perceptions about frequency of error reporting and number of error reports) raises important
questions about the use of the model of work-team learning in studying error reporting.
Based on the study findings, it may be that error reporting is a precursor to team learning
behavior, such that error reporting informs organizations to learn. Future research is needed
to more fully explore the role of error reporting in teams and how teams learn from error

129
reporting. The model of work-team learning introduces important constructs and concepts
for studying error reporting. Future research is needed to more fully understand how those
constructs and concepts relate to error reporting and team learning in nursing units.
Summary and Conclusions
This study demonstrates that the team dynamics of safety climate, leader
inclusiveness, and psychological safety are important to error reporting. This knowledge is
important for nurse and health care leaders and researchers, who can use this study’s findings
as a basis for developing and evaluating improved methods for error reporting and in turn
delivering safe, high-quality, patient care. Error reporting in hospitals is a complex
phenomenon that warrants additional study. Only when the importance of error reporting to
organizational learning is thoroughly examined and better understood will future
improvements in care delivery be achieved. Insights gained from this and future studies can
be used by healthcare leaders to design and implement more effective systems for delivering
safe, high-quality care to patients in hospitals. As continued emphasis is placed on
improving quality and patient safety in hospitals, understanding how to enhance error
reporting is necessary for the purpose of preventing errors and significantly improving the
systems of healthcare delivery.

130
APPENDIX 1: FREQUENCY OF EVENT REPORTING SCALE
Frequency of Event Reporting (AHRQ, n.d.)
Items from the Original Scale Items as Used in the Survey for this Study
1. When a mistake is made, but is caught
and corrected before affecting the patient,
how often is this reported?
1. When an error is made on this unit, but is
caught and corrected before affecting the
patient, how often is it reported?
2. When a mistake is made, but has no
potential to harm the patient, how often is
this reported?
2. When an error is made on this unit, but
has no potential to harm the patient, how
often is it reported?
3. When a mistake is made that could harm
the patient, but does not, how often is this
reported?
3. When an error is made on this unit that
could harm the patient, but does not, how
often is it reported?
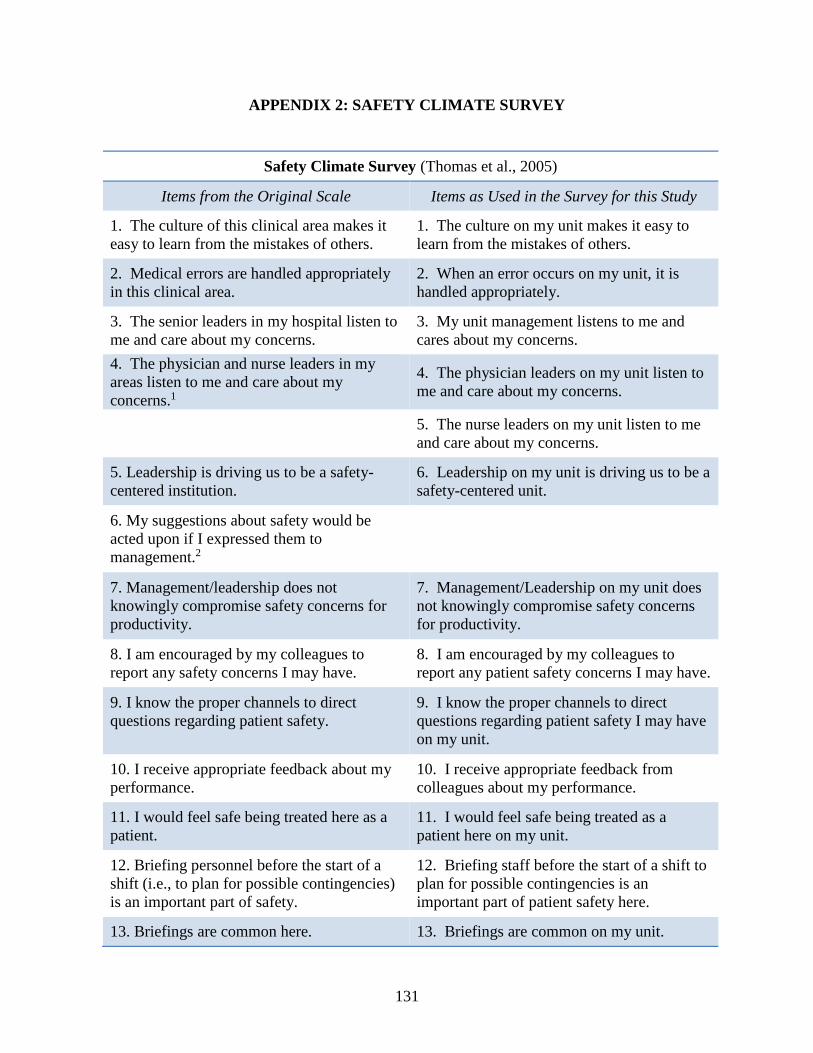
131
APPENDIX 2: SAFETY CLIMATE SURVEY
Safety Climate Survey (Thomas et al., 2005)
Items from the Original Scale Items as Used in the Survey for this Study
1. The culture of this clinical area makes it
easy to learn from the mistakes of others.
1. The culture on my unit makes it easy to
learn from the mistakes of others.
2. Medical errors are handled appropriately
in this clinical area.
2. When an error occurs on my unit, it is
handled appropriately.
3. The senior leaders in my hospital listen to
me and care about my concerns.
3. My unit management listens to me and
cares about my concerns.
4. The physician and nurse leaders in my
areas listen to me and care about my
concerns.1
4. The physician leaders on my unit listen to
me and care about my concerns.
5. The nurse leaders on my unit listen to me
and care about my concerns.
5. Leadership is driving us to be a safety-
centered institution.
6. Leadership on my unit is driving us to be a
safety-centered unit.
6. My suggestions about safety would be
acted upon if I expressed them to
management.2
7. Management/leadership does not
knowingly compromise safety concerns for
productivity.
7. Management/Leadership on my unit does
not knowingly compromise safety concerns
for productivity.
8. I am encouraged by my colleagues to
report any safety concerns I may have.
8. I am encouraged by my colleagues to
report any patient safety concerns I may have.
9. I know the proper channels to direct
questions regarding patient safety.
9. I know the proper channels to direct
questions regarding patient safety I may have
on my unit.
10. I receive appropriate feedback about my
performance.
10. I receive appropriate feedback from
colleagues about my performance.
11. I would feel safe being treated here as a
patient.
11. I would feel safe being treated as a
patient here on my unit.
12. Briefing personnel before the start of a
shift (i.e., to plan for possible contingencies)
is an important part of safety.
12. Briefing staff before the start of a shift to
plan for possible contingencies is an
important part of patient safety here.
13. Briefings are common here. 13. Briefings are common on my unit.

132
Safety Climate Survey (Thomas et al., 2005)
14. I am satisfied with the availability of
clinical leadership (Physician)
14. I am satisfied with the availability of
physician clinical leadership on my unit.
15. I am satisfied with the availability of
clinical leadership (Nursing)
15. I am satisfied with the availability of
nursing clinical leadership on my unit.
16. I am satisfied with the availability of
clinical leadership (Pharmacy)
16. I am satisfied with the availability of
pharmacy clinical leadership on my unit.
17. This institution is doing more for patient
safety now, than it did one year ago.
17. My unit is doing more for patient safety
now than it did one year ago.
18. I believe that most adverse events occur
as a result of multiple system failures, and
are not attributable to one individual’s
actions.1
18. A commonly held belief on this unit is
that most errors occur as a result of multiple
hospital failures.3
19. When errors occur on my unit, they are
generally not attributable to one individual's
actions.
19. The personnel in this clinical area take
responsibility for patient safety.
20. The staff on my unit takes responsibility
for patient safety.
20. Personnel frequently disregard rules or
guidelines that are established for this
clinical area.
21. The staff on my unit frequently
disregards established rules or guidelines.3
21. Patient safety is constantly reinforced as
the priority in this clinical area.
22. Patient safety is constantly reinforced as
the priority on this unit.
Note. 1 This item was changed from 1 item to 2 separate items. 2 When the paper version of the survey
was created, this item was inadvertently eliminated from the survey. The online survey was then created
from the paper version so no data were collected on this item. 3 These items were eliminated from the 2-
factor solution of the survey because they did not meet the requirement of at least .40 factor loadings.

133
APPENDIX 3: DIMENSIONS AND ITEMS OF THE SAFETY CLIMATE SURVEY
Safety Climate Survey
Safety Climate Survey:
Unit Environment
Safety Climate Survey:
Interprofessional Environment
1. Leadership on my unit is driving us to be
a safety-centered unit.
1. I am satisfied with the availability of
physician clinical leadership on my unit.
2. The nurse leaders on my unit listen to me
and care about my concerns.
2. I am satisfied with the availability of
pharmacy clinical leadership on my unit.
3. My unit management listens to me and
cares about my concerns.
3. Briefings are common on my unit.
4. When an error occurs on my unit, it is
handled appropriately.
4. Briefing staff before the start of a shift to
plan for possible contingencies is an
important part of patient safety here.
5. I am satisfied with the availability of
nursing clinical leadership on my unit.
5. The physician leaders on my unit listen to
me and care about my concerns.
6. The culture on my unit makes it easy to
learn from the mistakes of others.
7. I would feel safe being treated as a
patient here on my unit.
8. Management/Leadership on my unit does
not knowingly compromise safety concerns
for productivity.
9. Patient safety is constantly reinforced as
the priority on this unit.
10. The staff on my unit take responsibility
for patient safety.
11. I am encouraged by my colleagues to
report any patient safety concerns I may
have.
12. I receive appropriate feedback from
colleagues about my performance.
13. I know the proper channels to direct
questions regarding patient safety I may
have on my unit

134
Safety Climate Survey
14. My unit is doing more for patient safety
now than it did one year ago.
15. When errors occur on my unit, they are
generally not attributable to one individual's
actions.

135
APPENDIX 4: INCLUSIVE LEADERSHIP SCALE
Inclusive Leadership (Carmeli et al., 2010)
Items from the Original Scale Items as Used in the Survey for this Study
1. The manager is open to hearing new
ideas.
1. The manager on my unit is open to hearing
new ideas.
2. The manager is attentive to new
opportunities to improve work processes.
2. The manager on my unit is attentive to new
opportunities to improve work processes.
3. The manager is open to discuss the
desired goals and new ways to achieve them.
3. The manager on my unit is open to discuss
desired goals and new ways to achieve them.
4. The manager is available for consultation
on problems.
4. The manager on my unit is available for
consultation on problems.
5. The manager is an ongoing ‘presence’ in
this team—someone who is readily
available.
5. The manager is an ongoing presence on my
unit—someone who is readily available.
6. The manager is available for professional
questions I would like to consult with
him/her.
6. The manager on my unit is available to
discuss professional questions on which I
would like to consult with him/her on.
7. The manager is ready to listen to my
requests.
7. The manager on my unit is ready to listen
to my requests.
8. The manager encourages me to access
him/her on emerging issues.
8. The manager on my unit encourages me to
access him/her on emerging issues.
9. The manager is accessible for discussing
emerging problems.
9. The manager on my unit is accessible for
discussing emerging problems.

136
APPENDIX 5: PSYCHOLOGICAL SAFETY SCALE
Psychological Safety (Edmondson, 1999)
Items from the Original Scale Items as Used in the Survey for this Study
1. Members of this team are able to bring up
problems and tough issues.
1. I am able to bring up problems and discuss
tough issues with others on my unit.
2. People on this team sometimes reject
others for being different.
2. People on my unit sometimes reject or
ignore others for being different.
3. It is safe to take a risk on this team. 3. It is safe to take a risk on my unit.1
4. It is difficult to ask other members of this
team for help.
4. It is easy for me to ask other members on
my unit for help.
5. No one on this team would deliberately
act in a way that undermines my efforts.
5. No one I work with would deliberately act
in a way that undermines my efforts.
6. If you make a mistake on this team, it is
often held against you
7. Working with members of this team, my
unique skills and talents are valued and
utilized.
Note. 1 After data collection, this item was removed because of comments from study
participants that they found this item confusing. Further, the item had poor inter-item correlation
with other items in the scale.

137
APPENDIX 6: NURSE CONSENT TO PARTICIPATE
This research study invites registered nurses working on patient care units at UNC Hospitals to
help us understand the ways the nursing work environment and other factors influence error
reporting. You are one of almost 3,000 nurses invited to complete the survey, which forms the
basis of my doctoral dissertation at the UNC-Chapel Hill School of Nursing.
There are no known risks, benefits, or costs to you for participating in this study. Taking part in
this research is not a part of your University duties, and refusing will not affect your job. You
will not be offered or receive any special job-related consideration if you take part in this
research. Your responses will be confidential; no one will be able to identify you or your
answers, and no one will know whether or not you participated. Data will be reported only in
aggregate. The information you and other nurses provide will help us understand the factors that
influence nurse error reporting, as well as quality and safety in hospitals.
The survey takes most people about 10 minutes to complete. Your participation is completely
voluntary and you can skip any question you choose not to answer. The completion of the
survey indicates your consent to participate.
Thank you for your participation. If you have any questions about the study, please contact me
by email at [email protected] or my dissertation chair, Dr. Cheryl Jones, at
If you have any questions about your rights as a research participant, you may contact the
University of North Carolina Institutional Review Board at [email protected] and mention
study number 15-0229.

138
APPENDIX 7: NURSE MANAGER CONSENT TO PARTICIPATE
This research study invites all nurse managers of patient care units at UNC Hospitals to
participate in a study examining how the nursing work environment and other factors influence
error reporting. You are one of almost 50 nurse managers invited to complete the survey, which
forms the basis of my doctoral dissertation at the UNC-Chapel Hill School of Nursing.
There are no known risks, benefits, or costs to you for participating in this study. Taking part in
this research is not a part of your University duties, and refusing will not affect your job. You
will not be offered or receive any special job-related consideration if you take part in this
research. Your responses are confidential. Data will be reported only in aggregate, no individual
nurse managers or patient care units will be identified. The information you provide will help us
understand how nursing work force factors may influence nurse error reporting, as well as
quality and safety in hospitals.
The survey takes most people about 5 minutes to complete. Your participation is completely
voluntary and you can skip any question you choose not to answer. The completion of the
survey indicates your consent to participate.
Thank you for your participation. If you have any questions about the study, please contact me
by email at [email protected] or my dissertation chair, Dr. Cheryl Jones, at
If you have any questions about your rights as a research participant, you may contact the
University of North Carolina Institutional Review Board at [email protected] and mention
study number 15-0229.

139
APPENDIX 8: SAMPLE CHARACTERISTICS
Variables n M (SD) % Minimum Maximum
Nurse Characteristics
Highest Nursing Education
Diploma 24 3.0%
ADN 179 22.3%
BSN 549 68.4%
MSN 48 6.0%
Doctorate 3 0.4%
Nurse Experience (years) 786 11.7 (10) <1 51
Nurse Tenure (years) 777 6.1 (6.3) <1 39
Nursing Unit Characteristics
Highest Nurse Manager Education
BSN 25 54.4%
Any master's degree 20 43.5%
Doctorate 1 2.2%
Nurse Manager Tenure (years) 43 5.3 (4.8) <1 26
Unit Size
Number of RN Employees 49 39.9 (28.7) 9 162
Number of RN FTEs 43 36.0 (25.5) 6.8 137
Type of Unit
Medical/Surgical 13 26.5%
ICU 6 12.2%
Specialty 18 36.7%
Other 12 24.5%
Note. ADN: Associate Degree in Nursing; BSN: Bachelor of Science in Nursing; MSN: Master of
Science in Nursing; RN: Registered Nurse; FTEs: Full Time Equivalents; ICU: Intensive Care Units

140
APPENDIX 9: DESCRIPTIVE STATISTICS FOR VARIABLES IN THE STUDY
Variables n M (SD) Minimum Maximum
Dependent Variables
Error reporting (perceived)
876 3.4 (0.9) 1 5
Error reporting (# of reports submitted)
924
1.9 (3.5)
0
40
Independent Variables
Safety Climate-
Unit Environment
Interprofessional Relationships
824
822
3.9 (0.7)
3.7 (0.8)
1.6
1
5
5
Leader Inclusiveness 847 4.0 (1.0) 1 5
Psychological Safety 842 3.9 (0.7) 1.3 5

141
APPENDIX 10: PEARSON CORRELATION COEFFICIENTS FOR CONTINUOUS
STUDY VARIABLES AND COVARIATES1
Variables 1 2 3 4 5 6 7 8 9 10
1 Error Reports —
Safety Climate
2 - Unit Environment .39* —
3 - Interprofessional
Relationships .37* .58* —
4 Leader Inclusiveness .23* .76* .43* —
5 Psychological Safety .24* .61* .36* .39* —
6 Nurse Experience .07 .04 .004 .11* .04 —
7 Nurse Tenure .003 .06 .01 .16* .04 .65* —
8 Nurse Manager
Tenure .02 .08* .06 .11* .08* .01 .08* —
9 Unit Size
(#RN employees) .02 .19* .07 .15* .10* .07 .22* — —
10 Unit Size (#RN
FTEs) .01 .21* .07 .20* .12* .07 .23* — — —
Note. RN: Registered Nurse, FTE: Full Time Equivalents; 1 Sample population represents nurse
responses and ranged from 671 to 859; *p < .05.

142
APPENDIX 11: PEARSON CORRELATION COEFFICIENTS FOR NURSING UNIT
LEVEL COVARIATES1
Variables 1 2 3
1. Nurse Manager Tenure —
2. Unit Size (# RN Employees) .22 —
3. Unit Size (# RN FTEs) .21 .96* —
Note. RN: Registered Nurse, FTE: Full Time Equivalents; 1 Sample population represents nursing unit level
responses, N = 43; *p < .05.

143
APPENDIX 12: COVARIATE ANALYSIS FOR PSYCHOLOGICAL SAFETY
Covariate
n
r
df
Estimated
Slope
t
value
p
value
Nurse Educationa
- Diploma 842 840 0.01 0.08 .94
- ADN 842 840 -0.04 -0.65 .52
- BSN 842 840 0.04 0.81 .42
- MSN or higher degree 842 840 0.05 0.49 .63
Nurse Experienceb 779 .04 .27
Nurse Tenureb 770 -.04 .30
Nurse Manager Educationc
- BSN 811 47 0.04 0.49 .62
- Master’s or higher 811 47 -0.01 -0.11 .91
Nurse Manager Tenurec 687 38 -0.01 -0.71 .48
Sizec
-Number of RNs 781 44 -0.002 -1.23 .23
-Number of FTEs 687 38 -0.003 -1.73 .09
Type of Unitc
- Medical/Surgical 811 47 -0.02 -0.25 .80
- ICU 811 47 -0.04 -0.32 .75
- Specialty 811 47 -0.04 -0.47 .64
- Other 811 47 0.11 1.08 .29 Note. df = degrees of freedom; ADN: Associate Degree in Nursing; BSN: Bachelor of Science in Nursing; MSN:
Master of Science in Nursing; RN: Registered Nurse; FTEs: Full Time Equivalents; ICU: Intensive Care Unit; a
Standard t test for each covariate value one at a time; b Standard Pearson Correlation Coefficient for each of the
covariates; c Linear mixed models with random effects models to account for within unit correlation used to assess
each covariate value one at a time.

144
APPENDIX 13: COVARIATE ANALYSIS FOR NURSE PERCEPTIONS OF ERROR
REPORTING
Covariate
n
r
df
Estimated
Slope
t
value
p
value
Nurse educationa
- Diploma 876 874 0.37 1.97 .049
- ADN 876 874 0.12 1.51 .13
- BSN 876 874 -0.10 -1.52 .13
- MSN or higher degree 876 874 0.04 0.31 .76
Nurse experienceb 779 -.07 .05
Nurse tenureb 770 .003 .93
Nurse manager
educationc
- BSN 845 47 -0.22 -2.62 < .01
- Master’s or higher 845 47 0.20 2.24 .03
Nurse manager tenurec 715 38 0.01 0.55 .58
Sizec
-Number of RNs 814 44 -0.001 -1.01 .32
-Number of FTEs 715 38 -0.001 -0.71 .49
Type of unitc
- Medical/Surgical 845 47 -0.12 -1.23 .23
- ICU 845 47 -0.20 -1.73 .09
- Specialty 845 47 0.06 0.62 .54
- Other 845 47 0.22 2.22 .31
Note. df = degrees of freedom; ADN: Associate Degree in Nursing; BSN: Bachelor of Science in Nursing; MSN:
Master of Science in Nursing; RN: Registered Nurse; FTEs: Full Time Equivalents; ICU: Intensive Care Unit; a
Standard t test for each covariate value one at a time; b Standard Pearson Correlation Coefficient for each of the
covariates; c Linear mixed models with random effects models to account for within unit correlation used to assess
each covariate value one at a time.

145
APPENDIX 14: COVARIATE ANALYSIS FOR THE NUMBER OF ERROR REPORTS
SUBMITTED BY NURSES
Covariates
n
df
Estimated
Slope
SE
Z
Score
95% CI
p
value LL UL
Nurse educationa
- Diploma 924 1 -0.21 .17 1.64 -0.54 0.11 .20
- ADN 924 1 -0.01 .06 0.05 -0.13 0.11 .82
- BSN 924 1 -0.003 .05 0.00 -0.10 0.10 .95
- MSN or higher 924 1 0.44 .09 26.0 0.27 0.61 <.01
Nurse experiencea 784 1 0.01 .003 3.56 -0.0002 0.01 .07
Nurse tenurea 775 1 -0.02 .004 27.9 -0.03 -0.01 <.01
Nurse managerb
Education
- BSN 891 -0.59 .22 -2.71 -1.02 -0.16 <.01
- Master’s or
higher
891 0.87 .21 4.13 0.45 1.28 <.01
Nurse manager
tenureb
755
-0.003 .02 -0.11 -0.05 0.04 .91
Sizeb
- Number of RNs 859 0.002 .003 0.67 -0.004 0.01 .50
- Number of FTEs 755 0.01 .01 0.90 -0.01 0.01 .37
Type of unitb
- Medical/Surgical 891 -0.31 .27 -1.46 -0.72 0.11 .14
- ICU 891 0.11 .29 0.38 -0.45 0.67 .71
- Specialty 891 0.50 .25 1.95 -0.002 0.99 .05
- Other 891 -0.49 .22 -2.23 -1.07 -0.06 .03
Note. df = degrees of freedom; SE = standard error; CI = confidence interval; LL = lower limit, UL = upper limit;
ADN = Associate Degree in Nursing; BSN = Bachelor of Science in Nursing; MSN = Master of Science in Nursing;
RN = Registered Nurse; FTEs = Full Time Equivalents; a Poisson Regression used to assess each covariate value
one at a time; b Poisson Regression with GEE models to account for within unit correlation used to assess each
covariate values one at a time.

146
APPENDIX 15: THE INDIRECT EFFECT OF SAFETY CLIMATE AND LEADER
INCLUSIVENESS ON ERROR REPORTING1 THROUGH PSYCHOLOGICAL
SAFETY
Mediation Analysis
n
Estimated
Slope
SE
Z
score
95% CI
p
value LL UL
Step 1
Safety Climate-Unit
Environment
784 -0.22 .08 -2.59 -0.38 -0.05 <.01
Safety Climate-
Interprofessional
Environment
784 -0.34 .11 -3.20 -0.54 -0.13 <.01
Leader Inclusiveness 784 -0.18 .07 -2.55 -0.32 -0.04 .01
Step 2
Safety Climate-Unit
Environment
784 0.68 .03 20.78 — — <.01
Safety Climate-
Interprofessional
Environment
784 0.36 .03 10.90 — — <.01
Leader Inclusiveness 784 0.27 .03 10.53 — — <.01
Step 3
Safety Climate-Unit
Environment
Psychological Safety
784 -0.14
-0.11
.09
.10
-1.63
-1.07
-0.31
-0.31
0.03
0.09
.11
.28
Safety Climate-
Interprofessional
Environment
Psychological Safety
784 -0.31
-0.07
.11
.10
-2.76
-0.68
-0.54
-0.25
-0.09
0.12
<.01
.50
Leader Inclusiveness
Psychological Safety
784 -0.15
-0.11
.07
.09
-2.11
-1.24
-0.30
-0.29
-0.01
0.07
.03
.21
Note. 1Error reporting: The number of error reports submitted by nurses over a 12-month period.
SE = standard error; CI = confidence interval; LL = lower limit, UL = upper limit.

147
APPENDIX 16: THE INDIRECT EFFECT OF SAFETY CLIMATE AND LEADER
INCLUSIVENESS ON ERROR REPORTING1 THROUGH PSYCHOLOGICAL
SAFETY WITH SIGNIFICANT COVARIATES
Mediation Analysis
n
Estimate
SE
Z
score
95% CI
p
value LL UL
Step 1
Safety Climate-Unit
Environment
736 -0.22 .09 -2.60 -0.39 -0.05 <.01
-Tenure 736 -0.02 .01 -2.24 -0.03 -0.002 <.03
-Nurse Manager Education
(master’s degree or above)
736 0.84 .20 4.14 0.44 1.23 <.01
Safety Climate-
Interprofessional
Environment
736 -0.34 .08 -4.16 -0.49 -0.18 <.01
-Tenure 736 -0.02 .01 -2.40 -0.03 -0.003 .01
-Nurse Manager Education
(master’s degree or above)
736 0.87 .21 4.16 0.46 1.28
Leader Inclusiveness 736 -0.20 .06 3.34 -0.32 -0.08 <.01
-Nurse Manager Education
(master’s degree or above)
736 0.89 .20 4.24 0.47 1.27 <.01
Step 2
Safety Climate-Unit
Environment
736 0.69 .03 20.28 — — <.01
Safety Climate-
Interprofessional
Relationships
736 0.36 .03 10.53 — — <.01
Leader Inclusiveness 736 0.29 .11 10.79 — — <.01
Step 3
Safety Climate-Unit
Environment
736 -0.12 .08 -1.45 -0.28 0.04 .15
Psychological Safety 736 -0.14 .11 -1.36 -0.35 0.06 .17
-Tenure 736 -0.02 .01 -2.25 -0.04 -0.003 .03
-Nurse Manager Education
(master’s degree or above)
736 .85 .21 4.13 .45 1.26 <.01
Safety Climate-
Interprofessional
Relationships
736 -0.30 .08 -3.74 -0.46 -0.14 <.01
Psychological Safety 736 -0.09 .09 -0.95 -0.27 0.10 .34
-Tenure 736 -0.02 .01 -2.43 -0.03 -0.004 .02

148
Mediation Analysis
n
Estimate
SE
Z
score
95% CI
p
value LL UL
-Nurse Manager Education
(master’s degree or above)
736 0.87 .21 4.18 0.46 1.28 <.01
Leader Inclusiveness 736 -0.17 .06 -2.65 -0.28 -0.05 <.01
Psychological Safety 736 -0.12 .09 -1.27 -0.30 0.07 .21
-Nurse Manager Education
(master’s degree or above)
736 0.87 .20 4.27 0.47 1.26 <.01
Note. 1Error reporting: The number of error reports submitted by nurses over a 12-month period. SE = standard
error; CI = confidence interval; LL = lower limit, UL = upper limit.

149
APPENDIX 17: THE EFFECT OF NURSES’ PERCEPTIONS OF ERROR REPORTING
ON THE NUMBER OF ERROR REPORTS SUBMITTED
n
Estimated
Slope
SE
Z
score
95% CI p
value LL UL
Model 1
Error Reporting (Perceptions) 842 -0.07 .06 -1.19 -0.19 0.05 .23
Model 1 with Covariates
Error Reporting (Perceptions) 742 -0.12 .06 -1.89 -0.25 0.004 .06
Tenure -0.02 .01 -2.21 -0.04 -0.002 .03
Nurse Manager Education:
Master’s degree or higher
0.90 .20 4.45 0.50 1.20 <.01
Note. SE = standard error; CI = confidence interval; LL = lower limit, UL = upper limit.

150
REFERENCES
Agency for Healthcare Research and Quality. (n.d.). Hospital survey on patient safety culture:
Items and dimensions. Retrieved May 3, 2013, from Agency for Healthcare Research and
Quality: http://www.ahrq.gov/legacy/qual/patientsafetyculture/hospdim.pdf
Agency for Healthcare Research and Quality. (2015, March). Update on the Hospital Survey on
Patient Safety Culture. Retrieved January 27, 2016, from Agency for Healthcare
Research and Quality: Advancing Excellence in Health Care:
http://www.ahrq.gov/sites/default/files/wysiwyg/professionals/quality-patient-
safety/patientsafetyculture/hospital/update/crosswalk_v1-v2.pdf
Agency of Healthcare Research and Quality. (2014). Voluntary patient safety event reporting
(Incident Reporting). Retrieved January 11, 2016, from PSNet: Patient Safety Network:
https://psnet.ahrq.gov/primers/primer/13
Aiken, L. H., Cimiotti, J. P., Sloane, D. M., Smith, H. L., Flynn, L., & Neff, D. (2011). Effects of
nurse staffing and nurse education on patient deaths in hospitals with different nurse
work environments. Medical Care, 49,1047–1053.
Aiken, L. H., Clarke, S. P., Cheung, R. B., Sloane, D. M., & Silber, J. H. (2003). Educational
levels of hospital nurses and surgical patient mortality. JAMA, 290, 1617–1623.
American Hospital Association. (2013). AHA Data: Healthcare Viewer Quick Report. Health
Forum, LLC.
Argyris, C. (1976). Single-loop and double-loop models in research on decision making.
Administrative Science Quarterly, 21, 363–375.
Argyris, C., & Schön, D. A. (1996). Organizational learning II: Theory, method, and practice.
Reading, MA: Addison-Wesley.
Bae, S. H., Kelly, M., Brewer, C., & Spencer, A. (2014). Analysis of nurse staffing and patient
outcomes using comprehensive nurse staffing characteristics in acute care nursing units.
Journal of Nursing Care Quality, 29, 318–326.
Baer, M., & Frese, M. (2003). Innovation is not enough: Climates for initiative and
psychological safety, process innovations, and firm performance. Journal of
Organizational Behavior, 24, 45–68.
Baron, R. M., & Kenny, D. A. (1986). The moderator-mediator variable distinction in social
psychological research: Conceptual, strategic and statistical considerations. Journal of
Personality and Social Psychology, 51, 1173–1183.
Bartel, A. P., Beaulieu, N. D., Phibbs, C. S., & Stone, P. W. (2014). Human capital and
productivity in a team environment: Evidence from the healthcare sector. American
Economic Journal: Applied Economics, 6, 231–259.

151
Blegen, M. A., Vaughn, T. E., & Goode, C. J. (2001). Nurse experience and education: Effect on
quality of care. JONA: The Journal of Nursing Administration, 31, 33–39.
Blegen, M. A., Gearhart, S., O’Brien, R., Sehgal, N. L., & Alldredge, B. K. (2009). AHRQ's
Hospital Survey on Patient Safety Culture: Psychometric analsyses. Journal of Patient
Safety , 5 (3), 139–144.
Bresman, H., & Zellmer-Bruhn, M. (2013). The structural context of team learning: Effects of
organizational and team structure on internal and external learning. Oranization Science,
1120–1139.
Brueller, D., & Carmeli, A. (2011). Linking capacities of high-quality relationships to team
learning and performance in service organizations. Human Resource Management, 50,
455–477.
Bunderson, J. S., & Boumgarden, P. (2010). Structure and learning in self-managed teams: Why
"bureaucratic" teams can be better learners. Organization Science, 21, 609–624.
Canon, M. D., & Edmondson, A. C. (2005). Failing to learn and learning to fail (Intelligently):
How great organizations put failure to work to innovate and improve. Long Range
Planning, 38, 299–319.
Carmeli, A., Brueller, D., & Dutton, J. E. (2009). Learning behaviours in the workplace: The role
of high-quality interpersonal relationships and psychological safety. Systems Research
and Behavioral Science, 26, 81–98.
Carmeli, A., Reiter-Palmon, R., & Ziv, E. (2010). Inclusive leadership and employee
involvement in creative tasks in the workplace: The mediating role of psychological
safety. Creativity Research Journal, 22, 250–260.
Castel, E. S., Ginsburg, L. R., Zaheer, S., & Tamim, H. (2015). Understanding nurses' and
physicians' fear of repercussions for reporting errors: Clinician characteristics,
organization demographics, or leadership factors? BMC Health Services Research, 15
(326), 1–10.
Chang, S. J., van Witteloostuijn, A., & Eden, L. (2010). From the editors: Common method
variance in international business research. Journal of International Business Studies , 41,
178–184
Chen, G., Kirkman, B. L., Kanfer, R., Allen, D., & Rosen, B. (2007). A multilevel study of
leadership, empowerment, and performance in teams. Journal of Applied Psychology, 92,
331–346.
Chlang, H. Y., Lin, S. Y., Hsu, S. C., & Ma, S. C. (2010). Factors determining hospital nurses'
failures in reporting medication errors in Taiwan. Nursing Outlook, 58, 17–25.
Cohen, J. (1992). A power primer. Psychological Bulletin, 112, 155–159.

152
Cohen, J., Cohen, P., West, S. G., & Aiken, L. S. (2003). Applied multiple regression/correlation
analysis for the behavioral sciences (3rd ed.). New York: Routledge.
Colla, J. B., Bracken, A. C., Kinney, L. M., & Weeks, W. B. (2005). Measuring patient safety
climate: A review of surveys. Quality & Safety in Health Care, 14, 364–366.
Cooper, M. D. (2000). Towards a model of safety culture. Safety Science, 36, 111–136.
Craighead, C. W., Ketchen, D. J., Dunn, K. S., & Hult, T. M. (2011). Addressing common
method variace: Guidelines for survey research on information technology, operations,
and supply chain management. IEEE Transaction on Engineering Managment, 58, 578–
588.
de Cordova, P. B., Phibbs, C. S., Schmitt, S. K., & Stone, P. W. (2014). Night and day in the
VA: Associations between night shift staffing, nurse workforce characteristics, and length
of stay. Research in Nursing & Health Policy, 37, 90–97.
de Feijter, J. M., de Grave, W. S., & Koopmans, R. P. (2012). Informal learning from error in
hospitals: What do we learn, how do we learn and how can informal learning be
enhanced? A narrative review. Advances in Health Sciences Education, 1–12.
Denison, D. (1995). What is the difference between organizational culture and organizational
climate? A native's point of view on a decade of paradigm wars. The Academy of
Management Review, 21, 619–654.
Der, G., & Everitt, B. S. (2006). Statistical analysis of medical data using SAS. Boca Raton, FL:
Chapman & Hall/CRC.
Derickson, R., Fishman, J., Osatuke, K., Teclaw, R., & Ramsel, D. (2015). Psychological safety
and error reporting within Veterans Health Administration Hospitals. Journal of Patient
Safety, 11, 60–66.
DeVellis, R. F. (2003). Scale development: Theory and applications. Thousand Oaks, CA: Sage.
Dillman, D. A., Smyth, J. D., & Christian, L. M. (2009). Internet, mail, and mixed-mode surveys:
The tailored design method (Third ed.). Hoboken, NJ: John Wiley & Sons, Inc.
Edmondson, A. (1999). Psychological safety and learning behavior in work teams.
Administrative Science Quarterly, 44, 350–383.
Edmondson, A. C. (1996). Learning from mistakes is easier said than done: Group and
organizational influences on detection and correction of human error. Journal of Applied
Behavioral Science, 32 (1), 5–28.
Edmondson, A. C. (2003). Speaking up in the operating room: How team leaders promote
learning in interdisciplinary action teams. Journal of Management Studies, 40, 1419–
1452.

153
Edmondson, A. C. (2004). Learning from failure in health care: Frequent opportunities,
pervasive barriers. Quality and Safety in Health Care, 13 (Suppl II), ii3–ii9.
Edmondson, A. C., & Lei, Z. (2014). Psychological safety: The history, renaissance, and future
of an interpersonal construct. Annual Review of Organizational Behavior, 1, 23–43.
Edmondson, A. C., & McManus, S. E. (2007). Methodological fit in management field research.
Academy of Management Review, 32, 1155–1179.
Espin, S., Lingard, L., Baker, G. R., & Regehr, G. (2006). Persistence of unsafe practice in
everyday work: An exploration of organizational and psychological factors constraining
safety in the operating room. Quality and Safety in Health Care, 15, 165–170.
Espin, S., Regehr, G., Levinson, W., Baker, G. R., Biancucci, C., & Lingard, L. (2007). Factors
influencing perioperative nurses' error reporting preferences. AORN Journal, 85, 527–
543.
Espin, S., Wickson-Griffiths, A., Wilson, M., & Lingard, L. (2010). To report or not to report: A
descriptive study exploring ICU nurses' perceptions of error and error reporting. Intensive
and Critical Care Nursing, 26 (1), 1–9.
Farley, D. O., Haviland, A. M., Haas, A. C., & Pham, C. (2010). Adverse event reporting
practices by U.S. hospitals: Survey results from 2005 and 2009. RAND Health.
Fasolino, T., & Snyder, R. (2012). Linking nurse characteristics, team member effectiveness,
practice environment, and medication error incidence. Journal of Nursing Care Quality,
27 (2), E9–E16.
Fritz, M. S., & MacKinnon, D. P. (2007). Required sample size to detect the mediated effect.
Psychological Science, 18, 233–239.
Garrouste-Orgeas, M., Philippart, F., Bruel, C., Max, A., Lau, N., & Misset, B. (2012). Overview
of medical errors and adverse events. Annals of Intensive Care, 2 (2), 1–9.
Ghosh, R., Shuch, B., & Petrosko, J. (2012). Emotional intelligence and organizational learning
in work teams. Journal of Management Development, 31, 603–619.
Glick, W. H. (1985). Conceptualizing and measuring organizational and psychological climate:
Pitfalls in multilevel research. The Academy of Management Review, 10, 601–616.
Hartnell, N., MacKinnon, N., Sketris, I., & Fleming, M. (2012). Identifying, understanding and
overcoming barriers to medication reporting in hospitals: A focus group study. BMJ
Quality and Safety, 21, 361–368.
Hauck, W. W., Giliss, C. L., Donner, A., & Gortner, S. (1991). Randomization by cluster.
Nursing Research, 40, 356–358.

154
Heiervang, E., & Goodman, R. (2011). Advantages and limitations of web-based surveys:
Evidence from a child mental health survey. Social Psychiatry and Psychiatric
Epidemiology, 46 (1), 69–76.
Helmreich, R. L. (2000). On error management: Lessons from aviation. British Medical Journal,
320, 781–784.
Hewitt, T. A., & Chreim, S. (2015). Fix and forget or fix and report: A qualitative study of
tensions at the front line of incident reporting. BMJ Quality & Safety, 24, 303–310.
Hillen, H., Pfaff, H., & Hammer, A. (2015). The association between transformational leadership
in German hospitals and the frequency of events reported as perceived by medical
directors. Journal of Risk Research, 1–17.
Hirak, R., Peng, A. C., Carmeli, A., & Schaubroeck, J. M. (2012). Linking leader inclusiveness
to work unit performance: The improtance of psychological safety and learning from
failures. The Leadership Quarterly, 23 (1), 107–117.
Hoffman, D. A., & Mark, B. (2006). An investigation of the relationship between safety climate
and medication errors as well as other nurse and patient outcomes. Personnel Psychology,
59, 847–869.
Holden, R. J., & Karsh, B. (2007). A review of medical error reporting system design
considerations and a proposed cross-level systems research framework. The Journal of
Human Factors and Ergonomics, 49, 257–276.
Hung, C. C., Chu, T. P., Lee, B. O., & Hsiao, C. C. (2015). Nurses' attitude and intention of
medication administration error reporting. Journal of Clinical Nursing (Online Edition),
1–9.
Institute of Medicine. (2000). To err is human. (L. T. Kohn, J. M. Corrigan, & M. S. Donaldson,
Eds.) Washington, D.C.: National Academy Press.
Jeffe, D. B., Dunagan, W. C., Garbutt, J., Burroughs, T. E., Gallagher, T. H., Hill, P. R., . . .
Fraser, V. J. (2004). Using focus groups to understand physicians' and nurses'
perspectives on error reporting in hospitals. Joint Commission Journal on Quality and
Safety, 30, 471–479.
Kagan, I., & Barnoy, S. (2013). Organizational safety culture and medical error reporting by
Israeli nurses. Journal of Nursing Scholarship, 45, 273–280.
Kaldjian, L. C., Jones, E. W., Wu, B. J., Froman-Hoffman, V. L., Levi, B. H., & Rosenthal, G. E.
(2008). Reporting medical errors to improve patient safety: A survey of physicians in
teaching hospitals. Archives of Internal Medicine, 168 (1), 40–46.
Kaprielian, V., Østbye, T., Warburton, S., Sangvai, D., & Michener, L. (2008). A system to
describe and reduce medical errors in primary care. In K. Henriksen, J. B. Battles, M. A.
Keyes, & M. L. Grady (Eds.), Advances in Patient Safety: New Directions and Alternative

155
Approaches (Vol. 1: Assessment). Rockville, MD: Agency for Healthcare Research and
Quality.
Kark, R., & Carmeli, A. (2009). Alive and creating: The mediating role of vitality and aliveness
in the relationship between psychological safety and creative work involvement. Journal
of Organizational Behavior, 30, 785–804.
Katz-Navon, T., Naveh, E., & Stern, Z. (2005). Safety climate in health care organizations: A
multidimensional approach. The Academy of Management Journal, 48, 1075–1089.
Kho, M. E., Carbone, J. M., Lucas, J., & Cook, D. J. (2005). Safety climate survey: Reliability of
results from a multicenter ICU survey. Quality and Safety in Health Care, 14, 273–278.
Knott, M. J. (2009, May 17). Toward a model and measure of self-perception of team learning
beliefs and behaviors in a sample of undergraduate business students. Doctoral
Dissertation . George Washington University.
Ko, Y., & Yu, S. (2015). The relationships among perceived patients' safety culture, intention to
report errors, and leader coaching behavior of nurses in Korea: A pilot study. Journal of
Patient Safety, Online before print, 1–9.
Kostopoulos, K. C., & Bozionelos, N. (2011). Team exploratory and eploitative learning:
PSychological safety, task conflict, and team performance. Group & Organizational
Management, 36, 385–415.
Kozlowski, S. W., & Klein, K. J. (2000). A multilevel approach to theory and research in
organziations: Contextual, temporal, and emergent processes. In K. J. Klein, & S. W.
Kozlowski, Multilevel theory, research, and methods in organizations (pp. 3–90). San
Francisco: Jossey-Bass.
Kraemer, H. C., Kiernan, M., Essex, M., & Kupfer, D. J. (2008). How and why criteria defining
moderators and mediators differ between the Baron & Kenny and MacArthur approaches.
Health Psychology, 27, S101–S108
Lau, D. C., & Murnighan, J. K. (2005). Interactions within groups and subgroups: The effects of
demographic faultlines. Academy of Management Journal, 48, 645–659.
Leape, L. L. (2002). Reporting of adverse events. New England Journal of Medicine, 347, 1633–
1638.
Lederman, R., Dreyfus, S., Matchan, J., Knott, J. C., & Milton, S. K. (2013). Electronic error-
reporting systems: A case study into the impact on nurse reporting of medical errors.
Nursing Outlook, 61, 417–426.
Leppa, C. J. (1996). Nurse relationships and work group disruption. The Journal of Nursing
Administration, 26 (10), 23–27.

156
Leroy, H., Anseel, F., Halbesleben, J. R., Savage, G. T., Dierynck, B., Simons, T., . . . Sels, L.
(2012). Behavioral integrity for safety, priority of safety, psychological safety, and
patient safety: A team-level study. Journal of Applied Psychology, 97, 1273–1281.
Levinson, D. R. (2012). Hospital incident reporting systems do not capture most patient harm.
Washington DC: Office of the Inspector General.
Levitt, B., & March, J. G. (1988). Organizational learning. Annual Review of Sociology, 14, 319–
340.
Liang, K. Y., & Zeger, S. L. (1993). Regression analysis for correlated data. Annual Review of
Public Health, 14, 43–68.
MacKinnon, D. P., & Fairchild, A. J. (2009). Current directions in mediation analysis. Current
Directions in Psychological Science, 18 (1), 16–20.
MacKinnon, D. P., Lockwood, C. M., & Williams, J. (2004). Confidence limits for the indirect
effect: Distribution of the product and resampling methods. Multivariate Behavioral
Research, 39, 99–128
Mahajan, R. P. (2010). Critical incident reporting and learning. British Journal of Anaestesia,
105 (1), 69–75.
Mayo, A., & Duncan, D. (2004). Nurse perceptions of medicaiton errors: What we need to know
for patient safety. Journal of Nursing Care Quality, 19, 209–217.
Mearns, K. J., & Flin, R. (1999). Assessing the state of organizational safety: Culture or climate?
Current Psychology, 18 (1), 5–17.
Milch, C., Salem, D. N., Pauker, S. G., Lundquist, T. G., Kumar, S., & Chen, J. (2006).
Voluntary electronic reporting of medical errors and adverse events: An analysis of
92,547 reports from 26 acute care hospitals. Journal of General Internal Medicine, 21,
165–170.
Mitchell, I., Schuster, A., Smith, K., Pronovost, P., & Wu, A. (2016). Patient safety incident
reporting: A qualitative study of thoughts and perceptions of experts 15 years after 'To
Err is Human'. BMJ Quality and Safety, 25, 92–99.
Naveh, E., Katz-Navon, T., & Stern, Z. (2005). Treatment errors in healthcare: A safety climate
approach. Management Science, 51, 948–960.
Naveh, E., Katz-Navon, T., & Stern, Z. (2006). Readiness to report medical treatment errors: The
effect of safety procedures, safety information, and priority of safety. Medical Care,
44(2), 117–123.
Needleman, J., Buerhaus, P., Pankratz, S. V., Leibson, C. L., & Stevens, S. (2011). Nurse
staffing and inpatient hospital mortality. The New England Journal of Medicine, 364,
1037–1045.

157
Nembhard, I. M., & Edmondson, A. C. (2006). Making it safe: The effects of leader
inclusiveness and professional status on psychological safety and improvement efforts in
health care teams. Journal of Organizational Behavior, 27, 941–966.
Netemeyer, R. G., Bearden, W. O., & Sharma, S. (2003). Scaling procedures: Issues and
applications. Thousand Oaks, CA: Sage.
Newman, D. A. (2014). Missing data: Five practical guidelines. Organizational Research
Methods, 17, 372–411.
O’Reilly, C. A., Chatman, J., & Caldwell, D. F. (1991). People and organizational culture: A
profile comparison approach to assessing person-organization fit. The Academy of
Management Journal, 34, 487–516.
Ortega, A., Sanchez-Manzanares, M., Gil, F., & Rico, R. (2013). Enhancing team learning in
nursing teams through beliefs about interpersonal context. Journal of Advanced Nursing,
69, 102–111.
Pearsall, M. J., & Ellis, P. J. (2011). This as thieves: The effects of ethical orientation and
psychological safety on unethical team behavior. Journal of Applied Psychology, 96,
401–411.
Peyre, H., Leplege, A., & Coste, J. (2011). Missing data methods for dealing with missing items
in quality of life questionnaires. A comparison by simulation of personal mean score, full
information maximum likelihood, multiple imputation, and hot deck techniques applied
to the SF-36 in the French 2003 decennial health survey. Quality of Life Research, 20,
287–300.
Pfeiffer, Y., Briner, M., Wehner, T., & Manser, T. (2013, November 12). Motivational
antecedents of incident reporting: Evidence from a survey of nurses and physicians. Swiss
Medical Weekly, 1–11.
Pham, J. C., Girard, T., & Pronovost, P. J. (2013). What to do with healthcare incident reporting
systems. Journal of Public Health Research, 2, 154–159.
Pinkerton, S. (2005). From the editor: Patient safety culture. Health Care Management Review,
30 (1), 1.
Podsakoff, P. M., MacKenzie, S. B., Lee, J. Y., & Podsakoff, N. P. (2003). Common method
biases in behavioral research: A critical review of the literature and recommended
remedies. Journal of Applied Psychology, 88, 879–903.
Preacher, K. J., & Hayes, A. F. (2004). SPSS and SAS procedures for estimating indirect effects
in simple mediation models. Behavior Research Methods, Instruments, & Computers, 36,
717–731.
Pronovost, P., & Sexton, B. (2005). Accessing safety culture: Guidelines and recommendations.
Quality and Safety in Health Care, 14, 231–233.

158
Reason, J. (1998). Achieving a safe culture: Theory and practice. Work & Stress, 12, 293–306.
Reason, J. (2000). Human error: Models and management. BMJ, 329, 768–770.
Reason, J. (2008). The human contribution: Unsafe acts, accidents and heroic recoveries.
Surrey, England: Ashgate Publishing Unlimited.
Richter, J. P., McAlearney, A. S., & Pennell, M. L. (2014). Evaluating the effect of safety culture
on error reporting: A comparison of managerial and staff perspectives. American Journal
of Medical Quality, 30, 550–558.
Robinson, Z., & Hughes, R. G. (2008). Error reporting and disclosure. In R. Hughes, Patient
safety and quality: An evidence-based handbook for nurses (pp. 1–47). Rockville, MD:
Agency for Healthcare Research and Quality.
Roth, P. L., Switzer, F. S., & Switzer, D. M. (1999). Missing data in multiple item scales: A
Monte Carlo analysis of missing data techniques. Organizational Research Methods, 2,
211–232.
Rothschild, J. M., Hurley, A. C., Landrigan, C. P., Cronin, J. W., Martell-Waldrop, K., Foskett,
C., . . . Bates, D. W. (2006). Recovery from medical errors: The critical care nursing
safety net. Jounral on Quality and Patient Safety, 32(2), 65–72.
Russo, M., Buonocore, F., & Ferrara, M. (2015). Motivational mechanisms influencing error
reporting among nurses. Journal of Managerial Psychology, 30, 118–132.
Sari, A. B., Sheldon, T. A., Cracknell, A., & Turnbull, A. (2006). Sensitivity of routine system
for reporting patient safety incidents in NHS hospital: Retrospective patient case not
review. BMJ .
Schneider, B., Ehrhart, M. G., & Macey, W. H. (2013). Organizational climate and culture.
Annual Review of Psychology, 64, 361–388.
Schwappach, D. L., & Gehring, K. (2015). Frequency of and predictors for witholding patient
safety concerns among oncology staff: A survey Study. European Journal of Cancer
Care, 24, 395–403.
Shah, P. S., Mirea, L., Solimano, A., & Lee, S. K. (2015). Association of unit size, resource
utilization and occupancy with outcomes of preterm infants. Journal of Perinatology, 35,
522–529.
Shrout, P. E., & Bolger, N. (2002). Mediation in experimental and nonexperimental studies:
New procedures and recommendations. Psychological Methods, 7, 422–445.
Sorra, J. S., & Dyer, N. (2010). Multilevel psychometric properties of the AHRQ hospital survey
on patient safety culture. BMC Health Services Research, 10 (199), 1–13.

159
Stratton, K. M., Blegen, M. A., Pepper, G., & Vaughn, T. (2004). Reporting of medication errors
by pediatric nurses. Journal of Pediatric Nursing, 19, 385–392.
Tang, F., Sheu, S., Yu, S., Wei, I., & Chen, C. (2007). Nurses relate the contributing factors
involved in medication errors. Journal of Clinical Nursing, 16, 447–457.
Tavakol, M., & Dennick, R. (2011). Making sense of Cronbach’s alpha. International Journal of
Medical Education, 2, 53–55.
Taylor, J. A., Brownstein, D., Christakis, D. A., Blackburn, S., Strandjord, T. P., Klein, E. J., &
Shafii, J. (2004). Use of incident reports by physicians and nurses to document medical
errors in pediatric patients. PEDIATRICS, 114, 729–735.
Thomas, E. J., Sexton, J. B., Neilands, T. B., Frankel, A., & Helmreich, R. L. (2005). The effect
of executive walk rounds on nurse safety climate attitudes: A randomized trial of clinical
units. BMC Health Services Research, 5(28), 1–9.
Thompson, J., & Fairchild, R. (2013). Does nurse manager education really matter? Nursing
Management, 44(9), 10–14.
Throckmorton, T., & Etchegaray, J. (2007). Factors affecting incident reporting by registered
nurses: The relationship of perceptions of the environment for reporting errors,
knowledge of the nursing practice act, and demographics on intent to report errors.
Journal of PeriAnesthesia Nursing, 22, 400–412.
Tucker, A., & Edmondson, A. (2003). Why hospitals don’t learn from failures: Organizational
and psychological dynamics that inhibit system change. California Management Review,
45(2), 55–72.
Unver, V., Tastan, S., & Akbayrak, N. (2012). Medication errors: Perspectives of newly
graduated and experienced nurses. International Journal of Nursing Practice, 18, 317–
324.
Van Bogaert, P., Timmermans, O., Weeks, S. M., van Heusden, D., Wouters, K., & Franck, E.
(2014). Nursing unit teams matter: Impact of unit-level nurse practice environment, nurse
work characteristics, and burnout on nurse reported job outcomes, and quality of care,
and patient adverse events-A cross-sectional survey. International Journal of Nursing
Studies, 51, 1123–1134.
Van den Bossche, P. V., Gijselaers, W. H., Segers, M., & Kirschner, P. A. (2006). Factors
driving teamwork in collaborative learning environments: Team learning beliefs and
behaviors. Small Group Research, 37, 490–521.
Van Dyck, C., Dimitrova, N. G., de Korne, D. F., & Hiddema, F. (2013). Walk the talk: Leaders’
enacted priority of safety, incident reporting, and error management. Health Care
Management, 14, 95–117.

160
VanGeest, J., & Johnson, T. P. (2011). Surveying nurses: Identifying strategies to improve
participation. Evaluation & Health Professions, 34, 487–511.
Vogt, W. P., & Johnson, R. B. (2011). Dictionary of statistics & methodology: A nontechnical
guide for the social sciences (4th ed.). Thousand Oaks, CA: SAGE.
Vogus, T. J., & Sutcliffe, K. M. (2007). The impact of safety organizing, trusted leadership, and
care pathways on reported medication errors in hospital nursing units. Medical Care, 45,
997–1002.
Vogus, T. J., Sutcliffe, K. M., & Weick, K. E. (2010). Doing no harm: Enabling, enacting, and
elaborating a culture of safety in health care. Academy of Management Perspectives, 24,
60–77.
Wageman, R., Gardner, H., & Mortensen, M. (2012). The changing ecology of teams: New
directions for teams research. Journal of Organizational Behavior, 33, 301–315.
Westbrook, J., Rob, M., Woods, A., & Parry, D. (2011). Errors in the administration of
intravenous medications in hospital and the role of correct procedures and nurse
experience. BMJ Quality & Safety, 20, 1027–1034.
Williams, S. D., Phipps, D. L., & Ashcroft, D. M. (2013). Understanding the attitudes of hospital
pharmacists to reporting medication incidents: A qualitative study. Research in Social
and Administrative Pharmacy, 9 (1), 80–89.
Wong, C. A., & Laschinger, H. K. (2015). The influence of frontline manager job strain on
burnout, commitment and turnover intention: A cross-sectional study. International
Journal of Nursing Studies, 52, 1824–1833.
Yoder-Wise, P. S., Scott, E. S., & Sullivan, D. T. (2013). Expanding leadership capacity:
Educational levels for nurse leaders. JONA: The Journal of Nursing Administration, 43,
326–328.
Zaheer, S., Ginsburg, L., Chuang, Y., & Grace, S. L. (2015). Patient safety climate perceptions
of frontline staff in acute care hospitals: Examining the role of ease of reporting, unit
norms of openness, and participative leadership. Health Care Management Review, 40
(1), 13–23.
Zuckerman, H. S., & Dowling, W. L. (1994). The managerial role. In S. M. Shortell, & A. D.
Kaluzny, Health Care Management (3rd ed.). Clifton Park, NY: Delmar
Top Related