


Languages
Pages
Legal

Task 3.2 – (Land Use)/Spatial Indicators of Vulnerable communities
Friday 27th April 2012
Patrik Karlsson Nyed GIS analyst, KU
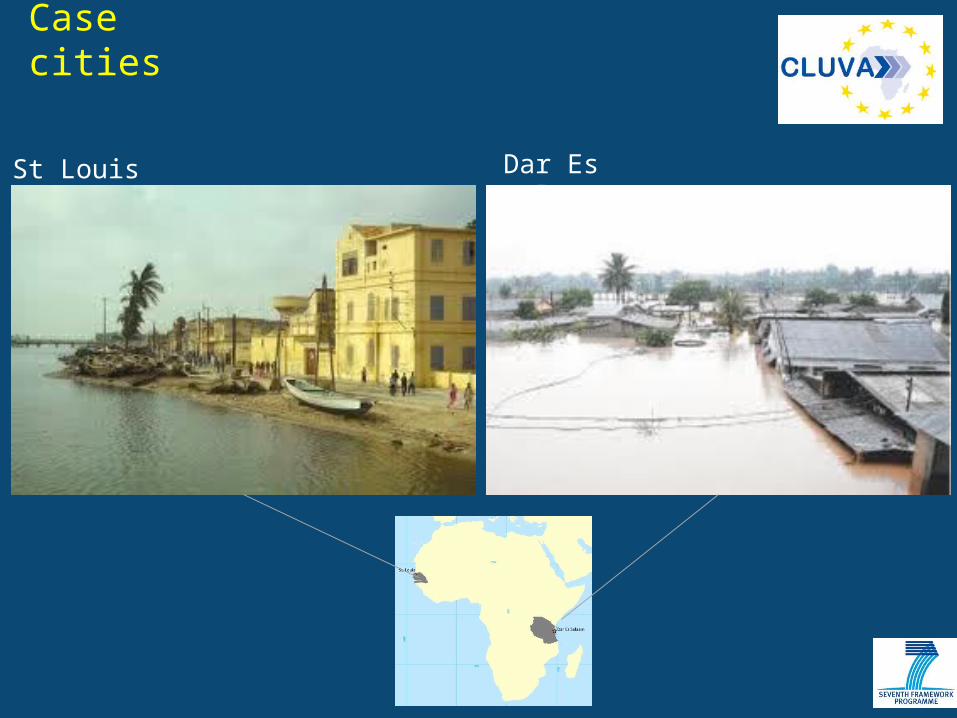
Case cities
St Louis Dar Es Salaam

Main objectives
• Reveal spatial indicators which are relating to the vulnerability of communities.
• Map vulnerable communities and high risk areas.
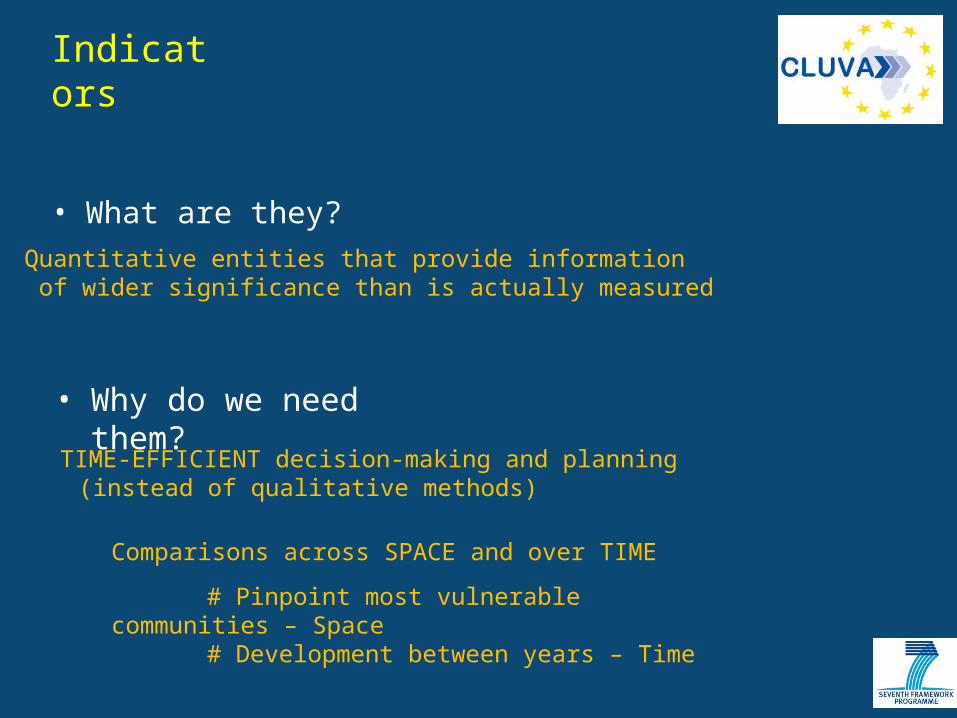
Indicators
• What are they?Quantitative entities that provide information of wider significance than is actually measured
TIME-EFFICIENT decision-making and planning (instead of qualitative methods)
Comparisons across SPACE and over TIME
# Pinpoint most vulnerable communities – Space# Development between years – Time
• Why do we need them?

Task 3.2 – Workflow indicatorsInventory
First selectionHazard-type relevant
Second selectionSite-specific
Check data availability
Geodata processingAnalysis/Validation
Map making
Sharing with stakeholders
Expert surveyLiterature study
Local expert surveyRanking/Weighting?
African partnersOther sources (e.g. WWW)OOA (Digitizing/Segmentation)
Field surveysPurchase Decide MMU
Reduction indicatorsVulnerability Index
1
2a
2b
3
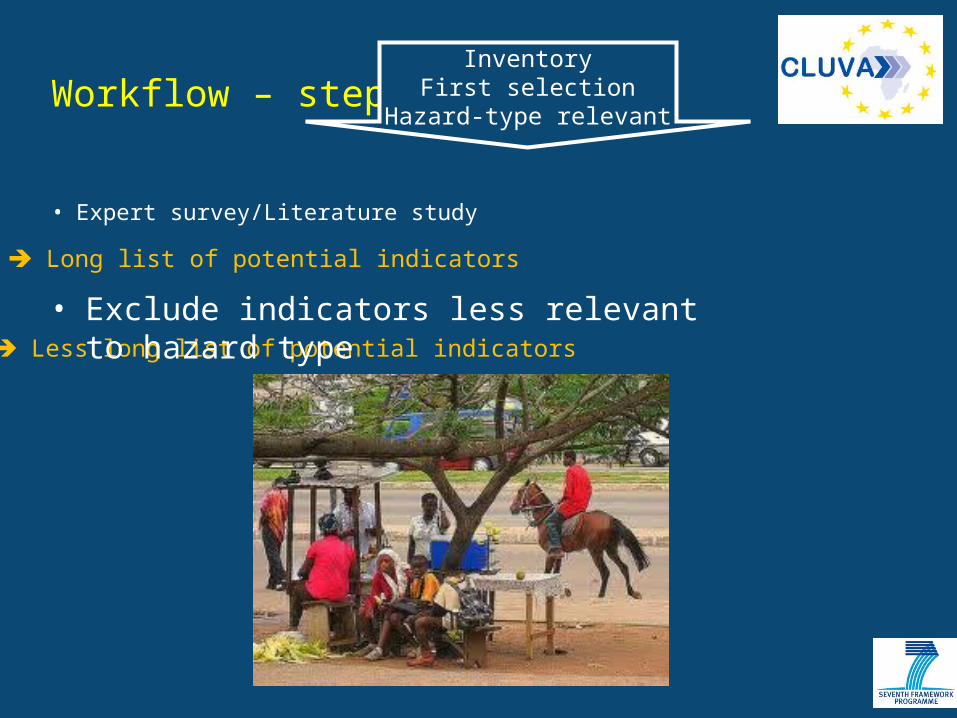
Workflow – step 1
• Expert survey/Literature study Long list of potential indicators
Less long list of potential indicators
• Exclude indicators less relevant to hazard type
InventoryFirst selection
Hazard-type relevant

Workflow – step 2a Second selectionSite-specific
• Local expert survey
Less long list of potential indicators
Short list of potential indicators
Municipality officials and University staff Community representatives
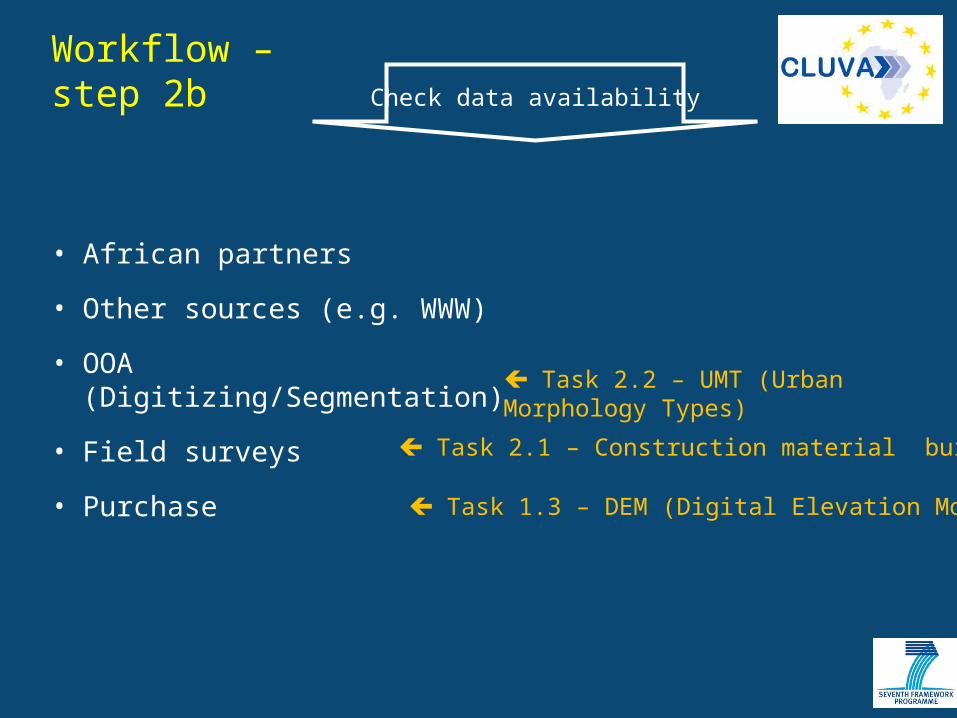
Workflow – step 2b Check data availability
• African partners
• Other sources (e.g. WWW)
• OOA (Digitizing/Segmentation)
• Field surveys
• Purchase
Task 2.2 – UMT (Urban Morphology Types)
Task 2.1 – Construction material buildings
Task 1.3 – DEM (Digital Elevation Models)
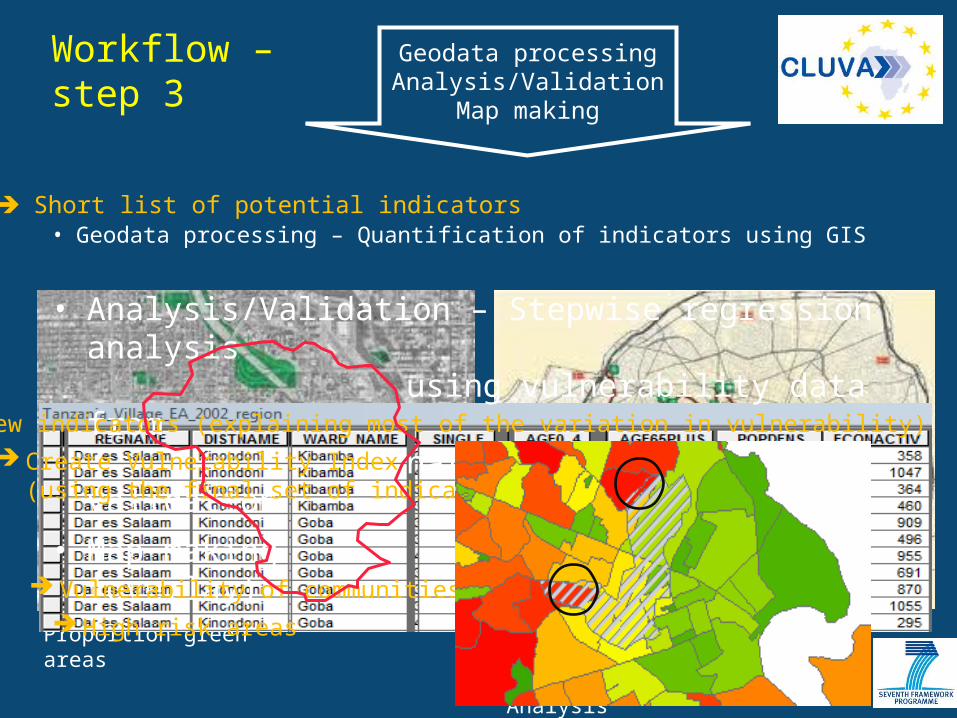
Workflow – step 3
• Geodata processing – Quantification of indicators using GIS
Geodata processingAnalysis/Validation
Map making
Short list of potential indicators
Mobility/Accessibility-Network Analysis
Proportion green areas
• Analysis/Validation – Stepwise regression analysis using vulnerability data from national census as validation
A few indicators (explaining most of the variation in vulnerability)
• Map making (overlay)
Create Vulnerability Index (using the final set of indicators)
Vulnerability of communities High risk areas
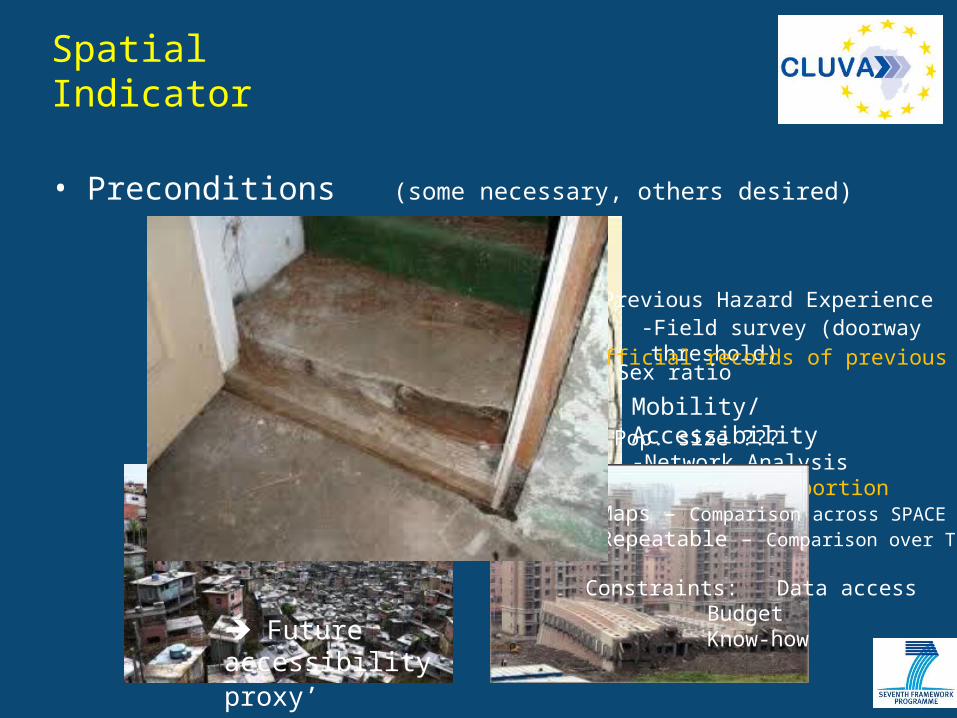
Spatial Indicator
• Preconditions (some necessary, others desired)
- Quantifiable in space
- Express variation
- Comprehensible
- Valid (measure what it is intended to)
- Achievable?
‘Short-cut proxy’
Mobility/Accessibility-Network Analysis
Proportion paved roads
- Field survey (doorway threshold) Official records of previous flood areas
Previous Hazard Experience
Sex ratio
Pop. size ???
Maps – Comparison across SPACERepeatable – Comparison over TIME
Constraints: Data accessBudgetKnow-how Future accessibility

Thanks for the attention
Top Related