


Languages
Pages
Legal

SYNTHESIS OF CONDUCTING BLOCK COPOLYMERS AND THEIR USE IN THE IMMOBILIZATION OF INVERTASE AND POLYPHENOL
OXIDASE ENZYME
A THESIS SUBMITTED TO THE GRADUATE SCHOOL OF NATURAL AND APPLIED SCIENCES
OF THE MIDDLE EAST TECHNICAL UNIVERSITY
BY
SENEM KIRALP
IN PARTIAL FULFILLMENT OF THE REQUIREMENTS FOR THE DEGREE OF
DOCTOR OF PHILOSOPHY
IN
THE DEPARTMENT OF CHEMISTRY
MAY 2004
ii
Approval of the Graduate School of Natural and Applied Sciences
Prof. Dr. Canan Özgen Director
I certify that this thesis satisfies all the requirements as a thesis for the degree of
Doctor of Philosophy.
Prof. Dr. Hüseyin İşçi Head of Department
This is to certify that we have read this thesis and that in our opinion it is fully
adequate, in scope and quality, as a thesis for the degree of Doctor of
Philosophy
Prof. Dr. Levent Toppare Supervisor
Examining Committee Members
Prof. Dr. Levent Toppare
Prof. Dr. Teoman Tinçer
Prof. Dr. Ufuk Bakır
Prof. Dr. Leyla Aras
Prof. Dr. Yusuf Yağcı
iii
ABSTRACT
SYNTHESIS OF CONDUCTING BLOCK COPOLYMERS AND THEIR USE
IN THE IMMOBILIZATION OF INVERTASE AND POLYPHENOL
OXIDASE ENZYMES
Kıralp, Senem
Ph.D., Department of Chemistry
Supervisor: Prof. Dr. Levent Toppare
May 2004, 121 pages
A new thiophene derivative containing menthyl group (MM) was
synthesized and polymerized via chemical and electrochemical methods.
Polymers obtained and MM itself were used to synthesize copolymers with
pyrrole under conditions of constant potential electrolysis. Cyclic Voltammetry,
thermal analysis and scanning electron microscopy analyses were performed for
the characterization of samples.
Immobilization of invertase and polyphenol oxidase enzymes was
performed in the matrices obtained via copolymerization of MM with pyrrole.
Immobilization was carried out via entrapment of enzyme in matrices during the
polymerization of pyrrole. Temperature optimization, operational stability and
shelf-life of the enzyme electrodes were investigated. Maximum reaction rate
(Vmax) and Michaelis-Menten constant (Km) were determined.

iv
It is known that wine includes phenolic groups that give astringency in
high concentrations. Polyphenol oxidase (PPO) converts mono and diphenols to
quinone. By analyzing the product, one can find out the amount of phenolic
groups. By using obtained enzyme electrodes via immobilization of PPO,
amount of phenolics in different wines were analyzed.
Keywords: Electrochemical polymerization, immobilization, invertase,
polyphenol oxidase, wine.
v
ÖZ
İLETKEN KOPOLİMERLERDE İNVERTAZ VE POLİFENOL OKSİDAZ
ENZİMLERİNİN TUTUKLANMASI
Kıralp, Senem
Doktora, Kimya Bölümü
Tez Yöneticisi: Levent Toppare
Mayıs 2004, 121 sayfa
Mentil grubu içeren yeni bir tiyofen türevi sentezlendi (MM) ve bu
monomer kimyasal ve elektrokimyasal yolla polimerleştirildi. MM kullanılarak
pirolle iletken kopolimerler elde edildi. Kopolimerleştirme hem sabit akım
hemde sabit gerilim altında gerçekleştirildi. Elde edilen kopolimerlerin
karakterizasyonu, dönüşümlü voltametre, taramalı elektron mikroskobu ve
termal analizlerle yapıldı.
MM kullanılarak elde edilen kopolimerler invertaz ve polifenol oksidaz
tutuklamaları için kullanıldı. Enzim elektrotlarının optimum sıcaklıkları,
kararlılıkları ve raf ömürleri tayin edildi. Kinetik parametreleri de ayrıca
incelendi.
Polifenol oksidaz enzimi kullanılarak elde edilen enzim elektrotları
şaraplarda bulunan ve fazla miktarı şarabın acılaşmasına sebep olan fenolik

vi
yapıların miktar tayininde kullanıldı. Türkiye’de üretilen iki farklı kırmızı
şarabın fenolik miktar analizleri yapıldı.
Anahtar Kelimeler: Elektrokimyasal polimerleşme, enzim tutuklaması, invertaz,
polifenol oksidaz, şarap.

vii
To My Parents
ACKNOWLEDGMENTS
I would like to express appreciation to my supervisor Prof. Dr.
Levent Toppare for his guidance and encouragement throughout this thesis.
I wish to express my sincere thanks to Prof. Dr. Yusuf Yagcı and Prof.
Dr. Ufuk Bakır for their valuable discussions and help throughout this study.
I also wish to express my endless thanks to my family especially to my
sister Seda Kıralp, for her patience, moral support and encouragement.
I would like to give my special thanks to Semih Seyyidoğlu for being my
best friend and for his moral support.
I also want to thank to every member in our group for their friendship.
Finally I want to thank with my entire heart to my love Uygar Kayahan
for his continuous support, understanding and being near me whenever I want. I
could not achieve anything without his love and trust.
Appreciation is extended to colleques in the Department of Chemistry,
Middle East Technical University.

ix
TABLE OF CONTENTS
ABSTRACT ........................................................................................................................iii
ÖZ.........................................................................................................................................v
ACKNOWLEDGMENTS.................................................................................................viii
TABLE OF CONTENTS .................................................................................................... ix
LIST OF TABLES ............................................................................................................xiii
LIST OF FIGURES...........................................................................................................xiv
CHAPTERS
I. INTRODUCTION………………………………………………………………….1
1.1. Conducting Polymers………………………………………………………..1
1.1.1. Historical Riview of Conducting Polymers…………………………..1
1.1.2. Principle Structure and Types of Conductive Polymers……………...3
1.1.3. Band theory and Conduction Mechanism in Conducting
Polymers ............................................................................................. ….5
1.1.3.1. Band Theory of Solids……………………………………………7
1.1.3.2. Conduction Mechanism…………………………………………..9
1.1.3.3. Movement of the Charge Carrier Through Polypyrrole………….10
1.1.4. Synthesis of Conducting Polymers…………………………………..12

x
1.1.4.1. Chemical Synthesis………………………………………………12
1.1.4.2. Electrochemical Synthesis……………………………………….13
1.1.5. Conducting Copolymers …………………………………………….15
1.1.6. Characterization of Conducting polymers…………………………...16
1.1.6.1. Cyclic Voltammetry……………………………………………..17
1.1.7. Applications of Conducting Polymers ……………………………...17
1.2. Enzymes…………………………………………………………………….18
1.2.1. EnzymeNomenclature……………………………………………….20
1.2.2. Enzyme Kinetics……………………………………………………..22
1.2.2.1. Michaelis-Menten Equation …………………………………….23
1.2.2.2. Linweaver- Burk Plot …………………………………………..28
1.2.3. Enzyme Immobilization……………………………………………..30
1.2.3.1. Benefits of Enzyme Immobilization…………………………….30
1.2.3.2.Immobilization Methods…………………………………………31
1.2.4. Invertase……………………………………………………………...36
1.2.5. Polyphenol oxidase (Tyrosinase)…………………………………….37
1.2.6. Phenolics in Wines…………………………………………………...40
1.3. Aim of the Study…………………………………………………………….42
2. EXPERIMENTAL……………………………………………………………....43
2.1. Chemicals…………………………………………………………………...43
2.2. Instrumentation……………………………………………………………...44
2.2.1. Electrolysis…………………………………………………………...44
2.2.2. Cyclic Voltammetry (CV) System…………………………………...46
2.2.3. Conductivity Measurements………………………………………….49
xi
2.2.4. Thermal Analysis……………………………………………………..51
2.2.5. Nuclear Magnetic Resonance Spectrometer………………………….51
2.2.6. Fourier Transform Infrared Spectrophotometer (FTIR)……………...51
2.2.7. Scanning Electron Microscope (SEM)……………………………….51
2.2.8. UV- Visible Spectrophotometry……………………………………..52
2.3. Experimental Procedures…………………………………………………….52
2.3.1. Synthesis of Menthyl Containing Thiophene Monomer (MM)………52
2.3.2. Synthesis of copolymers of MM……………………………………...53
2.3.2.1.Synthesis of copolymers of MM with pyrrole……………………53
2.3.2.2.Synthesis of copolymers of MM with thiophene…………………53
2.3.3. Chemical Polymerization of MM (CN)………………………………54
2.3.4. Galvanostatic Polymerization of MM (GDM)………………………..55
2.3.5. Synthesis of Block Copolymers of CN and GDM with Pyrrole……...55
2.3.6. Synthesis of monomer MBTA………………………………………..56
2.3.7. Immobilization of Enzymes…………………………………………..57
2.3.7.1.Immobilization of Invertase………………………………………57
2.3.7.1.1. Preparation of Enzyme Electrodes in Copolymers of
MM…………………………………………………………..57
2.3.7.1.2. Determination of Invertase Activity……………………...58
2.3.7.1.3. Kinetic Parameters for immobilized Invertase…………...59
2.3.7.1.4. Determination of Optimum Temperature for
Immobilized Invertase……...………………………………..59
2.3.7.1.5. Determination of Operational and Storage Stability
for immobilized Invertase……………………………………59
xii
2.3.7.1.6. Morphologies of Invertase-Entrapped Films…………..60
2.3.7.2.Immobilization of Polyhenol Oxidase (PPO)………………….60
2.3.7.2.1. Preparation of Enzyme Electrodes in Copolymers of
MM………………………………………………………..60
2.3.7.2.2. Preparation of Enzyme Electrodes in Copolymers of
MBTA……………………………………………………..61
2.3.7.2.3. Determination of PPO Activity………………………...61
2.3.7.2.4. Kinetic Parameters for Free and Immobilized PPO........63
2.3.7.2.5. Determination of Optimum Temperature and pH of
Immobilized PPO……………………………………........63
2.3.7.2.6. Determination of Operational and Storage Stability
Immobilized PPO…………………………………………63
2.3.7.2.7. Morphologies of PPO Entrapped Films……………......64
2.3.7.2.8. Protein Determination …………...……………………64
2.3.7.2.9. Determination of Amount of Phenolic Compounds in Red
Wines………………………………………………...........65
3. RESULTS AND DISCUSSION……………………………………………….66
3.1. Synthesis and Characterization of Menthyl Ester of 3-Thiophene Acetic
Acid………………………………………………………………………..66
3.2. Chemical Polymerization of MM (CN)…………………………………...69
3.3. Galvanostatic Polymerization of MM (GDM)…………………………....71
3.4. Conducting Copolymers…………………………………………..............72
3.4.1. Copolymers of MM with Thiophene…...……………………….....72
3.4.2. Copolymers of MM with Pyrrole ……………………………….....73
xiii
3.4.3. Block Copolymers of CN and GDM with Pyrrole (CNPP, CNPS,
PGDM)…………………………………………………………….74
3.4.4. Characterization of Conducting Copolymers of Pyrrole………..74
3.4.4.1.Cyclic voltammetry………………………………………....74
3.4.4.2.FTIR………………………………………………………....74
3.4.4.3.Thermal Analysis…………………………………………....75
3.4.4.4. Morphologies of the Films……………………………….....80
3.4.4.5.Conductivity Measurements……..………………………….83
3.5. Immobilization of Invertase………………………………….................83
3.5.1. Immobilization of Invertase …………………………………….83
3.5.1.1.Morphologies of Films………………………………………84
3.5.1.2.Kinetic Parameters………………………………………......84
3.5.1.3.Effect of Temperature…………………………………….....87
3.5.1.4.Operation Stability………………………………………......88
3.5.1.5.Shelf-Life……………………………………………………88
3.5.2. Immobilization of PPO (Tyrosinase)……………………………91
3.5.2.1.Tyrosinase Activity……………………………………….....91
3.5.2.2.Protein Determination……………………………………….92
3.5.2.3.Kinetic Parameters………………………………………......93
3.5.2.4.Morphologies of Films………………………………………94
3.5.2.5.Effect of Temperature on Enzyme Activity………………...97
3.5.2.6.Effect of pH on Enzyme Activity……………………………99
3.5.2.7.Operational Stability of Enzyme Electrodes…………….....102
3.5.2.8.Shelf-Life of Enzyme Electrodes………………………..…104

xiv
3.5.2.9.Determination of Phenolic Compounds in Red Wines……106
4. CONCLUSION…………………………………………………………...108 REFERENCES………………………………………………………………..110 VITA………………………………………………………………………….117
xv
LIST OF FIGURES
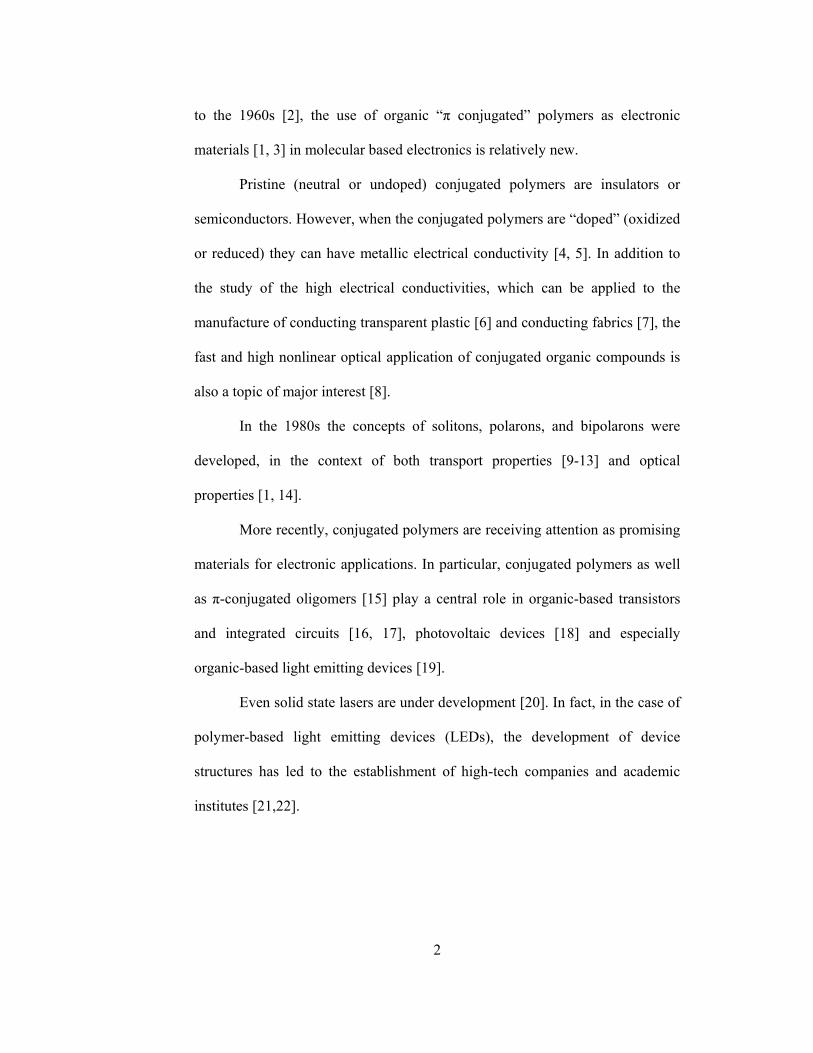
1.1 Structure of the repeat units of several conjugated polymers….................4
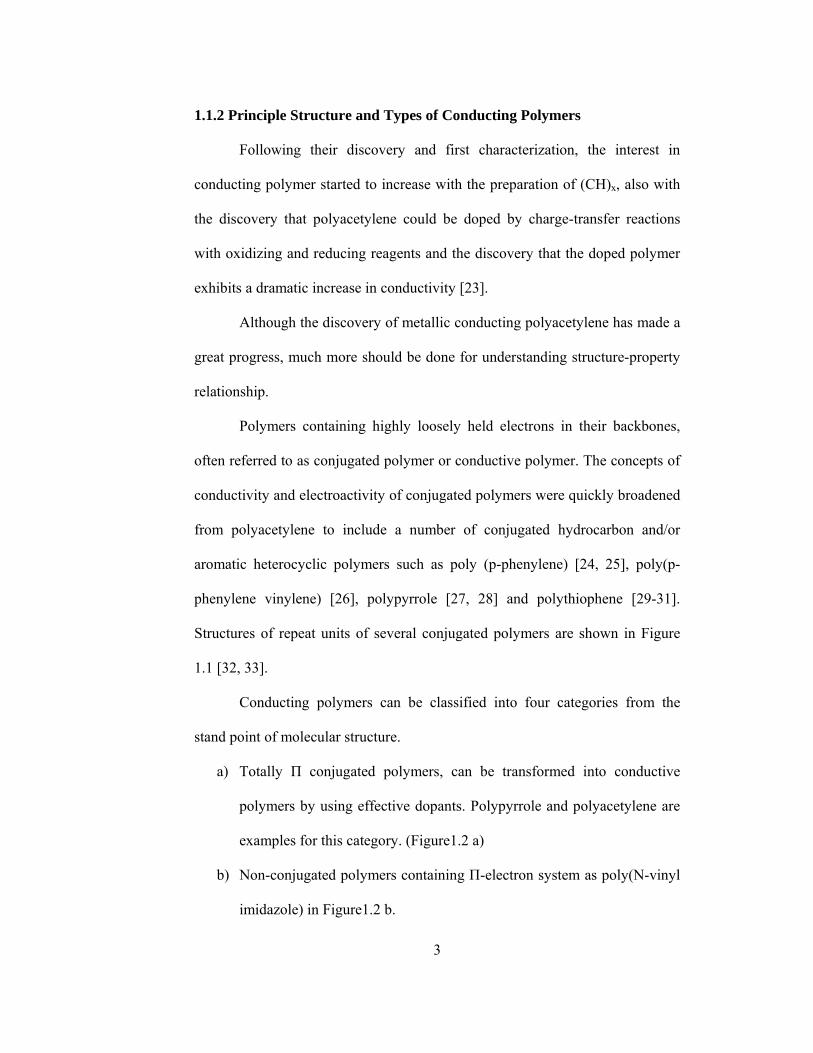
1.2 Types of conducting polymers....................................................................5
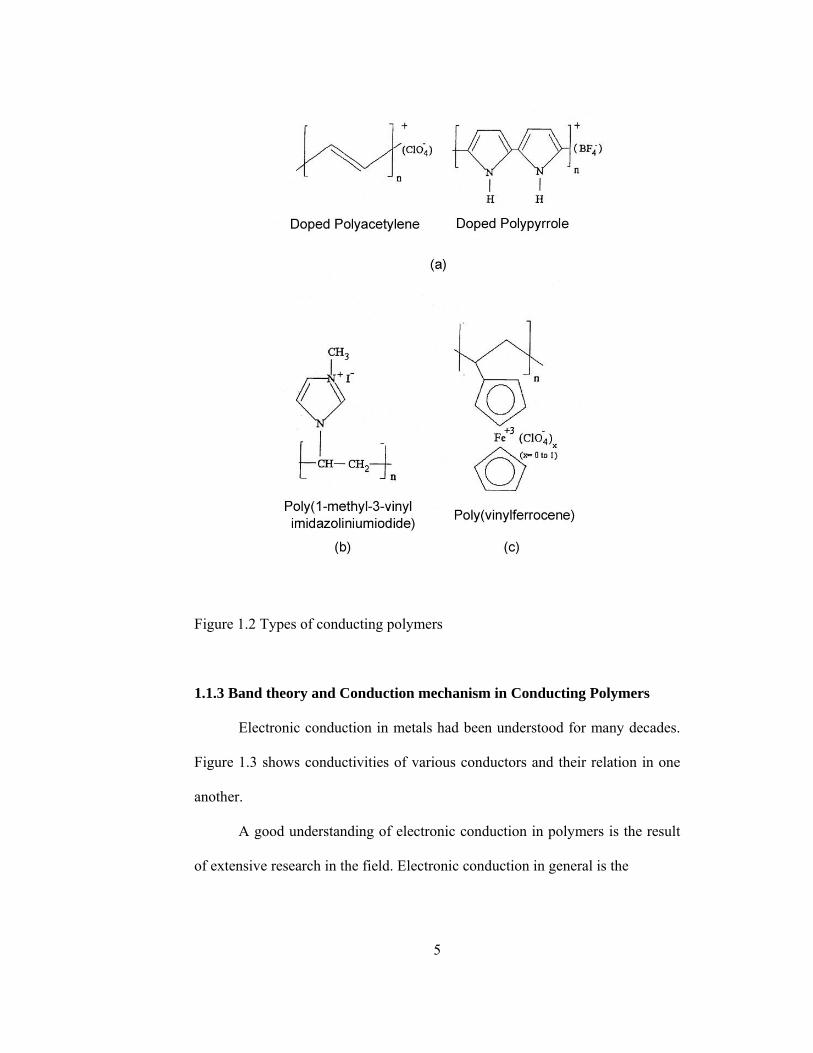
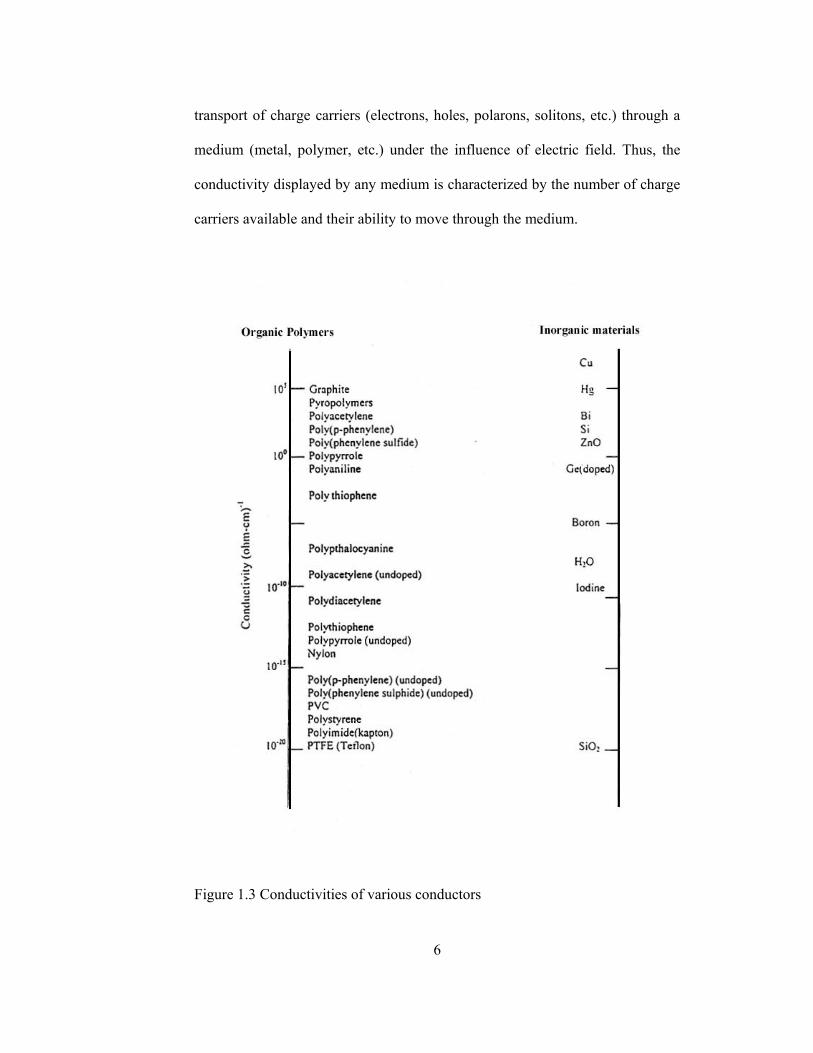
1.3 Conductivities of various conductors.........................................................6
1.4 Formation of energy bands and band gap based on the theoretical stacking of ethylene units..........................................................................................8
1.5 Physical-chemical “dictionary” for defects in conjugated chains...............9
1.6 Structural representation of bipolaron formation in polypyrrole and its corresponding energy bands in the mid gap..............................................11
1.7 Proposed mechanism for the electrochemical polymerization of aromatic
five membered heterocycles; where X=NH, S, or O……………………14
1.8 Typical Protein structure..........................................................................20
1.9 A schematic diagram showing the free energy profile of the course of an
enzyme catalyzed reaction involving the formation of enzyme-substrate
(ES) and enzyme-product (EP) complexes...............................................23
1.10 Computer simulation of the progress curves of d[ES]/dt , [ES] , [S] and [P] for a reaction obeying simple Michaelis-Menten kinetics..................26

xvi
1.11 A normalized plot of the initial rate (v0) against initial substrate
concentration ([S]0) for a reaction obeying the Michaelis-Menten
kinetics.....................................................................................................28
1.12 The Lineweaver-Burk Plot........................................................................29
1.13 Schematic representation of carrier-binding type enzyme
immobilization..........................................................................................32
1.14 Schematic representation of cross-linking type enzyme
immobilization…………………………………………………………..35
1.15 Schematic representation of entrapping enzyme…………...…………...36
1.16 Hydrolysis of sucrose...............................................................................37
1.17 Schematic representation of tyrosinase activity………………………...39
2.1 Polymerization cell..................................................................................45
2.2 Triangular wave function..........................................................................46
2.3 A cyclic voltammogram for a reversible reaction………………………48
2.4 Cyclic voltammetry cell...........................................................................49
2.5 Resistance measurement using four-probe technique………………..…50
2.6 Synthesis of copolymers of MM with pyrrole…………………………..53
2.7 Synthesis of copolymers of MM with thiophene.....................................58
2.8 Chemical polymerization of MM.............................................................58
2.9 Galvanostatic polymerization of MM.......................................................55
2.10 Synthesis of block copolymers of CN and GDM with pyrrole…………56
2.11 Synthesis of the monomer MBTA............................................................57
2.12 Schematic representation of Besthorn’s Hydrazone Method...................62
xvii
3.1 NMR spectrum of MM………………………………………………….66
3.2 FTIR spectrum of MM…………………………………………………..67
3.3 Cyclic voltammogram of MM………………………………………….68
3.4 DSC thermogram for MM……………………………………………...69
3.5 NMR spectrum of CN…………………………………………………...70
3.6 FTIR spectrum of CN…………………………………………………...70
3.7 (a) TGA (b) DSC of CN………………………………………………..71
3.8 Schematic representation of synthesis of CN and GDM………………..72
3.9 Cyclic voltammogram of (a) polythiophene (b) polythiophene in the
presence of MM…………………………………………………………73
3.10 Cyclic voltammograms of (a) MM (b) polypyrrole (c) polypyrrole in the
presence of MM…………………………………………………………75
3.11 TGA thermograms for (a) PM-1 (b) PM-2 (c) CNPP (d) CNPS
(e) PGDM……………………………………………………………….76
3.12 DSC thermograms for (a) PM-1 (b) PM-2 (c) CNPP (d) CNPS (e) PGDM……………………………………………………………….78
3.13 SEM micrographs of (a) PM-1 (b) PM-2……………………………….80
3.14 SEM micrographs of CNPP (a) unwashed electrode side (b) washed electrode side……………………………………………………………81
3.15 SEM micrographs of (a) CNPS solution side (b) CNPS electrode side (c)
PGDM solution side…………………………………………………….82

xviii
3.16 Scanning electron micrographs of (a) Ppy (b) CNPS (c) PM-2 matrices in
the presence of invertase………………………………………………..85
3.17 Effect of temperature on enzyme activity in (a) PM-2 (b) CNPS enzyme electrodes………………………………………………………………..87
3.18 Operational stability of (a) Ppy/PPO (b) PM-2/PPO (c) CNPS/PPO enzyme electrodes……………………………………………………….89
3.19 Storage stability of (a) Ppy/PPO (b) PM-2/PPO (c) CNPS/PPO enzyme electrodes………………………………………………………………..90
3.20 Calibration curve for Besthorn’s Hydrazone Method…………………..92
3.21 Calibration curve for protein determination…………………………….93
3.22 Scanning electron micrographs of (a) Ppy (b) PM-2 (c) CNPS (d) MBTA
enzyme electrodes……………………………………………………….96
3.23 Temperature stability (a)Free PPO (b)Ppy/PPO (c)PM-2/PPO
(d)CNPS/PPO (e)MBTA/PPO…………………………………………..97
3.24 pH stability of (a) Free PPO (b) Ppy/PPO (c) PM-2/PPO (d) CNPS/PPO (e) MBTA/PPO………………………………………………………..100
3.25 Operational stability for (a) Ppy/PPO (b) PM-2/PPO (c) CNPS/PPO (d)MBTA/PPO………………………………………………………...103
3.26 Shelf life for (a) Ppy/PPO (b) PM-2/PPO (c) CNPS/PPO (d) MBTA/PPO………………………………………………………...105

xix
LIST OF TABLES
3.1 Conductivities of polymers of MM……………………………………..83
3.2 Kinetic parameters for free and immobilized invertase………………...86
3.3 Protein amounts for enzyme electrodes………………………………...93
3.4 Kinetic parameters for free and immobilized PPO……………………..95
3.5 Total phenolics in two different red wines, determined by enzyme electrodes………………………………………………………………107
xx
LIST OF ABBREVIATION
AN Acetonitrile
CCE Constant current electrolysis
CN Homopolymer of MM via chemical polymerization
CNPP Block copolymer of CN with pyrrole in the presence of
PTSA
CNPS Block copolymer of CN with pyrrole in the presence of SDS
CPE Constant potential electrolysis
CV Cyclic Voltammetry
DCCl N,N’-dicyclohexylcarbodiimide
DCM Dichloromethane
DSC Differential scanning calorimetry
FTIR Fourier Transform Infrared Spectrophotometer
GDM Homopolymer of MM via galvanostatic polymerization
MBTA Methylbutyl 2-(3-thienyl)acetate
MBTH 3-methyl-2-benzothiozolinone
MM Menthyl Ester of 3-Thiophene Acetic Acid
NM Nitromethane
NMR Nuclear Magnetic Resonance Spectrometer
PGDM Block copolymer of GDM with pyrrole in the presence of
PTSA
xxi
PM-1 Copolymer of MMwith pyrrole in the presence of PTSA
PM-2 Copolymer of MM with pyrrole in the presence of SDS
PMBTA Homopolymer ofmethylbutyl 2-(3-thienyl)acetate
PPO Polyphenol oxidase
Ppy Polypyrrole
PTSA p-toluene sulfonic acid
SDS Sodium dodecylsulfate
SEM Scanning electron Microscope
TBAFB Tetrabutylammonium tetrafluoroborate
TGA Thermal gravimetry analysis
THF Tetrahydro furan

CHAPTER 1
INTRODUCTION
1.1 Conducting Polymers
Since the discovery of an increase by nearly 10 orders of magnitude of
the electrical conductivity of polyacetylene when it was doped (oxidized or
reduced) with iodine or other acceptors (dopants), in 1977 [1] conjugated
polymers have been studied intensively. Polyacetylene was the first conjugated
polymer to show this special electrical property. A number of researchers in
physics, chemistry, and materials science study conjugated polymers from
several different perspectives. Studies of the electronic structure of the neutral
and doped conjugated polymers have opened potential application areas.
1.1.1 Historical Review of Conducting Polymers
Conventional polymers, which are saturated polymers or plastics, have
been used for many applications traditionally because of their attractive
chemical, mechanical, and electrically insulating properties. Although the idea
of using polymers for their electrically conducting properties dates back at least
2
to the 1960s [2], the use of organic “π conjugated” polymers as electronic
materials [1, 3] in molecular based electronics is relatively new.
Pristine (neutral or undoped) conjugated polymers are insulators or
semiconductors. However, when the conjugated polymers are “doped” (oxidized
or reduced) they can have metallic electrical conductivity [4, 5]. In addition to
the study of the high electrical conductivities, which can be applied to the
manufacture of conducting transparent plastic [6] and conducting fabrics [7], the
fast and high nonlinear optical application of conjugated organic compounds is
also a topic of major interest [8].
In the 1980s the concepts of solitons, polarons, and bipolarons were
developed, in the context of both transport properties [9-13] and optical
properties [1, 14].
More recently, conjugated polymers are receiving attention as promising
materials for electronic applications. In particular, conjugated polymers as well
as π-conjugated oligomers [15] play a central role in organic-based transistors
and integrated circuits [16, 17], photovoltaic devices [18] and especially
organic-based light emitting devices [19].
Even solid state lasers are under development [20]. In fact, in the case of
polymer-based light emitting devices (LEDs), the development of device
structures has led to the establishment of high-tech companies and academic
institutes [21,22].
3
1.1.2 Principle Structure and Types of Conducting Polymers
Following their discovery and first characterization, the interest in
conducting polymer started to increase with the preparation of (CH)x, also with
the discovery that polyacetylene could be doped by charge-transfer reactions
with oxidizing and reducing reagents and the discovery that the doped polymer
exhibits a dramatic increase in conductivity [23].
Although the discovery of metallic conducting polyacetylene has made a
great progress, much more should be done for understanding structure-property
relationship.
Polymers containing highly loosely held electrons in their backbones,
often referred to as conjugated polymer or conductive polymer. The concepts of
conductivity and electroactivity of conjugated polymers were quickly broadened
from polyacetylene to include a number of conjugated hydrocarbon and/or
aromatic heterocyclic polymers such as poly (p-phenylene) [24, 25], poly(p-
phenylene vinylene) [26], polypyrrole [27, 28] and polythiophene [29-31].
Structures of repeat units of several conjugated polymers are shown in Figure
1.1 [32, 33].
Conducting polymers can be classified into four categories from the
stand point of molecular structure.
a) Totally Π conjugated polymers, can be transformed into conductive
polymers by using effective dopants. Polypyrrole and polyacetylene are
examples for this category. (Figure1.2 a)
b) Non-conjugated polymers containing Π-electron system as poly(N-vinyl
imidazole) in Figure1.2 b.

4
c) Metallomacrocyclic polymers, which contain covalently linked Π-
systems in a face to face orientation. These kind of polymers loaded with
electroactive counter ions, conduct current by electron self exchange
reactions between neighboring redox sites. (Figure.1.2 c)
d) Composite polymers which are prepared by dispersing highly conductive
polymer into inert polymers such as poly (vinylchloride).
S
NH
NH
polyacetylene polythiophene
polypyrrole polyaniline
polyparaphenylene poly(paraphenylene vinylene)
Figure 1.1 Structure of the repeat units of several conjugated polymers
5
Figure 1.2 Types of conducting polymers
1.1.3 Band theory and Conduction mechanism in Conducting Polymers
Electronic conduction in metals had been understood for many decades.
Figure 1.3 shows conductivities of various conductors and their relation in one
another.
A good understanding of electronic conduction in polymers is the result
of extensive research in the field. Electronic conduction in general is the
6
transport of charge carriers (electrons, holes, polarons, solitons, etc.) through a
medium (metal, polymer, etc.) under the influence of electric field. Thus, the
conductivity displayed by any medium is characterized by the number of charge
carriers available and their ability to move through the medium.
Figure 1.3 Conductivities of various conductors

7
In order to discuss charge carriers and their mobility, it is first necessary
to establish exactly what a charge carrier is and how they are formed. The basic
ideas or concepts of band theory are useful frameworks for establishing the
origins of electronic conduction and charge carriers.
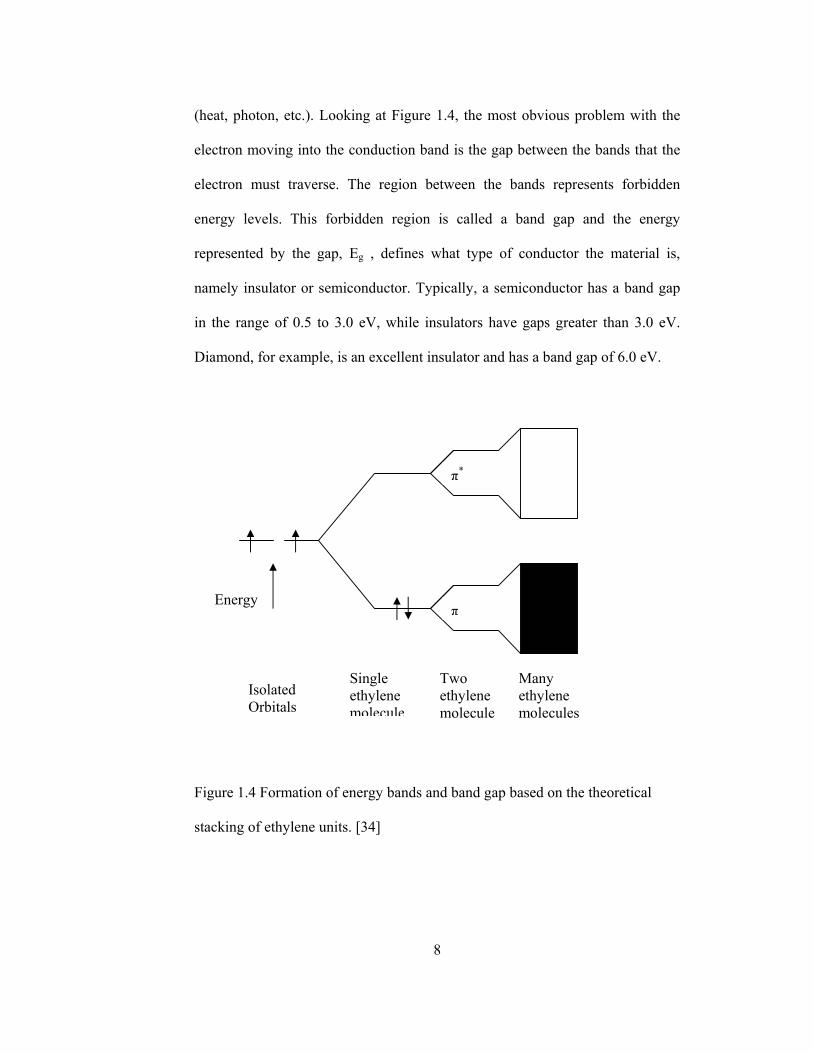
1.1.3.1 Band Theory of Solids
According to Huckel theory, π and π* orbitals are separated by an energy
(Figure 1.4). For example if two ethylene molecules are stacked directly on top
of one another and are allowed to interact, two sets of two molecular orbitals are
formed that are separated by an energy. As more and more ethylene units
accumulate, the corresponding number of π and π* states are formed with two
electrons per state. As the number of units becomes larger, the states begin to
form a continuous band. In the case of ethylene, the preferred energy state is the
bonding state and the band formed by the π states will be entirely full as shown.
This band is the highest occupied molecular orbital (HOMO) or valence band.
Also, the highest occupied state is called the Fermi Level. The π* state will be
empty and is called the lowest unoccupied molecular orbital (LUMO) or
conduction band.
According to band theory, for a polymer to be conductive an electron
must be moved from the highest occupied state to the next lowest unoccupied
state, which will be from the valence band to the conduction band. The energy
that it takes to create this electron jump can come from various energy sources
8
(heat, photon, etc.). Looking at Figure 1.4, the most obvious problem with the
electron moving into the conduction band is the gap between the bands that the
electron must traverse. The region between the bands represents forbidden
energy levels. This forbidden region is called a band gap and the energy
represented by the gap, Eg , defines what type of conductor the material is,
namely insulator or semiconductor. Typically, a semiconductor has a band gap
in the range of 0.5 to 3.0 eV, while insulators have gaps greater than 3.0 eV.
Diamond, for example, is an excellent insulator and has a band gap of 6.0 eV.
Figure 1.4 Formation of energy bands and band gap based on the theoretical
stacking of ethylene units. [34]
Energy
π*
π
Isolated Orbitals
Single ethylene molecule
Two ethylene molecule
Many ethylene molecules
9
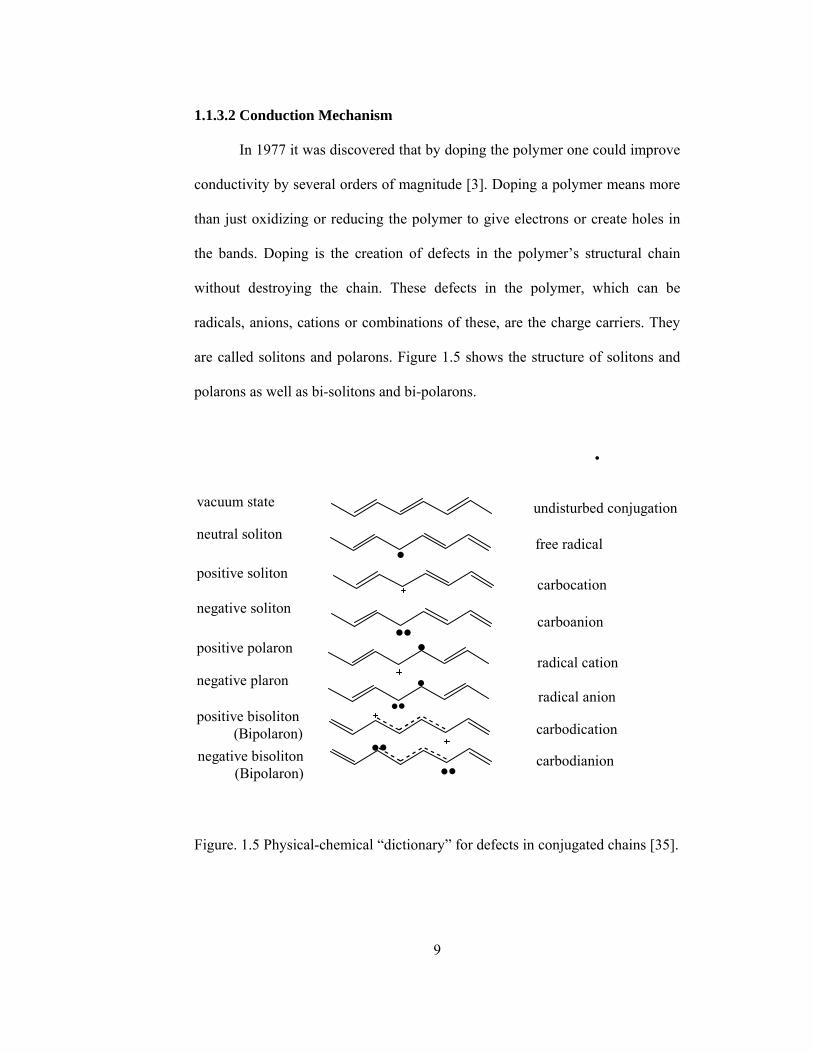
1.1.3.2 Conduction Mechanism
In 1977 it was discovered that by doping the polymer one could improve
conductivity by several orders of magnitude [3]. Doping a polymer means more
than just oxidizing or reducing the polymer to give electrons or create holes in
the bands. Doping is the creation of defects in the polymer’s structural chain
without destroying the chain. These defects in the polymer, which can be
radicals, anions, cations or combinations of these, are the charge carriers. They
are called solitons and polarons. Figure 1.5 shows the structure of solitons and
polarons as well as bi-solitons and bi-polarons.
undisturbed conjugation
free radical
carbocation
carboanion
radical cation
radical anion
carbodication
carbodianion
vacuum state
neutral soliton
positive soliton
negative soliton
positive polaron
negative plaron
positive bisoliton (Bipolaron)negative bisoliton (Bipolaron)
Figure. 1.5 Physical-chemical “dictionary” for defects in conjugated chains [35].
10
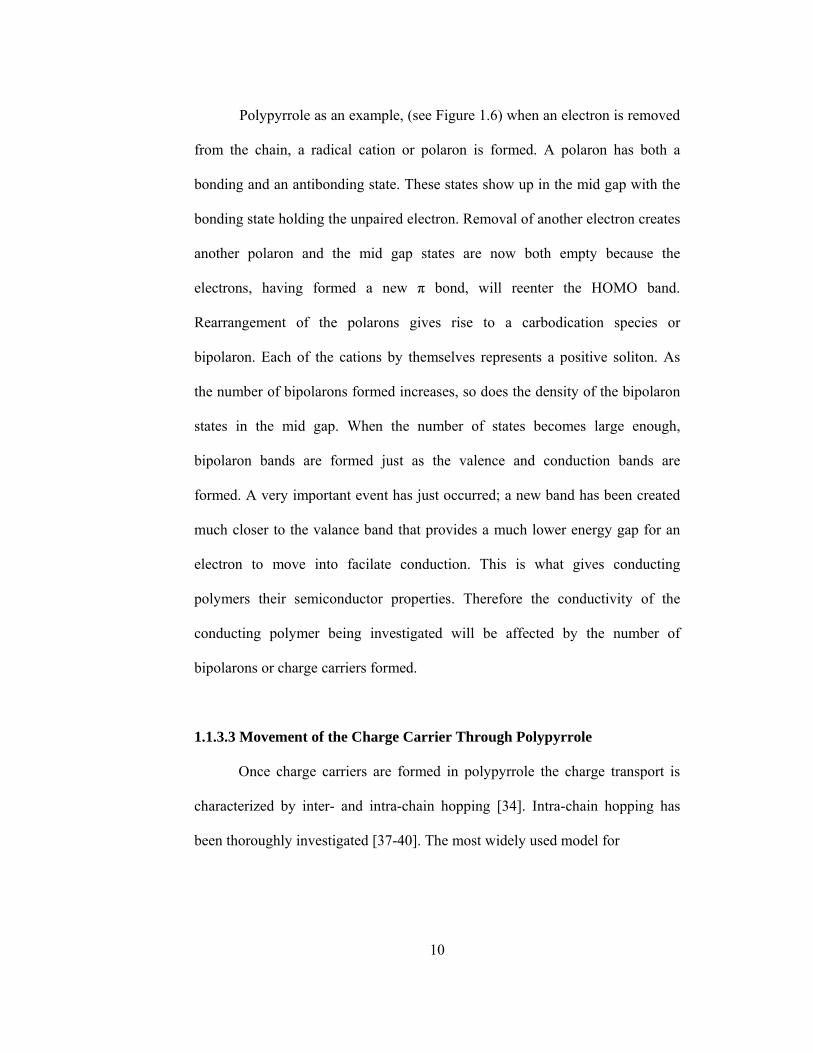
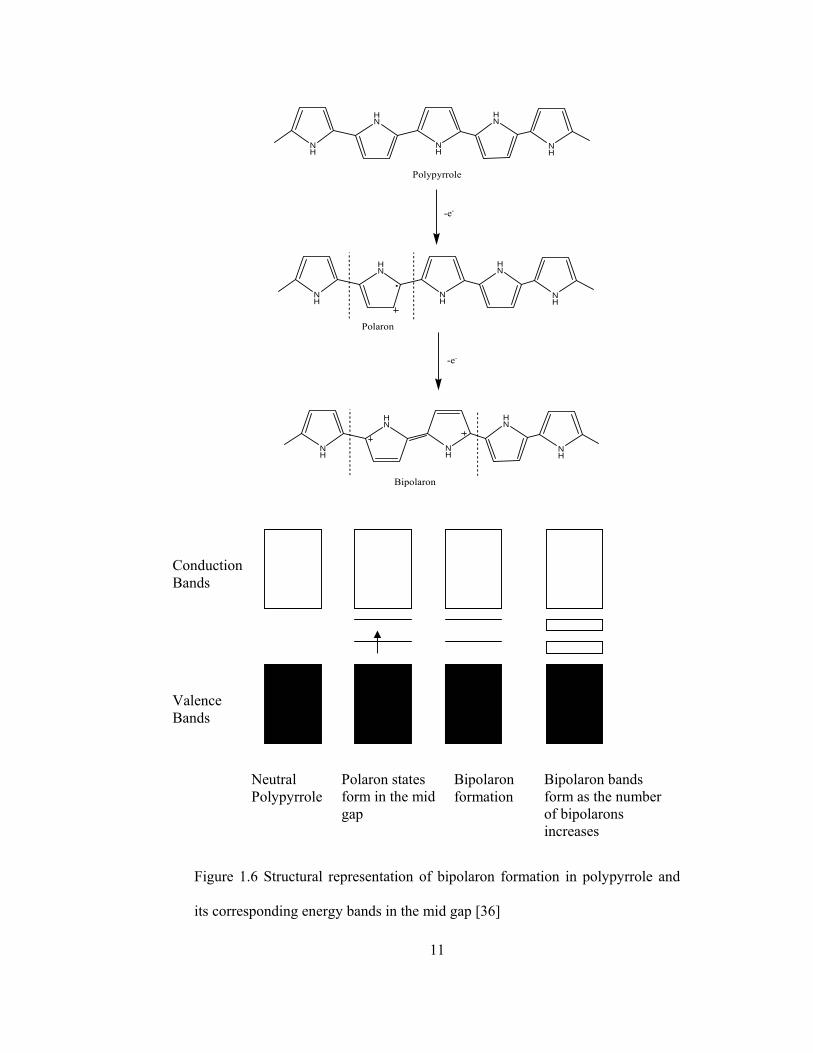
Polypyrrole as an example, (see Figure 1.6) when an electron is removed
from the chain, a radical cation or polaron is formed. A polaron has both a
bonding and an antibonding state. These states show up in the mid gap with the
bonding state holding the unpaired electron. Removal of another electron creates
another polaron and the mid gap states are now both empty because the
electrons, having formed a new π bond, will reenter the HOMO band.
Rearrangement of the polarons gives rise to a carbodication species or
bipolaron. Each of the cations by themselves represents a positive soliton. As
the number of bipolarons formed increases, so does the density of the bipolaron
states in the mid gap. When the number of states becomes large enough,
bipolaron bands are formed just as the valence and conduction bands are
formed. A very important event has just occurred; a new band has been created
much closer to the valance band that provides a much lower energy gap for an
electron to move into facilate conduction. This is what gives conducting
polymers their semiconductor properties. Therefore the conductivity of the
conducting polymer being investigated will be affected by the number of
bipolarons or charge carriers formed.
1.1.3.3 Movement of the Charge Carrier Through Polypyrrole
Once charge carriers are formed in polypyrrole the charge transport is
characterized by inter- and intra-chain hopping [34]. Intra-chain hopping has
been thoroughly investigated [37-40]. The most widely used model for
11
NH
HN
NH
HN
NH
-e-
Polypyrrole
NH
HN
NH
HN
NH
Polaron
-e-
NH
HN
NH
HN
NH
Bipolaron
Figure 1.6 Structural representation of bipolaron formation in polypyrrole and
its corresponding energy bands in the mid gap [36]
Conduction Bands
Valence Bands
Neutral Polypyrrole
Polaron states form in the mid gap
Bipolaron formation
Bipolaron bands form as the number of bipolarons increases
12
movement of a charge is given by Mott [36] which most accurately predicts the
behavior of a charge carrier “hopping” along the chain. Mott’s model works for
polypyrrole at low doping levels, however, it is not valid as the doping level
increases. This would seem to suggest that the conductivity is limited by the
inter-chain hopping or, in other words, the transport of charge from one chain to
another.
Intra-chain mechanisms remain something mystery. This is largely due
to the fact that it is difficult to show exactly what is hopping. Several
possibilities are plausible. (1) the transport of an entire bipolaron as if it were a
particle hopping from one chain to another; (2) the transport of the bipolaron as
its component solitons, coming together on the receiving chain to reform the
bipolaron; (3) as each component soliton hops it meets a soliton on the receiving
chain to form new bipolarons
1.1.4 Synthesis of Conducting Polymers
Conducting polymers can be synthesized via chemical or
electrochemical routes, although the former has been largly superseded by
electrochemical methods. However, many polymers, most notably
polyacetylene, are still only accessible via chemical synthesis.
1.1.4.1 Chemical Synthesis
A large number of conducting polymers can be synthesized via catalytic
oxidation [41, 24]. However, control over polymer morphology is extremely
limited, purification can be problematic and processing is virtually impossible.

13
However, a number of alternative synthetic routes have been developed which
involve soluble precursor polymers.
Polyheterocycles are usually polymerized with FeCl3 as the chemical
oxidant, although other oxidants can also be used. Reduction to the neutral state
is accomplished by addition of a strong base such as ammonium hydroxide or
hydrazine. Benzene can also undergo oxidative polymerization with
AlCl3/CuCl2 to yield poly (p-phenylene).
1.1.4.2 Electrochemical Synthesis
Electrochemical synthesis of conducting polymers offers many
advantages over chemical synthesis, including the in-situ deposition of the
polymer at the electrode surface, and, hence, eliminating processibility problems
and the control of the thickness, morphology and degree of polymer doping by
the quantity of charge passed. In addition, the polymers are simultaneously
oxidized to their doped conducting forms during polymer growth.
Electropolymerization is achieved by the electro-oxidation of the
heterocycle in an inert organic solvent containing a supporting electrolyte [42].
A schematic of the generally accepted mechanism for electropolymerization of
five membered heterocycles [27] is shown in Figure 1.7. The initial
electrochemical step (E) is a one electron oxidation of the monomer to form its
radical cation. A high concentration of these species is maintained at the anode
surface because the rate of electron transfer greatly exceeds the monomer
diffusion rate to the electrode surface. The second step, a chemical reaction (C),
involves the spin-pairing of two radical cations to form a dihydro dimer
14
X
-e-
X.+ X+.
X+.
X
X
+
+ -2H+
X
X
(E)
(C)
X
X -e-
X
X.+
X
X+
. (E)
X
X+
. +X +
.X
X+
X+
-2H+
X
X
X
2
...etc (C)
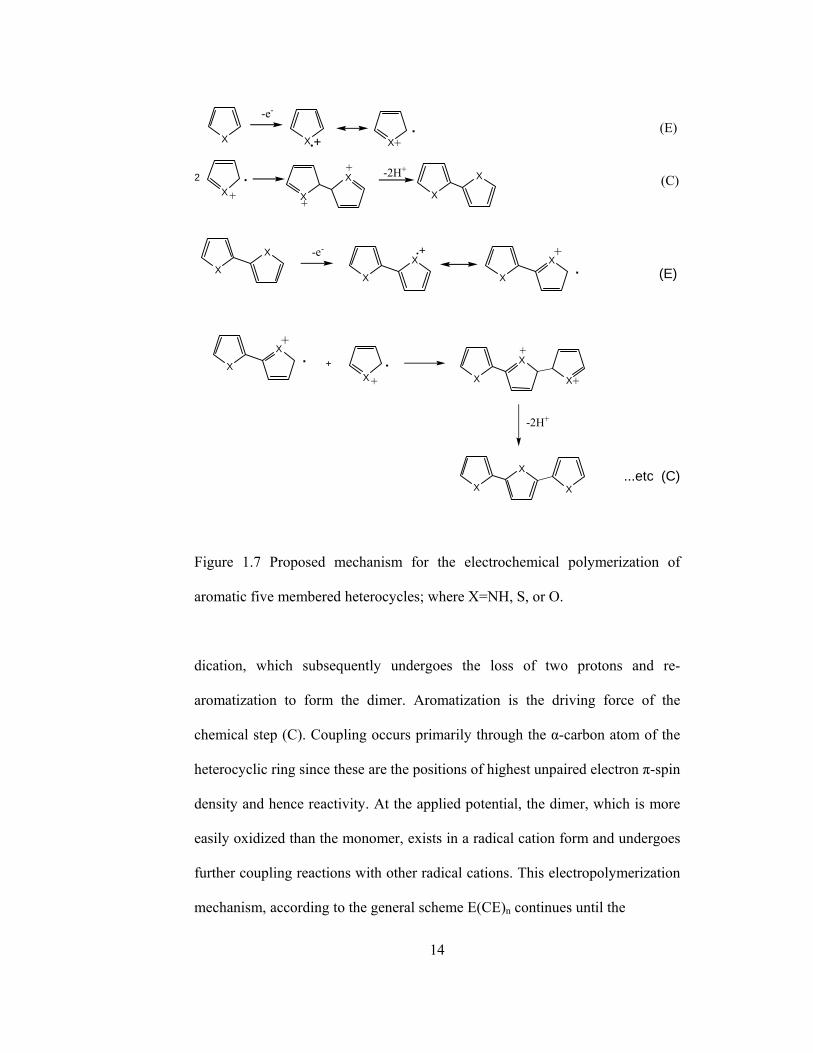
Figure 1.7 Proposed mechanism for the electrochemical polymerization of
aromatic five membered heterocycles; where X=NH, S, or O.
dication, which subsequently undergoes the loss of two protons and re-
aromatization to form the dimer. Aromatization is the driving force of the
chemical step (C). Coupling occurs primarily through the α-carbon atom of the
heterocyclic ring since these are the positions of highest unpaired electron π-spin
density and hence reactivity. At the applied potential, the dimer, which is more
easily oxidized than the monomer, exists in a radical cation form and undergoes
further coupling reactions with other radical cations. This electropolymerization
mechanism, according to the general scheme E(CE)n continues until the
15
oligomer becomes insoluble in the electrolytic medium and precipitates on the
anode surface [43]. Non-α,α’-linkages (e.g. α,β’ and β,β’ coupling) can occur to
variable extents, causing breaks in conjugation and hence, reduction in film
conductivity.
Since conjugated oligomers are oxidized at less positive potentials than
their corresponding monomer, polymer oxidation occurs concurrently with
electro-deposition. Typically, one electron is removed from the polymeric
backbone for every three-four monomer units to form polar structures,
responsible for inherent conductivity. Anions, termed ‘dopants’, are thus
incorporated into the film to maintain electro-neutrality. The doping
terminology of conductive polymers should be distinguished from its
conventional use in semi-conductor physics, since considerably higher
concentration of dopants are employed in the former, typically up to 33% [44].
The type of counterion used can greatly affect the conductivity of the
film [45]. For example, for equal degrees of doping, polypyrrole typically has
conductivities in the range of 30-100 Scm-1 with tetrafluoroborate ion, whereas
with perchlorate anions, enhanced conductivities of 60-200 Scm-1 can be
achieved [46].
1.1.5 Conducting Copolymers
Synthesis of conducting copolymer composites, graft and block
copolymers is a method used to overcome the drawbacks of conducting
polymers which are insoluble, hard and brittle. Properties of conducting
polymers can be controlled by the incorporation of two or more structurally

16
different units into the same polymer chain. Copolymers from pyrrole, pyrrole
derivatives, thiophene, bithiophene and other combination of aromatic
compounds have been reported [47-51].
Electropolymerization of the conducting component on electrode
previously coated with the insulating polymer is common approach for the
preparation of conducting composites and copolymers. Electrochemical
polymerization of pyrrole and thiophene may occur on an ordinary insulating
polymer film [52-54].
Polycarbonate and polystyrene [55], poly (methyl methacrylate) [56-58],
polyimide[59], polyamide[60], polysiloxanes[61], poly(tetrahydrofuran) [62, 63]
were previously used as the host matrices.
1.1.6 Characterization of Conducting Polymers
Conducting polymers can be characterized by a variety of analytical
techniques. Many examples exist in the literature, some of which include; cyclic
voltammetry for understanding redox processes in the conducting polymers,
optical characterization of conducting polymers for non-linear optical materials,
nuclear magnetic resonance for structure confirmation, chain orientation and
molecular motion, gel permeation chromatography for molecular weight,
differential scanning calorimetry and thermogravimetry analysis for evidence of
glass and melting transitions and decomposition temperatures.
17
1.1.6.1 Cyclic Voltammetry
Cyclic voltammetry is one of the most useful methods, which allows one
to scan the potential of the working electrode in the anodic and cathodic
directions. It allows one to observe the peaks due to the redox behavior of a
substrate. Cyclic voltammetry gives the exact reaction potentials of the
monomer as well as the information about the chemical reactions present during
the process. Also, it can easily be understood from the cyclic voltammograms
whether the chemical reaction is reversible or not.
In cyclic voltammograms, current response is plotted as a function of
applied potential. The current depends on the voltage scan rate, rate of electron
transfer and diffusion layer of the electroactive substrate to the surface of the
electrode.
1.1.7 Applications of Conducting Polymers
The application of conducting polymers can be divided into three main
classes. The first use is in their neutral form, which provides the advantages of
their semi-conducting and luminescent properties. Examples of applications are
semi-conducting materials for field effect transistors [64], and active material in
an electroluminescent device [65, 66]. The second category of applications
involves using the polymer in its doped or conducting form, and some
representative applications in this category are electrostatic charge disspation
and EMI shielding [67, 68], electrode materials for capacitors [69, 70], and
enzyme immobilization [71-73]. The third category uses the ability of the
polymer to reversibly switch between its conducting and reduced forms. Upon
18
switching between two states, the polymer undergoes color, conductivity and
volume changes. Applications that use these properties include battery
electrodes [74], actuators [75], sensors [76], drug delivery [77], electrochromics
[78-80].
1.2 Enzymes
Enzymes have a number of distinct advantages over conventional
chemical catalysts. Foremost amongst these are their specificity and selectivity
not only for particular reactions but also in their discrimination between similar
parts of molecules (regiospecificity) or optical isomers (stereospecificity). They
catalyze only the reactions of very narrow ranges of reactants (substrates),
which may consist of a small number of closely related classes of compounds
(e.g. trypsin catalyzes the hydrolysis of some peptides and esters in addition to
most proteins), a single class of compounds (e.g. hexokinase catalyses the
transfer of a phosphate group from ATP to several hexoses), or a single
compound (e.g. glucose oxidase oxidizes only glucose amongst the naturally
occurring sugars). This means that the chosen reaction can be catalysed to the
exclusion of side-reactions, eliminating undesirable by-products. Thus, higher
productivities may be achieved, reducing material costs. As a bonus, the product
is generated in an uncontaminated state so reducing purification costs and the
downstream environmental burden. Often a smaller number of steps may be
required to produce the desired end-product. In addition, certain stereospecific
reactions (e.g. the conversion of glucose into fructose) cannot be achieved by
classical chemical methods without a large expenditure of time and effort.
19
Enzymes work under generally mild processing conditions of temperature,
pressure and pH. This decreases the energy requirements, reduces the capital
costs due to corrosion-resistant process equipment and further reduces unwanted
side-reactions. The high reaction velocities and straightforward catalytic
regulation achieved in enzyme-catalyzed reactions allow an increase in
productivity with reduced manufacturing costs due to wages and overheads[81,
82].
There are some disadvantages in the use of enzymes which cannot be
ignored but which are currently being addressed and overcome. In particular, the
high cost of enzyme isolation and purification still discourages their use,
especially in areas which currently have an established alternative procedure.
The generally unstable nature of enzymes, when removed from their natural
environment, is also a major drawback to their more extensive use[83]. These
drawbacks can be eliminated by enzyme immobilization
The existence of enzymes has been known for well over a century. Some
of the earliest studies were performed in 1835 by the Swedish chemist Jon Jakob
Berzelius who termed the chemical action “catalytic”. It was not until 1926,
however, that the first enzyme was obtained in pure form, a feat accomplished
by James B. Sumner of Cornell University. Sumner was able to isolate and
crystallize the enzyme urease from the jack bean. His work was to earn him the
1947 Nobel Prize.
John H. Northrop and Wendell M. Stanley of the Rockefeller Institute
for Medical Research shared the 1947 Nobel Prize with Sumner. They
discovered a complex procedure for isolating pepsin. This precipitation
20
technique devised by Northrop and Stanley has been used to crystallize several
enzymes [84-86]
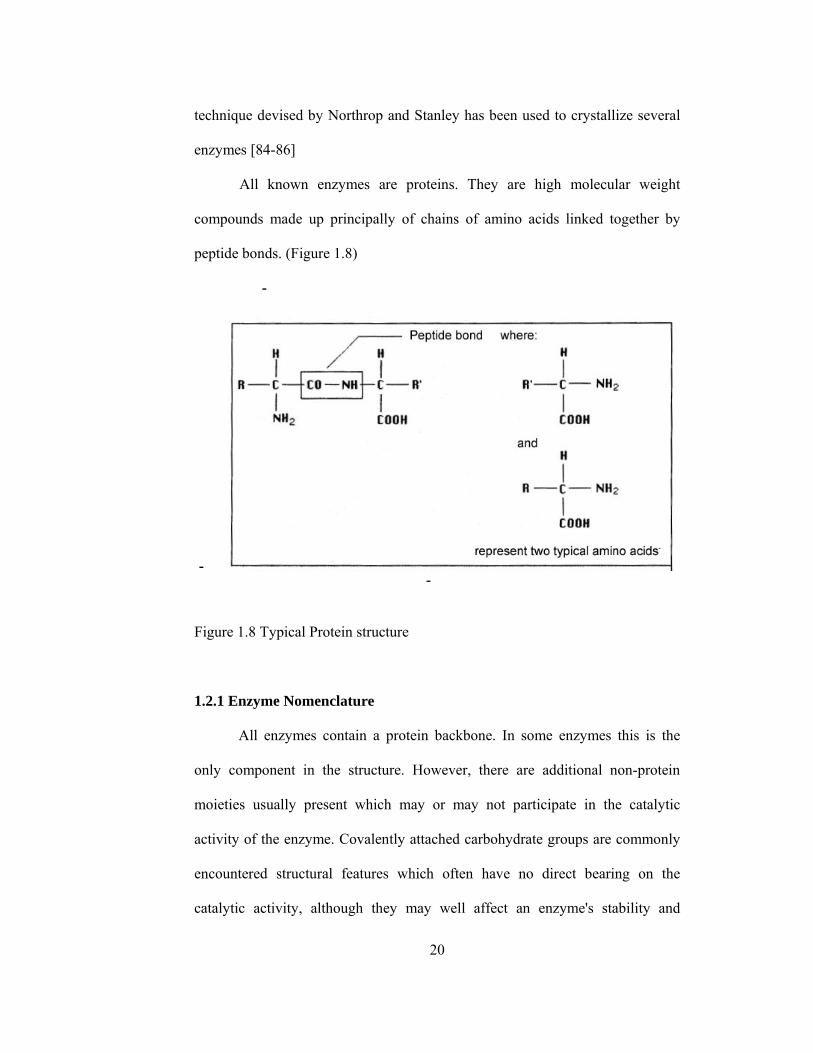
All known enzymes are proteins. They are high molecular weight
compounds made up principally of chains of amino acids linked together by
peptide bonds. (Figure 1.8)
-
- -
Figure 1.8 Typical Protein structure
1.2.1 Enzyme Nomenclature
All enzymes contain a protein backbone. In some enzymes this is the
only component in the structure. However, there are additional non-protein
moieties usually present which may or may not participate in the catalytic
activity of the enzyme. Covalently attached carbohydrate groups are commonly
encountered structural features which often have no direct bearing on the
catalytic activity, although they may well affect an enzyme's stability and
21
solubility. Other factors often found are metal ions (cofactors) and low
molecular weight organic molecules (coenzymes). These may be loosely or
tightly bound by noncovalent or covalent forces. They are often important
constituents contributing to both the activity and stability of the enzymes. This
requirement for cofactors and coenzymes must be recognized if the enzymes are
to be used efficiently and is particularly relevant in continuous processes where
there may be a tendency for them to become separated from an enzyme's protein
moiety.
Enzymes are classified according to the report of a Nomenclature
Committee appointed by the International Union of Biochemistry (1984). This
enzyme commission assigned each enzyme a recommended name and a 4-part
distinguishing number. It should be appreciated that some alternative names
remain in such common usage that they will be used, where appropriate, in this
text. The enzyme commission (EC) numbers divide enzymes into six main
groups according to the type of reaction catalyzed.
(1) Oxidoreductases which involve redox reactions in which hydrogen or
oxygen atoms or electrons are transferred between molecules. This extensive
class includes the dehydrogenases (hydride transfer), oxidases (electron transfer
to molecular oxygen), oxygenases (oxygen transfer from molecular oxygen) and
peroxidases (electron transfer to peroxide).
(2) Transferases which catalyse the transfer of an atom or group of atoms (e.g.
acyl-, alkyl- and glycosyl-), between two molecules, but excluding such
transfers as are classified in the other groups (e.g. oxidoreductases and
hydrolases).
22
(3) Hydrolases which involve hydrolytic reactions and their reversal. This is
presently the most commonly encountered class of enzymes within the field of
enzyme technology and includes the esterases, glycosidases, lipases and
proteases.
(4) Lyases which involve elimination reactions in which a group of atoms is
removed from the substrate. This includes the aldolases, decarboxylases,
dehydratases and some pectinases but does not include hydrolases
(5) Isomerases which catalyse molecular isomerizations and includes the
epimerases, racemases and intramolecular transferases.
(6) Ligases, also known as synthetases, form a relatively small group of
enzymes which involve the formation of a covalent bond joining two molecules
together, coupled with the hydrolysis of a nucleoside triphosphate.
1.2.2 Enzyme Kinetics
In order for a reaction to occur, reactant molecules must contain
sufficient energy to cross a potential energy barrier, the activation energy. All
molecules possess varying amounts of energy depending, for example, on their
recent collision history but, generally, only a few have sufficient energy for
reaction. The lower the potential energy barrier to reaction, the more reactants
have sufficient energy and, hence, the faster the reaction will occur. All
catalysts, including enzymes, function by forming a transition state, with the
reactants, of lower free energy than would be found in the uncatalyzed reaction
(Figure 1.9). Even quite modest reductions in this potential energy barrier may
produce large increases in the rate of reaction (e.g. the activation energy for the
23
uncatalyzed breakdown of hydrogen peroxide to oxygen and water is 76 kJ M-1
whereas, in the presence of the enzyme catalase, this is reduced to 30 kJ M-1 and
the rate of reaction is increased by a factor of 108, sufficient to convert a
reaction time measured in years into one measured in seconds).
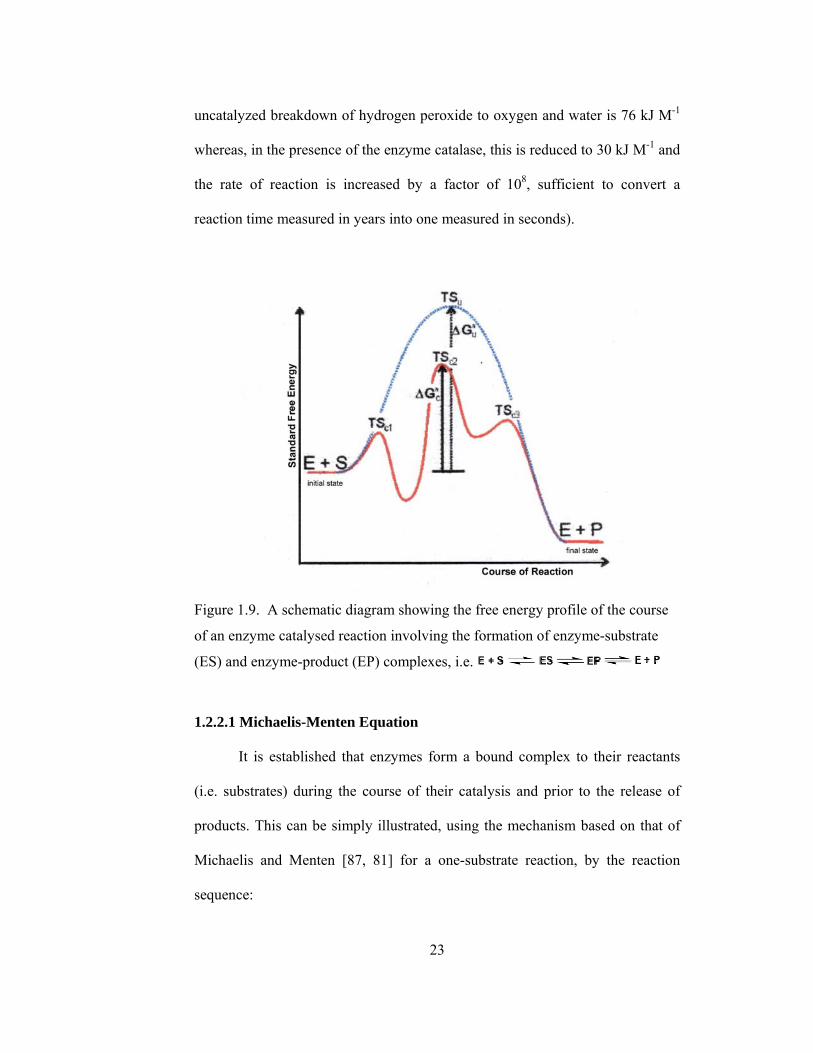
Figure 1.9. A schematic diagram showing the free energy profile of the course
of an enzyme catalysed reaction involving the formation of enzyme-substrate
(ES) and enzyme-product (EP) complexes, i.e.
1.2.2.1 Michaelis-Menten Equation
It is established that enzymes form a bound complex to their reactants
(i.e. substrates) during the course of their catalysis and prior to the release of
products. This can be simply illustrated, using the mechanism based on that of
Michaelis and Menten [87, 81] for a one-substrate reaction, by the reaction
sequence:

24
Enzyme+Substrate (Enzyme-substrate complex) Enzyme +Product
where k+1, k-1 and k+2 are the respective rate constants, typically having values of
105 - 108 M-1 s-1, 1 - 104 s-1 and 1 - 105 s-1 respectively; the sign of the subscripts
indicating the direction in which the rate constant is acting. For the sake of
simplicity the reverse reaction concerning the conversion of product to substrate
is not included in this scheme. This is allowable (1) at the beginning of the
reaction when there is no, or little, product present, or (2) when the reaction is
effectively irreversible. Reversible reactions are dealt with in more detail later in
this chapter. The rate of reaction (v) is the rate at which the product is formed.
[ ] [ ]ESkdtPd
v 2+== (1.1)
where [ ] indicates the molar concentration of the material enclosed (i.e. [ES] is
the concentration of the enzyme-substrate complex). The rate of change of the
concentration of the enzyme-substrate complex equals the rate of its formation
minus the rate of its breakdown, forwards to give product or backwards to
regenerate substrate. Therefore:
[ ] [ ] ( )[ ]ESkkSEkdtESd
211 +−⎥⎦⎤
⎢⎣⎡+ +−= (1.2)
During the course of the reaction, the total enzyme at the beginning of the
reaction ([E]0, at zero time) is present either as the free enzyme ([E]) or the ES
complex ([ES]).
25
i.e. [E]0 = [E] + [ES] (1.3)
therefore:
[ ] [ ] [ ]( )[ ] ( )[ ]ESkkSESEkdtESd
2101 +−+ +−−= (1.4)
Gathering terms together,
[ ] [ ] [ ][ ] ( )[ ]ESkkSESkSEkdtESd
21101 +−+⎥⎦⎤
⎢⎣⎡+ +−−=
[ ] [ ] [ ]( )[ ]ESkkSkSEkdtESd
21101 +−+⎥⎦⎤
⎢⎣⎡+ ++−=
this gives:
[ ]
[ ] [ ] [ ] [ ][ ] 211
01
211 +−+
+
+−+ ++=+
++ kkSkSEkES
kkSkdtESd
(1.5)
The differential equation 1.5 is difficult to handle, but may be greatly simplified
if it can be assumed that the left hand side is equal to [ES] alone. This
assumption is valid under the sufficient but unnecessarily restrictive steady state
approximation that the rate of formation of ES equals its rate of disappearance
by product formation and reversion to substrate (i.e. d[ES]/dt is zero). It is
additionally valid when the condition:
[ ]
[ ] 211 +−+ ++ kkSkdtESd
<< [ ]ES (1.6)
is valid. This occurs during a substantial part of the reaction time-course over a
wide range of kinetic rate constants and substrate concentrations and at low to
moderate enzyme concentrations. The variation in [ES], d[ES]/dt, [S] and [P]
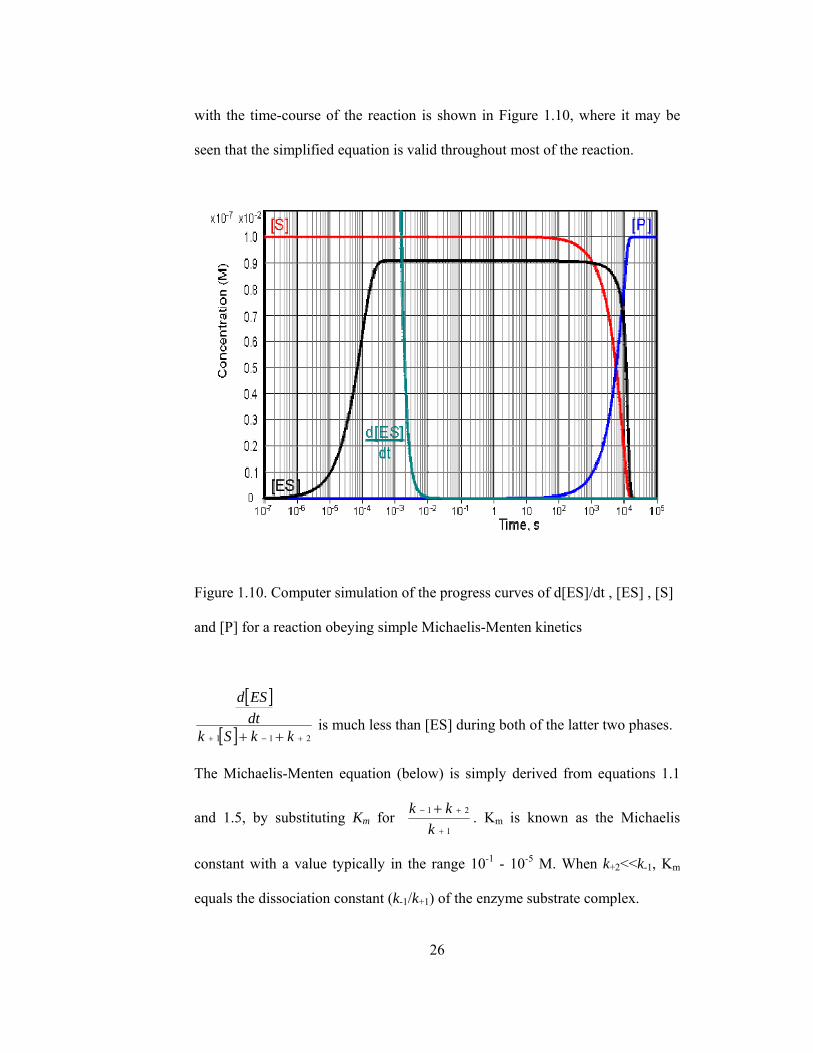
26
with the time-course of the reaction is shown in Figure 1.10, where it may be
seen that the simplified equation is valid throughout most of the reaction.
Figure 1.10. Computer simulation of the progress curves of d[ES]/dt , [ES] , [S]
and [P] for a reaction obeying simple Michaelis-Menten kinetics
[ ]
[ ] 211 +−+ ++ kkSkdtESd
is much less than [ES] during both of the latter two phases.
The Michaelis-Menten equation (below) is simply derived from equations 1.1
and 1.5, by substituting Km for 1
21
+
+− +k
kk . Km is known as the Michaelis
constant with a value typically in the range 10-1 - 10-5 M. When k+2<<k-1, Km
equals the dissociation constant (k-1/k+1) of the enzyme substrate complex.
27
[ ] [ ] [ ][ ] mKS
SEkESkv+
==+
+02
2 (1.7)
or, more simply
[ ][ ] mKS
SVv+
=max (1.8)
where Vmax is the maximum rate of reaction, which occurs when the enzyme is
completely saturated with substrate (i.e. when [S] is very much greater than Km,
Vmax equals k+2[E]0 , as the maximum value [ES] can have is [E]0 when [E]0 is
less than [S]0). Equation 1.8 may be rearranged to show the dependence of the
rate of reaction on the ratio of [S] to Km,
[ ]SK
Vvm
+=
1
max (1.9)
and the rectangular hyperbolic nature of the relationship, having asymptotes at v
= Vmax and [S] = -Km,
(Vmax-v)(Km+[S])=VmaxKm (1.10)
The substrate concentration in these equations is the actual concentration
at the time and, in a closed system, will only be approximately equal to the
initial substrate concentration ([S]0) during the early phase of the reaction.
Hence, it is usual to use these equations to relate the initial rate of reaction to the
initial, and easily predetermined, substrate concentration (Figure 1.11).

28
Figure 1.11 A normalized plot of the initial rate (v0) against initial substrate
concentration ([S]0) for a reaction obeying the Michaelis-Menten kinetics
(equation 1.8).
1.2.2.2 Lineweaver- Burk Plot
The graph of the Michaelis-Menten equation, v0 against [S0] (Figure
1.11), is not entirely satisfactory for the determination of Vmax and Km. Unless
after a series of experiments, there are at least three consistent points on the
plateau of the curve at different [S0] values, then an accurate value of Vmax, and
hence of Km, cannot be obtained: the graph, being a curve, cannot be accurately
extrapolated upwards from values of [S0] which are far from saturating.
Lineweaver and Burk [81] overcame this problem without making any
fresh assumptions. They simply took the Michaelis-Menten equation
[ ][ ] mKS
SVv+
=max

29
and inverted it:
[ ][ ]
[ ][ ] { }0max0max
0
0max
0
0
1SV
KSV
SSVKS
vmm
+=+
= (1.11)
[ ] max0max
11.01
VSVK
vm
+= (1.12)
This is of the form of y=mx + c, which is the equation of a straight line
graph; a plot of y against x has a slope m and intercept c on the y-axis.
A plot of 1/vo against 1/[S0] (the Lineweaver-Burk plot) for systems
obeying the Michaelis-Menten equation is shown in Figure 1.12. the graph being
linear, can be extrapolated even if no experiment has been performed at
anything approximating to a saturating substrate concentration, and from the
extrapolated graph the values of Km and Vmax can be determined as shown in
Figure 1.12.
Figure1.12 The Lineweaver-Burk Plot
1/Vmax
Slope=Km/Vmax
1/ve
loci
ty
-1/Km
1/[substrate

30
1.2.3 Enzyme Immobilization
The term ‘immobilized enzyme’ was adopted at the first Enzyme
Engineering Conference, held at Hennicker, New Hampshire, in 1971. It
describes ‘enzyme physically confined at or localized in a certain region of
space with retention of their catalytic activity, and which can be used repeatedly
and continuously’.[88]
1.2.3.1 Benefits of Enzyme Immobilization
Immoblization is the conversion of enzymes from a water-soluble,
mobile state to a water-insoluble, immobile state. It prevents enzyme diffusion
in the reaction mixtures and facilitate their recovery from the product stream by
solid liquid seperation techniques. The advantages of immobilization are (1)
multiple and repetitive use of a single batch of enzymes; (2) creation of buffer
by the support against changes in pH, temperature and ionic strength in the bulk
solvent, as well as protection from shear forces; (3) no contamination of
processed solution with enzyme; and (4) analytical considerations, especially
with respect to long-life for activity and predictable decay rates. Generally, an
enzyme is attached to a solid support material so that substrate can be
continually converted to product. Thus enzymes can be recycled and used many
times. The goals are to increase the enzyme’s stability, to increase the ability to
recycle the enzyme, and to separate the enzyme easily from the product. .[89]
31
1.2.3.2 Immobilization Methods
When immobilizing an enzyme to a surface, it is most important to
choose a method of attachment that will prevent loss of enzyme activity by not
changing the chemical nature or reactive groups in the binding site of the
enzyme. In other words, attach the enzyme but do as little damage as possible.
Considerable knowledge of the active site of the enzyme will prove helpful in
achieving this task. It is desired to avoid reaction with the essential binding site
group of the enzyme. Alternatively, an active site can be protected during
attachment as long as the protective groups can be removed later on without loss
of enzyme activity. In some cases, this protective function can be fulfilled by a
substrate or a competitive inhibitor of the enzyme.
The surface on which the enzyme is immobilized is responsible for
retaining the structure in the enzyme through hydrogen bonding or the formation
of electron transition complexes. These links will prevent vibration of the
enzyme and thus increase thermal stability. The micro environment of surface
and enzyme has a charged nature that can cause a shift in the optimum pH of the
enzyme. This may be accompanied by a general broadening of the pH region in
which the enzyme can work effectively, allowing enzymes that normally do not
have similar pH regions to work together.
1. Carrier-Binding
The carrier-binding method is the oldest immobilization technique for
enzymes. In this method, the amount of enzyme bound to the carrier and the
32
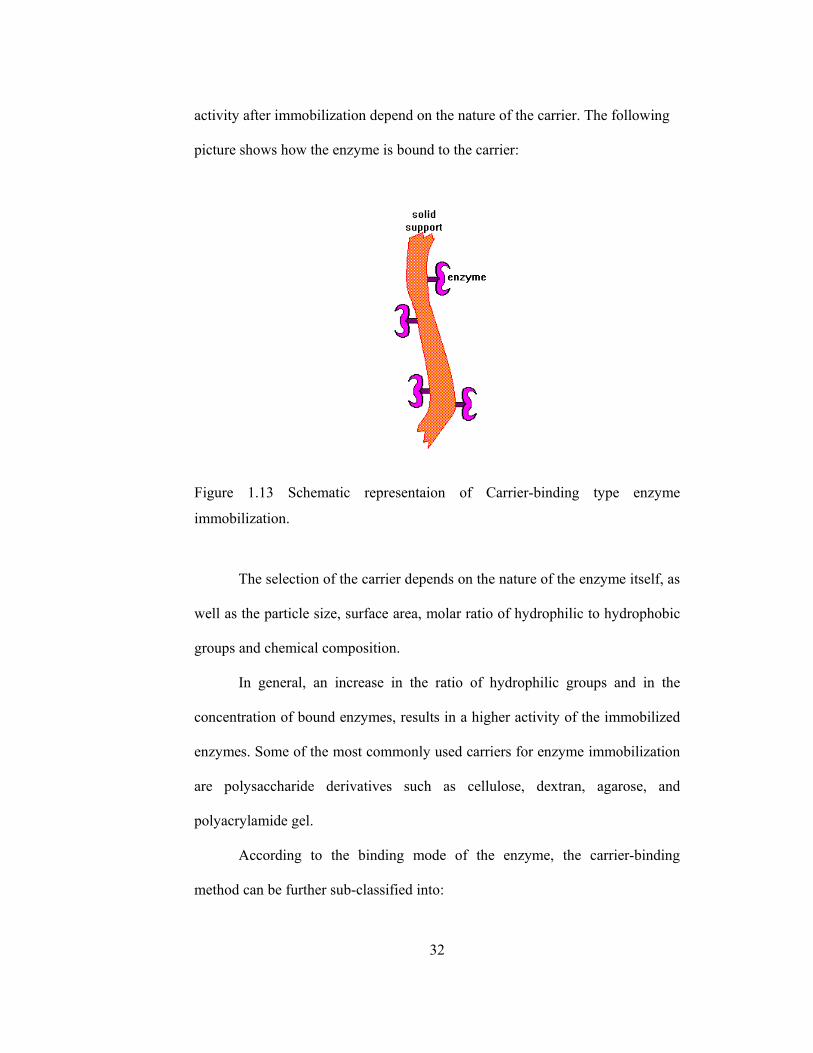
activity after immobilization depend on the nature of the carrier. The following
picture shows how the enzyme is bound to the carrier:
Figure 1.13 Schematic representaion of Carrier-binding type enzyme
immobilization.
The selection of the carrier depends on the nature of the enzyme itself, as
well as the particle size, surface area, molar ratio of hydrophilic to hydrophobic
groups and chemical composition.
In general, an increase in the ratio of hydrophilic groups and in the
concentration of bound enzymes, results in a higher activity of the immobilized
enzymes. Some of the most commonly used carriers for enzyme immobilization
are polysaccharide derivatives such as cellulose, dextran, agarose, and
polyacrylamide gel.
According to the binding mode of the enzyme, the carrier-binding
method can be further sub-classified into:
33
Physical Adsorption
This method for the immobilization of an enzyme is based on the
physical adsorption of enzyme protein on the surface of water-insoluble carriers.
Hence, the method causes little or no conformational change of the enzyme or
destruction of its active center. If a suitable carrier is found, this method can be
both simple and cheap. However, it has the disadvantage that the adsorbed
enzyme may leak from the carrier during use due to a weak binding force
between the enzyme and the carrier [90].
Ionic Binding
The ionic binding method relies on the ionic binding of the enzyme
protein to water-insoluble carriers containing ion-exchange residues.
Polysaccharides and synthetic polymers having ion-exchange centers are
usually used as carriers. The binding of an enzyme to the carrier is easily carried
out, and the conditions are much milder than those needed for the covalent
binding method. Hence, the ionic binding method causes little changes in the
conformation and the active site of the enzyme. Therefore, this method yields
immobilized enzymes with high activity in most cases.
Leakage of enzymes from the carrier may occur in substrate solutions of
high ionic strength or upon variation of pH. This is because the binding forces
between enzyme proteins and carriers are weaker than those in covalent binding.
The main difference between ionic binding and physical adsorption is
that the enzyme to carrier linkages are much stronger for ionic binding although
weaker than in covalent.

34
Covalent Binding
The most intensely studied of the immobilization techniques is the
formation of covalent bonds between the enzyme and the support matrix. When
trying to select the type of reaction by which a given protein should be
immobilized, the choice is limited by two characteristics: (1) the binding
reaction must be performed under conditions that do not cause loss of enzymatic
activity, and (2) the active site of the enzyme must be unaffected by the reagents
used.
The conditions for immobilization by covalent binding are much more
complicated and less mild than in the cases of physical adsorption and ionic
binding. Therefore, covalent binding may alter the conformational structure and
active center of the enzyme, resulting in major loss of activity and/or changes of
the substrate. However, the binding force between enzyme and carrier is so
strong that no leakage of the enzymes occurs, even in the presence of substrate
or solution of high ionic strength.
2. Cross-linking
Immobilization of enzymes has been achieved by intermolecular cross-
linking of the protein, either to other protein molecules or to functional groups
on an insoluble support matrix. Cross-linking an enzyme to itself is both
expensive and insufficient, as some of the protein material will inevitably be
acting mainly as the support. This will result in relatively low enzymatic
activity. Generally, cross-linking is best used in conjunction with one of the
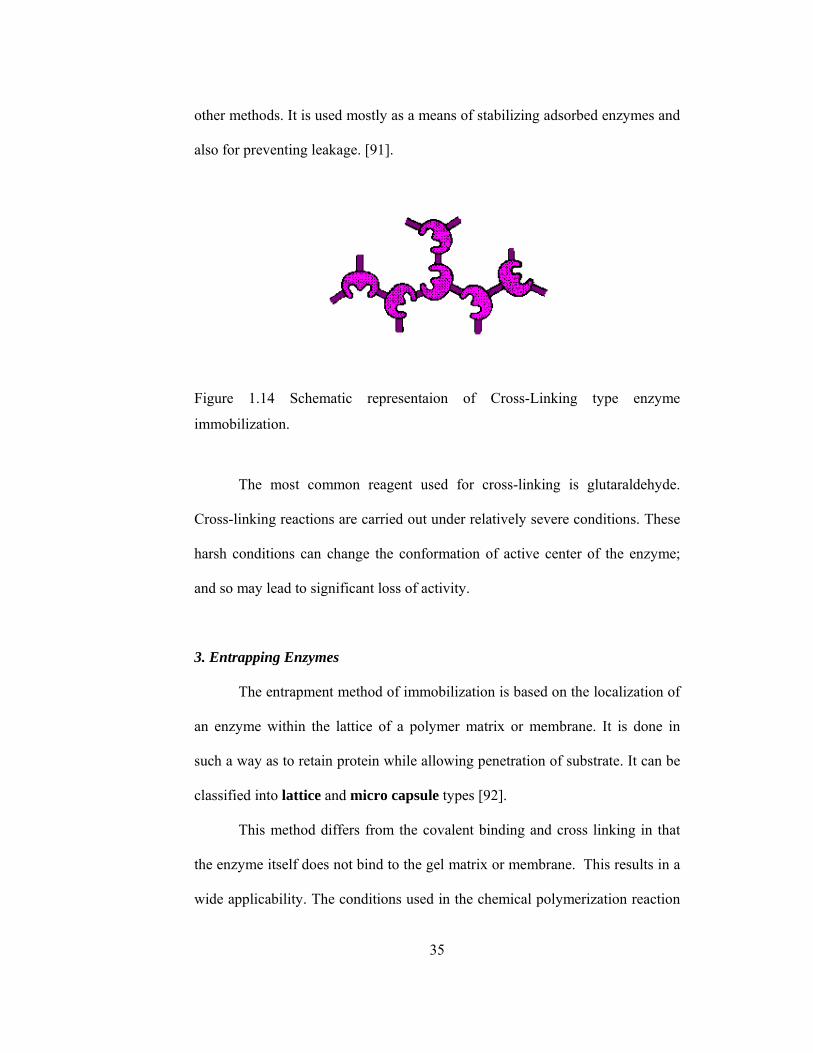
35
other methods. It is used mostly as a means of stabilizing adsorbed enzymes and
also for preventing leakage. [91].
Figure 1.14 Schematic representaion of Cross-Linking type enzyme
immobilization.
The most common reagent used for cross-linking is glutaraldehyde.
Cross-linking reactions are carried out under relatively severe conditions. These
harsh conditions can change the conformation of active center of the enzyme;
and so may lead to significant loss of activity.
3. Entrapping Enzymes
The entrapment method of immobilization is based on the localization of
an enzyme within the lattice of a polymer matrix or membrane. It is done in
such a way as to retain protein while allowing penetration of substrate. It can be
classified into lattice and micro capsule types [92].
This method differs from the covalent binding and cross linking in that
the enzyme itself does not bind to the gel matrix or membrane. This results in a
wide applicability. The conditions used in the chemical polymerization reaction

36
are relatively severe and result in the loss of enzyme activity. Therefore, careful
selection of the most suitable conditions for the immobilization of various
enzymes is required.
Figure 1.15 Schematic representaion of entrapping enzyme
Lattice-Type entrapment involves entrapping enzymes within the
interstitial spaces of a cross-linked water-insoluble polymer. Some synthetic
polymers such as polyarylamide, polyvinylalcohol, etc... and natural polymer
(starch) have been used to immobilize enzymes using this technique.
Microcapsule-Type entrapping involves enclosing the enzymes within
semi permeable polymer membranes.
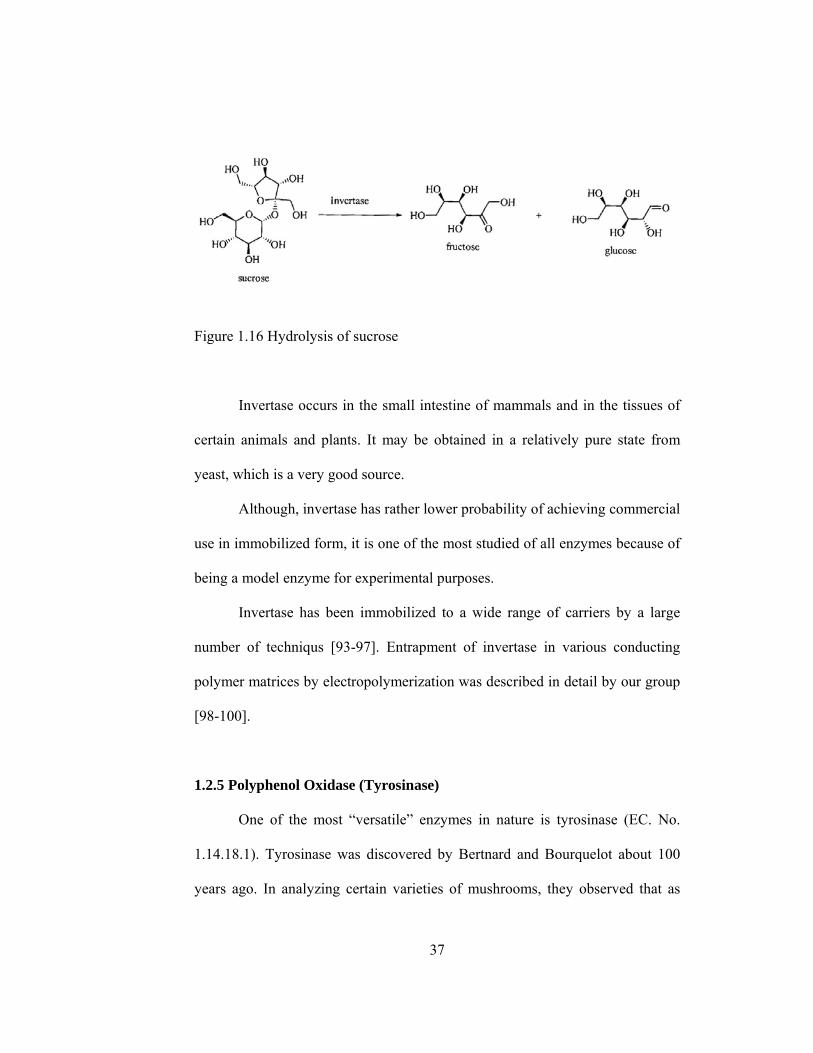
1.2.4 Invertase
β-fructofuranosidase (E.C No.3.2.1.26) catalysis the hydrolysis of
sucrose to glucose and fructose which is known as the invert sugar. Sucrose
crystallizes more readily than invert sugar, so the latter is widely used in the
production of noncrstallizing creams, in making jam and artificial honey.
37
Figure 1.16 Hydrolysis of sucrose
Invertase occurs in the small intestine of mammals and in the tissues of
certain animals and plants. It may be obtained in a relatively pure state from
yeast, which is a very good source.
Although, invertase has rather lower probability of achieving commercial
use in immobilized form, it is one of the most studied of all enzymes because of
being a model enzyme for experimental purposes.
Invertase has been immobilized to a wide range of carriers by a large
number of techniqus [93-97]. Entrapment of invertase in various conducting
polymer matrices by electropolymerization was described in detail by our group
[98-100].
1.2.5 Polyphenol Oxidase (Tyrosinase)
One of the most “versatile” enzymes in nature is tyrosinase (EC. No.
1.14.18.1). Tyrosinase was discovered by Bertnard and Bourquelot about 100
years ago. In analyzing certain varieties of mushrooms, they observed that as

38
oxidation progressed, the mushrooms changed color and finally become dark
brown or black. Subsequently studies showed that this new oxidase catalyzed
the aerobic oxidation of mono-phenols, and the final product of tyrosine
oxidation was melanin [101].
Tyrosinase is a tetramer which weights about 130,000 Daltons. Its active
site contains two copper atoms which exist in three states; met, oxy, and deoxy.
It occurs extensively in the pytogenetic scale. The enzyme is commonly found
in yeast, mushrooms, grapes, bananas, apples, potatoes, frogs and mammals.
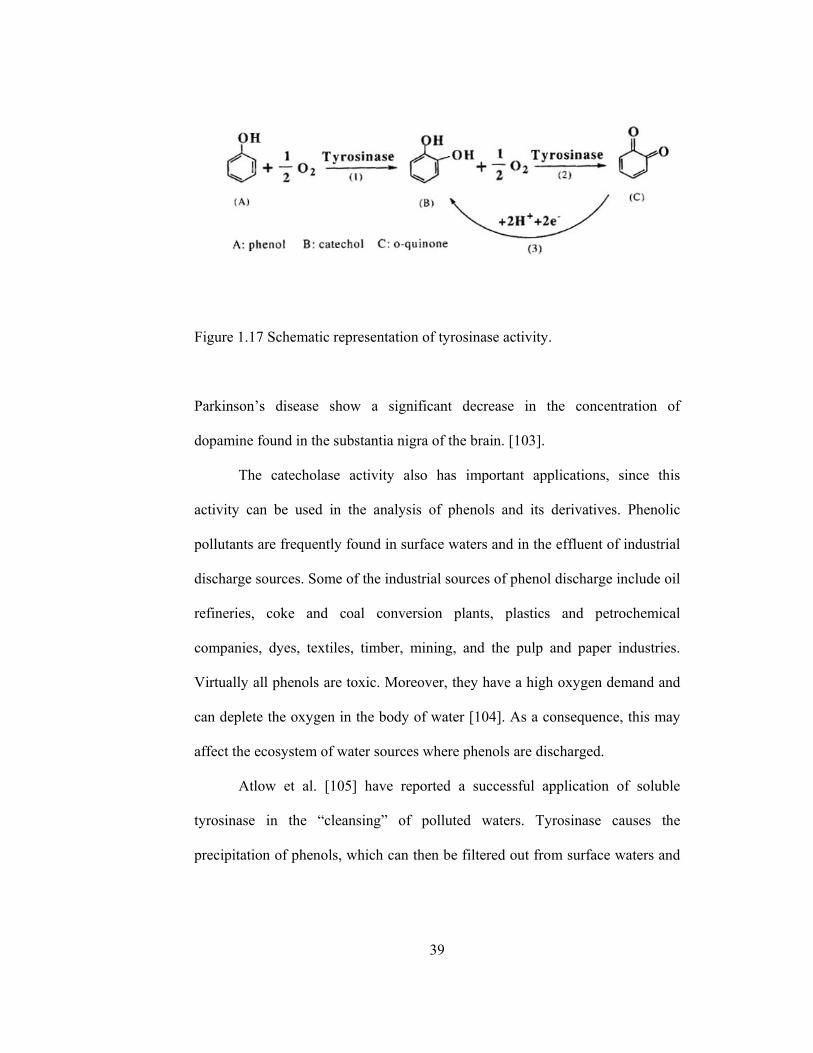
Tyrosinase catalyzes two reactions via separate active sites:
(1) the orthohydroxylation of monophenols, commonly referred to as the
cresolase activity and
(2) the oxidoreduction of orthodiphenols to orthoquinones, commonly
referred to as the catecholase activity.
Tyrosinase catalyzes the synthesis of melanin through the hydoxylation
of tyrosine to dihydoxyphenylalanine (DOPA) and the subsequent oxidation of
DOPA to dopaquinone. The unstable dopaquinone will polymerize and
precipitate into melanin. However, in the presence of a reductor, the reaction
will stop at the diphenol level [102]. The cresolase activity of tyrosinase is of
particular importance because it synthesizes DOPA. DOPA is a precursor of
dopamine, an important neural message transmitter. Patients who suffer from
39
Figure 1.17 Schematic representation of tyrosinase activity.
Parkinson’s disease show a significant decrease in the concentration of
dopamine found in the substantia nigra of the brain. [103].
The catecholase activity also has important applications, since this
activity can be used in the analysis of phenols and its derivatives. Phenolic
pollutants are frequently found in surface waters and in the effluent of industrial
discharge sources. Some of the industrial sources of phenol discharge include oil
refineries, coke and coal conversion plants, plastics and petrochemical
companies, dyes, textiles, timber, mining, and the pulp and paper industries.
Virtually all phenols are toxic. Moreover, they have a high oxygen demand and
can deplete the oxygen in the body of water [104]. As a consequence, this may
affect the ecosystem of water sources where phenols are discharged.
Atlow et al. [105] have reported a successful application of soluble
tyrosinase in the “cleansing” of polluted waters. Tyrosinase causes the
precipitation of phenols, which can then be filtered out from surface waters and
40
industrial discharge sources. The enzyme has also been used as a sensor to
detect the concentration of phenols in waste water [106-107].
The detection of phenols is not only of importance in industry but also in
the medical field. Tyrosinase has been used as part of an enzyme-electrode
system to detect catechols and assess catecholamines in the urine of patients
with neural crest tumors [108].
Tyrosinase also has applications in the food industry, as it is responsible
for the browning of fruits and vegetables. Interest in the enzyme has been
demonstrated by tannin oil companies due to the role that it plays in
melanogenesis. Also, it has been considered for use in melanin-related disorders,
such as albinism, vitiligo, and melanoma [109].
Although tyrosinase has widespread applications, its use is limited by its
inherent instability and rapid inactivation. By using enzyme immobilization
technology, good operational stability and long-term stability can be achieved
for tyrosinase.
1.2.6 Phenolics in Wines
Wine contains many phenolic substances. The phenolics have a number
of important functions in wine affect the tastes of bitterness and astringency,
especially in red wines. Second, the color of red wine is caused by phenolics.
They are also bactericidal agents and impart antioxidant properties, being
especially found in the skin and seeds of the grapes.
There are two types of phenols in wines. “flavonoids” and “non-
flavonoids”. The flavonoids are composed of three benzene rings and react

41
readily, binding to other molecules and there are between 6,000 and 8,000
species of flavonoids. A group of flavonoids, called the flavon-3-ols, have been
well characterized in wine. Flavon-3-ols are usually concentrated in grape seeds,
stems and skin. When these parts of the grape are left in for as long as possible
during the wine-making process, more flavon-3-ols end up in the resulting wine
than if the seeds, stems and skin are removed earlier.
The non-flavonoids in wine comprise many classes of chemicals
including hydroxycinnamates, benzoates, and stilbenes. Much ado has been
made in the media about the health benefits of a particular kind of stilbene,
called "resveratrol," which is unique to grapes and is not found in other fruits or
vegetables.
The chemical composition of a wine is influenced by the climatic and
atmospheric conditions, soil type, vine cultivation and the treatment to which it
is subjected. Due to this reason amount of phenolics vary from one brand and
type of wine to another. Process difference cause red wines to contain almost ten
times higher amount of phenolics.
The typical methods for the determination of phenolic compounds are
gas and liquid chromatography. These methods involve complex sample pre-
treatment procedures and are unsuitable for on site or field based analyses.
A biosensing approach with advantages of high specificity, high
sensitivity and rapid detection mechanism may provide a solution [110, 111]. In
this study immobilization of polyphenol oxidase enzyme in a conducting
polymer electrode was studied as an alternative method for the determination of
phenolic compounds.

42
1.3 Aim of the Study
(a) To achieve the synthesis of menthyl ester of 3-thiophene acetic acid and
characterization.
(b) To synthesize the conducting copolymers of menthyl ester of 3-
thiophene acetic acid with thiophene or pyrrole and to investigate the
electrochemical, thermal, morphological and conducting properties of
resultant copolymers.
(c) To check the possibility of enzyme immobilization, invertase and
tyrosinase, in copolymers obtained via electrochemical polymerization
and to characterize the enzyme electrodes.
(d) To determine the phenolic compound concentration in red wines by
using the tyrosinase electrodes.
43
CHAPTER 2
EXPERIMENTAL
2.1 Chemicals
Acetonitrile (AN) (Merck), methanol (Merck), nitromethane
(NM) (Sigma), tetrabutylammonium tetrafluoroborate (TBAFB), p-toluene
sulfonic acid (PTSA) (Sigma) and sodium dodecylsulfate (SDS) (Aldrich) were
used without further purification. Pyrrole and thiophene (Aldrich) were distilled
just before use. Dichloromethane was purified by usual methods and dried over
CaH2 or Na wire. Thiophene-3-acetic acid (Fluka) and menthol (Fluka) were
used as received.
Invertase (β-fructofuranoxidase), type V (E.C no 3.2.1.26) and
Tyrosinase (PPO) [E.C 1.14.18.1] was purchased from Sigma. Substrate for
invertase, sucrose, was obtained from Merck. For the preparation of Nelson
Reagent that is used in the assay of invertase activity, sodium carbonate (Riedel
de Haen), sodium potassium tartarate (Riedel de Haen), sodium bicarbonate
(Merck), sodium sulfate (Merck), copper sulfate (Merck) were used as received.
For the preparation of
44
arsenomolibdate reagent, ammonium heptamolibdate (Merck) sodium hydogen
arsenate (Merck) were used as received
3-methyl-2-benzothiozolinone (MBTH), acetone and sulfuric acid used
in spectrophotometric activity determination of PPO were also obtained from
Sigma. For the preparation of citrate buffer, tri-sodium citrate-2 hydrate and
citric acid were used as received. Catechol was purchased from Sigma. All
catechol solutions were prepared in citrate buffer.
Bovine serum albumin and Folin & Ciocalteu’s Phenol Reagent (Sigma)
were used as purchased
2.2 Instrumentation
2.2.1 Electolysis
The electrochemical techniques generally used in the electrochemical
synthesis of conducting polymers are constant potential (potentiometric) or
constant current (galvanostatic) electrolysis.
Constant current electrolysis (CCE) is carried out in a two electrode
system which are working and counter electrodes. The current is controlled
during the electrolysis and the potential is allowed to alter. The film thickness
can be easily controlled by inspection of the polymerization time. The increase
in the film resistance may cause variation of potential which may lead to side
reactions.
45
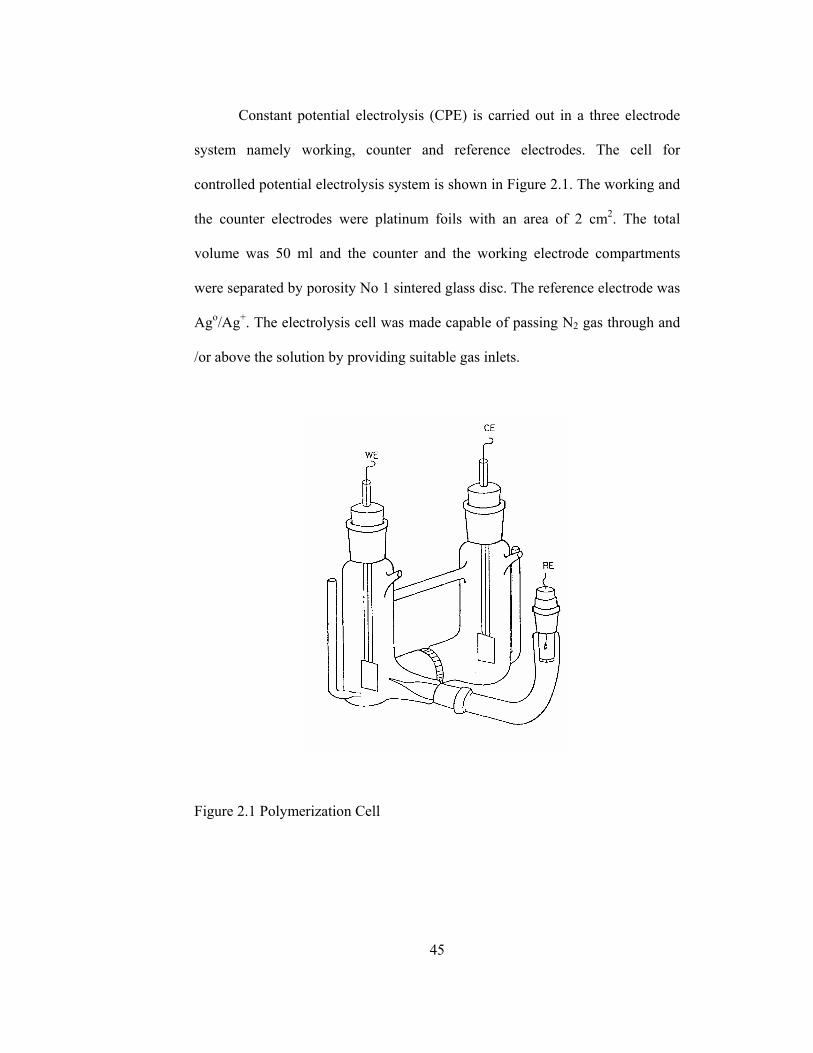
Constant potential electrolysis (CPE) is carried out in a three electrode
system namely working, counter and reference electrodes. The cell for
controlled potential electrolysis system is shown in Figure 2.1. The working and
the counter electrodes were platinum foils with an area of 2 cm2. The total
volume was 50 ml and the counter and the working electrode compartments
were separated by porosity No 1 sintered glass disc. The reference electrode was
Ago/Ag+. The electrolysis cell was made capable of passing N2 gas through and
/or above the solution by providing suitable gas inlets.
Figure 2.1 Polymerization Cell

46
The voltage between the working and the reference electrodes is called as the
polymerization potential (Epot). The applied potential is determined by cyclic
voltammetry.
2.2.2 Cyclic Voltammetry (CV) System
The CV system was composed of a potentiostat, a function generator, an
XY recorder, and a cyclic voltammetry cell. Function generator or wave
generator applies a triangular wave potential to the cell so that the working
electrode potential is swept linearly through the voltammetric wave and then
backs again (Figure 2.2). During these scans, potential-time response and I-V
curves are obtained.
Figure 2.2 Triangular wave function

47
A typical cyclic voltammogram recorded for a reversible single electrode
transfer reaction is shown in Figure 2.3. Solution contains only a single
electrochemical reactant. The forward scan produces a current peak for any
analyte that can be reduced through the range of the potential scan. The current
will increase as the potential reaches the reduction potential of the analyte, but
then falls off as the concentration of the analyte is depleted close to the electrode
surface. As the applied potential is reversed, it will reach a potential that will
reoxidize the product formed in the first reduction reaction, and produce a
current of reverse polarity from the forward scan. This oxidation peak will
usually have a similar shape to the reduction peak. The peak current, ip, is
described by the Randles-Sevcik equation:
ip = (2.69x10⁵) n3/2 A C D1/2 v1/2 . (2.1)
where n is the number of moles of electrons transferred in the reaction, A is the
area of the electrode, C is the analyte concentration (in moles/cm3), D is the
diffusion coefficient, and v is the scan rate of the applied potential.
For a reversible electrochemical reaction the CV recorded has certain
well defined characteristics.
I) The voltage separation between the current peaks is
mVn
EEE cp
ap
59==∆ − . (2.2)
II) The positions of peak voltage do not alter as a function of voltage scan rate
III) The ratio of the peak currents is equal to one
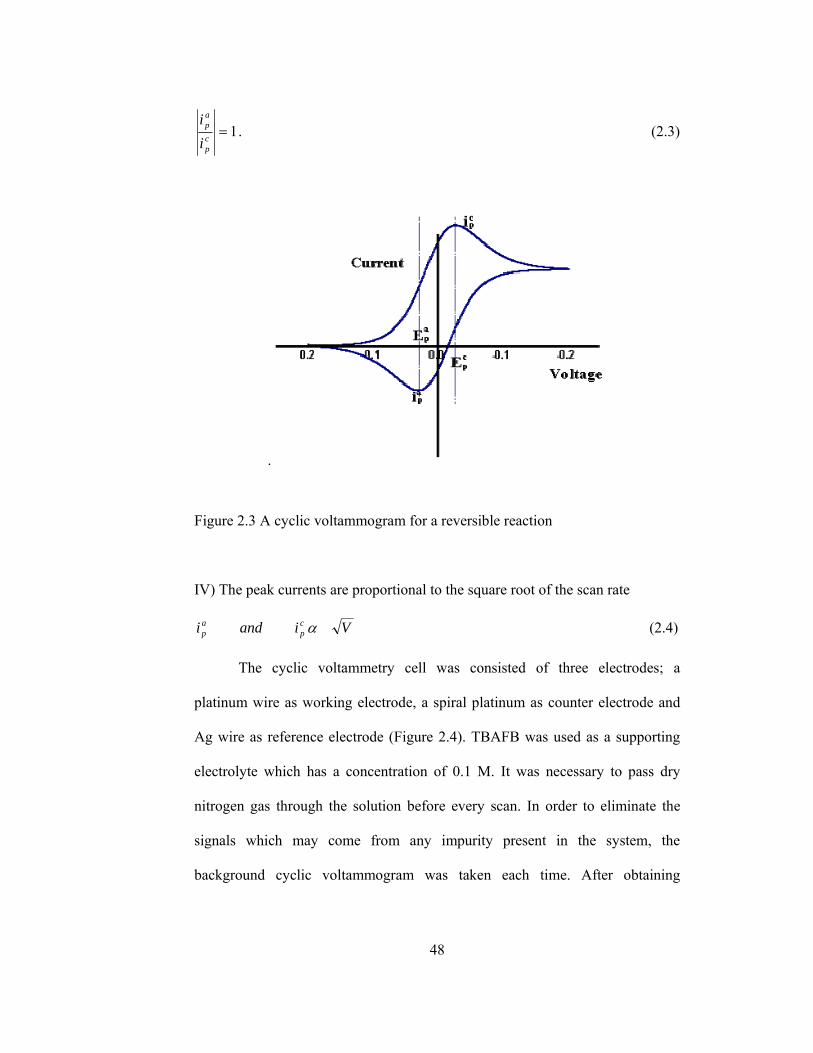
48
1=cp
ap
ii
. (2.3)
.
Figure 2.3 A cyclic voltammogram for a reversible reaction
IV) The peak currents are proportional to the square root of the scan rate
Viandi cp
ap α (2.4)
The cyclic voltammetry cell was consisted of three electrodes; a
platinum wire as working electrode, a spiral platinum as counter electrode and
Ag wire as reference electrode (Figure 2.4). TBAFB was used as a supporting
electrolyte which has a concentration of 0.1 M. It was necessary to pass dry
nitrogen gas through the solution before every scan. In order to eliminate the
signals which may come from any impurity present in the system, the
background cyclic voltammogram was taken each time. After obtaining
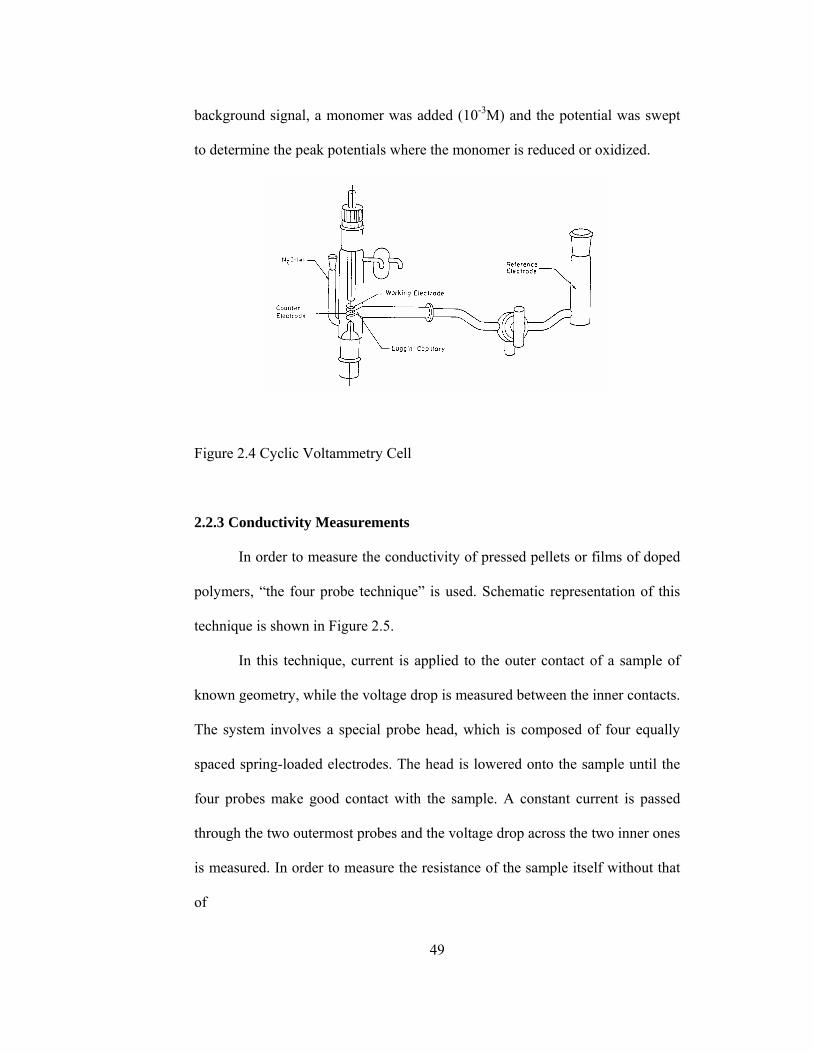
49
background signal, a monomer was added (10-3M) and the potential was swept
to determine the peak potentials where the monomer is reduced or oxidized.
Figure 2.4 Cyclic Voltammetry Cell
2.2.3 Conductivity Measurements
In order to measure the conductivity of pressed pellets or films of doped
polymers, “the four probe technique” is used. Schematic representation of this
technique is shown in Figure 2.5.
In this technique, current is applied to the outer contact of a sample of
known geometry, while the voltage drop is measured between the inner contacts.
The system involves a special probe head, which is composed of four equally
spaced spring-loaded electrodes. The head is lowered onto the sample until the
four probes make good contact with the sample. A constant current is passed
through the two outermost probes and the voltage drop across the two inner ones
is measured. In order to measure the resistance of the sample itself without that
of
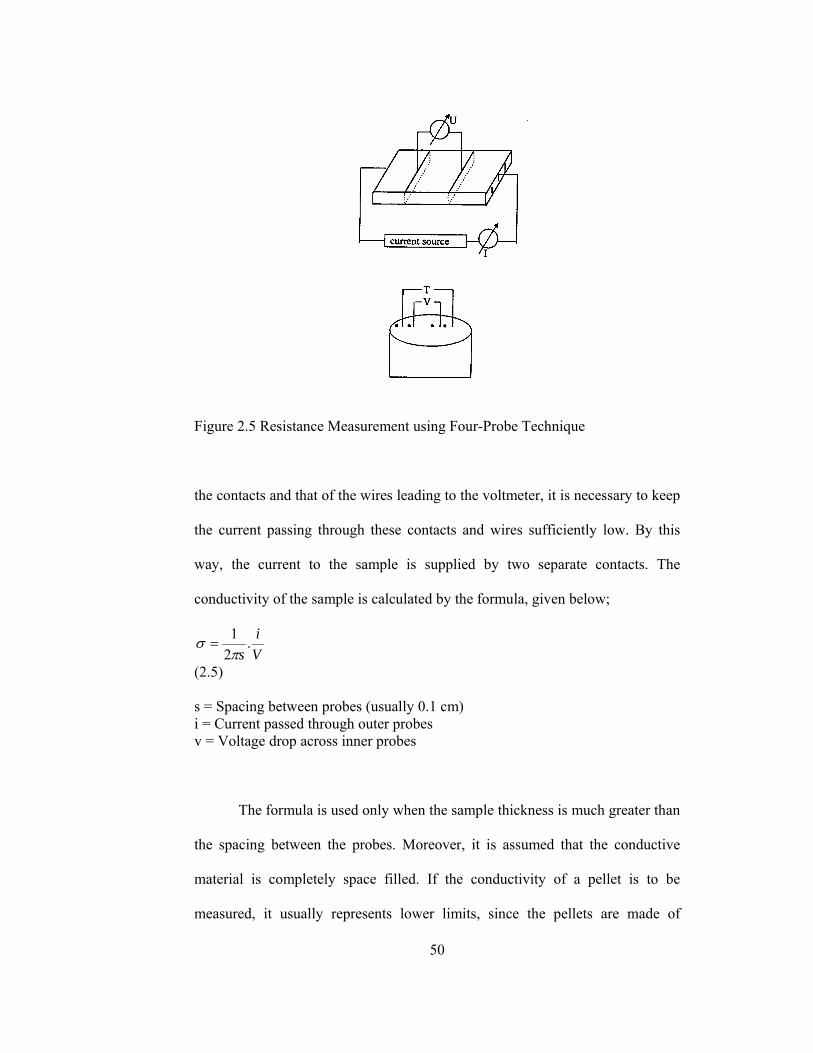
50
Figure 2.5 Resistance Measurement using Four-Probe Technique
the contacts and that of the wires leading to the voltmeter, it is necessary to keep
the current passing through these contacts and wires sufficiently low. By this
way, the current to the sample is supplied by two separate contacts. The
conductivity of the sample is calculated by the formula, given below;
Vi
s.
21π
σ =
(2.5) s = Spacing between probes (usually 0.1 cm) i = Current passed through outer probes v = Voltage drop across inner probes
The formula is used only when the sample thickness is much greater than
the spacing between the probes. Moreover, it is assumed that the conductive
material is completely space filled. If the conductivity of a pellet is to be
measured, it usually represents lower limits, since the pellets are made of

51
compact powders, which contain various amount of void space. Conductivities
of compact powder pellets of materials can be as small as a factor of 102 than
that of a completely space filled materials.
2.2.4 Thermal Analysis
Thermal characterization of polymers was carried out using a Dupont
modular thermal analyzer system in conjunction with 951 Thermal Gravimetric
Analyzer and 910 Differential Scanning Calorimeter. Thermal gravimetry
analysis (TGA) experiments were performed under a dry nitrogen purge. A
constant heating rate of 10ºC/min was used during differential scanning
calorimetry (DSC) experiments.
2.2.5 Nuclear Magnetic Resonance Spectrometer
NMR spectra were registered on a Bruker-NMR Spectrometer (DPX-
400) instrument.
2.2.6 Fourier Transform Infrared Spectrophotometer (FTIR)
The FTIR spectra of conducting polymer blends were measured as
dispersed in KBr pellets, using a Nicolet-510 FTIR and Mattson 1000 FTIR
Spectrometer.
2.2.7 Scanning Electron Microscope (SEM)
The morphological studies on composite films were done by a JEOL
Scanning Microscope Model JSM-6400.
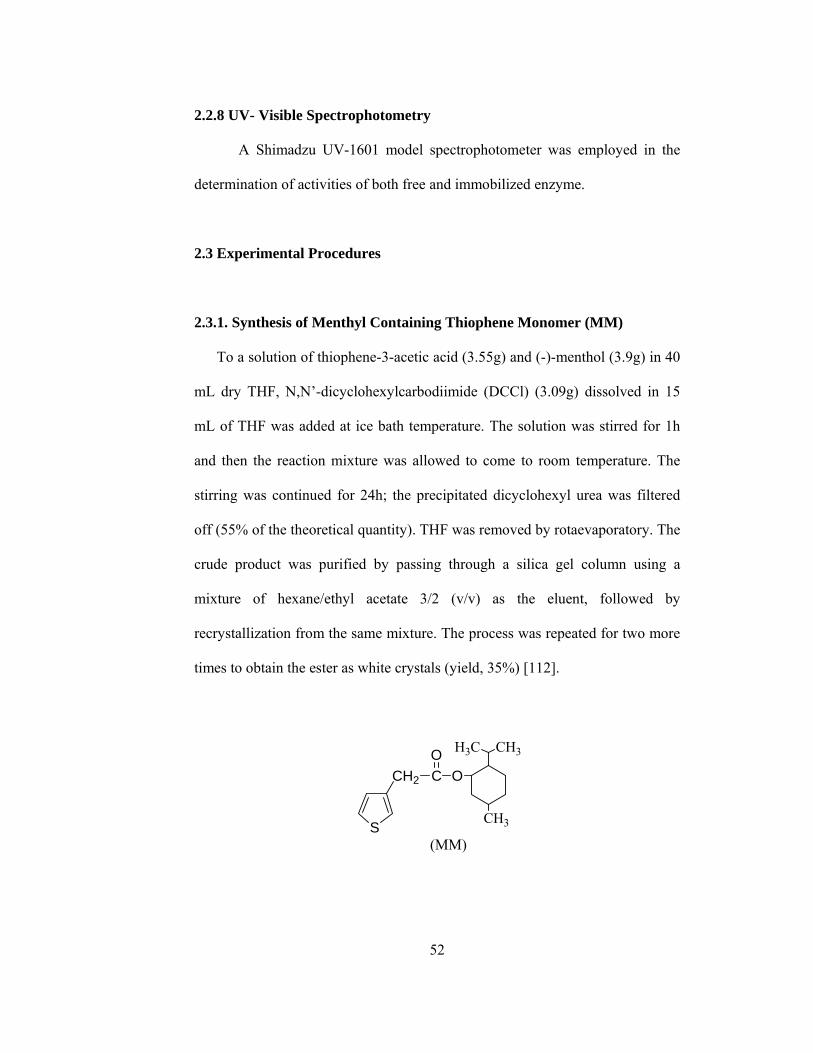
52
2.2.8 UV- Visible Spectrophotometry
A Shimadzu UV-1601 model spectrophotometer was employed in the
determination of activities of both free and immobilized enzyme.
2.3 Experimental Procedures
2.3.1. Synthesis of Menthyl Containing Thiophene Monomer (MM)
To a solution of thiophene-3-acetic acid (3.55g) and (-)-menthol (3.9g) in 40
mL dry THF, N,N’-dicyclohexylcarbodiimide (DCCl) (3.09g) dissolved in 15
mL of THF was added at ice bath temperature. The solution was stirred for 1h
and then the reaction mixture was allowed to come to room temperature. The
stirring was continued for 24h; the precipitated dicyclohexyl urea was filtered
off (55% of the theoretical quantity). THF was removed by rotaevaporatory. The
crude product was purified by passing through a silica gel column using a
mixture of hexane/ethyl acetate 3/2 (v/v) as the eluent, followed by
recrystallization from the same mixture. The process was repeated for two more
times to obtain the ester as white crystals (yield, 35%) [112].
(MM)
S
CH2 CO
O
CH3
CH3H3C

53
2.3.2 Synthesis of Copolymers of MM
2.3.2.1 Synthesis of Copolymers of MM with Pyrrole (PM-1, PM-2)
Working electrode (Pt, 2cm2) was coated with 1% w/v MM –
dichloromethane solution. Electrolyses were performed in the presence of 0.02
M pyrrole (Py), 0.05M p-toluene sulfonic acid (PTSA), or 0.05M sodium
dodecyl sulphate (SDS) in water. 1.0V was applied for 90 min. Same procedure
was repeated for Acetonitrile (AN)/tetrabutylammonium tetrafluoroborate
(TBAFB) system, where 50 mg MM was dissolved in the solution (Figure 2.6)
[112].
S
CH2 C
O
O
CH3
CH3H3C
NH
(
PTSA or SDS/water
Pyrrole
PM-1for PTSAand PM-2 for SDS doped copolymers
PtAN/TBAFB
MM, PyrroleNo product other than polypyrrole
NH
( )n)nMM coated Pt
Figure 2.6. Synthesis of copolymers of MM with pyrrole.
2.3.2.2 Synthesis of Copolymers of MM with Thiophene
Copolymerization of thiophene must take place in acetonitrile since
thiophene is completely insoluble in water. 0.05M TBAFB in acetonitrile was

54
used as the supporting electrolyte and a constant potential of 2.0 V was applied
for 2 h to a solution containing 50 mg MM (Figure 2.7)
PtAN/TBAFB
MM,Thiopheneno product
Figure 2.7. Synthesis of copolymers of MM with thiophene
2.3.3 Chemical Polymerization of MM (CN)
100 mg MM was dissolved in 5mL CCl4 and put in three-necked flask.
Nitromethane solution of FeCl3 (2 M) was added dropwise to the solution of
MM at 0 ˚C (Figure 2.8). The reaction was carried out for 24 h under constant
flow of nitrogen and continuous stirring. After 24 h, this mixture was poured
onto methanol, and then water was added until precipitate was observed. The
precipitate was washed several times with water and methanol and dried under
vacuum. The product was named as CN. The yield was 40% (CN) [112].
S
CH2 CO
O
CH3
CH3H3C
MMFeCl3
Nitromethane ( )n
(CN)
Figure 2.8. Chemical polymerization of MM

55
2.3.4 Galvanostatic Polymerization of MM (GDM)
Constant current electrolyses were performed in one component cell with
two Pt electrodes as the working (2cm2) and counter electrodes (2cm2).
Acetonitrile/TBAFB and dichloromethane (DCM)/TBAFB were used as the
electrolysis media. For each medium, 100 mg monomer was introduced and
electrolyses were carried at 20 mA for 90 min (Figure 2.9). Throughout this
time, the cell was in ice bath. A black precipitate was obtained at the end of both
electrolyses. After filtering and washing with water to remove TBAFB, the
precipitate (GDM) was dried under vacuum.
S
CH2 CO
O
CH3
CH3H3C
PtAN or DCM/TBAFB (GDM)
MM( )n
Figure 2.9 Galvanostatic polymerization of MM
2.3.5 Synthesis of Block Copolymers of CN and GDM with Pyrrole (CNPP,
CNPS, PGDM)
A Pt working electrode (2cm2) was coated either with chemically
synthesized polymer, CN, or galvanostatically synthesized polymer GDM from
their DCM solution. CNPP and CNPS were synthesized in water using PTSA or
SDS electrolytes respectively. Since GDM is insoluble in water,
copolymerization with pyrrole was carried out in water/PTSA
solvent/electrolyte couple (Figure 2.10) [112].
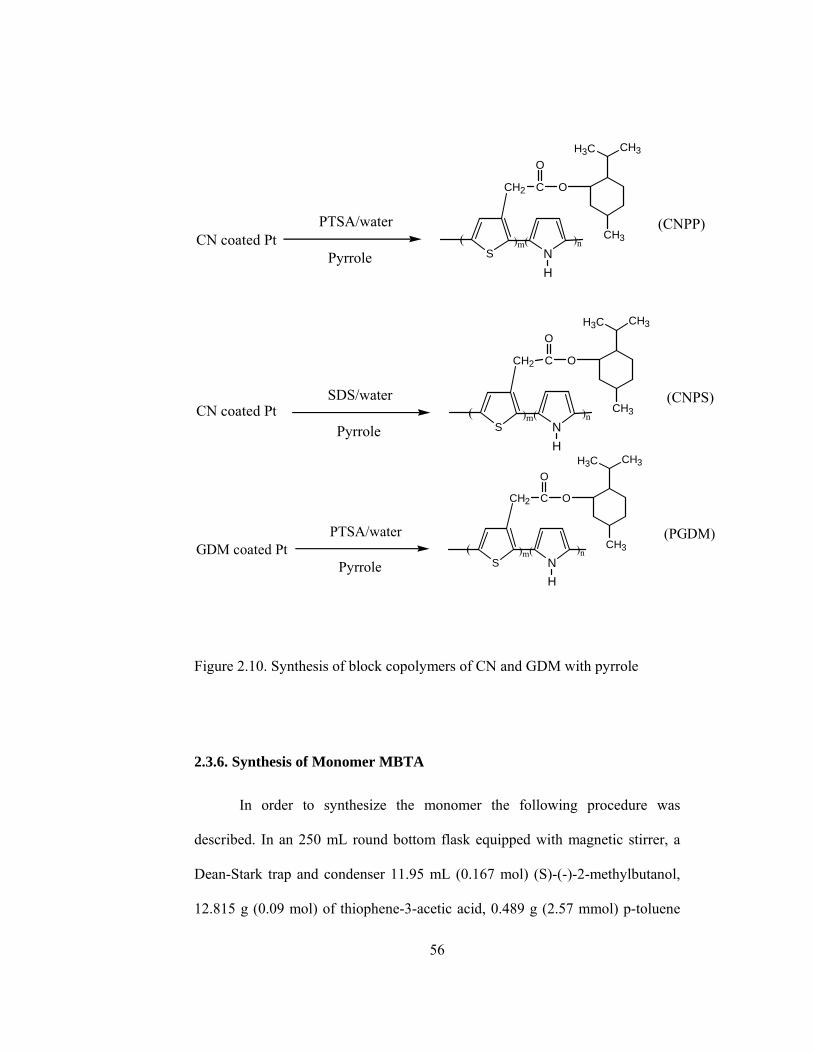
56
PTSA/water
Pyrrole S
CH2 C
O
O
CH3
CH3H3C
NH
)n)m(((CNPP)
CN coated Pt
SDS/water
Pyrrole S
CH2 C
O
O
CH3
CH3H3C
NH
)n)m(((CNPS)
CN coated Pt
PTSA/water
Pyrrole S
CH2 C
O
O
CH3
CH3H3C
NH
)n)m(((PGDM)
GDM coated Pt
Figure 2.10. Synthesis of block copolymers of CN and GDM with pyrrole
2.3.6. Synthesis of Monomer MBTA
In order to synthesize the monomer the following procedure was
described. In an 250 mL round bottom flask equipped with magnetic stirrer, a
Dean-Stark trap and condenser 11.95 mL (0.167 mol) (S)-(-)-2-methylbutanol,
12.815 g (0.09 mol) of thiophene-3-acetic acid, 0.489 g (2.57 mmol) p-toluene
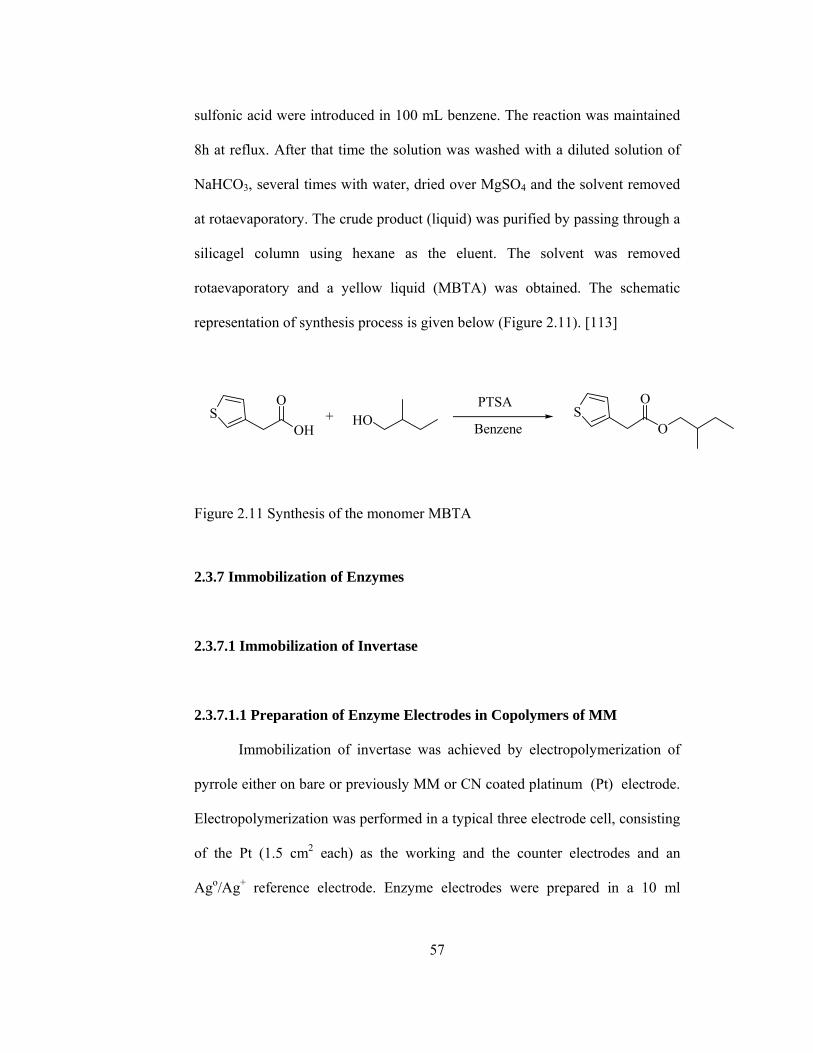
57
sulfonic acid were introduced in 100 mL benzene. The reaction was maintained
8h at reflux. After that time the solution was washed with a diluted solution of
NaHCO3, several times with water, dried over MgSO4 and the solvent removed
at rotaevaporatory. The crude product (liquid) was purified by passing through a
silicagel column using hexane as the eluent. The solvent was removed
rotaevaporatory and a yellow liquid (MBTA) was obtained. The schematic
representation of synthesis process is given below (Figure 2.11). [113]
Figure 2.11 Synthesis of the monomer MBTA
2.3.7 Immobilization of Enzymes
2.3.7.1 Immobilization of Invertase
2.3.7.1.1 Preparation of Enzyme Electrodes in Copolymers of MM
Immobilization of invertase was achieved by electropolymerization of
pyrrole either on bare or previously MM or CN coated platinum (Pt) electrode.
Electropolymerization was performed in a typical three electrode cell, consisting
of the Pt (1.5 cm2 each) as the working and the counter electrodes and an
Ago/Ag+ reference electrode. Enzyme electrodes were prepared in a 10 ml
SO
OS
O
OH+ HO
PTSA
Benzene
58
acetate buffer containing 0.4 mg/ml invertase, 0.4 mg/ml SDS and 0.01M
pyrrole. Immobilization was carried out at a constant potential of +1.0V for 30
min at room temperature. The reaction between pyrrole and thiophene moiety on
MM and CN yields conducting copolymers which entrap invertase. Enzyme
electrodes were kept at 4°C in acetate buffer solution when not in use.
2.3.7.1.2 Determination of Invertase Activity
The activities of free and immobilized enzyme were determined using
Nelson’s method. Nelson’s Reagent was composed of two solutions, which are
reagent A and reagent B. Sodium carbonate (25g), sodium potassium tartarate
(25g), sodium bicarbonate (20g), sodium sulfate (200g) were dissolved in
distilled water and diluted to 1L for the preparation of Reagent A. Reagent B
was obtained by dissolving copper sulfate (15g) in 100 mL distilled water.
Finally Nelson Reagent was prepared by mixing Reagent A and B in 25:1 (v/v).
Arsenomolibdate reagent was obtained by dissolving ammonium
heptamolibdate (25g), in 450 mL distilled water and 21 mL concentrated
sulfuric acid. Sodium hydrogen arsenate (3g) was dissolved in distilled water
and added to the above solution . The resultant solution was incubated for 24-48
hours at 37 ºC and stored in dark.
For the determination of free invertase activity different concentration of
invertase solutions (0,001- 0,01 mg/mL) were vortexed and then 0.1 ml 0.3M
sucrose solution added to start the reaction (pH = 4.6). After 2 min, 1ml Nelson
reagent was added to stop the reaction. After 20 minutes of incubation in boiling
59
water bath, 1ml of arsenomolibdate solution and 7 ml distilled water were added
to each test tube. After mixing, absorbance was measured at 540nm.
For immobilized invertase, sucrose solution in buffer were placed in test
tubes and put in a water bath at 25°C. Enzyme electrode was immersed in a test
tube and shaken for 2 min. The rest of procedure was the same as for free
enzyme activity measurements.
2.3.7.1.3 Kinetic Parameters for Immobilized Invertase
Kinetic studies of the enzymatic reaction for both free and immobilized
enzyme were performed at varying concentrations of sucrose. Activity assay
performed according to Section 1.3.6.1.2.
2.3.7.1.4 Determination of Optimum Temperature for Immobilized
Invertase
Optimum temperature determinations were carried out by changing
incubation temperature between 10°C and 80°C, in a constant sucrose
concentration (10 Km) for each temperature. The rest of the procedure was the
same as the invertase activity measurements described in section 1.3.6.1.2.
2.3.7.1.5 Determination of Operational and Storage Stability for Immobilized
Invertase
Stability of electrodes in terms of repetitive uses was performed in more
than 25 successive measurements. In order to determine the storage stability of

60
enzyme electrodes were preserved in buffer solution at 4ºC, their activities were
measured daily for more than 60 days.
2.3.7.1.6 Morphologies of Invertase-Entrapped Films
Enzyme immobilization procedure was carried out until obtaining free
standing films. After washing with buffer solution to remove unbound enzyme
and supporting electrolyte, SEM analysis was performed.
2.3.7.2 Immobilization of Polyphenol Oxidase (PPO)
2.3.7.2.1 Preparation of Enzyme Electrodes in Copolymers of MM
Thiophene functionalized menthyl monomer (MM) was used to
synthesize copolymers with pyrrole which at the end, form a matrix for
immobilization of PPO. Immobilization of PPO was achieved by
electropolymerization of pyrrole either on bare or previously MM or CN coated
platinum (Pt) electrode.
Electropolymerization was performed in a typical three electrode cell,
consisting of the Pt (1.5 cm2 each) as the working and counter electrodes and a
Ag0/Ag+ reference electrode.
Enzyme electrodes were prepared in 10 ml citrate buffer (pH=6.5)
containing 1 mg/ml SDS as the supporting electrolyte, 0.01M pyrrole and 0.3
mg/ml PPO. Immobilization was carried out at a constant potential of +1.0V.

61
The reaction between pyrrole and thiophene moiety of MM yields
conducting copolymers which entrap PPO within. Enzyme electrodes were kept
at 4°C in citrate buffer solution when not in use.
2.3.7.2.2 Preparation of Enzyme Electrodes in Copolymers of MBTA
The homo-polymerization of MBTA was achieved by constant current
electrolysis in one compartment cell consisting of platinum working and
counter electrodes. Experiments were carried out in dichloromethane (10mL)–
tetrabutylammonium tetrafluoroborate (TBAFB) (0.2 M) solvent-electrolyte
system with 50 mg monomer at 0°C using 30 mA for 10 min. [112]
Immobilization of polyphenol oxidase (PPO) was achieved by
electropolymerization of pyrrole on previously PMBTA coated platinum
electrode. The solution consists 0.3 mg ml-1 polyphenol oxidase, 0.6 mg ml-1
supporting electrolyte (sodium dodecyl sulfate) and 0.01M pyrrole and 10 ml
citrate buffer (pH=6.5). Immobilization was performed in a typical three
electrode cell, consisting of the Pt working and counter electrodes and a Ag/Ag+
reference electrode. Immobilization was carried out at a constant potential of
+1.0 V for min at room temperature. Enzyme electrodes were kept at 4°C in
citrate buffer solution when not in use.
2.3.7.2.3 Determination of PPO Activity
The activities of free and immobilized PPO was determined by using
Besthorn’s Hydrazone Method.

62
Besthorn’s Hydrazone Method [114] includes spectrophotometric
measurements. In this method 3-methyl-2-benzothiozolinone (MBTH) interacts
with the quinones produced by the enzyme to yield red products instead of
brown colored pigments in the absence of the color reagent [115]. The pathway
proposed by Rodriguez et al is shown in Figure 2.12 [116].
Figure 2.12 Schematic representation of Besthorn’s Hydrazone Method
For the determination of free PPO activity different concentrations of
catechol were prepared. Solutions contain 1.0 ml citrate buffer, 0.5 ml MBTH
(0.3% in ethanol) and 0.5 ml catechol. 1 minute of reaction time was given after
the addition of 0.5 ml enzyme solution (0.1mg/ml). 0.5 ml sulfuric acid (5% v/v)
was added to stop the enzymatic reaction. Quinone produced reacts with MBTH
to form a red color complex and this complex was dissolved by adding 3.0 ml
63
acetone in the test tube. After mixing, absorbance was measured at 495 nm by
using a Shimadzu UV-Visible spectrophotometer.
For immobilized PPO, different concentrations of catechol were prepared
(3.0 ml) and put in water bath at 25°C. 1 ml MBTH solution was added. Enzyme
electrode immersed in the solution and shaken for 5 minutes. 1 ml sulfuric acid
and 1 ml acetone were added for a total volume of 6 ml. After mixing,
absorbances were measured at 495 nm.
2.3.7.2.4 Kinetic Parameters for Free and Immobilized PPO
Kinetic studies of the enzymatic reaction for both free and immobilized
PPO were performed at varying concentrations of catechol. Activity assay
performed according to Section 1.3.6.2.2.
2.3.7.2.5 Determination of Optimum Temperature and pH of Immobilized
PPO
Optimum temperature and pH determinations were carried out by
changing incubation temperature and pH between 10°C-90°C and 2-12
respectively. The rest of the procedure was the same as the determination of
PPO activity.
2.3.7.2.6 Determination of Operational and Storage Stability Immobilized
PPO
Enzymes can easily lose their catalytic activity and denatured, so careful
storage and handling are essential. To determine the stability against repetitive

64
use and shelf-life of enzyme electrodes, the activity of electrode was checked.
40 measurements in the same day were done to perform the operational stability.
For storage stability activity measurements were performed for 40 days.
2.3.7.2.7 Morphologies of PPO Entrapped Films
Enzyme immobilization procedure was carried out until obtaining free
standing films. After washing with buffer solution to remove unbound enzyme
and supporting electrolyte, SEM analysis was performed.
2.3.7.2.8 Protein Determination
Protein determination measurements were performed by Bradford’s
Method. Bradford reagent was prepared by mixing 25 ml phosphoric acid, 12.5
ml ethanol and 25 mg Coomassie Brilliant Blue (G-dye). The mixture was
diluted to 50 ml with distilled water. During measurements, a solution of
Bradford reagent was prepared by mixing 1 volume stock solution with 4
volumes of distilled water.
For the preparation of protein calibration curve, bovine serum albumin
(BSA) was used. Different concentrations of BSA were prepared as 1 ml, and 2
ml of diluted Bradford reagent was added. The absorbance of these solutions
was measured at 595 nm.
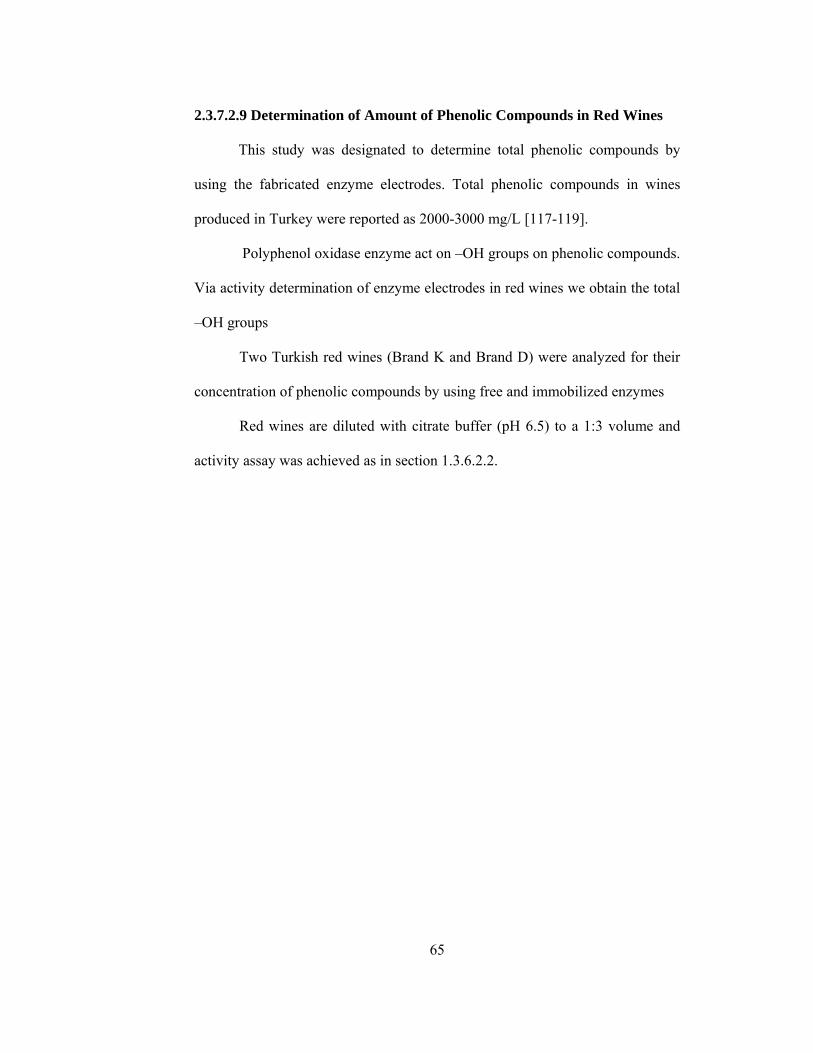
65
2.3.7.2.9 Determination of Amount of Phenolic Compounds in Red Wines
This study was designated to determine total phenolic compounds by
using the fabricated enzyme electrodes. Total phenolic compounds in wines
produced in Turkey were reported as 2000-3000 mg/L [117-119].
Polyphenol oxidase enzyme act on –OH groups on phenolic compounds.
Via activity determination of enzyme electrodes in red wines we obtain the total
–OH groups
Two Turkish red wines (Brand K and Brand D) were analyzed for their
concentration of phenolic compounds by using free and immobilized enzymes
Red wines are diluted with citrate buffer (pH 6.5) to a 1:3 volume and
activity assay was achieved as in section 1.3.6.2.2.

66
CHAPTER 3
RESULTS AND DISCUSSION
3.1 Synthesis and Characterization of Menthyl Ester of 3-Thiophene Acetic
Acid
Menthyl Ester of 3-Thiophene acetic acid was synthesized by
esterification reaction of thiophene acetic acid with menthol. NMR spectrum of
obtained product was shown in Figure 3.1.
Figure 3.1 NMR spectrum of MM
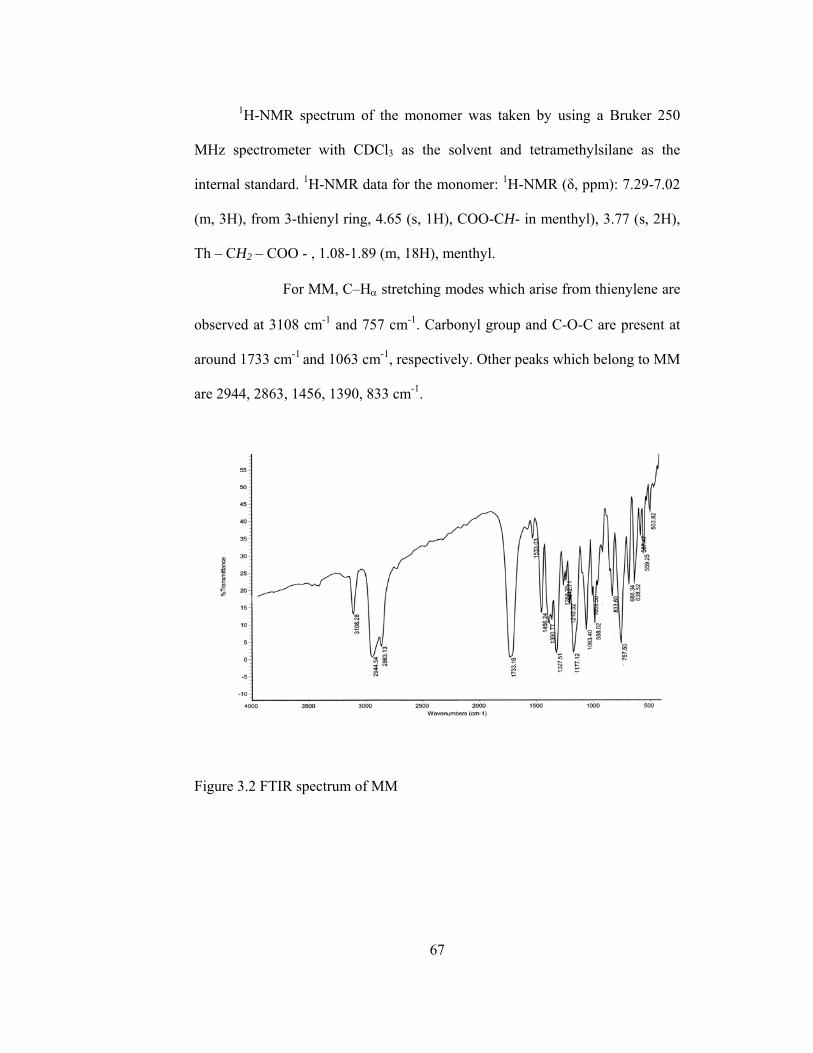
67
1H-NMR spectrum of the monomer was taken by using a Bruker 250
MHz spectrometer with CDCl3 as the solvent and tetramethylsilane as the
internal standard. 1H-NMR data for the monomer: 1H-NMR (δ, ppm): 7.29-7.02
(m, 3H), from 3-thienyl ring, 4.65 (s, 1H), COO-CH- in menthyl), 3.77 (s, 2H),
Th – CH2 – COO - , 1.08-1.89 (m, 18H), menthyl.
For MM, C–Hα stretching modes which arise from thienylene are
observed at 3108 cm-1 and 757 cm-1. Carbonyl group and C-O-C are present at
around 1733 cm-1 and 1063 cm-1, respectively. Other peaks which belong to MM
are 2944, 2863, 1456, 1390, 833 cm-1.
Figure 3.2 FTIR spectrum of MM

68
Acetonitrile and TBAFB were used as the solvent and electrolyte
respectively for cyclic voltammetry studies. As seen from Figure 3.3, MM has
no redox peak, which implies that MM is not an electroactive material.
Figure 3.3 Cyclic Voltammogram of MM
Thermal Gravimetry Analysis and Differential Scanning Calorimetry
were used to examine thermal behavior of monomer and polymers.
TGA showed weight losses for MM at 265°. No residue was observed
for MM. DSC thermogram for monomer shows a sharp melting point at 118°C
(Figure3.4).
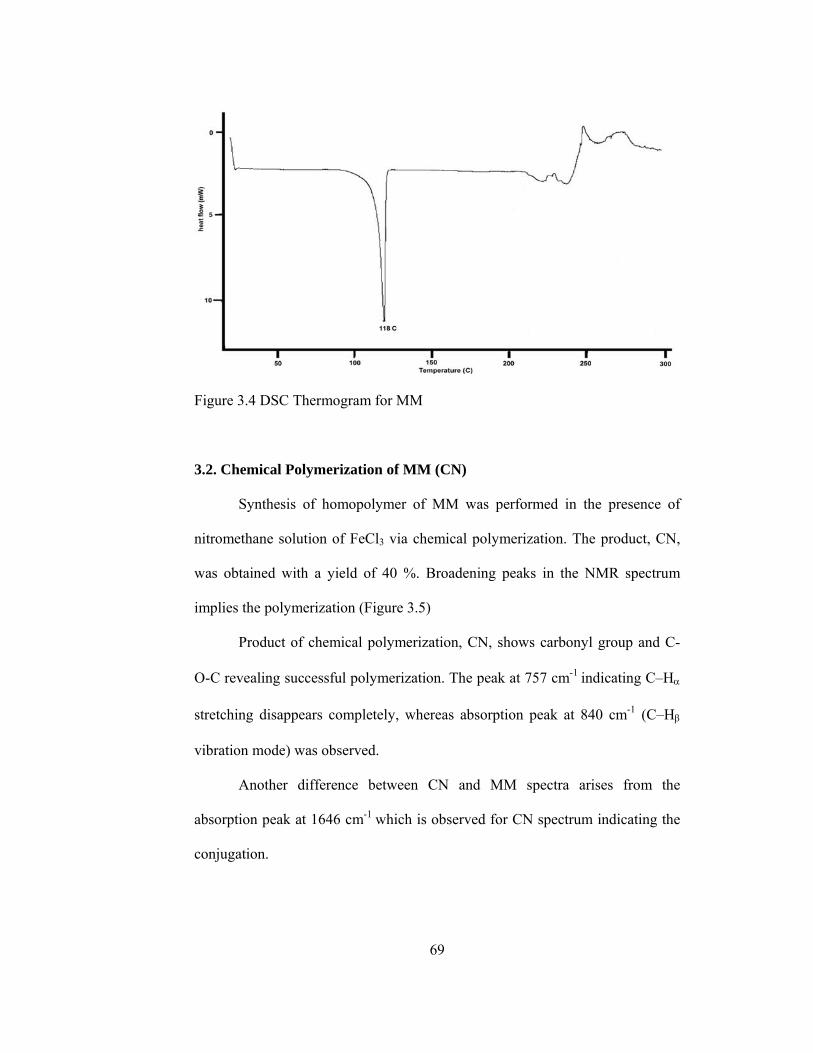
69
Figure 3.4 DSC Thermogram for MM
3.2. Chemical Polymerization of MM (CN)
Synthesis of homopolymer of MM was performed in the presence of
nitromethane solution of FeCl3 via chemical polymerization. The product, CN,
was obtained with a yield of 40 %. Broadening peaks in the NMR spectrum
implies the polymerization (Figure 3.5)
Product of chemical polymerization, CN, shows carbonyl group and C-
O-C revealing successful polymerization. The peak at 757 cm-1 indicating C–Hα
stretching disappears completely, whereas absorption peak at 840 cm-1 (C–Hβ
vibration mode) was observed.
Another difference between CN and MM spectra arises from the
absorption peak at 1646 cm-1 which is observed for CN spectrum indicating the
conjugation.
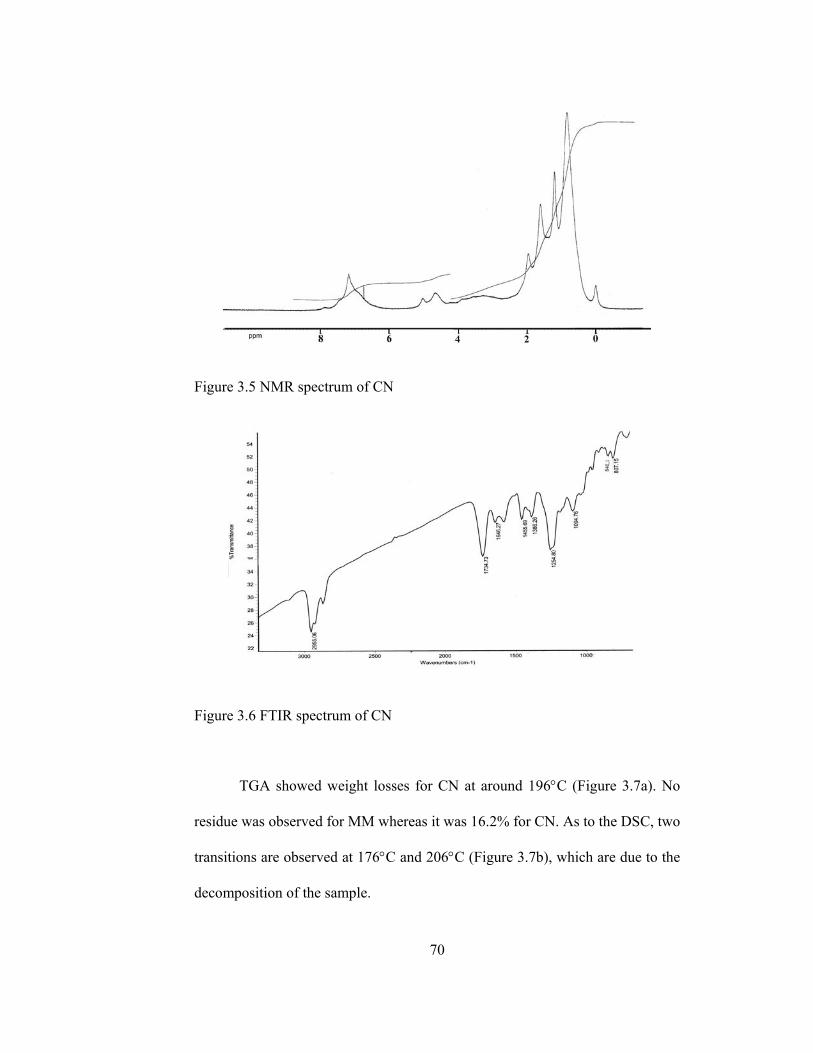
70
Figure 3.5 NMR spectrum of CN
Figure 3.6 FTIR spectrum of CN
TGA showed weight losses for CN at around 196°C (Figure 3.7a). No
residue was observed for MM whereas it was 16.2% for CN. As to the DSC, two
transitions are observed at 176°C and 206°C (Figure 3.7b), which are due to the
decomposition of the sample.

71
(a)
(b)
Figure 3.7 (a) TGA (b) DSC of CN
3.3. Galvanostatic Polymerization of MM (GDM)
NMR, FTIR and Thermal analysis for GDM exhibit similar behavior
with CN. This is an expected result because the product obtained with
galvanostatic polymerization is same with that of chemical polymerization.
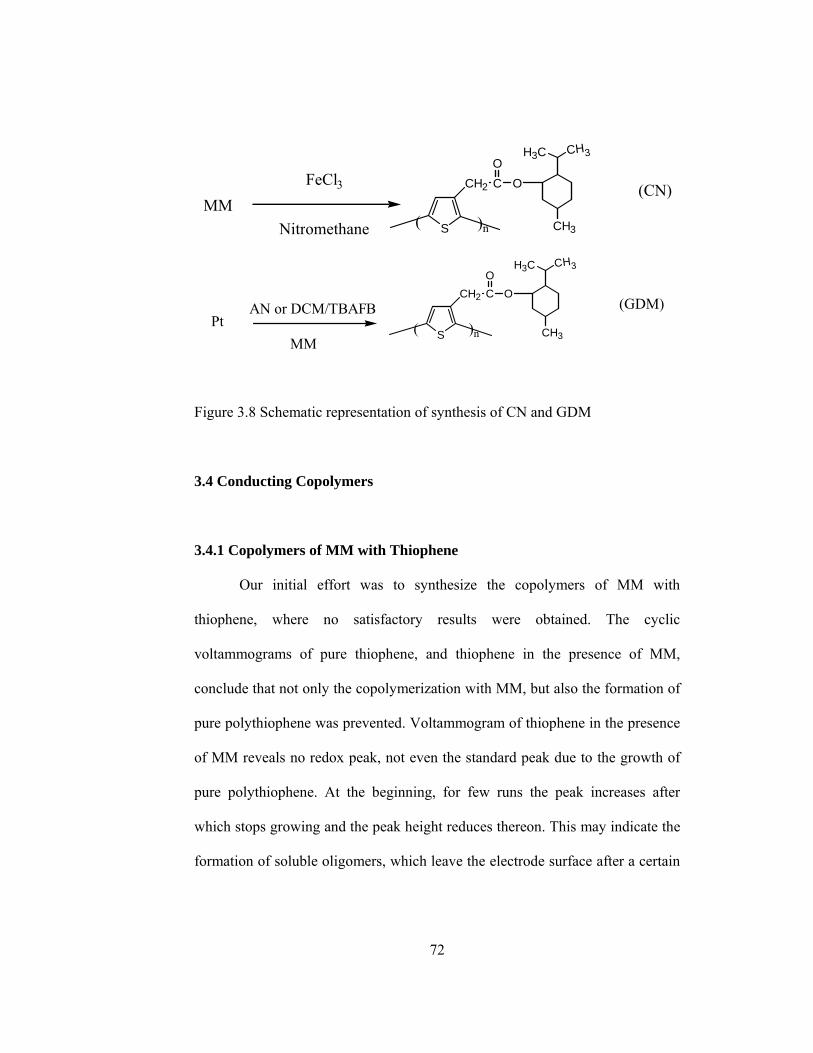
72
S
CH2 CO
O
CH3
CH3H3C
MMFeCl3
Nitromethane ( )n
(CN)
S
CH2 CO
O
CH3
CH3H3C
PtAN or DCM/TBAFB (GDM)
MM( )n
Figure 3.8 Schematic representation of synthesis of CN and GDM
3.4 Conducting Copolymers
3.4.1 Copolymers of MM with Thiophene
Our initial effort was to synthesize the copolymers of MM with
thiophene, where no satisfactory results were obtained. The cyclic
voltammograms of pure thiophene, and thiophene in the presence of MM,
conclude that not only the copolymerization with MM, but also the formation of
pure polythiophene was prevented. Voltammogram of thiophene in the presence
of MM reveals no redox peak, not even the standard peak due to the growth of
pure polythiophene. At the beginning, for few runs the peak increases after
which stops growing and the peak height reduces thereon. This may indicate the
formation of soluble oligomers, which leave the electrode surface after a certain
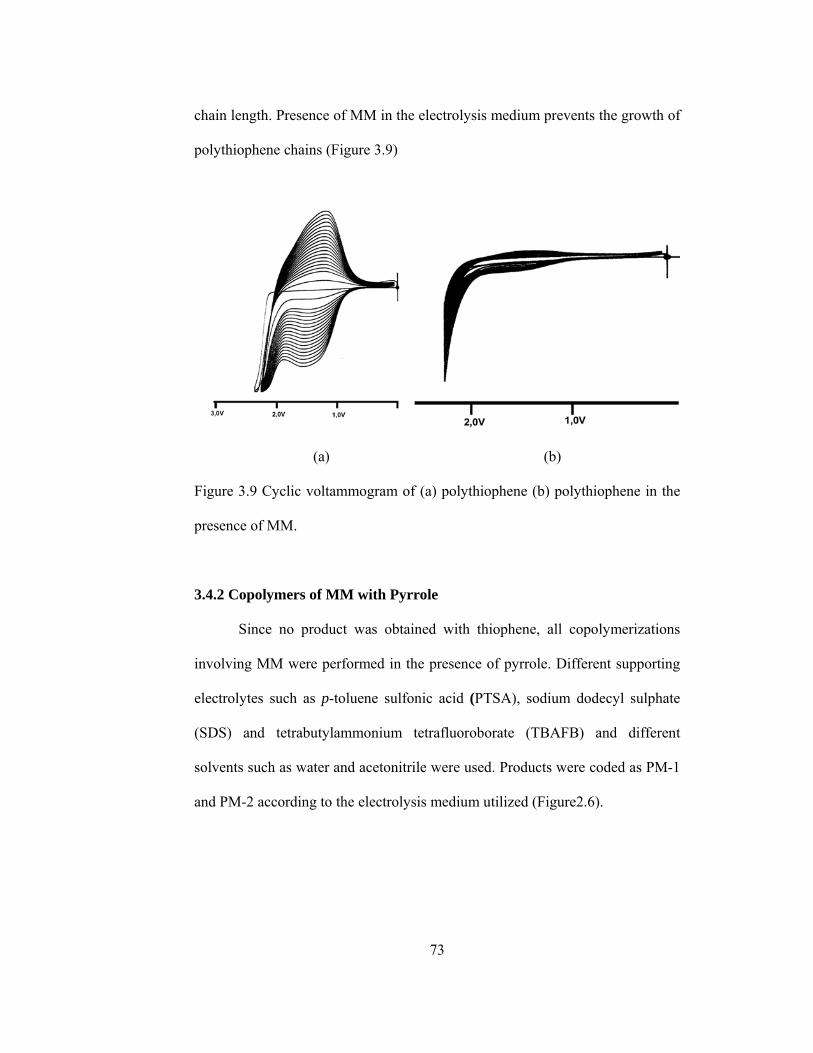
73
chain length. Presence of MM in the electrolysis medium prevents the growth of
polythiophene chains (Figure 3.9)
(a) (b)
Figure 3.9 Cyclic voltammogram of (a) polythiophene (b) polythiophene in the
presence of MM.
3.4.2 Copolymers of MM with Pyrrole
Since no product was obtained with thiophene, all copolymerizations
involving MM were performed in the presence of pyrrole. Different supporting
electrolytes such as p-toluene sulfonic acid (PTSA), sodium dodecyl sulphate
(SDS) and tetrabutylammonium tetrafluoroborate (TBAFB) and different
solvents such as water and acetonitrile were used. Products were coded as PM-1
and PM-2 according to the electrolysis medium utilized (Figure2.6).

74
3.4.3 Block Copolymers of CN and GDM with Pyrrole (CNPP, CNPS,
PGDM)
Homopolymers obtained via chemical and galvanostatic polymerization
which are coded as CN and GDM respectively, were used as the precursor of
copolymerization with pyrrole (Figure 2.10)
3.4.4 Characterization of Conducting Copolymers of Pyrrole
3.4.4.1 Cyclic voltammetry
Acetonitrile and TBAFB were used as the solvent and electrolyte respectively
for cyclic voltammetry studies. Figure 3.10 shows the voltammogram of pure
pyrrole and the voltammogram of pyrrole in the presence of MM. For this
solvent – electrolyte couple, addition of pyrrole to the medium makes no
significant difference.
3.4.4.2 FTIR
FTIR analysis is an important characterization method which is used to
prove that copolymerizations were succeeded. Significant features of pristine
MM are carbonyl group and C-O-C which are around 1733 cm-1 and 1063 cm-1,
respectively. PM-1 and PM-2 contain an absorption band at 1730 cm-1. This
carbonyl band reveals that copolymerization takes place between the two
components since FTIR analyses were performed after a rigorous washing of
films with the solvent of MM.
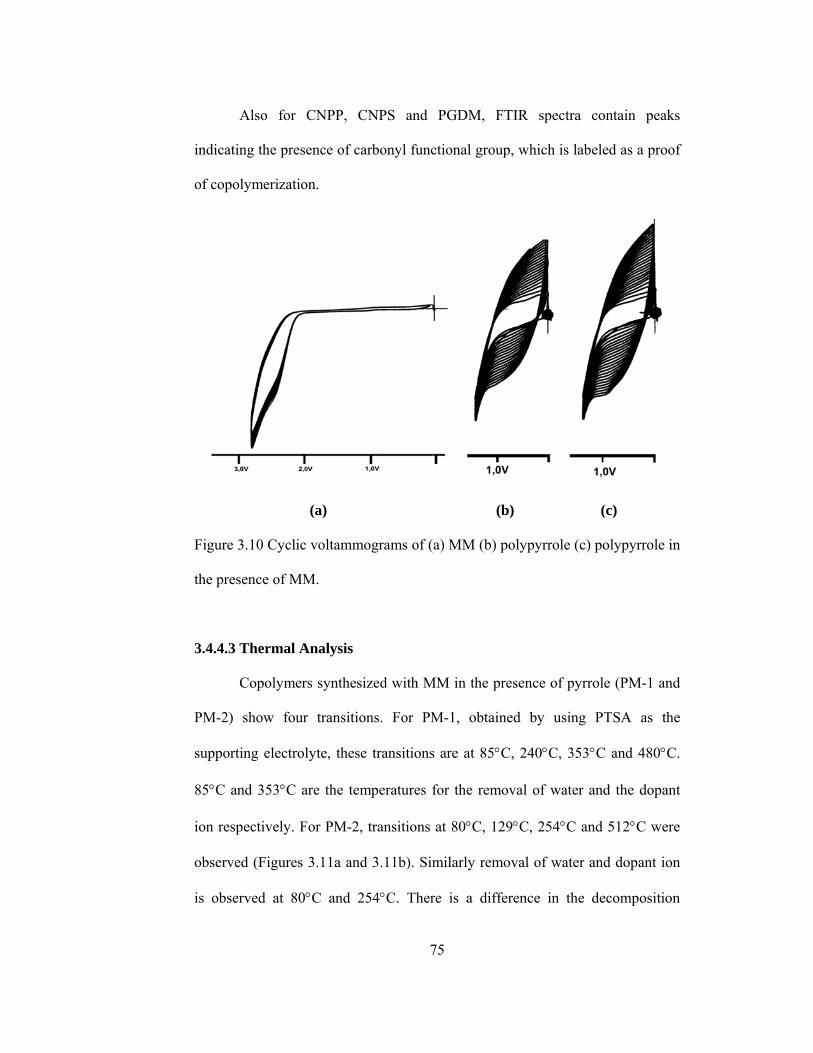
75
Also for CNPP, CNPS and PGDM, FTIR spectra contain peaks
indicating the presence of carbonyl functional group, which is labeled as a proof
of copolymerization.
(a) (b) (c)
Figure 3.10 Cyclic voltammograms of (a) MM (b) polypyrrole (c) polypyrrole in
the presence of MM.
3.4.4.3 Thermal Analysis
Copolymers synthesized with MM in the presence of pyrrole (PM-1 and
PM-2) show four transitions. For PM-1, obtained by using PTSA as the
supporting electrolyte, these transitions are at 85°C, 240°C, 353°C and 480°C.
85°C and 353°C are the temperatures for the removal of water and the dopant
ion respectively. For PM-2, transitions at 80°C, 129°C, 254°C and 512°C were
observed (Figures 3.11a and 3.11b). Similarly removal of water and dopant ion
is observed at 80°C and 254°C. There is a difference in the decomposition

76
temperature, which is 480°C for PM-1 and 512°C for PM-2, indicating that
thermal stability of the latter is a better.
High pyrrole content in the CNPP, CNPS and PGDM give rise to weight
loss behaviors similar to that of pristine polypyrrole (Figures 3.11c and 3.11d)
(a)
(b)
Figure 3.11 TGA thermograms for (a) PM-1 (b) PM-2 (c) CNPP (d) CNPS (e)
PGDM
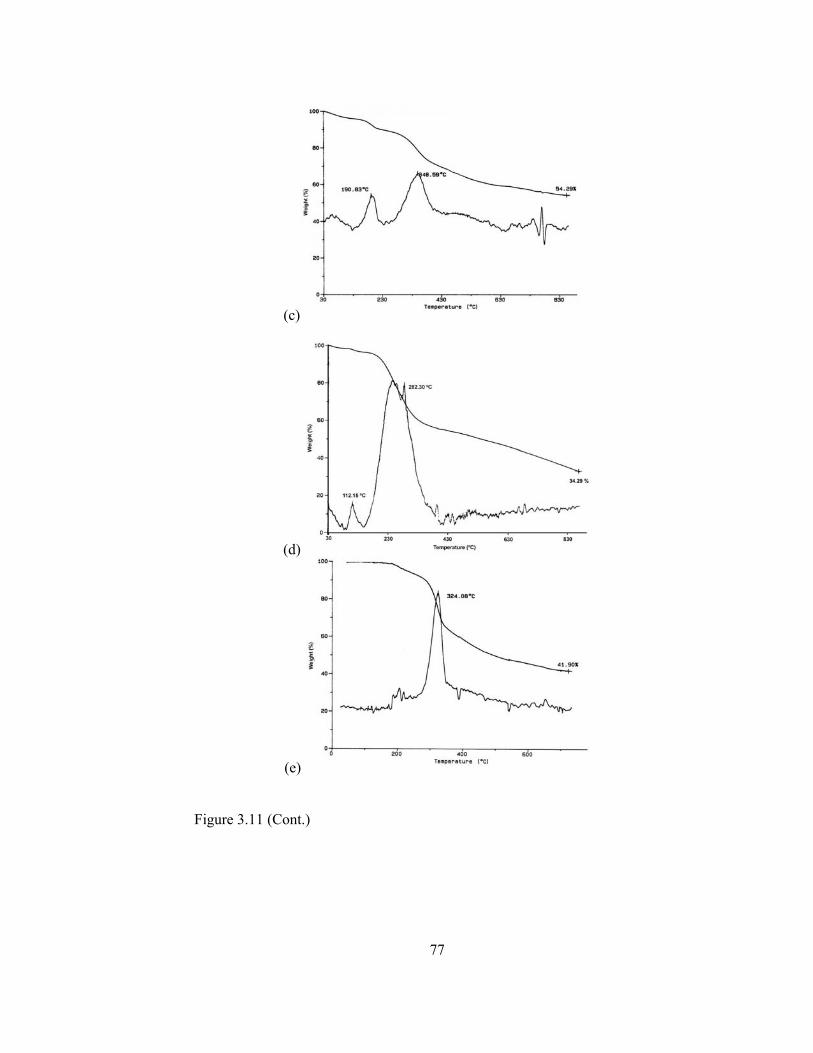
77
(c)
(d)
(e)
Figure 3.11 (Cont.)
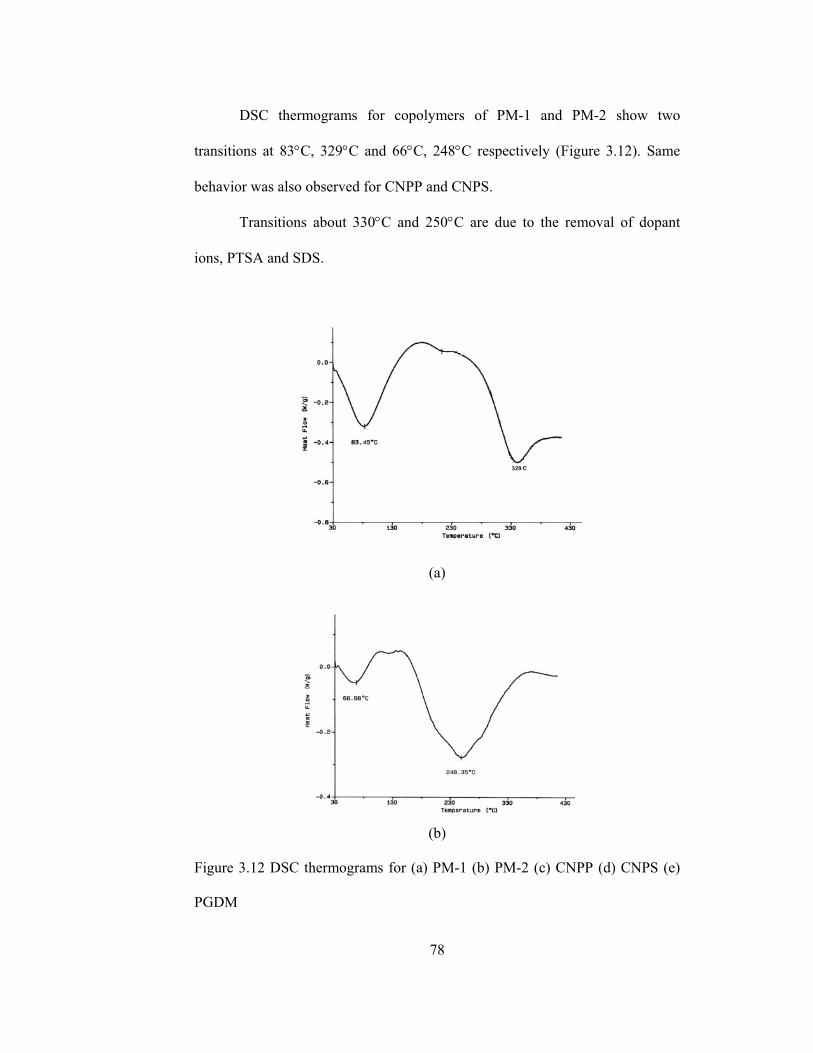
78
DSC thermograms for copolymers of PM-1 and PM-2 show two
transitions at 83°C, 329°C and 66°C, 248°C respectively (Figure 3.12). Same
behavior was also observed for CNPP and CNPS.
Transitions about 330°C and 250°C are due to the removal of dopant
ions, PTSA and SDS.
(a)
(b)
Figure 3.12 DSC thermograms for (a) PM-1 (b) PM-2 (c) CNPP (d) CNPS (e)
PGDM
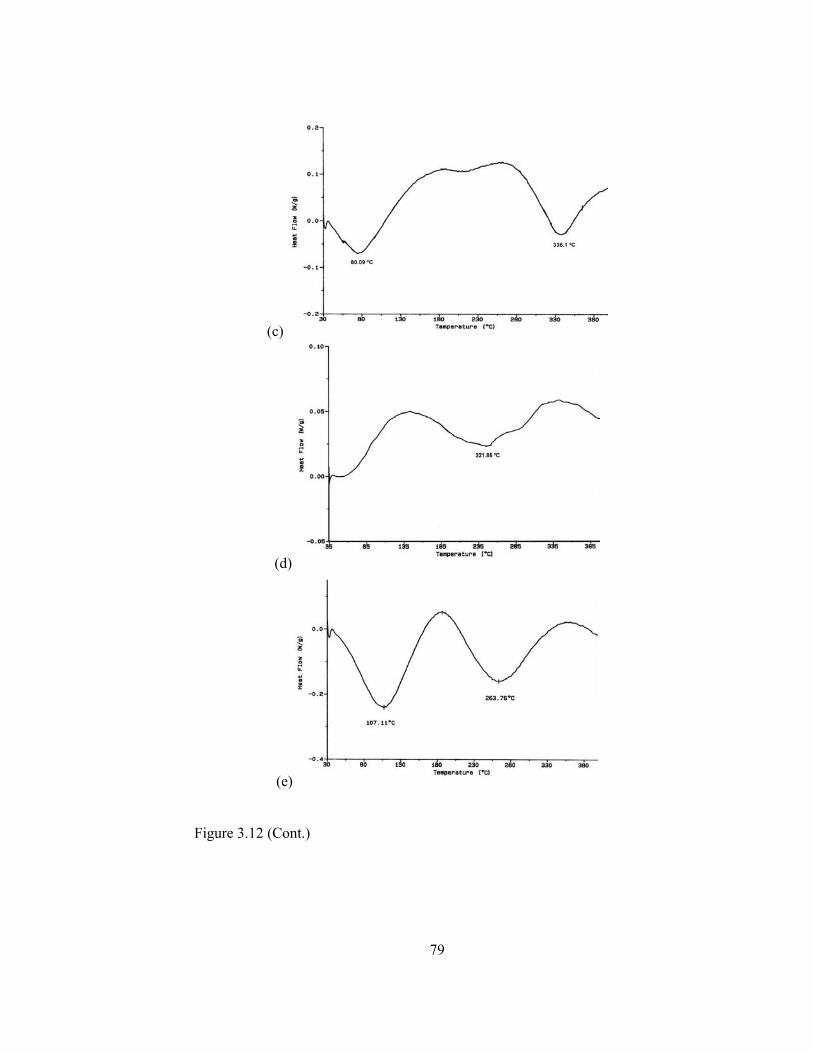
79
(c)
(d)
(e)
Figure 3.12 (Cont.)

80
3.4.4.4 Morphologies of the Films
In order to examine the morphology of copolymer films, SEM studies
were carried out.
Copolymers of MM with pyrrole, i.e. PM-1 and PM-2, exhibit different
morphologies than that of pure polypyrrole, which has a smooth surface on the
electrode side and standard cauliflower structure on the solution side. For both
copolymers, solution side has standard cauliflower structure, but electrode sides
are interesting. For PM-1, electrode side contains regular islands, whereas PM-2
has rather a smoother surface (Figure 3.13).
(a)
(b)
Figure 3.13 SEM micrographs of (a) PM-1 (b) PM-2
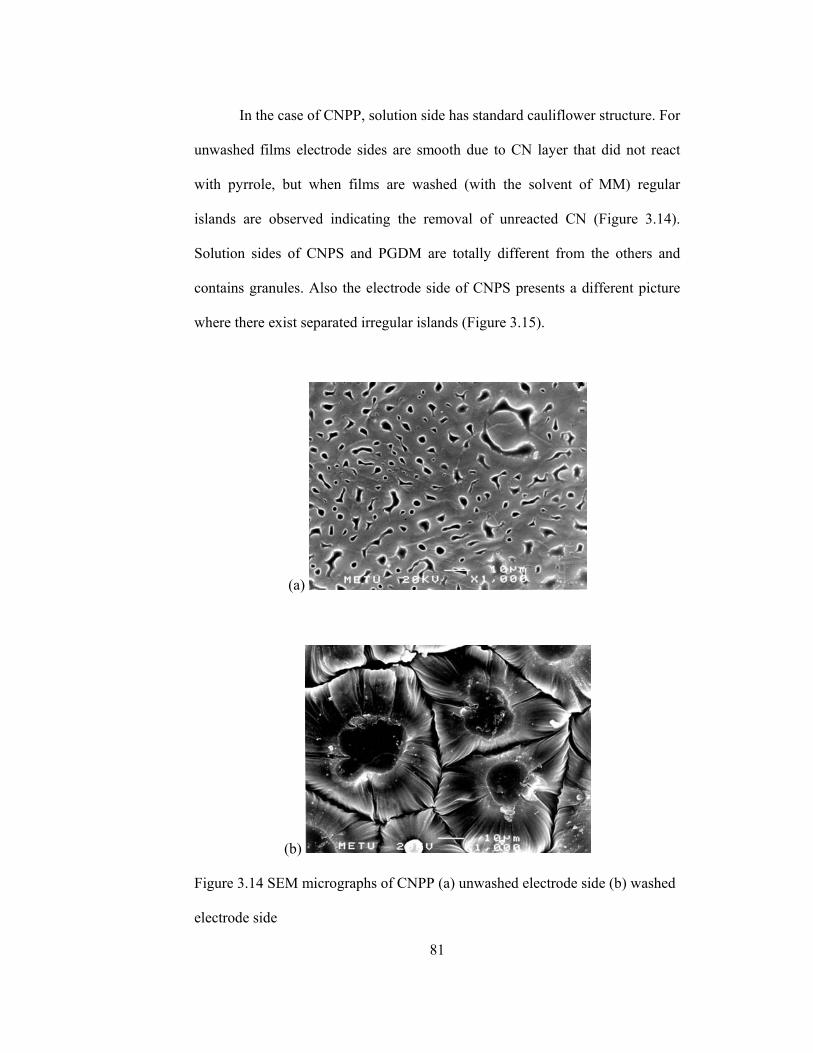
81
In the case of CNPP, solution side has standard cauliflower structure. For
unwashed films electrode sides are smooth due to CN layer that did not react
with pyrrole, but when films are washed (with the solvent of MM) regular
islands are observed indicating the removal of unreacted CN (Figure 3.14).
Solution sides of CNPS and PGDM are totally different from the others and
contains granules. Also the electrode side of CNPS presents a different picture
where there exist separated irregular islands (Figure 3.15).
(a)
(b)
Figure 3.14 SEM micrographs of CNPP (a) unwashed electrode side (b) washed
electrode side

82
(a)
(b)
(c)
Figure 3.15 SEM micrographs of (a) CNPS solution side (b) CNPS electrode
side (c) PGDM solution side.

83
3.4.4.5 Conductivity Measurements
Standard four-probe technique was used for conductivity measurements.
Conductivities were in the range of 0-4 S/cm and no significant difference was
observed between the electrode and solution sides of the films. In Table 1
although PM-2, which is doped with SDS, exhibits the best conductivity, whilst
there is no order of magnitude difference between the polymer films.
Table 3.1 Conductivities of polymers of MM (a: pellet)
Electrode Side (S/cm) Solution Side (S/cm)
CNa 3.7x10⁻³ 3.7x10⁻³
PM-1 3.4 3.2
PM-2 4.1 4.0
CNPP 0.7 0.2
CNPS 0.8 0.6
3.5 Immobilization of Enzymes
3.5.1 Immobilization of Invertase
Immobilization of invertase was achieved in PM-2 and CNPS
copolymers via constant potential electrolysis. For comparing the obtained data,
pure polypyrrole was also used as a matrix for the immobilization of invertase.
Optimum reaction conditions during immobilization and activity assay were
determined in the previous studies [98-100]. Although the enzyme is available at
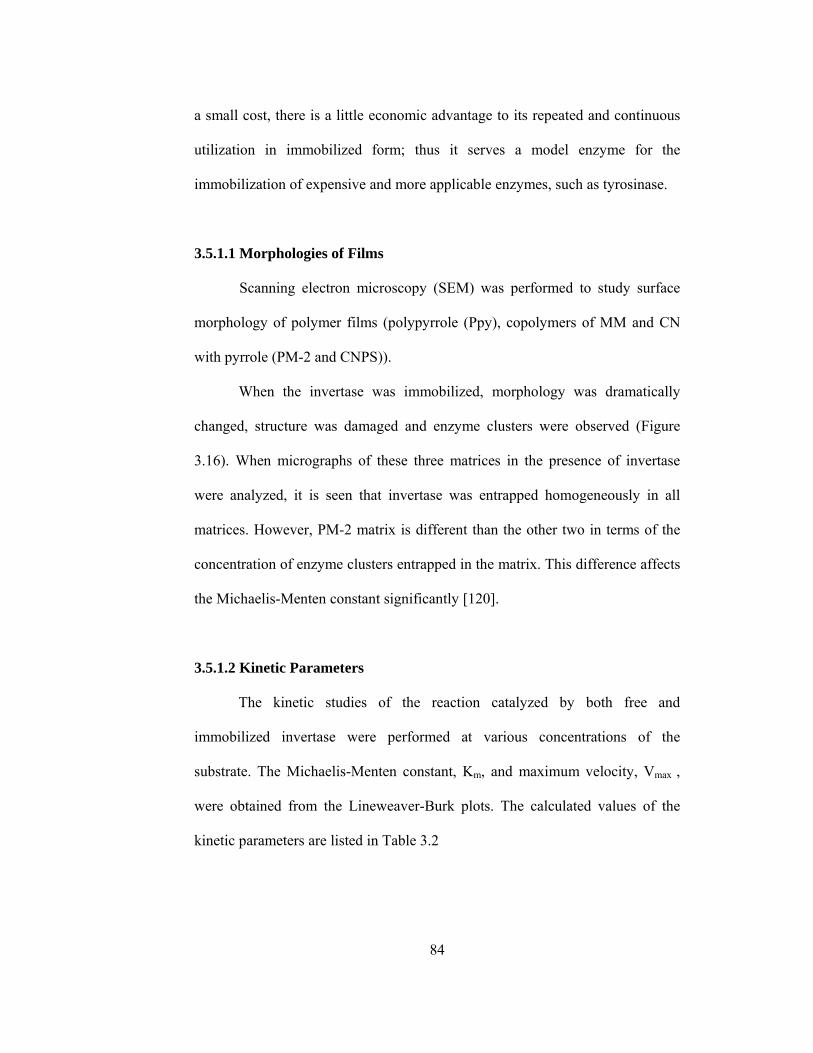
84
a small cost, there is a little economic advantage to its repeated and continuous
utilization in immobilized form; thus it serves a model enzyme for the
immobilization of expensive and more applicable enzymes, such as tyrosinase.
3.5.1.1 Morphologies of Films
Scanning electron microscopy (SEM) was performed to study surface
morphology of polymer films (polypyrrole (Ppy), copolymers of MM and CN
with pyrrole (PM-2 and CNPS)).
When the invertase was immobilized, morphology was dramatically
changed, structure was damaged and enzyme clusters were observed (Figure
3.16). When micrographs of these three matrices in the presence of invertase
were analyzed, it is seen that invertase was entrapped homogeneously in all
matrices. However, PM-2 matrix is different than the other two in terms of the
concentration of enzyme clusters entrapped in the matrix. This difference affects
the Michaelis-Menten constant significantly [120].
3.5.1.2 Kinetic Parameters
The kinetic studies of the reaction catalyzed by both free and
immobilized invertase were performed at various concentrations of the
substrate. The Michaelis-Menten constant, Km, and maximum velocity, Vmax ,
were obtained from the Lineweaver-Burk plots. The calculated values of the
kinetic parameters are listed in Table 3.2
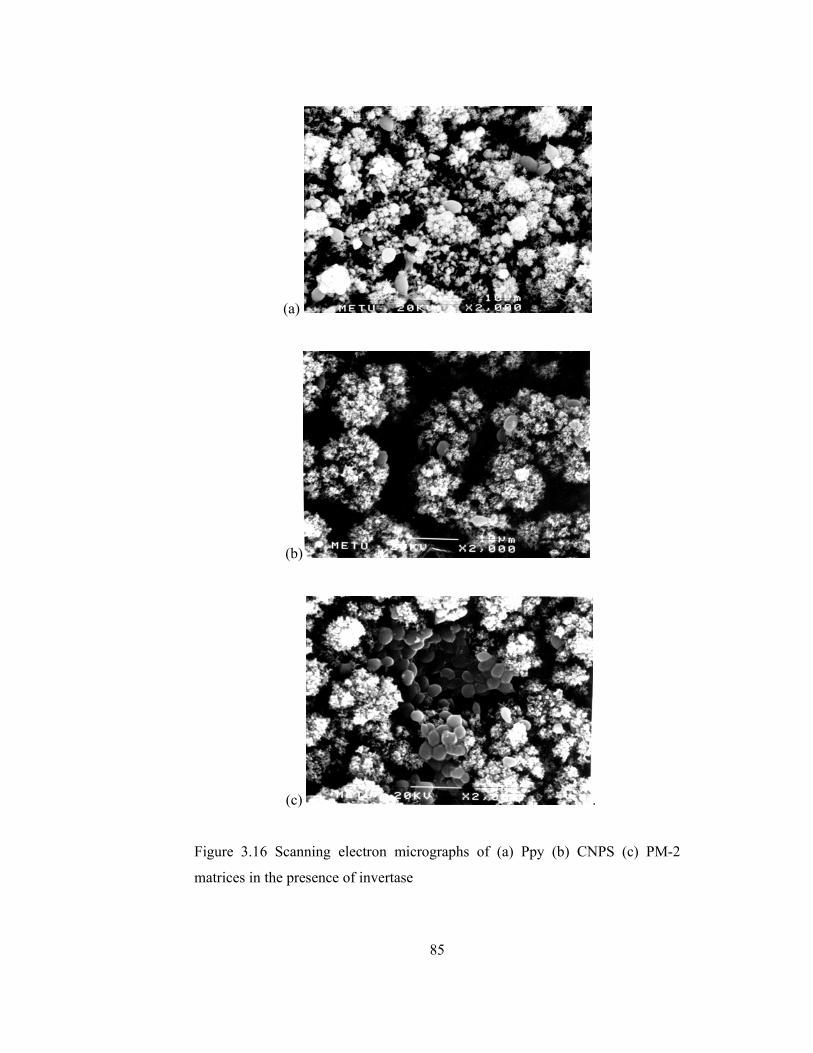
85
(a)
(b)
(c) .
Figure 3.16 Scanning electron micrographs of (a) Ppy (b) CNPS (c) PM-2
matrices in the presence of invertase
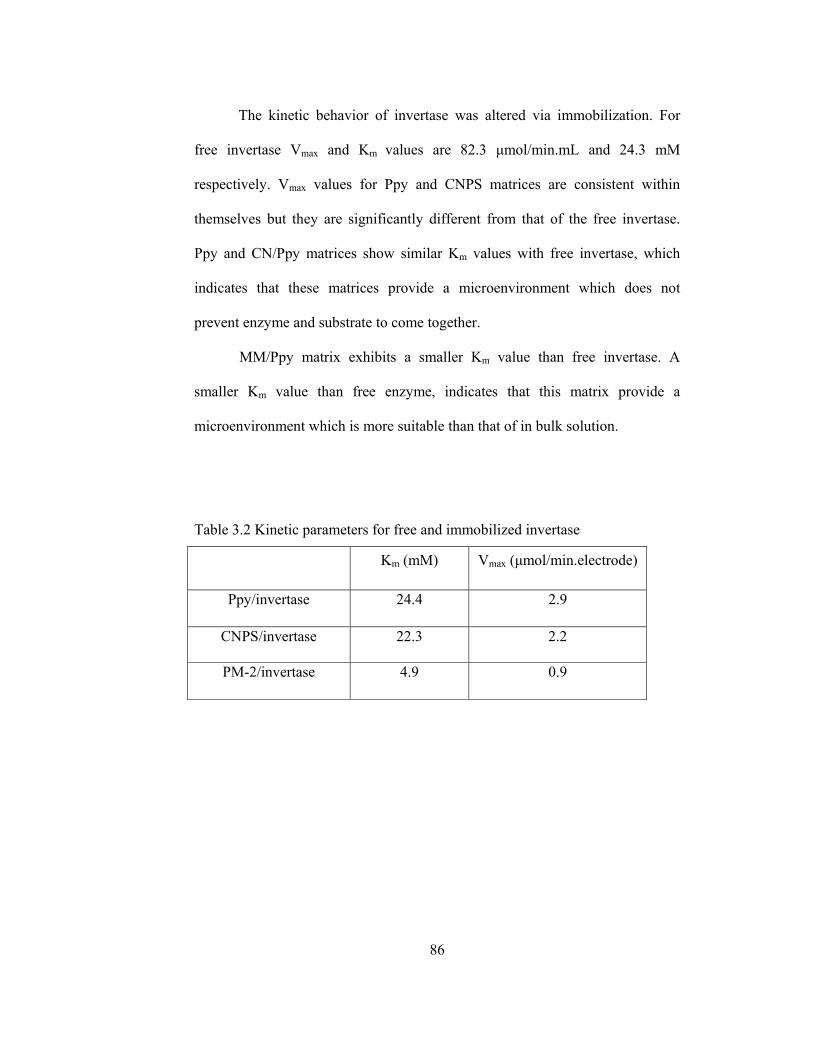
86
The kinetic behavior of invertase was altered via immobilization. For
free invertase Vmax and Km values are 82.3 µmol/min.mL and 24.3 mM
respectively. Vmax values for Ppy and CNPS matrices are consistent within
themselves but they are significantly different from that of the free invertase.
Ppy and CN/Ppy matrices show similar Km values with free invertase, which
indicates that these matrices provide a microenvironment which does not
prevent enzyme and substrate to come together.
MM/Ppy matrix exhibits a smaller Km value than free invertase. A
smaller Km value than free enzyme, indicates that this matrix provide a
microenvironment which is more suitable than that of in bulk solution.
Table 3.2 Kinetic parameters for free and immobilized invertase
Km (mM) Vmax (µmol/min.electrode)
Ppy/invertase 24.4 2.9
CNPS/invertase 22.3 2.2
PM-2/invertase 4.9 0.9
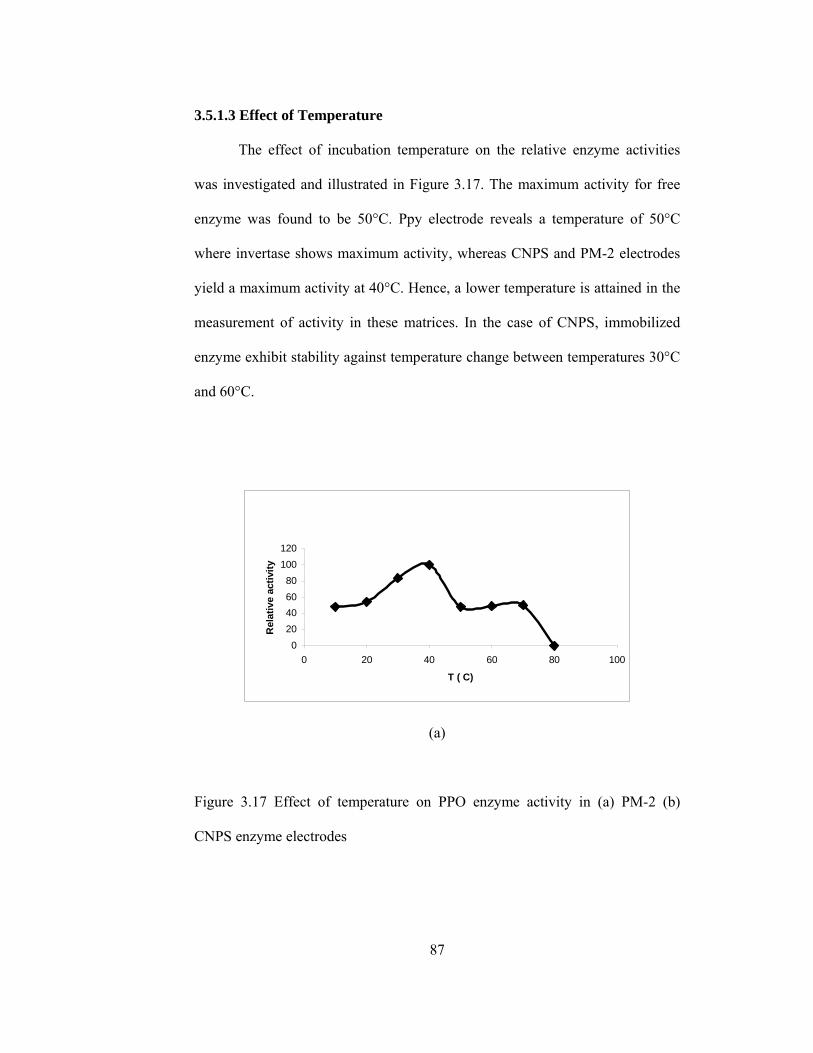
87
3.5.1.3 Effect of Temperature
The effect of incubation temperature on the relative enzyme activities
was investigated and illustrated in Figure 3.17. The maximum activity for free
enzyme was found to be 50°C. Ppy electrode reveals a temperature of 50°C
where invertase shows maximum activity, whereas CNPS and PM-2 electrodes
yield a maximum activity at 40°C. Hence, a lower temperature is attained in the
measurement of activity in these matrices. In the case of CNPS, immobilized
enzyme exhibit stability against temperature change between temperatures 30°C
and 60°C.
020406080
100120
0 20 40 60 80 100
T ( C)
Rel
ativ
e ac
tivity
(a)
Figure 3.17 Effect of temperature on PPO enzyme activity in (a) PM-2 (b)
CNPS enzyme electrodes
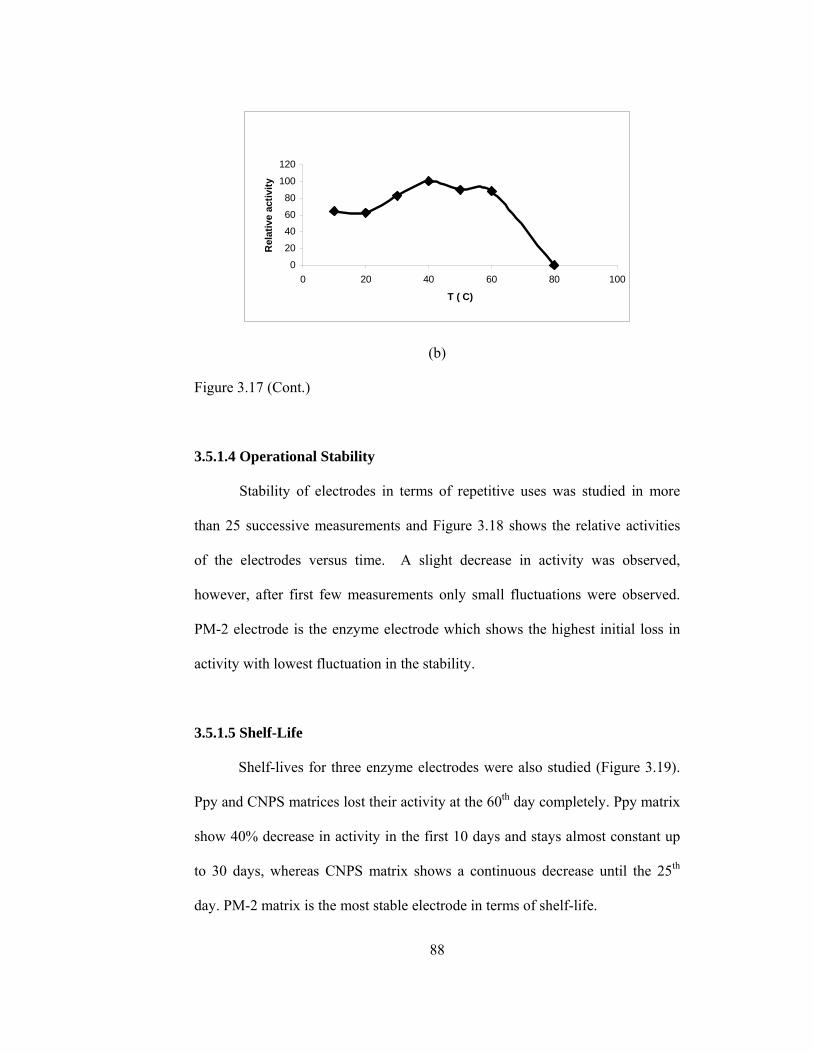
88
0
20
40
60
80
100
120
0 20 40 60 80 100
T ( C)
Rel
ativ
e ac
tivity
(b)
Figure 3.17 (Cont.)
3.5.1.4 Operational Stability
Stability of electrodes in terms of repetitive uses was studied in more
than 25 successive measurements and Figure 3.18 shows the relative activities
of the electrodes versus time. A slight decrease in activity was observed,
however, after first few measurements only small fluctuations were observed.
PM-2 electrode is the enzyme electrode which shows the highest initial loss in
activity with lowest fluctuation in the stability.
3.5.1.5 Shelf-Life
Shelf-lives for three enzyme electrodes were also studied (Figure 3.19).
Ppy and CNPS matrices lost their activity at the 60th day completely. Ppy matrix
show 40% decrease in activity in the first 10 days and stays almost constant up
to 30 days, whereas CNPS matrix shows a continuous decrease until the 25th
day. PM-2 matrix is the most stable electrode in terms of shelf-life.

89
(a)
0
20
40
60
80
100
120
0 5 10 15 20 25 30
no.of assaysR
elat
ive
Act
ivity
(b)
0
20
40
60
80
100
120
0 5 10 15 20 25 30
no. of assays
Rel
ativ
e ac
tivity
(c)
0
20
40
60
80
100
120
0 5 10 15 20 25 30
no. of assays
Rel
ativ
e A
ctiv
ity
Figure 3.18 Operational stability of (a) Ppy/PPO (b) PM-2/PPO (c) CNPS/PPO
enzyme electrodes
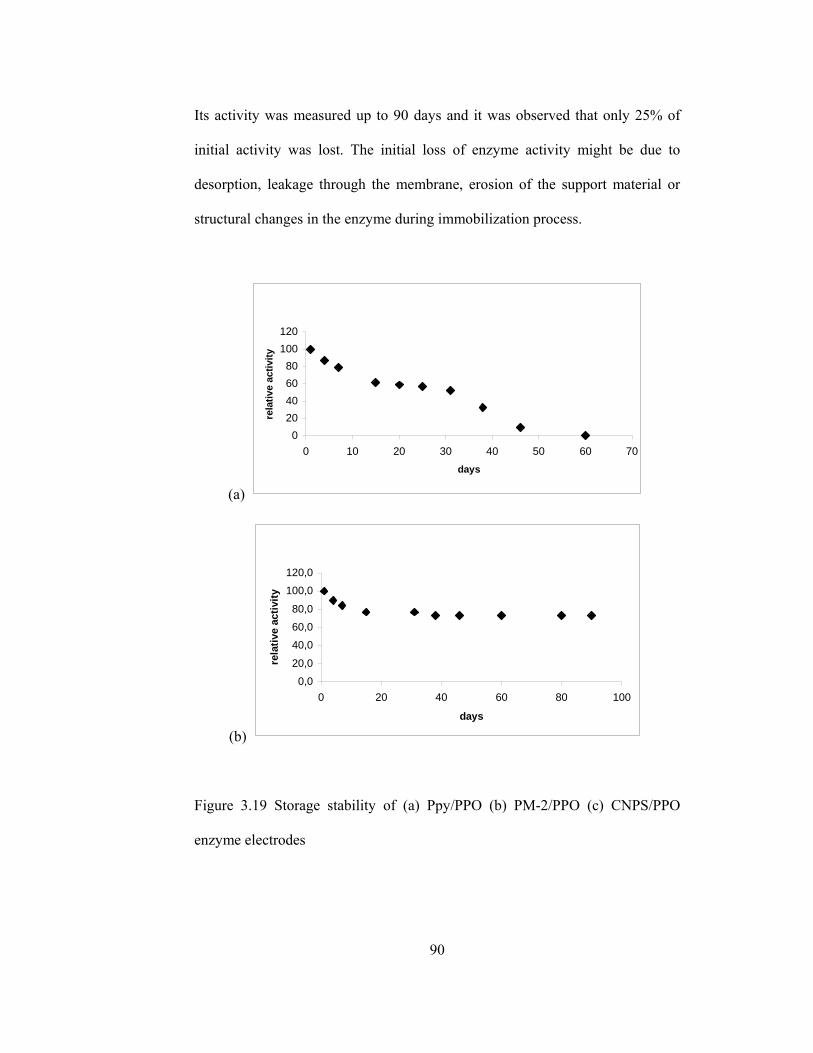
90
Its activity was measured up to 90 days and it was observed that only 25% of
initial activity was lost. The initial loss of enzyme activity might be due to
desorption, leakage through the membrane, erosion of the support material or
structural changes in the enzyme during immobilization process.
(a)
020406080
100120
0 10 20 30 40 50 60 70days
rela
tive
activ
ity
(b)
0,0
20,0
40,0
60,0
80,0
100,0
120,0
0 20 40 60 80 100
days
rela
tive
activ
ity
Figure 3.19 Storage stability of (a) Ppy/PPO (b) PM-2/PPO (c) CNPS/PPO
enzyme electrodes

91
(c)
0,0
20,0
40,0
60,0
80,0
100,0
120,0
0 10 20 30 40 50 60 70
days
rela
tive
activ
ity
Figure 3.19 (Cont.)
3.5.2 Immobilization of PPO (Tyrosinase)
3.5.2.1 Tyrosinase Activity
The enzyme assay is based on the measurement of o-quinone generated
in enzymatic reaction.
The method described in section 2.3.7.2.3 is based on the
spectrophotometric measurements of absorbance of the compound produced
when the 3-methyl-2-benzothiozolinone (MBTH) interacts with the quinones
produced by the enzyme to yield red products.
Figure 2.12 shows the coloration reaction of o-quinone by Besthorn’s
Hydrazone Method.

92
y = 963,33x + 0,0673R2 = 0,9949
00,020,040,060,080,1
0,120,140,160,18
0 0,00002 0,00004 0,00006 0,00008 0,0001 0,00012
o-qunone concentration (M)
Abs
orba
nce
(495
nm)
Figure 3.20 Calibration Curve for Besthorn’s Hydrazone Method
3.5.2.2 Protein Determination
Determination of amount of immobilized protein was performed as it
was described in section 2.3.7.2.8. Figure 3.21 shows the calibration curve
which is prepared by using bovine serum albumin.
Results of protein determination experiments showed that Ppy/PPO and
PM-2/PPO electrodes entrapped 9.6x10⁻³ and 8.9x10⁻³ mg protein in each
electrode respectively. Other two enzyme electrodes that were obtained by
homopolymers contain less amount of protein compared to the Ppy and PM-2
electrodes (Table 3.3) [121].
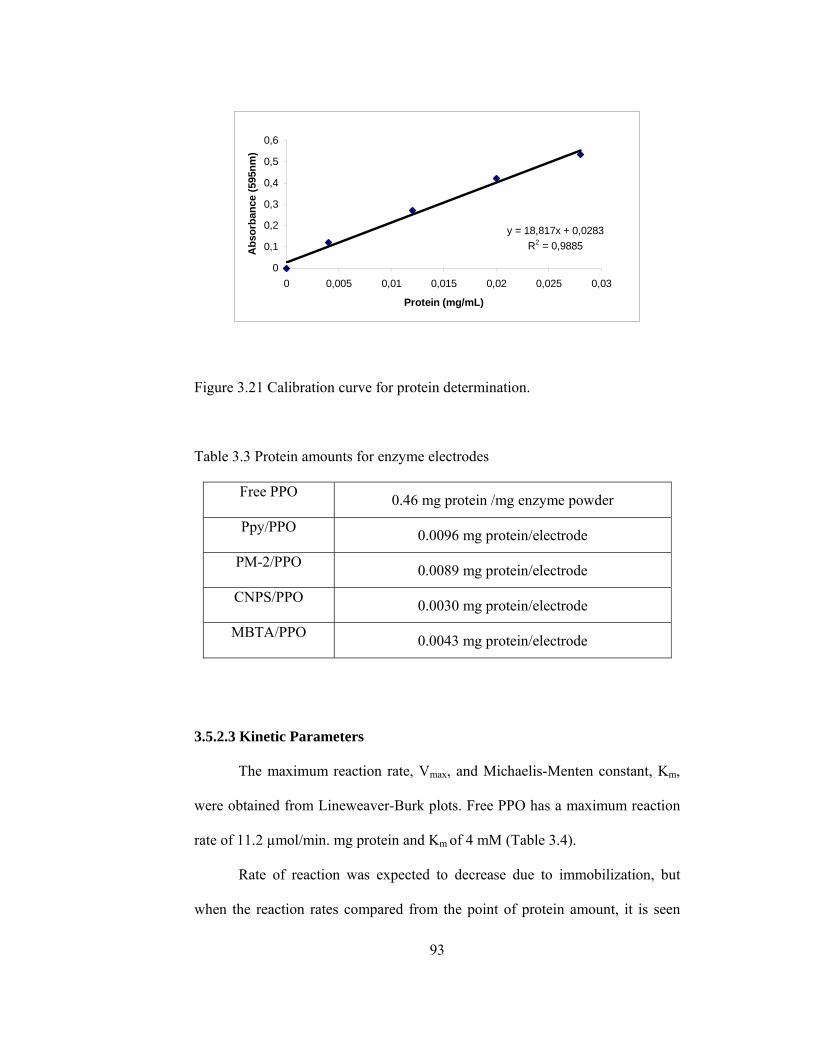
93
y = 18,817x + 0,0283R2 = 0,9885
0
0,1
0,2
0,3
0,4
0,5
0,6
0 0,005 0,01 0,015 0,02 0,025 0,03
Protein (mg/mL)
Abs
orba
nce
(595
nm)
Figure 3.21 Calibration curve for protein determination.
Table 3.3 Protein amounts for enzyme electrodes
Free PPO 0.46 mg protein /mg enzyme powder
Ppy/PPO 0.0096 mg protein/electrode
PM-2/PPO 0.0089 mg protein/electrode
CNPS/PPO 0.0030 mg protein/electrode
MBTA/PPO 0.0043 mg protein/electrode
3.5.2.3 Kinetic Parameters
The maximum reaction rate, Vmax, and Michaelis-Menten constant, Km,
were obtained from Lineweaver-Burk plots. Free PPO has a maximum reaction
rate of 11.2 µmol/min. mg protein and Km of 4 mM (Table 3.4).
Rate of reaction was expected to decrease due to immobilization, but
when the reaction rates compared from the point of protein amount, it is seen
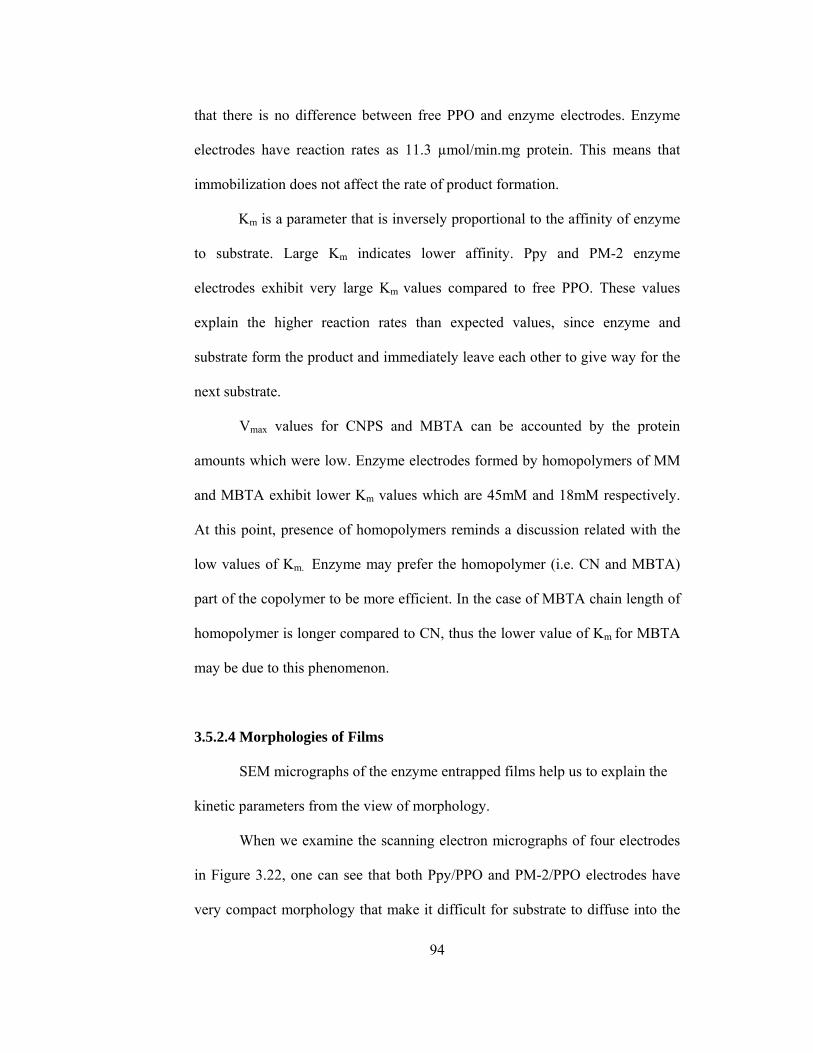
94
that there is no difference between free PPO and enzyme electrodes. Enzyme
electrodes have reaction rates as 11.3 µmol/min.mg protein. This means that
immobilization does not affect the rate of product formation.
Km is a parameter that is inversely proportional to the affinity of enzyme
to substrate. Large Km indicates lower affinity. Ppy and PM-2 enzyme
electrodes exhibit very large Km values compared to free PPO. These values
explain the higher reaction rates than expected values, since enzyme and
substrate form the product and immediately leave each other to give way for the
next substrate.
Vmax values for CNPS and MBTA can be accounted by the protein
amounts which were low. Enzyme electrodes formed by homopolymers of MM
and MBTA exhibit lower Km values which are 45mM and 18mM respectively.
At this point, presence of homopolymers reminds a discussion related with the
low values of Km. Enzyme may prefer the homopolymer (i.e. CN and MBTA)
part of the copolymer to be more efficient. In the case of MBTA chain length of
homopolymer is longer compared to CN, thus the lower value of Km for MBTA
may be due to this phenomenon.
3.5.2.4 Morphologies of Films
SEM micrographs of the enzyme entrapped films help us to explain the
kinetic parameters from the view of morphology.
When we examine the scanning electron micrographs of four electrodes
in Figure 3.22, one can see that both Ppy/PPO and PM-2/PPO electrodes have
very compact morphology that make it difficult for substrate to diffuse into the
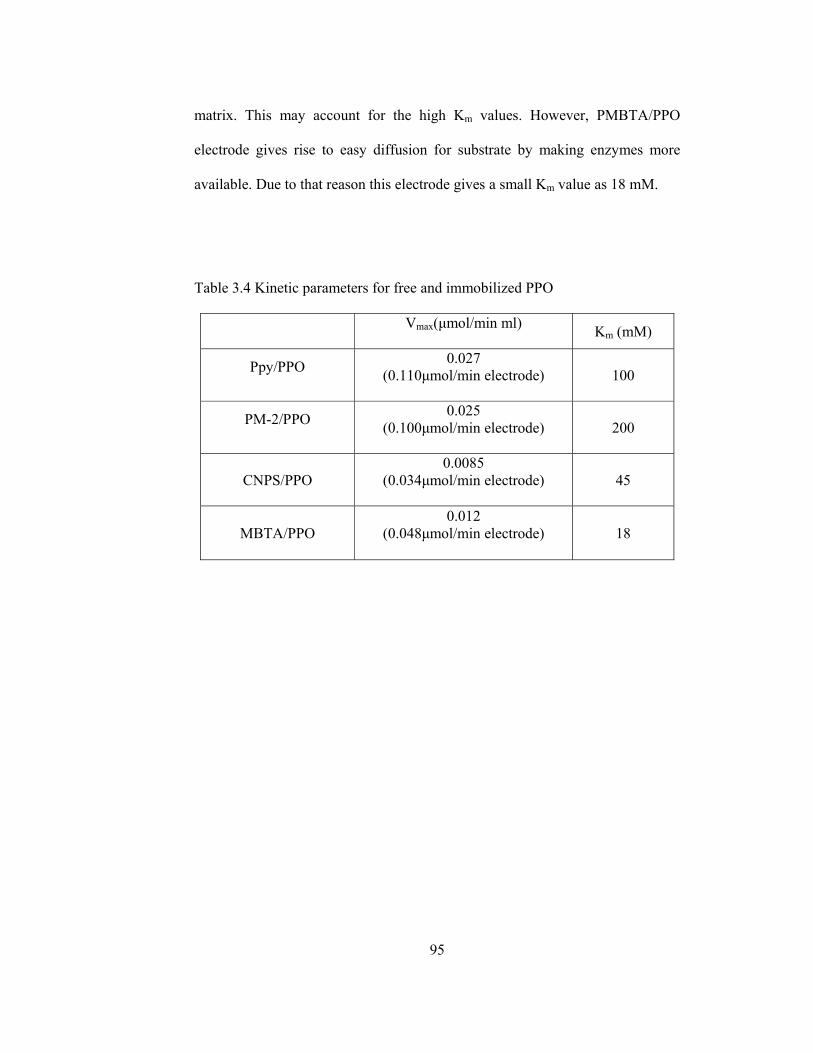
95
matrix. This may account for the high Km values. However, PMBTA/PPO
electrode gives rise to easy diffusion for substrate by making enzymes more
available. Due to that reason this electrode gives a small Km value as 18 mM.
Table 3.4 Kinetic parameters for free and immobilized PPO
Vmax(µmol/min ml) Km (mM)
Ppy/PPO
0.027 (0.110µmol/min electrode)
100
PM-2/PPO
0.025 (0.100µmol/min electrode)
200
CNPS/PPO 0.0085
(0.034µmol/min electrode)
45
MBTA/PPO 0.012
(0.048µmol/min electrode)
18

96
(a) (b)
(c) (d)
Figure 3.22 Scanning electron micrographs of (a) Ppy (b) PM-2 (c) CNPS (d)
MBTA enzyme electrodes

97
3.5.2.5 Effect of Temperature on Enzyme Activity
The influence of the reaction temperature on the activity of the free and
immobilized PPO is given in Figure 3.23. Both free and immobilized
polyphenol oxidase in Ppy/PPO electrode showed an optimal temperature of
40°C. Free PPO lost its activity completely at 50°C but PPO immobilized in Ppy
electrode lost only its 40% of its original activity at 50°C. PM-2/PPO electrode
showed a maximum at 60°C and exhibit stability up to 80°C. Immobilized PPO
in this electrode retained 50% of its optimum activity up to 80°C.
In the case of CNPS/PPO electrode, maximum activity was observed at
60°C, with a little amount of activity loss after this temperature. At
temperatures between 50°C and 70°C, MBTA/PPO enzyme electrode exhibit
high resistance to temperature change. Almost no activity loss was observed
between these temperatures.
(a)
0
20
40
60
80
100
120
0 20 40 60 80
Temperature ( C)
Rel
ativ
e A
ctiv
ity
Figure 3.23 Temperature stability of (a) Free PPO (b) Ppy/PPO (c) PM-2/PPO
(d) CNPS/PPO (e) MBTA/PPO
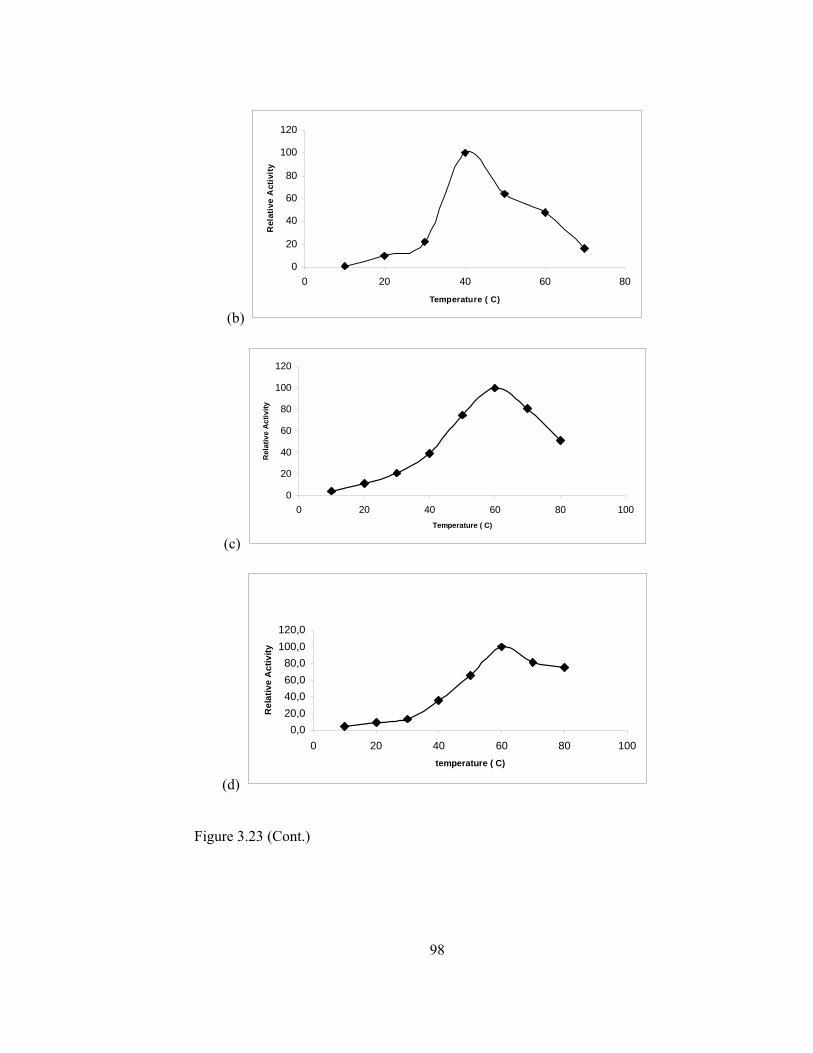
98
(b)
0
20
40
60
80
100
120
0 20 40 60 80
Temperature ( C)
Rel
ativ
e A
ctiv
ity
(c)
0
20
40
60
80
100
120
0 20 40 60 80 100Temperature ( C)
Rel
ativ
e A
ctiv
ity
(d)
0,020,040,060,080,0
100,0120,0
0 20 40 60 80 100temperature ( C)
Rel
ativ
e A
ctiv
ity
Figure 3.23 (Cont.)
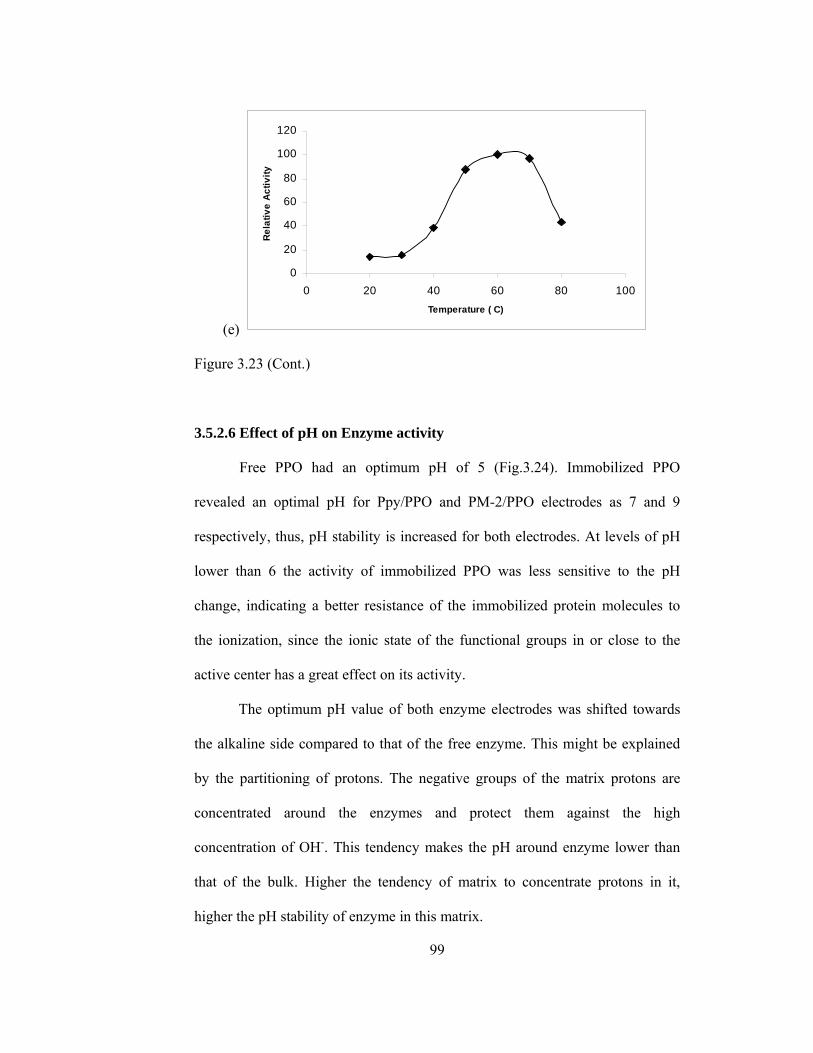
99
(e)
0
20
40
60
80
100
120
0 20 40 60 80 100Temperature ( C)
Rel
ativ
e A
ctiv
ity
Figure 3.23 (Cont.)
3.5.2.6 Effect of pH on Enzyme activity
Free PPO had an optimum pH of 5 (Fig.3.24). Immobilized PPO
revealed an optimal pH for Ppy/PPO and PM-2/PPO electrodes as 7 and 9
respectively, thus, pH stability is increased for both electrodes. At levels of pH
lower than 6 the activity of immobilized PPO was less sensitive to the pH
change, indicating a better resistance of the immobilized protein molecules to
the ionization, since the ionic state of the functional groups in or close to the
active center has a great effect on its activity.
The optimum pH value of both enzyme electrodes was shifted towards
the alkaline side compared to that of the free enzyme. This might be explained
by the partitioning of protons. The negative groups of the matrix protons are
concentrated around the enzymes and protect them against the high
concentration of OH-. This tendency makes the pH around enzyme lower than
that of the bulk. Higher the tendency of matrix to concentrate protons in it,
higher the pH stability of enzyme in this matrix.

100
In case of Ppy and PM-2 electrodes, at pH levels greater than the
maximum points, the activity of entrapped PPO was much affected by the pH
change than that of the free enzyme. The positive charges on the matrix should
decrease with increasing pH and so does the net charge of PPO where isoelectric
point is 6.1. Therefore, the repulsive forces might have caused a split in the
enzyme electrodes resulting in a less favorable conformation of the enzyme
molecules.
The same behavior in pH dependence was observed for CNPS and
MBTA electrodes, but these electrodes exhibit greater stability towards high pH
(Figure 3.24). From pH 7 to 11 there is no change in the enzyme activity. This
shows that these electrodes can protect enzymes against high OH concentration.
a)
0
20
40
60
80
100
120
0 2 4 6 8 10 12pH
Rel
ativ
e A
ctiv
ity
Figure 3.24 pH stability of (a) Free PPO (b) Ppy/PPO (c) PM-2/PPO (d)
CNPS/PPO (e) MBTA/PPO
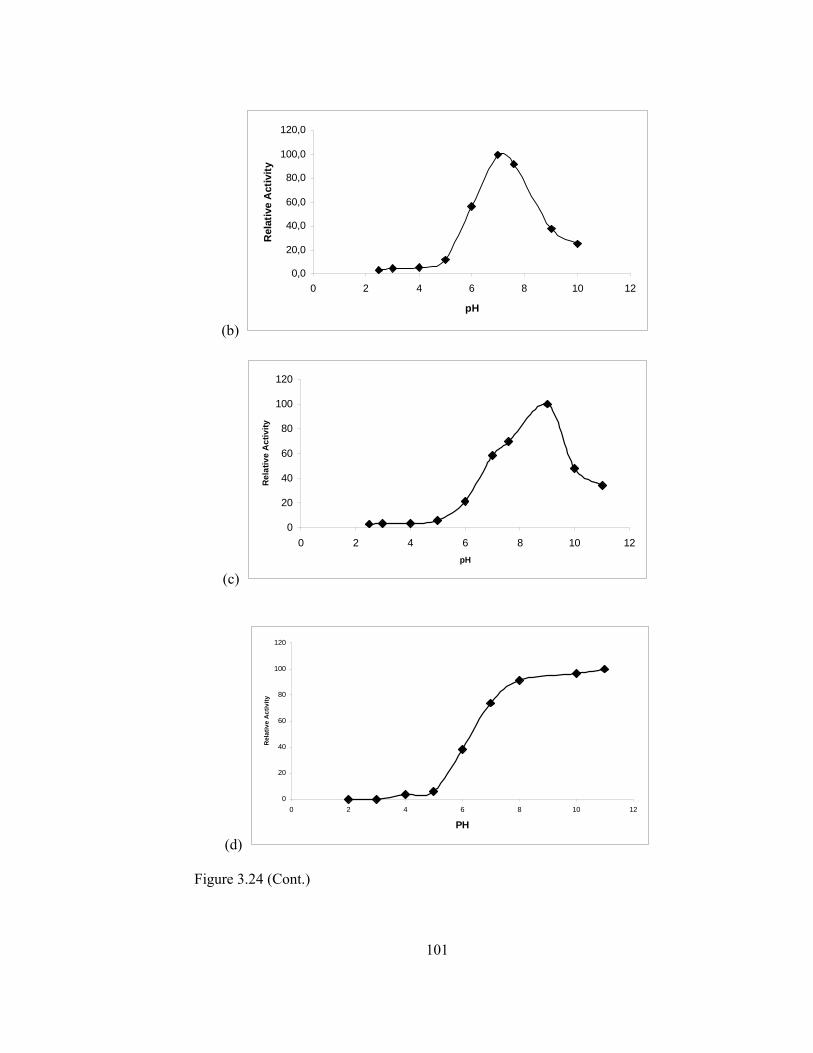
101
(b)
0,0
20,0
40,0
60,0
80,0
100,0
120,0
0 2 4 6 8 10 12
pH
Rel
ativ
e A
ctiv
ity
(c)
0
20
40
60
80
100
120
0 2 4 6 8 10 12pH
Rel
ativ
e A
ctiv
ity
(d)
0
20
40
60
80
100
120
0 2 4 6 8 10 12
PH
Rel
ativ
e A
ctiv
ity
Figure 3.24 (Cont.)

102
(e)
0
20
40
60
80
100
120
0 2 4 6 8 10 12
PH
Rel
ativ
e A
ctiv
ity
Figure 3.24 (Cont.)
3.5.2.7 Operational Stability of Enzyme Electrodes
Enzymes can easily lose their catalytic activity and denatured, thus,
careful storage and handling are essential. Stability of electrodes in terms of
repetitive uses was performed in 40 successive measurements. Ppy/PPO
electrode showed activity that gradually decreased up to 10th use and then stayed
constant at 60% activity (Figure 3.25). As to the temperature and pH stability,
PM-2/PPO electrode exhibits very high operational stability and retained 85% of
its activity up to 40th use.
CNPS and MBTA enzyme electrodes reveal similar amount of activity
loss. CNPS electrode exhibit a fluctuation up to the 20th use but its activity stay
constant in the further measurements.

103
(a)
0
20
40
60
80
100
120
0 10 20 30 40 50
no. of assays
Rel
ativ
e A
ctiv
ity
(b)
0
20
40
60
80
100
120
0 10 20 30 40 50
no. of assays
Rel
ativ
e A
ctiv
ity
(c)
0,0
20,0
40,0
60,0
80,0
100,0
120,0
0 10 20 30 40 50
no.of assays
Rel
ativ
e A
ctiv
ity
Figure 3.25 Operational stability for (a) Ppy/PPO (b) PM-2/PPO (c) CNPS/PPO
(d) MBTA/PPO
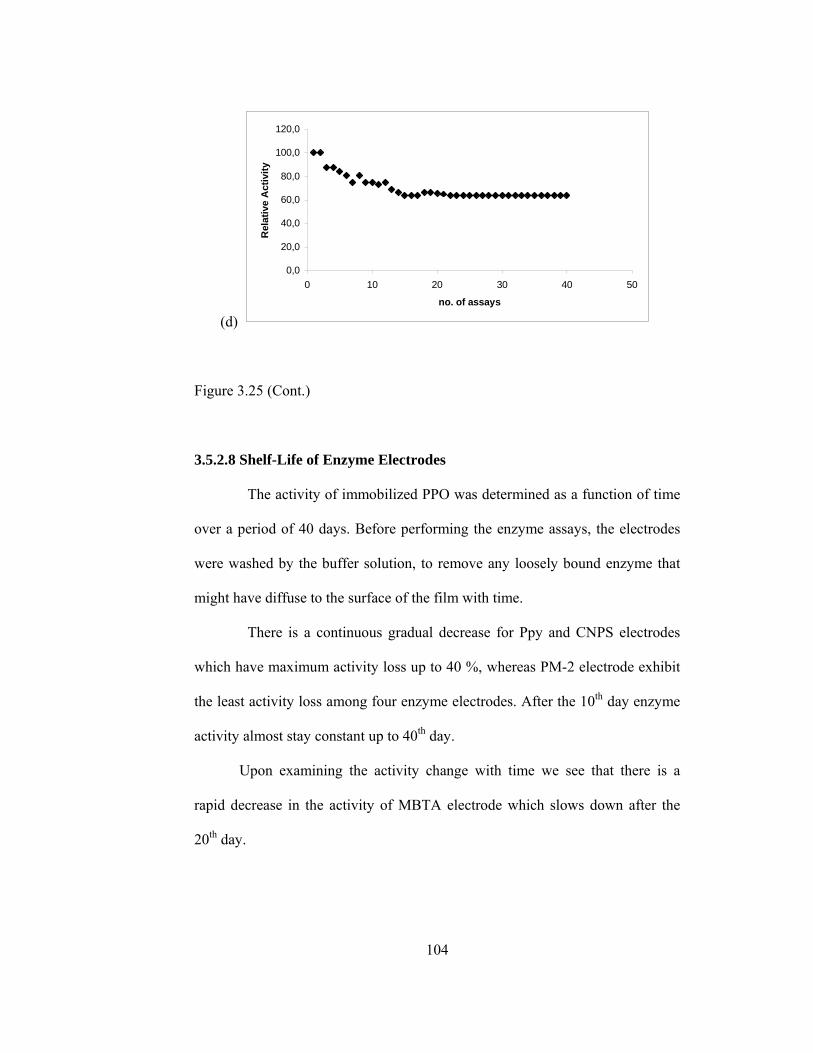
104
(d)
0,0
20,0
40,0
60,0
80,0
100,0
120,0
0 10 20 30 40 50
no. of assays
Rel
ativ
e A
ctiv
ity
Figure 3.25 (Cont.)
3.5.2.8 Shelf-Life of Enzyme Electrodes
The activity of immobilized PPO was determined as a function of time
over a period of 40 days. Before performing the enzyme assays, the electrodes
were washed by the buffer solution, to remove any loosely bound enzyme that
might have diffuse to the surface of the film with time.
There is a continuous gradual decrease for Ppy and CNPS electrodes
which have maximum activity loss up to 40 %, whereas PM-2 electrode exhibit
the least activity loss among four enzyme electrodes. After the 10th day enzyme
activity almost stay constant up to 40th day.
Upon examining the activity change with time we see that there is a
rapid decrease in the activity of MBTA electrode which slows down after the
20th day.

105
(a)
0
20
40
60
80
100
120
0 10 20 30 40 50
days
Rel
ativ
e A
ctiv
ity
(b)
0
20
40
60
80
100
120
0 10 20 30 40 50
days
Rel
ativ
e A
ctiv
ity
(c)
0
20
40
60
80
100
120
0 10 20 30 40 50
days
Rel
ativ
e A
ctiv
ity
Figure 3.26 Shelf life for (a) Ppy/PPO (b) PM-2/PPO (c) CNPS/PPO
(d) MBTA/PPO
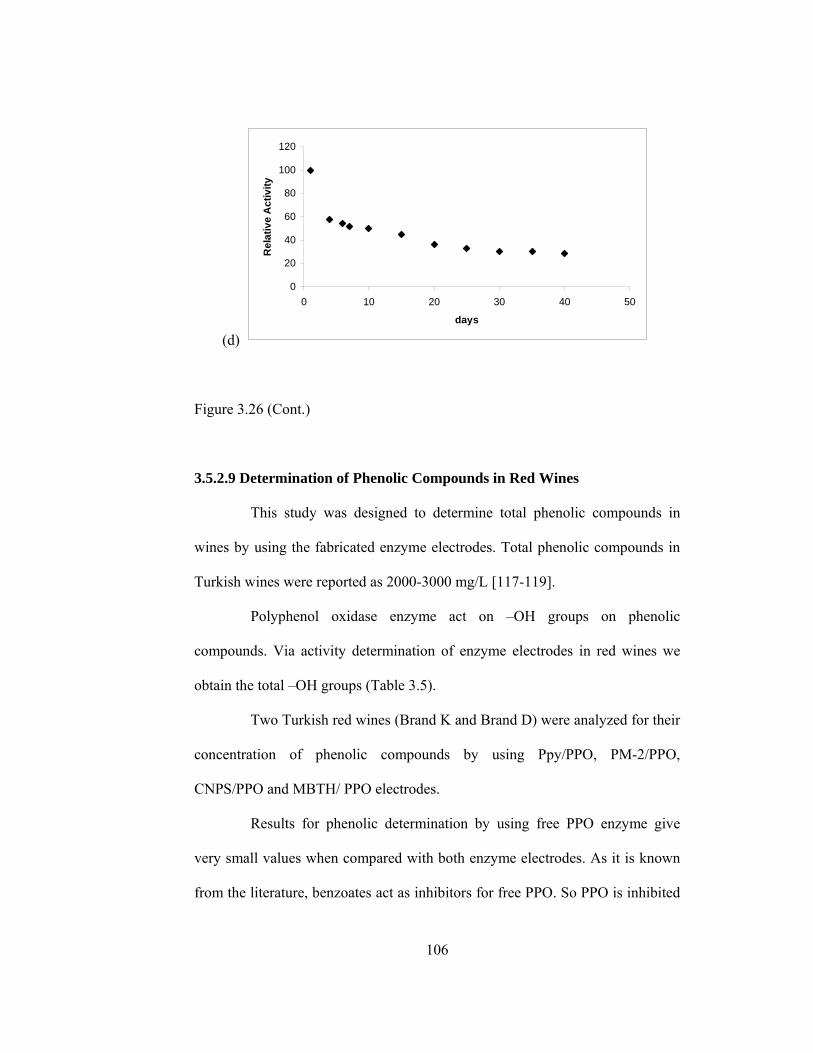
106
(d)
0
20
40
60
80
100
120
0 10 20 30 40 50
days
Rel
ativ
e A
ctiv
ity
Figure 3.26 (Cont.)
3.5.2.9 Determination of Phenolic Compounds in Red Wines
This study was designed to determine total phenolic compounds in
wines by using the fabricated enzyme electrodes. Total phenolic compounds in
Turkish wines were reported as 2000-3000 mg/L [117-119].
Polyphenol oxidase enzyme act on –OH groups on phenolic
compounds. Via activity determination of enzyme electrodes in red wines we
obtain the total –OH groups (Table 3.5).
Two Turkish red wines (Brand K and Brand D) were analyzed for their
concentration of phenolic compounds by using Ppy/PPO, PM-2/PPO,
CNPS/PPO and MBTH/ PPO electrodes.
Results for phenolic determination by using free PPO enzyme give
very small values when compared with both enzyme electrodes. As it is known
from the literature, benzoates act as inhibitors for free PPO. So PPO is inhibited
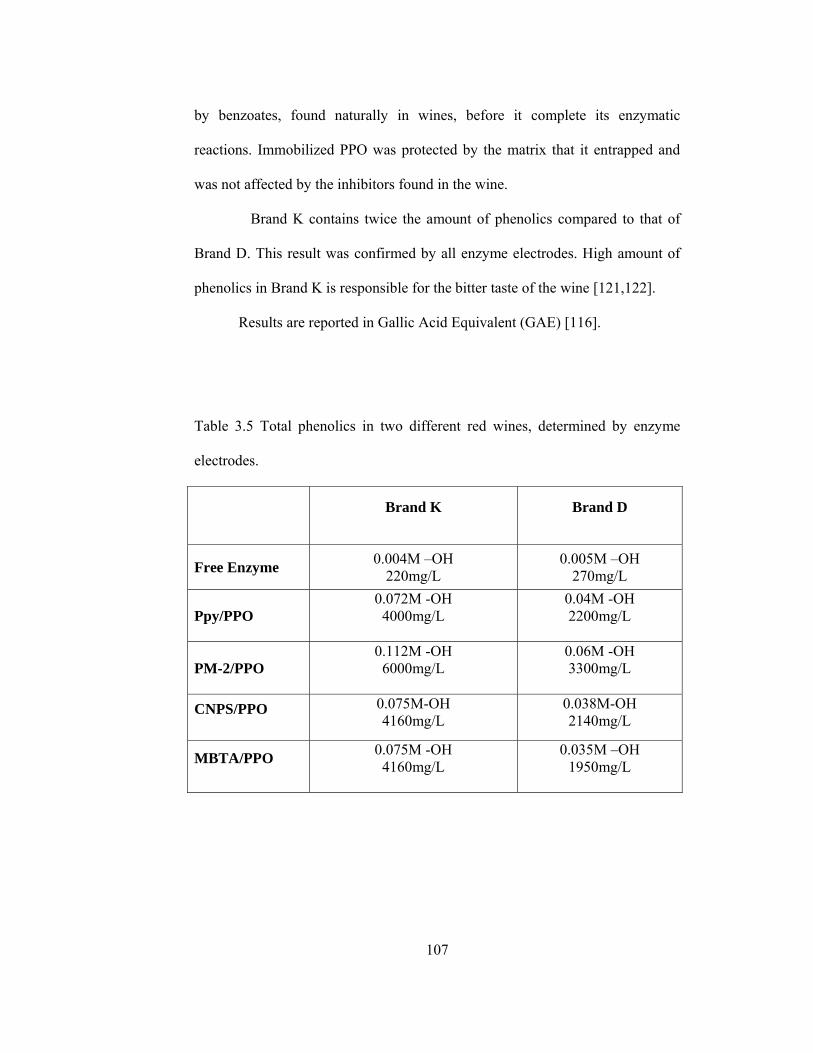
107
by benzoates, found naturally in wines, before it complete its enzymatic
reactions. Immobilized PPO was protected by the matrix that it entrapped and
was not affected by the inhibitors found in the wine.
Brand K contains twice the amount of phenolics compared to that of
Brand D. This result was confirmed by all enzyme electrodes. High amount of
phenolics in Brand K is responsible for the bitter taste of the wine [121,122].
Results are reported in Gallic Acid Equivalent (GAE) [116].
Table 3.5 Total phenolics in two different red wines, determined by enzyme
electrodes.
Brand K Brand D
Free Enzyme 0.004M –OH 220mg/L
0.005M –OH 270mg/L
Ppy/PPO 0.072M -OH
4000mg/L 0.04M -OH 2200mg/L
PM-2/PPO 0.112M -OH
6000mg/L 0.06M -OH 3300mg/L
CNPS/PPO 0.075M-OH 4160mg/L
0.038M-OH 2140mg/L
MBTA/PPO 0.075M -OH 4160mg/L
0.035M –OH 1950mg/L
108
CHAPTER 4
CONCLUSION
A new thiophene derivative containing menthyl group (MM) was
synthesized and polymerized via chemical and electrochemical (constant
current) methods. Polymers and MM itself were used to synthesize copolymers
with pyrrole under conditions of constant potential electrolyses. These
copolymers were used as enzyme immobilization matrices.
In terms of surface morphology, water/PTSA solvent/electrolyte couple
is the most interesting medium for copolymerization. In terms of conductivity
best films were obtained in water/SDS medium. Hence, copolymers of MM
were prepared with an appreciable conductivity.
This study shows that invertase and polyphenol oxidase can be
successfully immobilized in all used matrices synthesized for that purpose. For
both enzymes, as regards to operational stability and shelf-life PM-2 matrix
exhibits significant improvement among the enzyme electrodes. In case of
temperature and pH stability, enzyme electrodes constructed in the presence of
homopolymers reveal better results.

109
Immobilization of polyphenol oxidase enzyme in a conducting polymer
electrode was studied as an alternative method for determination of phenolic
compounds in wines and obtained results reveal that this significant
development can successfully replace the classical methods.

110
REFERENCES
1. C.K. Chiang, CR. Finche Y.W. Park, A.J. Heeger. H. Shirakawa,
E.J.Louis, S.C. Gua, and A.G. MacDiarmid. Phy. Rev. Lett, 39:1098,
1977.
2. N.P. Cheremisinoff (Ed), Encyclopedia of Engineering Materials, Part A,
Polymer science and Tchnology, Marcel Dekker Inc., New york, 1998,
vol.1, chapter8.
3. Shirakawa, E.J. Louis, AG. MacDiarmid, and AJ. Heeger J. Chem.
Soc.Chem. Comm., page 578, 1977.
4. W.R. Salaneck and J.L. Bredas. Solid State Comm., 92:31, 1994.
5. T. Skotheim, J.R. Reynolds, and RL. Elsenbaumer(Eds.). Handbook of
Conjugated Po1ymers II Marcel Dekker INC., NY, 1997.
6. S.Roth, W. Graupner, and P. McNeillia. Acta Phys. Polon., 85:1, 1995.
7. M. Aldissi(Ed.). Intrinsically Conducting Polymers: An Emerging
Technology. Kluwer, Dordrecht, 1993.
8. S.A. Jenekhe and K.J. Wynne (Eds). Photonic and Optoelectronic
Polymers. ACS Symposium Series, Whashinton DC, 1995.
9. A.J. Heeger, S. Kivelson, J.R. Schrieffer, and WP. Su. Rev. Mod. Phys.,
60:781, 1988.

111
10. JL Brédas, RR. Chance, R. Silbey, G. Nicolas, and P. Durand. J.. Chem.
Phys, 75:255, 1981.
11. K. Lee and A.J. Heeger. Synth. Met., 84:715, 1997.
12. RS. Kohlman, T. Ishiguro, H. Kaneko, and A.J. Epstein. Synth. Met,
69:325, 1995.
13. R.S. Kohlman, A. Zibold, D.B. Tanner, G.G. Ihas, T. Ishiguro, Y.G. Min,
AG. MacDiarmid, and AJ. Epstein. Phys. Rev. Lett, 78:3915, 1997.
14. W.R. Salaneck, D.T. Clark, and E.J. Samuelsen (Eds.). Science and Tech-
nology of Conducting Polymers. Adam Hilger. Bristol, England, 1991.
15. K. Mullen and G. Wegner (Ed.). Electronic Materials: The Oligomer Ap-
proach. Wiley-VCH, NY, 1998.
16. F. Garnier, R. Hajlaoui, A. Yassar, and P. Srivastava. Science, 265:684,
1992.
17. H. Sirringhaus, N. Tessler, and R.H. Friend. Science 280:1741,1998.
18. J.J.M. Halls, C.A. Walsh, N.C. Greenham,, E.A. Marseglia, R.H Friend,
S.C. Moratti, and AB. Holmes. Nature, 376:498, 1995.
19. R:H. Friend, R.W. Gymer, A.B. Holmes, E.G.J. Staring, c. Taliani,
D.DC.Bradley, DA. dos Santos, J.L. Bredas, M. Lögdlund, and W.R.
Salaneck.Nature 397:121,1998.
20. F. Hide, MA. Diaz-Garcia, B. Schwartz, MR Anderson, Q. Pei, and A.J.
Heeger Science, 273:1833, 1996.
21. Y.Z. Wang and AJ. Epstein. Acc. Che. Res., 32:217, 1999.
112
22. D.D Gebler, Y.Z. Wang, D.-K. Fu, T.M.. Swager, and A.J. Epstein.
J.Chem. Phys.., 108:7842, 1998.
23. A.O. Patil, A.J. Heeger, F. Wudl, American Chem. Soc. (Chem. Review)
Vol.88, 183 (1988).
24. P. Kovacıc, A. Kyriakis, J. Am. Chem. Soc., Vol.85, 454 (1963).
25. D.M. Ivory, G.G. Miller, J.M. Sowa, L.W. Shacklette, R.R. Chance, R.H.
Baughmann, J. Chem. Phys., Vol.71, 1506 (1979).
26. G.E. Wnek, J.C. Chine, F.E. Karasz, C.P. Lillya, Polymer, Vol.20, 1441
(1979).
27. E.M. Genies, G. Bidan, A.F.Diaz, J. Electroanalyt. Chem., Vol.149, 101
(1983).
28. A.F. Diaz, A. Martinez, K.K. Kanazawa, M. Salmon, J. Electroanalyt.
Chem., Vol.130, 181 (1980).
29. K. Kaneto, K. Yoshino, Y. Inıushı, Solid State Comm., Vol.46, 389
(1983)
30. Jan Bartus, J. Macromol. Sci.-Chem.A(28), Vol.9, 917 (1991).
31. A.J. Heeger, P. Smith, A. Fizazi, J. Moulton, K. Pakbaz, S. Rughooputh,
Synthetic Metals, 41-43, 1027 (1991).
32. Semih Yiğit, Ph.D.Thesis, METU, 1996.
33. N.Balci, U. Akbulut, L. Toppare, d. Stanke and M.L. Hallensleben, Mat.
Res. Bull.,32, 1997, 1449.

113
34. Tanaka, M.; Watanabe, A.; Fujimoto, H; Tanaka, J. Mol Cryst. Liq.
Cryst. 1982,83,277.
35. Plochaski, J.In Material Science Forum; Murch G.E. Ed.; Trans Tech
Pub. Ltd.: Switzerland, 1987; Vol.21, p 173-178
36. Miller, D.L. PhD. Dissertation, Texas A&M University, 1990.
37. Salmon, M.; Diaz, A. F.; Logan, A. J.; Krounbi, M. Bargon, J. Mol
Cr,yst. Liq Cryst. 1982,83.265.
38. Bredas, J.L.; Scott, J. C.; Yakushi, K; Street~ G. B. Phys. Rev. B
1984,30, 1023
39. Wegner, G. Angus, Clue., hit. Ed. Engi. 1931,20,361.
40. Kaufman, J. H Colaneri. N.; Scott, J. C; Kanazawa, K. K.; Street, G. B.
Mol. Cryst. Liq. Cryst. 1985, 118, 171.
41. Y. Ito, H. Shirakawa and S. Ikeda,.J Polym. Sci,13 (1975) 1943.
42. R B. Kaner, Electrochemical Science and Technology of Polymers, R. G.
Linford (Ed), 97, Elsevier Applied Science, Essex, England, 1990.
43. J. Roncali, Chem. Rev., 92(4) (1992) 711.
44. D.J.Walton, Mater.Des., 11(3) (1990)142
45. S. Hotta, T. Hosaka and W. Shimotsuma,Synth. Met, 6(1983) 319.
46. F. Diaz and J. Bargon, Handbook of ConductingPolymers,T. J. Skotheim
(Ed.), Marcel Dekker, New York, 1986, p. 81.
114
47. H. Koezuka, S. Etoh, J. Appl. Phys. 54, 2511 (1983)
48. K. K. Kanazawa, A. F. Diaz, W. Will, P. Grant, G. B. Street, G. P.
Gardini, G. Kwak, Synth.Met. 1, 320 (1980)
49. S. Kuwabata, S. Ito, H. Yoneyama, J. Electrochem. Soc. 135, 1691
(1988)
50. Inganas, B. Liedberg, W. Hang-Ru, H. Wynberg, Synth. Met. 11, 239
(1985)
51. J. P. Ferraris, G. D. Skiles, Polymer 28, 179 (1987)
52. Niva, T. Tamamura, M. Kakuchi, Macromolecules 20, 749 (1987)
53. M. A. DePaoli, R. J. Waltman, A. F. Diaz and I. Bargon, J. Polym. Sci.
Polym. Chem. Ed. 23, 1687 (1985).
54. G. Nagausubramanian, S. DiStefano, I. Elect rochem. Soc. Extended
Abstr. 85, 659 (1985)
55. H. L. Wang, L. Toppare and J. F. Fernandez, Macromolecules 23, 1053
(1990)
56. D. Stanke, M. L. Hallensleben, L. Toppare, Synth. Met. 55, 1108 (1988).
57. D. Stanke, M. L. Hallensleben, L. Toppare, Macromol. Chem. Phys.196,
1697 (1988).
58. D. Stanke, M. L. Hallensleben, L. Toppare, Synth. Met. 73, 261 (1995).
115
59. F. Selampmar, U. Akbulut, T. Yilmaz, A. Gürgör, L. Toppare, I. Polym.
Sci. Polym. Chem. 5, 3009 (1997)
60. F. Selampinar, U. Akbulut, T. Yalcin, S. Suzer, L. Toppare, Synth. Met.
62, 201 (1999)
61. F. Kalaycioglu, L. Toppare, Y. Yagci, V. Harabagiu, M. Pintela, R.
Ardelean, B. Simunescu, Synth. Met. 97, 7 (1998)
62. N. Kizilyar, L. Toppare, A. Onen, Y. Yagci, Polym. Bull. 40, 639 (1997)
63. S. Oztemiz, L. Toppare, A. Onen, Y. Yagci, JMS-Pure Appl.Chem. A37,
277 (2000)
64. Dodabalapur, L. Torsi, H. E. Katz, Science 268, 270 (1995)
65. J. C. Gustafson, 0. Inganas, A. M. Andersson, Synth. Met. 62, 17 (1994)
66. Kraft, A. C. Grimsdale, A. B. Holmes, Angew. Chem. Int. Ed. 37, 402
(1998)
67. F. Jonas, G.Heywang, W. Schmidtberg, J. Heinze, M. Dietrich, M. Europ.
Pat. Appl. 339, 340 (1988)
68. J. C. DuBois, 0. Sagnes, F. Henry, Synth.Met.28, C871 (1989)
69. J. P. Ferraris, M. M. Eissa, I. D. Brotherson, D. C. Loveday, Chem.
Mater. 10, 3528 (1998)
70. G. Heywang, F. Jonas, Adv. Mater.4, 116 (1992)
71. P. N. Bartlett, R.G. Whitaker, J. Electroanal. Chem. 224, 37 (1987)

116
72. N. C. Foulds, C. R. Lowe, J. Chem. Soc. Faraday Trans. 82, 1259 (1986)
73. W. Schuhmann, Microchim. Acta. 121, 1 (1995)
74. P. Novak, K. Muller, K. S. V. Santhanam, 0. Hass, Chem.Rev. 97, 207
(1997)
75. T. F. Otero, H. Grande, in Handbook of Conducting Polymers, (1998)
2nd ed.; I. A, Skotheim, R. L. Elsenbaumer, J. R. Reynolds, (Eds).;
Marcel Dekker: New York
76. D. T. McQuade, A. E. Pullen, T. M. Swager, Chem. Rev. 100, 2537
(2000)
77. J. Pernaut, J. R. Reynolds, J. Phys. Chem. B.104, 4080 (2000)
78. B. Sankaran, ,J. R. Reynolds, Macromolecules 30, 2582 (1997)
79. S. A. Sapp, G. A. Sotzing, J. R. Reynolds, Chem. Mater. 10, 2101 (1998).
80. P. M. S. Monk, R. J. Mortimer, D. R. Rosseirisky, Electrochromism:
Fundemantals and Applications (1995) VCH mc: Weinheim.
81. T. Palmer, Understanding Enzymes (1995) Prentice Hall London.
82. a. Rosevear. J. F. Kennedy, M.S. Cabral, Immobilized Enzymes and Cells
(1997). IOD Publishing Ltd. Bristol
83. K. Mosbach (Ed), Methods in Enzymology, Immobilized Enzymes.
(1976)Academic Press, New York.
84. R.A. Alberty (1956) Advances in Enzymology 17, 1.

117
85. J. B. S. Haldane (1930) Enzymes, Longmans, Green & Co., New York.
86. L. Massart, The Enzymes, (1950) Academic Press, New York.
87. L. Michaelis, m. L. Menten, Biochem, Z. 4(1913).
88. T. Godfrey, S. West, Industrial Enzymology, (1996), Macmillan Press
Ltd, U.K
89. G. S. Mittal, Food Biotechnology (1992), Technomic Publishing
Company USA
90. W. Hartmeimer, Immobilized Biocatalysts (1998) Springer-Verlag, Berlin
91. P. W. Carr, L. D. Bowers, Immobilized Enzymes in Analytical and
Clinical Chemistry (1980) John Wiley & Sons, Inc. New York
92. 0. R. Zaborsky, Immobilized Enzymes (1973), CRC Press, Cleveland
93. . Marconi, S. Gulinelli, F. Morisi, Biotechnol. Bioeng. 16, 501 (1974)
94. H. Maeda, H. Suzuki, A. Yamauchi, A. Sakimal, Biotechnol. Bioeng.
17, 119 (1975)
95. S. S. Wang, W. R. Vieth, Biotechnol. Bioeng. 15, 93 (1973).
96. C. Olson, W. L. Stanley, I. Agric. Food. Chem., 21, 440 (1973).
97. H. Filippusson, W. E. Hornby, Biochem. J. 120, 215 (1970).
98. F. Selampinar, U. Akbulut, M. Y. ~zden, L. Toppare, Biomaterials 92,
1163 (1997)

118
99. N. Kizilyar, M. Y. Ozden, L. Toppare, Y. Yagci., Synth. Met. 104, 50
(1998)
100. R. Erginer, L.Toppare, S. Alkan, U. Bakır, React and Funct Polymers 45
(2000) 227.
101. J. M Nelson, C.R. Dowson, , Advances in Enzymology, 4:99 (1944)
102. J.F. Maddaluno, K.F. Faull, Applied Radiation and Isotopes, 41 (9):873
(1990)
103. F. Stocchi, N.P. Quinn, L. Barbato, P.N. Patsalos, M.T. O’Connel, S.
Ruggieri, C.D. Marsden, Clinical Neuropharmacology, 17 (1): 38 (1994)
104. K.H. Lanouette, Chemical Engineering, 84(22): 99 (1977)
105. S.C. Atlow, L. Banadonna-Aparo, A.M. Klibanov, Biotechnology and
Bioengineering, 26: 599 (1984)
106. J.G. Schiller, A.K. Chen, C.C. Liu, Analytical Biochemistry, 85:25(1978)
107. K. Zachariah, H.A. Mottola, Analytical Letters, 22(5): 1145 (1989)
108. C.R. Tiliyer, P.T. Gobin, Biosensors and Bioelectronics, 6(7): 569
(1991)
109. A.J. Winder, H. Harris, European Journal of Biochemistry, 198: 317
(1991)
110. Vinas P, Lopez-Erroz C, Marin-Hernandez JJ, Hernandez-Cordoba M..
J.Chrom A 2000; 871: 85-93.
119
111.Zhang S, Zhao H, John R.. Anal Chim Acta 2001; 441: 95-105.
112.Kiralp S, Alkan S, Toppare L, Cianga I, Yagci Y J. Macrom. Sci. Pure
and Appl. Chem., A40, 251(2003).
113.A. Levent, L.Toppare, I. Cianga, Y. Yağci, Macr.Chem.Phys, 204,
1118(2003).
114.Mazzocco F, Pifferi PG.. Anal Biochem 1976; 72: 643-647.
115.Russell IM, Burton SG. Anal Chim Acta 1999; 389: 161-170.
116.Rodriguez-Lopez JN, Escribano J, Garcia-Canovas FA. Anal Biochem
1994; 216: 205-212.
117.Lopez M, Martinez F, Del Valle C, Orte C, Miro M. J Chrom A 2001;
922: 359-363.
118.Sakkiadi AV, Stavrakakis MN, Haroutounian SA. Lebensm Wiss Technol
2001; 34: 410-413.
119.Karakaya S, El SN, Taş AA. Inter J Food Sci Nutr 2001; 52: 501-508.
120.Kıralp S, Toppare L, Yağcı Synth. Met., 135, 79(2003)
121.Kiralp S, Toppare L, Yağci Y Int. J. Biol. Macrom., 33, 37(2003)
122.Kıralp S, Toppare L, YağcıY Des Monomers Polym., 7,3 (2004)
120
VITA
Senem Kıralp was born on September 15 1976 in Cyprus. She graduated
from Middle East Technical University, Faculty of Arts and Science in 1997.
She began her MS studies at chemistry department of METU where she became
a research assistant. During this time she worked on electrochemistry under the
supervision of Prof. Dr. Zuhal Küçükyavuz. She began doctorial studies in 2000
with Prof. Dr. Levent Toppare in the area of electrochemical polymerization,
conducting polymers and enzyme immobilization. Within this time she has
published 8 papers in international journals.
1. S. Kiralp, S. Alkan, L. Toppare, I. Cianga, Y. Yagci “Synthesis and
Characterization of Conducting Copolymers of Menthyl Ester of 3-
Thiophene Acetic Acid with Pyrrole”. J. Macrom. Sci. Pure and Appl.
Chem., A40, 251(2003).
2. S.Kıralp, L.Toppare, Y.Yağcı “Immobilization of İnvetase in
Copolymers of thiophene Functionalized Menthyl Ester with pyrrole”
Synth. Met., 135, 79(2003)
3. S. Kiralp, L. Toppare, Y. Yağci “Immobilization of Polyphenol Oxidase
in Conducting Copolymers and Determination of Phenolic Compounds
in Wines with Enzyme Electrodes” Int. J. Biol. Macrom., 33, 37(2003)
121
4. S.Kiralp, Z.Küçükyavuz, A.F.Qasrawi “Preparation and characterization
of Conducting polybutadiene/Polythiophene Composites” Turkish J.
Chem. 27, 417(2003)
5. S. Kıralp, L. Toppare, Y. Yağcı “Determination of Phenolic Compounds
in Wines with Enzyme Electrodes Fabricated by Immobilization of
Polyphenol Oxidase in Conducting Copolymers” Des Monomers Polym.,
7,3 (2004)
6. S. Kıralp, A. Cirpan, L. Toppare “Enzyme Electrodes for Determination
of Total Phenolic Capacity of Red Wines” Biosens and Bioelect
(submitted)
7. H.B.Yildiz, S.Kiralp, L.Toppare, Y. Yağcı “Immobilization of invertase
in conducting polypyrrole/PMMA-co-PMTM graft copolymers” J.Appl.
Polm. Sci. (submitted)
8. H.B.Yildiz, S.Kiralp, L.Toppare, F.Yilmaz, Y.Yağcı, K.Ito, T.Senyo
“Conducting copolymers of 3-methyl methacrylate and p-
vinylbenzyloxy poly(ethyleneoxide) and their electrochromic
properties1” Polymer Journal (submitted)
9. H. B.Yildiz, S.Kiralp, L.Toppare, F.Yilmaz, Y.Yağcı, K.Ito, T.Senyo
“Polyethylene oxide enzyme electrodes for determination of total
phenolic capacity of red wines” J. Appl. Polm. Sci. (submitted)
Top Related