


Languages
Pages
Legal


Scholars' Mine Scholars' Mine
Doctoral Dissertations Student Theses and Dissertations
Fall 2015
Synthesis and characterization of vanadium oxide nanomaterials Synthesis and characterization of vanadium oxide nanomaterials
Tyler M. Fears
Follow this and additional works at: https://scholarsmine.mst.edu/doctoral_dissertations
Part of the Chemistry Commons
Department: Chemistry Department: Chemistry
Recommended Citation Recommended Citation Fears, Tyler M., "Synthesis and characterization of vanadium oxide nanomaterials" (2015). Doctoral Dissertations. 2443. https://scholarsmine.mst.edu/doctoral_dissertations/2443
This thesis is brought to you by Scholars' Mine, a service of the Missouri S&T Library and Learning Resources. This work is protected by U. S. Copyright Law. Unauthorized use including reproduction for redistribution requires the permission of the copyright holder. For more information, please contact [email protected].

SYNTHESIS AND CHARACTERIZATION OF VANADIUM OXIDE
NANOMATERIALS
by
TYLER MARTIN FEARS
A DISSERTATION
Presented to the Graduate Faculty of the
MISSOURI UNIVERSITY OF SCIENCE AND TECHNOLOGY
In Partial Fulfillment of the Requirements for the Degree
DOCTOR OF PHILOSOPHY
in
CHEMISTRY
2015
Approved by:
Jeffrey G. Winiarz (Co-Advisor)
Nicholas Leventis (Co-Advisor)
Richard Dawes
Chariklia Sotiriou-Leventis
Helmut Kaiser
Haskell Taub

Copyright 2015
Tyler Martin Fears
All Rights Reserved

iii
PUBLICATION DISSERTATION OPTION
This dissertation is prepared in the format of the Journal of Sol-Gel Science and
Technology (Springer), the Journal of Power Sources (Elsevier), and the journal Physical
Chemistry Chemical Physics (Royal Society of Chemistry). This dissertation includes an
article published in the Journal of Sol-Gel Science and Technology (Paper I, 32-72), an
article published in the Journal of Power Sources (Paper II, 73-100), and an article in
preparation for submission to the journal Physical Chemistry Chemical Physics (Paper
III, 101-146).

iv
ABSTRACT
This dissertation focuses on the synthesis and characterization of vanadium oxide
nanomaterials and neutron-transparent Li-ion battery electrolytes.
Vanadium oxide gels were synthesized via the epoxide-assisted gelation of VOCl3
using epichlorohydrin in ethanol. This represents the first epoxide-assisted gelation
developed for vanadium oxide gels and serves as a potential economical replacement for
the fabrication of vanadium oxide gels via the hydrolysis of vanadium alkoxides. Though
epoxide-assisted gelation has been demonstrated for a number of transition metal oxides,
the gelation mechanism observed here for VOCl3 appears to be unique.
While investigating the electrochemical and structural properties of lithium
vanadates, it became desirable to perform in situ neutron diffraction with electrochemical
cycling. The inability to perform these experiments prompted the development of a series
of perfluorocarboxylate esters which could potentially serve as neutron-transparent
electrolyte solvents and help enable in situ neutron scattering characterizations.
Electrochemical studies were carried out on Si anodes, and the solid-electrolyte-
interphase was studied both ex situ and in situ. Results indicate that these electrolyte
solvents improve neutron scattering data when used in place of standard deuterated
carbonates and provide insight into fluorinated components proposed for next-generation
electrolytes.
v
ACKNOWLEDGEMENTS
I would like to thank my advisor Dr. Jeffrey G. Winiarz for his scientific and
professional guidance; my co-advisor Dr. Nicholas Leventis for his advice; and my
committee members Drs. Chariklia Sotiriou-Leventis, Richard Dawes, Helmut Kaiser,
and Haskell Taub for their support. I would also like to thank Dr. Gabriel M. Veith for his
mentorship at Oak Ridge National Laboratory and Drs. James F. Browning and Mathieu
Doucet on Liquids Reflectometer team at the Spallation Neutron Source for their help
collecting and analyzing neutron reflectometry data. I would also like to thank Dr. Rex
Gerald III for his help performing NMR experiments. I would also like to acknowledge
my lab mates Dr. Jong-Sik Moon and Yichen Liang, as well as the other graduate
students, undergraduate students, and support staff in the Chemistry Department, who are
too numerous to list.
I would like to thank the various sources that provided student and material
support: the Army Research Office (W911NF-14-1-0369), the National Science
Foundation through a University of Missouri Neutron Scattering IGERT Traineeship
(grant DGE-1069091), the U.S. Department of Energy, Office of Science, Office of
Workforce Development for Teachers and Scientists, Office of Science Graduate Student
Research (SCGSR) program, administered by the Oak Ridge Institute for Science and
Education for the DOE under contract number DE‐AC05‐06OR23100, the Missouri S&T
Materials Research Center, and Bayer Corporation.
Finally, I would like to thank my family for their support, love, and forbearance
throughout my undergraduate and graduate careers.

vi
TABLE OF CONTENTS
Page
PUBLICATION DISSERTATION OPTION ................................................................... iii
ABSTRACT ....................................................................................................................... iv
ACKNOWLEDGEMENTS .................................................................................................v
LIST OF ILLUSTRATIONS ...............................................................................................x
LIST OF TABLES ........................................................................................................... xiv
SECTION
1. INTRODUCTION ...........................................................................................................1
1.1 SOL-GEL METHOD .................................................................................................1
1.2 PROPERTIES OF VANADIUM OXIDES ...............................................................5
1.2.1 VO2 Metal-to-Insulator Transition. .....................................................................6
1.2.2 Li Intercalation. ...................................................................................................8
1.3 IN SITU NEUTRON SCATTERING OF BATTERY MATERIALS ....................10
1.3.1 In situ Neutron Diffraction................................................................................14
1.3.2 In situ Neutron Reflectometry. .........................................................................17
BIBLIOGRAPHY ..............................................................................................................23
PAPER
I. Economical synthesis of vanadia aerogels via epoxide-assisted gelation of
VOCl3 ........................................................................................................................31
Abstract ..........................................................................................................................31
1 Introduction .................................................................................................................33

vii
2 Results .........................................................................................................................36
2.1 Gelation ................................................................................................................36
2.1.1 H2O and Epoxide Optimization ....................................................................39
2.1.2 Mesophase 13
C and 1H Nuclear Magnetic Resonance (NMR) .....................41
2.1.3 Epoxide Ring-Opening in H2O-Free Sols .....................................................43
2.2 Physical Properties ...............................................................................................47
2.2.1 Nanomorphology, Surface Area, and Porosity .............................................47
2.2.2 Solvent Trapping and H2O Content ..............................................................49
3 Discussion ...................................................................................................................51
4 Conclusion ..................................................................................................................55
5 Experimental Section ..................................................................................................56
5.1 Aerogel and Xerogel Synthesis ............................................................................56
5.2 Materials Characterization ...................................................................................57
Acknowledgements ........................................................................................................59
References ......................................................................................................................60
Electronic Supplementary Material ...............................................................................64
II. A study of perfluorocarboxylate ester solvents for lithium ion battery
electrolytes ................................................................................................................73
ABSTRACT ...................................................................................................................73
1. Introduction ................................................................................................................75
2. Materials and methods ...............................................................................................77

viii
2.1 Perfluorocarboxylate esterification ......................................................................77
2.2. Si Thin Film Fabrication .....................................................................................79
2.3. Electrochemical Characterization .......................................................................79
2.4. Ex situ Analysis of Cycled Electrodes ................................................................80
3. Results ........................................................................................................................81
3.1 Ester Physical Properties......................................................................................81
3.2. Galvanostatic Cycling of Si Anode Half-Cells ...................................................83
3.3. ATR-IR of Soluble Electrolyte Decomposition Products ...................................89
3.4. XPS of SEIs Formed on Si Anodes ....................................................................90
4. Discussion ..................................................................................................................96
5. Conclusion .................................................................................................................97
Acknowledgements ........................................................................................................98
References ......................................................................................................................99
III. Evaluating the solid-electrolyte-interphase formed on silicon electrodes: a
comparison of ex situ X-ray photoelectron spectroscopy and in situ neutron
reflectometry ...........................................................................................................101
1. Introduction ..............................................................................................................102
2. Materials and methods .............................................................................................105
2.1. Perfluorocarboxylic acid esterification .............................................................106
2.2. Neutron Scattering Profile ................................................................................107
2.3. Fabrication of electrochemical cell for in situ NR ............................................108
2.4. In situ electrochemistry and NR .......................................................................110

ix
2.5. Fitting of NR data .............................................................................................112
2.6. Ex situ characterization .....................................................................................112
3. Results ......................................................................................................................114
3.1. Ester physical properties ...................................................................................114
3.2. Comparison of ex situ and in situ electrochemistry ..........................................117
3.3.Neutron reflectometry ........................................................................................119
3.4.Ex situ XPS ........................................................................................................126
3.5. Ex situ NMR .....................................................................................................132
4. Discussion ................................................................................................................135
6. Conclusion ...............................................................................................................139
Acknowledgements ......................................................................................................139
References ....................................................................................................................141
Electronic Supplementary Material .............................................................................143
SECTION
2. CONCLUSION ............................................................................................................147
VITA ................................................................................................................................149

x
LIST OF ILLUSTRATIONS
Page
Figure 1.1. H+-catalyzed epoxide ring-opening in the presence of nucleophilic
anions utilized for epoxide-assisted gelation of metal oxides. ...................4
Figure 1.2. SEM images showing the unique nanomorphology of alkoxide
and VOCl3 gels. ..........................................................................................5
Figure 1.3. Optical MIT in undoped and W-doped VO2 films. ....................................7
Figure 1.4. I-V curve for an electrodeposited VO2 film showing resistance
switching hysteresis. ...................................................................................8
Figure 1.5. The cycling characteristics of NMC and NMC core-shell cathode
materials with accompanying SEM images. ............................................10
Figure 1.6. Wavelength as a function of kinetic energy for X-rays and
neutrons. ...................................................................................................12
Figure 1.7. Graphical representation of the relative scattering cross-sections
for selected elements. ...............................................................................13
Figure 1.8. Growth of Ni/Mn ordered phase with annealing in LiNi0.5Mn1.5O4
spinel.........................................................................................................15
Figure 1.9. In situ neutron diffraction of a commercial LiαNixMnyCo1-(x+y)O2
vs. graphite cell. ........................................................................................16
Figure 1.10. Neutron reflectometry of a stack of poly(styrene sulfonate) and
poly(allylamine hydrochloride) made via spin-assisted layer-by-
layer deposition with regularly placed deuterated layers to provide
contrast. ....................................................................................................18
Figure 1.11. Image and diagram of an in situ electrochemical cell used on
Beam Line 4B at the Spallation Neutron Source at Oak Ridge
National Laboratory..................................................................................20
Figure 1.12. 1H NMR of deuterated and protiated ethylene carbonate-
dimethylcarbonate electrolytes used for in situ neutron
reflectometry.............................................................................................22
PAPER I
Scheme 1 Acid-scavenging mechanism for commonly used epoxides and
nucleophilic metal salt anions ..................................................................35

xi
Scheme 2 Fabrication procedure for vanadia aerogels, polymer-crosslinked
vanadia aerogels, and vanadia xerogels ....................................................38
Fig. 1 Mesophase 13
C NMR of a wet-gel before and after aging .......................42
Fig. 2 Reference peak drift in mesophase 13
C NMR during gel aging. ..............43
Fig. 3 1H NMR of H2O-free sols shows the inductive effect of V
V and
exchange broadening in EtO--V
V chelates and ECH ring-opening
in the absence of H2O and H+. ..................................................................44
Scheme 3 Formation of 5-coordinate VOCl3 adducts of EtOH and ECH, Cl-
↔EtO- ligand exchange, and Lewis acid-catalyzed intramolecular
epoxide ring-opening in the absence of free Cl- in CCl4 observed
via 1H NMR in H2O-free sols ...................................................................46
Fig. 4 Representative SEM and TEM images of VOx aerogels ..........................47
Fig. 5 N2-sorption isotherms for a VOx xerogel, VOx aerogel, and X-
VOx aerogel ..............................................................................................49
Fig. 6 TGA-MS results for vanadia aerogels and xerogels .................................51
Scheme 4 Proposed reaction mechanism for gelation in the VOCl3-ECH-
EtOH system involving ligand exchange in EtOH; Lewis-acid-
catalyzed ECH ring-opening; neutral 4-, 5-, and 6-coordinate
species potentially formed during additional ligand exchange; and
a possible mechanism for the polymerization of vanadium oxide
via olation of a 5-coordinate vanadyl hydroxide ......................................54
Figure S.1 UV-Vis absorption spectra comparing several VOCl3 solutions
and a wet gel, assuming a 25 μm path length ...........................................65
Figure S.2 UV-Vis absorption spectra of standard epoxide gel during aging,
assuming a 25 μm path length. .................................................................66
Figure S.3 Concentration of ECH, MCPDH2, MCEPH and their Sum as a
function of time as monitored by 13
C NMR .............................................67
Figure S.4 X-ray diffraction pattern of a ground vanadia aerogel monolith ..............68
Figure S.5 Conformally coated cylindrical VOx nanoworm approximation
used to calculate polymer coating density ................................................69
Figure S.6 Representative quasi-static compression tests of X-VOx aerogels
with different densities, as controlled by isocyanate concentration
in crosslinking solutions ...........................................................................70

xii
Figure S.7 MS signals between m/z = 15 and m/z = 300 above the detection
limit for vanadia aerogels and vanadia xerogels ......................................71
PAPER II
Fig. 1. Perfluorocarboxylate esters investigated in this work. .............................76
Scheme 1. Esterification of perfluoroglutaric acid to form dimethyl
perfluoroglutarate. ....................................................................................78
Fig. 2. Electrochemical cycling results on Si thin film electrodes. .....................85
Fig. 3. Capacity fade in Si thin film electrodes. ..................................................87
Fig. 4. IR absorption spectra of the PF5M2 electrolyte before and after
500 cycles at C/5. .....................................................................................89
Scheme 2. Electrochemical de-esterification of PF5M2. ...........................................90
Fig. 5. High-resolution XPS of lithiated Si electrodes. .......................................91
Fig. 6. High-resolution XPS and atomic fractions of Si electrodes cycled
with 0.1 M LiTFSI in PF5M2 at the various SOCs shown in Fig.
7.. ..............................................................................................................93
Fig. 7. Differential capacity curve with SOCs labeled for XPS data. ..................94
Scheme 3. Electrochemical defluorination of lithium perfluoroglutarate. .................95
PAPER III
Fig. 1 d3-methyl perfluorocarboxylate esters investigated as electrolyte
solvents in this study. .............................................................................105
Scheme 1 Esterification of perfluorobutyric acid to form methyl
perfluorobutyrate. ...................................................................................106
Fig. 2 Experimental geometry for collecting NR data. .....................................110
Fig. 3 Calculated total neutron scattering coefficients and measured
neutron scattering profiles for selected electrolyte solvents...................116
Fig. 4 Differential capacity curve for the first cycle of a Si thin-film half-
cell used for ex situ analysis. ..................................................................118
Fig. 5 Electrochemical data for in situ NR cell.................................................119
Fig. 6 NR data and fits in order of collection. ..................................................120
xiii
Fig. 7 SLD profiles representing the tabulated fit parameters. .........................122
Fig. 8 Potential relaxation and relaxation rate for in situ NR and coin
cells stopped at various potentials. .........................................................124
Fig. 9 Ex situ Si 2p XPS spectra used to calculate SEI thickness using
Eq. 5. .......................................................................................................129
Fig. 10 Atomic compositions of the SEI determined from XPS and used
to estimate SLD. .....................................................................................131
Fig. 11 1H,
7Li,
13C, and
19F NMR spectra of deuterated and protiated
electrolytes before and after cycling. ......................................................133
Fig. 12 SEI thickness and SLD as determined via ex situ XPS and in situ
NR...........................................................................................................136
Fig. S1 High-Q NR data before background subtraction. ...................................144

xiv
LIST OF TABLES
Page
PAPER I
Table 1 Results of attempts to fabricate gels at different sol concentrations ........37
Table 2 Gel quality and gelation time as a function of H2O content and
epoxide functionality. ...............................................................................40
Table 3 Physical properties of VOx and X-VOx gels .............................................49
PAPER II
Table 1. Electrolyte conductivity as determined by impedance
spectroscopy. ............................................................................................82
PAPER III
Table 1 Results of NR fits for electrochemically active components. ................126
Table 2 Layer thicknesses derived from ex situ XPS. .........................................130
Table S1 Multilayer parameters determined from NR fits. ...................................145
1. INTRODUCTION
Like many other transition metal oxides, vanadium oxides possess useful optical,1-
11 electronic,
1, 2, 12-21 magnetic,
1, 21-23 and catalytic properties.
24-27 The redox activity and
typically lamellar molecular structures of crystalline and amorphous vanadium oxides
also makes these materials useful as intercalation cathodes for Li-ion batteries.12, 28-39
Physical vapor deposition (PVD),1, 2, 15, 26, 29, 40
chemical vapor deposition
(CVD),1, 15
atmospheric pressure chemical vapor deposition (APCVD)5, 7, 15, 30
and
electrochemical deposition19, 30
are all frequently used to deposit vanadium oxide films.
However, the most effective method for fabricating monolithic structures is the sol-gel
method, a well-studied, versatile technique that has been shown to be effective for
numerous transition metal oxides.41
This method is well-suited for device fabrication of
many geometries, especially those that require high porosity or surface area.1, 3, 4, 6, 9, 12, 18,
20, 27, 32-34, 38, 39, 42-52
The synthesis of vanadium oxide nanomaterials using sol-gel techniques is
discussed, including synthetic mechanisms and properties of the fabricated samples.
Additional attention will be placed on the development and characterization of neutron-
transparent Li-ion battery electrolytes and the relationship between that work and
vanadium oxide nanomaterials.
1.1 SOL-GEL METHOD
The sol-gel technique is typified by sequential hydrolysis and condensation
steps.53
There are several methods for fabricating vanadium oxide (VOx) gels,42, 48
including oxide hydrolysis,18
peroxide-assisted hydrolysis,46, 49
cation-exchange,4, 32, 47, 50
and alkoxide hydrolysis.3, 12, 20, 31, 33, 44, 51, 52
Variations on these techniques also exist
2
which utilize templating50
and chelating agents.6 All of these techniques proceed through
the formation of acidic polyvanadates (e.g. V10O286-
, V6O162-
, etc.) in solution followed
by aggregation into a space-filling gel. The strong anisotropy of polyvanadates leads to
fibrous gel morphologies, dissimilar from many inorganic sol-gels, which are typified by
random aggregates of spherical particles.41
The first step in the oxide hydrolysis method is the formation of soluble metal
oxide hydrates from vanadium oxide, which speciate as a number of polyvanadates in
aqueous solution. This method is employed by quenching molten V2O5 (ca. 900 °C) in
distilled H2O, forming a gel on the order of hours to days. It has also been noted that
crystalline V2O5 powders slowly dissolve in distilled water over the course of weeks to
form solutions which undergo gelation through the same process over much longer time
periods.12, 42, 48
Peroxide-assisted hydrolysis takes advantage of the chelating power of the
peroxide anion (O22-
). In the presence of aqueous hydrogen peroxide, crystalline V2O5
powder forms soluble, metastable vanadium oxy-peroxides, of which several have been
identified: VO(O2)(H2O)3+, VO(O2)2(H2O)2
-, [VO(O2)2]2O(H2O)2
4-, and
(O2)2OVOVO2(O2)4-
which can take on varying degrees of protonation.46
The particular
speciation in solution is a function of H+, V
V, and O2
2- concentration. As the peroxides
decay, forming O2 and H2O, polyvanadates are formed, which undergo gelation in the
same manner as previously described.45, 46, 48, 49
NaVO3 is the soluble, alkaline vanadate most commonly used in the cation
exchange method. A NaVO3 solution is passed through a cation exchange column to
acidify the solution and remove unwanted Na+ ions. The acidified solution undergoes

3
polymerization and gelation as previously described. In some cases, incomplete ion-
exchange is desirable, forming Na2xV3O8-x (0 ≤ x ≤ 0.5) gels. Similarly, direct
acidification of NH4VO3—another soluble, alkaline vanadate—in aqueous solutions leads
to gelation.4, 32, 39, 42, 47, 48
Unlike the previous syntheses, the alkoxide method takes place in non-aqueous
media, as metal alkoxides are prone to rapid hydrolysis, forming flocculates or
precipitates instead, if added directly to H2O. Vanadia gels are commonly made in
acetone with controlled concentrations of H2O and VO(OR)3 species (typically vanadium
oxytripropoxide or vanadium oxytriisopropoxide). The exothermic nature and speed of
hydrolysis necessitates performing the gelation at a reduced temperature, i.e. using a dry
ice/acetone bath. The presence of organic species during gelation causes some VV→V
IV
(red/yellow→blue) reduction, which is apparent in the final gel coloration (green). Some
alkoxide-derived gels also have a distinct nanomorphology intermediate between the
random spherical aggregates of silica gels and monofilament fibers of other vanadium
gels, the cause of which has not been investigated.1, 3, 4, 31, 33, 39, 51, 52
Recently, following a trend in other transition metal oxides,41, 54
an epoxide-
assisted gelation method has been developed for the fabrication of sol-gel vanadium
oxides. In this method, acidic hydrated metal salts (typically chlorides or nitrates)
protonate the epoxide ring, enabling irreversible ring-opening by nucleophilic anions.
This process consumes H+ and gradually raises the pH of the solution, uniformly
inducing gelation (Figure 1.1).54

4
Figure 1.1. H+-catalyzed epoxide ring-opening in the presence of nucleophilic anions
utilized for epoxide-assisted gelation of metal oxides.
The primary advantage of epoxide-assisted gelation is cost. Aside from a few
examples (Si, Ti, Al), transition metal alkoxides are prohibitively expensive or
commercially unavailable; whereas their chlorides and nitrates are comparatively
inexpensive. The two most common epoxides used are propylene oxide (PPO) and
epichlorohydrin (ECH), which are inexpensive and have reactivities which differ
sufficiently for useful control over gelation rates. Though this procedure has been
developed for a large number of metal oxide systems, the epoxide-assisted gelation of
vanadia had been notably unobserved before this work.55
An additional advantage of the epoxide method over the alkoxide method is the
stability of the precursors. Vanadium oxytriisopropoxide (VO(OiPr)3), a commonly used
vanadium alkoxide, and VOCl3, used in the epoxide method, are both prone to hydrolysis
from ambient moisture; however, while the alkoxide forms solid precipitates, the acid
chloride forms soluble hydrates, especially stable in alcoholic or ethereal solutions, until
the addition of the epoxide. It was also noted that, while the nanomorphology of gels
fabricated in-house using the alkoxide and epoxide methods were nominally equivalent

5
(Figure 1.2), the gels fabricated through the epoxide method were of a superior optical
quality (glassy) and significantly sturdier.
Figure 1.2. SEM images showing the unique nanomorphology of alkoxide51
and VOCl3
gels.
1.2 PROPERTIES OF VANADIUM OXIDES
Like many transition metal oxides, vanadium(III, IV, and V) oxides have
interesting properties as catalytic25, 27, 56
and magnetic materials;1, 15, 21, 22
however, those
properties and applications will not be discussed here. Instead, two properties of recent
interest with immediately apparent commercial application will serve as the motivation
for the fabrication of functional vanadium oxide devices: the metal-insulator transition
(MIT) of VO2 and Li-intercalation properties of numerous vanadium oxide phases.

6
1.2.1 VO2 Metal-to-Insulator Transition. The MIT of V2O3 and VO2 have been
known for half a century.13
This transition is characterized by a subtle structural
transformation and conductivity change that covers several orders of magnitude and
occurs at a well-defined temperature. These and several intermediate vanadium oxides—
and a number of other transition metal oxides—possess this property,21
but VO2 is of the
most practical importance, as its 68 °C transition is closest by far to ambient
temperatures, meaning that it is more easily accessible. This transition can be induced
thermally, optically, or electrically, and the efficiency of any device utilizing such
interactions is limited in part by the energy input required to induce the transition, which
is minimized by transitions which take place near the operating temperature.16, 17
It is
preferable to operate any device at ambient temperatures, as opposed to liquid N2 or He
temperatures, which are common in the laboratory but difficult to achieve in consumer
products.
One recent commercial foray that utilizes the MIT of VO2 is the development of
energy-efficient thermochromic window coatings.7, 9-11
Accompanying the MIT is a—
predictably—significant change in the optical properties of VO2. Specifically, the
reflectivity of VO2 in the infrared (IR) region is significantly increased in the high-
temperature, metallic phase (Figure 1.3). Using this property, coated windows allow most
solar energy to pass when below the transition temperature and reflect a large portion of
the radiation when above the transition temperature, creating a passive temperature
mediation device. Since humans prefer temperatures below 68 °C, dopants (typically W)
are used to lower the transition temperature.11

7
The MIT in VO2 can also be utilized in optical limiters and shutters. Optical
limiters are used to protect sensors from saturating or becoming damaged by intensities
above the dynamic range of devices. VO2 (IR) limiters work by increasing their
reflectivity—as opposed to absorption—at high incident intensity. The speed of this
transition (~0.5 ps) also makes VO2 ideal for high-speed optical shutters in which a high-
intensity visible writing beam induces the transition and an IR beam reads the state.
These optical shutters are of interest as elements in all-optical digital logic devices.2, 17
`
Figure 1.3. Optical MIT in undoped (a) and W-doped (b) VO2 films. Reproduced from
literature.4
Electronic logic gates are built on discontinuous changes in conductivity. In
current transistor technologies, this is done by modifying the carrier density in a
semiconductor contact using a gate voltage, but any material or device geometry which

8
can reliably alter its conductivity by a significant amount is compatible with current logic
architectures. Resistance switching in VO2 (Figure 1.4) represents one possible
mechanism for such devices.19
Despite the fact that the MIT in VO2 has been known and studied for over 60
years, the exact nature of the transition is still under debate.17, 21
One important contested
aspect in optically- and electrically-induced transitions is whether the transition is truly
field-induced, as seen in gated Si-based microelectronics, or thermally-induced by local
heating from optical absorption and joule heating, respectively.2, 17, 19
Figure 1.4. I-V curve for an electrodeposited VO2 film showing resistance switching
hysteresis. Reproduced from literature.19
1.2.2 Li Intercalation. Vanadium oxides have been studied as potential Li-
intercalation cathodes. They operate in a reasonable voltage range (1.5-3.5 V vs. Li) and
possess high theoretical capacities. Unfortunately, these materials typically exhibit
unacceptably poor cycling lifetimes.28, 35, 57
Recent studies on nanostructured materials
suggest that improvements in cycling fade are possible, suggesting that vanadium oxide
materials may be made commercially viable.58-60

9
Initial efforts focused on Li2V6O13,35
which has the fortuitous property of metallic
conductivity (most intercalation cathodes have poor conductivity, increasing internal
resistance at the interface of the cathode and current-collector). However, conductivity
decreases with Li insertion and the material does not possess a satisfactory cycling
lifetime. Other investigated vanadates (LiV3O8, V2O5, VO2(B)) also possess poor cycling
lifetimes,61
but studies with nanoparticulate and amorphous vanadates show improved
cycling characteristics. 30-34, 37, 39, 61
Using nanostructured materials to improve the performance of electrode materials
has been proven effective in other systems, including commercially successful materials.
LiFePO4 only became commercially viable after coating the insulating nanocrystals with
a conductive carbon coating, greatly improving power density.59
LiNiαMnβCoγO2 (NMC)
cathode materials have differing properties depending on their transition metal ratio: a
composition which possesses high capacity tends to suffer from degradation at the
electrolyte interface, while a lower-capacity composition possesses excellent stability
towards the electrolyte. By coating the high-capacity material with a low-capacity
material shell, the desired properties of both materials were obtained (Figure 1.5).58
AlF3
and TiO2 have also been investigated as coatings for surface passivation to improve the
cycling characteristics of MnO2 cathode materials.59
Si anodes possess a much higher
capacity than graphite anodes, but undergo massive expansion (ca. 300%), leading to
extreme strain and fracture during Li insertion. Nanoparticles have inherent resistance to
strain fracture, making them ideal for systems plagued by strain fracture, explaining the
interest in Si nanowire anodes.60

10
Figure 1.5. The cycling characteristics of NMC (blue) and NMC core-shell (red) cathode
materials with accompanying SEM images. Reproduced from literature.58
While vanadate cathode materials suffer from poor cycling characteristics,
attributed primarily to strain during Li insertion and extraction, their favorable
comparisons to commercial cathodes (LiVO2-LiCoO2)—and the potential for very high
charge capacity in some cases—cause them to remain subjects of interest. Advances in
nanostructured and composite electrode materials suggest that capacity fade in vanadates
can be mitigated.
1.3 IN SITU NEUTRON SCATTERING OF BATTERY MATERIALS
X-ray scattering and neutron scattering occupy much of the same theoretical
domain and can be treated using similar mathematical formalisms, the details of which
are covered in detail in other texts.62-68
While numerous X-ray and neutron scattering
techniques are routinely applied in a wide variety of fields, this discussion will focus on
11
those aspects which differentiate X-ray and neutron scattering and are relevant to the
analysis of battery electrodes and interfaces.
There are four practical differences between X-ray scattering and neutron
scattering.65, 69
(1) The mass of the neutron means that much lower energies are necessary
to reach wavelengths on the order of chemical bonds when compared to X-rays (Figure
1.6). This facilitates the investigation of low-energy inelastic phenomena such as
molecular diffusion and phonon excitation. (2) Neutrons scatter from atomic nuclei via
the (relatively weak) strong force. Since this interaction is isotope dependent, isotopic
doping can be used to distinguish between otherwise indistinguishable chemical
environments. (3) Neutrons are spin-1/2 particles and can be used to investigate magnetic
phenomena. (4) Neutrons can only be produced in significant quantities at dedicated
facilities which are ~105 times dimmer than common laboratory X-ray sources. Of these
differences, the nuclear scattering dependence (2) and low intensity of neutron sources
(4) affect the study of battery materials most.
The weak interaction of neutrons with matter means that they penetrate materials
more easily than X-rays and are well-suited for non-destructive characterization of
assembled devices. Unfortunately, this also means that large samples are required to
obtain data at a comparable rate (additionally complicated by the low brightness of
neutron sources).

12
Figure 1.6. Wavelength as a function of kinetic energy for X-rays and neutrons.
Coherent X-ray scattering cross-sections scale approximately with the square of
the atomic number (σcoh ∝ Z 2
), so heavy atoms dominate scattering events and atoms of
similar Z are difficult to differentiate. Neutron scattering cross-sections do not obey a
similarly simple trend (Figure 1.7). As a result, neutrons are much more sensitive to light
elements and are often able to differentiate between elements of similar Z.62, 65
Additionally, since neutron scattering cross-sections are isotope-dependent, isotopic
substitution can provide contrast to chemically or physically distinct features which are
otherwise atomically indistinguishable. While X-ray scattering form factors are always
positive (f ∝ σcoh1/2
> 0), neutron scattering lengths can be positive or negative (b ∝
±σcoh1/2
).69
Positive and negative scattering lengths can provide contrast for nuclei with

13
similar scattering cross-sections or suppress scattering from specific features through
isotopic substitution and contrast matching.
Figure 1.7. Graphical representation of the relative scattering cross-sections for selected
elements. Coherent neutron cross-sections are shown for relevant primary (bottom) and
secondary (top) isotopes with positive (blue) and negative (red) scattering lengths. (F,
Mn, and Co only have a single stable isotope and O isotopes do not have sufficiently
different scattering lengths for practical use.) Incoherent scattering cross-sections
(yellow) are shown for elements at their natural isotopic abundancy.69
The primary barrier to performing neutron scattering experiments is the
availability of sufficiently luminous sources. Neutron production requires significant
infrastructure, e.g., a reactor or accelerator, which is not economically feasible for a
typical research group. Even then, sources are typically orders of magnitude less
luminous than common laboratory X-ray sources.65
This limitation means that neutrons
are extremely expensive to produce and must be utilized efficiently. This concern is
especially important in in situ studies, where material not of interest is often in the

14
neutron beam, attenuating signal and increasing background, and in situ sample
modification consumes precious instrument time.
The most common source of interference in neutron scattering experiments is
ancillary sources of 1H in the form of organic material and H2O.
1H possesses an
enormous incoherent scattering cross-section (Figure 1.7), making it an excellent
moderator and radiation shielding component but a serious inconvenience in
experimental apparatuses and methodologies. Isotopic (2H) substitution is common and
typically sufficient to enable successful data collection; however, it is not always possible
nor desirable.62, 64-68, 70-73
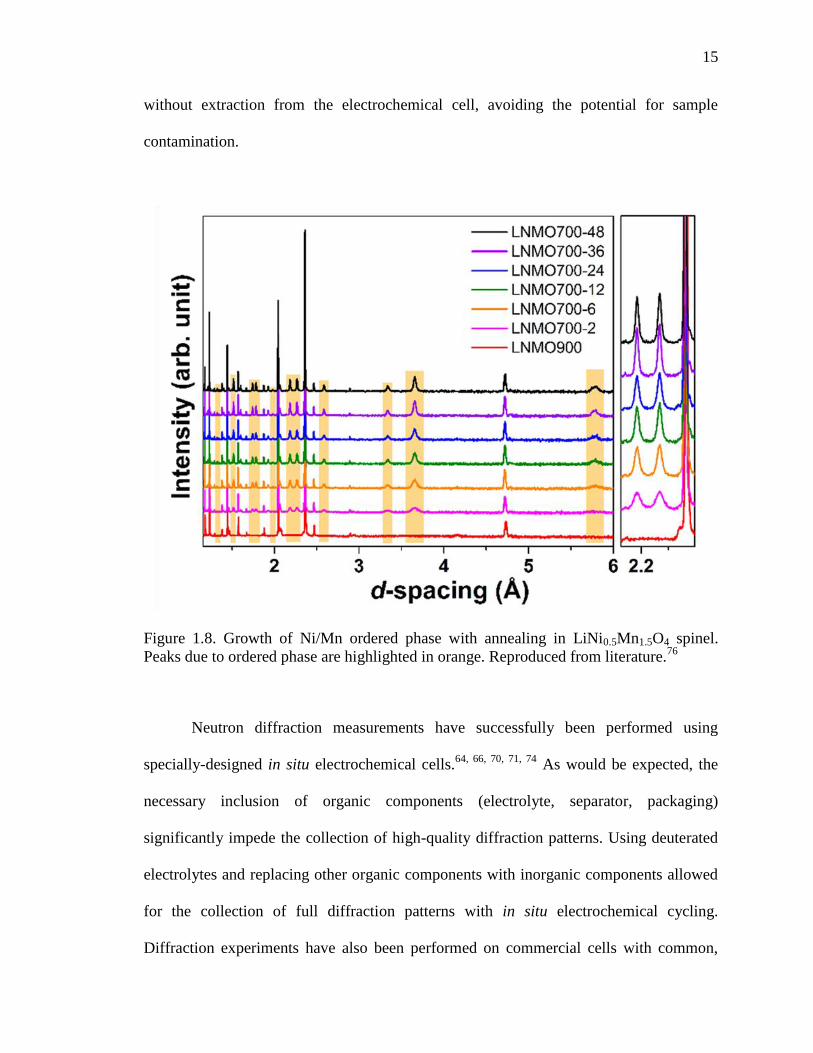
1.3.1 In situ Neutron Diffraction. Powder neutron diffraction is the most
common neutron scattering technique applied to battery materials.64, 70-74
Li sensitivity
and transition metal contrast make neutron diffraction ideal for studying these materials,
especially cathodes. In particular, powder neutron diffraction has been used to observe Li
diffusion pathways in LiFePO475
and Ni/Mn ordering in LiNi0.5Mn1.5O4 cathodes (Figure
1.8),76
measurements that are not possible with traditional X-ray diffraction. Given the
importance of these structural details in the performance of the materials during cycling,
neutron diffraction is an integral tool for understanding and developing state-of-the-art
devices.
Typically, neutron diffraction is performed on battery materials as-synthesized.
Analysis of cycled materials is carried out by collecting material from electrochemical
cells after performing the desired lithiation and delithiation reactions.70, 73, 76, 77
Ideally,
these diffraction experiments would be performed on materials in situ, allowing for the
study of dynamic structural changes and the collection of multiple states of charge
15
without extraction from the electrochemical cell, avoiding the potential for sample
contamination.
Figure 1.8. Growth of Ni/Mn ordered phase with annealing in LiNi0.5Mn1.5O4 spinel.
Peaks due to ordered phase are highlighted in orange. Reproduced from literature.76
Neutron diffraction measurements have successfully been performed using
specially-designed in situ electrochemical cells.64, 66, 70, 71, 74
As would be expected, the
necessary inclusion of organic components (electrolyte, separator, packaging)
significantly impede the collection of high-quality diffraction patterns. Using deuterated
electrolytes and replacing other organic components with inorganic components allowed
for the collection of full diffraction patterns with in situ electrochemical cycling.
Diffraction experiments have also been performed on commercial cells with common,

16
protiated components by limiting Q-space (Q = 2π/d, where d is the spacing for particular
reflection) to obtain sufficient statistics (Figure 1.9).78
The development of methodologies for collecting full high-quality diffraction
patterns of Li-ion battery materials in in situ electrochemical cells is ongoing.
Figure 1.9. In situ neutron diffraction of a commercial LiαNixMnyCo1-(x+y)O2 vs. graphite
cell. Long (1 h) scans of the cell in the charged and discharged state (a) and in-operando
diffraction data of the cell during charging and discharging (b). Reproduced from
literature.78

17
1.3.2 In situ Neutron Reflectometry. While in situ neutron diffraction is used to
study changes in crystalline and molecular structures with electrochemical cycling, in situ
neutron reflectometry probes the composition and thickness of electrode interfaces. The
neutron reflectivity of a sample is given by:
where R is the reflectivity of the surface, Q is the magnitude of the neutron wavevector
(momentum) transfer, β is the scattering length density (SLD) of the material averaged
over the two-dimensional sampling footprint, and z is the direction normal to the surface.
SLD is determined by the atomic density and composition of the material,
where Nd,a is the number density of atom a, ba is the coherent scattering length of atom a,
NA is Avagadro's number, Md is the average atomic molar density of the material, and χa
is the atomic fraction of atom a. SLD is analogous to refractive index, although total
reflection occurs at low angles when passing from low SLD to high SLD, the opposite of
refractive index.62, 65, 79
The SLD profile along z is determined by fitting experimental profiles to
theoretical curves, e.g., using least-squares fits. Uniform layers with sharp interfaces and

18
large differences in SLD result in well-defined interference fringes. In practice though,
each interface has some roughness, and samples with multiple layers that have small
differences in SLD (low contrast) can lead to complicated reflectivity patterns which
cannot be uniquely fit. Therefore, it is useful to carefully design cells with internal
standards and a minimal number of layers with high contrast.68, 79, 80
Isotopic (1H,
2H) substitution in layer-by-layer polymer films is the prototypical
example as monolayer deposition is relatively simple and 1H and
2H have scattering
lengths of -3.74 fm and 6.67 fm, respectively, providing large contrast (Figure 1.10).62, 69,
81
Figure 1.10. Neutron reflectometry of a stack of poly(styrene sulfonate) (PSS) and
poly(allylamine hydrochloride) (PAH) made via spin-assisted layer-by-layer deposition
with regularly placed deuterated layers to provide contrast. Neutron reflectivity profile
with fits (a), SLD profile for best fit (b), and diagram of the layered polymers (c).
Reproduced from literature.81

19
Thin-film Li-ion batteries for neutron reflectometry are composed of four layers
at the investigated electrode: sequentially, a smooth, flat structural support, e.g., single
crystal Si; a current collector; the active intercalation material; and the electrolyte. During
cycling, a fourth layer forms at the electrode-electrolyte interface, known as a solid-
electrolyte-interphase (SEI). This SEI plays an integral role in cell performance and
cycling lifetime. In situ neutron reflectometry is a non-destructive method that can probe
compositional changes in both the electrode and SEI along with swelling and growth
during electrochemical cycling.
Since Si has a small incoherent scattering cross-section and data is collected
below the diffraction condition for Si, using the Si as the incident medium (fronting) in in
situ electrochemical cells is preferred to using the electrolyte, which, even when
deuterated, has a significant incoherent scattering cross-section, leading to a high
background signal. Using the Si as the incident medium also means that data of a
reasonable quality can be collected even with a protiated electrolyte, as the neutron beam
does not pass through the protiated material, unlike in in situ diffraction cells.79
This
allows for greater experimental flexibility, such as isotopically (1H→
2H) doping specific
electrolyte components to study which species incorporate into the SEI.
The design of a neutron reflectometry experiment involves maximizing contrast
between layers while minimizing both background signal, e.g., incoherent scatter from
1H, and fitting parameters, i.e., the number of undefined layers. It is necessary to identify
the most important parameters, as it is often not possible to simultaneously optimize all
parameters. For example, when investigating thin layers, high-Q data is required; since
signal intensity falls off rapidly with increasing Q (R(Q) ∝ Q-4
), it is necessary to

20
prioritize a low background intensity. Preliminary optimization of layer thickness is also
desirable; layer thicknesses outside the 1-100 nm range are more difficult to model, as are
layers of similar thickness (overlapping interference fringes).
An example of an in situ neutron cell used to investigate SEI growth on a Si
anode, used on Beam Line 4B at the Spallation Neutron Source at Oak Ridge National
Lab, is shown in Figure 1.11.68, 79, 80
The Cu current collector is impermeable to Li,
serving as a layer of constant thickness and SLD to aid in fitting and preventing lithiation
of the Si substrate. The Si and Cu thicknesses were chosen to prevent the overlap of
interference fringes. Polycrystalline Ti0.68Zr0.32 was chosen as the current collector for the
counter/reference electrode, as it is machinable, chemically inert, does not alloy with Li,
and is a null scatterer, meaning that it scatters only incoherently and will not result in
aberrant signals in the reflectivity data. The working and counter/reference electrodes are
separated by a relatively large distance (0.1-0.5 mm) to prevent electrical shorting in the
absence of a porous separator.
Figure 1.11. Image and diagram of an in situ electrochemical cell used on Beam Line 4B
(Liquids Reflectometer) at the Spallation Neutron Source at Oak Ridge National
Laboratory. O-ring seal/spacer and electrolyte filling ports not shown in diagram.

21
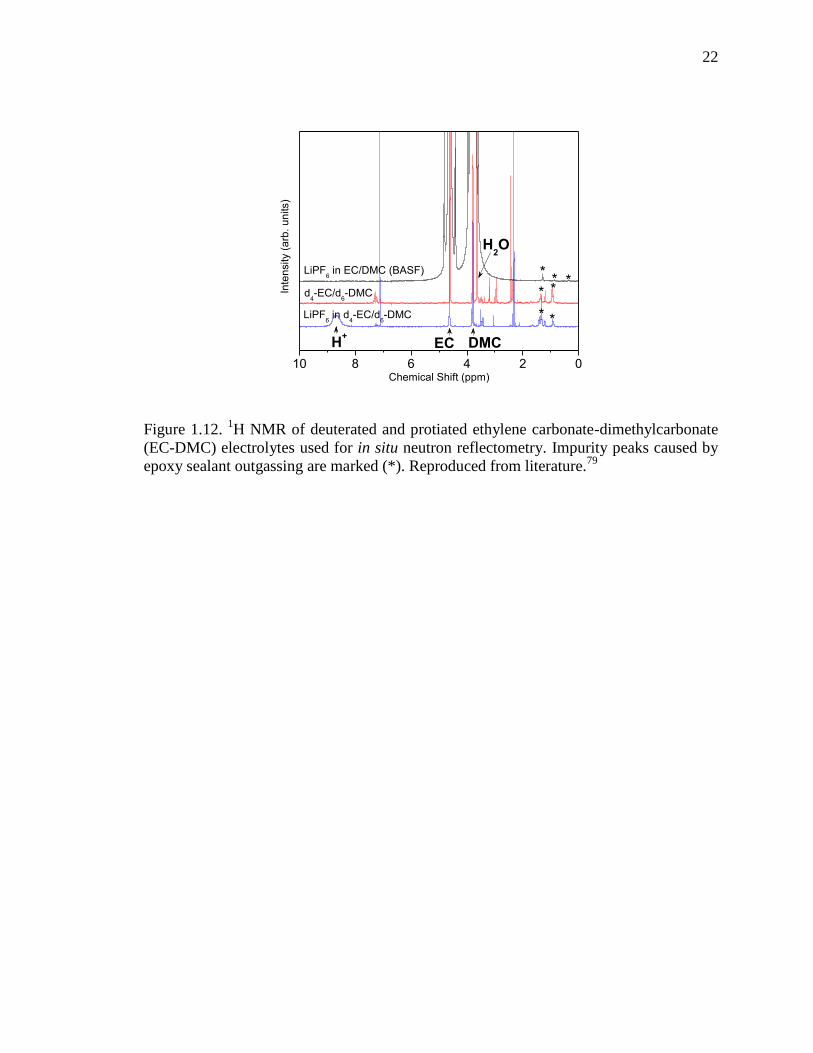
The use of deuterated carbonate electrolytes to enable in situ electrochemistry in
neutron reflectometry cells revealed an additional issue. Commercial (protiated)
electrolytes are available in a wide variety of formulations and are exceedingly pure to
prevent undesirable electrochemical reactions which inhibit extended cycling. Deuterated
electrolytes have to be prepared in the lab from their individual components. The
deuterated components (organic carbonates) are ≥99.5% pure, but 1H NMR shows that
the deuterated carbonates have a number of small impurities, while the protiated
electrolyte has no detectable impurities (Figure 1.12). Due to the large electrolyte volume
in the in situ cell, the electrochemically active impurities represent a significant
proportion of the capacity of the Si electrode.79
These components must be
electrochemically consumed before SEI formation and electrode lithiation can occur. It is
unclear whether or not these impurities affect the SEI. The use of protiated electrolytes
results in "clean" electrochemistry, but significantly decreases the quality of reflectivity
data, due to both a decrease in contrast and increase in background signal. With standard
carbonate-based electrolytes, one must choose between high quality reflectivity data or
high quality electrochemical data.
Like in situ neutron diffraction, in situ neutron reflectometry for Li-ion battery
materials is a developing technique. Ongoing advancements in materials and
methodology will enable the collection of higher quality reflectivity data without
sacrificing clean electrochemistry.
22
10 8 6 4 2 0
LiPF6 in d
4-EC/d
6-DMC
d4-EC/d
6-DMC
DMC
**
In
ten
sity (
arb
. u
nits)
Chemical Shift (ppm)
** *
* *
EC
H2O
H+
LiPF6 in EC/DMC (BASF)
Figure 1.12. 1H NMR of deuterated and protiated ethylene carbonate-dimethylcarbonate
(EC-DMC) electrolytes used for in situ neutron reflectometry. Impurity peaks caused by
epoxy sealant outgassing are marked (*). Reproduced from literature.79

23
BIBLIOGRAPHY
1. Nag, J.; Haglund, R. F. J., Synthesis of vanadium dioxide thin films and
nanoparticles. Journal of Physics: Condensed Matter 2008, 20 (26), 264016.
2. Lysenko, S.; Rua, A. J.; Vikhnin, V.; Jimenez, J.; Fernandez, F.; Liu, H., Light-
induced ultrafast phase transitions in VO2 thin film. Applied Surface Science
2006, 252 (15), 5512-5515.
3. Guzman, G.; Morineau, R.; Livage, J., Synthesis of vanadium dioxide thin films
from vanadium alkoxides. Materials Research Bulletin 1994, 29 (5), 509-515.
4. Livage, J.; Guzman, G.; Beteille, F.; Davidson, P., Optical properties of sol-gel
derived vanadium oxide films. Journal of Sol-Gel Science and Technology 1997,
8 (1-3), 857-865.
5. Manning, T. D.; Parkin, I. P.; Clark, R. J. H.; Sheel, D.; Pemble, M. E.; Vernadou,
D., Intelligent window coatings: atmospheric pressure chemical vapour deposition
of vanadium oxides. Journal of Materials Chemistry 2002, 12 (10), 2936-2939;
Piccirillo, C.; Binions, R.; Parkin, I. P., Synthesis and Functional Properties of
Vanadium Oxides: V2O3, VO2, and V2O5 Deposited on Glass by Aerosol-Assisted
CVD. Chemical Vapor Deposition 2007, 13 (4), 145-151; Field, M. N.; Parkin, I.
P., Atmospheric pressure chemical vapour deposition of vanadium(V) oxide films
on glass substrates from reactions of VOCl3 and VCl4 with water. Journal of
Materials Chemistry 2000, 10 (8), 1863-1866.
6. Pan, M.; Zhong, H.; Wang, S.; Liu, J.; Li, Z.; Chen, X.; Lu, W., Properties of VO2
thin film prepared with precursor VO(acac)2. Journal of Crystal Growth 2004,
265 (1–2), 121-126.
7. Binions, R.; Hyett, G.; Piccirillo, C.; Parkin, I. P., Doped and un-doped vanadium
dioxide thin films prepared by atmospheric pressure chemical vapour deposition
from vanadyl acetylacetonate and tungsten hexachloride: the effects of thickness
and crystallographic orientation on thermochromic properties. Journal of
Materials Chemistry 2007, 17 (44), 4652-4660; Saeli, M.; Piccirillo, C.; Parkin, I.
P.; Ridley, I.; Binions, R., Nano-composite thermochromic thin films and their
application in energy-efficient glazing. Solar Energy Materials and Solar Cells
2010, 94 (2), 141-151.
8. Bai, H.; Cortie, M. B.; Maaroof, A. I.; Dowd, A.; Kealley, C.; Smith, G. B., The
preparation of a plasmonically resonant VO2 thermochromic pigment.
Nanotechnology 2009, 20 (8), 085607.

24
9. Wu, J.; Huang, W.; Shi, Q.; Cai, J.; Zhao, D.; Zhang, Y.; Yan, J., Effect of
annealing temperature on thermochromic properties of vanadium dioxide thin
films deposited by organic sol–gel method. Applied Surface Science 2013, 268
(0), 556-560; Zhang, Z.; Gao, Y.; Chen, Z.; Du, J.; Cao, C.; Kang, L.; Luo, H.,
Thermochromic VO2 Thin Films: Solution-Based Processing, Improved Optical
Properties, and Lowered Phase Transformation Temperature. Langmuir 2010, 26
(13), 10738-10744.
10. Gao, Y.; Luo, H.; Zhang, Z.; Kang, L.; Chen, Z.; Du, J.; Kanehira, M.; Cao, C.,
Nanoceramic VO2 thermochromic smart glass: A review on progress in solution
processing. Nano Energy 2012, 1 (2), 221-246.
11. Kamalisarvestani, M.; Saidur, R.; Mekhilef, S.; Javadi, F. S., Performance,
materials and coating technologies of thermochromic thin films on smart
windows. Renewable and Sustainable Energy Reviews 2013, 26 (0), 353-364.
12. Chaput, F.; Dunn, B.; Fuqua, P.; Salloux, K., Synthesis and characterization of
vanadium oxide aerogels. Journal of Non-Crystalline Solids 1995, 188 (1–2), 11-
18.
13. Morin, F. J., Oxides Which Show a Metal-to-Insulator Transition at the Neel
Temperature. Physical Review Letters 1959, 3 (1), 34-36.
14. Mott, N. F., Metal-Insulator Transition. Reviews of Modern Physics 1968, 40 (4),
677-683; Corr, S. A.; Grossman, M.; Furman, J. D.; Melot, B. C.; Cheetham, A.
K.; Heier, K. R.; Seshadri, R., Controlled Reduction of Vanadium Oxide
Nanoscrolls: Crystal Structure, Morphology, and Electrical Properties. Chemistry
of Materials 2008, 20 (20), 6396-6404.
15. Golan, G.; Axelevitch, A.; Sigalov, B.; Gorenstein, B., Metal–insulator phase
transition in vanadium oxides films. Microelectronics Journal 2003, 34 (4), 255-
258.
16. Hormoz, S.; Ramanathan, S., Limits on vanadium oxide Mott metal–insulator
transition field-effect transistors. Solid-State Electronics 2010, 54 (6), 654-659.
17. Whittaker, L.; Patridge, C. J.; Banerjee, S., Microscopic and Nanoscale
Perspective of the Metal−Insulator Phase Transitions of VO2: Some New Twists
to an Old Tale. The Journal of Physical Chemistry Letters 2011, 2 (7), 745-758.
18. Pergament, A.; Stefanovich, G.; Berezina, O.; Kirienko, D., Electrical
conductivity of tungsten doped vanadium dioxide obtained by the sol–gel
technique. Thin Solid Films 2013, 531 (0), 572-576.
19. Koza, J. A.; He, Z.; Miller, A. S.; Switzer, J. A., Resistance Switching in
Electrodeposited VO2 Thin Films. Chemistry of Materials 2011, 23 (18), 4105-
4108.

25
20. Wu, Y. F.; Fan, L. L.; Chen, S. M.; Chen, S.; Zou, C. W.; Wu, Z. Y.,
Spectroscopic analysis of phase constitution of high quality VO2 thin film
prepared by facile sol-gel method. AIP Advances 2013, 3 (4), -.
21. Pergament, A. L.; Stefanovich, G. B.; Kuldin, N. A.; Velichko, A. A., On the
Problem of Metal-Insulator Transitions in Vanadium Oxides. ISRN Condensed
Matter Physics 2013, 2013, 6.
22. Lampe-Önnerud, C.; Nordblad, P.; Thomas, J. O., Chemical intercalation of
lithium into a V6O13 host. Solid State Ionics 1995, 81 (3–4), 189-199.
23. Lee, S. H.; Qiu, Y.; Broholm, C.; Ueda, Y.; Rush, J. J., Spin Fluctuations in a
Magnetically Frustrated Metal LiV2O4. Physical Review Letters 2001, 86 (24),
5554-5557.
24. Albaric, L.; Hovnanian, N.; Julbe, A.; Volle, G., Oxovanadium(V)-1-methoxy-2-
propanoxide: synthesis and spectroscopic studies — a molecular precursor for a
vanadium–magnesium oxide catalyst. Polyhedron 2001, 20 (18), 2261-2268.
25. Graham, J. L.; Almquist, C. B.; Kumar, S.; Sidhu, S., An investigation of
nanostructured vanadia/titania catalysts for the oxidation of monochlorobenzene.
Catalysis Today 2003, 88 (1–2), 73-82.
26. Van Overmeere, Q.; Kerman, K.; Ramanathan, S., Energy Storage in Ultrathin
Solid Oxide Fuel Cells. Nano Letters 2012, 12 (7), 3756-3760.
27. Brazdil, J. F.; Toft, M. A.; Bartek, J. P.; Teller, R. G.; Cyngier, R. M., Sol−Gel
Method for Preparing Vanadium−Antimony Oxide Catalysts. Chemistry of
Materials 1998, 10 (12), 4100-4103.
28. Pistola, G.; Pasquali, M.; Tocci, M.; Manev, V.; Moshtev, R. V., Lithium/lithium
vanadium oxide secondary batteries: IV. Evaluation of factors affecting the
performance of test cells. Journal of Power Sources 1985, 15 (1), 13-25.
29. Navone, C.; Pereira-Ramos, J. P.; Baddour-Hadjean, R.; Salot, R.,
Electrochemical and structural properties of V2O5 thin films prepared by DC
sputtering. Journal of Power Sources 2005, 146 (1–2), 327-330.
30. Wang, Y.; Takahashi, K.; Lee, K. H.; Cao, G. Z., Nanostructured Vanadium
Oxide Electrodes for Enhanced Lithium-Ion Intercalation. Advanced Functional
Materials 2006, 16 (9), 1133-1144.
31. Augustyn, V.; Dunn, B., Vanadium oxide aerogels: Nanostructured materials for
enhanced energy storage. Comptes Rendus Chimie 2010, 13 (1–2), 130-141.

26
32. Lee, C.-Y.; Marschilok, A. C.; Subramanian, A.; Takeuchi, K. J.; Takeuchi, E. S.,
Synthesis and characterization of sodium vanadium oxide gels: the effects of
water (n) and sodium (x) content on the electrochemistry of NaxV2O5•nH2O.
Physical Chemistry Chemical Physics 2011, 13 (40), 18047-18054.
33. Li, H.; He, P.; Wang, Y.; Hosono, E.; Zhou, H., High-surface vanadium oxides
with large capacities for lithium-ion batteries: from hydrated aerogel to
nanocrystalline VO2(B), V6O13 and V2O5. Journal of Materials Chemistry 2011,
21 (29), 10999-11009.
34. Zhang, L.; Wu, G.; Gao, G.; Yang, H., Electrochemical Performance of V2O5
Nano-Porous Aerogel Film. Key Engineering Materials, 2013; Vol. 537, pp 165-
168.
35. West, K.; Zachau-Christiansen, B.; Jacobsen, T.; Atlung, S., V6O13 As cathode
material for lithium cells. Journal of Power Sources 1985, 14 (1–3), 235-245.
36. Dubarry, M.; Gaubicher, J.; Guyomard, D.; Durupthy, O.; Steunou, N.; Livage, J.;
Dupré, N.; Grey, C. P., Sol Gel Synthesis of Li1+αV3O8. 1. From Precursors to
Xerogel. Chemistry of Materials 2005, 17 (9), 2276-2283; Arico, A. S.; Bruce, P.;
Scrosati, B.; Tarascon, J.-M.; van Schalkwijk, W., Nanostructured materials for
advanced energy conversion and storage devices. Nat Mater 2005, 4 (5), 366-377.
37. Pan, A.; Zhang, J.-G.; Cao, G.; Liang, S.; Wang, C.; Nie, Z.; Arey, B. W.; Xu,
W.; Liu, D.; Xiao, J.; Li, G.; Liu, J., Nanosheet-structured LiV3O8 with high
capacity and excellent stability for high energy lithium batteries. Journal of
Materials Chemistry 2011, 21 (27), 10077-10084.
38. Lee, S.-H.; Cheong, H. M.; Seong, M. J.; Liu, P.; Tracy, C. E.; Mascarenhas, A.;
Pitts, J. R.; Deb, S. K., Raman spectroscopic studies of amorphous vanadium
oxide thin films. Solid State Ionics 2003, 165 (1–4), 111-116.
39. Livage, J., Sol-gel chemistry and electrochemical properties of vanadium oxide
gels. Solid State Ionics 1996, 86–88, Part 2 (0), 935-942.
40. Clavero, C.; Slack, J. L.; Anders, A., Size and composition-controlled fabrication
of thermochromic metal oxide nanocrystals. Journal of Physics D: Applied
Physics 2013, 46 (36), 362001.
41. Leventis, N.; Vassilaras, P.; Fabrizio, E. F.; Dass, A., Polymer nanoencapsulated
rare earth aerogels: chemically complex but stoichiometrically similar core-shell
superstructures with skeletal properties of pure compounds. Journal of Materials
Chemistry 2007, 17 (15), 1502-1508.
42. Livage, J., Vanadium pentoxide gels. Chemistry of Materials 1991, 3 (4), 578-
593.

27
43. Luca, V.; Hook, J. M., Study of the Structure and Mechanism of Formation
through Self-Assembly of Mesostructured Vanadium Oxide. Chemistry of
Materials 1997, 9 (12), 2731-2744; Rouhani, R.; Aghabozorg, H. R.; Asadi
Asadabad, M.; Aghabozorg, H., Synthesis of Mo, W, and Mo- and W-Doped
Multiwall VONTs via Sol-Gel and Hydrothermal Methods. Journal of Chemistry
2013, 2013, 5.
44. Mege, S.; Verelst, M.; Lecante, P.; Perez, E.; Ansart, F.; Savariault, J. M.,
Surfactant effects in vanadium alkoxide derived gels. Journal of Non-Crystalline
Solids 1998, 238 (1–2), 37-44.
45. Alonso, B.; Livage, J., Synthesis of Vanadium Oxide Gels from Peroxovanadic
Acid Solutions: A 51V NMR Study. Journal of Solid State Chemistry 1999, 148
(1), 16-19.
46. Fontenot, C. J.; Wiench, J. W.; Pruski, M.; Schrader, G. L., Vanadia Gel
Synthesis via Peroxovanadate Precursors. 1. In Situ Laser Raman and 51
V NMR
Characterization of the Gelation Process. The Journal of Physical Chemistry B
2000, 104 (49), 11622-11631.
47. Livage, J.; Pelletier, O.; Davidson, P., Vanadium Pentoxide Sol and Gel
Mesophases. Journal of Sol-Gel Science and Technology 2000, 19 (1-3), 275-278.
48. Pelletier, O.; Davidson, P.; Bourgaux, C.; Coulon, C.; Regnault, S.; Livage, J., A
Detailed Study of the Synthesis of Aqueous Vanadium Pentoxide Nematic Gels.
Langmuir 2000, 16 (12), 5295-5303.
49. Fontenot, C. J.; Wiench, J. W.; Pruski, M.; Schrader, G. L., Vanadia Gel
Synthesis via Peroxovanadate Precursors. 2. Characterization of the Gels. The
Journal of Physical Chemistry B 2001, 105 (43), 10496-10504.
50. Carn, F.; Steunou, N.; Livage, J.; Colin, A.; Backov, R., Tailor-Made
Macroporous Vanadium Oxide Foams. Chemistry of Materials 2005, 17 (3), 644-
649.
51. Leventis, N.; Sotiriou-Leventis, C.; Mulik, S.; Dass, A.; Schnobrich, J.; Hobbs,
A.; Fabrizio, E. F.; Luo, H.; Churu, G.; Zhang, Y.; Lu, H., Polymer
nanoencapsulated mesoporous vanadia with unusual ductility at cryogenic
temperatures. Journal of Materials Chemistry 2008, 18 (21), 2475-2482.
52. Luo, H.; Churu, G.; Fabrizio, E. F.; Schnobrich, J.; Hobbs, A.; Dass, A.; Mulik,
S.; Zhang, Y.; Grady, B. P.; Capecelatro, A.; Sotiriou-Leventis, C.; Lu, H.;
Leventis, N., Synthesis and characterization of the physical, chemical and
mechanical properties of isocyanate-crosslinked vanadia aerogels. Journal of Sol-
Gel Science and Technology 2008, 48 (1-2), 113-134.
53. Hench, L. L.; West, J. K., The sol-gel process. Chemical Reviews 1990, 90 (1),
33-72.

28
54. Gash, A. E.; Tillotson, T. M.; Satcher, J. H.; Poco, J. F.; Hrubesh, L. W.;
Simpson, R. L., Use of Epoxides in the Sol−Gel Synthesis of Porous Iron(III)
Oxide Monoliths from Fe(III) Salts. Chemistry of Materials 2001, 13 (3), 999-
1007; Gash, A. E.; Tillotson, T. M.; Satcher Jr, J. H.; Hrubesh, L. W.; Simpson,
R. L., New sol–gel synthetic route to transition and main-group metal oxide
aerogels using inorganic salt precursors. Journal of Non-Crystalline Solids 2001,
285 (1–3), 22-28.
55. Aerogel.org. Metal Oxide Aerogels. http://www.aerogel.org/?p=44 (accessed July
9, 2015).
56. Lapina, O. B.; Khabibulin, D. F.; Shubin, A. A.; Terskikh, V. V., Practical aspects
of 51
V and 93
Nb solid-state NMR spectroscopy and applications to oxide
materials. Progress in Nuclear Magnetic Resonance Spectroscopy 2008, 53 (3),
128-191.
57. Pistoia, G.; Panero, S.; Tocci, M.; Moshtev, R. V.; Manev, V., Solid solutions
Li1+xV3O8 as cathodes for high rate secondary Li batteries. Solid State Ionics
1984, 13 (4), 311-318; Pistoia, G.; Pasquali, M.; Wang, G.; Li, L., Li/Li1+xV3O8
Secondary Batteries. Journal of the Electrochemical Society 1990, 137 (8), 2365-
2370; Koval’chuk, E. P.; Reshetnyak, O. V.; Kovalyshyn, Y. S.; Blażejowski, J.,
Structure and properties of lithium trivanadate—a potential electroactive material
for a positive electrode of secondary storage. Journal of Power Sources 2002, 107
(1), 61-66.
58. Chen, Z.; Lee, D.-J.; Sun, Y.-K.; Amine, K., Advanced cathode materials for
lithium-ion batteries. MRS Bulletin 2011, 36 (07), 498-505.
59. Song, H.-K.; Lee, K. T.; Kim, M. G.; Nazar, L. F.; Cho, J., Recent Progress in
Nanostructured Cathode Materials for Lithium Secondary Batteries. Advanced
Functional Materials 2010, 20 (22), 3818-3834.
60. Scrosati, B.; Garche, J., Lithium batteries: Status, prospects and future. Journal of
Power Sources 2010, 195 (9), 2419-2430.
61. Chernova, N. A.; Roppolo, M.; Dillon, A. C.; Whittingham, M. S., Layered
vanadium and molybdenum oxides: batteries and electrochromics. Journal of
Materials Chemistry 2009, 19 (17), 2526-2552.
62. Russell, T. P., X-ray and neutron reflectivity for the investigation of polymers.
Materials Science Reports 1990, 5 (4), 171-271.
63. Hirayama, M.; Sonoyama, N.; Abe, T.; Minoura, M.; Ito, M.; Mori, D.; Yamada,
A.; Kanno, R.; Terashima, T.; Takano, M.; Tamura, K.; Mizuki, J. i.,
Characterization of electrode/electrolyte interface for lithium batteries using in
situ synchrotron X-ray reflectometry—A new experimental technique for LiCoO2
model electrode. Journal of Power Sources 2007, 168 (2), 493-500.
29
64. Bianchini, M.; Suard, E.; Croguennec, L.; Masquelier, C., Li-Rich Li1+xMn2–
xO4Spinel Electrode Materials: An Operando Neutron Diffraction Study during
Li+Extraction/Insertion. The Journal of Physical Chemistry C 2014, 118 (45),
25947-25955.
65. Heitmann, T.; Montfrooij, W., Practical Neutron Scattering at a Steady State
Source. Mizzou Media - University BookStores: 2012.
66. Owejan, J. E.; Owejan, J. P.; DeCaluwe, S. C.; Dura, J. A., Solid Electrolyte
Interphase in Li-Ion Batteries: Evolving Structures Measured In situ by Neutron
Reflectometry. Chemistry of Materials 2012, 24 (11), 2133-2140.
67. Jerliu, B.; Dorrer, L.; Huger, E.; Borchardt, G.; Steitz, R.; Geckle, U.; Oberst, V.;
Bruns, M.; Schneider, O.; Schmidt, H., Neutron reflectometry studies on the
lithiation of amorphous silicon electrodes in lithium-ion batteries. Physical
Chemistry Chemical Physics 2013, 15 (20), 7777-7784.
68. Browning, J. F.; Baggetto, L.; Jungjohann, K. L.; Wang, Y.; Tenhaeff, W. E.;
Keum, J. K.; Wood, D. L.; Veith, G. M., In Situ Determination of the
Liquid/Solid Interface Thickness and Composition for the Li Ion Cathode
LiMn1.5Ni0.5O4. ACS Applied Materials & Interfaces 2014, 6 (21), 18569-18576.
69. Sears, V. F., Neutron scattering lengths and cross sections. Neutron News 1992, 3
(3), 26-37.
70. Bobrikov, I. A.; Balagurov, A. M.; Hu, C.-W.; Lee, C.-H.; Chen, T.-Y.; Deleg, S.;
Balagurov, D. A., Structural evolution in LiFePO4-based battery materials: In-situ
and ex-situ time-of-flight neutron diffraction study. Journal of Power Sources
2014, 258, 356-364.
71. Dolotko, O.; Senyshyn, A.; Mühlbauer, M. J.; Nikolowski, K.; Ehrenberg, H.,
Understanding structural changes in NMC Li-ion cells by in situ neutron
diffraction. Journal of Power Sources 2014, 255, 197-203.
72. Hansen, T. C.; Kohlmann, H., Chemical Reactions followed by in situ Neutron
Powder Diffraction. Zeitschrift für anorganische und allgemeine Chemie 2014,
640 (15), 3044-3063.
73. Roberts, M.; Biendicho, J. J.; Hull, S.; Beran, P.; Gustafsson, T.; Svensson, G.;
Edström, K., Design of a new lithium ion battery test cell for in-situ neutron
diffraction measurements. Journal of Power Sources 2013, 226, 249-255.
74. Liu, H.; Fell, C. R.; An, K.; Cai, L.; Meng, Y. S., In-situ neutron diffraction study
of the xLi2MnO3·(1 − x)LiMO2 (x = 0, 0.5; M = Ni, Mn, Co) layered oxide
compounds during electrochemical cycling. Journal of Power Sources 2013, 240,
772-778.
30
75. Nishimura, S.-i.; Kobayashi, G.; Ohoyama, K.; Kanno, R.; Yashima, M.; Yamada,
A., Experimental visualization of lithium diffusion in LixFePO4. Nat Mater 2008,
7 (9), 707-711.
76. Kim, J.-H.; Huq, A.; Chi, M.; Pieczonka, N. P. W.; Lee, E.; Bridges, C. A.;
Tessema, M. M.; Manthiram, A.; Persson, K. A.; Powell, B. R., Integrated Nano-
Domains of Disordered and Ordered Spinel Phases in LiNi0.5Mn1.5O4 for Li-Ion
Batteries. Chemistry of Materials 2014, 26 (15), 4377-4386.
77. Mohanty, D.; Huq, A.; Payzant, E. A.; Sefat, A. S.; Li, J.; Abraham, D. P.; Wood,
D. L.; Daniel, C., Neutron Diffraction and Magnetic Susceptibility Studies on a
High-Voltage Li1.2Mn0.55Ni0.15Co0.10O2 Lithium Ion Battery Cathode: Insight into
the Crystal Structure. Chemistry of Materials 2013, 25 (20), 4064-4070; Shin, D.
W.; Bridges, C. A.; Huq, A.; Paranthaman, M. P.; Manthiram, A., Role of Cation
Ordering and Surface Segregation in High-Voltage Spinel LiMn1.5Ni0.5–xMxO4 (M
= Cr, Fe, and Ga) Cathodes for Lithium-Ion Batteries. Chemistry of Materials
2012, 24 (19), 3720-3731.
78. Wang, X.-L.; An, K.; Cai, L.; Feng, Z.; Nagler, S. E.; Daniel, C.; Rhodes, K. J.;
Stoica, A. D.; Skorpenske, H. D.; Liang, C.; Zhang, W.; Kim, J.; Qi, Y.; Harris, S.
J., Visualizing the chemistry and structure dynamics in lithium-ion batteries by in-
situ neutron diffraction. Sci. Rep. 2012, 2.
79. Veith, G. M.; Doucet, M.; Baldwin, J. K.; Sacci, R. L.; Fears, T. M.; Wang, Y.;
Browning, J. F., Direct determination of solid-electrolyte interphase thickness and
composition as a function of state of charge on a silicon anode. Journal of
Physical Chemistry C 2015, 119, 20339-20349.
80. Veith, G. M.; Baggetto, L.; Sacci, R. L.; Unocic, R. R.; Tenhaeff, W. E.;
Browning, J. F., Direct measurement of the chemical reactivity of silicon
electrodes with LiPF6-based battery electrolytes. Chemical Communications
2014, 50 (23), 3081-3084.
81. Kharlampieva, E.; Kozlovskaya, V.; Chan, J.; Ankner, J. F.; Tsukruk, V. V., Spin-
Assisted Layer-by-Layer Assembly: Variation of Stratification as Studied with
Neutron Reflectivity. Langmuir 2009, 25 (24), 14017-14024.

31
PAPER
I. Economical synthesis of vanadia aerogels via epoxide-assisted gelation of VOCl3
Tyler M. Fears*, Chariklia Sotiriou-Leventis, Jeffrey G. Winiarz, Nicholas Leventis
Department of Chemistry, Missouri University of Science and Technology, 400 W. 11th
St., Rolla, MO 65409, USA
*Email address: [email protected]
Abstract: Herein is reported the first synthesis of vanadium oxide (vanadia) aerogels via
epoxide-assisted gelation. Vanadia aerogels fabricated via epoxide-assisted gelation using
VOCl3 and epichlorohydrin mimic those fabricated via the hydrolysis of vanadium
oxytripropoxide while reducing cost per mole by a factor of 10, on par with silica gels
synthesized from alkyl orthosilicates. Typical vanadia aerogels possess a macroporous
nanoworm morphology, a density of 0.103 g/cm3, 96.9 % porosity, a specific surface area
of 102 m2/g, and ~18 % reversible hydration capacity by mass.
1H and
13C NMR reveal
that epoxide ring-opening does not proceed through epoxide protonation, as is the typical
case with other transition metal oxide gels, but rather through Lewis-acid-catalyzed ring-
opening. A multi-step gelation mechanism is proposed involving a fast initial VV oxide
gelation, driven by H+ and Cl
- consumption during epoxide ring-opening, followed by
partial vanadia dissolution, VV → V
IV reduction, and secondary gelation of low-valent
VIV/V
oxide.

32
Graphical Abstract
Keywords: vanadia, vanadium oxide, aerogel, vanadium oxytrichloride, epichlorohydrin,
epoxide-assisted gelation
Highlights:
Developed first epoxide-assisted gelation method for vanadium oxide, using
epichlorohydrin and VOCl3.
Gels synthesized via epoxide-assisted gelation are comparable to those fabricated
via the hydrolysis of vanadium(V) alkoxides.
Observed Lewis-acid-catalyzed epoxide ring-opening under both protic and
aprotic conditions.
Observed secondary gelation step after partial dissolution of VV oxide matrix and
VV→V
IV reduction.

33
1 Introduction
Aqueous vanadium oxide (vanadia) sol–gel chemistry is well studied and serves
as the basis on which all vanadia sol–gel chemistry is modeled. The first step in the
synthesis of aqueous vanadium oxide gels is the formation of a supersaturated solution of
vanadium oxy-hydrates [1]. This step can be accomplished using a variety of methods,
e.g., quenching molten V2O5 in H2O (oxide hydrolysis) [2]; decomposition of soluble
vanadium oxy-peroxide hydrates, e.g., VO(O2)(H2O)3+, VO(O2)2(H2O)
2- (peroxide-
assisted hydrolysis) [3, 4]; or passing a water-soluble vanadate salt such as NaVO3
through a proton-exchange column (cation-exchange) [5–7]. These hydrates evolve into
acidic vanadates with varying degrees of hydration (e.g., VO(OH)3(H2O)2, V10O286-
,
V6O162-
), dependent upon pH, temperature, and VV concentration [1, 8, 9]. The strong
anisotropy of the polymerizable, neutral, monomeric VO(OH)3(H2O)2 leads to the
formation of vanadyl oxo-polymer chains, which then aggregate, leading to fibrous gels
[1]. This morphology is markedly dissimilar from common inorganic gels, which are
typified by random aggregates of spherical particles [10–12]. Variations on these
techniques also exist which utilize templating agents to modify gel morphology [7].
To date, aqueous syntheses have only been shown capable of producing V2O5 gels
(and related VV gels such as Na2xV2O5-x). Lower oxidation states are accessible via non-
aqueous gelation methods. Thus, hydrolysis of organic VIV
and VV species in non-
aqueous solvents is known to produce high-quality vanadia powders, films, and
monoliths, e.g., VO2 films can be made from hydrolysis of vanadyl(IV) acetylacetonate
in methanol [13]. Furthermore, while organic VV species do undergo hydrolysis to form
vanadium(V) oxide gels, partial VV(yellow/ red) → V
IV(blue/brown) reduction is nearly

34
universal in organic solvents, resulting in gels with varying degrees of VIV
content [1,
14].
The most common method for fabricating non-aqueous vanadia gels is the
hydrolysis of vanadyl(V) alkoxides in a water-miscible solvent, e.g., vanadium
oxytripropoxide in acetone [15–18]. Reaction proceeds extremely rapidly, is highly
exothermic, and yields light green gels. Some alkoxide-derived gels also have a
nanoworm morphology intermediate between the random spherical aggregates commonly
seen in metal oxide gels and the monofilament fibers typical of aqueous vanadia gels [5,
13–15, 17–20]. Nevertheless, while the gelation mechanism is well studied for aqueous
V2O5 and V2O5•xH2O gels, the oxo-polymer formation mechanisms in non-aqueous
vanadia gels are less studied, due in part to the increased complexity of the system [1, 8,
9, 21].
Meanwhile, epoxide-assisted gelation has been shown effective for a wide range
of metal oxides [10–12, 22]. In this method, an epoxide (typically propylene oxide: PO,
epichlorohydrin: ECH, or glycidol: GLY) reacts with an acidic hydrated metal salt
(typically a chloride or nitrate), undergoing H+-catalyzed irreversible ring-opening by the
nucleophilic anions, forming the corresponding alcohol (Scheme 1). Epoxide ring-
opening raises the pH of the solution uniformly by scavenging protons from the acidic
metal hydrate. This gradual change favors controlled olation (metal–hydroxy bridge
formation) and oxolation (metal–oxide bridge formation) creating a percolating metal
oxide network, leading to a gel instead of a precipitate [22]. Ex situ NMR measurements
on iron(III) [11] and chrome(III) [12] oxide aerogels made from their chlorides and PO
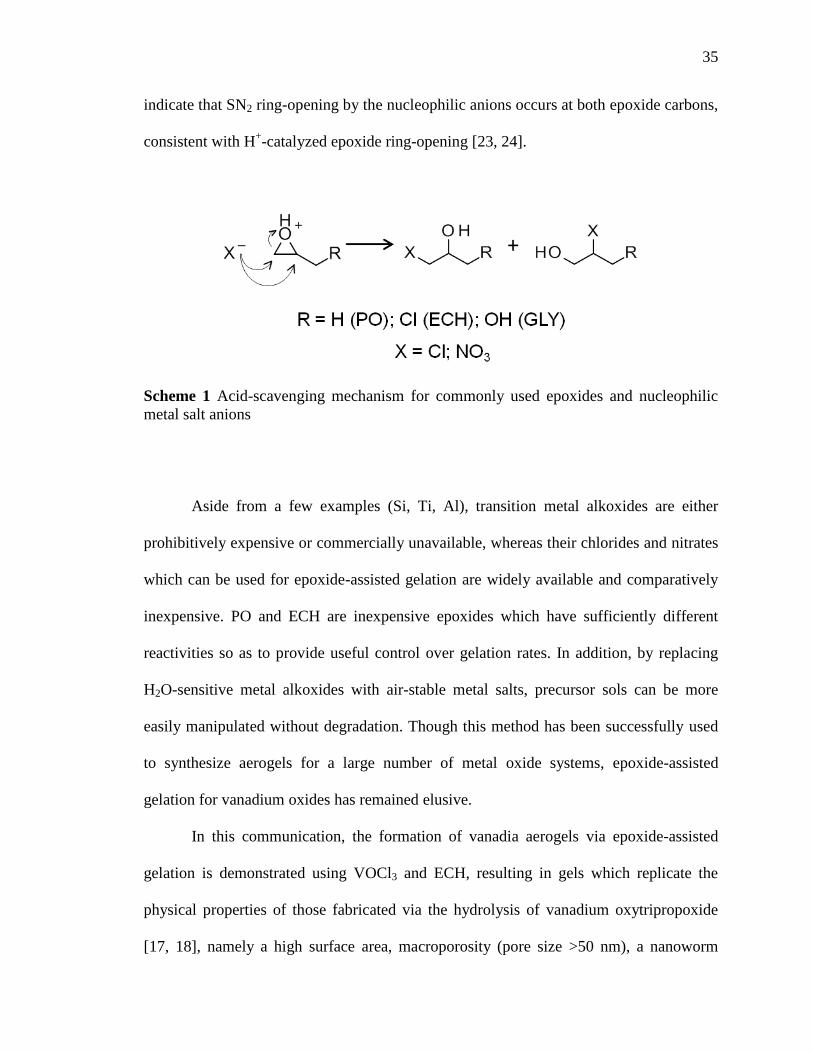
35
indicate that SN2 ring-opening by the nucleophilic anions occurs at both epoxide carbons,
consistent with H+-catalyzed epoxide ring-opening [23, 24].
Scheme 1 Acid-scavenging mechanism for commonly used epoxides and nucleophilic
metal salt anions
Aside from a few examples (Si, Ti, Al), transition metal alkoxides are either
prohibitively expensive or commercially unavailable, whereas their chlorides and nitrates
which can be used for epoxide-assisted gelation are widely available and comparatively
inexpensive. PO and ECH are inexpensive epoxides which have sufficiently different
reactivities so as to provide useful control over gelation rates. In addition, by replacing
H2O-sensitive metal alkoxides with air-stable metal salts, precursor sols can be more
easily manipulated without degradation. Though this method has been successfully used
to synthesize aerogels for a large number of metal oxide systems, epoxide-assisted
gelation for vanadium oxides has remained elusive.
In this communication, the formation of vanadia aerogels via epoxide-assisted
gelation is demonstrated using VOCl3 and ECH, resulting in gels which replicate the
physical properties of those fabricated via the hydrolysis of vanadium oxytripropoxide
[17, 18], namely a high surface area, macroporosity (pore size >50 nm), a nanoworm

36
morphology, and the ability to form extremely strong composite aerogels via isocyanate
crosslinking [17, 18]. Replacing vanadium oxytripropoxide with VOCl3 and ECH for the
synthesis of vanadia aerogels represents a >tenfold reduction in reagent cost per mole
[25]. From a mechanistic point of view, we observe H+-free epoxide ring-opening and a
discrete multi-step gelation, processes not previously reported in the literature for
epoxide-assisted gelation.
2 Results
2.1 Gelation
Vanadia (VOx) and isocyanate-crosslinked vanadia (X-VOx) aerogels and
xerogels were prepared as summarized in Scheme 2 and Table 1.
Gelation is highly exothermic and extremely rapid (<10 s), resulting in bright red,
glassy monoliths. Cooling precursor sols to -78 °C in a dry ice-acetone bath prevented
gelation, but upon removal from the cooling bath, i.e., to pour into molds, sols gelled in
<1 min as they warmed up.
The precursor sol is red up through gelation; however, while investigating
potential precursors formed during gelation, other solution colors were observed. VOCl3
(orange) forms a red solution in EtOH, which becomes yellow upon the addition of ECH,
indicating ECH ring-opening takes place in the absence of H2O (discussed later in Sect.
2.1.3). Optical absorption by VV species in the visible range is attributed to ligand-to-
metal charge-transfer transitions [26–32], which cover from the UV to ~350, ~450, and
~500 nm for the yellow, orange, and red species observed here, respectively (Electronic
Supplementary Material, Fig. S.1). The addition of 3 equivalents of H2O (0.308 mL) to
the VOCl3 (0.540 mL)–EtOH (6.00 mL) solution does not effect solid formation and

37
results in only a slight change in the absorption spectrum, qualitatively attributed to the
exchange of Cl-, EtO
-, and EtOH ligands with HO
- and H2O. The absorption spectrum of
the VOCl3-H2O-EtOH solution is indistinguishable from that of the gel immediately after
gelation, suggesting that similar coordination spheres exist around VV in both cases. The
absorption leading to red VV species is commonly—though neither universally nor
exclusively—seen in 5- and 6-coordinate VV chelates with halide, HO
-, and H2O ligands;
however, the shape of the visible absorption spectrum alone is not sufficient for
unambiguous determination of ligand arrangement or coordination number [21, 30–33].
Table 1 Results of attempts to fabricate gels at different sol concentrations
Nominal Sol
Concentration
(target aerogel
density)
EtOH
[mL]
VOCl3
[eq.]
ECH
[eq.]
H2O
[eq.]
Result
(after 5 days aging)
Standard
(0.10 g/cm3) 6.00
1.00
(0.540 mL)
5.00
(2.25 mL)
9.00
(0.925 mL) translucent, dark green gel
1/2
(0.05 g/cm3)
6.00 0.50 2.50 4.50 very turbid, green gel
6.00 0.50 2.50 9.00 turbid, green gel
6.00 0.50 5.00 4.50 translucent, green gel
6.00 0.50 5.00 9.00 translucent, dark green gel
1/10
(0.01 g/cm3)
6.00 0.10 0.50 0.90 red sol
6.00 0.10 0.50 9.00 green flocc
6.00 0.10 5.00 0.90 orange sol
6.00 0.10 5.00 9.00 dark green sol
(translucent gel in 7 days)
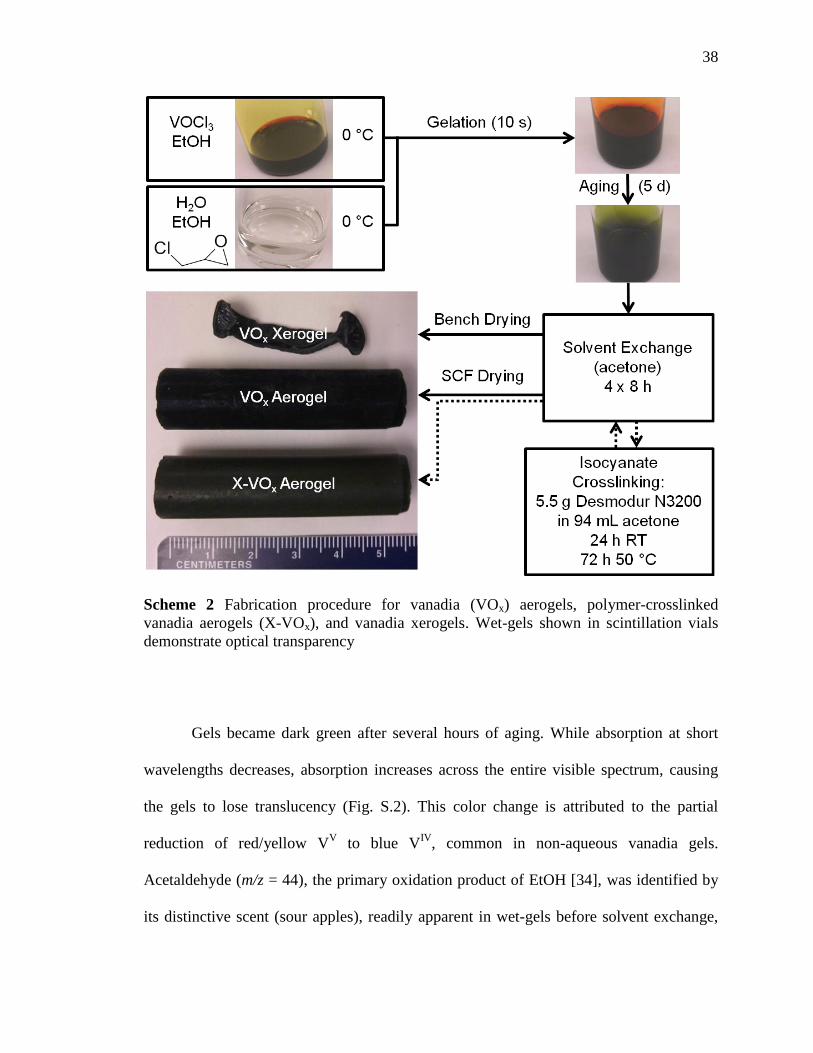
38
Scheme 2 Fabrication procedure for vanadia (VOx) aerogels, polymer-crosslinked
vanadia aerogels (X-VOx), and vanadia xerogels. Wet-gels shown in scintillation vials
demonstrate optical transparency
Gels became dark green after several hours of aging. While absorption at short
wavelengths decreases, absorption increases across the entire visible spectrum, causing
the gels to lose translucency (Fig. S.2). This color change is attributed to the partial
reduction of red/yellow VV to blue V
IV, common in non-aqueous vanadia gels.
Acetaldehyde (m/z = 44), the primary oxidation product of EtOH [34], was identified by
its distinctive scent (sour apples), readily apparent in wet-gels before solvent exchange,

39
but is not easily detected via tandem mass spectrometry methods, due to interference
from CO2 (m/z = 44), which is present in the atmosphere at levels 10,000 times the odor
threshold of acetaldehyde [35]. Gels underwent minimal syneresis. All solvent-exchange
baths were colorless, and no measureable shrinkage was observed during aging or
supercritical drying.
Ultra-low-density gels (target densities: 0.05 and 0.01 g/ cm3) were fabricated by
reducing the VOCl3 concentration in the standard formulation (Table 1). Reducing the
ECH and H2O concentrations to maintain stoichiometric ratios reduced the optical quality
(translucency) of gels and in some cases prevented gelation. Gels could only be made
from sols with nominally constant concentrations of ECH and H2O. Curiously, the lowest
density gels passed through three distinct phases, forming a soft red gel initially (5 min),
followed by a dissolution of the solid matrix and the formation of a deep green sol (~24
h), with the eventual formation of a stable deep green gel (7 days). Unfortunately, ultra-
low-density aerogels could not be fabricated, as these wet-gels collapsed during
supercritical CO2 drying.
2.1.1 H2O and Epoxide Optimization
Precursor sol compositions along with the corresponding gelation rates and gel
quality are summarized in Table 2.
H2O content in the standard gel formulation was optimized to lengthen gelation
time while maintaining optical transparency. Since optical inhomogeneity, e.g., turbidity,
is determined by regions of differing absorption or refractive index and generally visible
to the naked eye only when such regions are on the lm scale, the lack of visible scattering

40
is indicative of the absence of inhomogeneities above ~1 lm. Increasing the H2O/VOCl3
ratio in the precursor sol shortened the gelation time, at the extreme of which (20:1 by
mole) gelation occurred faster than the mixing of the precursor solutions, resulting in
visibly inhomogeneous gels (colored swirls). Lowering the ratio (6:1 by mole) produced
homogeneously turbid gels, implying scattering from lm-scale inhomogeneities.
Table 2 Gel quality and gelation time as a function of H2O content and epoxide
functionality. Optimized gel formulation bolded.
VOCl3
[eq.]
Epoxide
[eq.]
H2O
[eq.] Gelation Time Optical Quality
ECH 1.00 5.00 6.00 10 s Turbid
1.00 5.00 9.00 < 10 s Translucent
1.00 5.00 12.0 < 10 s Translucent
1.00 5.00 20.0 < 3 s Inhomogeneous
PO
1.00 5.00 9.00 << 1 s Inhomogeneous
GLY
1.00 5.00 15.0 15 min Translucent
(Fragile)
DMO
1.00 5.00 12.0 10 min Very Turbid
The addition of 9 equivalents of H2O (0.925 mL) to the VOCl3 (0.180 mL)–EtOH
(6.00 mL) solution without ECH formed an orange precipitate with a red supernatant in
~1 h, both of which became green within several hours. Adding ECH to this VOCl3–
H2O–EtOH solution before precipitation resulted in an inhomogeneous gel in ~10 s. This
result is attributed to the poor miscibility of H2O and ECH, leading to gelation prior to
the realization of a homogeneous sol. Adding ECH to VOCl3 resulted in an indefinitely

41
stable yellow solution. The addition of H2O to this solution resulted in the immediate
formation of inhomogeneous ‘‘gunk.’’ High-quality gels are only realized upon the
simultaneous addition of H2O and ECH to the VOCl3 solution.
It has been reported that modifying epoxide functionality at the α-carbon and
utilizing less-strained oxetanes can alter gelation rates [22, 36]. Several commercially
available alternatives were investigated, as a slower gelation rate would facilitate
fabrication. Replacing ECH with PO significantly decreased the gelation time, leading to
instantaneous gelation and the formation of inhomogeneous solids in the sol. GLY
significantly slowed gelation (15 min), but the resulting gels were extremely fragile and
crumbled even with careful handling during solvent exchange. Gels made using GLY
also exhibited both a green liquid expelled during syneresis and a green supernatant
during solvent exchange, attributed to improved vanadium oxide chelation in polyols
formed from glycidol ring-opening [21]. Dimethyl oxetane (DMO) significantly slowed
gelation and gels remained robust, though they were entirely opaque, indicating μm-scale
inhomogeneities.
2.1.2 Mesophase 13
C and 1H Nuclear Magnetic Resonance (NMR)
While gelation occurs too quickly to monitor spectroscopically, gel aging was
successfully monitored via in situ mesophase NMR to identify organic reaction products
and their formation rates. All major organic species in the gel effluent were identifiable,
as shown in Fig. 1. No redox products were detected via 13
C or 1H NMR due to their low
concentration and the unavoidably large peak width caused by susceptibility broadening
[37]. The spectra confirm that Cl- participated in nucleophilic attack exclusively on the
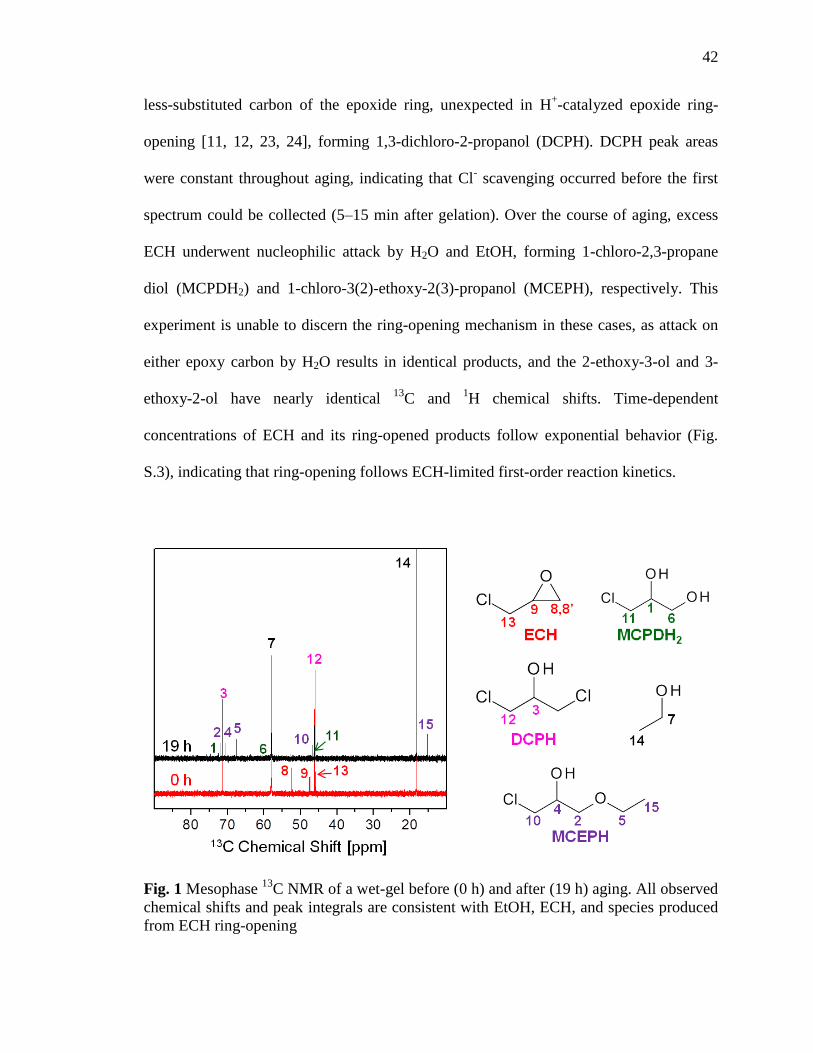
42
less-substituted carbon of the epoxide ring, unexpected in H+-catalyzed epoxide ring-
opening [11, 12, 23, 24], forming 1,3-dichloro-2-propanol (DCPH). DCPH peak areas
were constant throughout aging, indicating that Cl- scavenging occurred before the first
spectrum could be collected (5–15 min after gelation). Over the course of aging, excess
ECH underwent nucleophilic attack by H2O and EtOH, forming 1-chloro-2,3-propane
diol (MCPDH2) and 1-chloro-3(2)-ethoxy-2(3)-propanol (MCEPH), respectively. This
experiment is unable to discern the ring-opening mechanism in these cases, as attack on
either epoxy carbon by H2O results in identical products, and the 2-ethoxy-3-ol and 3-
ethoxy-2-ol have nearly identical 13
C and 1H chemical shifts. Time-dependent
concentrations of ECH and its ring-opened products follow exponential behavior (Fig.
S.3), indicating that ring-opening follows ECH-limited first-order reaction kinetics.
Fig. 1 Mesophase 13
C NMR of a wet-gel before (0 h) and after (19 h) aging. All observed
chemical shifts and peak integrals are consistent with EtOH, ECH, and species produced
from ECH ring-opening

43
VV → V
IV reduction was observed by monitoring the reference peak (EtOH: 18.3
ppm in 13
C) drift as a function of time (Fig. 2), analogous to the Evans method for
measuring solute paramagnetic moments [38]. The large, positive, time-dependent peak
drift is consistent with the reduction of diamagnetic VV to paramagnetic V
IV and the
observed color change (red to green) during gel aging.
Fig. 2 Reference peak (CH3 of EtOH: 18.3 ppm vs. TMS) drift in mesophase 13
C NMR
during gel aging. The final, constant drift is due to the quasi-linear field drift in the
superconducting magnet field
2.1.3 Epoxide Ring-Opening in H2O-Free Sols
1H NMR of gel precursors without H2O (Fig. 3) shows that epoxide ring-opening
does occur even in the absence of an acidic metal hydrate at the least-substituted epoxide
carbon, consistent with Lewis-acid-catalyzed ring-opening [24]. This reaction is evident
in the color changes that occurred when adding ECH to VOCl3 solutions: orange to
yellow in the absence of EtOH (solution b3 and b4 in Fig. 3b) and red to yellow in the

44
presence of EtOH (solution b1 and b2). Solution b1 (Fig. 3b), a standard sol formulation
without H2O, clearly shows the formation of DCPH, but, while the absence of significant
susceptibility broadening improves peak resolution as compared to mesophase NMR,
several peaks lay within a small chemical shift range, ca. 3.5–3.7 ppm, overlapping with
the intense EtOH methylene (peak 7).
Fig. 3 1H NMR of H2O-free sols shows the inductive effect of V
V and exchange
broadening in EtO--V
V chelates (a) and ECH ring-opening in the absence of H2O and H
+
(b). Peaks associated with VV chelates are labeled (3*, 12*, 14*)

45
Weak, rapidly exchanging VV chelates, commonly five-coordinate [8, 9, 21], are
known to occur in monodentate alcohols and mixed H2O-alcohol solvent systems, the
most pertinent of which here are the EtOH and ECH adducts of VOCl3 (Scheme 3a)
which result in Cl-↔EtO
- ligand exchange (Scheme 3b) and epoxide ring-opening
(Scheme 3c). 1H NMR of VOCl3–EtOH chelates undergoing ligand exchange (Scheme
3b) in CCl4, a non-coordinating, 1H-signal-free solvent (Fig. 3a), illustrates the electron-
withdrawing effect of VV on alkoxy ligands [33]. Since alkoxy and halide ligands
undergo rapid exchange in solution [8, 21, 33], the observed chemical shift of the EtOH
peaks is the time-weighted average of the chemical shift of EtO-/EtOH ligands and free
EtOH. The downfield shift of the EtOH methylene (Fig. 3a, peak 7) relative to the EtOH
methyl reference (Fig. 3a, peak 14) is indicative of the inductive effect of the VV center
and increases as each exchangeable EtOH spends more time on average attached to VV.
As expected, this shift is greatest in VOCl3-CCl4 solutions with the lowest EtOH/VOCl3
ratio (Fig. 3a, solution a4), since nearly all of the EtOH is chelated to VV and undergoing
minimal exchange. The fact that the CH3 triplet (Fig. 3a, peak 14) is only resolved in the
solution in which ligands undergo the least amount of exchange (Fig. 3a, solution a4)
indicates that exchange broadening, in contrast to electronic or magnetic effects from the
VV center, is the dominant broadening mechanism in these systems. We can then infer
that species with well-resolved peaks do not exchange significantly between the bulk
solution and VV ligand shell. This conclusion is consistent with the observed peak
resolutions in solutions b1 (Fig. 3b), where due to its high concentration EtOH is
effectively the sole ligand, and b2 (Fig. 3b), where DCPH and EtOH exchange rapidly.
Peak 14* in solutions b1 and b2 (Fig. 3b) corresponds to EtO-/EtOH active in ligand

46
exchange over the timescale of the experiment. The high resolution of the ECH peaks in
all cases suggests that ECH coordinates only weakly to VV, implying that peak 3*
(quintet) and peak 12* (doublet) in solutions b3 and b4 (Fig. 3b) are attributable to DCP-
/DCPH ligands bound to the electron-withdrawing VV and not an ECH adduct.
Additionally, since free Cl- is unlikely to exist in CCl4 (Fig. 3b, solutions b3 and b4),
epoxide ring-opening likely proceeds through an intramolecular rearrangement in the
transitional VOCl3-xDCPx-ECH adduct (Scheme 3c).
Scheme 3 Formation of 5-coordinate VOCl3 adducts of EtOH and ECH (a), Cl-↔EtO
-
ligand exchange (b), and Lewis acid-catalyzed intramolecular epoxide ring-opening in
the absence of free Cl- in CCl4 (c) observed via
1H NMR in H2O-free sols (Fig. 3).
Ligand atoms corresponding to peaks observed in Fig. 3b are labeled (3*, 12*, 14*)
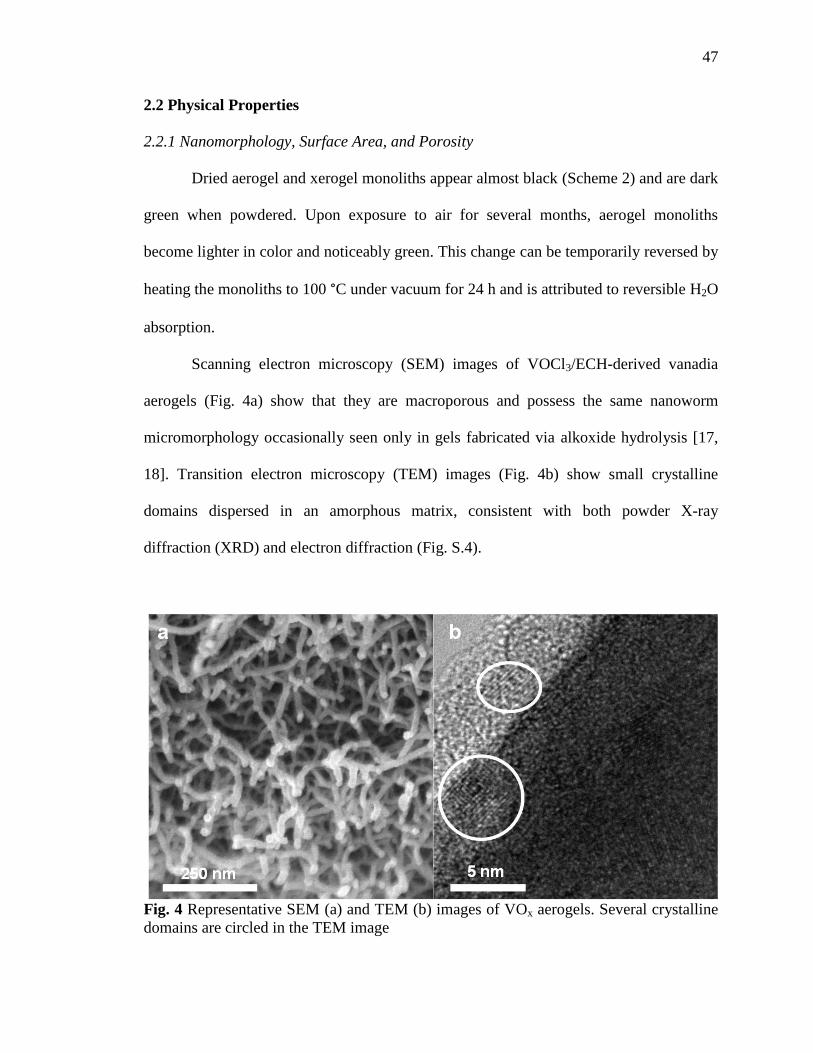
47
2.2 Physical Properties
2.2.1 Nanomorphology, Surface Area, and Porosity
Dried aerogel and xerogel monoliths appear almost black (Scheme 2) and are dark
green when powdered. Upon exposure to air for several months, aerogel monoliths
become lighter in color and noticeably green. This change can be temporarily reversed by
heating the monoliths to 100 °C under vacuum for 24 h and is attributed to reversible H2O
absorption.
Scanning electron microscopy (SEM) images of VOCl3/ECH-derived vanadia
aerogels (Fig. 4a) show that they are macroporous and possess the same nanoworm
micromorphology occasionally seen only in gels fabricated via alkoxide hydrolysis [17,
18]. Transition electron microscopy (TEM) images (Fig. 4b) show small crystalline
domains dispersed in an amorphous matrix, consistent with both powder X-ray
diffraction (XRD) and electron diffraction (Fig. S.4).
Fig. 4 Representative SEM (a) and TEM (b) images of VOx aerogels. Several crystalline
domains are circled in the TEM image

48
While the bulk density (ρb) of aerogels (Table 3) was easily determined from the
sample mass and dimension, the irregular shape of the xerogels made it impossible to
determine ρb for those samples. The Brunauer–Emmett–Teller (BET) method was used to
determine specific surface area (σm). BET analysis of N2-sorption data of aerogels and
xerogels (Fig. 5; Table 3) indicates that pores collapse entirely during bench drying. The
skeletal density (ρs), determined via He pycnometry, of the xerogels is significantly lower
than that of the aerogels, indicating the formation of closed pores during ambient drying.
X-VOx aerogels possess a lower BET surface area than their native counterparts, but
Barrett–Joyner–Halenda (BJH) analysis suggests that X-VOx aerogels possess a greater
macropore volume. This apparent contradiction is explained by carefully considering the
geometric effects of the conformal polymer coating on the VOx matrix. The conformal
coating adds mass, which scales volumetrically, faster than surface area, resulting in a
reduced σm, while filling in void space, decreasing pore size and shrinking macropores to
the point that they exhibit capillary condensation and are observed via BJH analysis.
Considering the volumetric surface area of the aerogels (σv = σmρb), it can be seen that
the total surface area of the monoliths increases with crosslinking, as would be expected
from a conformal coating. Approximating the VOx nanoworms as cylinders (Fig. S.5), the
width of the nanoworms increases by a factor of 3.21 after crosslinking, sufficient for the
observed reduction in macropore size. The density of the polymer coating calculated
using this approximation is 1.11 g/cm3, consistent with the skeletal density of polyurea
aerogels fabricated from N3200A (1.15 g/cm3) [39], implying that the polymer coating is
both conformal and dense.

49
Table 3 Physical properties of VOx and X-VOx gels
ρ
b
[g/cm3] ρ
s
[g/cm3] Porosity
(1-ρb/ρ
s)
σ m
[m2/g]
σ v
[m2/cm3]
VOx Xerogel - 2.67 - 0.31 -
VOx Aerogel 0.103 3.30 0.969 102 10.5
X-VOx Aerogel 0.412 1.32 0.688 82 34
Fig. 5 N2-sorption isotherms for a VOx xerogel (black dots), VOx aerogel (solid blue
line), and X-VOx aerogel (red dashes). Volumetric pore-width (w) distribution (dV/dw) is
determined from BJH analysis inset
2.2.2 Solvent Trapping and H2O Content
Tandem thermogravimetric analysis–mass spectrometry (TGA-MS) reveals a
significant difference between vanadia aerogels and xerogels (Fig. 6). Both gels showed
significant mass losses around 100 °C, coincident with the evolution of H2O (m/z = 18),
but xerogels show an additional mass loss above 200 °C, corresponding to the release of
CO2 (m/z = 44) along with H2O. Combined with the skeletal density measurements
implying closed porosity in the xerogels, it was surmised that these pores are filled with

50
organic residue, likely acetone, which undergoes complete combustion, possibly
catalyzed by vanadia. The possibility that the CO2 represents physisorbed gas or the
decomposition of a carbonate, formed by reaction of CO2 with the amphoteric oxide, was
considered and rejected, as, if that were the case, aerogels (formed by immersion in liquid
CO2) would show a higher relative concentration of CO2, instead of the negligible
amount that is observed. The combustion of residual alkoxide residue commonly seen
due to incomplete hydrolysis in vanadia gels [1, 13] made in organic solvents also cannot
be the source of CO2, as in that case aerogels and xerogels would have similar organic
content and CO2 signals. TGA also shows that H2O content relative to the solid matrix,
indicated by the magnitude of the low-temperature mass loss, is the same for both
aerogels and xerogels. Since aerogels possess several orders of magnitude higher specific
surface area, this H2O cannot be surface-adsorbed and must be bound inside the VOx
skeleton. This H2O appears to be loosely bound and its removal reversible, as evinced by
the color changes observed in aerogel monoliths: dark blue immediately after
supercritical fluid drying, green after extended exposure to air, and dark blue again after
holding under vacuum at 100 °C.

51
Fig. 6 TGA-MS results for vanadia aerogels (a) and xerogels (b). TGA signal is
normalized to the final mass, in order to represent losses as a proportion of the VOx
matrix, which becomes V2O5 in all cases.
3 Discussion
The fact that robust, homogeneous gels can be fabricated over a large range of
densities only using sols with nominally constant concentrations of ECH and H2O, which
must be added simultaneously, suggests that epoxide ring-opening and hydrolysis occur
on similar timescales, unlike what has been previously observed in other metal oxide
systems [10–12, 22, 36, 40]. Of perhaps more interest, while it is proposed that acidic
transition metal hydrates protonate the epoxide ring before nucleophilic ring-opening

52
[10–12], ECH ring-opening is observed in the VOCl3-ECH system in the absence of H2O,
i.e., absent acidic hydrates, and even in a fully aprotic system, in which protonation is
explicitly precluded, implying that epoxide protonation is not necessary for ring-opening.
Instead, we propose that VV-Lewis-acid catalysis is responsible for ring-opening in this
system even in the presence of H+, as evinced by exclusive nucleophilic attack on the
less-substituted epoxide carbon. Based on the fact that FeCl3 also reportedly reacts with
PO before the addition of H2O and the formation of acidic [Fe(OH)6]3+
during the
formation of Fe2O3 gels [11], Lewis-acid-catalyzed ring-opening may occur during the
epoxide-assisted gelation of other metal oxide gels.
We propose a new gelation sequence (Scheme 4) following four basic steps: (Step
1) Cl-↔EtO
- ligand exchange netting a 5-coordinate vanadyl ethoxide and HCl (Scheme
4a); (Step 2) Lewis-acid-catalyzed ECH ring-opening, consuming H+ and Cl
- produced
during Cl-↔EtO
- exchange (Scheme 4b); (Step 3) additional ligand exchange forming a
mixture of 4-, 5-, and 6-coordinate vanadyl(V) species (e.g., VOX3Yα, where X- is an
anionic ligand; Y is a neutral ligand; and α is 0 for 4-coordinate species, 1 for 5-
coordinate species, and 2 for 6-coordinate species) (Scheme 4c); and (Step 4) vanadium
oxo-polymer formation in the absence of HCl (Scheme 4d). Ligand exchange and VV-
adduct formation (Step 1) are well known in H2O and alcoholic solvents and are directly
observed for VV-OEt (Fig. 3b, peak 14*) and V
V-DCP (Fig. 3b, peaks 3* and 12*)
species through inductive deshielding in 1H NMR. Lewis-acid-catalyzed ring-opening
(Step 2) is observed in CCl4, where epoxide protonation is explicitly excluded and can be
inferred in EtOH from exclusive nucleophilic attack by Cl- at the less-substituted epoxide
carbon [24]. VOCl3–H2O–EtOH (1:9:18) is stable in the absence of ECH for tens of
53
minutes and only results in partial precipitation, so gelation (Step 4) which occurs in ~10
s must be driven by the reaction in Step 2. Given that vanadium oxide solubility in H2O is
pH-dependent [1] and vanadyl alkoxides are typically unstable in the presence of water
[15–19], we can infer that gelation is driven by the net consumption of HCl as a result of
Lewis-acid-catalyzed ECH ring-opening. This mechanism is similar to the hydrolysis of
vanadyl alkoxides [15–19], where here the vanadyl alkoxide is generated in situ from
VOCl3 and ECH.
Scheme 4 only accounts for the formation of the initial red V2O5•xH2O gel [1] and
comes with several caveats. EtOH, DCPH, and H2O (and their anionic counterparts) are
all competing ligands at relatively high concentrations (6:1:3 by mol, respectively), so
VOX3:Yα species in solution likely contain a mixture of all three, in addition to the
possibility of cationic and anionic VV species. Dimers and oligomers of V
V species with
small ligands are also well known [21, 8], adding mixed-ligand oligomers to the list of
species in solution. ECH ring-opening (Step 2) and vanadium oxide polymerization (Step
4) also occur on similar timescales, meaning that the stepwise mechanism proposed
above is overly simplistic. The high gelation rate (instability of intermediates)
complicates any analyses necessary for such subtle determinations as explicit
identification of the VV species directly responsible for gelation or the precise ring-
opening intermediate, which are beyond the scope of this study.
In addition to the primary gelation scheme discussed above, the intermediate fluid
phase of the lowest density gel suggests multiple discreet processes take place at
disparate timescales in all vanadia gels. After the (fast) formation of a red V2O5•xH2O
gel, partial or complete dissolution of the VV oxide matrix occurs in concert with or

54
followed by VV → V
IV reduction by EtOH. Gelation (and/or precipitation) of a blue-
green VIV/V
oxide, possibly driven by changes in solvent properties brought on during CH
hydrolysis and ethanolysis, results in the final observed wet-gels which were further
processed into VOx and X-VOx aerogels and xerogels.
Scheme 4 Proposed reaction mechanism for gelation in the VOCl3-ECH-EtOH system
involving ligand exchange in EtOH (a); Lewis-acid-catalyzed ECH ring-opening (b);
neutral 4-, 5-, and 6-coordinate species potentially formed during additional ligand
exchange (c); and a possible mechanism for the polymerization of vanadium oxide via
olation of a 5-coordinate vanadyl hydroxide (d)
55
While there is little doubt that VV → V
IV reduction occurs, evinced by: (a) the gel
color change, (b) the formation of acetaldehyde, and (c) the magnetic susceptibility
evolution, the exact degree of reduction has proven difficult to quantify; sol–gel vanadia
is not stable under conditions necessary for measurement, e.g., aqueous redox titration
[8], XPS, or laser Raman spectroscopy. Nevertheless, the significantly darker color of the
dried gels and their dispersed solids (e.g., in preparation for TEM) as compared to
previously synthesized gels made from vanadium oxytripropoxide suggests that
significantly more reduction occurs in those made from VOCl3 and ECH in EtOH, likely
reflective of efficient VV-EtOH redox chemistry [34].
VOx gels formed through epoxide-assisted gelation exhibit several other
differences from their alkoxide counterparts. Wet vanadia gels synthesized via epoxide-
assisted gelation are sturdier (easier to handle during solvent exchange) and exhibit less
optical scattering than their alkoxide counterparts. While the X-VOx aerogels synthesized
here possess mechanical properties similar to previously synthesized X-VOx aerogels
(Fig. S.6), mechanical failure occurred at a lower strain in those synthesized via epoxide-
assisted gelation. This premature failure is attributed to internal voids, which are not
present in aerogels synthesized via the hydrolysis of vanadium oxytripropoxide [17, 18].
It is suspected that these voids are formed by solvent vaporization during exothermic
reactions.
4 Conclusion
Vanadia aerogels fabricated via epoxide-assisted gelation utilizing VOCl3 and
ECH resemble those fabricated via alkoxide hydrolysis at approximately one-tenth of the
cost. The gels synthesized via epoxide-assisted gelation in fact appear superior to their

56
alkoxide counterparts in both optical quality and robustness (as wet-gels), though they are
prone to the formation of internal voids and likely possess a different average oxidation
state [17, 18]. Results also indicate that ECH ring-opening occurs through Lewis-acid
catalysis, unlike what is seen in other transition metal oxide gels.
5 Experimental Section
All reagents were used as received without further purification.
5.1 Aerogel and Xerogel Synthesis
A typical gel was fabricated as follows: 0.540 mL (5.71 mmol) of VOCl3 (99 %,
Strem Chemicals) was dissolved in 3.00 mL (51.4 mmol) of absolute ethanol (EtOH)
(LyondellBasell) and cooled to 0 °C in an ice bath. In a separate container, 2.25 mL (28.6
mmol) of ECH (99 %, Acros Organics) and 0.925 mL (51.4 mmol) of deionized H2O
were dissolved in the same amount of EtOH (3.00 mL) and cooled to 0 °C in an ice bath.
The two solutions were mixed and swirled vigorously before immediately pouring into
syringe molds. Within 10 s, solid red gels were formed, which were aged for 5 days at
ambient temperature before further processing. PO (C99 %, Sigma-Aldrich), GLY (96 %,
Acros), and DMO (98 %, Sigma-Aldrich) were substituted for ECH in some cases to
investigate their effects on gelation rate.
Solvent exchange and isocyanate crosslinking procedures were followed
according to those previously reported in the literature [17, 18]. Gels were placed in
acetone (Technical Grade, Univar) for 8 h to exchange residual solvent. Solvent exchange
was repeated 3 times. Xerogels were formed by drying acetone-exchanged wet-gels under
57
ambient conditions for several days followed by placing samples under vacuum for 6 h at
50 °C to remove residual acetone. Aerogels were prepared by placing acetone-exchanged
wet-gels in an autoclave, exchanging residual solvent with liquid CO2, taking the
autoclave above the supercritical point of CO2, and finally venting the CO2 isothermally
at 40 °C. Mechanically strong X-VOx aerogels (Fig. S.6) were formed using a solution of
5.5 g Desmodur N3200A (courtesy of Bayer Corp.) in 94 mL of dry acetone
(CHROMASOLV for HPLC, Sigma-Aldrich), followed by solvent exchange in acetone
baths and supercritical CO2 drying.
5.2 Materials Characterization
Absorption spectra of wet-gels and precursor sols were on an Ocean Optics Chem
2000 UV–Vis spectrometer with a deuterium lamp source. Short-path-length cuvettes (to
limit absorption) were fabricated using two glass microscope slides (Corning) affixed
with epoxy, using a plastic sheet (20–30 μm) as a temporary spacer during epoxy curing.
Cuvettes were sealed with Parafilm after filling with sols to prevent solvent evaporation
and hydrolysis.
Mesophase 1H (400 MHz) and
13C (100 MHz) NMR was performed on wet-gels
using a Varian Unity Inova spectrometer without 2H locking, due to the absence of a
deuterated solvent. An inverse-gated 1H decoupling sequence was used for
13C NMR in
order to obtain quantitative peak integrals. The terminal CH3 on EtOH [18.3 ppm (13
C)
and 1.21 ppm (1H) vs. tetramethylsilane (TMS)] was used as an internal reference. Peak
assignments were determined using experimental data from the Spectral Database for
Organic Compounds [41].
58
H2O-free CCl4 and EtOH solutions of VOCl3 with various amounts of ECH for 1H
NMR were made by dissolving 0.090 mL (0.95 mmol) of VOCl3 in 1.00 mL of the
appropriate solvent (CCl4 or EtOH) to which ECH (0, 2.95, 4.75 mol) and/or EtOH (0,
0.95, 2.85 mol) was added. The terminal CH3 on EtOH (1.21 ppm vs. TMS) and the
highfield proton on ECH (2.70 vs. TMS) were used as internal references.
Nanomorphology was analyzed using cross sections mounted in a Hitachi S-4700
SEM. Monoliths were ground to a fine powder using a mortar and pestle before
performing XRD with a PANalytical X’Pert Pro Multi-Purpose Diffractometer, using a
Cu Kα (λ = 1.54 Å) radiation source. Ground powders were dispersed in acetone and
deposited onto a silky-carbon-coated Cu grid for TEM and electron diffraction on a
Technai F20 STEM.
The bulk density (ρb) of aerogels was determined from sample mass and
dimensions. The skeletal density (ρs) was determined via He pycnometry using a
Micromeritics AccuPyc II 1340. N2-sorption porosimetry was carried out on a
Micromeritics ASAP 2020 surface area and porosity analyzer using monoliths broken
into small chunks. Specific surface area was determined using the BET method, and the
pore size distribution was determined using the BJH method. Prior to pycnometry and
porosimetry measurements, samples were dried for 12 h at 80 °C under vacuum.
Quasi-static compression tests were conducted on an MTS-810 servo-hydraulic
testing machine, following the testing procedures and specimen length-to-diameter ratio
in ASTM D1621-04a (Standard Test Method for Compressive Properties of Rigid
Cellular Plastics). The specimens had a diameter of 13.75 mm and a length/diameter ratio
of one.

59
TGA-MS was carried out on a Netzsch STA 409 C thermogravimetric analyzer
connected via a fused silica capillary to a QMS 403 C mass spectrometer under air at a
heating rate of 5 °C/min. Ion currents were monitored for 15 < m/z < 300. Signals were
normalized by carrier gas ion current (N2, m/z = 28) and sample mass for comparison
between runs. Only signals for m/z = 18 and m/ z = 44 were detectable above background
(Fig. S.7).
Acknowledgements T. M. F. would like to thank Dr. Shruti Mahadik-Khanolkar for her
expertise in synthesizing vanadia aerogels, Dr. H. Lu (of The University of Texas-Dallas)
for quasi-static compression measurements, and Dr. Chakkaravarthy Chidambareswara-
pattar for N2 porosimetry measurements. The authors would also like to thank Bayer
Corporation, USA, for their generous supply of Desmodur N3200A isocyanate.
Funding This project was funded by the Army Research Office (W911NF-14-1-0369).
The Materials Research Center of Missouri S&T provided partial support with materials
characterization. Student support was provided in part by the National Science
Foundation through a University of Missouri Neutron Scattering IGERT Traineeship
(Grant DGE-1069091).
Conflict Of Interest The authors declare that they have no conflict of interest.

60
References
1. Livage J (1991) Vanadium pentoxide gels. Chemistry of Materials 3:578-593.
2. Pergament A, Stefanovich G, Berezina O, Kirienko D (2013) Electrical
conductivity of tungsten doped vanadium dioxide obtained by the sol–gel
technique. Thin Solid Films 531:572-576.
3. Fontenot CJ, Wiench JW, Pruski M, Schrader GL (2000) Vanadia Gel Synthesis
via Peroxovanadate Precursors. 1. In Situ Laser Raman and 51
V NMR
Characterization of the Gelation Process. The Journal of Physical Chemistry B
104:11622-11631.
4. Fontenot CJ, Wiench JW, Pruski M, Schrader GL (2001) Vanadia Gel Synthesis
via Peroxovanadate Precursors. 2. Characterization of the Gels. The Journal of
Physical Chemistry B 105:10496-10504.
5. Livage J, Guzman G, Beteille F, Davidson P (1997) Optical properties of sol-gel
derived vanadium oxide films. Journal of Sol-Gel Science and Technology 8:857-
865.
6. Lee C-Y, Marschilok AC, Subramanian A, Takeuchi KJ, Takeuchi ES (2011)
Synthesis and characterization of sodium vanadium oxide gels: the effects of
water (n) and sodium (x) content on the electrochemistry of NaxV2O5∙nH2O.
Physical Chemistry Chemical Physics 13:18047-18054.
7. Carn F, Steunou N, Livage J, Colin A, Backov R (2005) Tailor-Made
Macroporous Vanadium Oxide Foams. Chemistry of Materials 17:644-649.
8. Crans DC, Tracey AS (1998) The Chemistry of Vanadium in Aqueous and
Nonaqueous Solution. Vanadium Compounds, vol 711. ACS Symposium Series,
vol 711. American Chemical Society, pp 2-29.
9. Crans DC (2005) Fifteen years of dancing with vanadium. Pure and Applied
Chemistry 77:1497-1527.
10. Leventis N, Vassilaras P, Fabrizio EF, Dass A (2007) Polymer nanoencapsulated
rare earth aerogels: chemically complex but stoichiometrically similar core-shell
superstructures with skeletal properties of pure compounds. Journal of Materials
Chemistry 17:1502-1508.
11. Gash AE, Tillotson TM, Satcher JH, Poco JF, Hrubesh LW, Simpson RL (2001)
Use of Epoxides in the Sol−Gel Synthesis of Porous Iron(III) Oxide Monoliths
from Fe(III) Salts. Chemistry of Materials 13:999-1007.
12. Gash AE, Tillotson TM, Satcher Jr JH, Hrubesh LW, Simpson RL (2001) New
sol–gel synthetic route to transition and main-group metal oxide aerogels using
inorganic salt precursors. Journal of Non-Crystalline Solids 285:22-28.

61
13. Guzman G, Morineau R, Livage J (1994) Synthesis of vanadium dioxide thin
films from vanadium alkoxides. Materials Research Bulletin 29:509-515.
14. Livage J (1996) Sol-gel chemistry and electrochemical properties of vanadium
oxide gels. Solid State Ionics 86–88, Part 2:935-942.
15. Augustyn V, Dunn B (2010) Vanadium oxide aerogels: Nanostructured materials
for enhanced energy storage. Comptes Rendus Chimie 13:130-141.
16. Chaput F, Dunn B, Fuqua P, Salloux K (1995) Synthesis and characterization of
vanadium oxide aerogels. Journal of Non-Crystalline Solids 188:11-18.
17. Leventis N, Sotiriou-Leventis C, Mulik S, Dass A, Schnobrich J, Hobbs A,
Fabrizio EF, Luo H, Churu G, Zhang Y, Lu H (2008) Polymer nanoencapsulated
mesoporous vanadia with unusual ductility at cryogenic temperatures. Journal of
Materials Chemistry 18:2475-2482.
18. Luo H, Churu G, Fabrizio EF, Schnobrich J, Hobbs A, Dass A, Mulik S, Zhang
Y, Grady BP, Capecelatro A, Sotiriou-Leventis C, Lu H, Leventis N (2008)
Synthesis and characterization of the physical, chemical and mechanical
properties of isocyanate-crosslinked vanadia aerogels. Journal of Sol-Gel Science
and Technology 48:113-134.
19. Li H, He P, Wang Y, Hosono E, Zhou H (2011) High-surface vanadium oxides
with large capacities for lithium-ion batteries: from hydrated aerogel to
nanocrystalline VO2(B), V6O13 and V2O5. Journal of Materials Chemistry
21:10999-11009.
20. Nag J, Haglund RFJ (2008) Synthesis of vanadium dioxide thin films and
nanoparticles. Journal of Physics: Condensed Matter 20:264016
21. Crans DC, Felty RA, Chen H, Eckert H, Das N (1994) Oxovanadium(V)
Alkoxide Derivatives of 1,2-Diols: Synthesis and Solid-State 51
V NMR
Characterization. Inorganic Chemistry 33:2427-2438.
22. Baumann T, Gash A, Satcher J, Jr. (2011) A Robust Approach to Inorganic
Aerogels: The Use of Epoxides in Sol–Gel Synthesis. In: Aegerter MA, Leventis
N, Koebel MM (eds) Aerogels Handbook. Advances in Sol-Gel Derived Materials
and Technologies. Springer New York, pp 155-170.
23. Parker RE, Isaacs NS (1959) Mechanisms Of Epoxide Reactions. Chemical
Reviews 59:737-799.
24. Carey FA, Sundberg RJ (2007) Advanced Organic Chemistry: Part B: Reaction
and Synthesis. Advanced Organic Chemistry / Part B: Reactions and Synthesis.
Springer.

62
25. Sigma-Aldrich. https://www.sigmaaldrich.com/united-states.html. Accessed
March 10, 2015
26. Anderson WP, Edwards WD, Zerner MC (1986) Calculated spectra of hydrated
ions of the first transition-metal series. Inorganic Chemistry 25:2728-2732.
27. So H, Pope MT (1972) Origin of some charge-transfer spectra. Oxo compounds
of vanadium, molybdenum, tungsten, and niobium including heteropoly anions
and heteropoly blues. Inorganic Chemistry 11:1441-1443.
28. Cornman CR, Colpas GJ, Hoeschele JD, Kampf J, Pecoraro VL (1992)
Implications for the spectroscopic assignment of vanadium biomolecules:
structural and spectroscopic characterization of monooxovanadium(V) complexes
containing catecholate and hydroximate based noninnocent ligands. Journal of the
American Chemical Society 114:9925-9933.
29. Rehder D, Weidemann C, Duch A, Priebsch W (1988) Vanadium-51 shielding in
vanadium(V) complexes: a reference scale for vanadium binding sites in
biomolecules. Inorganic Chemistry 27:584-587.
30. Crans DC, Felty RA, Anderson OP, Miller MM (1993) Structure and solution
properties of a dimeric tetrahedral vanadium(V) chloride alkoxide complex.
Inorganic Chemistry 32:247-248.
31. Carrano CJ, Mohan M, Holmes SM, de la Rosa R, Butler A, Charnock JM,
Garner CD (1994) Oxovanadium(V) Alkoxo-Chloro Complexes of the
Hydridotripyrazolylborates as Models for the Binding Site in Bromoperoxidase.
Inorganic Chemistry 33:646-655.
32. Abernethy CD, Codd GM, Spicer MD, Taylor MK (2003) A Highly Stable N-
Heterocyclic Carbene Complex of Trichloro-oxo-vanadium(V) Displaying Novel
Cl−Ccarbene Bonding Interactions. Journal of the American Chemical Society
125:1128-1129.
33. Crans DC, Chen H, Felty RA (1992) Synthesis and reactivity of oxovanadium(V)
trialkoxides of bulky and chiral alcohols. Journal of the American Chemical
Society 114:4543-4550.
34. Bobtelsky M, Glasner A (1942) The Rate of Reduction of Vanadium Pentoxide in
Concentrated Acid Solutions. Reduction of Vanadium Pentoxide by Arsenious
Acid, Oxalic Acid, Formaldehyde and Ethyl Alcohol. Journal of the American
Chemical Society 64:1462-1469.
35. Fritsch HT, Schieberle P (2005) Identification Based on Quantitative
Measurements and Aroma Recombination of the Character Impact Odorants in a
Bavarian Pilsner-type Beer. Journal of Agricultural and Food Chemistry 53:7544-
7551.

63
36. Gash AE, Satcher JH, Simpson RL (2003) Strong akaganeite aerogel monoliths
using epoxides: Synthesis and characterization. Chemistry of materials 15:3268-
3275.
37. Pemberton C, Hoffman R, Aserin A, Garti N (2011) New insights into silica-
based NMR “chromatography”. Journal of Magnetic Resonance 208:262-269.
38. Evans DF (1959) 400. The determination of the paramagnetic susceptibility of
substances in solution by nuclear magnetic resonance. Journal of the Chemical
Society (Resumed):2003-2005.
39. Leventis N, Sotiriou-Leventis C, Chandrasekaran N, Mulik S, Larimore ZJ, Lu H,
Churu G, Mang JT (2010) Multifunctional Polyurea Aerogels from Isocyanates
and Water. A Structure−Property Case Study. Chemistry of Materials 22:6692-
6710.
40. Baumann TF, Gash AE, Chinn SC, Sawvel AM, Maxwell RS, Satcher JH (2005)
Synthesis of High-Surface-Area Alumina Aerogels without the Use of Alkoxide
Precursors. Chemistry of Materials 17:395-401.
41. Debbie CC, Alan ST (1998) The Chemistry of Vanadium in Aqueous and
Nonaqueous Solution. Vanadium Compounds, vol 711. ACS Symposium Series,
vol 711. American Chemical Society, pp 2-29.
42. SDBSWeb. National Institute of Advanced Industrial Science and Technology.
http://sdbs.riodb.aist.go.jp. Accessed 06/15/15

64
Electronic Supplementary Material
Contents: Page
Figure S.1 UV-Vis absorption spectra of VOCl3 solutions 65
Figure S.2 UV-Vis absorption spectra collected during gel aging 66
Figure S.3 Concentration study from time-resolved 13
C NMR collected
during gel aging 67
Figure S.4 XRD and electron diffraction patterns of aerogel powders 68
Figure S.5 Concentric cylinder model used to calculate crosslinking
polymer density 69
Figure S.6 Quasi-static compression of X-VOx aerogels 70
Figure S.7 Full mass spectrometry data from tandem TGA-MS 71
References 72

65
Spectrum EtOH
[mL]
VOCl3
[mmol]
H2O
[mmol]
ECH
[mmol]
Apparent
Color
Neat VOCl3 - Neat - - Orange
VOCl3 in EtOH 6.0 5.70 - - Red
VOCl3 + 3 H2O in EtOH 6.0 5.70 17.1 - Red
VOCl3 + 5 ECH in EtOH 6.0 5.70 - 28.5 Yellow
Gel at t = 0 6.0 5.70 51.3 28.5 Red
Figure S.1 UV-Vis absorption spectra comparing several VOCl3 solutions and a wet gel,
assuming a 25 μm path length. The major absorption in the visible spectrum is due to a
metal-to-ligand charge-transfer transition.

66
Figure S.2 UV-Vis absorption spectra of standard epoxide gel during aging, assuming a
25 μm path length. No significant changes to absorption were detected after ~16 h. Strong
absorption in the near UV gives rise to the initial red gel color. The onset of intense
absorption across the entire visible spectrum causes gels to lose transparency.

67
k [h-1
]
(Independently
Fit)
k [h-1
]
(Constrained Fit)
Initial Relative
Concentration (A
+A0)
Final Relative
Concentration
(A0)
ECH 0.400
0.406
0.977 0.022
MCPDH2 0.364 0.003 0.329
MCEPH 0.433 0.021 0.649
Sum 2.83×10⁻³⁰
1.001 1.000
Figure S.3 Concentration (C) of ECH (red), MCPDH2 (orange), MCEPH (blue) and their
Sum (black) as a function of time (t) as monitored by 13
C NMR. Individual peak
intensities (open circles) were averaged (solid squares) to determine the concentration of
each species. All intensities were normalized to the time-averaged Sum to determine
relative concentration. Data for each species was initially fit independently to an
exponential decay. Noting that each of the rate constants (k) was similar―excepting the
Sum series, for which k ≈ 0―this parameter was constrained to be identical for each
species and the data was refit. The fits (solid line) are excellent (R2 = 0.994) and
physically consistent, i.e., the sum of the fitted concentrations matches the fit of Sum,
which has negligible (A = 8.81566×10⁻⁴
) exponential character. This result indicates that
ECH ring-opening is first-order with respect to ECH concentration. As both H2O and
EtOH are present in large excess, changes in their concentration by consumption during
ring-opening would have little effect on the observed kinetics.
This demonstrates that concentration curves can be determined via in situ
mesophase 13
C NMR for analysis of slow gelation kinetics, even in the presence of poor
signal to noise caused by low concentrations and anisotropic susceptibility broadening.

68
Figure S.4 X-ray (Cu-Kα) diffraction pattern of a ground vanadia aerogel monolith. Stick
patterns for a series of potential VOx·nH2O species are included for comparison:
V2O5·H2O (PDF# 01-074-3093), V3O7·H2O (01-085-2401), V3O7 (01-71-0454),
H3.78V6O13 (01-088-1753 38-8). Electron diffraction pattern inset.
The peaks in the X-ray diffraction pattern are in locations similar to several
known VOx materials, but the broad low-intensity peaks are more consistent with an
amorphous material. (A detailed analysis of the diffuse scattering and determination of a
model pair distribution function (PDF) is beyond the scope of this study.) The electron
diffraction pattern and TEM image (Fig. 4B) suggest that some intermittent
nanocrystalline domains are present. A good single-crystal electron diffraction pattern
was not obtainable, due in part to multiple scattering from the amorphous matrix. The
scarcity of the nanocrystals also precludes the collection of a quality powder electron
diffraction pattern.

69
Figure S.5 Conformally coated cylindrical VOx nanoworm approximation used to
calculate polymer coating density, where r1 and r2 are the radii of the nanoworms and
before and after isocyanate crosslinking, respectively and L is the length of the
nanoworms. Since conformal crosslinking only adds onto existing nanoworms, the ratio
of the radii can be determined from the ratio of the volumetric surface area, σv:
The skeletal density of the composite nanoworm, ρs,T, is the average of the
skeletal density of the composite parts, ρs,1 and ρs,2, weighted by their respective volumes,
V1 and V2:

70
Figure S.6. Representative quasi-static compression tests of X-VOx aerogels with
different densities, as controlled by isocyanate concentration in crosslinking solutions.
Elastic region expanded in inset. Protocols were followed as previously reported [17,18].

71
Figure S.7. MS signals between m/z = 15 and m/z = 300 above the detection limit (~10-10
A) for (a) vanadia aerogels and (b) vanadia xerogels. All identified signals are listed and
identified in order of intensity at right, with isotopes labeled where more than one is
observed. The ratios of the species are consistent with both typical concentrations in air
and natural isotopic abundancies. For TGA-MS analysis, signals due to air were removed
by subtracting the m/z = 36 signal multiplied by the final measured ratio between each
species. Only m/z = 18, H2O, (blue) and m/z = 44, CO2, (red) show a statistically
significant deviation from the background. These signals were normalized by sample
mass and N2 carrier gas (m/z = 28) ion current, to account for variations in carrier gas
flow. Latency between TGA and MS signals was determined to be 6 min by matching
maxima in the mass-loss derivatives to maxima in the H2O and CO2 ion currents.

72
References:
1. Leventis N, Sotiriou-Leventis C, Mulik S, Dass A, Schnobrich J, Hobbs A,
Fabrizio EF, Luo H, Churu G, Zhang Y, Lu H (2008) Polymer nanoencapsulated
mesoporous vanadia with unusual ductility at cryogenic temperatures. Journal of
Materials Chemistry 18:2475-2482.
2. Luo H, Churu G, Fabrizio EF, Schnobrich J, Hobbs A, Dass A, Mulik S, Zhang
Y, Grady BP, Capecelatro A, Sotiriou-Leventis C, Lu H, Leventis N (2008)
Synthesis and characterization of the physical, chemical and mechanical
properties of isocyanate-crosslinked vanadia aerogels. Journal of Sol-Gel Science
and Technology 48:113-134.

73
II. A study of perfluorocarboxylate ester solvents for lithium ion battery electrolytes
Tyler M. Fearsa,b,†,*
, Robert L. Saccib, Jeffrey G. Winiarz
a, Helmut Kaiser
c,d, Haskell
Taubc,d
, Gabriel M. Veithb,*
aDepartment of Chemistry, Missouri University of Science and Technology, 400 W. 11
th
St., Rolla, MO 65409, USA bMaterials Science and Technology Division, Oak Ridge National Laboratory, 1 Bethel
Valley Rd., Oak Ridge, TN, 37830, USA cUniversity of Missouri Research Reactor, University of Missouri, 1513 Research Park
Dr., Columbia, MO 65211, USA dDepartment of Physics and Astronomy, University of Missouri, Columbia, MO 65211,
USA
†U.S. Department of Energy, Office of Science Graduate Student Research Program
Fellow, Oak Ridge National Laboratory
*Corresponding author
Email address: [email protected] (T.M. Fears)
Email address: [email protected] (G.M. Veith)
ABSTRACT
Several high-purity methyl perfluorocarboxylates were prepared (>99.5% purity by mole)
and investigated as potential fluorine-rich electrolyte solvents in Li-ion batteries. The
most conductive electrolyte, 0.1 M lithium bis(trifluoromethanesulfonyl)imide (LiTFSI)
in dimethyl perfluoroglutarate (PF5M2) (ionic conductivity = 1.87 × 10⁻²
mS cm-1
), is
investigated in Si thin-film half-cells. The solid-electrolyte-interphase (SEI) formed by
the PF5M2 electrolyte is composed of similar organic and inorganic moieties and at
comparable concentrations as those formed by ethylene carbonate/dimethyl carbonate
electrolytes containing LiPF6 and LiTFSI salts. However, the SEI formed by the PF5M2
electrolyte undergoes reversible electrochemical defluorination, contributing to the
reversible capacity of the cell and compensating in part for capacity fade in the Si
electrode. While far from ideal, these electrolytes provide an opportunity to further
develop predictions of suitable fluorinated molecules for use in battery solvents.

74
GRAPHICAL ABSTRACT
HIGHLIGHTS
Prepared fluorine-rich methyl perfluorocarboxylates electrolyte solvents.
Perfluorinated electrolytes supported reversible Li-ion chemistry on Si electrodes.
Perfluorinated electrolyte SEIs are similar to carbonate electrolyte SEIs.
Reversible electrochemical defluorination mitigated Si capacity fade.
KEYWORDS: SEI, LiTFSI, silicon thin-film, fluorinated electrolyte

75
1. Introduction
The fluorination of organic electrolyte components typically decreases the energy
(increases the molecular electrostatic potential) of both the highest occupied molecular
orbital (HOMO) and lowest unoccupied molecular orbital (LUMO), shifting the usable
voltage window of electrolyte components to higher potentials [1-6]. This shift increases
the stability to oxidative decomposition at the cathode but decreases stability to reductive
decomposition at the anode. By controlling the oxidation and reduction potentials of each
species in the electrolyte, one can theoretically control which species decompose at each
electrode during the initial discharge cycle and fine-tune the properties of the solid-
electrolyte-interphase (SEI), which plays a vital role in extending the lifetime of Li-ion
batteries [5-10].
Zhang et al. have shown that electrolytes composed entirely of fluorinated
components are capable of supporting high-voltage (>5.0 V) Li-ion chemistry with
minimal electrolyte degradation [1] and demonstrated that passivation issues with low-
voltage anode materials can be overcome with the judicious use of fluorinated additives
[2]. For example, the use of fluoroethylene carbonate (FEC) as an electrolyte additive has
been shown to form a dense, robust, polymeric SEI that ameliorates fade in Si electrodes
caused by fracture due to large volume changes during Li alloying and dealloying [4,10-
12].
To better understand the role of fluorinated species in Li-ion battery chemistry, a
series of methyl perfluorocarboxylate esters (Fig. 1) were prepared and their
electrochemical performance investigated. We observe that the conductivity in these neat
solvents is limited largely by Li+ salt solubility (≤0.1 M). The electrochemical properties

76
of the most conductive electrolyte were studied using idealized Si thin-film half-cells. We
observe via X-ray photoelectron spectroscopy (XPS) that the SEI formed by this
perfluorocarboxylate electrolyte on a Si electrode is composed of chemical moieties, e.g.,
organic carbonates and LiF, similar to those formed by traditional carbonate-based
electrolytes at remarkably similar concentrations. However, electrochemical
defluorination, well-known in poly(tetrafluoroethylene) (PTFE) [13,14], in combination
with the high reduction potential (1.0e1.5 V) of the fluorinated solvent prevents effective
electrode passivation, limiting the use of such fluorine-rich species as neat electrolyte
solvents in Li-ion battery cells that require extended cycling.
Fig. 1. Perfluorocarboxylate esters investigated in this work.
Beyond adjusting the stability window, lowering the flammability [6,15], and
improving the SEI characteristics of common electrolytes, fluorinated organic
compounds are also one family of solvents that can be largely hydrogen-free. This lack of
H makes them prime candidates for alternative solvents in in situ neutron scattering
77
experiments, where it is desirable to minimize the background signal due to incoherent
scattering from 1H [16-24].
2. Materials and methods
All reagents were used as received unless otherwise noted. Those used in Li-ion
battery cells were stored in a dry Ar glovebox (<5.0 ppm O2, <100 ppb H2O) prior to cell
fabrication.
The perfluorocarboxylates investigated here will be referenced according to the
shorthand PFnOxZy, where n is the number of carbons on the perfluorocarboxylate, x is
the number of ethereal oxygens in the perfluorocarboxylate, Z identifies the terminal
group (A for carboxylic acid and M for methyl carboxylate), and y is the number of
terminal groups.
2.1 Perfluorocarboxylate esterification
Perfluorobutyric acid (PF4A) (Acros, 99%), perfluoroheptanoic acid (PF7A)
(Alfa Aesar, 98+%), perfluorononanoic acid (PF9A) (Alfa Aesar, 97%), perfluoroglutaric
acid (PF5A2) (Exfluor, 98%), and perfluoro- 3,6,9-trioxaundane-1,11-dioic acid
(PF8O3A2) (Exfluor, 98%) were esterified with methanol (MeOH) (Sigma-Aldrich,
≥99.8%) to form the corresponding methyl esters, PF4M, PF7M, PF9M, PF5M2, and
PF8O3M2 (Fig. 1) respectively (Scheme 1).

78
Scheme 1. Esterification of perfluoroglutaric acid (PF5A2) to form dimethyl
perfluoroglutarate (PF5M2).
In a typical synthesis, 25 mmol perfluorocarboxylic acid was dissolved in 50
mmol MeOH in a 20 mL scintillation vial. HCl, prepared by passing concentrated
aqueous HCl (Sigma-Aldrich, 37%) vapor through a Drierite (Sigma-Aldrich) column,
was bubbled through the solution, while stirring with a PTFE stir bar, until it became
turbid. This solution was then sealed and stirred overnight. After allowing the reaction
mixture to settle into two phases, the lower, colorless layer was collected and transferred
to a 50 mL round-bottom flask and distilled under dry N2 (PF4M, B.P. = 80 °C; PF7M,
B.P. = 140 °C) or vacuum (PF9M, B.P. = 140 °C; PF5M2, B.P. = 120 °C; PF8O3M2, B.P.
= 160 °C) as appropriate. For dicarboxylic acid esters, 100 mmol MeOH was used.
1H (400 MHz) nuclear magnetic resonance (NMR) and
13C (100 MHz) NMR with
inverse-gated 1H decoupling were performed on a Varian Unity Inova and used to verify
ester synthesis. Purity was determined using the integral of the CH3 peak in the 1H
spectrum for the ester and trace MeOH, the only detectable impurity (ester: 4.0 ppm in 1H
and 54.2 ppm in 13
C vs. tetramethylsilane (TMS); MeOH: 3.3 ppm in 1H and 48.6 ppm in
13C vs. TMS).
As-distilled esters were dried by storing over 3A molecular sieves (Alfa Aesar) in
an Ar-filled glovebox for two weeks. A series of dry electrolyte salts (LiPF6, LiClO4,

79
lithium triflate, lithium bis(oxalato)borate) was investigated, and only LiTFSI (3M,
Battery Grade) was found to be appreciably soluble in the synthesized esters.
2.2. Si Thin Film Fabrication
Si thin-film electrodes were prepared via radio-frequency (RF) magnetron
sputtering using an undoped Si target (99.999%, Kurt J. Lesker) under Ar (99.9995%, Air
Liquide) at 7.5 mTorr and 90 W RF power. The deposition rate was determined to be 8
nm/min using a quartz crystal microbalance (Inficon). Si was deposited for 10 min onto a
rough electrochemical-grade Cu foil (Oak-Mitsui) and cut into 13-mm diameter
electrodes with a kerfless punch (EL-CELL).
2.3. Electrochemical Characterization
Four electrolytes were evaluated in this work: 1.2 M LiPF6 in 3:7 (by volume)
ethylene carbonate/dimethyl carbonate (EC/DMC) (BASF), 0.1 M LiTFSI in 3:7
EC/DMC (Reagent Grade solvents, Aldrich, dried over 3A molecular sieves, <1 ppm
H2O), 0.1 M LiTFSI in PF5M2, and saturated 0.1 M LiTFSI in PF8O3M2. Given that the
PF5M2-based electrolyte possessed the highest conductivity of the perfluocarboxylate
esters, it was exclusively used for electrochemical cycling studies.
Impedance spectroscopy was performed using a Biologic SP200 with an Accumet
two-point Pt conductivity probe (#13-620-155) possessing a 1.0 cm-1
cell constant in an
Ar-filled glovebox. Electrolyte conductivity was obtained by fitting the impedance
spectra to a typical RC circuit.

80
CR2023 stainless steel coin cells (Pred Materials) were prepared using Li ribbon
(99.9% Alfa Aesar), porous polypropylene separators (Treopore) wetted with electrolyte,
and 13-mm diameter Si thinfilm electrodes. Coin cells were galvanostatically cycled on a
Maccor 4000 battery cycler at 10 μA with voltage cutoffs 0.07 V upon lithiation and 2.5
V upon delithiation with a 10 min equilibration period between steps, corresponding to a
nominal cycling rate of C/10. Rate performance was probed using galvanostatic currents
of 5 μA (C/20),10 μA (C/10), 20 μA (C/5), and 50 μA (C/2). Capacity data were
normalized to the first delithiation capacity for each cell to account for slight variability
in thin film thickness across the Cu foil.
2.4. Ex situ Analysis of Cycled Electrodes
After galvanostatic cycling, coin cells were transferred into an Ar-filled glovebox
for decrimping. Electrodes were rinsed with 2mL DMC to remove excess electrolyte,
dried under vacuum, and sectioned for ex situ analysis of insoluble SEI components.
Attenuated total reflectance infrared absorption (ATR-IR) spectroscopy was
performed on the PF5M2-based electrolyte as prepared and on residue collected from a
separator after extensive cycling (500 cycles at C/5) without exposure to air. ATR-IR was
performed on a Bio-Rad 575c with a 4 mm × 4 mm diamond ATR crystal (Golden Gate,
Specac) with a reactive sample anvil and KBr beam splitter.
XPS data were collected on Si electrodes cycled in 0.1MLiTFSI in PF5M2
electrolyte to various states of charge (SOC). Electrodes cycled in 1.2MLiPF6 in 3:7
EC/DMC and 0.1MLiTFSI in 3:7 EC-DMC were stopped at their 7th discharge (0.07 V)
for comparison. Electrodes were transferred from the glovebox to the XPS sample stage

81
under vacuum in a specially developed transfer chamber to prevent errant decomposition
upon exposure to air. XPS data were collected on a PHI 3056 with an Al anode source
operating at 15 kV and 23.3 mA. High-resolution spectra were collected using a pass
energy of 5.85 eV with 0.05 eV steps. Peak fitting and quantitative elemental analysis
was performed using the PHI Multipak analysis suite and standard sensitivity factors.
Binding energies were referenced to the C 1s C-H peak (284.8 eV). Intensity (counts per
second) was normalized to the measured total atomic composition to prevent systematic
errors in signal intensity.
3. Results
3.1 Ester Physical Properties
Specific perfluorocarboxylate esters were chosen to investigate the effects of
perfluorinated chain length, mono- versus dicarboxylate esters, and the effect of ethereal
functional groups (Fig. 1). Despite the relatively low purity of the carboxylic acid starting
reagents, 13
C and 1H NMR revealed that the esterified products were highly pure: 0.5
mol% MeOH was detected in PF4M and <0.1 mol% MeOH in all other cases. This trend
is explained by the fact that increasing the boiling point of an ester allows easier
separation from volatile compounds; esters that were vacuum distilled above 100 °C can
be held under vacuum at room temperature with no observable sample loss and contained
no detectable methanol impurity. No additional impurities were detected above 0.01
mol% via 1H or
13C NMR in any sample. All distilled esters were colorless; however, the
upper phase discarded during synthesis was often pale yellow. We believe that impurities

82
in the starting materials dissolve selectively in the MeOH/H2O/HCl phase, resulting in
high product purity without excessive processing.
LiTFSI solubility in the synthesized esters qualitatively follows the trend PF5M2
≥ 0.1 M >> PF8O3M2 ≥ PF4M > PF7M > PF9M. Solubility appears to depend primarily
upon the molar density of ester functional groups (PF5M2 = 11.1 M; PF8O3M2 = 6.78 M;
PF4M = 6.45 M; PF7M = 4.39 M; PF9M = 3.62 M), consistent with previous reports
[15]. It appears that the perfluorinated ether functionality, as in PF8O3M2, contributes
negligibly to solubility, presumably due to the low net polarity of competing C-O and C-
F dipoles. The low solubility of LiTFSI limits electrolyte conductivity (Table 1). As a
result, only PF5M2 can be utilized as a neat electrolyte solvent. While the conductivity of
0.1 M LiTFSI in PF5M2 is inferior to both EC-DMC-based electrolytes, it is sufficient for
operation at the low current densities necessary to investigate SEI formation on thin-film
electrodes.
Table 1. Electrolyte conductivity as determined by impedance spectroscopy.
Electrolyte Conductivity
(mS/cm) 1.2 M LiPF
6 in 3:7 EC/DMC 11.0 0.1 M LiTFSI in 3:7 EC/DMC 2.51
0.1 M LiTFSI in PF5M2 1.87 × 10
-2
Sat. LiTFSI in PF8O3M
2 5.89 × 10
-4

83
3.2. Galvanostatic Cycling of Si Anode Half-Cells
Fig. 2 (left) shows the normalized galvanostatic discharge (Si reduction/lithiation)
and charge (Si oxidation/delithiation) curves for Si thin film half-cells as a function of
electrolyte composition and cycling rate up to 25 cycles. Based on a theoretical Si
capacity of 3578 mAh g-1
(Li15Si4) and a target film thickness of 80 nm, these electrodes
are expected to possess a capacity of 90 mAh; however, due to electrolyte limitations and
non-uniform Si deposition, due to thinning at the edges during film growth from the
larger deposition distances, the capacities are highly variable. To account for these
effects, the capacity was normalized to that of the first delithiation capacity, which
depends only upon the total Si mass and degree of lithiation. As a result the discharge
profiles are plotted with respect to 100% of the discharge capacity. The actual capacities
are reported within the figures. The advantage of this approach is that we can more
clearly identify changes in capacity with cycling. The corresponding differential capacity
curves (Fig. 2, right) highlight the major electrochemical reactions taking place:
reversible lithiation (†), irreversible lithiation (‡), and SEI formation (*). Lithiation steps
occur at 0.25 and 0.10 V in the carbonate-based electrolytes (Fig. 2, †). In the PF5M2
electrolyte, lithiation occurs at lower potentials, due to appreciable resistive losses.
Increasing cycling rate exacerbates this potential drop. At C/5, only a single lithiation
step is apparent above the 0.07 V cutoff.
All electrolytes exhibited two major irreversible reduction features at 0.5 V and
0.3 V during the first cycle (Fig. 2, ‡). The fact that the reduction potentials for these
features are independent of the electrolyte used is evidence that these peaks are related to
electrode―rather than electrolyte―chemistry. Work by Mullins et al. on partially

84
oxidized Si electrodes suggests that the sharp reduction feature around 0.5 V is related to
the lithiation of SiOx while the feature at 0.3 V is related to the irreversible lithiation of
Si0 [25]. The capacity corresponding to the SiOx peak is 2.8 ± 0.2 mAh, equivalent to a
4.5 ± 0.3 nm layer of SiO2 (4Li + SiO2 → Si + 2Li2O, 1.59 nm μAh-1
for 13 mm
electrodes). The fact that the capacity of this feature is independent of the bulk lithiation
capacity is consistent with a surface phenomenon. Because the Cu substrate is rough,
resulting in an increased surface area, this calculation overestimates the thickness of a
SiO2 film. The location of the reduction peak at 0.3 V prevents accurate integration.
However, beyond asserting that these two reduction peaks are unique to the electrode and
not associated with electrolyte chemistry, a detailed interpretation of these features is
beyond the scope of this study.

85
Fig. 2. Electrochemical cycling results on Si thin film electrodes. (A-E) Charge-discharge
curves for investigated electrolytes at several cycling rates, normalized to initial
delithiation capacity to account for fluctuations in Si thin film thickness, and (F-J) their
respective differential capacity curves with an expanded inset to show SEI formation.
Reduction peaks related to reversible lithiation (†), irreversible lithiation (‡), and SEI
formation (*) are labeled.
SEI formation is most likely related to small irreversible peaks that can be seen in
the differential capacity curve insets (Fig. 2, *). Specifically, carbonate-based electrolytes

86
(Fig. 2F and G) show reduction peaks at 1.75 and 0.75 V, while the PF5M2 electrolyte
(Fig. 2H,I, and 2J) shows a pair of broad peaks between 1.5 and 1.0 V. These features
disappear after the first cycle, but similar features reappear around cycle 10 in the PF5M2
electrolyte and grow steadily in intensity, suggesting that the SEI formed in this
electrolyte does not effectively passivate the electrode.
The charge-discharge curves for the PF5M2 electrolyte (Fig. 2C,D,and 2E) change
in shape in later cycles. The linear region in the charge (Si delithiation) curve adopts a
gentler slope, compensating in part for a decrease in the capacity of the Si lithiation peaks
at 0.25 V and 0.10 V (Fig. 2H,I,and 2J), leading to a relatively stable capacity. Given that
the change in the charge curve coincides with the reemergence of the SEI reduction peaks
during discharge (Fig. 2H,I, and 2J, *), it is likely that these features are due to
electrochemical reactions within the SEI. The fact that these changes do not occur in the
carbonate electrolytes is further evidence that these changes are related to PF5M2 and not
electrode chemistry.
Si anodes cycled with the PF5M2 electrolyte suffer a ~12% loss in capacity after
the first cycle (Fig. 3A) but regain it over the next 5 cycles. The initial loss in capacity is
attributed to thermodynamic changes in the lithiation potential, e.g., structural relaxation,
and increased cell resistance due to SEI formation during the first few cycles. Because
high resistive losses due to the low conductivity of the electrolyte place the lithiation
potential very near the voltage cutoff, electrodes cycled in the PF5M2 electrolyte are
exquisitely sensitive to changes in the lithiation thermodynamics and cell resistance. The
high cell resistance is illustrated by the greater voltage shift in the differential capacity
curves with higher cycling rates (lower lithiation voltage and higher delithiation voltage)

87
(Fig. 2H,I, and 2J). At C/2 these small changes are enough to move the lithiation
potential below the voltage cutoff, resulting in immediate and catastrophic capacity fade
(Fig. 3A).
Fig. 3. Capacity fade in Si thin film electrodes: (A) normalized delithiation capacity and
(B) absolute irreversible capacity (lithiation capacity - delithiation capacity). The
anomalous capacity drop at cycles 13 and 14 in the PF5M2 electrolyte (C/20) is due to a
decrease in electrolyte conductivity caused by a drop in ambient temperature.

88
The initial drop and subsequent recovery in the delithiation capacity appears
invariant when normalized to the initial delithiation capacity (Fig. 3A), implying that the
reaction(s) responsible for this capacity are associated with the bulk of the Si film,
consistent with silicon lithiation. By contrast, the irreversible reduction in capacity during
lithiation appears invariant at low currents (C/10 and C/20) with respect to absolute
current (Fig. 3B), suggesting a surface phenomenon. At high current densities (C/2), this
irreversible loss drops to zero after only a few cycles, reflective of kinetic limitations on
the reaction, consistent with electrochemical reactions taking place away from the Si
electrode, i.e., electrolyte decomposition instead of Si lithiation. The observed
irreversible capacity is qualitatively consistent with the magnitude of reduction peaks
attributed to SEI formation (Fig. 2H,I, and J, *).
Si anodes cycled in the carbonate electrolytes do not show the early capacity loss-
recovery behavior and fade much more quickly than those cycled in the PF5M2
electrolyte (Fig. 3A). This latter effect is attributable to the higher conductivity of the
carbonate electrolytes which allows for deep lithiation of the Si electrode, where extreme
volume changes speed Si fracture, the primary source of capacity fade in Si electrodes
[11,26,27]. The irreversible reductive capacity (Fig. 3B) of electrodes cycled in the
carbonate electrolytes is relatively constant (2-3 μAh) and much less than that observed
in the PF5M2 electrolyte (>12 μAh), implying that electrochemical decomposition of the
electrolyte is more significant in the PF5M2 electrolyte.

89
3.3. ATR-IR of Soluble Electrolyte Decomposition Products
To investigate soluble species produced as a result of electrolyte decomposition,
ATR-IR was performed on the PF5M2 electrolyte before and after extensive cycling (Fig.
4). ATR-IR spectra show no major changes in the PF5M2 electrolyte with extended
cycling (500 cycles at C/5) except for a small feature that appears around 1700 cm-1
,
consistent with a carbonyl stretch. This stretch is most likely due to a partially soluble
lithium perfluorocarboxylate created via electrochemical de-esterification of PF5M2
during SEI formation (Scheme 2). The lack of changes in the regions of 3000 cm-1
to
3600 cm-1
(COOH, OH) and 2850 cm-1
to 3000 cm-1
(CH) suggest that no protic or alkyl
species are formed at detectable levels. Unfortunately, since the TFSI- anion is
undetectable due to its low concentration and interference from PF5M2, it is unlikely that
any of its decomposition products, if decomposition occurs, would be observed.
Fig. 4. IR absorption spectra of the PF5M2 electrolyte before and after 500 cycles at C/5.
All peaks are attributable to PF5M2 in both spectra except for the small shoulder in the
cycled electrolyte at 1700 cm-1
, attributed to the carbonyl stretch in the corresponding
lithium carboxylate.

90
Scheme 2. Electrochemical de-esterification of PF5M2.
3.4. XPS of SEIs Formed on Si Anodes
High resolution XPS data were collected on Si electrodes (0.07 V) after 7
lithiations with 1.2 M LiPF6 in 3:7 EC/DMC and 0.1 M LiTFSI in 3:7 EC/DMC and
compared to one lithiated twice in 0.1 M LiTFSI in PF5M2 to investigate the effects of
both electrolyte salt and solvent on SEI characteristics. Despite their significantly
differing chemistries, SEIs formed from PF5M2-based and carbonate-based electrolytes
are remarkably similar (Fig. 5), containing LiF and Li2CO3 in addition to organic
carbonates (C 1s: CO3, 289 eV; O 1s: C=O, 532 eV, and C-O, 533 eV), carboxylates (C
1s: CO2, 289 eV; O 1s: C=O and C-O), ethers/esters (C 1s: CO, 285.5 eV; O 1s: C-O),
and fluorides (C 1s: CF, 287 eV; F 1s: CF 689 eV) in similar concentrations. The greatest
compositional differences between the three electrolyte systems is the presence of the PF
peak for the LiPF6-EC/DMC electrolyte (F 1s, 688 eV) and the absence of the Li2O peak
for the PF5M2 electrolyte (O 1s, 528 eV, and Li 1s, 54 eV).

91
Fig. 5. High-resolution XPS of lithiated (0.07 V) Si electrodes after 7 (1.2 M LiPF6 in
EC/DMC and 0.1 M LiTFSI in EC/DMC) and 2 (0.1 M LiTFSI in EC/DMC) lithiations
with nominal peak identifications.
The P 2p and N 1s spectra (not shown) indicate the presence of 1.6 at% P in the
electrolyte with LiPF6 and 0.2 at% N in the electrolytes with LiTFSI, suggesting that
decomposition products of PF6- are a more significant (though still small) part of the SEI
formed in LiPF6-based electrolytes when compared to those utilizing LiTFSI. However,
because TFSI- is the only source of F in the 0.1 M LiTFSI in EC/DMC electrolyte, the
presence of LiF at a significant concentration (10.0 at% of the SEI) implies that TFSI-
decomposition occurs readily, possibly with the formation of soluble S and N species.
92
To investigate the compositional changes of the PF5M2 SEI during formation,
XPS data (Fig. 6) were collected at several SOCs (Fig. 7). While Li2O appears to form
only in the carbonate electrolytes (Fig. 5), analysis of the SEI formed by the PF5M2
electrolyte during the first cycle (Fig. 6) does show the formation of Li2O. This finding is
consistent with the observation that Li2O is produced from the lithiation of SiOx at the
electrode surface [10,28]. Continued SEI growth buries this interface, reducing its
intensity and making it undetectable. The fact that it is detectable in electrodes cycled
with the carbonate electrolytes but not the PF5M2 electrolyte after repeated cycling
suggests that the SEI formed by the PF5M2 electrolyte is thicker than that formed by the
carbonate electrolytes, consistent with the increased and continued electrolyte
decomposition observed in the PF5M2 electrolyte during galvanostatic cycling (Fig. 2).
XPS data collected for the bare Si electrode and electrode held at open circuit
voltage (OCV) vs. Li/Li+ for 10 min under the PF5M2 shows only adventitious C 1s and
F 1s signals, indicating no SEI is formed in the absence of a reduction current. A slight
broadening and increase in the binding energy of the 103 eV peak in the Si 2p peak is
consistent with the conversion of SiO2 to SiO2-xF2x, suggesting that some chemical
reaction does take place before SEI formation. In both cases, the peak areas indicate that
27% of the Si within the sampling depth is SiO2/SiO2-xF2x. Assuming a sampling depth of
10 ± 2 nm, we estimate a SiO2 thickness of 5.4 ± 1.1 nm, consistent with that determined
from the SiO2 lithiation capacity (Fig. 2, 0.5 V). These Si peaks can be used as a
qualitative estimate for the SEI thickness (lower intensity implies a thicker SEI). Using
this measure, we can see that the SEI forms above 0.6 V and continues to grow during
lithiation. It then appears to shrink during delithiation and swell during lithiation. This

93
“breathing” phenomenon has been previously observed through similar techniques
[22,23,28].
Fig. 6. High-resolution XPS and atomic fractions of Si electrodes cycled with 0.1 M
LiTFSI in PF5M2 at the various SOCs shown in Fig. 7. A delithiation and second
lithiation step was performed to determine SEI stability.

94
Fig. 7. Differential capacity curve with SOCs labeled for (and color-coded to match) XPS
data.
XPS data show that the initial formation of the SEI in the PF5M2 electrolyte
occurred between OCV and 0.6 V upon discharge, suggesting that the small
electrochemical reaction(s) around 1.5-1.0 V (Fig. 2H,I, and 2J, *) corresponds to SEI
formation. This initial SEI appears to be composed primarily of fluorinated carboxylates
(CO2, CO, CF) and LiF (Fig. 6). Electrochemical defluorination of adjacent CeF bonds
by Liþ is known to occur (C=C…
LiF: C 1s, 289 eV), meaning that the presence of LiF (Li
1s, 56 eV, and F 1s, 686 eV) in the initial SEI could be due to either LiTFSI
decomposition, shown to occur in the carbonate electrolyte, or partial electrochemical
defluorination of the perfluorocarboxylate component of the SEI (Scheme 3). The
pronounced CF signal (C 1s, 287 eV, and F 1s, 689 eV) disappears with additional
electrochemical reduction (between 0.6 and 0.2 V), indicating that electrochemical
defluorination goes to completion. Upon delithiation, these peaks reappear, meaning that
either additional SEI forms during delithiation or electrochemical defluorination is

95
reversible. The intensity of the Si 2p peaks makes it unlikely that any significant SEI
growth takes place during delithiation, the perfluorocarboxylate defluorination must be at
least partially reversible.
Scheme 3. Electrochemical defluorination of lithium perfluoroglutarate.
After the second discharge, a significant change in the SEI composition took
place, most dramatically seen in the atomic fractions (Fig. 6, bottom right). While the C
and Li atomic fractions remained relatively unchanged, the O content increased
drastically at the expense of F. No additional soluble F compounds were detected via IR,
so it is unlikely that F is lost from the SEI. Instead, we find it probable that partially
soluble defluorinated carboxylate and carbonate moieties segregated towards the surface
of the SEI during the cycling, increasing their observed intensity via XPS. This
interpretation is consistent with the formation of a CO3 peak in the C 1s spectrum (290
eV) and the ~0.3 eV decrease in the binding energy (and slightly lower intensity) of the
primary Li 1s peak. Such changes have been observed previously in other studies [9,28].
We are unable to explain the systematic change in the binding energy of the LiF F 1s
peak, but, since the shift appears reversible (686.0 eV at 0.07 V on the first and second
discharge and 685.8 eV at 0.6 V and 2.5 V), it may be related to the electrochemical
defluorination reaction.
96
4. Discussion
While these studies investigated a number of new battery solvent molecules we
found significant similarities in the atomic and functional composition of SEIs formed
from carbonate-based and perfluorocarboxylate-based electrolytes. This is surprising
given the significant chemical differences between the solvent molecules indicating the
SEI formation reactions drive to specific low energy chemical species, e.g. LiF, Li2CO3
etc. These apparent similarities, though, do not prevent the systems from possessing quite
different electrochemical properties, i.e., defluorination and passivation, suggesting that
important subtleties in SEI composition are not captured via XPS [29]. Additionally, ex
situ analysis only captures insoluble SEI components possibly missing species essential
to SEI function.
The decreased capacity fade of the Si electrodes in the PF5M2 electrolyte (110%
(C/20), 100% (C/10), and 90% (C/5) compared to 75% (0.1MLiTFSI in EC/DMC, C/10)
and 50% (1.2 M LiPF6 in EC/DMC, C/10) after 25 cycles) can be partially attributed to
shallower lithiation and the accompanying reduction in electrode strain [11]; however,
the anomalous (yet repeatable) change in the voltage profile at later cycles partially
compensates for the observed capacity losses in the lithiation and delithiation peaks. This
capacity is most likely related to reversible electrochemical defluorination within the SEI.
Unfortunately, we believe that these reactions increase the electronic conductivity of the
SEI through the formation of an extended conjugated network, inhibiting effective
passivation, as evinced by the large (>9.0 μAh/cm2) irreversible capacity and growth of
SEI reduction peaks.

97
While this study focused on the use of perfluorocarboxylate esters as neat
electrolyte solvents to reduce experimental complexity, there is no reason to limit their
use to such simple systems. Additives, such as EC or fluorinated components, e.g., those
investigated by Zhang et al. [1,2], which chelate Liþ more strongly would almost
certainly improve conductivity and may improve SEI stability without sacrificing
beneficial properties like nonflammability, oxidative stability, and neutron transparency.
5. Conclusion
Perfluorocarboxylate esters can be easily and inexpensively synthesized in high
purity; however, as neat solvents, they do not possess the necessary conductivity to
compete with more traditional electrolytes in commercial Li-ion batteries. Interestingly,
the SEI formed from these electrolytes appears to undergo reversible electrochemical
defluorination, contributing to the cycling capacity and compensating in part for fade due
to electrode fracture and delamination. The low inherent stability of the electrolyte
towards reduction, possibly combined with the electronic conductivity of an extended
conjugated network formed in the SEI during electrochemical defluorination, leads to
continual electrolyte decomposition. These properties may also apply to similar heavily
fluorinated species proposed for next generation Li-ion electrolytes [1,2,5,30,31]. In
particular the defluorination reaction, which may impart unwanted electronic
conductivity in the SEI, has been shown in poly(tetrafluoroethylene) to be related to
neighboring C-F bonds [13,14], an issue that can be ameliorated with careful synthetic
design.

98
Conflicts of interest
The authors declare no conflicts of interest.
Acknowledgements
Student support and materials for ester synthesis were provided by the U.S.
National Science Foundation under Grant No. DGE-1069091. Student support for the
electrochemical, XPS, and ATR-IR studies performed at Oak Ridge National Laboratory
provided by the U.S. Department of Energy, Office of Science, Office of Workforce
Development for Teachers and Scientists, Office of Science Graduate Student Research
(SCGSR) program. The SCGSR program is administered by the Oak Ridge Institute for
Science and Education for the DOE under contract number DE-AC05-06OR23100. The
equipment, materials and technical guidance at ORNL was supported by the Materials
Sciences and Engineering Division, Office of Basic Energy Sciences, U.S. Department of
Energy under contract with UT-Battelle, LLC (GMV―XPS, ATR-IR, electrochemical)
and the Fluid Interface Reactions, Structures, and Transport (FIRST) Center, an Energy
Frontier Research Center funded by the Office of Science, Office of Basic Energy
Sciences (RLS―Conductivity, ATR-IR). T.M.F. would also like to thank Dr. C. Sotiriou-
Leventis for help in formulating the perfluorocarboxylate ester synthesis.

99
References
[1] Z. Zhang, L. Hu, H. Wu, W. Weng, M. Koh, P.C. Redfern, L.A. Curtiss, K.
Amine, Energy & Environmental Science, 6 (2013) 1806.
[2] L. Hu, Z. Xue, K. Amine, Z. Zhang, Journal of the Electrochemical Society, 161
(2014) A1777-A1781.
[3] T. Böttcher, B. Duda, N. Kalinovich, O. Kazakova, M. Ponomarenko, K. Vlasov,
M. Winter, G.V. Röschenthaler, Progress in Solid State Chemistry, 42 (2014)
202-217.
[4] X. Chen, X. Li, D. Mei, J. Feng, M.Y. Hu, J. Hu, M. Engelhard, J. Zheng, W. Xu,
J. Xiao, J. Liu, J.-G. Zhang, ChemSusChem, 7 (2014) 549-554.
[5] H.Q. Pham, K.M. Nam, E.H. Hwang, Y.G. Kwon, H.M. Jung, S.W. Song, Journal
of the Electrochemical Society, 161 (2014) A2002-A2011.
[6] K. Xu, Chem Rev, 114 (2014) 11503-11618.
[7] P. Verma, P. Maire, P. Novák, Electrochimica Acta, 55 (2010) 6332-6341.
[8] K.C. Klavetter, S.M. Wood, Y.-M. Lin, J.L. Snider, N.C. Davy, A.M. Chockla,
D.K. Romanovicz, B.A. Korgel, J.-W. Lee, A. Heller, C.B. Mullins, Journal of
Power Sources, 238 (2013) 123-136.
[9] C.K. Chan, R. Ruffo, S.S. Hong, Y. Cui, Journal of Power Sources, 189 (2009)
1132-1140.
[10] B. Philippe, R. Dedryvère, M. Gorgoi, H. Rensmo, D. Gonbeau, K. Edström,
Chemistry of Materials, 25 (2013) 394-404.
[11] V. Chakrapani, F. Rusli, M.A. Filler, P.A. Kohl, Journal of Power Sources, 205
(2012) 433-438.
[12] N. Delpuech, N. Dupré, D. Mazouzi, J. Gaubicher, P. Moreau, J.S. Bridel, D.
Guyomard, B. Lestriez, Electrochemistry Communications, 33 (2013) 72-75.
[13] L. Kavan, F.P. Dousek, K. Doblhofer, Journal of Fluorine Chemistry, 55 (1991)
37-45.
[14] L. Kavan, F.P. Dousek, P. Janda, J. Weber, Chemistry of Materials, 11 (1999)
329-335.
[15] D.H. Wong, J.L. Thelen, Y. Fu, D. Devaux, A.A. Pandya, V.S. Battaglia, N.P.
Balsara, J.M. DeSimone, Proc Natl Acad Sci U S A, 111 (2014) 3327-3331.
[16] I.A. Bobrikov, A.M. Balagurov, C.-W. Hu, C.-H. Lee, T.-Y. Chen, S. Deleg, D.A.
Balagurov, Journal of Power Sources, 258 (2014) 356-364.
[17] O. Dolotko, A. Senyshyn, M.J. Mühlbauer, K. Nikolowski, H. Ehrenberg, Journal
of Power Sources, 255 (2014) 197-203.
[18] T.C. Hansen, H. Kohlmann, Zeitschrift für anorganische und allgemeine Chemie,
640 (2014) 3044-3063.
[19] H. Liu, C.R. Fell, K. An, L. Cai, Y.S. Meng, Journal of Power Sources, 240
(2013) 772-778.
[20] M. Roberts, J.J. Biendicho, S. Hull, P. Beran, T. Gustafsson, G. Svensson, K.
Edström, Journal of Power Sources, 226 (2013) 249-255.
[21] J.F. Browning, L. Baggetto, K.L. Jungjohann, Y. Wang, W.E. Tenhaeff, J.K.
Keum, D.L. Wood, G.M. Veith, ACS Applied Materials & Interfaces, 6 (2014)
18569-18576.

100
[22] B. Jerliu, L. Dorrer, E. Huger, G. Borchardt, R. Steitz, U. Geckle, V. Oberst, M.
Bruns, O. Schneider, H. Schmidt, Physical Chemistry Chemical Physics, 15
(2013) 7777-7784.
[23] J.E. Owejan, J.P. Owejan, S.C. DeCaluwe, J.A. Dura, Chemistry of Materials, 24
(2012) 2133-2140.
[24] G.M. Veith, L. Baggetto, R.L. Sacci, R.R. Unocic, W.E. Tenhaeff, J.F. Browning,
Chemical Communications, 50 (2014) 3081-3084.
[25] P.R. Abel, Y.-M. Lin, H. Celio, A. Heller, C.B. Mullins, ACS Nano, 6 (2012)
2506-2516.
[26] C.K. Chan, H. Peng, G. Liu, K. McIlwrath, X.F. Zhang, R.A. Huggins, Y. Cui,
Nat Nanotechnol, 3 (2008) 31-35.
[27] Y. Oumellal, N. Delpuech, D. Mazouzi, N. Dupré, J. Gaubicher, P. Moreau, P.
Soudan, B. Lestriez, D. Guyomard, Journal of Materials Chemistry, 21 (2011)
6201.
[28] B. Philippe, R. Dedryvère, J. Allouche, F. Lindgren, M. Gorgoi, H. Rensmo, D.
Gonbeau, K. Edström, Chemistry of Materials, 24 (2012) 1107-1115.
[29] N. Leifer, M.C. Smart, G.K.S. Prakash, L. Gonzalez, L. Sanchez, K.A. Smith, P.
Bhalla, C.P. Grey, S.G. Greenbaum, Journal of The Electrochemical Society, 158
(2011) A471.
[30] M.L. Gordin, F. Dai, S. Chen, T. Xu, J. Song, D. Tang, N. Azimi, Z. Zhang, D.
Wang, ACS Appl Mater Interfaces, 6 (2014) 8006-8010.
[31] J. Kalhoff, D. Bresser, M. Bolloli, F. Alloin, J.Y. Sanchez, S. Passerini,
ChemSusChem, 7 (2014) 2939-2946.

101
III. Evaluating the solid-electrolyte-interphase formed on silicon electrodes: a
comparison of ex situ X-ray photoelectron spectroscopy and in situ neutron
reflectometry
Tyler M. Fearsa,b,†,*
, Mathieu Doucetc,*
, James F. Browningd,*
, Jon K. S. Baldwine, Jeffrey
G. Winiarza, Helmut Kaiser
f,g, Haskell Taub
f,g, Robert L. Sacci
b, Gabriel M. Veith
b,*
aDepartment of Chemistry, Missouri University of Science and Technology, 400 W. 11
th
St., Rolla, MO 65409, USA bMaterials Science and Technology Division, Oak Ridge National Laboratory, 1 Bethel
Valley Rd., Oak Ridge, TN 37830, USA cNeutron Data Analysis and Visualization Division, Oak Ridge National Laboratory, 1
Bethel Valley Rd., Oak Ridge, TN 37830, USA dChemical and Engineering Materials Division, Oak Ridge National Laboratory, 1 Bethel
Valley Rd., Oak Ridge, TN 37830, USA eMaterials Science and Technology Division, Los Alamos National Laboratory, Los
Alamos, NM 87545, USA fUniversity of Missouri Research Reactor, University of Missouri, 1513 Research Park
Dr., Columbia, MO 65211, USA gDepartment of Physics and Astronomy, University of Missouri, Columbia, MO 65211,
USA
†U.S. Department of Energy, Office of Science Graduate Student Research Program
Fellow, Oak Ridge National Laboratory
*Corresponding authors: [email protected] (T.M. Fears), [email protected] (M. Doucet),
[email protected] (J.F. Browning), [email protected] (G.M. Veith)
This work details experiments to characterize the liquid-solid interface of a silicon anode
material in situ using neutron scattering characterization with perfluorocaroxylate
electrolytes. The most conductive electrolyte, 0.1 M lithium
bis(trifluoromethanesulfonyl)imide (LiTFSI) in deuterated dimethyl perfluoroglutarate
(d6-PF5M2) (1.87 10-2
mS/cm), was utilized for an in situ neutron reflectometry (NR)
study of the solid-electrolyte-interphase (SEI) formation on a Si electrode. SEI
composition and thickness determined via in situ NR and ex situ X-ray photoelectron
spectroscopy (XPS) was compared. SEI expansion and contraction (breathing) during
electrochemical cycling was observed via both techniques; however, ex situ XPS suggests

102
that the SEI thickness increases during Si lithiation and decreases during delithiation,
while in situ NR suggests the opposite. It is shown that the most likely cause of this
discrepancy is the selective removal of SEI components during electrode rinse, required
to remove electrolyte residue prior to ex situ analysis, demonstrating the necessity of
performing SEI characterizations in situ.
1. Introduction
Solid-electrolyte-interphases (SEIs) formed by electrolyte decomposition on
electrode surfaces during electrochemical cycling are an integral, yet under-characterized
component of Li-ion batteries. SEIs impede performance by reducing Li+ conductivity
but also increase the useful lifetime of the cell by preventing continual decomposition of
the electrolyte and inhibiting electrode decomposition and exfoliation. Finding a balance
between these properties is necessary for the optimization of battery performance and
requires a detailed study of the relationship between SEI composition and properties. The
SEI is typically a 5-50 nm layer on 1-100 μm particles, so the SEI is only a low
compositional fraction and must be analyzed with surface-sensitive techniques or grown
on high-surface-area materials to obtain sufficient signal intensity.1-8
The most common
methods of characterizing SEIs, e.g., X-ray photoelectron spectroscopy (XPS), infrared
absorption spectroscopy (IR), nuclear magnetic resonance spectroscopy (NMR), involve
disassembling cycled Li-ion cells and often rinsing the electrode of interest to remove
excess electrolyte before analysis.6-9
These preparation steps potentially remove soluble
SEI components and expose the electrode to environmental contaminants. In situ
characterization avoids such effects and has the potential to monitor transient and
dynamic interactions.
103
Several methods exist for studying battery materials and interfaces in situ.9-19
For
this study, neutron reflectometry (NR) was chosen to investigate the SEI formed on a Si
thin film, as it possesses several advantages over other methods. X-ray and neutron
reflectometry are interface-sensitive techniques,8, 20-25
unlike diffraction or nuclear
magnetic resonance, and interrogate a macroscopic sample size, unlike electron
microscopy. Neutrons are deeply penetrating and sensitive to light elements (H, Li),10, 15,
17, 24-27 unlike X-rays, making NR particularly suited for the characterization of SEIs and
electrodes in Li-ion batteries.10, 15, 17, 24-27
A specialized cell has been developed at the
Oak Ridge National Laboratory for use on the Liquids Reflectometer (Spallation Neutron
Source, Beam Line 4B) for performing NR on thin films with electrochemical cycling.
This set-up can obtain high quality data in a reasonable amount of time (<1 hr per
measurement) and minimizes model uncertainty by limiting the number of fitting
parameters.23-25
Hydrogen, 1H, possesses a large, incoherent neutron scattering cross-section, so
the presence of hydrogenous material in an electrochemical cell can contribute
significantly to the background signal in elastic neutron scattering techniques like NR.
For neutron scattering experiments with in situ electrochemistry, this unwanted scattering
typically comes from the requisite organic electrolyte solvent, e.g., dimethyl carbonate
(DMC), ethylene carbonate (EC), propylene carbonate (PC). Because neutron scattering
is derived from nuclear interactions, isotopic substitution (deuteration, 2H) is typically
utilized to minimize unwanted scattering from hydrogenous components.15-18, 20, 21, 23-25, 27,
28 Unfortunately, deuterated carbonate esters are both expensive and of only moderate
(~99%) purity, making viable alternatives desirable.29

104
An ideal electrolyte for in situ neutron scattering studies would possess a high
ionic conductivity, high purity (commercially available 1H EC, DMC, PC electrolytes),
and a low (incoherent) scattering cross-section (commercially available 2H EC, DMC,
PC). It is also necessary that the electrolyte have an appropriate electrochemical stability
window, which is experiment-dependent. In order to aid NR data it is necessary to
maximize the scattering length density (SLD) contrast between layers (discussed in Sect.
2.5), which warrants the use of an electrolyte with a high SLD for the experimental
geometry used here. Other in situ neutron scattering techniques, e.g., neutron diffraction,
benefit from minimizing both the electrolyte SLD and incoherent neutron scattering
cross-section.10, 15-19
Fluorinated solvents have a number of advantageous properties for Li-ion battery
electrolytes: high oxidation potential, low flammability, and attractive SEI
characteristics.1, 5, 8, 30-32
Perfluorinated organic solvents are also one family of materials
that are both electrochemically stable and hydrogen-free, suggesting that they may be
prime candidates for solvents in in situ neutron scattering experiments. To investigate this
potential, d3-methyl perfluorocarboxylates were synthesized with high (≥99.9%) purity
and used as low-scattering electrolyte solvents for in situ NR. Perfluorocarboxylate esters
were chosen due to the known ability of esters to solvate Li ions
8 and the ability to easily
and inexpensively synthesize deuterated esters using the corresponding carboxylic acids
and deuterated methanol (d3-MeOD). The specific methyl perfluorocarboxylates used in
this study (Fig. 1) were chosen such that they covered a reasonable range of -CF2- chain
lengths, diesters, and perfluoroethers. The electrochemical properties of these electrolytes
have been previously reported along with an in-depth ex situ chemical characterization of
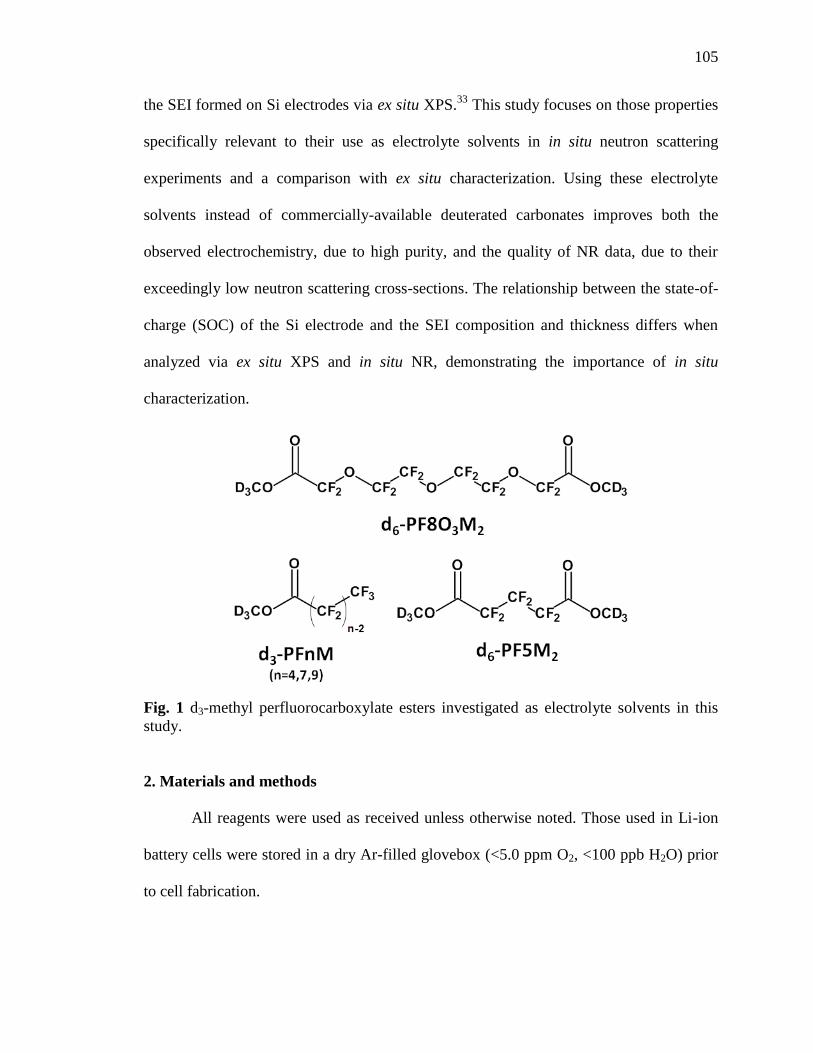
105
the SEI formed on Si electrodes via ex situ XPS.33
This study focuses on those properties
specifically relevant to their use as electrolyte solvents in in situ neutron scattering
experiments and a comparison with ex situ characterization. Using these electrolyte
solvents instead of commercially-available deuterated carbonates improves both the
observed electrochemistry, due to high purity, and the quality of NR data, due to their
exceedingly low neutron scattering cross-sections. The relationship between the state-of-
charge (SOC) of the Si electrode and the SEI composition and thickness differs when
analyzed via ex situ XPS and in situ NR, demonstrating the importance of in situ
characterization.
Fig. 1 d3-methyl perfluorocarboxylate esters investigated as electrolyte solvents in this
study.
2. Materials and methods
All reagents were used as received unless otherwise noted. Those used in Li-ion
battery cells were stored in a dry Ar-filled glovebox (<5.0 ppm O2, <100 ppb H2O) prior
to cell fabrication.
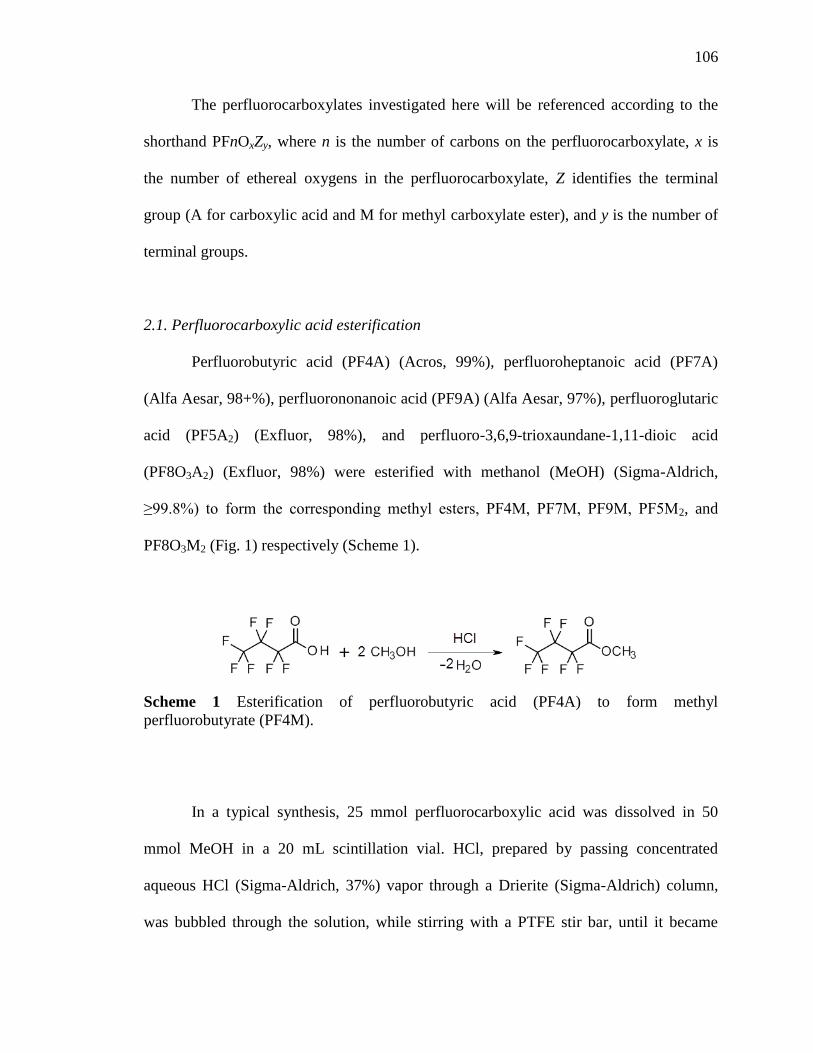
106
The perfluorocarboxylates investigated here will be referenced according to the
shorthand PFnOxZy, where n is the number of carbons on the perfluorocarboxylate, x is
the number of ethereal oxygens in the perfluorocarboxylate, Z identifies the terminal
group (A for carboxylic acid and M for methyl carboxylate ester), and y is the number of
terminal groups.
2.1. Perfluorocarboxylic acid esterification
Perfluorobutyric acid (PF4A) (Acros, 99%), perfluoroheptanoic acid (PF7A)
(Alfa Aesar, 98+%), perfluorononanoic acid (PF9A) (Alfa Aesar, 97%), perfluoroglutaric
acid (PF5A2) (Exfluor, 98%), and perfluoro-3,6,9-trioxaundane-1,11-dioic acid
(PF8O3A2) (Exfluor, 98%) were esterified with methanol (MeOH) (Sigma-Aldrich,
≥99.8%) to form the corresponding methyl esters, PF4M, PF7M, PF9M, PF5M2, and
PF8O3M2 (Fig. 1) respectively (Scheme 1).
Scheme 1 Esterification of perfluorobutyric acid (PF4A) to form methyl
perfluorobutyrate (PF4M).
In a typical synthesis, 25 mmol perfluorocarboxylic acid was dissolved in 50
mmol MeOH in a 20 mL scintillation vial. HCl, prepared by passing concentrated
aqueous HCl (Sigma-Aldrich, 37%) vapor through a Drierite (Sigma-Aldrich) column,
was bubbled through the solution, while stirring with a PTFE stir bar, until it became

107
turbid. This solution was then sealed and stirred overnight. After allowing the reaction
mixture to settle into two phases, the lower, colorless layer was collected and transferred
to a 50 mL round-bottom flask and distilled under dry N2 (PF4M, boiling point = 80° C;
PF7M, 140° C) or vacuum (PF9M, 140° C; PF5M2, 120° C; PF8O3M2, 160° C) as
appropriate. For dicarboxylic acid esters, 100 mmol MeOH was used. For the synthesis of
deuterated esters, e.g., d3-PF4M, d6-PF5M2, MeOH was replaced with its perdeuterated
counterpart, d3-MeOD (99.8 %D, Fisher Scientific).
1H (400 MHz) nuclear magnetic resonance (NMR) and
13C (100 MHz) NMR with
inverse-gated 1H decoupling were performed on a Varian Unity Inova and used to verify
ester synthesis. Purity was determined using the integral of the CH3 peak in the 1H
spectrum for the ester and trace MeOH, the only detectable impurity (ester: 4.0 ppm in 1H
and 54.2 ppm in 13
C vs. tetramethylsilane (TMS); MeOH: 3.3 ppm and 3.6 ppm in 1H and
48.6 ppm in 13
C vs. TMS).
As-distilled esters were dried by storing over 3A molecular sieves (Alfa Aesar) in
an Ar-filled glovebox for two weeks. Due to its high relative ionic conductivity in
comparison to other perfluorocarboxylate-based electrolytes (1.87 × 10⁻²
mS/cm), 0.1 M
lithium bis(trifluoromethane-sulfonyl)imide (LiTFSI) (3M, Battery Grade) in d6-PF5M2
was used as the electrolyte for all electrochemical characterizations.
2.2. Neutron Scattering Profiles
The total scattering coefficient (τ) of a series of protiated and deuterated
electrolyte solvents was calculated using standard thermal neutron scattering cross-
sections34
and solvent densities:

108
where Nd,i is the number density of nucleus i, σT,i is the sum of the coherent (σCOH,i) and
incoherent (σINC,i) neutron scattering cross-section of nucleus i, NA is Avagadro's number,
Md is the molar density of the solvent, and ni is the number of nucleus i in the molecular
formula for the solvent. Scattering profiles were collected from several electrolyte
solvents in order to compare with the calculated values and demonstrate the contribution
of both incoherent (flat) and coherent (diffuse peaks) scattering to the total background
signal.
Energy-integrated neutron scattering profiles were collected on the University of
Missouri Research Reactor (MURR) triple-axis spectrometer (TRIAX) using a 6-mm-
diameter Al sample can. The incident wavelength was fixed at 2.36 Å (14.7 meV).
Scattered neutrons were monitored from 2θ = 44.0° (Q = 1.99 Å-1) to 2θ = 82.2° (3.50 Å-1
)
at a step-size of 0.1° for 1 106 monitor counts (~2 min) per point.
2.3. Fabrication of electrochemical cell for in situ NR
The thin-film working electrode was deposited by DC magnetron sputtering and
evaporation from commercially available targets, Cu (99.99% - Kurt J. Lesker) and Si
(99.99% - Kurt J. Lesker) in an in-house sputtering system. Base pressures were below 5
× 10-8
Torr before Cu sputter deposition and the target to substrate distances were 5 cm.
Rates were measured using a quartz crystal microbalance. The Cu films were deposited
by DC sputtering at an applied power of 300 W, at 3 mTorr Ar (99.9995%, Air Liquide)
for 2 min. The amorphous Si films were deposited by thermal evaporation in a chamber

109
with a base pressure less than 5 x 10⁻⁹
Torr. The samples were not exposed to air between
depositions. 50-mm-diameter, 10-mm-thick single-crystal Si substrates were obtained
from the Institute of Electronic Materials Technology, Warszawa, Poland.
Ti0.68Zr0.32 alloy (subsequently referred to as TiZr) was selected as the Li current
collector for two reasons: (1) TiZr is a null (SLD = 0, incoherent) scatterer of neutrons,
eliminating the possibility of interfering diffraction peaks in the NR pattern, and (2) TiZr
does not react chemically or electrochemically with Li. A machined 50-mm-diameter, 1-
cm-thick TiZr substrate was cleaned in successive water and isopropanol sonication baths
and dried at 120 °C for 2 days. The Li counter electrode (2.9 cm) was prepared using 3/4''-
wide Li-foil (Alfa Aesar), which was scraped clean and pressed onto the TiZr substrate in
a dry Ar-filled glovebox.
Wires were attached to the Si and TiZr plates (prior to Li deposition) using silver
epoxy (Illinois Tool Works) which was allowed to dry overnight. The silver epoxy was
placed on the edge of the Si wafer to contact the Cu which was spilled around the wafer
during deposition. The epoxy was never in contact with the electrolyte. Electrodes and
0.1 M LiTFSI in d6-PF5M2 electrolyte were sealed under dry Ar and transferred to a He-
filled glovebox (H2O < 1 ppm; O2 < 7 ppm) located at the beam line for on-site cell
assembly.
The in situ electrochemical cell for NR was assembled using a specially-
developed apparatus as previously reported.23-25
The electrodes were separated by a 48-
mm-diameter Teflon-coated Viton O-ring with a 0.8 mm cross-sectional diameter. The
total cell volume was ~2.5 mL, depending on the amount of Li on the TiZr. This volume
was filled with the 0.1 M LiTFSI in d6-PF5M2 electrolyte using ports in the TiZr current

110
collector, which were subsequently sealed with Teflon plugs. A diagram of the assembled
cell and NR geometry is shown in Fig. 2.
Fig. 2 Experimental geometry for collecting NR data.
2.4. In situ electrochemistry and NR
Electrochemistry was controlled using a Biologic VSP potentiostat. Due to the
high resistance of the in situ cell, galvanostatic cycling was not possible, so the cell was
cycled using a hybrid galvanostatic-potentiostatic protocol. Electrodes were driven
galvanostatically (375 μA) to the desired potential and held potentiostatically for 30 min.
The cell was then allowed to equilibrate in the open-circuit state for 30 min prior to NR
data collection. Voltages are reported with respect to the Li metal counter electrode
(Li/Li+).
NR measurements were carried out on the Liquids Reflectometer (LR, Beam Line
4B) at the Spallation Neutron Source (SNS) at Oak Ridge National Laboratory. The LR is

111
a horizontal-geometry instrument using the time-of-flight technique with an effective
single bandwidth of 3.5 Å at an accelerator pulse frequency of 60 Hz. NR measurements
on the assembled cell were carried out in the inverted geometry, using the Si substrate as
the incident medium, in order to observe a critical edge. NR was performed on the as-
fabricated electrode in the traditional geometry, with air as the incident medium, in order
to determine the initial multilayer parameters prior to any chemical interaction with the
electrolyte. For these measurements, neutrons of wavelengths 2.5 Å to 17 Å together with
four angles of incidence, θ = 0.60°, 0.69°, 1.37°, and 2.71°, provided a wave vector
transfer (Q) range extending from 0.008 Å-1
to 0.22 Å-1
. An incident beam slit was
adjusted for each angle in order to maintain a constant footprint on the sample.
Reflected neutrons are collected in a two-dimensional detector array oriented
perpendicular to the specularly reflected beam. Each neutron detection event is recorded
with detector pixel ID and time-of-flight (TOF) from the spallation event. This data is
processed with the Mantid data analysis framework to obtain the reflectivity profile.35
Using the reflection angle and neutron TOF, the data is converted to intensity as function
of Q. The background intensity is determined from the off-specular intensity and
subtracted from the specular intensity (Electronic Supplementary Material Fig. S1). The
final reflectivity is obtained by absolutely normalizing the resulting intensity using
attenuation parameters experimentally-determined from an uncoated single-crystal Si
substrate.

112
2.5. Fitting of NR data
Modeling of the neutron reflectivity data was done using the Motofit program.26
Details of the analysis, including the estimation of the uncertainties can be found in
reference.25
Model constraints were added to analysis described in the reference stated
above. Using the well-defined relationship between LixSi alloy stoichiometry and cell
volume,36
and assuming one-dimensional swelling typical of thin films, the thickness and SLD of
the LixSi layer were constrained to a single fitting parameter. Ultimately fitting of NR
results in a thickness and SLD (β) for each layer. SLD is indicative of the atomic
composition of the layer and can be calculated using Eq. 3:
where Nd,i is the number density of nucleus i, bi is the neutron scattering length of nucleus
i, Nd is the average atomic number density of the layer, and χi is the molar fraction of
nucleus i.
2.6. Ex situ characterization
Si thin-film witness electrodes were prepared via radio-frequency (RF) magnetron
sputtering using an undoped Si target under Ar at 7.5 mTorr and 90 W RF power. The

113
deposition rate was determined to be 8 nm/min using a quartz crystal microbalance
(Inficon). Si was deposited for 10 min onto a rough electrochemical-grade Cu foil (Oak-
Mitsui). The Si films were then cut into either 13-mm- or 8-mm-diameter electrodes as
necessary.
The effect of cycling on electrolyte composition was investigated via ex situ
NMR. Cycled electrolytes were prepared by galvanostatically (10 μA) discharging
electrolytes for 18 hr in a two-electrode Swagelok-type cells with an 8-mm Si thin-film
working electrode and Li counter electrode and ~1 mL protiated or deuterated 0.1 M
TFSI electrolyte. Two layers of a 0.14-mm-thick PEEK mesh (McMaster Carr) were used
as a separator in order to ensure a large electrolyte volume for analysis. Swagelok cells
were disassembled in a dry Ar glovebox and ~0.75 mL of each cycled and uncycled
electrolyte was transferred to a 5-mm NMR tube. The tubes were then sealed with a
polypropylene cap followed by placing a thin bead of epoxy (Loctite Hysol 1C) on the lip
of the polypropylene cap for air-tightness before removing from the glovebox. 1
H (400
MHz), 13
C (101 MHz) with inverse-gated 1H decoupling,
19F (376 MHz), and
7Li (155
MHz) NMR on a Bruker Avance III spectrometer. 1H spectra were referenced to the most
intense impurity signal (1.35 ppm vs. TMS). 13
C and 19
F spectra were referenced to the
most intense CF2 peak (109.43 ppm vs. TMS and -119.60 ppm vs. CFCl3, respectively).
These secondary references were chosen in order to avoid isotopically-induced shifts
from deuteration on the CH3 signal (0.04 ppm in 1H and 0.70 ppm in
13C). Due to the
absence of an accurate (<0.01 ppm) secondary standard, 7Li peaks were set to 0 ppm and
are only used to demonstrate changes in peak width and intensity with cycling.

114
The atomic composition of the SEI formed on Si thin-film electrodes was
characterized as a function of SOC via ex situ XPS. CR2023 stainless steel coin cells
(Pred Materials) were prepared using Li ribbon, porous polypropylene separators
(Treopore) wetted with electrolyte, and 13-mm Si thin-film electrodes. Coin cells were
galvanostatically cycled at 10 μA, corresponding to an approximate cycling rate of C/10
(fully discharged in 10 h), on a Maccor 4000 battery cycler and stopped at specific
potentials related to observed electrochemical reactions. Cycled coin cells were then
transferred into a dry Ar-filled glovebox for decrimping. Electrodes were rinsed with 2
mL DMC (Aldrich, 99.9%) to remove excess electrolyte, dried under vacuum, and
sectioned for ex situ analysis of insoluble SEI components. Electrodes were transferred
from the glovebox to the XPS sample stage under vacuum in a specially developed
transfer chamber to prevent decomposition upon exposure to air. XPS data were collected
on a PHI 3056 with an Al anode source operating at 15 kV and 23.3 mA. High-resolution
spectra were collected using a pass energy of 5.85 eV with 0.05 eV steps. Peak fitting and
quantitative elemental analysis was performed using the PHI Multipak analysis suite and
standard sensitivity factors. Binding energies were referenced to the C 1s C-H peak
(284.8 eV).
3. Results
3.1. Ester physical properties
The synthesis and conductivity of these electrolytes has been described
previously.33
In this prior work we demonstrated that despite the relatively low purity of
the carboxylic acid starting reagents, 13
C and 1H NMR revealed that the esterified

115
products were of high purity (>99.7 mole %). The most common impurity was methanol
which could easily be removed by distillation especially for the esters with higher boiling
points, which can be held under vacuum at room temperature for extended periods with
negligible sample loss. In order to confirm the predicted coherent and incoherent
scattering components, Fig. 3A, from the electrolyte energy-integrated, elastic plus
ineleastic, neutron scattering profiles were measured, Fig. 3B, on the solvents without salt
species. Using the calculated thermal neutron scattering coefficients, τ (summarized in
Fig. 3A), the fraction of unscattered neutrons passing through a medium can be estimated
from the Beer-Lambert law (Eq. 4):
where I(l) is the intensity of the neutron beam after passing a distance l through the
scattering medium and I0 is the initial intensity of the neutron beam. Since the scattered
neutrons only add to the background intensity during a measurement, it is ideal to
minimize this contribution. For example, a 5-mm path through protiated DMC would
scatter 80% of neutrons while deuterated DMC would only scatter 5.5% of the neutrons.
Passing neutrons through protiated and deuterated PF5M2 results in 56% and 2.8% of
neutrons scattering, respectively. Fig. 3B shows the measured neutron scattering profiles
of several standard and prepared deuterated and protiated solvents. The two large peaks at
2.7 and 3.1 Å-1
are due to the polycrystalline Al in the sample can whose intensities vary
depending on tube orientation relative to the beam. The data for the solvents is reflected
in the apparent baseline of the spectra. As expected the protiated DMC has a very high

116
intensity due to the large concentration of protons. A second group of spectra collected
for the protiated esters show that their cross-sections are much lower than the DMC
consistent with lower neutron scattering densities as estimated in Figure 3A. Finally, the
third bunch of spectra collected for the deuterated esters are universally low, which is
consistent with theoretical calculations.34
While the greatest reduction in background is
achieved through deuteration, d6-PF5M2 is expected to contribute only about half as
much to the background intensity as d6-DMC which would result in a significant
reduction in background intensity.
After rigorous drying with 3A molecular sieves in a dry Ar glovebox, only PF5M2
was able to dissolve LiTFSI up to 0.1 M. While the conductivity of 0.1 M LiTFSI in
PF5M2 (1.9 × 10⁻²
mS/cm) is inferior to carbonate-based electrolytes, e.g., 1.2 M LiPF6 in
3:7 EC-DMC (11 mS/cm), it is sufficient for low to moderate discharge rates.33
Fig. 3 (A) Calculated total neutron scattering coefficients (τ) and (B) measured neutron
scattering profiles for selected electrolyte solvents. Al (111) and (200) peaks in (B) arise
from the Al sample cell.
117
3.2. Comparison of ex situ and in situ electrochemistry
A differential capacity (dQC/dV) curve for the first cycle of a Si thin-film coin cell
cycled galvanostatically at 10 μA is shown in Fig. 4. Previous studies have identified the
major electrochemical reactions that take place during the first lithiation of Si thin-film
electrodes with a 0.1 M LiTFSI in PF5M2 electrolyte: SEI formation, ~1.0 V (Fig. 4,
green ●); adventitious oxide lithiation, 0.48 V (orange ■); irreversible Si lithiation
feature, 0.26 V (blue ♦); first lithiation step, 0.21 V (red ▲); second lithiation step, <0.07
V (red ▲); and delithiation, 0.40 V and 0.54 V (red ▼).33
These voltages were used to
identify regions of interest for the NR studies described below. Furthermore, additional
coin cells were cycled to 0.6 V, 0.4 V, 0.2 V, 0.07 V, and 2.5 V (Fig. 4, black arrows) for
ex situ XPS investigations to support the NR investigation of the SEI chemistry. A
detailed analysis of the chemical composition and evolution of the SEI as determined via
ex situ XPS is discussed elsewhere.33

118
Fig. 4 Differential capacity curve for the first cycle of a Si thin-film half-cell used for ex
situ analysis. Arrows mark stopping potentials for ex situ XPS. Shapes mark identified
electrochemical reactions: SEI formation (green ●), SiO2 lithiation (orange ■),
irreversible lithiation (blue ♦), Si lithiation (red ▲), and Si delithiation (red ▼).
Fig. 5 shows the voltage and current profiles for the electrode used in the in situ
NR cell as function of time. The NR data was collected during the rest steps for the
voltage and current collection. While the cycling of battery materials is typically
performed galvanostatically (constant current), the high resistance of the electrode used
in the NR cell resulted in large overpotentials which made stopping at predetermined cell
potentials difficult. For this reason, a hybrid galvanostatic-potentiostatic (constant
voltage) protocol was utilized. By holding the electrode at a predetermined potential and
allowing the current to decay, the resistive potential drop will decrease and approach the
"true" potential of a traditional cell with a lower resistance, i.e., a coin cell. After this
step, an additional relaxation step was performed at open circuit to allow for cell
equilibration, e.g., Li redistribution, to prevent compositional changes from occurring

119
during NR data collection. Even though the cell was allowed to relax at open circuit for
30 min prior to the collection of NR data, continued potential relaxation during NR data
collection is apparent; however, this relaxation is quasi-linear and relatively small,
implying that any additional changes in the electrode and SEI are minimal and
acceptable. Furthermore, as our goal was to characterize the SEI structure very small
changes in Li-Si chemistry will not influence the SEI chemistry significantly.
Fig. 5 Electrochemical data for in situ NR cell. NR data was collected during the gaps.
The voltage profile is shown in black while the current profile is shown in red (lithiation)
and blue (delithiation).
3.3.Neutron reflectometry
The electrode used in this study was initially measured in air in order to determine
the thickness of the Si electrode, Cu current collector, and any adventitious oxide layers
before any chemical or electrochemical reactions took place. It was determined that the Si
electrode and copper current collectors were 48.3 and 7.4 nm thick, respectively, and that
there was a 2.3 nm SiO2 layer between the single-crystal Si substrate and the Cu current
collector (Table 1). Adding a SiO2 layer on the surface of the Si electrode in the model

120
did not improve the fit quality, so it is assumed that any adventitious oxide on the surface
of the electrode is negligible. Neutron reflectivity curves obtained for the electrode at
different cell potentials and the corresponding fits to the data fits are shown in Fig. 6A-I.
From this data one can clearly see no change in the OCV structure and the 1.1 V data
indicating no change in the Si electrode stoichiometry and no clear formation of a
condensed surface layer or SEI reaction product. Furthermore, there is also no change in
the in air structure versus OCV (not shown).
Fig. 6 NR data (black points) and fits (colored lines) in order of collection (A-I).

121
However, there are subtle but clear differences in the reflectometry profile at high
Q’s upon reaching 0.7 V where we see evidence for SEI formation in the CV data (Fig.
4). Fitting this data revealed a very small expansion of the Si layer (48.3 to 48.9 nm) due
to a slight lithiation and the formation of a 14.4 nm surface reaction layer we attribute to
the SEI. Fig. 7 shows a representation of the SLD as a function of distance from the
Cu/Si interface determined from the fits to the NR data. From this plot, and Table 1, we
see that the SEI has a refined SLD of 4.5 which is lower than the experimentally
measured SLD of the electrolyte (4.8 × 10⁻⁶
Å-2). This lower SLD has to be due to the
formation of a reaction phase with slightly higher Li content than the bulk electrolyte or a
film made from the electrolyte but with a lower density than the electrolyte. Given that a
significant decrease in density with solid formation is unlikely and additional evidence of
Li in the SEI layer (discussed below) this reduction in SLD has to be due to an increase in
the Li content of the SEI. Upon continued lithiation (0.4 V) we see a further loss in
structure within the NR data consistent with an increased Li-Si ratio and a slight
thickening of the SEI layer (14.4 to 16.7 nm).

122
Fig. 7 SLD profiles representing the tabulated fit parameters (Table 1). Colors match the
corresponding fits from Fig 7. Major layers are labeled.
Upon further lithiation (0.08 V) we see a significant change in the NR data due to
the growth of the Li-Si electrode layer (50.5 to 106 nm) and the further growth in the SEI
thickness (16.7 to 26.6 nm). The SLD of the Si-layer decreases from 2.07 × 10⁻⁶
Å-2 to
0.28 × 10⁻⁶
Å-2 due to the incorporation of the low SLD Li. Eq. 2 and 3 indicate that
lithiation of the electrode results in the alloy Li1.5Si, well below the full lithiation capacity
of Li3.75Si. Furthermore, delithiation of the electrode does not go to completion, resulting
in an electrode composition of Li0.45Si, suggesting that a significant portion of the Si
lithiation capacity is irreversible.
To confirm that the Li-Si ratio determined via NR is consistent with
electrochemical results we compared the reversible Li/Si ratio from NR to the reversible
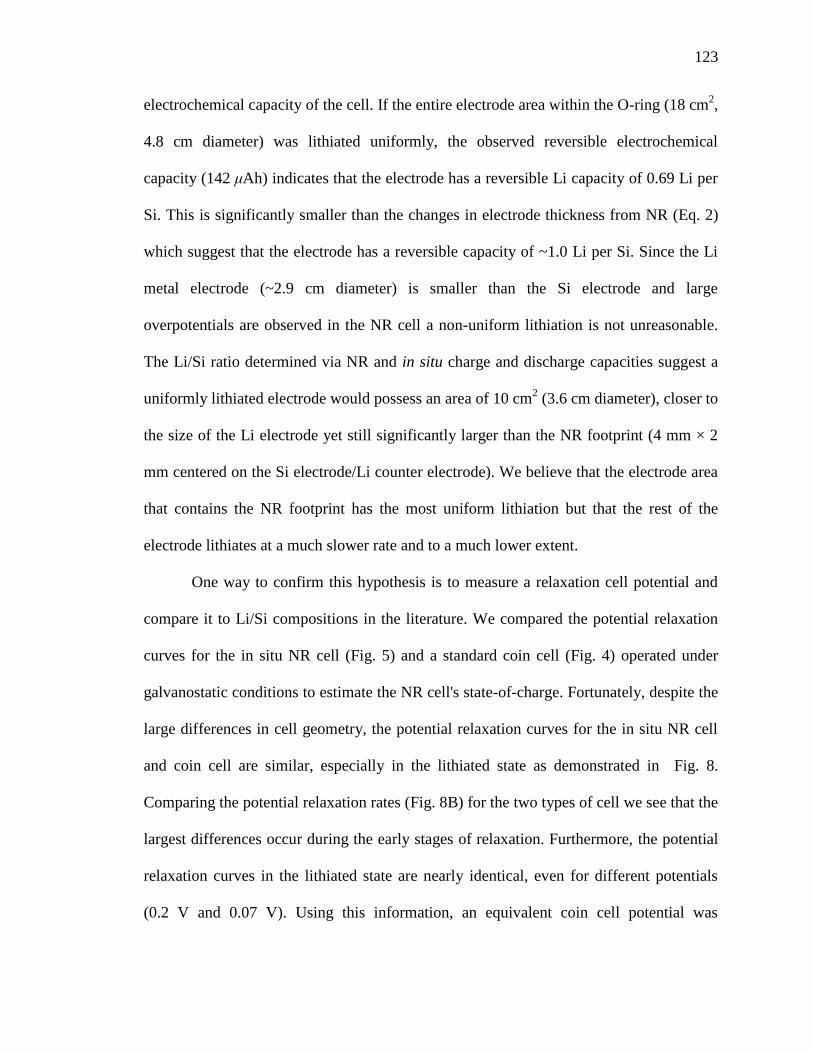
123
electrochemical capacity of the cell. If the entire electrode area within the O-ring (18 cm2,
4.8 cm diameter) was lithiated uniformly, the observed reversible electrochemical
capacity (142 μAh) indicates that the electrode has a reversible Li capacity of 0.69 Li per
Si. This is significantly smaller than the changes in electrode thickness from NR (Eq. 2)
which suggest that the electrode has a reversible capacity of ~1.0 Li per Si. Since the Li
metal electrode (~2.9 cm diameter) is smaller than the Si electrode and large
overpotentials are observed in the NR cell a non-uniform lithiation is not unreasonable.
The Li/Si ratio determined via NR and in situ charge and discharge capacities suggest a
uniformly lithiated electrode would possess an area of 10 cm2 (3.6 cm diameter), closer to
the size of the Li electrode yet still significantly larger than the NR footprint (4 mm × 2
mm centered on the Si electrode/Li counter electrode). We believe that the electrode area
that contains the NR footprint has the most uniform lithiation but that the rest of the
electrode lithiates at a much slower rate and to a much lower extent.
One way to confirm this hypothesis is to measure a relaxation cell potential and
compare it to Li/Si compositions in the literature. We compared the potential relaxation
curves for the in situ NR cell (Fig. 5) and a standard coin cell (Fig. 4) operated under
galvanostatic conditions to estimate the NR cell's state-of-charge. Fortunately, despite the
large differences in cell geometry, the potential relaxation curves for the in situ NR cell
and coin cell are similar, especially in the lithiated state as demonstrated in Fig. 8.
Comparing the potential relaxation rates (Fig. 8B) for the two types of cell we see that the
largest differences occur during the early stages of relaxation. Furthermore, the potential
relaxation curves in the lithiated state are nearly identical, even for different potentials
(0.2 V and 0.07 V). Using this information, an equivalent coin cell potential was

124
determined for each in situ NR cell potential by taking the potential after 10 min of
relaxation and subtracting the total relaxation potential drop (10 min) for a comparable
coin cell potential. From this analysis we find that the NR cell would have an equivalent
potential of 0.18 V relative to a coin cell indicating a Li/Si ratio between 0.9 and 1.9
which is consistent with the NR thicknesses.
Fig. 8 Potential relaxation (A) and relaxation rate (B) for in situ NR and coin cells
stopped at various potentials.
As noted previously the SEI thickness increased from 16.7 to 26.6 nm when
lithiated to Li1.5Si. Interestingly the SLD of the SEI increased from 4.5 to 4.7 × 10⁻⁶
Å-2.
Since ex situ XPS indicates that Li content increases during the first lithiation (Sect. 3.4),
which is expected to decrease SLD, this increase in SLD could be due to a densification
of the SEI or an increase in high scattering length nuclei like 2H, which is not captured
via XPS, or C. A large increase in SEI porosity (> 66%) could also explain this change;
however, we are unaware of any mechanism which would induce such a sudden and
significant increase in porosity and further find this explanation unlikely in a period when

125
both in situ NR and ex situ XPS (Sect 3.4) indicate SEI growth, from 14.4 ± 3.2 nm to
26.6 ± 2.1 nm (NR) and 5.3 ± 2.3 nm to 7.9 ± 3.4 nm (XPS).
Upon delithiation the electrode thickness reduces significantly (106 to 65.4 nm)
resulting in a composition of Li0.45Si. Interestingly, the thickness of the SLD increases
further to 34.2 nm with a corresponding decrease in the SLD to 4.3 ± 0.3 × 10⁻⁶
Å-2
indicating an increase in Li content or a decrease in SEI density. Since ex situ XPS
indicates that Li content is decreasing (Sect. 3.4) during this stage, the change in SLD is
most likely due to a change in the average atomic density (Nd) of the SEI. Upon further
cycling the SEI layer contracts (Li1.5Si) significantly (34.2 to 27.3 nm) while maintaining
the SEI SLD. A similar expansion and contraction are observed for the later cycle. This
swelling and contracting has been previously observed via in NR studies on the SEI
formed in traditional carbonate electrolytes.25
The degree of swelling and contraction
decreases with additional cycling―a 6.9 nm difference after the first cycle and a 3.6 nm
difference after the second cycle―suggesting that the SEI is approaching an equilibrium
state. If this contraction and swelling is due in part to changes in the atomic density of the
SEI, the lack of corresponding changes in the SLD of the SEI indicate that compositional
changes occur in concert, counteracting the effects of changes in atomic density. The
most likely compositional difference is the Li content. Increasing the density of the SEI
(contraction) increases the SLD while increasing the Li content reduces the SLD. If we
assume that the changes in SEI thickness are due primarily to changes in atomic density
and changes in the SLD are due primarily to changes in the Li content of the SEI, we can
conclude that the SEI on the Si electrode in the lithiated state (Li1.5Si) has both a higher

126
atomic density and higher Li content than the SEI on the Si electrode in the delithiated
state (Li0.5Si).
Table 1 Results of NR fits for electrochemically active components. Additional layers
and roughness parameters included in Electronic Supplementary Material Table S1.
Potentiostatic
Voltage
Equivalent
Coin Cell
Potential
[V]
Si Electrode
Thickness
[nm]
Li/Si
SEI
Thickness
[nm]
SEI SLD
[10-6 Å-2] χ2
In air
48.3 ± 0.1
2.2
OCV 2.88 48.4 ± 0.1 0.00
2.0
1.1 V 1.30 48.3 ± 0.1 0.00
1.8
0.7 V 0.70 48.9 ± 0.1 0.01 14.4 ± 3.2 4.5 ± 0.1 2.3
0.4 V 0.55 50.5 ± 0.5 0.06 16.7 ± 6.4 4.5 ± 0.2 7.0
0.08 V 0.18 106.0 ± 0.3 1.53 26.6 ± 2.1 4.7 ± 0.1 2.9
2.0 V 2.20 65.4 ± 1.1 0.45 34.2 ± 7.2 4.3 ± 0.3 4.1
0.08 V 0.18 105.9 ± 0.7 1.53 27.3 ± 2.3 4.3 ± 0.1 3.0
2.0 V 2.27 66.9 ± 0.6 0.49 32.2 ± 1.5 4.3 ± 0.1 3.2
0.08 V 0.17 105.5 ± 0.7 1.52 28.6 ± 4.0 4.3 ± 0.1 3.9
2.0 V 2.30
3.4.Ex situ XPS
Most of the communities understanding of SEI chemistry comes from traditional
ex situ methods like X-ray photoelectron spectroscopy. To understand how the SEI
chemistry measured from the reflectometery data compares with traditional XPS studies
we performed a detailed analysis of previously collected XPS data to estimate layer
thicknesses and compositions. The published XPS data indicates that the SEI chemistry
in the PF5M2 electrolytes were very similar to a standard EC/DMC based electrolyte.
Indeed the SEI was shown to contain LiF and Li2CO3 type components as well as organic
carbonates (C 1s: CO3, 289 eV; O 1s: C=O, 532 eV, and C-O, 533 eV), carboxylates (C
1s: CO2, 289 eV; O 1s: C=O and C-O), ethers/esters (C 1s: CO, 285.5 eV; O 1s: C-O),

127
and fluorides (C 1s: CF, 287 eV; F1s: CF 689 eV) in similar concentrations. For this
work we turned our attention to the Si 2p spectra collected for the samples, which was
not previously discussed in great detail. Given that the XPS probe depth can be can be
used to estimate layer thickness using Eq. 5:
where I(A) is the signal intensity for atom A, F is a prefactor that is determined by the
experimental conditions, σ(A) is the standard sensitivity factor for atom A, Li is the
thickness of layer i (i = 1 for the top layer), λi is the electron inelastic mean free path for
layer i, and Nd,i(A) is the number density (atoms/nm3) for atom A in layer i. The only
source of Si is the electrode and adventitious oxide, so the Si 2p signal (Fig. 9) and Eq. 5
can be used to estimate the SEI (Layer 1) thickness, since Nd(Si) and thickness are known
for those layers. For the as-fabricated electrodes, no Cu signal from the current collector
is detected, so the Si layer (Layer 3) can be treated as infinitely thick. Assuming the
adventitious oxide is SiO2, the oxide layer (Layer 2) thickness can be calculated from the
ratio of the integrated intensity of the SiO2 and Si peak in the Si 2p spectrum. In general,
λ is material dependent; however, most materials have λ = 3.5 ± 1.5 nm.6, 7, 37, 38
There is
no simple method for determining λ for arbitrary materials, so a uniform λ = 3.5 ± 1.5 nm
was assumed for all calculations. X-ray attenuation does occur within the sample;
however, the penetration depth of X-rays in on the order of mm and can be neglected
without the introduction of error for all subsequent calculations.

128
For an accurate determination of the SEI thickness, changes in the thickness and
Nd(Si) of Layers 2 and 3 must be taken into account. Fortunately, the reactions in these
layers are relatively well-defined in the literature and electrochemically well-separated.6,
7, 33, 39 At 0.5 V, the adventitious oxide (Layer 2) undergoes irreversible lithiation (4e
- +
4Li+ + SiO2 → 2LiO2 + Si) and is assumed to form an intimate mixture of LiO2 and Si,
both of which have well-known densities. At lower voltages (<0.3 V) lithiation of the Si
(xe- + xLi
+ + Si → LixSi) in Layers 2 and 3 begins to occur, where Nd(Si) can be
determined from Eq. 2. Based on the NR results, x = 1.56 for 0.2 V, x = 3.75 for 0.07 V,
and x = 0.5 for 2.5 V. Although the differential capacity curves indicate that the electrode
does not reach full lithiation (Li3.75Si) at 0.07 V, assuming full lithiation underestimates
SEI thickness and represents the most conservative estimate and is sufficient for analysis.
The thickness, composition, and Nd(Si) for each layer as a function of SOC are
summarized in Table 2.
Only Layer 1 (SEI) contains information that is not defined a priori for this
analysis so only the properties of that layer can be determined. Ex situ XPS shows that
the SEI forms electrochemically above 0.6 V (4.5 ± 1.9 nm) followed by continued
growth during SiO2 (0.4 V, 5.3 ± 2.3 nm) and Si (0.2 V, 7.9 ± 3.4) lithiation. A Si signal
for the first full lithiation (0.07 V) was not collected, so it is not possible to determine an
SEI thickness for this state; however, given the low reduction stability of the fluorinated
electrolyte,8, 30, 31, 33
it is likely that the thickness of the SEI in this state is greater than in
the 0.2 V state. The SEI then shrinks during delithiation (2.5 V, 6.9 ± 3.0 nm) and swells
during the second lithiation (0.07 V, 12.5 ± 5.4 nm). This is the opposite of the swelling
behavior observed via NR indicating that the washing procedure removes part of the SEI

129
layer chemistry or changes the density of the surface layer by removing parts of the
condensed surface layer. This effect was explicitly studied on highly-oriented pyrolytic
graphite electrodes for a 1.5 M LiTFSI in EC electrolyte with and without additives,
where the removal of SEI components is universally observed.
Fig. 9 Ex situ Si 2p XPS spectra used to calculate SEI thickness using Eq. 5. Spectra
colored to match that of the closest SLD profile determined from NR.
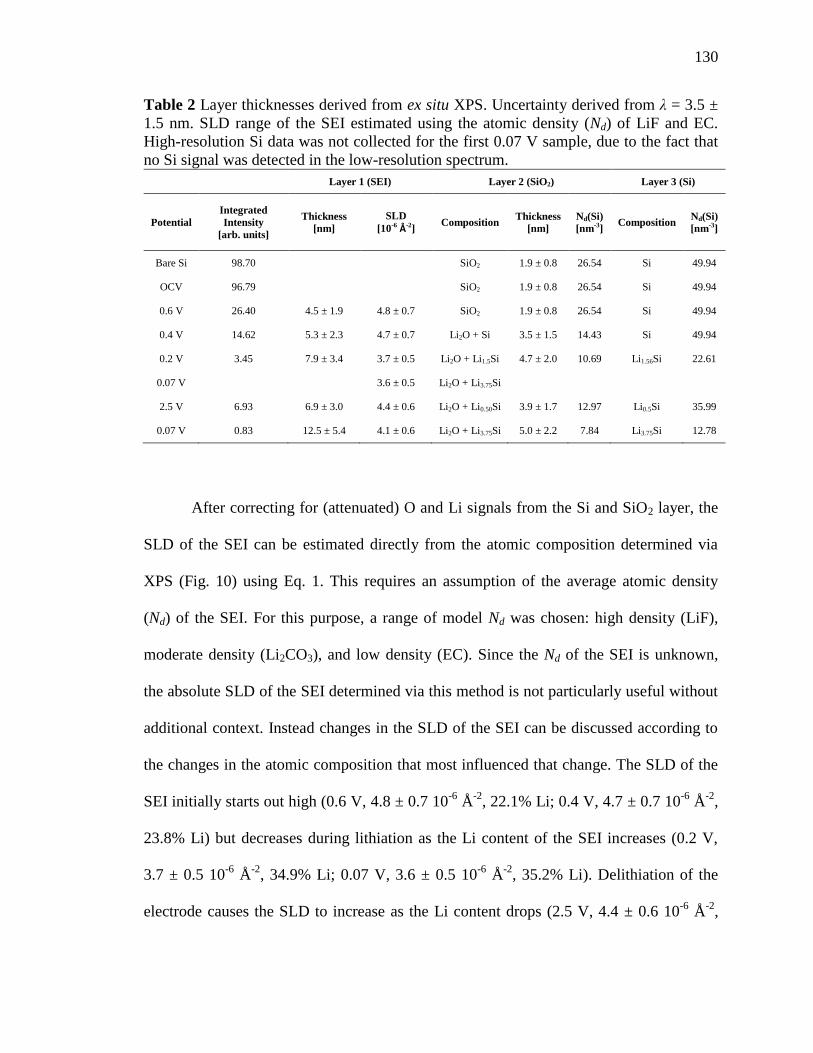
130
Table 2 Layer thicknesses derived from ex situ XPS. Uncertainty derived from λ = 3.5 ±
1.5 nm. SLD range of the SEI estimated using the atomic density (Nd) of LiF and EC.
High-resolution Si data was not collected for the first 0.07 V sample, due to the fact that
no Si signal was detected in the low-resolution spectrum.
Layer 1 (SEI) Layer 2 (SiO2) Layer 3 (Si)
Potential
Integrated
Intensity
[arb. units]
Thickness
[nm]
SLD
[10-6 Å-2] Composition
Thickness
[nm]
Nd(Si)
[nm-3] Composition
Nd(Si)
[nm-3]
Bare Si 98.70
SiO2 1.9 ± 0.8 26.54 Si 49.94
OCV 96.79
SiO2 1.9 ± 0.8 26.54 Si 49.94
0.6 V 26.40 4.5 ± 1.9 4.8 ± 0.7 SiO2 1.9 ± 0.8 26.54 Si 49.94
0.4 V 14.62 5.3 ± 2.3 4.7 ± 0.7 Li2O + Si 3.5 ± 1.5 14.43 Si 49.94
0.2 V 3.45 7.9 ± 3.4 3.7 ± 0.5 Li2O + Li1.5Si 4.7 ± 2.0 10.69 Li1.56Si 22.61
0.07 V
3.6 ± 0.5 Li2O + Li3.75Si
2.5 V 6.93 6.9 ± 3.0 4.4 ± 0.6 Li2O + Li0.50Si 3.9 ± 1.7 12.97 Li0.5Si 35.99
0.07 V 0.83 12.5 ± 5.4 4.1 ± 0.6 Li2O + Li3.75Si 5.0 ± 2.2 7.84 Li3.75Si 12.78
After correcting for (attenuated) O and Li signals from the Si and SiO2 layer, the
SLD of the SEI can be estimated directly from the atomic composition determined via
XPS (Fig. 10) using Eq. 1. This requires an assumption of the average atomic density
(Nd) of the SEI. For this purpose, a range of model Nd was chosen: high density (LiF),
moderate density (Li2CO3), and low density (EC). Since the Nd of the SEI is unknown,
the absolute SLD of the SEI determined via this method is not particularly useful without
additional context. Instead changes in the SLD of the SEI can be discussed according to
the changes in the atomic composition that most influenced that change. The SLD of the
SEI initially starts out high (0.6 V, 4.8 ± 0.7 10-6
Å-2
, 22.1% Li; 0.4 V, 4.7 ± 0.7 10-6
Å-2
,
23.8% Li) but decreases during lithiation as the Li content of the SEI increases (0.2 V,
3.7 ± 0.5 10-6
Å-2
, 34.9% Li; 0.07 V, 3.6 ± 0.5 10-6
Å-2
, 35.2% Li). Delithiation of the
electrode causes the SLD to increase as the Li content drops (2.5 V, 4.4 ± 0.6 10-6
Å-2
,
131
27.2% Li). The SLD then drops again as the Li content increases during lithiation (0.07
V, 4.1 ± 0.6 10-6
Å-2
, 29.8% Li).
Fig. 10 Atomic compositions of the SEI determined from XPS and used to estimate SLD.
The changes in the SLD are simplest to explain in terms of changes in the
concentration of Li salts (LiF, Li2CO3, etc.), which are less likely than organic (C, F, O)
species to be removed during washing. However, all of the atoms composing the SEI
affect its SLD. Changes in both the C (6.65 fm) and Li (-1.90 fm) content of the SEI will
drastically affect the predicted SLD. One of the major changes in SEI composition is the
increase of F and decrease of O with cycling (Fig. 10); however, since F and O have
similar scattering lengths (5.65 fm and 5.80 fm, respectively), this change does not have a
significant effect on the SLD of the SEI. XPS also does not capture the contribution of
hydrogen to the SLD of the SEI, meaning that this method of predicting the SLD of the
SEI will underestimate the SLD of a deuterated SEI and overestimate the SLD of a

132
protiated SEI proportional to the hydrogen content, as D (6.67 fm) and H (-3.74 fm) have
scattering lengths higher and lower than that of any of the other SEI components.
3.5. Ex situ NMR
NMR was carried out on the electrolyte before and after cycling in order to
determine to what extent soluble electrochemical byproducts were formed during cycling.
Lithium perfluoroglutarate (PF5Li2) was previously observed in a cycled electrolyte via
infrared absorption spectroscopy,33
suggesting that electrochemical de-esterification of
the methyl ester takes place, similar to what is seen in the initial stages of SEI formation
in organic carbonates.8
Multinuclear NMR (Fig. 11) of deuterated and protiated electrolytes shows subtle
changes that occur during cycling. Major signals belong to PF5M2 [1H: 1.0 (singlet);
13C:
15.0 (singlet), 109.4 (triplet of triplets), 111.2 (triplet of quintets), 160.2 (multiplet); 19
F: -
125.2 (singlet), 119.6 (singlet)] and TFSI- [
13C: 120.6 (quartet);
19F: -80.8 (singlet)]. The
chemical shift of the CH3 group in the deuterated electrolytes is slightly different than
that of the protiated electrolyte (4.00 ppm vs. 4.04 ppm in 1H and 54.34 (septet) vs. 55.04
ppm (singlet) in 13
C). The deuterated electrolytes have a relatively intense peak at 3.85
ppm in the 1H spectrum which is most likely due to MeOH (CD3OH) formed by
hydrolysis of d6-PF5M2 by trace H2O impurities. The corresponding peak in the protiated
electrolytes is obscured by the 1H-
13C satellite. The signal for the CH3 of MeOH (
1H: 3.6
ppm) appears in the protiated electrolytes but not the deuterated electrolytes, consistent
with the low proportion (<0.6 %) of CHD2 in the deuterated electrolyte.

133
Fig. 11
1H (A),
7Li (B),
13C (C), and
19F (D) NMR spectra of deuterated and protiated
electrolytes before and after cycling. Peaks corresponding to PF5M2 (a-d) and the TFSI-
anion are labeled. Insets in 1H and
19F spectra are 1/1000× scale to show full intensity of
PF5M2 and TFSI- peaks. Signals unique to the cycled (†) and uncycled (‡) electrolytes as
well as signals attributed to volatile species in the epoxy sealant (*) are labeled.
Additional signals are of low intensity (<0.1% of primary peaks), illustrating the
necessity of using neat (no deuterated solvent) electrolytes during analysis in order to
observe impurities and electrochemically-formed compounds. All species unique to
cycled and uncycled electrolytes appear in both protiated and deuterated electrolytes. The
broad peak at 3.7 ppm in the 1H spectrum (Fig. 11A, †) of the cycled, deuterated
134
electrolyte does not show a corresponding intense peak in the protiated electrolyte,
suggesting that this peak may be due to an adventitious 1H source, likely ambient H2O,
whose chemical shift is highly environment-dependent.40, 41
Adventitious sources of H
have 1H signals that are independent of the level of deuteration of the electrolyte, unlike
any hydrogenous species formed from the electrolyte during cycling.
The most significant difference between the cycled and uncycled electrolytes is
the intensity and width of the 7Li signal (Fig. 11B). The changes in peak width for the
protiated (3.1 Hz → 13.3 Hz) and deuterated (3.6 Hz → 8.6 Hz) electrolytes with cycling
is consistent with the formation of PF5Li2, which would reduce symmetry around the
quadrupolar 7Li nuclear, increasing relaxation rate and peak width. The intensity of the
7Li signal increases by 18% for the protiated electrolyte and by 28% for the deuterated
electrolyte. Though it is difficult to integrate the 19
F signals, due to overlap from intense
nearby peaks, the differences in the intensity changes in the 7Li signal are qualitatively
consistent with the differences in intensity of the 19
F peaks (Fig. 11D, †) in the protiated
and deuterated electrolytes. If due solely to electrochemical formation of PF5Li2, a 28%
increase in the 7Li signal (0.1 M) would correspond to the formation of 14 mM PF5Li2.
The appearance of 19
F signals (†) at ~0.003 times the intensity of the primary PF5M2 (5.5
M) peaks at similar chemical shifts is consistent with the formation of PF5Li2. This
observation is further evidence that PF5Li2 is the primary soluble product formed during
electrochemical cycling. It is, however, unclear whether the differences in the 7Li
spectrum between the protiated and deuterated electrolytes are due to slight differences in
the electrochemical discharge conditions, e.g., electrolyte volume and cell resistance, or
chemical differences caused by an isotopic effect, e.g., PF5Li2 solubility.

135
It is difficult to identify the specific species formed during cycling solely from the
chemical shifts in one-dimensional NMR data; though it is clear that only a small number
of species (at relatively low concentrations) are formed. Since all other impurity signals
present in the uncycled electrolyte except for one (Fig. 11D, ‡) are also present in the
cycled electrolyte at roughly the same concentrations, these impurities are most likely
electrochemically inert and do not affect SEI formation or composition. Based on the
above analysis, PF5Li2 is the only soluble species formed during electrochemical cycling.
Using Eq. 3, the SLD of the electrolyte is expected to change from 4.78 × 10⁻⁶
Å-2 to 4.77
after discharging the cell. NR is not sensitive to such a small change in the electrolyte
SLD, so it is assumed to remain constant during cycling. Additionally, this analysis does
not eliminate the possibility of species formed that are soluble in DMC and would be
removed during washing prior to ex situ XPS.
4. Discussion
Fig. 12 compares the thickness and SLD of the SEI as determined via ex situ XPS
(Table 2) and in situ NR (Table 1). XPS suggests that the SEI swells during lithiation and
contracts during delithiation. NR suggests the opposite, and previous in situ NR
measurements using a traditional EC/DMC electrolyte show swelling during delithiation
and contraction during lithiation, in agreement with the NR results shown here.25
XPS
also appears to underestimate the SLD of the SEI when compared to NR. The differences
between the XPS and NR results have three potential causes: (1) the lack of hydrogen
sensitivity in XPS, (2) differences in porosity caused by drying the SEI prior to ex situ

136
analysis, and (3) the removal of SEI components during DMC washing prior to ex situ
analysis.
Fig. 12. SEI thickness and SLD as determined via ex situ XPS (A, C) and in situ NR (B,
D). The black dashed lines in C and D indicate the expected SLD for PF5Li2 at the
atomic density of LiF (upper), Li2CO3 (middle), and EC (lower). The solid red line
indicates the SLD of the electrolyte.

137
It is possible that SLDs calculated from XPS are low due to the insensitivity of
XPS to H, which, in the form of D (6.67 fm), has a higher scattering length than O (5.80
fm), F (5.65 fm), C (6.65 fm), and Li (-1.90 fm). However, the low hydrogen content of
the electrolyte makes this possibility unlikely, and neglecting the hydrogen content fails
to explain the observed differences in SEI thickness.
Another possibility is that SEI porosity, which would be present only in the in situ
cell, is responsible for this discrepancy. Assuming these pores are filled with electrolyte,
only for the lowest model density (Nd(SEI) = Nd(EC)) can physically reasonable values of
porosity be calculated. Reconciling these values would require 40 % to 70 % porosity in
most of the cases to obtain the SLD observed via NR, much higher than previously
observed values. Since this porosity would collapse entirely during drying, prior to
collecting XPS data, the thicknesses determined from NR should be 1.7 to 3.3 times as
thick as that determined via XPS. While these results are not physically impossible, they
are on the extreme edge of plausibility. For the SEI formed at the end of the first
discharge, these values jump to 90 % - 99 % porosity and 10 to 100 swelling. Though a
thickness measurement from XPS is not available for this state, it is highly unlikely that
an SEI of 0.3 nm to 4.1 nm would be observed. Changes in porosity are also unable to
explain why swelling and contracting of the SEI occur during opposite steps when
observed through XPS or NR. For these reasons, it is unlikely that porosity of the SEI
measured in situ is the sole source of the differences between SEI thickness and SLD
measured via XPS or NR.
The third possibility is that rinsing the electrodes prior to XPS, necessary to
remove excess electrolyte, dissolves certain components of the SEI. We tested only for

138
the formation of species which were soluble in PF5M2, in which most Li salts are not
very soluble, and found only small amounts of PF5Li2 (also likely of low solubility). Li
salts and organic monomers that are part of the SEI are likely to be much more soluble in
DMC, leaving only high molecular weight polymers and highly insoluble Li salts, e.g.,
LiF, Li2O, Li2CO3, to be detected after washing. Identification of dissolved species, e.g.,
via NMR of electrode rinse, is made difficult by the low concentration of any extracted
species and their likely similarity to the electrolyte itself, which is a significant
component of the residue on the electrode prior to rinsing. However, since the SLD of the
SEI (4.3 ± 0.1 × 10⁻⁶
Å-2) is lower than the SLD of PF5Li2 at the lowest proposed density
(EC, 4.6 × 10⁻⁶
Å-2), the SEI is more Li-rich than both polymerized PF5M2 and solid
PF5Li2.
NR indicates that the PF5M2 electrolyte forms an SEI that's 32 ± 8 nm thick. This
result is consistent with the generally theorized―albeit broad―range for a typical SEI
thickness of one to hundreds of nm8, 9
and similar to previous NR measurements of the
thickness of the SEI formed in EC/DMC electrolytes.25
Both in situ NR and ex situ XPS
indicate that the SEI swells and contracts during cycling. NR indicates that the SEI
contracts by up to 22% during lithiation and swells during delithiation, slowly
approaching an equilibrium thickness. XPS suggests the opposite, up to 45% contraction
during delithiation and swelling during lithiation. XPS also underestimates the SLD of
the SEI by up to 25% and underestimates the thickness of the SEI by a factor of 3 to 4.
Combining in situ atomic force microscopy and ex situ XPS, Cresce et al. have shown
that the SEI formed in a carbonate electrolyte (1.32 M LiTFSI in EC) on highly oriented
pyrolytic graphite (HOPG) is composed of a hard, primarily inorganic layer on the

139
electrode surface and soft, organic layer on top of that. Rinsing the HOPG electrode after
cycling was shown to remove the soft outer layer of the SEI and leave a layer rich in
inorganic carbonates and fluorides.9 This can explain the differences observed in this
study between ex situ XPS and in situ NR. The inner, thin Li-rich (low SLD) layer is
observed in XPS after washing away the outer, thick organic layer (high SLD) that is
observed in NR.
6. Conclusion
This study provides direct evidence for the contention that rinsing electrodes prior
to ex situ characterization modifies the SEI, leading to potentially fallacious conclusions
about the function, composition, and optimization of SEIs.2, 8, 9, 11, 13, 14, 21, 22, 25
In order to
obtain an accurate description of the SEI it is necessary to characterize it in situ.
Unfortunately, in situ characterizations are difficult to perform, prone to interference, and
often limited in scope. For example, in situ NR requires extremely smooth interfaces and
low-scattering electrolytes, is not reliable in the absence of an accurate and relatively
simple model, and does not provide chemical information. The composition and function
of the SEI is complicated and will require multiple complementary in situ techniques to
fully understand. Recently, strides have been made to develop robust methods for in situ
characterization; however, ex situ characterizations are currently far more common.8
Acknowledgements
Student support and materials for ester synthesis and scattering profiles provided
by the U.S. National Science Foundation under Grant No. DGE-1069091. Student
140
support for the electrochemical, XPS, and ATR-IR studies performed at Oak Ridge
National Laboratory provided by the U.S. Department of Energy, Office of Science,
Office of Workforce Development for Teachers and Scientists, Office of Science
Graduate Student Research (SCGSR) program. The SCGSR program is administered by
the Oak Ridge Institute for Science and Education for the DOE under contract number
DE‐AC05‐06OR23100. The equipment, materials and technical guidance at ORNL was
supported by the Materials Sciences and Engineering Division, Office of Basic Energy
Sciences, U.S. Department of Energy under contract with UT-Battelle, LLC (GMV –
XPS, ATR-IR, electrochemical) and the Fluid Interface Reactions, Structures, and
Transport (FIRST) Center, an Energy Frontier Research Center funded by the U.S.
Department of Energy, Office of Science, Office of Basic Energy Sciences (RLS –
Conductivity, ATR-IR). T.M.F would like to thank Dr. C. Sotiriou-Leventis for help in
formulating the perfluorocarboxylate ester synthesis.

141
References
1. H. Q. Pham, K. M. Nam, E. H. Hwang, Y. G. Kwon, H. M. Jung and S. W. Song,
Journal of the Electrochemical Society, 2014, 161, A2002-A2011.
2. P. Verma, P. Maire and P. Novák, Electrochimica Acta, 2010, 55, 6332-6341.
3. K. C. Klavetter, S. M. Wood, Y.-M. Lin, J. L. Snider, N. C. Davy, A. M. Chockla,
D. K. Romanovicz, B. A. Korgel, J.-W. Lee, A. Heller and C. B. Mullins, Journal
of Power Sources, 2013, 238, 123-136.
4. C. K. Chan, R. Ruffo, S. S. Hong and Y. Cui, Journal of Power Sources, 2009,
189, 1132-1140.
5. X. Chen, X. Li, D. Mei, J. Feng, M. Y. Hu, J. Hu, M. Engelhard, J. Zheng, W. Xu,
J. Xiao, J. Liu and J.-G. Zhang, ChemSusChem, 2014, 7, 549-554.
6. B. Philippe, R. Dedryvère, M. Gorgoi, H. Rensmo, D. Gonbeau and K. Edström,
Chemistry of Materials, 2013, 25, 394-404.
7. B. Philippe, R. Dedryvère, J. Allouche, F. Lindgren, M. Gorgoi, H. Rensmo, D.
Gonbeau and K. Edström, Chemistry of Materials, 2012, 24, 1107-1115.
8. K. Xu, Chem Rev, 2014, 114, 11503-11618.
9. A. v. Cresce, S. M. Russell, D. R. Baker, K. J. Gaskell and K. Xu, Nano Letters,
2014, 14, 1405-1412.
10. O. Dolotko, A. Senyshyn, M. J. Mühlbauer, K. Nikolowski and H. Ehrenberg,
Journal of Power Sources, 2014, 255, 197-203.
11. M. T. McDowell, S. W. Lee, J. T. Harris, B. A. Korgel, C. Wang, W. D. Nix and
Y. Cui, Nano Lett, 2013, 13, 758-764.
12. L. Zhou, M. Leskes, A. J. Ilott, N. M. Trease and C. P. Grey, J Magn Reson,
2013, 234, 44-57.
13. K. Edström and M. Herranen, Journal of The Electrochemical Society, 2000, 147,
3628-3632.
14. P. Novák, D. Goers, L. Hardwick, M. Holzapfel, W. Scheifele, J. Ufheil and A.
Würsig, Journal of Power Sources, 2005, 146, 15-20.
15. M. Bianchini, E. Suard, L. Croguennec and C. Masquelier, The Journal of
Physical Chemistry C, 2014, 118, 25947-25955.
16. I. A. Bobrikov, A. M. Balagurov, C.-W. Hu, C.-H. Lee, T.-Y. Chen, S. Deleg and
D. A. Balagurov, Journal of Power Sources, 2014, 258, 356-364.
17. H. Liu, C. R. Fell, K. An, L. Cai and Y. S. Meng, Journal of Power Sources,
2013, 240, 772-778.
18. M. Roberts, J. J. Biendicho, S. Hull, P. Beran, T. Gustafsson, G. Svensson and K.
Edström, Journal of Power Sources, 2013, 226, 249-255.
19. X.-L. Wang, K. An, L. Cai, Z. Feng, S. E. Nagler, C. Daniel, K. J. Rhodes, A. D.
Stoica, H. D. Skorpenske, C. Liang, W. Zhang, J. Kim, Y. Qi and S. J. Harris, Sci.
Rep., 2012, 2.
20. B. Jerliu, L. Dorrer, E. Huger, G. Borchardt, R. Steitz, U. Geckle, V. Oberst, M.
Bruns, O. Schneider and H. Schmidt, Physical Chemistry Chemical Physics,
2013, 15, 7777-7784.
21. J. E. Owejan, J. P. Owejan, S. C. DeCaluwe and J. A. Dura, Chemistry of
Materials, 2012, 24, 2133-2140.

142
22. M. Hirayama, N. Sonoyama, T. Abe, M. Minoura, M. Ito, D. Mori, A. Yamada,
R. Kanno, T. Terashima, M. Takano, K. Tamura and J. i. Mizuki, Journal of
Power Sources, 2007, 168, 493-500.
23. J. F. Browning, L. Baggetto, K. L. Jungjohann, Y. Wang, W. E. Tenhaeff, J. K.
Keum, D. L. Wood and G. M. Veith, ACS Applied Materials & Interfaces, 2014,
6, 18569-18576.
24. G. M. Veith, L. Baggetto, R. L. Sacci, R. R. Unocic, W. E. Tenhaeff and J. F.
Browning, Chemical Communications, 2014, 50, 3081-3084.
25. G. M. Veith, M. Doucet, J. K. Baldwin, R. L. Sacci, T. M. Fears, Y. Wang and J.
F. Browning, The Journal of Physical Chemistry C, 2015, 119, 20339-20349.
26. A. Nelson, J. Appl. Cryst., 2006, 39, 273-276.
27. T. Heitmann and W. Montfrooij, Practical Neutron Scattering at a Steady State
Source, Mizzou Media - University BookStores, 2012.
28. T. C. Hansen and H. Kohlmann, Zeitschrift für anorganische und allgemeine
Chemie, 2014, 640, 3044-3063.
29. Sigma-Aldrich, https://www.sigmaaldrich.com/united-states.html, (accessed
March 10, 2015).
30. L. Hu, Z. Xue, K. Amine and Z. Zhang, Journal of the Electrochemical Society,
2014, 161, A1777-A1781.
31. Z. Zhang, L. Hu, H. Wu, W. Weng, M. Koh, P. C. Redfern, L. A. Curtiss and K.
Amine, Energy & Environmental Science, 2013, 6, 1806.
32. T. Böttcher, B. Duda, N. Kalinovich, O. Kazakova, M. Ponomarenko, K. Vlasov,
M. Winter and G. V. Röschenthaler, Progress in Solid State Chemistry, 2014, 42,
202-217.
33. T. M. Fears, R. L. Sacci, J. G. Winiarz, H. Kaiser, H. Taub and G. M. Veith,
Journal of Power Sources, 2015, 299, 434-442.
34. V. F. Sears, Neutron News, 1992, 3, 26-37.
35. O. Arnold, J. C. Bilheux, J. M. Borreguero, A. Buts, S. I. Campbell, L. Chapon,
M. Doucet, N. Draper, R. Ferraz Leal, M. A. Gigg, V. E. Lynch, A. Markvardsen,
D. J. Mikkelson, R. L. Mikkelson, R. Miller, K. Palmen, P. Parker, G. Passos, T.
G. Perring, P. F. Peterson, S. Ren, M. A. Reuter, A. T. Savici, J. W. Taylor, R. J.
Taylor, R. Tolchenov, W. Zhou and J. Zikovsky, Nuclear Instruments and
Methods in Physics Research Section A: Accelerators, Spectrometers, Detectors
and Associated Equipment, 2014, 764, 156-166.
36. V. L. Chevrier and J. R. Dahn, Journal of The Electrochemical Society, 2009,
156, A454-A458.
37. S. Tanuma, C. J. Powell and D. R. Penn, Surface and Interface Analysis, 2005,
37, 1-14.
38. S. Tanuma, C. J. Powell and D. R. Penn, Surface and Interface Analysis, 2011,
43, 689-713.
39. P. R. Abel, Y.-M. Lin, H. Celio, A. Heller and C. B. Mullins, ACS Nano, 2012, 6,
2506-2516.
40. H. E. Gottlieb, V. Kotlyar and A. Nudelman, The Journal of Organic Chemistry,
1997, 62, 7512-7515.
41. G. R. Fulmer, A. J. M. Miller, N. H. Sherden, H. E. Gottlieb, A. Nudelman, B. M.
Stoltz, J. E. Bercaw and K. I. Goldberg, Organometallics, 2010, 29, 2176-2179.

143
Electronic Supplementary Material
Contents: Page
Fig. S1 UV-Vis absorption spectra of VOCl3 solutions 144
Table S1 UV-Vis absorption spectra collected during gel aging 145
References 146

144
Fig. S1 High-Q NR data before background subtraction. This data demonstrates the low
background signal of the PF5M2 electrolyte as compared to a deuterated EC/DMC
electrolyte.1
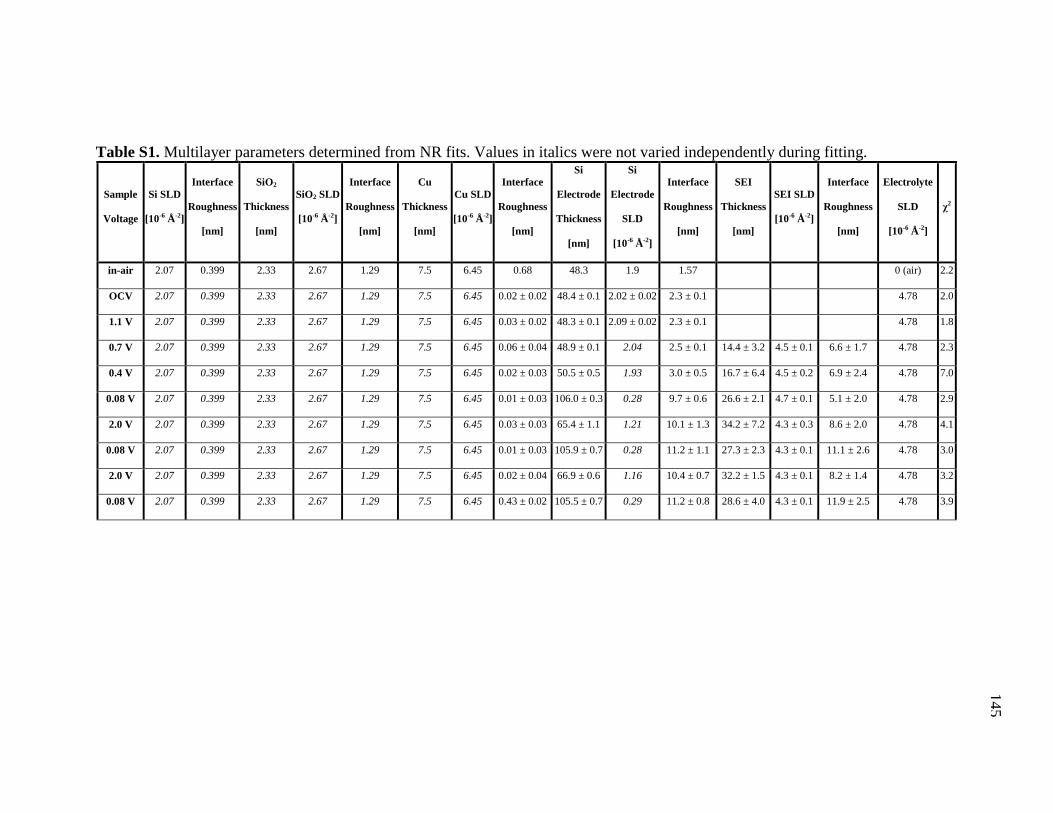
Table S1. Multilayer parameters determined from NR fits. Values in italics were not varied independently during fitting.
Sample
Voltage
Si SLD
[10-6 Å-2]
Interface
Roughness
[nm]
SiO2
Thickness
[nm]
SiO2 SLD
[10-6 Å-2]
Interface
Roughness
[nm]
Cu
Thickness
[nm]
Cu SLD
[10-6 Å-2]
Interface
Roughness
[nm]
Si
Electrode
Thickness
[nm]
Si
Electrode
SLD
[10-6 Å-2]
Interface
Roughness
[nm]
SEI
Thickness
[nm]
SEI SLD
[10-6 Å-2]
Interface
Roughness
[nm]
Electrolyte
SLD
[10-6 Å-2]
χ2
in-air 2.07 0.399 2.33 2.67 1.29 7.5 6.45 0.68 48.3 1.9 1.57
0 (air) 2.2
OCV 2.07 0.399 2.33 2.67 1.29 7.5 6.45 0.02 ± 0.02 48.4 ± 0.1 2.02 ± 0.02 2.3 ± 0.1
4.78 2.0
1.1 V 2.07 0.399 2.33 2.67 1.29 7.5 6.45 0.03 ± 0.02 48.3 ± 0.1 2.09 ± 0.02 2.3 ± 0.1
4.78 1.8
0.7 V 2.07 0.399 2.33 2.67 1.29 7.5 6.45 0.06 ± 0.04 48.9 ± 0.1 2.04 2.5 ± 0.1 14.4 ± 3.2 4.5 ± 0.1 6.6 ± 1.7 4.78 2.3
0.4 V 2.07 0.399 2.33 2.67 1.29 7.5 6.45 0.02 ± 0.03 50.5 ± 0.5 1.93 3.0 ± 0.5 16.7 ± 6.4 4.5 ± 0.2 6.9 ± 2.4 4.78 7.0
0.08 V 2.07 0.399 2.33 2.67 1.29 7.5 6.45 0.01 ± 0.03 106.0 ± 0.3 0.28 9.7 ± 0.6 26.6 ± 2.1 4.7 ± 0.1 5.1 ± 2.0 4.78 2.9
2.0 V 2.07 0.399 2.33 2.67 1.29 7.5 6.45 0.03 ± 0.03 65.4 ± 1.1 1.21 10.1 ± 1.3 34.2 ± 7.2 4.3 ± 0.3 8.6 ± 2.0 4.78 4.1
0.08 V 2.07 0.399 2.33 2.67 1.29 7.5 6.45 0.01 ± 0.03 105.9 ± 0.7 0.28 11.2 ± 1.1 27.3 ± 2.3 4.3 ± 0.1 11.1 ± 2.6 4.78 3.0
2.0 V 2.07 0.399 2.33 2.67 1.29 7.5 6.45 0.02 ± 0.04 66.9 ± 0.6 1.16 10.4 ± 0.7 32.2 ± 1.5 4.3 ± 0.1 8.2 ± 1.4 4.78 3.2
0.08 V 2.07 0.399 2.33 2.67 1.29 7.5 6.45 0.43 ± 0.02 105.5 ± 0.7 0.29 11.2 ± 0.8 28.6 ± 4.0 4.3 ± 0.1 11.9 ± 2.5 4.78 3.9
145

146
References
1. G. M. Veith, M. Doucet, J. K. Baldwin, R. L. Sacci, T. M. Fears, Y. Wang and J.
F. Browning, The Journal of Physical Chemistry C, 2015, 119, 20339-20349.
147
SECTION
2. CONCLUSION
The work included in Paper I and Papers II and III is difficult to reconcile within a
single cohesive theme, indicative of the changes that occur over the course of a 5-year
doctoral career. The project that resulted in Papers II and III (fluorinated neutron-
transparent Li-ion battery electrolytes) arose organically from the project that resulted in
Paper I (sol-gel vanadium oxide) through a series of projects (and funding sources) which
have not yet yielded publishable results.
In the process of characterizing the materials formed in Paper I, one application
stood out as particularly interesting (fundable): high-capacity Li-ion battery cathodes. A
series of novel vanadium oxide and lithium vanadate nanomaterials could be synthesized
in the lab, but structural characterization―especially the ever-desirable in situ
studies―proved difficult. The co-refinement of (common) X-ray and (less-common)
neutron diffraction data represented one promising solution; however, application of
these techniques was more difficult than initially anticipated due to inherent complexity
of both the structure of vanadium oxide systems and diffraction from highly anisotropic
nanomaterials.
The desire to perform in situ studies of battery materials was ever-present and a
functional electrochemical cell for in situ neutron diffraction was sufficiently novel to
pique interest in an exploratory study on alternative neutron-transparent electrolytes.
Unlike solving the structure of three-dimensional anisotropic vanadate nanoparticles, the
synthesis and study of fluorinated, neutron-transparent Li-ion battery electrolytes showed
immediate high-quality results. As such, focus shifted from solving the structure of

148
nanoparticulate vanadate cathode materials to the characterization of fluorinated ester
electrolytes.
This path shows how the two projects included in this thesis, which share little in
terms of subject or technique, arose naturally over the course of investigation.

149
VITA
Tyler Martin Fears was born in St. Charles, Missouri on May 13, 1987. In 2005
he began school at the University of Missouri-Rolla. As an undergraduate he was a
member and officer of the Beta Alpha chapter of the Kappa Alpha Order fraternity. He
also performed undergraduate research under Dr. Jeffrey G. Winiarz where he published
a manuscript as first author. In 2010 he graduated the (now Missouri University of
Science in Technology) with Bachelors of Science in Physics and in Chemistry.
In 2011, Tyler joined Dr. Winiarz's group as a Doctoral Student in Chemistry. He
worked on the synthesis of transition metal aerogels under the purview of Dr. Nicholas
Leventis. In 2013, he recieved a National Science Foundation Integrative Graduate
Education and Research Traineeship (IGERT) to learn and apply neutron scattering to his
research under Drs. Helmut Kaiser and Haskell Taub at the University of Missouri. In
2015, he recieved a Department of Energy Office of Science Graduate Student Research
(SCGSR) fellowship to study solid-electrolyte interphases under Dr. Gabriel Veith at Oak
Ridge National Laboratory.
Tyler successfully defended this doctoral thesis on August 14, 2015. In
December, 2015, he received his Doctorate of Philosophy in Chemistry from the
Missouri University of Science and Technology.
Top Related