


Languages
Pages
Legal


Sustainable management of dipterocarp forests in the Philippines
by
Mariya Chechina
A thesis submitted in partial fulfillment of the requirements for the degree of
Doctor of Philosophy
in
Forest Biology and Management
Department of Renewable Resources University of Alberta
© Mariya Chechina, 2015

ii
Abstract
Southeast Asian dipterocarp forests are highly diverse tropical forest communities, with the
family Dipterocarpaceae alone comprising hundreds of species. Dipterocarps are remarkable in
that they exhibit supra-annual mass flowering events, which occur in irregular intervals of two to
ten years, normally involving several dipterocarp species and sometimes including many other
plant families as well, a phenomenon known as general flowering event. Dipterocarps are a
leading species group on 85% of Southeast Asia’s forested land base and they are also
commercially important, representing a quarter of global consumption of tropical timbers.
Southeast Asia’s dipterocarp forests are also one of the most threatened tropical ecosystems in
the world. Only 16% of the total original forested area remains classified as primary forest in
Southeast Asia and less than 6% in the Philippines, which is a focus of this thesis. The overall
objective of this thesis is to support and improve reforestation and community forestry initiatives
in dipterocarp forests by contributing ecological insight and compiling local community
knowledge, and by addressing major impediments to successful forest restoration in Southeast
Asia.
The first issue is the biology of dipterocarp reproduction that makes it hard to manage natural
regeneration as well as reforestation. It is logistically difficult to mobilize resources to collect
short lived dipterocarp seed without knowing in advance when flowering will occur. This thesis
research investigates what environmental factors drive dipterocarp mass flowering and tests
alternative resource accumulation and trigger models to predict mass flowering. Using a variety

iii
of candidate predictor variables (precipitation, cloud cover, minimum temperature and El Niño
indices) a plausible environmental trigger could not be found (median AUCs around 0.55
indicating near random predictions), while the best resource accumulation model had a median
AUC of 0.70, which could be improved to 0.75 when the date of previous flowering was
included in the model. Further, the analysis revealed that a simple resource accumulation by
individual trees can cause inter- and intraspecific flowering synchronization leading to
community-wide general flowering events.
The second issue is a lack of knowledge of which dipterocarps and which other native species
are suitable for reforestation. Community based forest management programs typically use
readily available exotic species that may not be desired by the local communities. Choosing
species for reforestation programs or community forestry in species-rich tropical rainforest
ecosystems is a complex task. Reforestation objectives, social preferences, and ecological
attributes must be balanced to achieve landscape restoration, timber production, or community
forestry objectives. In a case study for an upland tropical rainforest in the Philippines,
socioeconomic preference in five forest-dependent communities were surveyed. In addition,
ecological suitability of tree species for open-field plantations was inferred from growth rates,
density and frequency of native tree species in long-term monitoring plots. Notably, ecological
suitability indicators and socioeconomic preference ranks were generally negatively correlated,
with few species being classified as both ecologically suitable and socioeconomically valuable.
The results also highlight that reforestation species must be carefully chosen, and that species-
rich tropical rainforests are not an easily renewable natural resource. Secondary and planted

iv
forests do not serve socioeconomic needs of forest-dependent communities as do original native
forests.
Finally, many communities rely on forests to supplement their livelihoods but these resources
become increasingly limited because of deforestation. There is a need to protect the remaining
dipterocarp forests for their ecological functions without restricting community use of natural
resources and increasing poverty rates. A case study for the North Negros Natural Park
investigates how land use, land use planning, and protected area management affects
communities in and around a major forest reserve in the Negros Island in the Philippines. The
analysis is first carried out at the provincial level using secondary socioeconomic data derived
from government statistics. The second analysis was conducted at a local scale, where the
socioeconomic status of communities close to a protected forest was compared to more distant
communities. Generally, resources are more abundant in areas close to protected areas where
population densities are low. While rural communities have fewer amenities and infrastructure
than urban centers, communities close to a protected forest where non-destructive activities are
allowed were better-off than other rural communities farther from protected areas.
v
Preface
Thesis chapter 2 has been submitted to a peer-reviewed journal under a title “Climatic drivers of
dipterocarp mass flowering in Southeast Asia”, authored by Mariya Chechina and Andreas
Hamann. The study was conceived and designed by AH and MC. Data on flowering and fruiting
was gathered and analyzed by MC with contribution of analysis tools and climate data by AH.
First draft and revisions were conducted by MC and AH.
Thesis chapter 3 has been accepted for publication in the peer-reviewed journal Ecosphere under
a title “Choosing species for reforestation in diverse forest communities: social preference versus
ecological suitability”, authored by Mariya Chechina and Andreas Hamann. The study was
conceived and designed by AH and MC. Data from forest plots was gathered by AH (1995 and
2003) and Mariya Chechina (2012). Interview data was gathered by MC. MC performed the
analysis and wrote the paper with revisions by AH. The fieldwork was conducted under a
wildlife gratuitous permit no. R6-2012-10 through Philippine Biodiversity Conservation Project
issued by the Department of Environment and Natural Resources in Iloilo City, on June 20, 2012
and expired in June, 20, 2013. The ethics approval (Pro00027508) for the questionnaire was
obtained through the Human Research Ethics Review process at the University of Alberta Ethics
Board, valid from February 28, 2012 to February 28, 2013.
Chapter 4 has been submitted to a peer-reviewed journal under the title “Effects of land use and
protected area management on socioeconomic conditions of forest dependent communities: a
case study in the North Negros Natural Park, Philippines”, authored by Mariya Chechina, John
R. Parkins, and Andreas Hamann. The study was conceived and designed by MC, JRP and AH.
MC collected interview and census data, performed the analysis, and wrote the paper, with
revisions from JRP and AH. The ethics approval (Pro00027508) for the questionnaire was
obtained through the Human Research Ethics Review process at the University of Alberta Ethics
Board, valid from February 28, 2012 to February 28, 2013.

vi
Dedication
To my sister, Olya, who always believed in me
To Denali Sylvain
To the people of Patag

vii
Acknowledgements
The completion of this PhD thesis would not have been possible without support and
involvement of many people, which I am very thankful for.
I am grateful to the Canadian Natural Sciences and Engineering Research Council (NSERC) for
providing the Discovery Grant from the Government of Canada which made this research
possible. I am grateful to Graduate Student Association for providing a Professional
Development Grant, Faculty of Graduate Studies and Research for providing a Travel Grant,
Government of Alberta for providing the Queen Elizabeth II graduate scholarship and Max
MacLaggan foundation for their financial support.
My biggest gratitude is to my supervisor, Dr. Andreas Hamann, for his guidance and knowledge.
Thank you for introducing me to statistical analysis. Thank you also for giving me the
opportunity to conduct research in such an amazing place as the North Negros Natural Park. The
fieldwork in the forest provided me with research tools but also with incredible life experience. I
also appreciate the balance with which you provided me guidance and support when I needed
and giving me independence to lead exploration into new topics. You gave me the tools needed
to pursue scientific work and the confidence to ask the right questions.
My gratitude goes also to Dr. John R. Parkins for his guidance on interview and census data
collection and analysis for the third research chapter. Thank you for giving me confidence to
explore socioeconomic research. I would also like to thank the members of my advisory
committee, Dr. Debra Davidson and Dr. Scott Nielsen for all of their insightful suggestions and
comments, which have helped guide this research.
I would like to thank Christia (Ching) Ledesma from the Silay City Environment Natural
Resources office for facilitating forest plot data collection. Ching, thank you also for taking me
with your group on an expedition to the interior of the North Negros Natural Park that left

viii
unforgettable memories. I would like to thank the members of Silay City forest guards,
particularly Danilo (Boy) Desoyo, Ricky Marquez, Dennis Castillon, Roberto Parrenas, and
Norberto Punzalan, for their knowledge of native species and forests that proved critical to data
collection efforts. In particular I would like to thank Boy for taking such a good care of me
during our stays in the forest, for memorable evenings around a campfire, and for making me
feel as part of your family. Thank you to Ricky and Dennis for lifting group spirits on rainy days
with your sunny personalities. I am thankful to Mari Kurata of the Ikaw Ako foundation for
facilitating with interview data collection. I would like to thank Maria Lourdes (Mai Mai)
Severino Conlu for providing help with questionnaire translation and with census data collection.
I thank Romela (Apple) Golez for your help in census data collection. Mai Mai, thank you also
for your friendship and for making me feel at home in Silay City. Thank you to my husband,
Yannick Neveux, for sharing this unbelievable experience with me in the field, for helping me
find the forest plots, for making me feel confident with work in the forest, and for many hours
spent discussing the research and editing the thesis. Thank you for always believing in me. I
would be lost without you. Finally, thank you to my family that supported me through this
endeavor by believing and me and by being proud of me even when I was in doubt. It gave me
incredible confidence and a drive to continue.
ix
Table of Contents
Chapter 1 - Introduction and literature review ......................................................................... 1
1.1. Dipterocarp forests of Southeast Asia ................................................................................. 1
1.2. Deforestation of dipterocarp forests .................................................................................... 3
1.3. Reforestation initiatives ....................................................................................................... 4
1.4. Forest dependent communities ............................................................................................ 6
1.5. Research objectives and thesis structure .............................................................................. 7
1.6. Literature cited ................................................................................................................... 10
Chapter 2 - Climatic drivers of dipterocarp mass flowering in Southeast Asia ................... 15
2.1. Summary ............................................................................................................................ 15
2.2. Introduction ........................................................................................................................ 15
2.3. Materials and methods ....................................................................................................... 19
2.3.1. Phenology data ............................................................................................................ 19
2.3.2. Climate data ................................................................................................................ 20
2.3.3. Environmental trigger model ...................................................................................... 21
2.3.4. Resource accumulation model .................................................................................... 22
2.3.5. Flowering synchronization model ............................................................................... 24
2.4. Results ................................................................................................................................ 24
2.4.1. Regional climatology and flowering ........................................................................... 24
2.4.2. Trigger model versus tracking model ......................................................................... 26
2.4.3. Intra- and interspecies synchronization....................................................................... 27
2.5. Discussion .......................................................................................................................... 28
2.6. Literature cited ................................................................................................................... 31
Chapter 3 - Choosing species for reforestation in diverse forest communities: social
preference versus ecological suitability ............................................................................. 41
3.1. Summary ............................................................................................................................ 41
3.2. Introduction ........................................................................................................................ 42
3.3. Materials and methods ....................................................................................................... 45

x
3.3.1. Study site and ecological data ..................................................................................... 45
3.3.2. Survey of social preferences ....................................................................................... 47
3.3.3. Statistical analysis of plot data .................................................................................... 48
3.4. Results ................................................................................................................................ 50
3.4.1. Characteristics of experimental plots .......................................................................... 50
3.4.2. Successional syndromes of tree species ...................................................................... 51
3.4.3. Socioeconomic importance of tree species ................................................................. 52
3.5. Discussion .......................................................................................................................... 53
3.5.1. Social preference versus ecological suitability ........................................................... 53
3.5.2. Native forests are not easily renewable ....................................................................... 55
3.5.3. Reforestation compromises are necessary .................................................................. 56
3.5.4. General guidelines for species selection ..................................................................... 57
3.6. Literature cited ................................................................................................................... 59
Chapter 4 - Effects of land use and protected area management on socioeconomic
conditions of forest dependent communities: a case study in the North Negros Natural
Park, Philippines ................................................................................................................. 70
4.1. Summary ............................................................................................................................ 70
4.2. Introduction ........................................................................................................................ 70
4.3. Materials and methods ....................................................................................................... 74
4.3.1. Study region and area .................................................................................................. 74
4.3.2. Planned land use and actual land cover data ............................................................... 75
4.3.3. Socioeconomic data .................................................................................................... 77
4.3.4. Interview data .............................................................................................................. 79
4.4. Results ................................................................................................................................ 80
4.4.1. Land use plan and actual land cover ........................................................................... 80
4.4.2. Municipal-level socioeconomic analysis .................................................................... 80
4.4.3. Barangay-level socioeconomic analysis ..................................................................... 81
4.4.4. Socioeconomic characteristics of a forest dependent community based on interviews
............................................................................................................................................... 82
4.5. Discussion .......................................................................................................................... 83

xi
4.5.1. Protected areas in Negros Occidental are not poverty traps ....................................... 83
4.5.2. Guidelines for using secondary socioeconomic data to assess well-being in protected
areas ...................................................................................................................................... 86
4.6. Literature cited ................................................................................................................... 87
Chapter 5 - Conclusions ............................................................................................................. 99
Thesis Bibliography .................................................................................................................. 104
Appendix A - Flowering and fruiting data from dipterocarp forests in several long-term
ecological monitoring plots and regions in Southeast Asia. See notes and references
corresponding to the numbers in the table heading below .................................................. 116
Appendix B - R program to simulate an extended resource tracking model with more parameters
than the basic model used for evaluation of a resource tracking mechanism to trigger mass
flowering .............................................................................................................................. 118
Appendix C - R program to simulate a multi-species extended resource tracking model with
more parameters than the basic model used for evaluation of a resource tracking mechanism
to trigger mass flowering ..................................................................................................... 119
Appendix D - Local uses of native tree species in the North Negros Natural Park. The table
summarizes complete data from the questionnaires with 47 forest guards that listed species
of socioeconomic and importance and their uses ................................................................ 120

xii
List of Tables
Table 2-1. Dipterocarp flowering and fruiting. This data are for the long-term ecological
monitoring plots in Peninsular Malaysia (Pas), central Kalimantan (BU), West Kalimantan
(GPNP), Sarawak (LH), North Sumatra (Keta) and regions (Kal, Sar, WPM, EPM, WB,
EB) in Southeast Asia describing time period, data type, primary flowering times (although
flowering may occur in April and September) and references of data origin. For sites with
seed data and September flowering times (GPNP, Kal, WB), flowering was assumed to
occur a year prior. ................................................................................................................. 35
Table 2-2. AUC values for the trigger model and the resource tracking model of mass flowering.
Predictor variables are the coldest monthly minimum temperature (Mmin), coldest daily
minimum temperature (Dmin), and El Niño index (NINO3) and precipitation (Prec). The
model version with reset (R) of the resource to zero after an observed flowering event
indicates the potential predictive accuracy for management applications. Refer to Table 2-1
for the explanation of sites and regions. ............................................................................... 36
Table 3-1. Local uses of native tree species in the North Negros Natural Park. The table
summarizes selected data from the questionnaires with 47 forest guards that listed species of
socioeconomic importance and their uses. The uses are grouped into lumber/construction
(Lum), varnish/resin (Var), charcoal/firewood (Cha), edible products (Food), ecological-
food for animals (Eco), medicine (Med). The summary includes sum of total uses for each
species (Tot), number of respondents that mention this species (N) and rank that combines
the number of uses and the number of respondents. Local names could refer to several
related species (reflected by multiple codes), although only one primary species name is
given. Refer to Appendix D for a full list of local species uses. ........................................... 65
Table 4-1. Planned land use versus actual land cover for Negros Occidental. Refer to Fig. 4-2 for
planned land use and actual land cover in Negros Occidental. Planned land use was derived
from the Negros Occidental Social and Economic Trends 2009 report (PPDO 2011). Actual
xiii
land cover classes were derived from 300 meter resolution Envisat MERIS remotely sensed
data (Arino et al. 2012). See the methods section on land cover extraction and
modifications. ........................................................................................................................ 92
Table 4-2. Correlation analysis between socioeconomic indicators and actual land cover in
Negros Occidental. Spearman rank correlation coefficient and p-value are given for the
actual land cover (Fig. 4-2, right) for each municipality (n=32) in Negros Occidental and
socioeconomic indicators (see Fig 4-3 for visualization of correlations). The significance of
the correlation was adjusted for multiple inferences using the Holm method within land
cover groups. ......................................................................................................................... 93
Table 4-3. Comparison of actual land use in barangays located the North Negros Natural Park
and the ones outside the protected forest area. The mean and standard error (se) are given
for rural barangays that are partially or fully located within a protected forest area (protected
area, Fig. 4-2), all other rural barangays outside of protected area (other rural) and urban
barangays (Goslee and Urban). ............................................................................................. 94
Table 4-4. Comparison of socioeconomic indicators of barangays located the North Negros
Natural Park and the ones outside the protected forest area. The mean and standard error
(se) are given for rural barangays that are partially or fully located within a protected forest
area (protected area, Fig. 4-2), all other rural barangays outside of protected area (other
rural) and urban barangays (Goslee and Urban). Permutational analysis of variance was
performed for the three groups of barangays and followed up with pair-wise Wilcoxon rank
sum tests to identify significant differences between socioeconomic indicators (marked with
different letters). The significance of the tests was adjusted for multiple inferences using the
Holm method. ....................................................................................................................... 95

xiv
List of Figures
Figure 2-1. Effects of El Niño and La Niña on regional climate in Southeast Asia. The map
shows long-term ecological monitoring plots and regions corresponding to data sources.
Climate diagrams are for the 1950-2002 period with El Niño years in 1953, 1965, 1969,
1972, 1977, 1982-83, 1987, 1991-1994, 1997, 2002 and La Niña years in1950, 1955-56,
1962, 1964, 1971, 1973-75, 1988-89, 1996, 1999, 2000. ..................................................... 37
Figure 2-2. El Niño Southern Oscillation and dipterocarp flowering events. The raw data and
source references are provided in Appendix A. .................................................................... 38
Figure 2-3. Trigger and resource tracking model predictions of dipterocarp mass flowering. For
illustrating the resource tracking model, we plot monthly probabilities of flowering based on
a resource accumulation mechanism that uses the NINO3 index as a proxy for resource
availability. For illustrating the trigger model, we plot yearly probabilities based on daily
minimum temperature preceding the flowering event (only one value is calculated based on
the lowest daily temperature value in the preceding 6-9 month period). .............................. 39
Figure 2-4. Resource tracking as explanation for intra- and interspecific synchronization of
flowering. Synchronization of individuals of one species with a lower (a) and higher (b)
flowering threshold relative to the anomaly, and interspecific synchronization of species (c)
with different flowering thresholds. (The model parameters are resource baseline (rb),
anomaly size (as), and anomaly interval (ai) and flowering threshold (ft), flowering
threshold (ftv), and number of species (ns). (See Appendix B & C for details). .................. 40
Figure 3-1. Map of the study area located within the North Negros Natural Park on Negros Island
in the Philippines. The questionnaires were collected from local stakeholders that live in the
communities around the park. ............................................................................................... 66
Figure 3-2. Tree size, density and diversity of trees with a diameter at breast height larger than
10 cm from the early, mid and late-successional study plots in the North Negros Natural

xv
Park. The graph shows the change in basal area, density and species diversity over a period
of 18 years from three surveys. ............................................................................................. 67
Figure 3-3. Ordination of tree species by similarity in frequency and growth rate in early (E), mid
(M) and late-successional (L) study plots. The size of dots represents seed size (which was
not used in the ordination), except when data was not available (gray dots). Dimension 1 of
the non-metric multidimensional scaling (NMDS) procedure separates early successional
species on the right from late-successional species on the left. Dimension 2 further separates
putatively mid-successional species (high values) from late-successional species. ............. 68
Figure 3-4. Scatter plot of native species ranked by socioeconomic importance (x-axis) and
inferred ecological suitability for open field plantation (y-axis). The trend line and r-value
exclude the outliers (A.phi and S.con). However, the relationship remains statistically
significant and moderately strong (r = -0.41, outliers included or r=-0.51, outliers excluded).
............................................................................................................................................... 69
Figure 4-1. Municipalities and barnagays (villages) selected for analysis in this study. Thirty two
municipalities of Negros Occidental, the northwestern part of Negros island were
investigated (municipal boundaries are outlined in black). More detailed data was collected
for 285 barangays of Northern Negros (shaded in gray), that surround North Negros Natural
Park and Mt. Kanlaon Natural Park. ..................................................................................... 96
Figure 4-2. Planned land use (left) versus actual land cover (right) for the province of Negros
Occidental, Philippines. The land use plan is according to the Negros Occidental Social and
Economic Trends Report 2009 (PPDO 2011) and land cover was determined from 300m
resolution Envisat MERIS remote sensing data (Arino et al. 2012) ..................................... 97
Figure 4-3. Correlation analysis between socioeconomic indicators and remotely sensed land
cover percent across all municipalities of Negros Occidental (32 municipalities). Positive
Spearman rank correlation coefficients indicate positive associations between land cover
and socioeconomic indicators. .............................................................................................. 98
1
Chapter 1 - Introduction and literature review
1.1. Dipterocarp forests of Southeast Asia
The family Dipterocarpaceae is the dominant forest type in Southeast Asia. Dipterocarp family
contains 16 genera and 580 species that are found in Southeast Asia, 3 genera with 50 species are
found in Africa and 1 genera containing 1 species in South America (Appanah et al. 1998). The
Philippines ranks fourth in Southeast Asian dipterocarp species diversity with 65 species
(Langenberger 2006), after Borneo (267 spp.), Peninsular Malaysia (155 spp.) and Sumatra (106
spp.). Dipterocarp forest is the most extensive type accounting for 85-90% of standing timber
(Rojo 1993). More than 65 % of all tree species present in the Philippines are endemic
(Langenberger 2006). Besides being used for their hardwood, dipterocarps also provide many
non-timber uses from their seeds. Species of the Shorea genus produce seed kernels that are used
for their fat as food by the locals or for export to be used in cosmetics and creams (Blicher-
Mathiesen 1994). As a result, deforestation in Southeast Asia is attributed to the loss of
dipterocarp forests; impacting local communities, national economies, and creating the need for
reforestation and restoration of this ecosystem (FAO 2003). Dipterocarp timber, marketed as
“Philippine Mahogany” comprised approximately three quarters of world trade in tropical
timbers in first half of the 20th century (Kummer and Turner 1994) until the resource was
virtually exhausted for economic purposes around the mid-80s and harvesting pressure shifted to
neighboring Southeast Asian countries.
Dipterocarp forests in Asia usually occur in the lowlands ranging from 0 to 1200 meters in
elevation and occupy the emergent stratum, although they are also found in the understory
(Ashton 1988). They grow on different soil types but thrive on poor stony soils (Smitinand et al.
2
1980). Higher species richness of dipterocarps is found in the wet aseasonal tropical regions
(Appanah 1985). Dipterocarps mainly occupy mature stages of primary forest and can also
colonize secondary forests (Appanah et al. 1998). Dipterocarps rely on variety of pollinators for
fertilization (Ashton 1988, Ashton et al. 1988) as they exhibit high outcross rate and high
abortion rates of fruits that are self-fertilized (Ghazoul 1997).
Dipterocarps in the aseasonal regions flower in a highly synchronized manner every two to ten
years, usually without a common interspecific pattern (Ashton 1988). These mass flowering
events can occur over large areas and involve many species of dipterocarps and trees from
related families (Ashton 1988, Appanah 1993). This phenomenon is particular to the aseasonal
tropics of Southeast Asia and has not been recorded to occur in African or South American
tropics (Appanah 1985). The mass flowering events require a lot of energy to produce big fruits
in large quantities. As a result, tree growth is suspended substantially during mass flowering
years (Ashton 1988). Mass flowering, even though energy intensive, serves a purpose of
escaping seed predation by i) limiting predator abundance with non-flowering years and ii)
saturating food source for predators during mass flowering and fruiting (Curran and Leighton
2000).
While the evolutionary purpose of mass flowering is well understood, the mechanism by which
the flowering becomes synchronized is not entirely clear. For localized events, plant chemical
signaling could provide a cue (Holopainen and Blande 2012), but would not explain general
flowering that happen synchronously in different regions. Many studies focus on examining
intreannual climatic cues (Ashton et al. 1988) point to different cues in different regions (Numata
et al. 2003). The mass flowering phenomenon of dipterocarp forests makes them hard to manage.
From a management perspective, unpredictable flowering patterns make natural regeneration of
dipterocarps forests after harvest difficult. In additional, dipterocarps produce recalcitrant seeds
3
that germinate within days after fruit fall occurs and the seeds cannot survive in cold-storage for
more than a few weeks, adding to the logistical difficulties of reforestation with dipterocarps
(Kettle et al. 2010, Kettle et al. 2011). Predicting mass flowering events could provide invaluable
information to forest managers.
1.2. Deforestation of dipterocarp forests
Southeast Asia’s dipterocarp forests are one of the most threatened tropical ecosystems in the
world. In 2005, only 37% of total original primary forested area remained classified as forest
cover in Southeast Asia, followed by Central America and Central Africa with 45%, and the
Amazon basin with 56% forest cover remaining (FAO 2005). Primary forests are most
threatened in Southeast Asia and Central America with 16% and 18% original forest cover
remaining intact, respectively (FAO 2005). In more recent years, deforestation rates remain
unsustainable with 1.2%/year of net forest loss between 1990 and 2005 in Central America,
0.7%/year net forest loss in Southeast Asia, and 0.5% per year in Central Africa (FAO 2005). As
of 2005, several countries in Southeast Asia, for example the Philippines, Vietnam, Laos, and
Cambodia, had less than 6% primary forest cover (FAO 2005). In these countries, land
degradation, erosion, water supply concerns, and landslides have often become common
problems (Sidle et al. 2006). According to another study, tropical forest ecosystems experienced
a loss to gain ratio of 3.6 for the 2000-2012 period as compared to 1.6 loss to gain in temperate
regions for the same period (Hansen et al. 2013). Within major geographic regions, countries
with high accessibility to forests and high population densities have little primary forest left,
often limited to mountainous regions.

4
Logging operations created roads and opened access to the valuable forest areas that are quickly
converted to agriculture or other uses (Liu et al. 1993, Kummer and Turner 1994, Saastamoinen
1996). Old growth forests are important ecologically as they are high in biodiversity (Noss 1999)
and form storage stocks for carbon (Luyssaert et al. 2008, Lewis et al. 2009). Increased
deforestation also contributes to an increased number and magnitude of humanitarian disasters as
cleared land in combination with frequent typhoons has been shown to result in massive
landslides and flash floods (Vitug 1993). These disasters would not be so severe if the
surrounding hills have sufficient forest cover that would have prevented massive landslides
(Vitug 1993). In developing countries, such as the Philippines, the combination of resource
accessibility, foreign corporations providing logging technology and a corrupt regime that pays
political cronies with timber clearing licenses created conditions for large scale deforestation
with little efforts for reforestation (Bautista 1990, Kummer 1992a, Kummer and Turner 1994,
Broad 1995, Bankoff 2007).
1.3. Reforestation initiatives
The reforestation opportunities in Southeast Asia are typically on sites of marginal or abandoned
farmlands with high level of degradation where growing of dipterocarp and other indigenous tree
species can be difficult (Tolentino 2008). In many cases degraded sites are invaded by cogon
grass (Imperata cylindrica), quickly taking over disturbed areas and making it almost impossible
for anything else to grow. Cogon grasslands are extremely prone to fire, preventing natural
establishment and succession of native species (Ainuddin 2010). In such places many programs
focus on planting fast growing exotic species. The exotic species are often preferred because of
their high yields and tolerance to a variety of stresses, available superior germplasm for planting,
and widespread research and development of propagation (Cruz 2001). However, exotic species

5
may be prone to diseases and pests and they out-compete native species for moisture and
nutrients (Hooper 2002). Further, exotic trees do not support the native fauna, which comprises
many endangered species (Wingfield et al. 2001b).
Natural forest regeneration of degraded forest lands is possible but depends on ecological
constraints and ecosystem resilience. Degraded forest land after excessive logging operation is
able to regenerate if the area is not suitable for agriculture with low soil fertility and high pest
and weed density, but containing a nearby forest to supply seed stock (Fujisaka 1991). Other
programs focus on assisted natural regeneration that involve sites of medium degradation and use
techniques that control fire, restrict grazing, and involving local communities in forest
management. This provides an inexpensive way of allowing natural regeneration of the forest
(FAO 2003). There are programs that focus on reforestation of severely degraded sites with
indigenous species (Cruz 2001, Tolentino 2008). Many such projects have been unsuccessful in
the past since they were using native species that are economically important but turn out to be
late-successional and unable to grow on denuded sites. Late-successional trees need certain
degree of shade for survival (Tolentino 2008). Projects that experiment with establishing
successional analogs, where pioneer species are first planted and then mid and late-successional
species are introduced to re-create natural forest regeneration have had success with
reestablishing of native species (Goltenboth 2004, Langenberger 2005). Other studies focus on
provenance trails to select species that can survive on denuded sites (Butterfield 1996, Hooper
2002). More studies are needed on site specific indigenous tree species matching to find early-
successional tree species that can create initial canopy cover for the economically important late-
successional species (Tolentino 2008).
6
1.4. Forest dependent communities
Deforestation has had a drastic negative impact on the rural poor. In many Southeast Asian
countries, the welfare of rural communities is dependent on natural resources (McElwee 2008).
For example, in the Philippines more than 30% of the population is living below poverty rates,
most of them in rural places where they depend on natural resources to enhance their livelihoods
(IFAD 2011) as exploitation of natural resources is seen as the only way for survival. When the
resources are abundant they bring about increase in economic and human development at first,
but with further deforestation, the benefits diminish and the municipalities which have exhausted
their resources are worse off than the ones that are more conservative (Rodrigues 2009).
Additionally, there is often a conflict between the needs of the rural population and national
government agenda of profiting from logging (McAllister 2007). This situation is further
worsened by weak formal institutions and the inability to enforce sustainable practices. As a
result, this leads to unfair distribution of profits, lack of consideration of long-term ecological
impacts of logging, or the sustainability of the industry (McAllister 2007). Studies show that
areas where forests have been cleared are worse off in terms of human development (measured
by literacy, human development index, standard of living, and life expectancy) (Okello et al.
2009).
In the recent years many developing countries focus on community based forestry programs that
involve local people in managing the forests for commercial and non-commercial purposes
including subsistence timber production, wild life conservation, and cultural significant of forest
preservation (Johnson 1999). However, the governments retain most of the control of natural
resources in community based forest management system (Gauld 2000, Dressler et al. 2006).
Many of the benefits are known to go to community elites as participation is usually poor and

7
decisions are made by the select few as the designed programs do not take into account historic
or ancestral ties leading to weak community involvement (Okello et al. 2009). Studies show that
seemingly homogenous regions contain diversity among the villages and hence different
reactions to the projects which requires flexibility in the programs and in-depth analysis of
socioeconomic factors to draw appropriate incentives (Walters et al. 1999). Better understanding
of socioeconomic conditions of rural communities can lead to better management of deforested
and protected areas and result in designing reforestation activities that are inclusive, introduce
appropriate livelihood options and designing equitable land tenure (Okello et al. 2009).
1.5. Research objectives and thesis structure
The overall objective of this PhD research is to support and improve reforestation initiatives in
dipterocarp forests through ecological and local knowledge by addressing major impediments to
successful forest restoration in Southeast Asia. The first issue is the biology of dipterocarp
reproduction that makes it hard to manage regeneration. It is logistically difficult to mobilize
resources to collect short lived dipterocarp seed on short notice without knowing in advance
when flowering will occur. Second, knowledge is lacking which native species in Southeast
Asia’s dipterocarp forests can be used in reforestation. Community based forest management
programs typically use readily available exotic species that may not be desired by the local
communities. And finally, many communities rely on forests to supplement their livelihoods but
these resources become increasingly limited because of deforestation. There is a need to protect
the remaining dipterocarp forests for their ecological functions without restricting community
use of natural resources and increasing poverty rates. This research thesis aims to address these
issues by providing guidelines for reforestation and restoration of degraded landscapes with the

8
hope to contribute to sustainable forest management by increasing ecological and socioeconomic
benefits to local communities.
In my first research chapter, I examine the possibility of predicting mass flowering events
using climate cues and accumulated resources. Several studies were conducted to show that
irregular flowering of dipterocarps is related to interannual changes in climate caused by El Niño
Southern Oscillation (Ashton et al. 1988, Curran et al. 1999, Wich and van Schaik 2000).
However, other studies did not find consensus on the particular climatic trigger, citing drop in
temperature (Ashton et al. 1988) or drop in precipitation (Sakai et al. 2006, Brearley et al. 2007),
or showing effects of El Niño in some areas or years and not others (Numata et al. 2003). In this
study I investigate several environmental triggers using data from 11 regions and sites in
Southeast Asia to see if any patterns become apparent. Further, to build on studies that describe
dipterocarps seeds as energy intensive, I investigate the effect of resource availability on
flowering induction. Finally, I use resource accumulation models to predict flowering events.
This chapter answers two specific questions:
1. What are the environmental factors that control mass flowering in dipterocarp forests?
2. Can resource accumulation models successfully predict flowering events in dipterocarp
forests?
In my second research chapter, I identify local tree species that can be used for reforestation in
the Philippines. I use ecological characteristics to identify trees that are early-successional and
are likely to survive open planting environments. I use information on species frequency,
recruitment, and growth increments collected in three successional stands to infer ecological
characteristics of native tree species. Secondly, I identify species that have socioeconomic
importance to forest communities with the help of a questionnaire. I investigate the relationship

9
between socioeconomic rank and ecological suitability of native tree species to propose species
that are suitable for community forestry. The objectives of this chapter are to answer two
questions:
3. Can easy to collect tree measurements from ecological plots be used to identify native
species that are ecologically suitable for reforestation on open sites in order to bypass
lengthy species test plantations?
4. Can we identify species that have both high ecological suitability for reforestation and
high value for forest dependent communities?
In my third research chapter, I investigate the impact of land use planning, protected area
planning, and actual land cover on socioeconomic conditions of communities. More specifically,
I examine if land use planning achieved its purpose of designating areas for use and for
protection by comparing planned land use with actual land cover based on satellite data. Further,
I use government census data to infer socioeconomic conditions in areas of different land cover.
Finally, I examine socioeconomic conditions of rural communities close to a protected area and
further away areas located in agricultural settings in order to understand the impact that
protected areas have on socioeconomic status. This chapter aims to answer the following
question:
5. What effect do protected areas have on socioeconomic status of communities that live
within or nearby areas with restrictions on resource extraction?
All research chapters, even though they cover different methodologies and different disciplines
have a common aim: to aid reforestation activities in the tropics and contribute scientific
10
knowledge for economic, social, and ecological benefits. The common ideas of these three
research chapters are summarized in the conclusions at the end of the thesis.
1.6. Literature cited
Ainuddin, N. A. and K. Goh. 2010. Effect of forest fire on stand structure in Raja Musa Peat Swamp Forest Reserve, Selangor, Malaysia. Journal of Environmental Science and Technology 3:56-62.
Appanah, S. 1985. General flowering in the climax rain forests of South-East Asia. Journal of
Tropical Ecology 1:225-240. Appanah, S. 1993. Mass flowering of dipterocarp forests in the aseasonal tropics. Journal of
Biosciences 18:457-474. Appanah, S. and J. W. Turnbull. 1998. A Review of Dipterocarps: Taxonomy, Ecology and
Silviculture. Center for International Forestry Research, Bogor, Indonesia. Ashton, P. S. 1988. Dipterocarp biology as a window to the understanding of tropical forest
structure. Annual Review of Ecology and Systematics 19:347-370. Ashton, P. S., T. J. Givnish, and S. Appanah. 1988. Staggered flowering in the Dipterocarpaceae:
new insights into floral induction and the evolution of mast fruiting in the aseasonal tropics. American Naturalist 132:44-66.
Bankoff, G. 2007. One island too many: reappraising the extent of deforestation in the
Philippines prior to 1946. Journal of Historical Geography 33:314-334. Bautista, G. M. 1990. The forestry crisis in the Philippines - nature, causes, and issues.
Developing Economies 28:67-94. Blicher-Mathiesen, U. 1994. Borneo illipe, a fat product from different Shorea spp.
(Dipterocarpaceae). Economic Botany 48:231-242. Brearley, F. Q., J. Proctor, L. Suriantata, G. N. Dalrymple, and B. C. Voysey. 2007.
Reproductive phenology over a 10-year period in a lowland evergreen rain forest of central Borneo. Journal of Ecology 95:828-839.
Broad, R. 1995. The political-economy of natural-resources - case-studies of the Indonesian and
Philippine forest sectors. Journal of Developing Areas 29:317-339.

11
Butterfield, R. P. 1996. Early species selection for tropical reforestation: A consideration of stability. Forest Ecology and Management 81:161-168.
Cruz, R. V. O., W. M. Carandang, R. D. Lasco, L. U. dela Cruz, E. Tolentino, Jr., R. V.
Dalmacio, L. L. Rebugio, A. B. Palacpac, L D. Camacho and N. C. Bantayan. 2001. State-of-the-Art Review of Forest Restoration in the Philippines. College of Forestry and Natural Resources, University of the Philippines Los Baños College, Laguna, the Philippines.
Curran, L. M., I. Caniago, G. D. Paoli, D. Astianti, M. Kusneti, M. Leighton, C. E. Nirarita, and
H. Haeruman. 1999. Impact of El Niño and logging on canopy tree recruitment in Borneo. Science 286:2184-2188.
Curran, L. M. and M. Leighton. 2000. Vertebrate responses to spatiotemporal variation in seed
production of mast-fruiting dipterocarpaceae. Ecological Monographs 70:101-128. Dressler, W. H., C. A. Kull, and T. C. Meredith. 2006. The politics of decentralizing national
parks management in the Philippines. Political Geography 25:789-816. FAO. 2003. Advancing Assisted Natural Regeneration in Asia and the Pacific. Food and
Agriculture Organization of the United Nations, Bangkok, Thailand. FAO. 2005. Global Forest Resources Assessment 2005. Progress Towards Sustainable Forest
Management. Food and Agriculture Organization of the United Nations, Rome, Italy. Fujisaka, S. and E. Wollenberg. 1991. From forest to agroforest and logger to agroforester: a
case study. Agroforestry Systems 14:113-129. Gauld, R. 2000. Maintaining centralized control in community-based forestry: Policy
construction in the Philippines. Development and Change 31:229-254. Ghazoul, J. 1997. The pollination and breeding system of Dipterocarpus obtusifolius
(Dipterocarpaceae) in dry deciduous forests of Thailand. Journal of Natural History 31:901-916.
Goltenboth, F. and C.-P. Hutter. 2004. New options for land rehabilitation and landscape ecology
in Southeast Asia by "Rainforestation Farming". Journal for Nature Conservation 12:181-189.
Hansen, M. C., P. V. Potapov, R. Moore, M. Hancher, S. A. Turubanova, A. Tyukavina, D.
Thau, S. V. Stehman, S. J. Goetz, T. R. Loveland, A. Kommareddy, A. Egorov, L. Chini, C. O. Justice, and J. R. G. Townshend. 2013. High-resolution global maps of 21st-entury forest cover change. Science 342:850-853.
Holopainen, J. and J. Blande. 2012. Molecular plant volatile communication. Pages 17-31 in C.
López-Larrea, editor. Sensing in Nature. Springer-Verlag. New York, NY.

12
Hooper, E., R. Condit, and P. Legendre 2002. Responses of 20 native species to reforestation
strategies for abandoned farmland in Panama. Ecological Applications 12:1626-1641. Johnson, T. R. 1999. Community-based forest management in the Philippines. Journal of
Forestry 1:26-30. Kettle, C. J., J. Ghazoul, P. S. Ashton, C. H. Cannon, L. Chong, B. Diway, E. Faridah, R.
Harrison, A. Hector, P. Hollingsworth, L. P. Koh, E. Khoo, K. Kitayama, K. Kartawinata, A. J. Marshall, C. Maycock, S. Nanami, G. Paoli, M. D. Potts, I. Samsoedin, D. Sheil, S. Tan, I. Tomoaki, C. Webb, T. Yamakura, and D. F. R. P. Burslem. 2011. Seeing the fruit for the trees in Borneo. Conservation Letters 4:184-191.
Kettle, C. J., J. Ghazoul, P. S. Ashton, C. H. Cannon, L. Chong, B. Diway, E. Faridah, R.
Harrison, A. Hector, P. Hollingsworth, L. P. Koh, E. Khoo, K. Kitayama, K. Kartawinata, A. J. Marshall, C. R. Maycock, S. Nanami, G. Paoli, M. D. Potts, D. Sheil, S. Tan, I. Tomoaki, C. Webb, T. Yamakura, and D. F. R. P. Burslem. 2010. Mass fruiting in Borneo: a missed opportunity. Science 330:584-584.
Kummer, D. M. 1992. Deforestation in the Postwar Philippines. 1st edition. The University of
Chicago Press. Chicago, Ilinois. Kummer, D. M. and B. L. Turner. 1994. The human causes of deforestation in Southeast-Asia.
Bioscience 44:323-328. Langenberger, G. 2006. Habitat distribution of dipterocarp species in the Leyte Cordillera: an
indicator for species-site suitability in local reforestation programs. Annals of Forest Science 63:149-156.
Langenberger, G., M. C. Martin, K. J. Sauerborn, and M. Wider. 2005. Land Rehabilitation in
the Tropics with Indigenous Tree Species: Economic and Ecological Considerations and Research Needs. Conference on International Agricultural Research for Development. University of Hohenheim. October 11-13, 2005. Stuttgart-Hohenheim, Germany.
Lewis, S. L., G. Lopez-Gonzalez, B. Sonke, K. Affum-Baffoe, T. R. Baker, L. O. Ojo, O. L.
Phillips, J. M. Reitsma, L. White, J. A. Comiskey, M.-N. D. K, C. E. N. Ewango, T. R. Feldpausch, A. C. Hamilton, M. Gloor, T. Hart, A. Hladik, J. Lloyd, J. C. Lovett, J.-R. Makana, Y. Malhi, F. M. Mbago, H. J. Ndangalasi, J. Peacock, K. S. H. Peh, D. Sheil, T. Sunderland, M. D. Swaine, J. Taplin, D. Taylor, S. C. Thomas, R. Votere, and H. Woll. 2009. Increasing carbon storage in intact African tropical forests. Nature 457:1003-1006.
Liu, D. S., L. R. Iverson, and S. Brown. 1993. Rates and patterns of deforestation in the
Philippines - application of Geographic Information-System analysis. Forest Ecology and Management 57:1-16.
13
Luyssaert, S., E. D. Schulze, A. Borner, A. Knohl, D. Hessenmoller, B. E. Law, P. Ciais, and J. Grace. 2008. Old-growth forests as global carbon sinks. Nature 455:213-215.
McAllister, R. R. J., A. Smajgl, J. Asafu-Adjaye. 2007. Forest logging and institutional
thresholds in developing south-east Asian economies: a conceptual model. Forest Policy and Economics 9:1079-1089.
McElwee, P. D. 2008. Forest environmental income in Vietnam: household socioeconomic
factors influencing forest use. Environmental Conservation 35:147-159. Noss, R. F. 1999. Assessing and monitoring forest biodiversity: A suggested framework and
indicators. Forest Ecology and Management 115:135-146. Numata, S., M. Yasuda, T. Okuda, N. Kachi, and N. S. M. Noor. 2003. Temporal and spatial
patterns of mass flowerings on the Malay Peninsula. American Journal of Botany 90:1025-1031.
Okello, M. M., S. K. O. Seno, and R. W. Nthiga. 2009. Reconciling people's livelihoods and
environmental conservation in the rural landscapes in Kenya: opportunities and challenges in the Amboseli landscapes. Natural Resources Forum 33:123-133.
Rodrigues, A. S. L., R. M. Ewers, L. Parry, C. Souza Jr., A. Verissimo, A. Balford. 2009. Boom-
and-dust development patterns across the Amazon deforestation frontier. Science 324:1435-1437.
Rojo, J. P. 1993. Species Diversity and Conservation Status of Philippine Dipterocarps. Pages
248-256 in Drysdale, R.M.; John, S.E.T. and Yapa, A.C., editors. Proceedings of International Symposium on Genetic Conservation and Production of Tropical Forest Tree Seed. June 14-16, 1993. Chiang Mai, Thailand.
Saastamoinen, O. 1996. Change and Continuity in the Philipppine Forest Policy. Pages 121-139
in M. Palo and G. Mery, editors. Sustainable Forestry Challenges for Developing Countries. Kluwer Academic Publishers, Dordrecht, the Netherlands.
Sakai, S., R. D. Harrison, K. Momose, K. Kuraji, H. Nagamasu, T. Yasunari, L. Chong, and T.
Nakashizuka. 2006. Irregular droughts trigger mass flowering in aseasonal tropical forests in Asia. American Journal of Botany 93:1134-1139.
Sidle, R. C., A. D. Ziegler, J. N. Negishi, A. R. Nik, R. Siew, and F. Turkelboom. 2006. Erosion
processes in steep terrain—truths, myths, and uncertainties related to forest management in Southeast Asia. Forest Ecology and Management 224:199-225.
Smitinand, T., T. Santisuk, and C. Phengklai. 1980. The Manual of Dipterocarpaceae of
Mainland South-East Asia. Royal Forest Department. Bangkok, Thailand.

14
Tolentino, E. L. 2008. Restoration of Philippine native forest by smallholder tree framers. Pages 319-342 in D. J. Snelder and R. D. Lasco, editor. Smallholder Tree Growing for Rural Development and Environmental Services. Springer Science and Business Media B.V. , Gainville, Florida.
Vitug, M. D. 1993. Chapter 2: The years of plunder. Pages 11-37 in M. D. Vitug, editor. Power
from the Forest: The Politics of Logging. Philippine Center for Investigative Journalism. Quezon City, the Philippines.
Walters, B. B., A. Cadelina, A. Cardano, and E. Visitacion. 1999. Community history and rural
development: why some farmers participate more readily than others. Agricultural Systems 59:193-214.
Wich, S. A. and C. P. van Schaik. 2000. The impact of El Niño on mast fruiting in Sumatra and
elsewhere in Malesia. Journal of Tropical Ecology 16:563-577. Wingfield, M. J., B. Slippers, J. Roux, and B. D. Wingfield. 2001. Worldwide movement of
exotic forest fungi, especially in the tropics and the Southern hemisphere. Bioscience 51:134-140.
15
Chapter 2 - Climatic drivers of dipterocarp mass flowering in Southeast Asia
2.1. Summary
Dipterocarps, a dominant family of trees in Southeast Asian tropical forests, are remarkable in
that they exhibit supra-annual mass flowering events. The flowering patterns are related to the El
Niño Southern Oscillation, but the trigger that precipitates mass flowering is unknown. Here, we
propose resource accumulation as alternative to a trigger mechanism, and we test the alternate
hypotheses in a meta-analysis with published flowering records. Using a variety of candidate
predictor variables (precipitation, cloud cover, minimum temperature and El Niño indices) we
could not find a plausible environmental trigger (median AUCs around 0.55 indicating near
random predictions), while the best resource accumulation model had a median AUC of 0.70,
which could be improved to 0.75 when the date of previous flowering was included in the model.
We further show that simple resource accumulation by individual trees can cause inter- and
intraspecific flowering synchronization leading to community-wide flowering events.
2.2. Introduction
The family Dipterocarpaceae consists of 16 genera and nearly 600 species, most of which are
found in Southeast Asia where they are the leading species group on 85% of the forested land
base (Appanah et al. 1998). They are also commercially important, representing a quarter of
global consumption of tropical timbers (Kettle 2010). Dipterocarps are remarkable in that they
exhibit supra-annual mass flowering events, which occur in irregular intervals of two to ten

16
years, normally involving several dipterocarp species (Ashton et al. 1988). Such mass flowering
events have further been documented to involve numerous species unrelated to dipterocarps (Yap
and Chan 1990, Hamann 2004, Sakai et al. 2006, Brearley et al. 2007, Cannon et al. 2007), a
phenomenon that may involve up to three-quarters of all forest species, and which has been
termed general flowering (Appanah 1985). Beside mass flowering events, it has been
documented that a small proportion of dipterocarp trees flower unsynchronized almost every
year, and notably small flowering events have often been observed to precede a mass flowering
event in the following year (Curran et al. 1999, Hamann 2004, Sakai et al. 2006, Brearley et al.
2007).
Mast fruiting is thought to be a predator satiation strategy, which is well supported by empirical
data showing that seedling survival rates increase with increased intensity of a masting, and that
during low intensity flowering, all viable seeds are lost to predation (Curran and Leighton 2000,
Sun et al. 2007). However, it has been proposed that several rather than a single factor have
shaped the evolution of mass flowering including pollination success and outcrossing rates
(Sakai 2002). This is empirically supported by several studies that observed high fruit abortion
rates because of inbreeding in years of minimal flowering (Ghazoul et al. 1998, Maycock et al.
2005). Other studies found reduced survival of seedlings and recruitment of saplings that
originate during non-masting years (Naito et al. 2008).
Another problem, distinct from the question of evolutionary causes, is what trigger mechanism
precipitates mass flowering or general flowering events. Ashton et al. (1988) hypothesized that
interannual climate anomalies would be a probable candidate for a trigger mechanism, and they
were the first to suggest that a drop in minimum night-time temperature below 20°C for several
days around six to nine weeks prior to mass flowering may be a plausible trigger based on their
data from the Malaysian peninsula. Other studies at different sites have supported the

17
relationship between flowering and drop in night-time temperature (Yasuda et al. 1999, Numata
et al. 2003). However, subsequent studies found no associations with low-temperature events,
instead pinpointing lack of rainfall as a plausible trigger with typical lead times between the
trigger occurrence and flowering of several weeks to a few months (Sakai et al. 2006, Brearley et
al. 2007).
Both low minimum temperatures and lack of rainfall can be linked to the irregular El Niño
Southern Oscillation (ENSO), which brings dry air masses into Malesia, creating drought
conditions and cloudless skies causing night-time temperatures to drop. The ENSO index in turn
has been shown to correlate reasonably well with mass flowering events (Ashton et al. 1988,
Appanah 1993, Curran et al. 1999, Wich and van Schaik 2000, Cannon et al. 2007). The positive
association of mass flowering with El Niño events is not consistent throughout the region,
however. Yasuda et al. (1999) and Numata et al. (2003) observed mass flowering events during
the opposite La Niña anomalies, while others found no association (Numata et al. 2003, Hamann
2004). The strongest associations with El Niño are observed in eastern Malesia weakening
westward (Wich and van Schaik 2000). In summary, there is significant spatial, temporal, inter-
and intraspecific variability in dipterocarp mass flowering, in parallel to occasional general
flowering events that involve many species over large geographic areas (Ashton et al. 1988,
Appanah 1993).
We find it difficult to reconcile this mix of spatial and temporal variability, combined with
occasional highly synchronized events across multiple species, with an evolved environmental
trigger mechanism. The lack of flowering correlation with topography and minor flowering
events preceding a large mass flowering in the following year point to a different mechanism that
may precipitate flowering. We hypothesize that a resource tracking mechanism may play an
important role in precipitating mass flowering events. Species-specific thresholds, where enough
18
resources are accumulated for mass flowering, could explain different flowering intervals in
dipterocarps, while community-wide events could be triggered by unusually high resource
availability (e.g., during El Niño events). Primary productivity and mobilization of
photosynthate in the production of large, energy rich seeds requires resource accumulation for
several years (Ashton 1988, Ichie 2005a). These resources were found to be more abundant
during drought conditions and higher irradiance (Ashton et al. 1988, Wich and van Schaik 2000,
Newbery et al. 2006).
Understanding and predicting mass flowering in Southeast Asian dipterocarps has important
practical applications. Dipterocarps produce recalcitrant short-lived seeds that pose difficult
logistical challenges for reforestation and conservation of dipterocarp resources (Appanah et al.
1998, Kettle 2010). The most recent major general flowering event in Borneo, the first in 12
years, went unutilized for lack of time to mobilize resources for seed collection (Kettle et al.
2010). Better predictive models of mass flowering events are therefore also needed to improve
forest resource management. Here, we re-examine potential environmental cues of mass
flowering in different regions of Southeast Asia and contrast the classical trigger model with a
straightforward resource tracking model of mass-flowering based on availability of resources
(measured by climate variable proxies). We evaluate which model has better predictive
capabilities, and further investigate whether a resource tracking model can in principle explain
intra- and interspecies synchronization of flowering.
19
2.3. Materials and methods
2.3.1. Phenology data
We compiled flowering data from published literature at eleven study sites in Southeast Asia
(Fig. 2-1, Table 2-1). Data sources include observations from five long-term ecological plots and
flowering records from six general geographic areas in Peninsular Malaysia, Borneo and
northern Sumatra. Few of these records were available for individual species, and we therefore
perform our meta-analysis at the community level, focusing on dipterocarps only. We included
studies that involve at least ten years of data and at least three mass flowering events. The
average length of the eleven time series we compiled was 29 years, excluding flowering data
prior 1950 to ensure high quality of climate data, which relies on a sufficiently dense network of
weather stations.
The flowering data were reported in different units, including seed export in tons per year for
various Shorea species used for food products, cosmetics, and lubricants (Blicher-Mathiesen
1994). Other regional data is reported as minor, major, or no flowering for each year. Data from
long-term ecological plots were recorded either as percent of dipterocarp trees or species
flowering each year. For our analysis, we converted all data to a binary response variable,
focusing on major flowering events (top quartile when measured quantitatively). When data was
reported as major/minor, we accepted those classifications. The database with original records is
available in Appendix A.

20
2.3.2. Climate data
We use two sources of climate data for analysis, daily weather station data and monthly
interpolated climate grids. Monthly variables for study sites and regions were extracted from the
CRU 2.1 database (Mitchell 2004). We used precipitation (mm), average cloud cover (%), vapor
pressure (hPa), and minimum temperature (°C) as putative predictors. Daily minimum night-time
temperature was directly obtained from a global weather station database (NCDC 2013). For the
long-term ecological plots, the following weather stations were used: Gunung Palung: USAF ID
966150, 965810 (the second station used to fill missing data), Barito Ulu: USAF ID 966550,
Pasoh: USAF ID 486470, Lambir Hills: USAF ID 964490, and Ketambe: USAF ID 960350. For
regional data, we used averages of all stations located within the region and that covered at least
60% of the data period (number of stations in parenthesis): East Borneo (6), West Borneo (7),
East Peninsular Malaysia (6), West Peninsular Malaysia (9), Kalimantan (5), Sarawak (6).
Beside climate variables as predictors for flowering events, we also use El Niño indices. These
indices may be measured with greater accuracy than the resulting climate patterns, and/or they
may stand as proxies for climate variables that we do not measure. We use two indices, the
Southern Oscillation Index (SOI), and the El Niño Region 3 anomaly index (NINO3) (Climate
Prediction Center Internet Team 2012). SOI is computed using a standardized monthly sea level
air pressure difference between Tahiti and Darwin (Bureau of Meteorology 2013). Values below
–8 signify an El Niño phase and values above +8 signify a La Niña phase. The NINO3 index is
calculated using the average monthly sea surface temperatures of the eastern equatorial Pacific
region enclosed by the latitudes 5°N to 5°S and the longitudes 150°W to 90°W (Trenberth 1997).
The periods where the anomalies for the running average over a period five months exceed
+0.5°C are defined as an El Niño phase and an anomaly below –0.5°C is interpreted as La Niña
phase (Trenberth 1997). We should note that all putative predictor variables for the trigger or
21
resource tracking model have moderate to high collinearity and should be considered proxies for
unknown climate factors that serve as biological triggers or resources.
2.3.3. Environmental trigger model
We assume a logistic rather than a linear relationship between the environmental trigger and the
probability of a flowering event. The s-shaped relationship implies that a low trigger value is
very unlikely to precipitate a flowering event, followed by a short transition of intermediate
values to a high probability of a flowering at high trigger values (or vice versa for some
candidate variables). Thus, our environmental trigger model conforms to the function: y =
1/(1+e– (a+bx)), where y is the probability of flowering, x is the environmental predictor variable,
the parameter a represents the intercept with y, and the parameter b represents the steepness of
the transition from low to high probabilities.
Because the flowering data is recorded annually, and climate data is given as monthly or daily
records, some temporal alignments are required. For seed data records, we assume that flowering
occurred three months prior (based on observations by Hamann 2004, Sakai et al. 2006, Brearley
et al. 2007). Flowering was assumed to occur in one of two flowering periods with peak times
around April or May in northern and eastern sites and in September in southern Borneo sites (see
Table 2-1 for flowering times), reflecting the periods where flowering was most frequent. To
capture the cue of flowering, we analyze climate data for the nine months preceding the peak of
flowering period at each site in each year. For example, at the West Borneo region, where
flowering peaks in September, the environmental cue was assumed to occur between January and
September. This ensures that even for early flowering species relative to the peak flowering
period, we would capture a climate cue up to six months prior to the flowering event, and a
flowering cue is not likely to occur more than six months prior to flowering induction (Ashton et

22
al. 1988, Brearley et al. 2007). Daily data were screened for extreme minimum temperature
events, and monthly data were screened for minimums in monthly precipitation, cloud cover, and
average minimum temperature. As an alternate predictor, means rather than minimums of
monthly data in the period leading up to the flowering event were also tested.
The quality of the predictive models were evaluated using the Area Under the receiver operating
characteristic Curve (AUC) using the ROCR package (Sing et al. 2005) for the R programming
environment (R Core Team 2014). Receiver operating characteristics evaluate true positives
(where flowering predictions correspond to observed mass flowering events) versus false
positives (Fawcett 2006). The true positive rate, or model sensitivity, is plotted over the false
positive rate, corresponding to model specificity, with any model-generated probability between
0 and 1 tested as potential threshold to predict a flowering event. The AUC value is subsequently
obtained by integrating the area under the curve. An AUC value of 1 implies a perfect model fit,
an AUC value of 0.5 is a random predictor, and an AUC below 0.5 implies a model with more
false positives than expected by random chance.
2.3.4. Resource accumulation model
Candidate predictors for the resource accumulation model were climate proxies of drought
conditions and high irradiance: cloud cover, precipitation, NINO3 index values, and SOI index
values (representing El Niño periods). We converted the variables to a standardized unit, where
the average resource availability was represented by a value of one, with a standard deviation of
one. Precipitation, SOI, and cloud cover negatively correlate with high resource availability
(drought, El Niño event, and clear skies) and therefore the inverse of these values was used. The
NINO3 index was not inverted as high values represent El Niño event. Monthly resources are
added up to a preset flowering threshold, which precipitates a flowering event and resets

23
resources to zero. The model was implemented in the R programming environment with the
following algorithm:
for (i in 1:nrow(x)) { r[i+1] ifelse( r[i]<ft, (x[i+1]+r[i]), (x[i+1]) ) }
where, x is a vector of monthly resource availability as explained above, r is a vector of the
resource accumulated over time, ft is the flowering threshold, and i represents a monthly counter.
We also developed a second model that makes predictions of the next mass flowering event
including knowledge of when the previous mass flowering event occurred. This version differed
from the algorithm above as it resets the resource to zero when an actual mass flowering event
was observed, regardless of whether the modeled flowering threshold was reached:
for (i in 1:nrow(x)) { r[i+1]ifelse( f[i]==0, (r[i+1]+r[i]), (x[i+1]) ) }
where f is a vector of observed mass flowering events placed in the months of peak flowering
according to Table 2-1.
For model evaluation, we are assuming the same logistic relationship between the value of the
accumulated resource and the probability of flowering as was used in the trigger model above.
The reasoning is similar: we assume that a minimal level of the accumulated resources implies a
very low flowering probability followed by a rapid s-shaped transition to high flowering
probabilities once a certain available resource threshold is exceeded.

24
2.3.5. Flowering synchronization model
Building on the resource accumulation model above, additional parameters could be varied, and
we tested the sensitivity of these factors in an expanded model. This model is meant to explore
if various qualitative observations (synchronization of trees of one species, synchronization of
several species, general flowering, or small flowering events prior to large flowering events)
could in principle be explained by a resource tracking model. This model has the following
additional parameters: a randomly varying resource baseline (rb), an irregular resource anomaly
(a) with an interval (ai) and an anomaly size (as) that is expressed as a multiple of the resource
baseline. Further, the model is expanded to simulate a multi-species community with a user
defined number of species (ns) and number of trees per species (nt), and species specific
flowering thresholds (ft) that now is a vector with different thresholds for different species (ftv).
The model remains exactly as explained above, but multiple trees and multiple species are now
kept track of in matrices rather than a single time series vector. R scripts for the single and multi-
species models can be found in the online supporting information (Appendix B and Appendix
C).
2.4. Results
2.4.1. Regional climatology and flowering
To visualize regional variation in the effects of El Niño on climate drivers, we plot climate
diagrams for all regions and sites for which we have flowering data (Fig. 2-1). El Niño phases
reverse the Pacific trade winds creating a failure in the southeast summer monsoon in Southeast
Asia (Fan et al. 2009), while La Niña intensifies the monsoon. Those effects vary regionally, and

25
we can distinguish different influences on the northeast and southwest-facing study sites. In the
regions facing the south Pacific (Fig. 2-1, WB, EB ,Kal), the divergence between El Niño and La
Niña is largest during the second half of the year, with warmer temperatures and less
precipitation during the El Niño phase, because of hot air masses being driven into the region
during the summer monsoon. In contrast, the north and east-facing regions (Fig. 2-1, Keta,
WPM, EPM, Sar) see the strongest influences of El Niño phases during the winter monsoon,
when weakened trade winds originating in the South China Sea and the Bay of Bengal, cause
reduced precipitation from January to April.
These differences in regional effects of El Niño are mirrored in the time of the year when
dipterocarps flower in different regions (Table 2-1). In the southwest-facing regions and study
sites (Table 2-1, WB, Kal, BU and GPNP), flowering is clustered around September, which
coincides with the time of the year of El Niño driven low precipitation anomalies. In the east and
north-facing regions and study sites, flowering occurs around April or May (Table 2-1, Keta,
WPM, EPM, Pas, Sar, LH), which coincides with the time of the year when the El Niño effects
are strongest in those regions as well. In summary, regional flowering times are synchronized
with where and when El Niño effects are regionally strongest, implying that El Niño related
climate phenomena may be a cue for flowering induction of dipterocarps in Southeast Asia.
While the seasonal association of flowering with El Niño is readily apparent, the association of
interannual flowering events with El Niño is less obvious when visualizing the data for
reproductive events (Fig. 2-2). In the monitoring site on the first line (Pas), flowering does not
correspond to El Niño periods (in red), where all but one of the mass flowering events occurred
during the normal or the La Niña periods. In fact, mass flowering throughout the northern and
eastern monitoring sites and regions are very weakly associated with El Niño periods.
Nevertheless, major flowering events observed across the entire study region occurred in

26
1957/58, 1968, 1976, 1981-82, 1997/98, with three out of five large events falling on or after El
Niño years. Large flowering events across Southeast Asia happen every five to twelve years, but
additional large and small regional events that are not synchronized with other locations are very
common.
2.4.2. Trigger model versus tracking model
A statistical evaluation of the trigger and the resource models is summarized in Table 2-2. AUC
values are based on the average probability of flowering for the six to nine months preceding
flowering range reported in Table 2-1. The minimum temperature and NINO3 predictor variables
for the trigger model yielded only slightly better predictions than expected by random chance
(0.53-0.57). The alternate El Niño index (SOI) yielded the same AUC value as the NINO3 index.
Further, the best predictor variable varied for different regions of the study area. For the
Peninsular Malaysian (Pas, EPM, WPM) a drop in monthly minimum temperature yielded
respectable AUC values between 0.7 and 0.8. For Borneo (BU, Sar, Kal, WB), and Sumatra
(Keta) the El Niño index yields high AUC values between 0.6 and 0.8, while monthly minimum
temperature regularly yields AUC values below 0.5.
The predictive ability of the resource tracking model is more accurate than the trigger model
overall, with median AUC values of 0.6 for precipitation and 0.7 for the NINO3 index. Cloud
cover AUCs were similar to precipitation as a predictor for resources. Sites and regions
representing Borneo and Sumatra (Kal, EB, WB, Sar, Keta) yield the highest AUC values for the
El Niño index as predictor. The Peninsular Malaysian sites (Pas, EPM, WPM) show better
results for precipitation as a proxy for resources. When the date of previous flowering was
included in the model, which would be relevant for practical applications, the model accuracy
could be improved to 0.75.
27
In Fig. 2-3, we visualize selected model predictions to illustrate what the AUC statistics are
based on. For the resource tracking model, we plot monthly probabilities of flowering based on a
resource accumulation mechanism that uses the NINO3 index as a proxy for resource
availability. For comparison, average monthly probabilities of the daily minimum temperature
trigger model is indicated by horizontal bars (only one value is calculated based on the lowest
daily temperature value in the preceding 6-9 month period). For the resource tracking model,
probabilities increase as the resource is accumulated, and the model resets itself when a
maximum resource threshold is reached, which is defined as the total resource accumulated over
the study period divided by the number of intervals between flowering events (we confirmed that
an equal interval flowering model has no predictive value, with an AUC=0.5 (± 0.06) across all
sites and variables).
2.4.3. Intra- and interspecies synchronization
Although there is better statistical support for a resource tracking model than for an
environmental trigger model, a resource tracking model does not obviously explain intraspecific
synchronization of individual trees to flower in the same year. Each individual may be flowering
and resetting the resource counter in its individual cycle. To explore the capacity of resource
tracking mechanism to explain synchronization of mass flowering and general flowering across
many species, we extend the model with additional parameters to simulate a group of trees in a
single species (Appendix B) and further to include multiple species that may have different
values for parameters for flowering thresholds, etc. (Appendix C).
The model as specified in Appendix B starts with 12 individual trees of a species that are initially
completely unsynchronized, set in the model to the worst case of flowering sequentially in 12

28
consecutive years. The program first generates a randomly varying resource with a certain
baseline value (here, set to rb=20) and a resource anomaly at most twice as large as the resource
baseline (as=40) at irregular intervals of 1 to 12 years (ai=12). The results of the single species
with a flowering threshold less than twice the maximum anomaly (ft=70) is shown in Fig. 2-4a.
In this model, individual trees of a species quickly synchronize to flower in the same year
because when resource anomaly occurs, all trees with resource levels close to the flowering
threshold are triggered, and are subsequently on the same resource accumulation cycle. If the
anomaly size is reduced, or the flowering threshold is raised relative to the size of the anomaly,
small population flower more frequently out of synchronization (Fig. 2-4b, ft=80).
In the multi-species implementation of the same model (Appendix C), we simulate five species
(ns=5), three with lower and two with higher flowering thresholds (specified with the user
defined vector ftv=70, 71, 72,120,122), while other parameters remain the same (Fig 2-4c). As
before, we start with all trees of all species being completely unsynchronized by setting their
flowering times to consecutive years. It takes about 20 to 30 years for populations to self-
synchronize and generate mass flowering events (species with similar thresholds), and occasional
general flowering events (all species). The model output from iteration 40 to 100, after the initial
self-synchronization has taken place (Fig 2-4c), resembles observed flowering patterns for
dipterocarps in Southeast Asia (Fig. 2-2).
2.5. Discussion
In this meta-analysis we found slightly more statistical support for a resource tracking hypothesis
than for the trigger model of mass flowering in dipterocarps. It should be noted, however that the
two hypotheses are not mutually exclusive and that, for example, a trigger threshold could be

29
modulated by a resource status. Other observations, however, point to a resource tracking
mechanism being the primary driver of dipterocarp phenology in Southeast Asia. First, the
widely documented occurrence of minor flowering events preceding mass flowering in
dipterocarps (Curran et al. 1999, Hamann 2004, Sakai et al. 2006, Brearley et al. 2007) points to
the resource tracking hypothesis, and is likely caused by some trees reaching the flowering
threshold somewhat earlier than the main population. Second, there is the phenomenon of
general flowering events that involves many species of dipterocarps as well as unrelated tree
species (Yap and Chan 1990, Hamann 2004, Sakai et al. 2006, Brearley et al. 2007, Cannon et al.
2007). It seems unlikely that a large range of species would independently evolve a mass
flowering strategy in response to the same proximate environmental cue, while a broad
community response to resource availability appears more parsimonious.
Third, a key observation that emerged in our analysis is that seasonal flowering times in
dipterocarps are determined by how the winter and summer monsoons mediate El Niño phases.
Notably, the climate seasonality is similar throughout the study area with minimal precipitation
in July and the highest temperatures around May when the monsoon directions reverse, and
when the sun reaches the zenith for the first time during the year. Yet flowering times of
dipterocarps do not show regional correspondence to this seasonality. Rather, they are associated
with the time of the year that regionally shows the largest anomalies during El Niño phases. We
interpret this observation as favoring the resource accumulation over the trigger hypothesis: a
large anomaly relative to the flowering threshold would facilitate intra- and interspecies
synchronization as shown in the model simulations (Fig 2-4).
Considering raising temperatures and increased droughts due to climate change (Dai 2011)
dipterocarp reproduction may also be affected. Studies found mass flowering species that are
synchronized during elevated temperatures to flower annually under changing climate conditions

30
(McKone et al. 1998). Under climate change, extreme weather events are likely to increase (Dai
2011) and frequency and intensity of El Nino Southern Oscilation (Timmermann et al. 1999).
With these changes both the trigger and the resources involved in flowering will become more
frequent and abundant (Butt et al. 2015), regardless of whether masting is cue or resource
dependent.
A resource tracking model does offer a plausible explanation for an evolutionary path toward
mass flowering and general flowering phenomena. Seasonal flowering is an evolutionary stable
strategy, not easily invaded by an alternative (mutant) mass flowering strategy without the initial
advantage of predator satiation. However, resource availability for fruit and seed production
would have an immediate evolutionary advantage (documented by Isagi et al. 1997), and mutant
populations would not be excluded from the general reproductive pool, because large anomalies
would still re-synchronize all individuals of a species despite different flowering thresholds (as
shown in Fig 2-4c).
In this paper, we tried to make the case for an alternative hypothesis that could explain the
evolution of mass flowering in dipterocarps, the general flowering phenomenon, and within-
species synchronization of individual trees. We should note, however, that our resource tracking
model did not yield levels of predictive accuracy that would be required for local management.
This is not unexpected, because our data compiled from the published literature includes many
species and different record types of flowering events. While resource tracking appears to be an
important component in controlling dipterocarp phenology, better predictive models could
potentially be developed by fitting more complex resource-modulated trigger models to species-
specific plot data. Building better models with accurate local data would have important
applications in management and conservation of dipterocarp species (Kettle et al. 2011). If the
probability of a flowering event could be estimated with reasonably high precision (AUC>0.8),

31
forestry operations and seed collections for conservation purposes could be planned accordingly.
In a recent letter to Science, (Kettle et al. 2010) pointed out that resource managers and
conservation agency need to mobilize resources and personnel for seed collection.
2.6. Literature cited
Appanah, S. 1985. General flowering in the climax rain forests of South-east Asia. Journal of Tropical Ecology 1:225-240.
Appanah, S. 1993. Mass flowering of dipterocarp forests in the aseasonal tropics. Journal of
Biosciences 18:457-474. Appanah, S. and J. W. Turnbull 1998. A Review of Dipterocarps: Taxonomy, Ecology and
Silviculture. Center for International Forestry Research. Bogor, Indonesia. Ashton, P. S. 1988. Dipterocarp biology as a window to the understanding of tropical forest
structure. Annual Review of Ecology and Systematics 19:347-370. Ashton, P. S., T. J. Givnish, and S. Appanah. 1988. Staggered flowering in the Dipterocarpaceae:
new insights into floral induction and the evolution of mast fruiting in the aseasonal tropics. American Naturalist 132:44-66.
Blicher-Mathiesen, U. 1994. Borneo illipe, a fat product from different Shorea spp.
(Dipterocarpaceae). Economic Botany 48:231-242. Brearley, F. Q., J. Proctor, S., L. Nagy, G. Dalrymple, and B. C. Voysey. 2007. Reproductive
phenology over a 10-year period in a lowland evergreen rain forest of central Borneo. Journal of Ecology 95:828-839.
Bureau of Meteorology. 2013. S.O.I. (Southern Oscillation Index) Archives - 1876 to Present.
Bureau of Meteorology of Commonwealth of Australia. Melbourne, Australia. Butt, N., L. Seabrook, M. Maron, B. S. Law, T. P. Dawson, J. Syktus, and C. A. McAlpine.
2015. Cascading effects of climate extremes on vertebrate fauna through changes to low-latitude tree flowering and fruiting phenology. Global Change Biology 21:9:3267-3277.
Cannon, C. H., L. M. Curran, A. J. Marshall, and M. Leighton. 2007. Long-term reproductive
behaviour of woody plants across seven Bornean forest types in the Gunung Palung National Park (Indonesia): suprannual synchrony, temporal productivity and fruiting diversity. Ecology Letters 10:956-969.
32
Climate Prediction Center Internet Team. 2012. Monthly Atmospheric and SST Indices. National
Oceanic and Atmospheric Association. College Park, Maryland. Curran, L. M., I. Caniago, G. D. Paoli, D. Astianti, M. Kusneti, M. Leighton, C. E. Nirarita, and
H. Haeruman. 1999. Impact of El Niño and logging on canopy tree recruitment in Borneo. Science 286:2184-2188.
Curran, L. M. and M. Leighton. 2000. Vertebrate responses to spatiotemporal variation in seed
production of mast-fruiting dipterocarpaceae. Ecological Monographs 70:101-128. Dai, A. 2011. Drought under global warming: a review. Wiley Interdisciplinary Reviews:
Climate Change 2:45-65. Fan, F. X., M. E. Mann, and C. M. Ammann. 2009. Understanding changes in the Asian summer
monsoon over the past millennium: insights from a long-term coupled model simulation. Journal of Climate 22:1736-1748.
Fawcett, T. 2006. An introduction to ROC analysis. Pattern Recognition Letters 27:861-874. Ghazoul, J., K. A. Liston, and T. J. B. Boyle. 1998. Disturbance-induced density-dependent seed
set in Shorea siamensis (Dipterocarpaceae), a tropical forest tree. Journal of Ecology 86:462-473.
Hamann, A. 2004. Flowering and fruiting phenology of a Philippine submontane rain forest:
climatic factors as proximate and ultimate causes. Journal of Ecology 92:24-31. Ichie, T., T. Kenta, M. Nakagawa, K. Sato, T. Nakashizuka. 2005a. Resource allocation to
reproductive organs during masting in the tropical emergent tree, Dipterocarpus tempehes. Journal of Tropical Ecology 21:237-241.
Isagi, Y., K. Sugimura, A. Sumida, and H. Ito. 1997. How does masting happen and
synchronize? Journal of Theoretical Biology 187:231-239. Kettle, C. J. 2010. Ecological considerations for using dipterocarps for restoration of lowland
rainforest in Southeast Asia. Biodiversity and Conservation 19:1137-1151. Kettle, C. J., J. Ghazoul, P. S. Ashton, C. H. Cannon, L. Chong, B. Diway, E. Faridah, R.
Harrison, A. Hector, P. Hollingsworth, L. P. Koh, E. Khoo, K. Kitayama, K. Kartawinata, A. J. Marshall, C. Maycock, S. Nanami, G. Paoli, M. D. Potts, I. Samsoedin, D. Sheil, S. Tan, I. Tomoaki, C. Webb, T. Yamakura, and D. F. R. P. Burslem. 2011. Seeing the fruit for the trees in Borneo. Conservation Letters 4:184-191.
Kettle, C. J., J. Ghazoul, P. S. Ashton, C. H. Cannon, L. Chong, B. Diway, E. Faridah, R.
Harrison, A. Hector, P. Hollingsworth, L. P. Koh, E. Khoo, K. Kitayama, K. Kartawinata, A. J. Marshall, C. R. Maycock, S. Nanami, G. Paoli, M. D. Potts, D. Sheil, S. Tan, I.

33
Tomoaki, C. Webb, T. Yamakura, and D. F. R. P. Burslem. 2010. Mass fruiting in Borneo: a missed opportunity. Science 330:584-584.
Maycock, C. R., R. N. Thewlis, J. Ghazoul, R. Nilus, and D. F. R. P. Burslem. 2005.
Reproduction of dipterocarps during low intensity masting events in a Bornean rain forest. Journal of Vegetation Science 16:635-646.
McKone, M. J., D. Kelly, and W. G. Lee. 1998. Effect of climate change on mast-seeding
species: frequency of mass flowering and escape from specialist insect seed predators. Global Change Biology 4:591-596.
Mitchell, T. D. 2004. An improved method of constructing a database of monthly climate
observations and associated high resolution grids. International Journal of Climatology. 25:6: 693-712.
Naito, Y., M. Kanzaki, H. Iwata, K. Obayashi, S. L. Lee, N. Muhammad, T. Okuda, and Y.
Tsumura. 2008. Density-dependent selfing and its effects on seed performance in a tropical canopy tree species, Shorea acuminata (Dipterocarpaceae). Forest Ecology and Management 256:375-383.
NCDC. 2013. NOAA Daily Global Summary of Day (GOBALSOD) Station Data. National
Climatic Data Cenetr of the National Oceanic and Atmospheric Association, Asheville, NC.
Newbery, D. M., G. B. Chuyong, and L. Zimmermann. 2006. Mast fruiting of large
ectomycorrhizal African rain forest trees: importance of dry season intensity, and the resource-limitation hypothesis. New Phytologist 170:561-579.
Numata, S., M. Yasuda, T. Okuda, N. Kachi, and N. S. M. Noor. 2003. Temporal and spatial
patterns of mass flowerings on the Malay Peninsula. American Journal of Botany 90:1025-1031.
R Core Team. 2014. R: A Language and Environment for Statistical Computing. R Foundation
for Statistical Computing. Vienna, Austria. Sakai, S. 2002. General flowering in lowland mixed dipterocarp forests of South-east Asia.
Biological Journal of the Linnean Society 75:233-247. Sakai, S., R. D. Harrison, K. Momose, K. Kuraji, H. Nagamasu, T. Yasunari, L. Chong, and T.
Nakashizuka. 2006. Irregular droughts trigger mass flowering in aseasonal tropical forests in Asia. American Journal of Botany 93:1134-1139.
Sing, T., O. Sander, N. Beerenwinkel, and T. Lengauer. 2005. ROCR: visualizing classifier
performance in R. Bioinformatics 21:3940-3941.

34
Sun, I. F., Y. Y. Chen, S. P. Hubbell, S. J. Wright, and N. S. M. D. Noor. 2007. Seed predation during general flowering events of varying magnitude in a Malaysian rain forest. Journal of Ecology 95:818-827.
Timmermann, A., J. Oberhuber, A. Bacher, M. Esch, M. Latif, and E. Roeckner. 1999. Increased
El Nino frequency in a climate model forced by future greenhouse warming. Nature 398:694-697.
Trenberth, K. E. 1997. The definition of El Niño. Bulletin of the American Meteorological
Society 78:2771-2777. Wich, S. A. and C. P. van Schaik. 2000. The impact of El Niño on mast fruiting in Sumatra and
elsewhere in Malesia. Journal of Tropical Ecology 16:563-577. Yap, S. K. and H. T. Chan. 1990. Phenological behaviour of some Shorea species in peninsular
Malaysia. Pages 21-36 in M. Hadley and K. S. Bawa, editors. Reproductive Ecology of Tropical Forest Plants. Parthenon Publishing Group, Inc., Bangi, Malaysia.
Yasuda, M., J. Matsumoto, N. Osada, S. Ichikawa, N. Kachi, M. Tani, T. Okuda, A. Furukawa,
A. R. Nik, and N. Manokaran. 1999. The mechanism of general flowering in Dipterocarpaceae in the Malay Peninsula. Journal of Tropical Ecology 15:437-449.

35
Table 2-1. Dipterocarp flowering and fruiting. This data are for the long-term ecological monitoring plots in Peninsular Malaysia (Pas), central Kalimantan (BU), West Kalimantan (GPNP), Sarawak (LH), North Sumatra (Keta) and regions (Kal, Sar, WPM, EPM, WB, EB) in Southeast Asia describing time period, data type, primary flowering times (although flowering may occur in April and September) and references of data origin. For sites with seed data and September flowering times (GPNP, Kal, WB), flowering was assumed to occur a year prior.
Code Site, Region Period Data Type Flowering Time Reference BU Barito Ulu RA, Kalimantan 1990-1999 % Trees flowering Sep (Jul-Dec) (Brearley et al. 2007)
EB East Borneo 1950-1983 Mass flowering (0,1,2) May (Mar-Jul) (Ashton et al. 1988)
EPM Eastern Peninsular Malaysia 1950-1983 Mass flowering (0,1,2) Apr (Feb-Jun) (Ashton et al. 1988)
GPNP Gunung P. NP, Kalimantan 1987-1999 Seed density (seeds/m2) Sep (Jul-Dec) (Curran et al. 1999)
Kal Kalimantan 1903-1999 Seed export (106 kg/year) Sep (Jul-Dec) (Blicher-Mathiesen 1994, Curran et al. 1999)
Keta Ketambe Site, Sumatra 1971-1998 Mast fruiting (0,2) Apr (Feb-May) (Wich & van Schaik 2000)
LH Lambir Hills NP, Sarawak 1993-2003 % Trees flowering May (Feb-Aug) (Sakai et al. 2006)
Pas Pasoh FR Area, Malaysia 1973-2002 % Trees flowering May (Feb-Aug) (Yap & Chan 1990, Numata et al. 2003)
Sar Sarawak 1903-1990 Seed export (106 kg/year) May (Mar-Jul) (Blicher-Mathiesen 1994)
WB West Borneo 1950-1987 Mast fruiting (0,1,2) Sep (Jul-Dec) (Ashton et al. 1988, Wich & van Schaik 2000)
WPM Western Peninsular Malaysia 1950-1987 Mass flowering (0,1,2) Apr (Feb-Jun) (Ashton et al. 1988, Wich & van Schaik 2000)
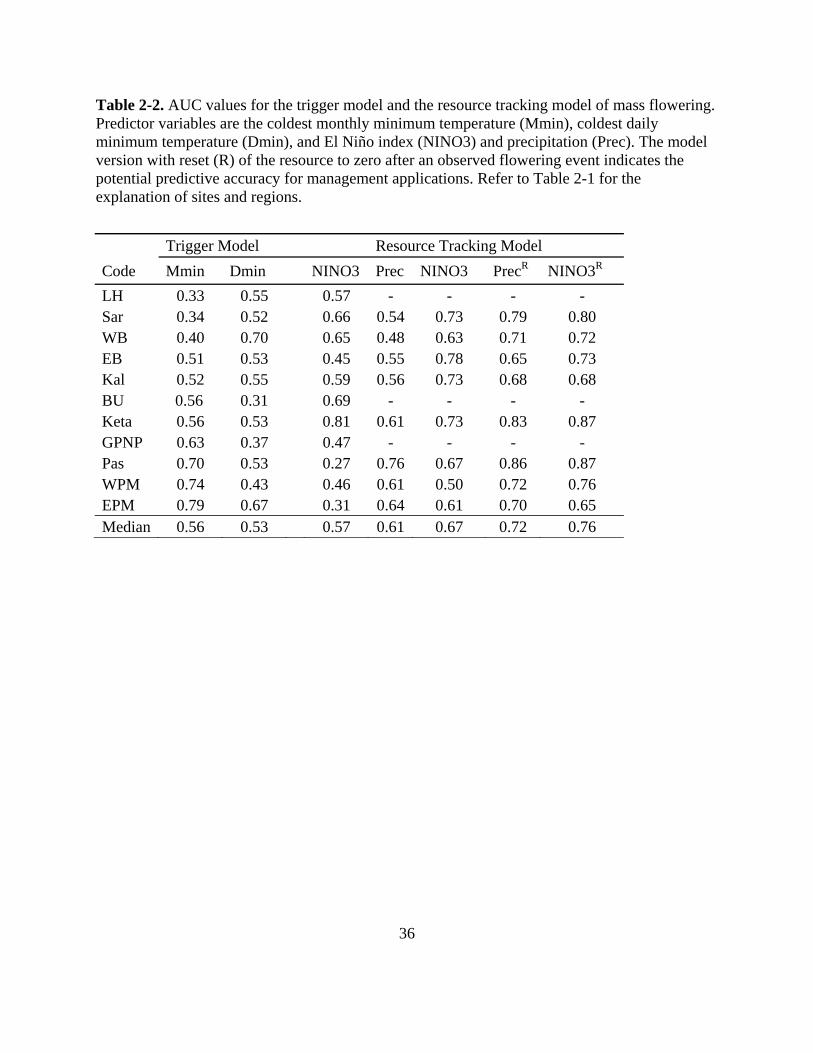
36
Table 2-2. AUC values for the trigger model and the resource tracking model of mass flowering. Predictor variables are the coldest monthly minimum temperature (Mmin), coldest daily minimum temperature (Dmin), and El Niño index (NINO3) and precipitation (Prec). The model version with reset (R) of the resource to zero after an observed flowering event indicates the potential predictive accuracy for management applications. Refer to Table 2-1 for the explanation of sites and regions.
Trigger Model Resource Tracking Model
Code Mmin Dmin NINO3 Prec NINO3 PrecR NINO3R
LH 0.33 0.55 0.57 - - - - Sar 0.34 0.52 0.66 0.54 0.73 0.79 0.80 WB 0.40 0.70 0.65 0.48 0.63 0.71 0.72 EB 0.51 0.53 0.45 0.55 0.78 0.65 0.73 Kal 0.52 0.55 0.59 0.56 0.73 0.68 0.68 BU 0.56 0.31 0.69 - - - - Keta 0.56 0.53 0.81 0.61 0.73 0.83 0.87 GPNP 0.63 0.37 0.47 - - - - Pas 0.70 0.53 0.27 0.76 0.67 0.86 0.87 WPM 0.74 0.43 0.46 0.61 0.50 0.72 0.76 EPM 0.79 0.67 0.31 0.64 0.61 0.70 0.65 Median 0.56 0.53 0.57 0.61 0.67 0.72 0.76

37
Figure 2-1. Effects of El Niño and La Niña on regional climate in Southeast Asia. The map shows long-term ecological monitoring plots and regions corresponding to data sources. Climate diagrams are for the 1950-2002 period with El Niño years in 1953, 1965, 1969, 1972, 1977, 1982-83, 1987, 1991-1994, 1997, 2002 and La Niña years in1950, 1955-56, 1962, 1964, 1971, 1973-75, 1988-89, 1996, 1999, 2000.
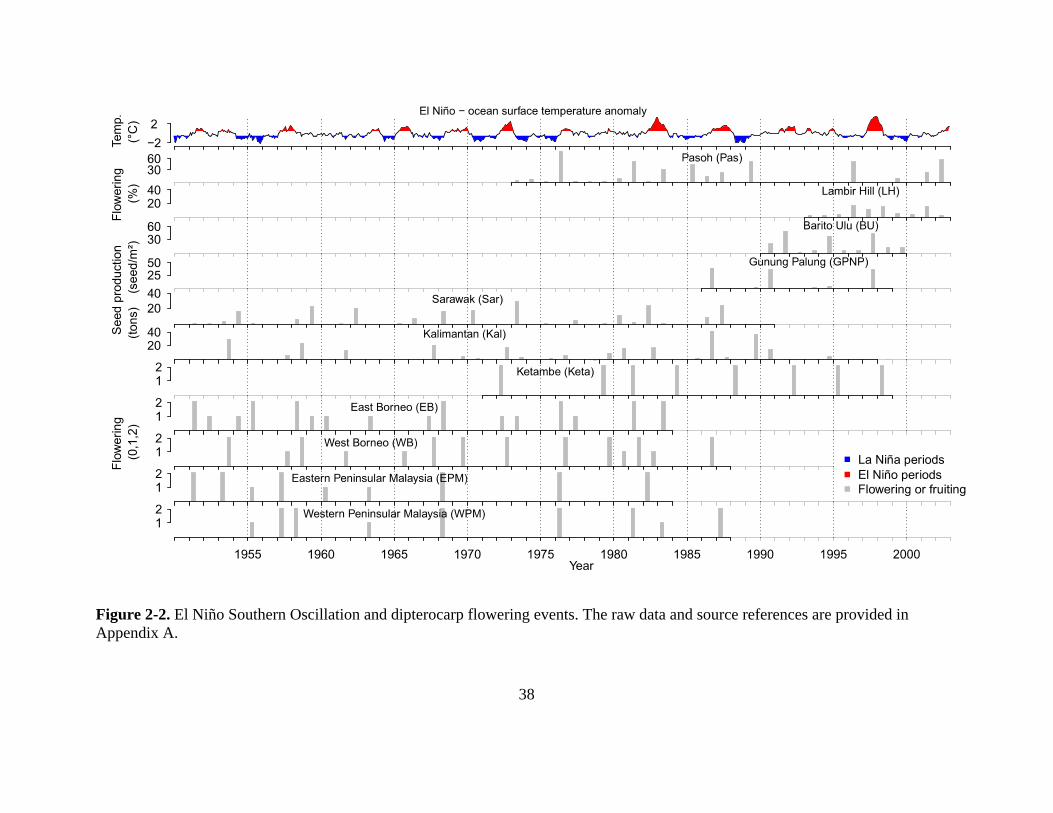
38
Figure 2-2. El Niño Southern Oscillation and dipterocarp flowering events. The raw data and source references are provided in Appendix A.

39
Figure 2-3. Trigger and resource tracking model predictions of dipterocarp mass flowering. For illustrating the resource tracking model, we plot monthly probabilities of flowering based on a resource accumulation mechanism that uses the NINO3 index as a proxy for resource availability. For illustrating the trigger model, we plot yearly probabilities based on daily minimum temperature preceding the flowering event (only one value is calculated based on the lowest daily temperature value in the preceding 6-9 month period).

40
Figure 2-4. Resource tracking as explanation for intra- and interspecific synchronization of flowering. Synchronization of individuals of one species with a lower (a) and higher (b) flowering threshold relative to the anomaly, and interspecific synchronization of species (c) with different flowering thresholds. (The model parameters are resource baseline (rb), anomaly size (as), and anomaly interval (ai) and flowering threshold (ft), flowering threshold (ftv), and number of species (ns). (See Appendix B & C for details).

41
Chapter 3 - Choosing species for reforestation in diverse forest communities: social preference versus ecological suitability
3.1. Summary
Choosing species for reforestation programs or community forestry in species-rich tropical
rainforest ecosystems is a complex task. Reforestation objectives, social preferences, and
ecological attributes must be balanced to achieve landscape restoration, timber production, or
community forestry objectives. Here we develop a method to make better species choices for
reforestation programs with native species when limited silvicultural information is available.
We conducted community surveys to determine social preference of tree species and inferred
their ecological suitability for open-field plantations from growth rates and frequency in forest
plots at different successional stages. Several species, for which silvicultural data was available,
were correctly classified as promising or unsuitable for open-field reforestation. Notably, we
found a strong negative correlation between ecological suitability indicators and socioeconomic
preference ranks (r = - 0.51). Only a single outlier species ranked very high in both categories.
This result highlights the difficulty of finding suitable native species for community forestry and
offers an explanation why reforestation efforts with native species often fail. We concluded that
the approach should be a useful first screening of species-rich forest communities for potential
reforestation species. Our results also support the view that species-rich tropical rainforests are
not an easily renewable natural resource in a sense that secondary forests will provide an
equivalent resource value to local communities.

42
3.2. Introduction
Government reforestation and community forestry programs are important activities to offset the
results of many decades of deforestation, which has left many countries and jurisdictions with an
impoverished and degraded land base (Hansen et al. 2013). Tropical forest ecosystems have been
particularly affected, and still experience a poor ratio of forest loss to forest gain (3.6:1 for the
2000-2010 period), despite promoting natural recovery after forest harvest and afforestation and
reforestation efforts (Hansen et al. 2013). Loss of tropical forest cover by geographic regions is
most severe in Southeast Asia (37% of total area remaining in 2005), followed by Central
America and Central Africa with 45%, and the Amazon basin with 56% forest cover remaining
(FAO 2005). Primary forest in Southeast Asia and Central America are most affected with 16%
and 18% original forest cover remaining intact, respectively (FAO 2005). Deforestation rates
also remain unsustainable with 1.2%/year of net forest loss between 1990 and 2005 in Central
America, 0.7%/year net forest loss in Southeast Asia, and 0.5%/year in Central Africa and the
Amazon region (FAO 2005).
Within major geographic regions, countries with high accessibility to forests and high population
densities have little primary forest left, often limited to mountainous regions. For example, in
Southeast Asia, the Philippines, Vietnam, Laos, and Cambodia had less than 6% primary forest
cover left in 2005 (FAO 2005). In these countries, land degradation, erosion, water supply
concerns, and landslides have often become common problems (Sidle et al. 2006). In recent
decades, the occurrence of landslides in Southeast Asia increased fivefold from 1970 levels due
to deforestation (Forbes and Broadhead 2013). With tropical cyclones making landfall five to
seven times a year in the Philippines, disasters are common with 35.4 per million fatalities

43
reported between 1950 and 2009, the second highest rate worldwide (Forbes and Broadhead
2013).
In response, government programs aimed at reforestation and protection of remaining forests
were created. Many countries in Southeast Asia imposed logging bans on natural forest lands,
phased out large timber operations and created large-scale government reforestation programs
and community forestry programs (Tumaneng-Diete et al. 2005, McElwee 2009, Pulhin and
Dressler 2009, Yonariza and Singzon 2010). Between 1985 and 1997 the percent of total
protected areas increased from 4% to 9% worldwide (Zimmerer et al. 2004), and community
forestry systems were widely adopted to produce locally required resources and reduce pressures
on harvesting the remaining natural forests (Molnar et al. 2007). Community forestry programs
worldwide increased by 70% to approximately 250 million hectares between 1985 and 2008
(Molnar et al. 2007). In addition, large-scale government reforestation program were created in
many jurisdictions, including the Philippines, where government program reforested 560,000
hectares between 1990 and 2000 (Cruz 2001).
Although large-scale reforestation programs that aim to rehabilitate degraded forest lands and
improve watershed properties are laudable, one potential concern is that most of these initiatives
rely on exotic species (Tolentino 2008). Large-scale reforestation programs in Southeast Asia
primarily plant Gemelina arborea, pine, Swietenia sp., Eucalyptus sp., Tectona grandis and
Acacia sp., because of readily available seed from international seed banks and well established
nursery protocols and silvicultural treatments for these species. As a result, exotics amount to
80% of all trees planted in tropical reforestation efforts (Cruz 2001, Tolentino 2008, Yonariza
and Singzon 2010). Exotic species monocultures, however, may change natural habitat
44
conditions, water balances, and nutrient cycles, typically in ways that do not support biodiversity
of native species (Hooper 2002). Additionally, exotic species can sometimes be vulnerable to
large outbreaks of insect pests and diseases, such as the Dothistroma Needle Blight in Central
America and Asia (Watt et al. 2009) and the Rhizina root disease in Southern Africa that have set
back reforestation efforts to the beginning (Wingfield et al. 2001a).
For large-scale reforestation and landscape restoration projects, native trees are therefore
preferred (FAO 2014), although native tree planting is not easy to carry out for lack of
silvicultural knowledge and regeneration ecology (Bautista 1990). Planting native species
exclusively is not required for community reforestation projects with limited ecological impacts
because of their small scale, but native species could also be beneficial here because the species
may be well known and valued by local communities for their non-timber benefits (Peters et al.
1989, Lacuna-Richman 2002, Mangaoang and Pasa 2003, McElwee 2008). In the Philippines,
community forestry with native species has shown some success in the form of “rainforestation
farming” programs, which combine native species for reforestation with some exotic fruit trees
to support local livelihoods (Goltenboth 2004, Vilei 2009, Schneider et al. 2014). Similar
initiatives are sponsored throughout the world by regional governments and international
agencies, including the Reducing Emissions from Deforestation and forest Degradation
(REDD+) program, the largest global initiative to combat deforestation, foster sustainable forest
management, and fight rural poverty (Agrawal and Angelsen 2009). As a result of these
programs, Asian tropical regions are experiencing planted or spontaneous forest regrowth in
more than 50% of sites of tropical forest degradation (Rudel 2012).

45
In support of such programs, this research aims to make better-informed species selections for
reforestation programs based on the ecology and socioeconomic desirability of tree species. The
primary objective of this paper is to develop a screening method for potential reforestation
species when silvicultural information is lacking. To identify early-succession species, suitable
for reforestation under open field conditions, we investigate if standard inventory plot data can
yield the required ecological information. Our expectation is that high frequency and basal area
in early-successional plots is associated with pioneer species and that will do well when planted
in degraded sites. Our second objective is to assess social preferences and find species with
early-successional ecological characteristics that are also highly valued as reforestation species
by local communities. While our research is a regional case study, we aim at developing a
simple, low-cost approach to screen species-rich communities for potential reforestation species
that can be applied to other regions and forest communities.
3.3. Materials and methods
3.3.1. Study site and ecological data
Our study site is the North Negros Natural Park (NNNP), located in Silay City of Negros
Occidental Province, Philippines (Fig 3-1). The NNNP was initially established in 1935 as a
timber reserve (Hamann et al. 1999, Hamann 2002), but expanded in 2005 and declared a Nature
Reserve to protect a high biodiversity, including many rare, endemic and endangered plant and
animal species. Previous botanical assessment in 1999 found 92 different species of 39 families,
with 50% of the trees coming from the Dipterocarpaceae, Lauraceae, Sapotaceae, Burseraceae

46
and Melastomaceae families. The most common individuals were of the Litsea luzonica,
Canarium asperum, Platea excels and Palaquium sp. species representing a sub-montane forest
ecosystem without a pronounced dry season (Hamann et al. 1999).
The experimental study plots are on the northwestern slope of Mt. Mandalagan close to Mt. Silay
(10°38.0’ N, 123°13.0’ E) at an average elevation of a 1000 m. The three experimental plots
were chosen to represent early-, mid-, and late-successional stages. They include a 1.61 hectare
plot in an early-successional forest area cleared for pasture and abandoned in 1975, a 1.71
hectare plot in a mid-successional forest destroyed through bombing during World War II and a
5.15 hectare area of old-growth forest not known to be cleared in the past 100 years. In the entire
forested area truly undisturbed forest is difficult to find because of proximity to settlement.
However, areas surveyed are on a rugged terrain and prevented logging industry from harvesting
trees. Low intensity use by the community involves rattan, firewood and seedling collection.
Some areas of the forest have been sub planted with coffee by the community.
The plot size was determined via species-area curves, so that further increases in plot size would
not capture additional species (except very rare species). While this approach captures most
species that would be considered for reforestation in a local area, the approach does not yield
comprehensive information for a larger geographic region, for example other islands in the
Philippines. Rather, our approach is meant to be easily repeatable to screen other species-rich
communities for local reforestation programs elsewhere.
Tree measurements were made three times over an 18 year period in 1995, 2003 and 2012 at all
three successional plots, where all trees more than 10 centimeters DBH were measured and
47
permanently tagged. Measurements for these trees included DBH, crown position, survival. New
recruiting trees recorded during the 2003 and 2012 measurements were also permanently tagged.
Seed sizes used in the analysis in this paper were obtained from a previous botanical survey
(Hamann et al 1999). Species diversity was evaluated based on frequency data using the
Shannon–Weaver index (Shannon and Weaver 1948).
3.3.2. Survey of social preferences
A survey of local knowledge of native tree uses in North Negros Natural Park was conducted
through questionnaires and picture guide developed from the botanical inventory effort. The
questionnaire was designed with open ended questions about forest use and given to community
members employed as forest guards of the protected area. Forest guards were a useful focus
group because they were recruited from the portion of the population that was forest-dependent,
in part to provide alternative livelihoods to forest extraction. While they may not represent a
completely unbiased sample of the preferences of the local forest-dependent population, they
provided an opportunity to efficiently assemble a local knowledge base of social preferences and
uses of local tree species. The questionnaires were given at the general assembly and included
forest guards from five municipalities around the North Negros Natural Park, Silay, Talisay,
Victorias, E.B. Magalona and Sagay with 47 respondents. The forest guards filled out the
questionnaire on their own with instructions given to the group prior to the start. All
questionnaires from 3 general assemblies were analyzed as one group.
In compliance with Canadian research ethics requirements for community surveys, the
involvement in the questionnaire was voluntary and the reasons and use of this data were
48
explained to the respondents before giving the questionnaire. Participation could be terminated
by the respondents at any time during or after the completion of the questionnaire and the
incomplete questionnaires were not used in the analysis. Respondents had the right to request
that their answers not be used in the study for a month after the completion of the questionnaire.
The questionnaire asked respondents to list tree species that the community uses as a source of
food, lumber, firewood, medicine, and charcoal making or to the forest for general ecological
observations (for example, use of fruit trees by wildlife). The responded listed local names of
tree species they considered important to the community with their uses. Local names were later
matched with a scientific name using a species guide developed during the first forest assessment
that contains 92 species of trees found in the North Negros Natural Park in 1995 (Hamann et al.
1999). The importance was ranked by combining the number of uses noted by respondents and
the number of respondents that mention the species. The highest-ranking trees are those that have
several uses and were mentioned by many people as important to the community.
3.3.3. Statistical analysis of plot data
To analyze which native species have an early-successional life history syndrome, we derived
three variables for each species at each successional plot. They are: 1) relative frequency,
calculated as the number of trees per hectare for each species, 2) basal area, calculated as the
total stem area per hectare of each species, and 3) growth increment among measurements in
1995, 2003, and 2012, calculated as the relative change in basal area. Growth rates were missing
for some species because measurements were not available in one of the survey times. Growth
data was not always available in one interval for rare species because of mortality, or became

49
available in the second interval because of recruitment. To use this data, we estimated the growth
rate for the missing year with a linear mixed model implemented with the ASReml (Butler et al.
2007) for R programming environment (R Core Team 2014). Rather than calculating means
across multiple survey times, we use best linear unbiased estimates (BLUEs) from the linear
mixed model. These estimates conform to straight means if there are no missing values, and
otherwise provides an unbiased estimate of the true mean.
To visualize groups of putative early- and late-successional life history syndromes, we applied
nonmetric multidimensional scaling (NMDS) of the nine variables, implemented with nmds
function of the ecodist package (Goslee and Urban 2007) for the R programming environment.
This scaling technique works by calculating a multivariate distance matrix based on the available
measurements, and subsequently ordinate the observations based on this matrix (Kruskal 1964).
Here, we used a Bray-Curtis distance matrix, suitable for presence absence and quantitative
measurements in community ecology data to ordinates the observations with NMDS. One
purpose of the NMDS ordination is to search for similarities in the multivariate dataset to find
easy to measure variables, such as frequencies, that may stand for other, harder to get variables
such as growth rates. The separation of data by successional syndrome was verified by plotting
seed sizes of known species, with larger seed sizes usually belonging to species of late-
successional syndromes (Budowski 1965, Bazzaz and Pickett 1980). The species with missing
data estimated with best linear unbiased predictions with ASReml were left out of the original
ordination and their NMDS scores were later determined with the predict function to avoid a
biased ordination because of poor data quality. The NMDS scores of species corresponding to
successional syndromes were plotted against social preference data from the questionnaire, and
the relationship was quantified with a Pearson correlation analysis.
50
3.4. Results
3.4.1. Characteristics of experimental plots
The selected forest plots show largely typical characteristics of a successional series regarding
basal area, tree density, and species diversity (Fig. 3-2). Notable is the reversal of expected
density in the early- and mid-successional plot, because of many trees in the early-successional
plot having several stems counted as a single tree. Before the second field season, a strong
typhoon hit the area and many smaller trees fell or were destroyed by branches falling from large
trees, causing the density of small trees (DBH 10-20cm) to decline. The basal area measurement,
driven by large trees was not significantly reduced, however, with little mortality in the large
diameter classes. Species diversity, measured by the Shannon–Weaver index, declined over time
in the mature plot, while it increased in the successional plots. The early-successional plot’s high
diversity was driven by the evenness and not the richness of species. The early-successional plot
has the fewest species but nearly half occur in high frequency (relative frequency > 5 trees/ha)
compared with a third of species occurring in high frequency in mid- and late-successional plots.
51
3.4.2. Successional syndromes of tree species
The NMDS of ecological tree data (Fig. 3-3) explains 89% of the variance in the dataset in two
dimensions. In NMDS, dimensions are not orthogonal, and therefore we do not report variance
explained for individual dimensions. Vectors in the plot indicate how original measurements are
related to NMDS dimension scores. The length reflects the strength of the correlation and the
direction indicates positive or negative correlations between dimensions and original variables.
Points in the plot represent tree species and their positions indicate associations with original
measurements. For example, species toward the right have high frequency and basal area in the
early-successional plot, and show high growth rates in the late-successional plot. Further, we
scale the plots based on a life history trait often associated with a successional syndrome: seed
size. For gray dots, no data on seed size was available.
Dimension 1 in Fig. 3-3 is strongly associated with an early-successional syndrome. High
frequency and basal area in the early-successional plot are positively correlated with this axis,
although the growth rate is negatively correlated, indicating that the species that fall on the right
side of this plot have reached maturity in the early-successional plot. These species are also
correlated with high growth relates on the late-successional plot, where this species group
vigorously recruits in gaps after typhoon disturbances shortly after the plot series was
established. Dimension 2 weakly separates late- and mid-successional species groups, with
putative mid-successional species correlating primarily along the second dimension (species
toward the top of the plot) and show little association with the first dimension. Putatively late-
successional trees correlate with each dimension and are located toward the top and left areas of
the plot. Large seed sizes are usually associated with mid- or late-successional species

52
(Budowski 1965, Bazzaz and Pickett 1980) and are grouping on the left and top area of the
ordination.
3.4.3. Socioeconomic importance of tree species
Surveys of social tree uses resulted in 71 tree species mentioned by survey participants, of which
three-quarters were native and one-quarter introduced species (Appendix D). Of the native
species, 35 were found in the ecological monitoring plots evaluated in this study (Table 3-1).
Plant families that ranked high in social importance (based on number of uses and number of
participants that mentioned them) include Dipterocarpaceae, Fabaceae and Lauraceae, with five
or more highly valued species each. Dipterocarpaceae, also known as Philippine mahogany are
some of the most important tropical timber species. Dipterocarps are primarily used locally for
construction and furniture making. Fabaceae contain fast growing, nitrogen fixing tree species
with dense wood valued for charcoal production and lumber for construction. Lauracea are the
second dominant tree species group in the upland forests of Southeast Asia, highly valued for
their timber as well.
The most common uses mentioned across all species are traditional timber values. Construction,
furniture making, and lumber constituted 48% of all mentioned use of native and non-native
trees by the community in this study (Appendix D). Next in importance are the species used for
charcoal and firewood, constituting 17% of all species-use combinations, although species used
for firewood and charcoal can easily be substituted by any other tree species. Species that had
mostly non-timber uses accounted for 28% of species-use combinations, with Fabaceae,
Guttiferae, Icainaceae, Moraceae, Lauraceae and Sapotaceae families mentioned prominently
53
for their use as fruit trees for wildlife and for human consumption. Medicinal use accounted for
5.6%, and included species of the families Moraceae, Meliaceae, Lauraceae, Fagaceae, and
Icainaceae.
To identify species for reforestation that have economic uses and are suitable for open-field
reforestation, we plotted the Dimension 1 from Fig. 3-3 where high scores indicated early-
successional species as a function of their social preference from Table 3-1 (Fig. 3-4). The most
desirable species should fall into the upper right quarter of this graph. Notably, we observed a
negative correlation between inferred ecological suitability and social preference ranks (r=-0.41,
p=0.015, df=42). If two outliers are excluded (Fig. 3-4, A.phi - Agathis philippinensis and S.con
- Shorea contorta), the correlation is more pronounced (r=-0.51, p=0.003, df=42).
3.5. Discussion
3.5.1. Social preference versus ecological suitability
The negative association between ecological suitability indicators and social preference ranks
highlights the difficulty of finding suitable native species for community forestry where social
acceptability is essential and planting efforts are often restricted to abandoned farmland.
Nevertheless, the realism of the proposed approach is highlighted particularly saliently by the
two outlier species in Fig. 3-3, Agathis philippinensis and Shorea contorta.

54
Agathis philippinensis has a native range from Indonesia to the Philippines and related species
are well regarded in Australia and New Zealand, where the species group is known as kauri,
valued for a variety of products made from their resin (Lacuna-Richman 2006). Agathis
philippinensis cannot survive in open-field plantations but can only be sub planted in secondary
forest in enrichment efforts (Orwa et al. 2009). Our analysis correctly identified the species as
late-successional species. Shorea contorta is a dipterocarp species native to Southeast Asian
forests, known as white lauan in the Philippines and is marketed for its wood qualities
worldwide. In this study, it had a high preference rank as well (Table 3-1 & Appendix D). In
contrast with Agathis this species is known to grow well in full sunlight unlike most other
dipterocarp species (Schneider et al. 2014) and was correctly classified in this study as an early-
successional species.
Further, we note that there are many early-successional species in the category of medicinal uses.
Thus, in this use category, the negative relationship between socioeconomic preference and
ecological suitability is weaker and provides an opportunity for species selection. Some
examples include the use of Ficus septica roots to cure boils and to eliminate access water, while
the leaves have antirheumatic properties and relieve headaches (Lanting and Palaypayon 2002).
The bark of Shorea contorta is used for cough or as an astringent while the wood decoction is
used to treat tumors (Lanting and Palaypayon 2002). Another example is Casuarina
equisetifolia, the leaves of which have antifungal and antibacterial properties and are used
traditionally to treat gonorrhea and stomach infections (Doyle and Aalbersberg 1998). Species
with medicinal uses are commonly found in the early-succesional group, which produce a host of
secondary metabolites and allelochemicals as protection against herbivores and for other
interspecies defenses (Bryant et al. 1983).

55
3.5.2. Native forests are not easily renewable
Our results indicate that species-rich Dipterocarp forests may not be an easily renewable natural
resource with respect to their usefulness and desirability to forest-dependent communities. Late-
successional tree species have more uses as timber and non-timber products, whereas, early-
successional secondary forests and planted forests do not serve social needs of forest-dependent
communities as original native forests. Previous research on economic valuation of mature
tropical forest has shown that old-growth forest bring the highest economic benefits from non-
timber forest products (Peters et al. 1989) and forest products from diverse forests can provide a
diversity of marketable products to local communities (Pattanayak and Sills 2001). Studies from
the Philippines also show that non-timber forest products, particularly the resin of Agathis
philippinensis, can be a major source of livelihood for forest communities (Lacuna-Richman
2002). Alternative uses, such as plantation forestry or a cattle pasture compared unfavorably in
valuations (Peters et al. 1989). Although this study found traditional timber uses rather than non-
timber products to be the most important socioeconomic feature in contrast with Peters et al.
(1989) those values were largely restricted to late-successional species. Other studies also find
majority of households relying on timber uses for subsistence in forest dependent communities in
Vietnam (McElwee 2008). Our results therefore confirm the importance of forest conservation
and restraint in resource extraction from existing natural forests. Further research and trials in
artificial propagation of old growth species is also needed as these species have limited seed
sources, they are difficult to establish and are targets for extraction while they provide most of
ecological and economic benefits,
56
Our data also points to a potential explanation of why reforestation efforts with native species
often fail. Typically, highly valued native trees used in local reforestation programs are late-
successional species. However, late-successional species usually cannot survive the
environmental stress associated with open-field plantation such as high insolation, dry and
degraded soil conditions (Uhl et al. 1988). In the Philippines, for example, large-scale
reforestation programs use a few native species, mostly dipterocarps, planted on small areas that
show lower growth rates compared with exotics (Otsamo et al. 1997, Tolentino 2008). Other
programs in the Philippines that focus on reforestation with a high diversity of native species,
such as the “rainforestation farming” program, are small in scale and expensive to implement
(Vilei 2009).
3.5.3. Reforestation compromises are necessary
The negative association between ecological suitability indicators and social preference ranks
highlights the difficulty of finding suitable native species for community forestry where social
acceptability is essential and planting efforts are often restricted to abandoned farmland. In our
surveys we noted many replies for uses of exotic species in local communities, accounting for
one-quarter of all species-use combinations. Including exotic species in small-scale, short
rotation community forestry programs appears to be a sensible choice according to our surveys.
Such programs should focus on high value and employ a variety of species for generating a
reliable source of income (Lamb 1998, Leopold et al. 2001, Hartley 2002). The alternative
choice of fast-growing, early-successional native species with few local uses may not meet the
necessary socioeconomic criteria.
57
For large-scale afforestation projects to restore watershed services, and restore forest cover at the
landscape level, we would discourage using exotic species. Although it is relatively easy to
successfully establish large-scale monocultures of exotic trees with well-known propagation and
planting techniques, the associated loss of biodiversity and the risk of unintended ecological
impacts are well documented (Hooper 2002, Sayer et al. 2004, Carnus et al. 2006). In this case,
planting a variety of native early-successional species would be the best first step to reestablish
forest cover (Chazdon 2008). Such secondary forests will not provide immediate benefits to the
communities, but over time natural regeneration (Lee et al. 2005, Piiroinen et al. 2015, Wolfe et
al. 2015) or enrichment planting with highly valued native species (Paquette et al. 2009, Ashton
et al. 2014) may restore the original economic and ecological benefits to local communities.
Alternatively, high-value late-successional species may be established more rapidly by the initial
use of early-successional species as nurse trees to shade out grasses and herbs and planting high
valued canopy species after a few years (Ashton et al. 2001).
3.5.4. General guidelines for species selection
Our original expectation of being able to identify a suite of easy to measure, quantitative
indicators for promising reforestation species from observation plots proved more difficult than
expected. For example, growth rates of early-successional species in our study were highly
dependent on stand history. In the early-successional plot used in this study early-successional
species were already reaching maturity, resulting in low growth rates. In contrast, regeneration in
forest gaps after typhoon damage in the late-successional plot resulted in rapid growth of early-
successional species. Nevertheless, grouping species by similarity in their inventory plot
58
measurements (Fig. 3-3), yielded interpretable ecological information and we would expect
useful (while not necessarily identical) results if the approach was applied elsewhere in a
different forest community with plots of somewhat different successional histories.
Information on suitability of species for reforestation under open-field conditions and degraded
sites can, of course, most reliably be obtained from planting trials, but they involve an
investment of time and resources if carried out for many species. Such trials can identify species
with growth rates and survival that compares favorably with exotic species, as research in Costa
Rica (Butterfield 1996), Panama (Hooper 2002, Wishnie et al. 2007), and Indonesia (Otsamo et
al. 1997). The suitability of a range of native species for reforestation can further be enhanced by
an initial cycle of genetic tree improvement (Leakey and Simons 1997). However, this involves
long-term investments that can only be made for a few species.
A first round of screening of species-rich forest communities for suitable reforestation species
therefore remains an important problem to solve. Life history attributes, such as small seed size,
also corresponded well to successional syndromes inferred from inventory plot statistics. Data
may be obtained for other regions from databases such as TRY (http://www.try-db.org).
Similarly, plot inventory data may be obtained for analysis from international data collection
efforts such as BIEN (http://bien.nceas.ucsb.edu). We propose that screening for such indicators
of early-successional life history strategies should be an important first step in narrowing species
choices for reforestation. Ecological indicators, combined with social surveys data can rapidly be
generated to support new, large-scale reforestation programs such as those initiated under the
Reducing Emissions from Deforestation and Forest Degradation (REDD+) programs that include

59
objectives such as on biodiversity conservation and providing livelihoods for the local
communities (Agrawal and Angelsen 2009).
3.6. Literature cited
Agrawal, A. and A. Angelsen. 2009. Using community forest management to achieve REDD+
goals. Pages 201-212 in A. Angelsen, editor. Realising REDD+. National Strategy and Policy Options. Center for International Forestry Research, Bogor Barat, Indonesia.
Ashton, M. S., C. V. S. Gunatilleke, I. A. U. N. Gunatilleke, B. M. P. Singhakumara, S. Gamage,
T. Shibayama, and C. Tomimura. 2014. Restoration of rain forest beneath pine plantations: a relay floristic model with special application to tropical South Asia. Forest Ecology and Management 329:351-359.
Ashton, M. S., C. V. S. Gunatilleke, B. M. P. Singhakumara, and I. A. U. N. Gunatilleke. 2001.
Restoration pathways for rain forest in southwest Sri Lanka: a review of concepts and models. Forest Ecology and Management 154:409-430.
Bautista, G. M. 1990. The forestry crisis in the Philippines - nature, causes, and issues.
Developing Economies 28:67-94. Bazzaz, F. A. and S. T. A. Pickett. 1980. Physiological ecology of tropical succession: a
comparative review. Annual Review of Ecology and Systematics 11:287-310. Bryant, J. P., F. S. Chapin, III, and D. R. Klein. 1983. Carbon/nutrient balance of boreal plants in
relation to vertebrate herbivory. Oikos 40:357-368. Budowski, G. 1965. Distribution of tropical American rain forest species in the light of
successional processes. Turrialba 15:40-42. Butler, D., B. R. Cullis, A. R. Gilmour, and B. J. Gogel. 2007. ASReml-R Reference Manual.
Technical Report, Queensland Department of Primary Industries. Toowoomba, Australia. Butterfield, R. P. 1996. Early species selection for tropical reforestation: A consideration of
stability. Forest Ecology and Management 81:161-168. Carnus, J. M., J. Parrotta, E. Brockerhoff, M. Arbez, H. Jactel, A. Kremer, D. Lamb, K. O'Hara,
and B. Walters. 2006. Planted forests and biodiversity. Journal of Forestry 104:65-77.
60
Chazdon, R. L. 2008. Beyond deforestation: restoring forests and ecosystem services on degraded lands. Science 320:1458-1460.
Cruz, R. V. O., W. M. Carandang, R. D. Lasco, L.U. dela Cruz, E. Tolentino, Jr., R. V.
Dalmacio, L. L. Rebugio, A. B. Palacpac, L. D. Camacho and N. C. Bantayan. 2001. State-of-the-Art Review of Forest Restoration in the Philippines. College of Forestry and Natural Resources, University of the Philippines Los Baños College, Laguna, Philippines.
Doyle, M. and W. Aalbersberg. 1998. Medicinal Plants in the South Pacific. World Health
Organization, Manila, The Philippines. FAO. 2005. Global Forest Resources Assessment 2005. Progress Towards Sustainable Forest
Management. Food and Agriculture Organization of the United Nations, Rome, Italy. FAO. 2014. The State of the World's Forest Genetic Resources - Thematic Study. Genetic
Considerations in Ecosystem Restoration using Native Tree Species. Food and Agriculture Organization of the United Nations, Rome, Italy.
Forbes, K. and J. Broadhead. 2013. Forests and Landslides: the Role of Trees and Forests in the
Prevention of Landslides and Rehabilitation of Landslide-Affected Areas in Asia. Second edition. RAP Publication for Food and Agriculture Organization of the United Nations. Bangkok, Thailand :vii + 61 pp.
Goltenboth, F. a. C.-P. Hutter. 2004. New options for land rehabilitation and landscape ecology
in Southeast Asia by "Rainforestation Farming". Journal for Nature Conservation 12:181-189.
Goslee, S. C. and D. L. Urban. 2007. The ecodist package for dissimilarity-based analysis of
ecological data. Journal of Statistical Software 22:1-19. Hamann, A. 2002. The North Negros Forest Reserve: a biodiversity hotspot at risk. Silliman
Journal 43:83-90. Hamann, A., E. B. Barbon, E. Curio, and D. A. Madulid. 1999. A botanical inventory of a
submontane tropical rainforest on Negros island, Philippines. Biodiversity and Conservation 8:1017-1031.
Hansen, M. C., P. V. Potapov, R. Moore, M. Hancher, S. A. Turubanova, A. Tyukavina, D.
Thau, S. V. Stehman, S. J. Goetz, T. R. Loveland, A. Kommareddy, A. Egorov, L. Chini, C. O. Justice, and J. R. G. Townshend. 2013. High-resolution global maps of 21st-century forest cover change. Science 342:850-853.

61
Hartley, M. J. 2002. Rationale and methods for conserving biodiversity in plantation forests. Forest Ecology and Management 155:81-95.
Hooper, E., R. Condit, and P. Legendre 2002. Responses of 20 native species to reforestation
strategies for abandoned farmland in Panama. Ecological Applications 12:1626-1641. Kruskal, J. B. 1964. Nonmetric Multidimensional-Scaling - a numerical method. Psychometrika
29:115-129. Lacuna-Richman, C. 2002. The socioeconomic significance of subsistence non-wood forest
products in Leyte, Philippines. Environmental Conservation 29:253-262. Lacuna-Richman, C. 2006. The use of non-wood forest products by migrants in a new
settlement: experiences of a Visayan community in Palawan, Philippines. Journal of Ethnobiology and Ethnomedicine 2:36.
Lamb, D. 1998. Large-scale ecological restoration of degraded tropical forest lands: the potential
role of timber plantations. Restoration Ecology 6:271-279. Lanting, M. V. and C. M. Palaypayon. 2002. Forest Tree Species with Medicinal Uses.
Ecosystems Research and Development Bureau of the Department of Environment and Natural Resources. Laguna, The Philippines.
Leakey, R. R. B. and A. J. Simons. 1997. The domestication and commercialization of
indigenous trees in agroforestry for the alleviation of poverty. Agroforestry Systems 38:165-176.
Lee, E. W. S., B. C. H. Hau, and R. T. Corlett. 2005. Natural regeneration in exotic tree
plantations in Hong Kong, China. Forest Ecology and Management 212:358-366. Leopold, A. C., R. Andrus, A. Finkeldey, and D. Knowles. 2001. Attempting restoration of wet
tropical forests in Costa Rica. Forest Ecology and Management 142:243-249. Mangaoang, E. O. and A. E. Pasa. 2003. Preferred native tree species for smallholder forestry in
Leyte. Annals of Tropical Research 25:25-30. McElwee, P. D. 2009. Reforesting “bare hills” in Vietnam: social and environmental
consequences of the 5 million hectare reforestation program. AMBIO: A Journal of the Human Environment 38:325-333.
McElwee, P. D. 2008. Forest environmental income in Vietnam: household socioeconomic
factors influencing forest use. Environmental Conservation 35:147-159.

62
Molnar, A., M. Liddle, C. Bracer, A. Khare, A. White, and J. Bull. 2007. Community-Based Forest Enterprises: Their Status and Potential in Tropical Countries. ITTO Technical Series - International Tropical Timber Organization, Yokohama, Japan :73 pp.
Orwa, C., A. Mutua, R. Kindt, R. Jamnadass, and S. Anthony. 2009. Agroforestree Database: a
Tree Reference and Selection Guide Version 4.0. World Agroforestry Centre, Nairobi, Kenya.
Otsamo, A., G. Ådjers, T. Hadi, J. Kuusipalo, and R. Vuokko. 1997. Evaluation of reforestation
potential of 83 tree species planted on Imperata cylindrica dominated grassland – a case study from South Kalimantan, Indonesia. New Forests 14:127-143.
Paquette, A., J. Hawryshyn, A. V. Senikas, and C. Potvin. 2009. Enrichment planting in
secondary forests: a promising clean development mechanism to increase terrestrial carbon sinks. Ecology and Society 14:31.
Pattanayak, S. K. and E. O. Sills. 2001. Do Tropical forests provide natural insurance? the
microeconomics of non-timber torest product collection in the Brazilian Amazon. Land Economics 77:595-612.
Peters, C. M., A. H. Gentry, and R. O. Mendelsohn. 1989. Valuation of an Amazonian rainforest.
Nature 339:655-656. Piiroinen, T., P. Nyeko, and H. Roininen. 2015. Natural establishment of indigenous trees under
planted nuclei: A study from a clear-felled pine plantation in an afrotropical rain forest. Forest Ecology and Management 345:21-28.
Pulhin, J. M. and W. H. Dressler. 2009. People, power and timber: The politics of community-
based forest management. Journal of Environmental Management 91:206-214. R Core Team. 2014. R: A Language and Environment for Statistical Computing. R Foundation
for Statistical Computing, Vienna, Austria. Rudel, T. K. 2012. The human ecology of regrowth in the Tropics. Journal of Sustainable
Forestry 31:340-354. Sayer, J., U. Chokkalingam, and J. Poulsen. 2004. The restoration of forest biodiversity and
ecological values. Forest Ecology and Management 201:3-11. Schneider, T., M. S. Ashton, F. Montagnini, and P. P. Milan. 2014. Growth performance of sixty
tree species in smallholder reforestation trials on Leyte, Philippines. New Forests 45:83-96.

63
Shannon, C. E. and W. Weaver. 1948. A mathematical theory of communication. Bell System Technical Journal 27:379-423.
Sidle, R. C., A. D. Ziegler, J. N. Negishi, A. R. Nik, R. Siew, and F. Turkelboom. 2006. Erosion
processes in steep terrain—truths, myths, and uncertainties related to forest management in Southeast Asia. Forest Ecology and Management 224:199-225.
Tolentino, E. L. 2008. Restoration of Philippine native forest by smallholder tree framers. Pages
319-342 D. J. Snelder and R.D. Lasco, editors. Smallholder Tree Growing for Rural Development and Environmental Services. Springer Science and Business Media B.V. , Gainville, Florida.
Tumaneng-Diete, T., I. S. Ferguson, and D. MacLaren. 2005. Log export restrictions and trade
policies in the Philippines: bane or blessing to sustainable forest management? Forest Policy and Economics 7:187-198.
Uhl, C., R. Buschbacher, and E. A. S. Serrao. 1988. Abandoned pastures in eastern Amazonia. I.
Patterns of plant succession. Journal of Ecology 76:663-681. Vilei, S. 2009. Adoptability of a complex agro-forestry project for smallholders on a Philippine
island. Pages 292-305 in K. Piatek, B. Spong, S. Harrison, and D. McGill, editors. Seeing the Forest Beyond the Trees. New Possibilities and Expectations for Products and Services From Small-Scale Forestry. IUFRO 3.08 Small Scale Forestry Symposium, June 7-11, 2009. Division of Forestry and Natural Resources, Morgantown, West Virginia.
Watt, M. S., D. J. Kriticos, S. Alcaraz, A. V. Brown, and A. Leriche. 2009. The hosts and
potential geographic range of Dothistroma needle blight. Forest Ecology and Management 257:1505-1519.
Wingfield, M., J., B. Slippers, J. Roux, and B. D. Wingfield. 2001. Worldwide movement of
exotic forest fungi, especially in the tropics and the southern hemisphere. BioScience 51:(134-140).
Wishnie, M. H., D. H. Dent, E. Mariscal, J. Deago, N. Cedeño, D. Ibarra, R. Condit, and P. S.
Ashton. 2007. Initial performance and reforestation potential of 24 tropical tree species planted across a precipitation gradient in the Republic of Panama. Forest Ecology and Management 243:39-49.
Wolfe, B., D. Dent, J. Deago, and M. Wishnie. 2015. Forest regeneration under Tectona grandis
and Terminalia amazonia plantation stands managed for biodiversity conservation in western Panama. New Forests 46:157-165.

64
Yonariza and S. B. Singzon. 2010. Post-logging ban timber tree planting in Thailand and the Philippines. Pages 1-28 in G. C. J. Saguiguit, editor. 7th Society for Ecological Restoration European Conference on Restoration Ecology, 24-26 March 2010. Agriculture & Development Discussion Paper Series, Avignion, France.
Zimmerer, K. S., R. E. Galt, and M. V. Buck. 2004. Globalization and multi-spatial trends in the
coverage of protected-area conservation (1980-2000). Ambio 33:520-529.

65
Table 3-1. Local uses of native tree species in the North Negros Natural Park. The table summarizes selected data from the questionnaires with 47 forest guards that listed species of socioeconomic importance and their uses. The uses are grouped into lumber/construction (Lum), varnish/resin (Var), charcoal/firewood (Cha), edible products (Food), ecological-food for animals (Eco), medicine (Med). The summary includes sum of total uses for each species (Tot), number of respondents that mention this species (N) and rank that combines the number of uses and the number of respondents. Local names could refer to several related species (reflected by multiple codes), although only one primary species name is given. Refer to Appendix D for a full list of local species uses.
Species (Code) Family Uses Statistics
Lum Var Cha Food Eco Med Tot N Rank
Agathis philippinensis (A.phi) Araucariaceae 2 3 1 0 0 0 6 37 43 Palaquium luzoniensis (P.luz) Sapotaceae 4 0 0 1 0 0 5 20 25 Shorea contorta (S.con) Dipterocarpaceae 4 0 1 0 0 1 6 17 23 Garcinia brevirostris (G.bre/sp2) Guttiferae 4 0 0 0 1 0 5 15 20 Syzygium gracile (S.gra/S.sp2) Myrtaceae 4 0 0 0 1 0 5 15 20 Cinnamomum mercadoi (C.mer) Lauraceae 3 0 2 1 0 1 7 12 19 Platea excelsa (P.exe) Icainaceae 0 0 0 1 3 1 5 11 16 Shorea polysperma (S.pol) Dipterocarpaceae 3 0 0 0 0 0 3 12 15 Dillenia philippinesis (D.phi) Dilleniaceae 0 0 0 1 1 0 2 12 14 Prunus fragrans (P.fra) Rosaceae 2 0 0 1 2 0 5 9 14 Lithocarpus sp. (L.sp1) Fagaceae 1 0 0 1 2 1 5 8 13 Memexylon brachybotris (M.bra) Melastomataceae 2 0 0 0 1 0 3 9 12 Mallotus sp.(M.sp1) Melastomataceae 2 0 0 0 1 0 3 9 12 Bischofia javanica (B.jav) Euphorbiaceae 2 0 0 0 1 0 3 8 11 Garcinia binucao (G.bin/sp1) Guttiferae 0 0 1 1 0 0 2 8 10 Arthrocarpus heterophyllus(A.het) Moraceae 1 0 0 1 0 0 2 7 9 Actinodaphne sp. (A.sp1) Lauraceae 0 0 2 0 1 0 3 6 9 Ficus crysolepis (F.chr/sp6/sp8) Moraceae 0 0 0 0 3 0 3 6 9 Myrica esculenta (M.esc) Myricaceae 0 0 0 0 1 0 1 8 9 Shorea almon (S.alm) Dipterocarpaceae 3 0 1 0 0 0 4 5 9 Pometia pinnata (P.pin) Sapindaceae 1 0 1 1 0 1 4 4 8 Trema orientalis (T.ori) Urticaceae 1 0 0 0 1 0 2 5 7 Memexylon cumingii (M.cum) Melastomataceae 0 0 1 0 0 0 1 6 7 Alphitonia excelsa (A.exc) Rhamnaceae 1 1 0 0 0 0 2 3 5 Palaquium sp. (P.sp1) Sapotaceae 1 0 0 0 0 0 1 4 5 Ficus benjamina (F.ben/F.sp4) Moraceae 0 0 0 0 1 0 1 3 4 Litsea tomentosa (L.tom) Lauraceae 1 0 0 0 0 0 1 3 4 Ficus septica (F.sep) Moraceae 0 0 0 0 1 0 1 2 3 Canarium villosum (C.vil) Burseraceae 1 0 0 0 0 0 1 1 2

66
Figure 3-1. Map of the study area located within the North Negros Natural Park on Negros Island in the Philippines. The questionnaires were collected from local stakeholders that live in the communities around the park.
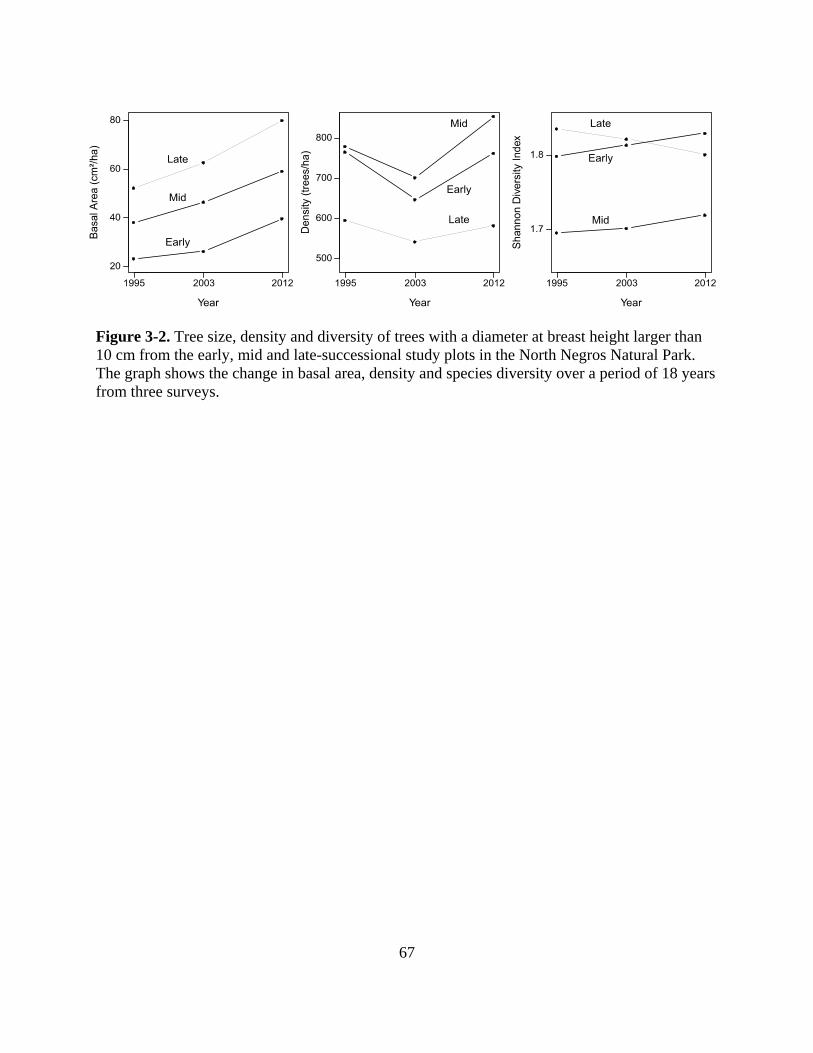
67
Figure 3-2. Tree size, density and diversity of trees with a diameter at breast height larger than 10 cm from the early, mid and late-successional study plots in the North Negros Natural Park. The graph shows the change in basal area, density and species diversity over a period of 18 years from three surveys.
68
Figure 3-3. Ordination of tree species by similarity in frequency and growth rate in early (E), mid (M) and late-successional (L) study plots. The size of dots represents seed size (which was not used in the ordination), except when data was not available (gray dots). Dimension 1 of the non-metric multidimensional scaling (NMDS) procedure separates early successional species on the right from late-successional species on the left. Dimension 2 further separates putatively mid-successional species (high values) from late-successional species.
69
Figure 3-4. Scatter plot of native species ranked by socioeconomic importance (x-axis) and inferred ecological suitability for open field plantation (y-axis). The trend line and r-value exclude the outliers (A.phi and S.con). However, the relationship remains statistically significant and moderately strong (r = -0.41, outliers included or r=-0.51, outliers excluded).

70
Chapter 4 - Effects of land use and protected area management on socioeconomic conditions of forest dependent communities: a case study in the North Negros Natural Park, Philippines
4.1. Summary
Forest-dependent communities in the tropics typically rank lower in socioeconomic status than
agricultural and urban communities, and improving the livelihood choices of forest-dependent
communities while protecting forest resources can be a difficult task. Additional conflicts can
arise where biodiversity conservation objectives further restrict resource access to forest
dependent communities. In this study, we investigate how land use, land use planning, and
protected area management affects communities in and around a major forest reserve on Negros
island, Philippines. Using mixed methods we conduct a socioeconomic analysis at two scales: a
provincial-level analysis relating land use to socioeconomic well-being, and a community-level
analysis contrasting villages that are close versus distant to a protected area. While rural
communities have fewer amenities and infrastructure than urban centers in general, the
community-level analysis showed that socioeconomic well-being was higher in areas close to
protected areas. The study provides an example of forest conservation that does not necessarily
result in lower socioeconomic status for local communities.
4.2. Introduction
Forest dependent communities that rely on forest products for livelihoods are among the poorest
in developing countries, including Southeast Asia (Kummer 1992a, Kummer 1992b, Kummer

71
and Turner 1994, Saastamoinen 1996). This has not always been the case, with commercial
logging being the largest source of revenue between 1960-80s (Tumaneng-Diete et al. 2005).
The level of resource extraction has, however, often been unsustainable and causing
deforestation and loss of livelihood options. Despite efforts to reclaim deforested lands, tropical
forests are undergoing a net loss in recent years (Hansen et al. 2013). Primary forest in Southeast
Asia and Central America are most affected with 16% and 18% original forest cover remaining
intact, respectively by 2005 (FAO 2005, Koh 2007). In Southeast Asia, the Philippines
experienced one of the worst rates of forest loss with 6% of primary forest left, mostly found on
steep mountain tops and in the uplands (FAO 2005).
Rural communities in Southeast Asia rely on forest products for subsistence directly through
logging and indirectly by collecting non-timber forest products for firewood, medicine, and food
sources (Lacuna-Richman 2002, McElwee 2008, Cagalanan 2013, Chechina and Hamann 2015).
About 20 million people in the Philippines, or 22% of the population live within public forest
lands that are designated for forest use (Tumaneng-Diete et al. 2005). Close to 80% of these
forest communities rely on farming as primary source of livelihood and most households have an
income lower than the poverty threshold of one dollar a day per person (Pulhin and Inoue 2008).
Overall the incidence of poverty, or percent of households below the poverty threshold, in the
Philippines is 25% (Reyes et al. 2012). However, agricultural and forest-dependent households
have a poverty rate of 57% compared with 17% in urban households (Reyes et al. 2012). On
average, the incidence of poverty is strongly correlated with provinces that have larger forest
cover in the Philippines (Tumaneng-Diete et al. 2005).
Poverty incidence may be an incomplete measure of well-being because many rural subsistence
based communities do not have formal income. Other measures of well-being can include
education levels, rates of malnutrition, among others. For example, rural remote households that

72
have large family sizes and where the household head has little or no formal education are
among the poorest and experience a high incidence of malnutrition (Reyes et al. 2012). There is
less government investment in infrastructure in rural communities because of their remoteness
and few households have running water or electricity (Reyes et al. 2012). Many poor
communities are in the uplands, where the land is less suited to most forms of cultivation, aside
from fruit trees, and where regulations prohibit farming on steep slopes. Most upland
communities do not have secure land titles. Lack of land tenure negatively affects the behavior of
its occupants encouraging indigenous and forest communities to practice unsustainable land
management as they have no incentive to conserve the land and forest resources (Bautista 1990).
As a result of rising poverty in rural areas and diminishing natural resources, there is a need for
government programs that increase forest cover for land and watershed protection, and at the
same time give control of natural resources to communities and facilitate sustainable livelihoods
(Reyes et al. 2012). Recently, the forest policy in the Philippines has taken account of these
multifaceted problems with programs including Integrated Conservation and Development
Projects (ICDP), Integrated Social Forestry (ISF, introduced in 1982), Communality Based
Forestry Management (CBFM, introduced in 1995) and National Integrated Protected Areas
System (NIPAS, introduced in 1992) (Bautista 1990, Cagalanan 2013). By the year 2000, these
programs accomplished reforestation on 560,000 hectares (Cruz 2001), and currently 15% of
total land area of the Philippines are managed under ISF or CBFM programs (Pulhin and
Dressler 2009).
A central idea of community forestry programs is to give control of forest lands back to the
communities, thereby encouraging them to manage their forest resources responsibly. However,
ISF or CBFM programs in the Philippines are still under government control, imposing strict
rules on how the land should be managed by the communities (Gauld 2000) with little to no
73
local benefits (Pulhin and Dressler 2009). Several studies find that the livelihood opportunities
from community forestry programs are not distributed equally and are received mostly by
wealthy households (McElwee 2008, Cagalanan 2013). As little as 4% of the community may
benefit from these forestry programs (Pulhin and Dressler 2009). However, positive examples
exist as well, showing that strong local leadership, stakeholder involvement in management and
strong social capital can improve outcomes of community forestry (Magno 2001).
For the most part, community forestry programs focus on planting fast-growing profitable, often
exotic tree species, which do not serve biodiversity and conservation objectives (Cruz 2001,
Tolentino 2008, Yonariza and Singzon 2010). On the other hand, protected natural area
management focuses primarily on conserving the biodiversity and ecosystem functions, which
can impose restrictions on the forest resources that communities rely on for subsistence (Cernea
and Schmidt-Soltau 2008). Therefore, protected areas can exacerbate poverty by limiting access
to land and imposing a change to livelihood activities that previously involved forest uses such
as logging or charcoal production (McElwee 2008). On the other hand, protected areas can
reduce poverty in communities where the focus is redirected towards using alternative, high-
value forest products or focus on eco-tourism activities, and where the land under protection is
not suitable for agriculture (Ferraro et al. 2011). As a result of the variable impact that protected
areas and forest programs have on the poor, there is a need to understand socioeconomic
conditions in these communities and to target the dual mandate of poverty alleviation and forest
conservation (McElwee 2009, McCay and Jones 2011, Groom and Palmer 2012).
In our study, with a focus on the relationship between protected areas and the well-being of
surrounding rural communities, we examine the land use of Negros Occidental in relation to
socioeconomic outcomes. We conduct a provincial-level analysis for Negros Occidental to
analyse the effects that land cover has on socioeconomic status of communities. Further, we
74
conduct a village level analysis of communities from 11 municipalities around the protected area
to gain additional insight into the socioeconomic conditions around protected areas. We compare
the socioeconomic status of rural communities surrounding a protected natural park to other rural
communities farther from the park as well as urban centers. Specifically, we compare the
benefits and costs to communities associated with a protected forest reserve with rural
communities outside the reserve. The analysis relies on several sources of secondary data
supplemented with interview data to identify differences in socioeconomic status. Our aim is to
quantify relationships between forest conservation and poverty alleviation in rural communities.
Given the potential efficiencies in using mostly secondary sources for this assessment, we also
evaluate the utility of secondary data sources in defining socioeconomic status in this region.
4.3. Materials and methods
4.3.1. Study region and area
We focus our research on the province of Negros Occidental in the West Visayan region of the
Philippines. We analyze the socioeconomic indicators of rural barangays (villages) surrounding
the North Negros Natural Park (Fig. 1). The study area includes 32 municipalities of Negros
Occidental Province and 235 barangays that surround the protected areas, shown in gray in Fig.
1. Negros Occidental experienced deforestation and land degradation because of commercial
logging. Commercial logging created roads that opened unsettled regions for settlement and
agricultural development, mainly sugar plantations. As the sugar industry was booming in the
1950s, waves of migrant workers came in search for work. The migration creating increased
demand for land (Mulkins 2000) putting stress on already diminishing resources. By 1996 only

75
3% of the original intact forest cover remained (Hamann 2002) that is far below the national
average forest cover of 20% (Munez 1999). The majority of residents are substance farmers
(Mulkins 2000). Similar to other forest communities in the Philippines (Lacuna-Richman 2002)
they rely on forest resources to gather building materials, firewood, medicine and food.
Deforestation has decreased the livelihood of many people in Negros Occidental (Garcia 2001).
The province has one of the few significant natural forests left in the central Visaya islands group
of the Philippines (Hamann 2002). The forest was established as a timber reserve in 1946, but by
2005 became a protected area under the NIPAS act and named the North Negros National Park
to preserve high diversity of species, many of which are rare, endemic and endangered (Hamann
et al. 1999, Hamann 2002, Chechina and Hamann 2015). Although logging is not allowed in
protected areas, illegal logging of old growth trees occasionally occurs in the park. Other
resource extractions include rattan collection, gathering of non-timber products for food and
medicine (such as fruits, seeds, bark and leaves), small tree removal for charcoal, and wildlife
hunting (Hamann 2002). An ISF project was established in the park in 1995, and significant
deforestation was curbed since the establishment of community forestry and protected area
declaration.
4.3.2. Planned land use and actual land cover data
We collect land cover data because it can indicate potential for alternative livelihoods for a
community and it also represents available natural resources. We compare land cover data to
planned land use for Negros Occidental. Planned land use data (Fig. 2, left panel) was extracted
from the Negros Occidental Land Use Plan 2012 prepared by the provincial planning office
(PPDO 2011). Actual land cover (Fig. 2, right panel), was derived from Envisat MERIS Fine
Resolution (300 m) data (Arino et al. 2012). Forest cover is composed of two layers from the

76
remotely sensed data: the closed to open (>15%) broadleaved evergreen or semi-deciduous forest
(>5m) and mosaic forest or shrub land (50-70%) / grassland (20-50%). Crop cover is composed
of rain fed croplands and post-flooding or irrigated croplands (or aquatic) layers. Cropland often
involves areas of large agricultural plantations, which is mostly sugarcane in Negros Occidental.
Mosaic vegetation is composed of mosaic cropland (50-70%) / vegetation
(grassland/shrubland/forest) (20-50%), mosaic vegetation (grassland/shrubland/forest) (50-70%)
/ cropland (20-50%), and closed to open (>15%) (broadleaved or needle leaved, evergreen or
deciduous) shrubland (<5m) layers. Mosaic vegetation represents primarily subsistence farms
scattered throughout the landscape among other vegetation. Mangrove is composed of closed to
open (>15%) broadleaved forest regularly flooded (semi-permanently or temporarily) - fresh or
brackish water and closed (>40%) broadleaved forest or shrubland permanently flooded - saline
or brackish water layers. Finally, artificial surface class includes buildings, roads and similar
areas (urban areas >50%) layer from the Envisat data.
Land cover summary statistics were extracted for each municipality in Negros Occidental and for
each of 285 barangays of the study area using zonal statistics in ArcGIS (ESRI 2011). The
planned land use data was obtained as vector data, which was converted to a 30 meter resolution
raster, and then evaluated in the same way to obtain percent of planned land use for each
municipality and 285 barangays. Municipality and barangay boundaries for the province were
extracted from the Global Administrative Areas Database (Global Administrative Areas 2012).
We calculate the percent of actual land cover in each planned land use category (forest land,
protected area, sugarcane production, agriculture and rice, fisheries and mangrove, and build up
areas) to analyze the degree to which the land use plan is being reflected by actual land cover.
77
4.3.3. Socioeconomic data
We base our methodology on several studies of forest dependent communities in Canada that use
socioeconomic data from census subdivision to analyze community well-being, defined as social
or economic benefits that communities gain (Patriquin et al. 2009, Stedman et al. 2011). We first
look at municipality level data on socioeconomic indicators from 32 municipalities in Negros
Occidental (Fig 4. municipal boundaries). Municipal level data on poverty, crime, home
amenities (electricity, sanitation, potable water), number of facilities (heath centers and
elementary schools), malnutrition, elementary school enrollment, population density, and total
area was derived from the Negros Occidental Social and Economic Trends Report 2009 (PPDO
2011). This data is based on a 5% population sample and provides various measures of economic
well-being in the municipality (PPDO 2011). We use data on investment in infrastructure and
services, home amenities (electricity, potable water, and sanitation), elementary school
enrollment, child malnutrition data and crime rates as indicators for social well-being of a
community.
We conduct a Pearson’s correlation analysis of land cover classes with socioeconomic indicators
for municipalities of Negros Occidental to evaluate the well-being (Beckley et al. 2008).
Correlation values (Carnus et al.) and significance (p-values) are given for this analysis. The
significance values are adjusted for multiple inferences using the Holm method (Holm 1979)
within each land class group.
In a second analysis we focus on 11 municipalities that surround the North Negros National Park
and contain 285 barangays (Fig. 1, barangay boundaries). The barangay level socioeconomic
indicators are different from the ones used for municipality level analysis for the lack of data
availability on barangay level. For example, poverty or employment rates are not collected at the

78
household or barangay level. For comparison, we collect indicators that are similar to the
indicators at the municipality level and add others such as number of precincts, markets, daycare
to substitute for lack of household amenities data. Barangay level demographic data on
population density and data on facilities, such as number of markets, health stations, daycare
centers, and elementary schools came from municipal planning department office for each
barangay. Data on crime against women and children came from the women’s desk at the
Philippines National Police office of each municipality. Child malnutrition data was gathered at
the municipal health centers. Number of registered and actual voters was gathered from the
municipal commission on election office. Elementary school enrollment data was gathered from
the Department of Education.
Based on the land use plan (PPDO 2011) we group the study area barangays into three groups as
follows: (1) rural barangays in or close to the protected areas, (2) rural barangays outside of
protected areas that are located in mostly agricultural settings and (3) urban barangays. We
summarize land cover classes for 235 barangays of the 11 municipalities around the protected
area (mean and standard deviation). Using the same groupings of barangays, we perform
permutational analysis of variance of socioeconomic indicators (Anderson and Braak 2003) with
the aovp function in lmPerm package in R programming environment (mean and standard errors
reported). The pairwise comparison were performed using Wilcoxon signed-rank test (Wilcoxon
1950) and the results were adjusted for multiple inferences using the Holm method. These non-
parametric methods were chosen because the socioeconomic data did not satisfy the assumption
of normality in all cases.

79
4.3.4. Interview data
We conduct 15 interviews with residents of forest dependent households in North Negros to
assess perception of community well-being. This group consisted of nine male and six female
between the ages of 18 and 74 with average of 42. The interviews took place in the barangay
Patag of Silay City, Negros Occidental. The barangay has 50% forest cover and is entirely
located inside the boundary of the of the protected forest area. Participants were chosen using
respondent driven sampling method (Salganik and Heckathorn 2004) to represent families living
closest to the forest and that depend on forest resources. Interviews were also conducted with 38
residents of Patag that live farther from the forest but in the boundary of the protected area and
are part of the ISF project that involves tree planting as part of the Japanese International
Cooperation Agency (JICA) initiative in the area. This group consisted of 22 female and 14 male
participants between the ages of 21 and 75 with an average age of 45.
The interviews were conducted with help of a local translator. The questionnaire was designed
with close-ended questions focused on the source of income and livelihood, how respondents
perceived their well-being, what trees and crops were planted by each household, how
respondents supplement their livelihood, and their feeling about the protected forest. The
involvement in the questionnaire was voluntary and the reasons and use of this data were
explained to the respondents before administering the questionnaire. Ethics approval for
interviews was obtained through the Human Research Ethics Review process at the University of
Alberta Ethics Board and on February 28, 2012 with one year validity.
80
4.4. Results
4.4.1. Land use plan and actual land cover
In Table 1 we report how actual land cover corresponds to planned land use, corresponding to
Fig. 2. Mosaic vegetation is the largest land cover in Negros Occidental and composes the
majority of planned land use classes. Forest land use is composed of majority mosaic vegetation
and protected areas also have majority mosaic vegetation and forest. Actual land cover shows
that much of the forest has been deforested and converted to degraded lands with mixed
subsistence farms (mosaic vegetation) and agricultural use (crops). Much of the cropland is
found in designated sugarcane production and agricultural land. Although sugarcane is
designated to be planted inland (Fig. 2, see sugarcane production in planned land use), most of it
is planted in lowlands and in areas designated for agricultural production. Artificial areas are
mostly located in areas designated for mangroves, mainly because of the coastal location.
4.4.2. Municipal-level socioeconomic analysis
The relationship between major land cover types (forest, crops, mosaic vegetation, mangrove,
and artificial surfaces) and socioeconomic indicators of 32 municipalities in Negros Occidental is
visualized in Fig. 3 with significant correlations reported in Table 2. The analysis reveals that
municipalities that have large scale agriculture (crops) have lower poverty rates, more amenities
such as homes with electricity and sanitation. Agricultural municipalities have more services
which are represented by more health stations. Agricultural land is located closer to urban
centers, which provided steady employment to surrounding communities and diversified

81
livelihood. Sugarcane plantations that are located in crop land areas also provide additional
seasonal work.
Areas that have mostly mosaic vegetation (areas of scattered farmland and mixed vegetation) or
forest cover are highly correlated with poverty and negatively with amenities such as electricity
and sanitation. These areas are mostly rural with subsistence type farming that does not provide
many opportunities for employment. In places where subsistence farming is the main livelihood,
families cannot afford to have children in school and many have children help on a farm instead
of attending schools. These municipalities have somewhat higher rates of enrollment in
elementary schools (not significant) than agriculture intensive areas.
4.4.3. Barangay-level socioeconomic analysis
Difference in land cover among rural barangays in or around the protected area, distant from the
protected area and urban barangays are shown in Table 3. Barangays in protected areas have the
lowest population density, are located further from the municipal center, have most of the forest
land, larger total area and least of cropland. Other rural areas have most of the cropland and
mosaic vegetation. Urban barangays have the highest population density, lowest total area, most
of the mangrove areas, and large amount of cropland.
Difference in socioeconomic status of the three classes of barangays as above are shown in Table
4. Barangays in or around the protected forest area have higher rates of elementary school
enrollment then other rural barangays. Even though there are fewer schools per capita, the
enrollment rates are highest in urban centers, which could be explained by bigger schools
inferred from the low student to teacher ratio. The schools are more accessible (data not shown)
because of smaller distances and smaller total area in urban centers. Barangays outside the
82
protected area are closer to urban centers and may have access to elementary schools where the
enrollment rates may increase because of children from nearby rural centers attending these
schools. It is likely that there is less need to build schools in rural centers if they are already in
proximity to an urban center school. Malnutrition and crime rates were not significantly different
between the two rural groups. Urban barangays have low child malnutrition rate (not significant)
but higher crime. Barangays in protected areas have lowest voter registration rates than other
rural communities and urban centers that could be associated with fewer registration precincts.
4.4.4. Socioeconomic characteristics of a forest dependent community based on
interviews
Interviews of 15 participants in forest-dependent community from within the protected area
revealed that they perceive themselves as relatively poor. Most of households have average
earnings of 5,000 Philippine pesos per month (equivalent of 120 USD, less than one dollar per
day per person for an average household of five). People in the community primarily rely on
farming for subsistence. Half of respondents (7 of 15) noted farming as their only livelihood. A
few people own small local stores, cater to local tourism or are employed by the municipality of
Silay as forest guards or working in the ISF program. Interviewees noted that resources, power,
and economic benefits are not equally distributed among the community with overwhelming
majority (95%) not having access to these benefits and having no power for decision making.
The 38 respondents of the reference group that were part of the integrated social forestry (ISF)
program had slightly higher income and more diversified livelihood options including
community animal husbandry program established with the help of non-governmental
development agencies. Of 38 respondents, more than half were involved in alternative livelihood

83
activities to supplement farming. Only three of 38 participants worked seasonally on sugarcane
plantations.
Respondents from both groups said that the forest reserve increases their well-being. The
respondents from the ISF program also credited forest reserve as a source of additional
livelihood option through community forestry and involvement of foreign NGO that provided
them with funding. Others commented on the ecological benefits of the forest, mentioning that
the weather is favorable for farming as the forest cover brings plenty of rain. Two participants
attributed clean water to the remaining forest cover. Only one person in the Patag interview
group said that the forest reserve increased poverty in the community. In general most
community members interviewed agreed that the forest reserve positively affected their
livelihood.
4.5. Discussion
4.5.1. Protected areas in Negros Occidental are not poverty traps
Negros Occidental is heavily deforested with 13 percent forest cover, of which 3 percent is old
growth forest, and we perceived a strong drive to bring back the forest cover by the provincial
government, non-governmental organizations, and local communities. In provincial land-use
plans, significant amounts of land are designated for forest use, but most of this land is being
used for large scale or subsistence agriculture. It is clearly challenging to convert agricultural
land back to forest, especially in places that have a significant human population inside the
designated protected areas. Strategies that focus on enforcing environmental protection usually

84
either restrict forest use or relocate forest communities. Such restrictions and enforcements can
exacerbate poverty in rural areas by limiting livelihood choices (McCay and Jones 2011, Groom
and Palmer 2012).
Our results show that rural communities in or near protected areas do not necessarily have lower
indicators of socioeconomic well-being, in agreement with a previous study by Ferraro et al.
(2011). A more qualitative evaluation of living conditions via interviews revealed that protected
area management in Patag limited original livelihoods of hunting and logging, but also created
new livelihoods by employing former hunters and loggers as the local forest guards and allowing
people to collect non-timber forest products. This strategy appears to minimize destructive forest
while at the same time resulted in largely positive valuation of forest resources by local
communities. Even though we did not formally evaluate how this affects the culture and
traditions of the community, presently the traditional knowledge of local plants and animals is
being utilized and maintained.
Our results show that urban and rural communities differ in socioeconomic status with more
investment in services, infrastructure and commercial agriculture in urban areas.
Furthermore, socioeconomic status is greater in areas that have commercial agriculture than in
mostly forested and mosaic vegetation in municipal and barangay level. Even though agriculture
related occupation are indicators of poverty in the Philippines (Reyes et al. 2012), in Negros
Occidental, large-scale agriculture areas are located closer to urban centers and in the lowlands
that makes them accessible to markets, job opportunities, and other sources of income such as
fishing. There is more government investment in infrastructure and services in large-scale
agricultural areas as these places also tend to bring more income from taxes then subsistence
based areas. Most of these areas are dominated by large sugarcane plantations, owned by one
family and provide seasonal, intermittent employment with inhabitants in need of finding other
85
ways of subsistence during low seasons for sugarcane collection (Diprose and McGregor 2009).
The statistics do not reflect the income disparity between plantation owners, people with
permanent employment and sugarcane workers who are forced to look for alternative options in
low season.
Further, our results show that rural communities in or near protected areas experience higher
investment in infrastructure and services, show higher elementary school enrollment rates and
provide more area per capita for subsistence farming than communities farther away from
protected areas. Our study shows that protected areas do not necessarily cause or increase
poverty for surrounding communities, in agreement with previous study by Ferraro et al. (2011).
Therefore, there is evidence that NIPAS and CBFMP state programs are increasing livelihood
conditions in rural communities near protected areas, even if the funding for these programs are
fairly limited (Cagalanan 2013). Other studies have also shown that protected areas have
alleviated poverty in forest reserves in Thailand and Costa Rica (Andam et al. 2010) and in
long-term marine protected areas in Indonesia (Gurney et al. 2014). In all cases, the positive
effects were associated with increased diversification of livelihoods as a result of government
programs. A recent report by the International Union of Forest Research Organizations
highlights the pivotal role that the forest resources play by providing alternative food sources and
ecosystem services (IUFRO 2015). We therefore conclude that forest protection does not
necessarily has to conflict with resource needs by forest dependent communities.

86
4.5.2. Guidelines for using secondary socioeconomic data to assess well-being in
protected areas
Secondary data to assess the well-being of rural communities offers an efficient and cost-
effective way to explore socioeconomic status over large areas. A socioeconomic account of the
entire region is useful to observe general trends and associations of land use planning, actual land
use, and socioeconomic well-being. However, additional more qualitative local information can
complement the quantitative analysis by identifying the cause of the established relationships
between protected areas and socioeconomic benefits or costs to the community using more in-
depth household surveys and qualitative questionnaire methods (McElwee 2008). Focusing on
census data could be a first step in a multi-staged approach that includes household surveys in
targeted locations to establish the mechanisms by which protected area management may
influence the socioeconomic status of forest-dependent communities.
One limitation of census data is related to issues of availability. In our study, employment
records were not available for municipality or barangay level. Also poverty data were not
available for the barangay level analysis and other data must be substituted to infer
socioeconomic well-being. For example, poverty was highly correlated with head of households
that didn’t have school education, therefore enrollment in school is associated with more affluent
families (Reyes et al. 2012). In fact, poverty indicators only reflect economic well-being in terms
of earnings and are not sufficient in subsistence based communities where most of the population
does not have steady employment or income. Distance of communities from administrative
centers is an indicator of remoteness and is usually correlated with poverty as higher travel costs
mean lower return on agriculture and forest products. On the other hand, remoteness is usually
positively associated with income from tourism activities. As a result, the relationship between

87
poverty and distance is not linear as shown in a study by Ferraro et al. (2011). Child malnutrition
has a more straightforward positive relationship with poverty (Reyes et al. 2012). In summary,
indicators of socioeconomic well-being need to be interpreted carefully and need to be viewed
through analysis at different scales to understand both large scale associations of land use
planning and socioeconomic well-being and the underlying causes of the relationships.
The results of this study offer several conclusions about protected areas management and poverty
alleviation. First, ecological and socioeconomic goals can be achieved in protected areas
management when community livelihoods are incorporated into planning. In particular, balance
between curbing destructive activities while allowing non-destructive cultural use of the forest
area and investment in infrastructure seems to encourage conservation while alleviating poverty
conditions. Second, a variety of secondary socioeconomic data can show general status of forest
communities at a large scale. In conclusions, this study offers conservation planners insight on
using census data to evaluate community well-being.
4.6. Literature cited
Andam, K. S., P. J. Ferraro, K. R. E. Sims, A. Healy, and M. B. Holland. 2010. Protected areas
reduced poverty in Costa Rica and Thailand. Proceedings of the National Academy of Sciences 107:9996-10001.
Anderson, M. and C. T. Braak. 2003. Permutation tests for multi-factorial analysis of variance.
Journal of Statistical Computation and Simulation 73:85-113. Arino, O., J. J. Ramos Perez, V. Kalogirou, S. Bontemps, P. Defourny, and E. van Bogaert.
2012. Global Land Cover Map for 2009 (GlobCover 2009). European Space Agency (ESA), Paris, France.
Bautista, G. M. 1990. The forestry crisis in the Philippines - nature, causes, and issues.
Developing Economies 28:67-94.

88
Beckley, T. M., D. Martz, S. Nadeau, E. Wall, and B. Reimer. 2008. Multiple capacities, multiple outcomes: delving deeper into the meaning of community capacity. Journal of Rural and Community Development 3:56-75.
Cagalanan, D. 2013. Integrated conservation and development: impacts on households in a
Philippine park. Journal of Environment & Development 22:435-458. Carnus, J. M., J. Parrotta, E. Brockerhoff, M. Arbez, H. Jactel, A. Kremer, D. Lamb, K. O'Hara,
and B. Walters. 2006. Planted forests and biodiversity. Journal of Forestry 104:65-77. Cernea, M. M. and K. Schmidt-Soltau. 2008. Poverty risks and national parks: policy issues in
conservation and resettlement. World Development 36:2966-2966. Chechina, M. and A. Hamann. 2015. Choosing species for reforestation in diverse forest
communities: social preference versus ecological suitability. Ecosphere (in press). Cruz, R. V. O., W. M. Carandang, R. D. Lasco, L. U. dela Cruz, E. Tolentino, Jr., R. V.
Dalmacio, L. L. Rebugio, A. B. Palacpac, L. D. Camacho and Nathaniel C. Bantayan. 2001. State-of-the-Art Review of Forest Restoration in the Philippines. College of Forestry and Natural Resources, University of the Philippines Los Baños College, Laguna, Philippines.
Diprose, G. and A. McGregor. 2009. Dissolving the sugar fields: Land reform and resistance
identities in the Philippines. Singapore Journal of Tropical Geography 30:52-69. ESRI. 2011. ArcGIS Desktop: Release 10. Environmental Systems Research Institute, Redlands,
CA. FAO. 2005. Global Forest Resources Assessment 2005. Progress Towards Sustainable Forest
Management. Food and Agriculture Organization of the United Nations, Rome, Italy. Ferraro, P. J., M. M. Hanauer, and K. R. E. Sims. 2011. Conditions associated with protected
area success in conservation and poverty reduction. Proceedings of the National Academy of Sciences of the United States of America 108:13913-13918.
Garcia, J. T. and L. Mulkins. 2001. Ecological Management of a Residual Forest in Negros
Occidental, Philippines. The Experience of Marco Flores in Negros Occidental. Resource Efficient Agricultural Production – Canada, Ste-Anne-de-Bellevue, Quebec, Canada.
Gauld, R. 2000. Maintaining centralized control in community-based forestry: policy
construction in the Philippines. Development and Change 31:229-254. Global Administrative Areas. 2012. GADM Database of Global Administrative Areas
(Boundaries), version 2.0. University of Berkeley, Museum of Vertebrate Zoology and the International Rice Research Institute , Berkeley, California.
89
Groom, B. and C. Palmer. 2012. REDD+ and rural livelihoods. Biological Conservation 154:42-52.
Gurney, G. G., J. Cinner, N. C. Ban, R. L. Pressey, R. Pollnac, S. J. Campbell, S. Tasidjawa, and
F. Setiawan. 2014. Poverty and protected areas: An evaluation of a marine integrated conservation and development project in Indonesia. Global Environmental Change 26:98-107.
Hamann, A. 2002. The North Negros Forest Reserve: a biodiversity hotspot at risk. Silliman
Journal 43:83-90. Hamann, A., E. B. Barbon, E. Curio, and D. A. Madulid. 1999. A botanical inventory of a
submontane tropical rainforest on Negros island, Philippines. Biodiversity and Conservation 8:1017-1031.
Hansen, M. C., P. V. Potapov, R. Moore, M. Hancher, S. A. Turubanova, A. Tyukavina, D.
Thau, S. V. Stehman, S. J. Goetz, T. R. Loveland, A. Kommareddy, A. Egorov, L. Chini, C. O. Justice, and J. R. G. Townshend. 2013. High-resolution global maps of 21st-Century Forest Cover Change. Science 342:850-853.
Holm, S. 1979. A simple sequentially rejective multiple rest procedure. Scandinavian Journal of
Statistics 6:65-70. IUFRO. 2015. Forest, Trees and Landscapes for Food Security and Nutrition. A Global
Assessment Report. International Union of Forest Research Organizations, Vienna, Austria.
Koh, L. P. 2007. Impending disaster or sliver of hope for Southeast Asian forests? The devil may
lie in the details. Biodiversity and Conservation 16:3935-3938. Kummer, D. M. 1992a. Deforestation in the Postwar Philippines. 1st edition. The University of
Chicago Press, Chicago, Ilinois. Kummer, D. M. 1992b. Upland agriculture, the land frontier and forest decline in the Philippines.
Agroforestry Systems 18:31-46. Kummer, D. M. and B. L. Turner. 1994. The human causes of deforestation in Southeast-Asia.
Bioscience 44:323-328. Lacuna-Richman, C. 2002. The socioeconomic significance of subsistence non-wood forest
products in Leyte, Philippines. Environmental Conservation 29:253-262. Magno, F. 2001. Forest devolution and social capital - State-civil society relations in the
Philippines. Environmental History 6:264-286.

90
McCay, B. J. and P. J. S. Jones. 2011. Marine protected areas and the governance of marine ecosystems and fisheries. Conservation Biology 25:1130-1133.
McElwee, P. D. 2009. Reforesting “bare hills” in Vietnam: social and environmental
consequences of the 5 million hectare reforestation program. AMBIO: A Journal of the Human Environment 38:325-333.
McElwee, P. D. 2008. Forest environmental income in Vietnam: household socioeconomic
factors influencing forest use. Environmental Conservation 35:147-159. Mulkins, L. and R. Samson. 2000. From Sugarcane Monoculture to Agro-Ecological Village.
ILEIA Newsletter, Wageningen, The Netherlands. Munez, M. P. 1999. Decline of the Philippine forest. Environmental Science for Social Change
1:1-44. Patriquin, M. N., J. R. Parkins, and R. C. Stedman. 2009. Bringing home the bacon: Industry,
employment, and income in boreal Canada. Forestry Chronicle 85:65-74. PPDO. 2011. Negros Occidental Social & Economic Trends 2009. Provincial Planing and
Development Office of the Province of Negros Occidental. Bacolod, the Philippines. Pulhin, J. M. and W. H. Dressler. 2009. People, power and timber: the politics of community-
based forest management. Journal of Environmental Management 91:206-214. Pulhin, J. M. and M. Inoue. 2008. Dynamics of devolution process in the management of the
Philippine forests. International Journal of Social Forestry 1:1-26. Reyes, C. M., A. D. Tabuga, R. D. Asis, and M. B. G. Datu. 2012. Poverty and Agriculture in the
Philippines: Trends in Income Poverty and Distribution. Philippine Institute for Development Studies, Makati City, the Philippines.
Saastamoinen, O. 1996. Change and continuity in the Philipppine forest policy. Pages 121-139 in
M. Palo and G. Mery, editors. Sustainable Forestry Challenges for Developing Countries. Kluwer Academic Publishers, Dordrecht, the Netherlands.
Salganik, M. J. and D. D. Heckathorn. 2004. Sampling and estimation in hidden populations
using respondent-driven sampling. Sociological Methodology, 34:193-239. Stedman, R. C., M. N. Patriquin, and J. R. Parkins. 2011. Forest dependence and community
well-being in rural Canada: a longitudinal analysis. Forestry 84:375-384. Tolentino, E. L. 2008. Restoration of Philippine native forest by smallholder tree framers. Pages
319-342 in D. J. Snelder and R. D. Lasco, editor. Smallholder Tree Growing for Rural Development and Environmental Services. Springer Science and Business Media B.V. , Gainville, Florida.
91
Tumaneng-Diete, T., I. S. Ferguson, and D. MacLaren. 2005. Log export restrictions and trade
policies in the Philippines: bane or blessing to sustainable forest management? Forest Policy and Economics 7:187-198.
Wilcoxon, F. 1950. Some rapid approximate statistical procedures. Annals of the New York
Academy of Sciences 52:808-814. Yonariza and S. B. Singzon. 2010. Post-logging ban timber tree planting in Thailand and the
Philippines. Pages 1-28 in G. C. J. Saguiguit, editor. 7th Society for Ecological Restoration European Conference on Restoration Ecology, 24-26 March 2010. Agriculture & Development Discussion Paper Series, Avignion, France.
92
Table 4-1. Planned land use versus actual land cover for Negros Occidental. Refer to Fig. 4-2 for planned land use and actual land cover in Negros Occidental. Planned land use was derived from the Negros Occidental Social and Economic Trends 2009 report (PPDO 2011). Actual land cover classes were derived from 300 meter resolution Envisat MERIS remotely sensed data (Arino et al. 2012). See the methods section on land cover extraction and modifications.
Actual land cover %
Planned land use Forest (13.2%)
Crops (27.8%)
Mosaic vegetation (57.7%)
Mangrove (0.2%)
Artificial surfaces (0.1%)
Forest land (30%) 21.1 20.5 58.5 0.00 0.00
Protected area (9%) 38.8 15.6 45.6 0.00 0.00
Sugarcane production (36%) 7.50 29.9 62.5 0.09 0.00
Agriculture and rice (21%) 1.86 36.2 61.7 0.19 0.00
Fishpond/mangrove (2%) 10.8 44.0 37.9 4.00 3.42
Urban area (2%) 0.37 47.9 48.3 0.43 2.98

93
Table 4-2. Correlation analysis between socioeconomic indicators and actual land cover in Negros Occidental. Spearman rank correlation coefficient and p-value are given for the actual land cover (Fig. 4-2, right) for each municipality (n=32) in Negros Occidental and socioeconomic indicators (see Fig 4-3 for visualization of correlations). The significance of the correlation was adjusted for multiple inferences using the Holm method within land cover groups.
Actual land cover (%)
Socioeconomic indicators Forest Crop Mosaic
vegetation Mangrove Artificial surface
Poverty rate 2003 0.16 -0.45~ 0.57* -0.12 -0.31
Homes with electricity 2003 -0.32 0.61** -0.67*** 0.16 0.41
Homes with sanitation 2003 -0.23 0.61** -0.66*** 0.05 0.37
Homes with potable water 2003 0.02 0.11 -0.31 0.38 0.02
Child malnutrition 2003 -0.08 -0.21 0.43~ -0.21 -0.15
Crime rate 2010 -0.16 0.01 -0.10 0.02 -0.15
No. health stations/ person -0.46~ 0.45~ -0.29 0.09 0.31
No. elem. schools/ person 0.10 -0.34 0.37 -0.03 0.11
Elem. school enrolment 2007 0.12 -0.47~ 0.56* -0.07 -0.02 ~ p<0.1, * p<0.05, ** p<0.01, *** p<0.001

94
Table 4-3. Comparison of actual land use in barangays located the North Negros Natural Park and the ones outside the protected forest area. The mean and standard error (se) are given for rural barangays that are partially or fully located within a protected forest area (protected area, Fig. 4-2), all other rural barangays outside of protected area (other rural) and urban barangays (Goslee and Urban).
Planned land use
Actual land cover
Protected area mean (sd) (n=47)
Other rural mean (sd) (n=135)
Urban mean (sd) (n=53)
Population density (people/km2) 2.45 (2.84) 22.0 (90.0) 111.5 (141.6)
Distance from municipal center (km) 20.6 (9.74) 8.39 (7.25) 1.75 (3.49)
Forest cover (%) 15.1 (14.8) 5.03 (8.86) 5.3 (12.77)
Crops cover (%) 0.25 (0.81) 33.4 (38.1) 31.2 (44.2)
Mosaic vegetation cover (%) 57.9 (15.9) 58.2 (25.4) 31.3 (31.2)
Mangrove cover (%) 0.00 (0.00) 4.84 (13.9) 58.3 (56.7)
Artificial surface cover (%) 0.06 (0.19) 1.13 (1.89) 7.12 (9.62)
Total area (100 HA) 28.5 (21.6) 11.3 (12.0) 2.86 (4.99)
95
Table 4-4. Comparison of socioeconomic indicators of barangays located the North Negros Natural Park and the ones outside the protected forest area. The mean and standard error (se) are given for rural barangays that are partially or fully located within a protected forest area (protected area, Fig. 4-2), all other rural barangays outside of protected area (other rural) and urban barangays (Goslee and Urban). Permutational analysis of variance was performed for the three groups of barangays and followed up with pair-wise Wilcoxon rank sum tests to identify significant differences between socioeconomic indicators (marked with different letters). The significance of the tests was adjusted for multiple inferences using the Holm method.
Planned land use
Socioeconomic indicators
Protected area mean (se)
(n=47)
Other rural mean (se) (n=135)
Urban mean (se)
(n=53)
p-value (perm. Anova)
% Child malnutrition 8.54 (0.89) a 7.83 (0.52) a 5.95 (0.83) a 0.1776
% Crime against women & children 0.09 (0.02) a 0.12 (0.02) a 0.28 (0.05) b <0.0001
% Registered voters 51.2 (1.20) a 56.5 (1.11) b 62.4 (1.66) c <0.0001
No. precincts/person *1000 2.90 (0.13) a 3.31 (0.11) a 3.87 (0.17) b <0.0001
No. daycare/person*1000 1.00 (0.07) a 0.84 (0.06) b 0.42 (0.04) c <0.0001
No. markets/ person *1000 0.08 (0.02) a 0.05 (0.01) a 0.06 (0.02) a 0.8150
No. health stations/person*1000 0.37 (0.04) a 0.35 (0.02) a 0.31 (0.04) a 0.8150
No. elem. schools/person *1000 0.59 (0.04) a 0.44 (0.03) b 0.25 (0.08) c <0.0001
Student teacher ratio (elem. sch.) 37.3 (1.58) a 29.6 (1.48) b 15.7 (2.29) c <0.0001
% Elem. school enrolment 18.7 (0.96) a 15.0 (1.55) b 21.3 (7.19) c 0.0489
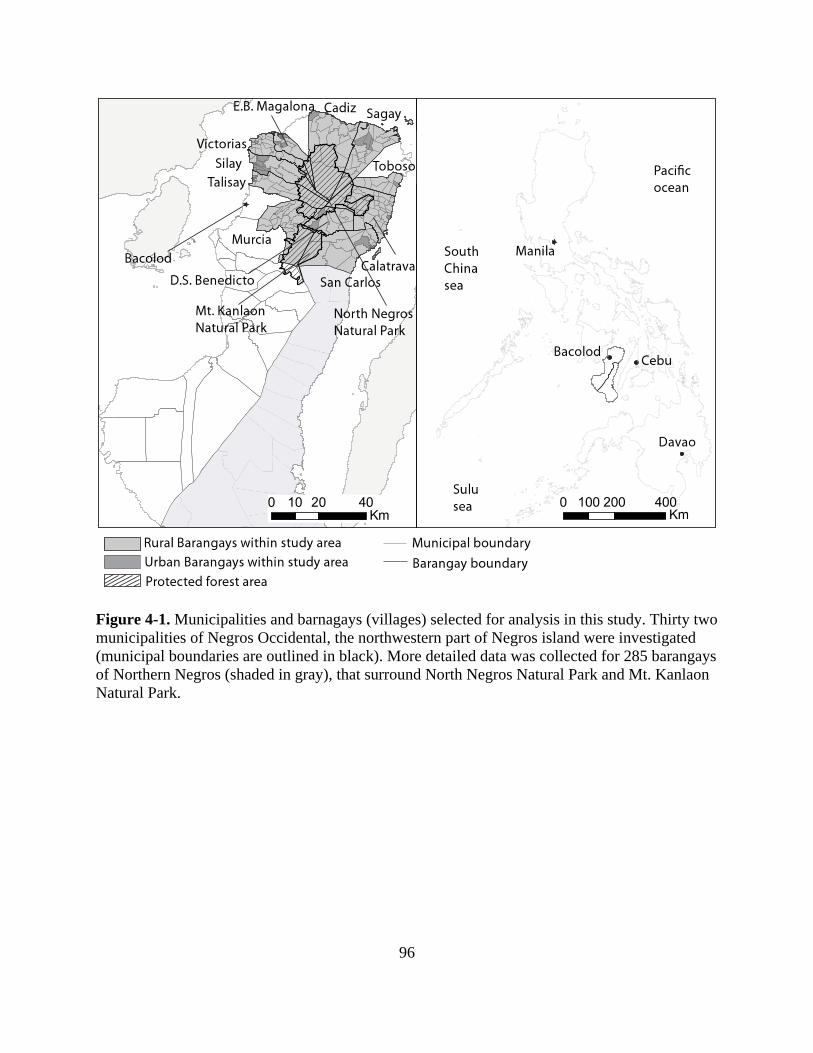
96
Figure 4-1. Municipalities and barnagays (villages) selected for analysis in this study. Thirty two municipalities of Negros Occidental, the northwestern part of Negros island were investigated (municipal boundaries are outlined in black). More detailed data was collected for 285 barangays of Northern Negros (shaded in gray), that surround North Negros Natural Park and Mt. Kanlaon Natural Park.
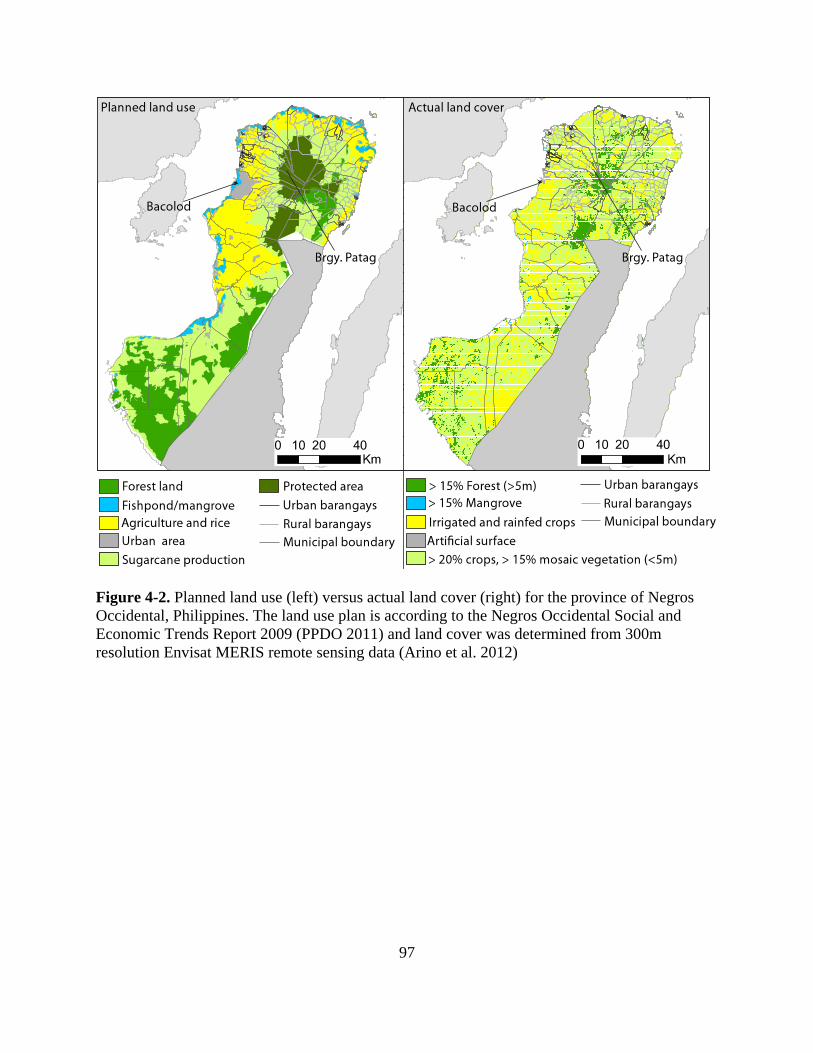
97
Figure 4-2. Planned land use (left) versus actual land cover (right) for the province of Negros Occidental, Philippines. The land use plan is according to the Negros Occidental Social and Economic Trends Report 2009 (PPDO 2011) and land cover was determined from 300m resolution Envisat MERIS remote sensing data (Arino et al. 2012)
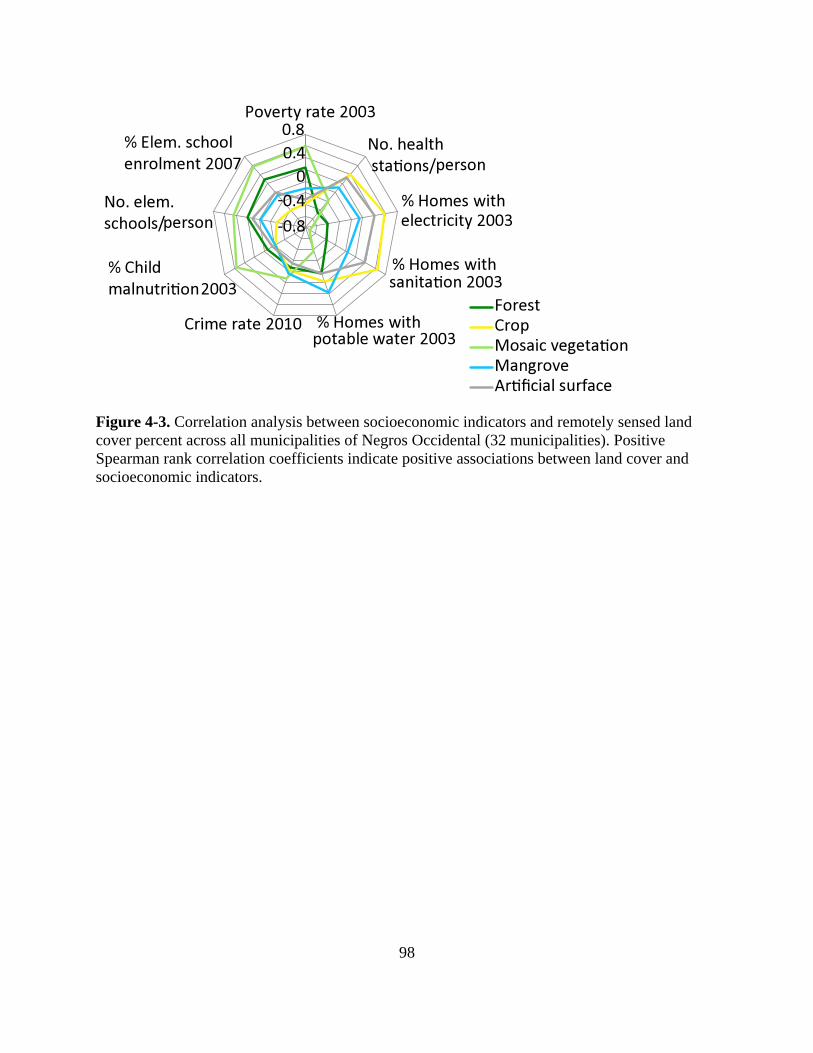
98
Figure 4-3. Correlation analysis between socioeconomic indicators and remotely sensed land cover percent across all municipalities of Negros Occidental (32 municipalities). Positive Spearman rank correlation coefficients indicate positive associations between land cover and socioeconomic indicators.
99
Chapter 5 - Conclusions
The objective of this PhD thesis was to improve tropical reforestation initiatives by addressing
three major issues concerning recovery of dipterocarp forests in Southeast Asia. The first is the
unique biology of the dipterocarps. The unpredictability of mass flowering events and
recalcitrant seeds pose a serious problem to forest managers as mobilization of resources and
people for large scale seed collection activities require significant time for preparation. The
second issue with tropical forests in Southeast Asia is the lack of silvicultural knowledge of other
native species that may be used for reforestation. The majority of the government reforestation
and community forestry projects use exotic species that have few ecological and socioeconomic
values. The third issue is that conservation and reforestation efforts have to include local
communities, which are mostly poor and rely at least in part on forest resources for their
livelihood. Community forestry programs often provide benefits only to a small group of the
targeted community while protected areas can restrict use of forest resources. Understanding
how protected area planning and land use planning affects local communities is therefore also
important to effectively protect local resources.
Revisiting my original research questions outlined in the introductory chapter of my thesis work
contributed the following knowledge to sustainable forest management, and to increasing
ecological and socioeconomic benefits to local communities:
1. What are the environmental factors that control mass flowering in dipterocarp forests?
Using flowering and fruiting data from 11 sites and regions in Southeast Asia covering a time
period of 53 years, I find that there are no environmental triggers of dipterocarp mass flowering
common to all sites and regions. Model fit using environmental variables (precipitation,

100
temperature, cloud cover, vapor pressure and El Niño) shows inconsistencies among regions,
with precipitation and El Niño showing better predictability in Borneo sites and regions and
temperature in Peninsular Malaysian sites and regions. El Niño is strongly associated with
climate in Borneo, with the relationship weakening in Peninsular Malaysia. Further investigation
showed that El Niño has variable effect on local climate by its interaction with the monsoons.
South Pacific facing regions of Borneo experience warmer temperatures and drier weather from
August to December because of hot air masses being driven into the region during the summer
monsoon. On the contrary, the north and east-facing regions of Northern Borneo and Peninsular
Malaysia see the strongest influences of El Niño phases during the winter monsoon causing
reduced precipitation from January to April.
2. Can resource accumulation models successfully predict flowering events in dipterocarp
forests?
Hypothesizing that resources are related to interannual variation of precipitation and El Niño, I
test models that use climate variables as proxy for resources which accumulated over time to
induce flowering in dipterocarps. The resource accumulation models show better predictive
ability than environmental trigger models. To further explain interspecific flowering
synchronization, this chapter explores a theoretical model with added parameters that include a
resource baseline (rb), a resource anomaly (as) that varies on interval of 1 to 12 years (ai). The
anomaly is modeled closely to the cycles of El Niño/La Nina that also occur irregularly every 1
to 12 years with an average of 7. The models show that a large anomaly is able to synchronize
flowering in a community of trees of the same species independent of a flowering threshold and
among related species that have different flowering thresholds. It seems likely for many related
species of trees to evolve a response to resource availability rather than the same climate trigger
independently and offers a possibility of predicting future flowering events.

101
3. Can easy to collect tree measurements from ecological plots be used to identify native
species that are ecologically suitable for reforestation under open field conditions in order
to bypass lengthy species test plantations?
The research in this chapter shows that easy to collect measurements such as tree frequency
collected in regenerating and mature forest stands and seed size can be used successfully to
classify species into general successional categories. This could be an important first step in
narrowing down the number of species to be tested in provenance trails for growth rates on sites
of different degree of degradation and provides an easily transferable technique. Identifying
native species for reforestation is crucial for projects that focus on restoring ecological functions
and habitat for native fauna. On the other hand, projects that want to incorporate local
communities need to select species that can be useful to forest people and is the second goal of
this chapter: This research highlighted superior ecological and economic importance of long
lived old-successional trees that are more difficult to establish. Further research focusing on
artificial propagation will be useful for regeneration of these species.
4. Can we identify species that have both high ecological suitability for reforestation and
high value for forest dependent communities?
Using local knowledge of forest communities about native species, I found that the trees that
grow in the mature forest are mostly preferred by the people for having more uses. The
implication of this finding suggests that it is difficult to find species that have ecological
suitability for forest regeneration and provide uses for communities. Therefore, compromises in
forestry programs need to be made. This finding also implies that mature tropical forests are not

102
easily renewable and protection of remaining natural forests should not be ignored in land use
planning.
However, managing protected areas requires limiting access of forest communities to resources.
Forest communities are generally the poorest and inhibitive land use planning further limits their
livelihood options.
5. What effect do protected areas have on socioeconomic status of communities that live
within or nearby areas with restrictions on resource extraction?
The analysis of census socioeconomic indicators and land use in this chapter finds that protected
areas are not necessarily poverty traps. In this case study, rural communities around the protected
area have higher socioeconomic status than communities in the lowlands that only rely on
agriculture. Communities in the forest reserve have more natural resources and have better
opportunities to supplement their livelihood by collecting forest products. There is also more
government investment in infrastructure and services in communities around protected areas.
This research shows that census data is useful for looking at entire regions around a protected
forest to observe trends that are not accessible through other methods such as household surveys.
The research chapters cover different issues that plague reforestation success in Southeast Asia
but with a common aim, to aid reforestation activities in the tropics with ecologic and
socioeconomic knowledge. In particular, predicting mass flowering can help forest managers in
seed collection efforts that are vital for reforestation with dipterocarps as seed propagation and
storage are not viable options. Next, selecting species that are well suited for degraded
environments can increase forest programs that use native species. Further, I outline the
importance of selecting species that are useful for forest communities and the need for

103
compromises between ecologic and socioeconomic factors when considering reforestation aims.
Finally, land use planning and protected areas management need to incorporate socioeconomic
conditions of forest dependent communities.
Further investigation should focus on building predictive models of dipterocarp mass flowering
using site specific climate and flowering data. Using climate projections data would be the next
step in predicting future mass flowering events and providing management recommendations of
dipterocarp forests. Based on the results of the second chapter, the next steps would be to test
growth rates of selected native species in provenance trails on degraded sites. Finally, a follow
up to the results of the third chapter would focus on selecting several communities in the forest
reserve and conducting household surveys to gain more insight into the impact that a protected
area has on the community.

104
Thesis Bibliography
Agrawal, A. and A. Angelsen. 2009. Using community forest management to achieve REDD+ goals Pages 201-212 in A. Angelsen, editor. Realising REDD+. National Strategy and Policy Options. Center for International Forestry Research, Bogor Barat, Indonesia.
Ainuddin, N. A. and K. Goh. 2010. Effect of forest fire on stand structure in Raja Musa Peat
Swamp Forest Reserve, Selangor, Malaysia. Journal of Environmental Science and Technology 3:56-62.
Andam, K. S., P. J. Ferraro, K. R. E. Sims, A. Healy, and M. B. Holland. 2010. Protected areas
reduced poverty in Costa Rica and Thailand. Proceedings of the National Academy of Sciences 107:9996-10001.
Anderson, M. and C. T. Braak. 2003. Permutation tests for multi-factorial analysis of variance.
Journal of Statistical Computation and Simulation 73:85-113. Appanah, S. 1985. General flowering in the climax rain forests of South-east Asia. Journal of
Tropical Ecology 1:225-240. Appanah, S. 1993. Mass flowering of Dipterocarp forests in the aseasonal tropics. Journal of
Biosciences 18:457-474. Appanah, S., J. W. Turnbull. 1998. A review of dipterocarps: taxonomy, ecology and
silviculture. Center for International Forestry Research, Bogor, Indonesia. Arino, O., J. J. Ramos Perez, V. Kalogirou, S. Bontemps, P. Defourny, and E. van Bogaert.
2012. Global Land Cover Map for 2009 (GlobCover 2009). European Space Agency (ESA), Paris, France.
Ashton, M. S., C. V. S. Gunatilleke, I. A. U. N. Gunatilleke, B. M. P. Singhakumara, S. Gamage,
T. Shibayama, and C. Tomimura. 2014. Restoration of rain forest beneath pine plantations: A relay floristic model with special application to tropical South Asia. Forest Ecology and Management 329:351-359.
Ashton, M. S., C. V. S. Gunatilleke, B. M. P. Singhakumara, and I. A. U. N. Gunatilleke. 2001.
Restoration pathways for rain forest in southwest Sri Lanka: a review of concepts and models. Forest Ecology and Management 154:409-430.
Ashton, P. S. 1988. Dipterocarp biology as a window to the understanding of tropical forest
structure. Annual Review of Ecology and Systematics 19:347-370. Ashton, P. S., T. J. Givnish, and S. Appanah. 1988. Staggered flowering in the Dipterocarpaceae:
new insights into floral induction and the evolution of mast fruiting in the aseasonal tropics. American Naturalist 132:44-66.
105
Bankoff, G. 2007. One island too many: reappraising the extent of deforestation in the
Philippines prior to 1946. Journal of Historical Geography 33:314-334. Bautista, G. M. 1990. The forestry crisis in the Philippines - nature, causes, and issues.
Developing Economies 28:67-94. Bazzaz, F. A. and S. T. A. Pickett. 1980. Physiological ecology of tropical succession: a
comparative review. Annual Review of Ecology and Systematics 11:287-310. Beckley, T. M., D. Martz, S. Nadeau, E. Wall, and B. Reimer. 2008. Multiple capacities,
multiple outcomes: delving deeper into the meaning of community capacity. Journal of Rural and Community Development 3:56-75.
Blicher-Mathiesen, U. 1994. Borneo illipe, a fat product from different Shorea spp.
(Dipterocarpaceae). Economic Botany 48:231-242. Brearley, F. Q., J. Proctor, Suriantata, L. Nagy, G. Dalrymple, and B. C. Voysey. 2007.
Reproductive phenology over a 10-year period in a lowland evergreen rain forest of central Borneo. Journal of Ecology 95:828-839.
Broad, R. 1995. The political-economy of natural-resources - case-studies of the Indonesian and
Philippine Forest Sectors. Journal of Developing Areas 29:317-339. Bryant, J. P., F. S. Chapin, III, and D. R. Klein. 1983. Carbon/nutrient balance of boreal plants in
relation to vertebrate herbivory. Oikos 40:357-368. Budowski, G. 1965. Distribution of tropical American rain forest species in the light of
successional processes. Turrialba 15:40-42. Bureau of Meteorology. 2013. S.O.I. (Southern Oscillation Index) Archives - 1876 to Present.
Bureau of Meterorology of Commonwealth of Australia, Melbourne, Australia. Butler, D., B. R. Cullis, A. R. Gilmour, and B. J. Gogel. 2007. ASReml-R Reference Manual.
Technical Report, Queensland Department of Primary Industries. Butt, N., L. Seabrook, M. Maron, B. S. Law, T. P. Dawson, J. Syktus, and C. A. McAlpine.
2015. Cascading effects of climate extremes on vertebrate fauna through changes to low-latitude tree flowering and fruiting phenology. Global Change Biology 21:9:3267-3277.
Butterfield, R. P. 1996. Early species selection for tropical reforestation: A consideration of
stability. Forest Ecology and Management 81:161-168. Cagalanan, D. 2013. Integrated conservation and development: impacts on households in a
Philippine park. Journal of Environment & Development 22:435-458.
106
Cannon, C. H., L. M. Curran, A. J. Marshall, and M. Leighton. 2007. Long-term reproductive behaviour of woody plants across seven Bornean forest types in the Gunung Palung National Park (Indonesia): suprannual synchrony, temporal productivity and fruiting diversity. Ecology Letters 10:956-969.
Carnus, J. M., J. Parrotta, E. Brockerhoff, M. Arbez, H. Jactel, A. Kremer, D. Lamb, K. O'Hara,
and B. Walters. 2006. Planted forests and biodiversity. Journal of Forestry 104:65-77. Cernea, M. M. and K. Schmidt-Soltau. 2008. Poverty risks and national parks: policy issues in
conservation and resettlement. World Development 36:2966-2966. Chazdon, R. L. 2008. Beyond Deforestation: Restoring forests and ecosystem services on
degraded lands. Science 320:1458-1460. Chechina, M. and A. Hamann. 2015. Choosing species for reforestation in diverse forest
communities: social preference versus ecological suitability. Ecosphere (in press). Climate Prediction Center Internet Team. 2012. Monthly Atmospheric and SST Indices. National
Oceanic and Atmospheric Association. College Park, Maryland. Cruz, R. V. O., W. M. Carandang, R. D. Lasco, L. U. dela Cruz, E. Tolentino, Jr., R. V.
Dalmacio, L. L. Rebugio, A. B. Palacpac, L D. Camacho and N. C. Bantayan. 2001. State-of-the-Art Review of Forest Restoration in the Philippines. College of Forestry and Natural Resources, University of the Philippines Los Baños College, Laguna, the Philippines
Curran, L. M., I. Caniago, G. D. Paoli, D. Astianti, M. Kusneti, M. Leighton, C. E. Nirarita, and
H. Haeruman. 1999. Impact of El Niño and logging on canopy tree recruitment in Borneo. Science 286:2184-2188.
Curran, L. M. and M. Leighton. 2000. Vertebrate responses to spatiotemporal variation in seed
production of mast-fruiting dipterocarpaceae. Ecological Monographs 70:101-128. Dai, A. 2011. Drought under global warming: a review. Wiley Interdisciplinary Reviews:
Climate Change 2:45-65. Diprose, G. and A. McGregor. 2009. Dissolving the sugar fields: land reform and resistance
identities in the Philippines. Singapore Journal of Tropical Geography 30:52-69. Doyle, M. and W. Aalbersberg. 1998. Medicinal Plants in the South Pacific. World Health
Organization, Manila, The Philippines. Dressler, W. H., C. A. Kull, and T. C. Meredith. 2006. The politics of decentralizing national
parks management in the Philippines. Political Geography 25:789-816.
107
ESRI. 2011. ArcGIS Desktop: Release 10. Environmental Systems Research Institute, Redlands, CA.
Fan, F. X., M. E. Mann, and C. M. Ammann. 2009. Understanding Changes in the Asian
Summer Monsoon over the Past Millennium: Insights from a Long-Term Coupled Model Simulation. Journal of Climate 22:1736-1748.
FAO. 2003. Advancing Assisted Natural Regeneration in Asia and the Pacific. Food and
Agriculture Organization of the United Nations, Bangkok, Thailand. FAO. 2005. Global Forest Resources Assessment 2005. Progress Towards Sustainable Forest
Management. Food and Agriculture Organization of the United Nations, Rome, Italy. FAO. 2014. The State of the World's Forest Genetic Resources - Thematic Study. Genetic
Considerations in Ecosystem Restoration Using Native Tree Species. Food and Agriculture Organization of the United Nations, Rome, Italy.
Fawcett, T. 2006. An introduction to ROC analysis. Pattern Recognition Letters 27:861-874. Ferraro, P. J., M. M. Hanauer, and K. R. E. Sims. 2011. Conditions associated with protected
area success in conservation and poverty reduction. Proceedings of the National Academy of Sciences of the United States of America 108:13913-13918.
Forbes, K. and J. Broadhead. 2013. Forests and Landslides: the Role of Trees and Forests in the
Prevention of Landslides and Rehabilitation of Landslide-Affected Areas in Asia. Second edition. RAP Publication for Food and Agriculture Organization of the United Nations. Bangkok, Thailand :vii + 61 pp.
Fujisaka, S. and E. Wollenberg. 1991. From forest to agroforest and logger to agroforester: a
case study. Agroforestry Systems 14:113-129. Garcia, J. T. and L. Mulkins. 2001. Ecological Management of a Residual Forest in Negros
Occidental, Philippines. The Experience of Marco Flores in Negros Occidental. Resource Efficient Agricultural Production – Canada, Ste-Anne-de-Bellevue, Quebec, Canada
Gauld, R. 2000. Maintaining centralized control in community-based forestry: Policy
construction in the Philippines. Development and Change 31:229-254. Ghazoul, J. 1997. The pollination and breeding system of Dipterocarpus obtusifolius
(Dipterocarpaceae) in dry deciduous forests of Thailand. Journal of Natural History 31:901-916.
Ghazoul, J., K. A. Liston, and T. J. B. Boyle. 1998. Disturbance-induced density-dependent seed
set in Shorea siamensis (Dipterocarpaceae), a tropical forest tree. Journal of Ecology 86:462-473.

108
Global Administrative Areas. 2012. GADM Database of Global Administrative Areas (Boundaries), version 2.0. University of Berkeley, Museum of Vertebrate Zoology and the International Rice Research Institute , Berkeley, California.
Goltenboth, F. and C.-P. Hutter. 2004. New options for land rehabilitation and landscape ecology
in Southeast Asia by "Rainforestation Farming". Journal for Nature Conservation 12:181-189.
Goslee, S. C. and D. L. Urban. 2007. The ecodist package for dissimilarity-based analysis of
ecological data. Journal of Statistical Software 22:1-19. Groom, B. and C. Palmer. 2012. REDD+ and rural livelihoods. Biological Conservation 154:42-
52. Gurney, G. G., J. Cinner, N. C. Ban, R. L. Pressey, R. Pollnac, S. J. Campbell, S. Tasidjawa, and
F. Setiawan. 2014. Poverty and protected areas: An evaluation of a marine integrated conservation and development project in Indonesia. Global Environmental Change 26:98-107.
Hamann, A. 2002. The North Negros Forest Reserve: A biodiversity hotspot at risk. Silliman
Journal 43:83-90. Hamann, A. 2004. Flowering and fruiting phenology of a Philippine submontane rain forest:
climatic factors as proximate and ultimate causes. Journal of Ecology 92:24-31. Hamann, A., E. B. Barbon, E. Curio, and D. A. Madulid. 1999. A botanical inventory of a
submontane tropical rainforest on Negros island, Philippines. Biodiversity and Conservation 8:1017-1031.
Hansen, M. C., P. V. Potapov, R. Moore, M. Hancher, S. A. Turubanova, A. Tyukavina, D.
Thau, S. V. Stehman, S. J. Goetz, T. R. Loveland, A. Kommareddy, A. Egorov, L. Chini, C. O. Justice, and J. R. G. Townshend. 2013. High-resolution global maps of 21st-century forest cover change. Science 342:850-853.
Hartley, M. J. 2002. Rationale and methods for conserving biodiversity in plantation forests.
Forest Ecology and Management 155:81-95. Holm, S. 1979. A simple sequentially rejective multiple test procedure. Scandinavian Journal of
Statistics 6:65-70. Holopainen, J. and J. Blande. 2012. Molecular plant volatile communication. Pages 17-31 in C.
López-Larrea, editor. Sensing in Nature. Springer-Verlag. New York, NY. Hooper, E., R. Condit, and P. Legendre 2002. Responses of 20 native species to reforestation
strategies for abandoned farmland in Panama. Ecological Applications 12:1626-1641.

109
Ichie, T., T. Kenta, M. Nakagawa, K. Sato, T.Nakashizuka. 2005. Resource allocation to reproductive organs during masting in the tropical emergent tree, Dipterocarpus tempehes. Journal of Tropical Ecology 21:237-241.
Isagi, Y., K. Sugimura, A. Sumida, and H. Ito. 1997. How does masting happen and
synchronize? Journal of Theoretical Biology 187:231-239. IUFRO. 2015. Forest, Trees and Landscapes for Food Security and Nutrition. A Global
Assessment Report. International Union of Forest Research Organizations, Vienna, Austria.
Johnson, T. R. 1999. Community-based forest management in the Philippines. Journal of
Forestry 1:26-30. Kettle, C. J. 2010. Ecological considerations for using dipterocarps for restoration of lowland
rainforest in Southeast Asia. Biodiversity and Conservation 19:1137-1151. Kettle, C. J., J. Ghazoul, P. S. Ashton, C. H. Cannon, L. Chong, B. Diway, E. Faridah, R.
Harrison, A. Hector, P. Hollingsworth, L. P. Koh, E. Khoo, K. Kitayama, K. Kartawinata, A. J. Marshall, C. Maycock, S. Nanami, G. Paoli, M. D. Potts, I. Samsoedin, D. Sheil, S. Tan, I. Tomoaki, C. Webb, T. Yamakura, and D. F. R. P. Burslem. 2011. Seeing the fruit for the trees in Borneo. Conservation Letters 4:184-191.
Kettle, C. J., J. Ghazoul, P. S. Ashton, C. H. Cannon, L. Chong, B. Diway, E. Faridah, R.
Harrison, A. Hector, P. Hollingsworth, L. P. Koh, E. Khoo, K. Kitayama, K. Kartawinata, A. J. Marshall, C. R. Maycock, S. Nanami, G. Paoli, M. D. Potts, D. Sheil, S. Tan, I. Tomoaki, C. Webb, T. Yamakura, and D. F. R. P. Burslem. 2010. Mass fruiting in Borneo: a missed opportunity. Science 330:584-584.
Koh, L. P. 2007. Impending disaster or sliver of hope for Southeast Asian forests? The devil may
lie in the details. Biodiversity and Conservation 16:3935-3938. Kruskal, J. B. 1964. Nonmetric Multidimensional-Scaling - a numerical-method. Psychometrika
29:115-129. Kummer, D. M. 1992a. Deforestation in the Postwar Philippines. 1st edition. The University of
Chicago Press, Chicago and London. Kummer, D. M. 1992b. Upland agriculture, the land frontier and forest decline in the Philippines.
Agroforestry Systems 18:31-46. Kummer, D. M. and B. L. Turner. 1994. The human causes of deforestation in Southeast-Asia.
Bioscience 44:323-328. Lacuna-Richman, C. 2002. The socioeconomic significance of subsistence non-wood forest
products in Leyte, Philippines. Environmental Conservation 29:253-262.
110
Lacuna-Richman, C. 2006. The use of non-wood forest products by migrants in a new
settlement: experiences of a Visayan community in Palawan, Philippines. Journal of Ethnobiology and Ethnomedicine 2:36.
Lamb, D. 1998. Large-scale ecological restoration of degraded tropical forest lands: the potential
role of timber plantations. Restoration Ecology 6:271-279. Langenberger, G. 2006. Habitat distribution of dipterocarp species in the Leyte Cordillera: an
indicator for species-site suitability in local reforestation programs. Annals of Forest Science 63:149-156.
Langenberger, G., M. C. Martin, K. J. Sauerborn, and M. Wider. 2005. Land Rehabilitation in
the Tropics with Indigenous Tree Species: Economic and Ecological Considerations and Research Needs. Conference on International Agricultural Research for Development. University of Hohenheim. October 11-13, 2005. Stuttgart-Hohenheim, Germany.
Lanting, M. V. and C. M. Palaypayon. 2002. Forest Tree Species with Medicinal Uses.
Ecosystems Research and Development Bureau of the Department of Environment and Natural Resources. Laguna, The Philippines.
Leakey, R. R. B. and A. J. Simons. 1997. The domestication and commercialization of
indigenous trees in agroforestry for the alleviation of poverty. Agroforestry Systems 38:165-176.
Lee, E. W. S., B. C. H. Hau, and R. T. Corlett. 2005. Natural regeneration in exotic tree
plantations in Hong Kong, China. Forest Ecology and Management 212:358-366. Leopold, A. C., R. Andrus, A. Finkeldey, and D. Knowles. 2001. Attempting restoration of wet
tropical forests in Costa Rica. Forest Ecology and Management 142:243-249. Lewis, S. L., G. Lopez-Gonzalez, B. Sonke, K. Affum-Baffoe, T. R. Baker, L. O. Ojo, O. L.
Phillips, J. M. Reitsma, L. White, J. A. Comiskey, M.-N. D. K, C. E. N. Ewango, T. R. Feldpausch, A. C. Hamilton, M. Gloor, T. Hart, A. Hladik, J. Lloyd, J. C. Lovett, J.-R. Makana, Y. Malhi, F. M. Mbago, H. J. Ndangalasi, J. Peacock, K. S. H. Peh, D. Sheil, T. Sunderland, M. D. Swaine, J. Taplin, D. Taylor, S. C. Thomas, R. Votere, and H. Woll. 2009. Increasing carbon storage in intact African tropical forests. Nature 457:1003-1006.
Liu, D. S., L. R. Iverson, and S. Brown. 1993. Rates and patterns of deforestation in the
Philippines - application of Geographic Information-System analysis. Forest Ecology and Management 57:1-16.
Luyssaert, S., E. D. Schulze, A. Borner, A. Knohl, D. Hessenmoller, B. E. Law, P. Ciais, and J.
Grace. 2008. Old-growth forests as global carbon sinks. Nature 455:213-215.

111
Magno, F. 2001. Forest devolution and social capital - state-civil society relations in the Philippines. Environmental History 6:264-286.
Mangaoang, E. O. and A. E. Pasa. 2003. Preferred native tree species for smallholder forestry in
Leyte. Annals of Tropical Research 25:25-30. Maycock, C. R., R. N. Thewlis, J. Ghazoul, R. Nilus, and D. F. R. P. Burslem. 2005.
Reproduction of dipterocarps during low intensity masting events in a Bornean rain forest. Journal of Vegetation Science 16:635-646.
McAllister, R. R. J., A. Smajgl, J. Asafu-Adjaye. 2007. Forest logging and institutional
thresholds in developing south-east Asian economies: A conceptual model. Forest Policy and Economics 9:1079-1089.
McCay, B. J. and P. J. S. Jones. 2011. Marine protected areas and the governance of marine
ecosystems and fisheries. Conservation Biology 25:1130-1133. McElwee, P. D. 2009. Reforesting “bare hills” in Vietnam: social and environmental
consequences of the 5 million hectare reforestation program. AMBIO: A Journal of the Human Environment 38:325-333.
McElwee, P. D. 2008. Forest environmental income in Vietnam: household socioeconomic
factors influencing forest use. Environmental Conservation 35:147-159. McKone, M. J., D. Kelly, and W. G. Lee. 1998. Effect of climate change on mast-seeding
species: frequency of mass flowering and escape from specialist insect seed predators. Global Change Biology 4:591-596.
Mitchell, T. D. 2004. An improved method of constructing a database of monthly climate
observations and associated high resolution grids. International Journal of Climatology. 25:6: 693-712.
Molnar, A., M. Liddle, C. Bracer, A. Khare, A. White, and J. Bull. 2007. Community-Based
Forest Enterprises: Their Status and Potential in Tropical Countries. ITTO Technical Series - International Tropical Timber Organization, Yokohama, Japan :73 pp
Mulkins, L. a. R. S. 2000. From Sugarcane Monoculture to Agro-Ecological Village. ILEIA
Newsletter, Wageningen, The Netherlands. Munez, M. P. 1999. Decline of the Philippine forest. Environmental Science for Social Change
1:1-44. Naito, Y., M. Kanzaki, H. Iwata, K. Obayashi, S. L. Lee, N. Muhammad, T. Okuda, and Y.
Tsumura. 2008. Density-dependent selfing and its effects on seed performance in a tropical canopy tree species, Shorea acuminata (Dipterocarpaceae). Forest Ecology and Management 256:375-383.

112
NCDC. 2013. NOAA Daily Global Summary of Day (GOBALSOD) Station Data. National
Oceanic and Atmospheric Association, Asheville, NC. Newbery, D. M., G. B. Chuyong, and L. Zimmermann. 2006. Mast fruiting of large
ectomycorrhizal African rain forest trees: importance of dry season intensity, and the resource-limitation hypothesis. New Phytologist 170:561-579.
Noss, R. F. 1999. Assessing and monitoring forest biodiversity: A suggested framework and
indicators. Forest Ecology and Management 115:135-146. Numata, S., M. Yasuda, T. Okuda, N. Kachi, and N. S. M. Noor. 2003. Temporal and spatial
patterns of mass flowerings on the Malay Peninsula. American Journal of Botany 90:1025-1031.
Okello, M. M., S. K. O. Seno, and R. W. Nthiga. 2009. Reconciling people's livelihoods and
environmental conservation in the rural landscapes in Kenya: opportunities and challenges in the Amboseli landscapes. Natural Resources Forum 33:123-133.
Orwa, C., A. Mutua, R. Kindt, R. Jamnadass, and S. Anthony. 2009. Agroforestree Database: a
Tree Reference and Selection Guide Version 4.0. World Agroforestry Centre, Nairobi, Kenya.
Otsamo, A., G. Ådjers, T. Hadi, J. Kuusipalo, and R. Vuokko. 1997. Evaluation of reforestation
potential of 83 tree species planted on Imperata cylindrica dominated grassland – A case study from South Kalimantan, Indonesia. New Forests 14:127-143.
Paquette, A., J. Hawryshyn, A. V. Senikas, and C. Potvin. 2009. Enrichment planting in
secondary forests: a promising clean development mechanism to increase terrestrial carbon sinks. Ecology and Society 14:31.
Patriquin, M. N., J. R. Parkins, and R. C. Stedman. 2009. Bringing home the bacon: industry,
employment, and income in boreal Canada. Forestry Chronicle 85:65-74. Pattanayak, S. K. and E. O. Sills. 2001. Do tropical forests provide natural insurance? The
microeconomics of non-timber forest product collection in the Brazilian Amazon. Land Economics 77:595-612.
Peters, C. M., A. H. Gentry, and R. O. Mendelsohn. 1989. Valuation of an Amazonian rainforest.
Nature 339:655-656. Piiroinen, T., P. Nyeko, and H. Roininen. 2015. Natural establishment of indigenous trees under
planted nuclei: A study from a clear-felled pine plantation in an afrotropical rain forest. Forest Ecology and Management 345:21-28.

113
PPDO. 2011. Negros Occidental Social & Economic Trends 2009. Provincial Planing and Development Office of the Province of Negros Occidental. Bacolod, the Philippines.
Pulhin, J. M. and W. H. Dressler. 2009. People, power and timber: The politics of community-
based forest management. Journal of Environmental Management 91:206-214. Pulhin, J. M. and M. Inoue. 2008. Dynamics of Devolution Process in the Management of the
Philippine Forests. International Journal of Social Forestry 1:1-26. R Core Team. 2014. R: A Language and Environment for Statistical Computing. R Foundation
for Statistical Computing, Vienna, Austria. Reyes, C. M., A. D. Tabuga, R. D. Asis, and M. B. G. Datu. 2012. Poverty and Agriculture in the
Philippines: Trends in Income Poverty and Distribution. Philippine Institute for Development Studies, Makati City, the Philippines.
Rodrigues, A. S. L., R.M. Ewers, L. Parry, C. Souza Jr., A. Verissimo, A.Balford. 2009. Boom-
and-dust development patterns across the Amazon deforestation frontier. Science 324:1435-1437.
Rojo, J. P. 1993. Species diversity and conservation status of Philippine Dipterocarps. Pages
248-256 in Drysdale, R.M.; John, S.E.T. and Yapa, A.C., editors. Proceedings of International Symposium on Genetic Conservation and Production of Tropical Forest Tree Seed. June 14-16, 1993. Chiang Mai, Thailand
Rudel, T. K. 2012. The human ecology of regrowth in the tropics. Journal of Sustainable
Forestry 31:340-354. Saastamoinen, O. 1996. Change and continuity in the Philipppine forest policy. Pages 121-139 in
M. Palo and G. Mery, editors. Sustainable Forestry Challenges for Developing Countries. Kluwer Academic Publishers, Dordrecht, the Netherlands.
Sakai, S. 2002. General flowering in lowland mixed dipterocarp forests of South-East Asia.
Biological Journal of the Linnean Society 75:233-247. Sakai, S., R. D. Harrison, K. Momose, K. Kuraji, H. Nagamasu, T. Yasunari, L. Chong, and T.
Nakashizuka. 2006. Irregular droughts trigger mass flowering in aseasonal tropical forests in Asia. American Journal of Botany 93:1134-1139.
Salganik, M. J. and D. D. Heckathorn. 2004. Sampling and estimation in hidden populations
using respondent-driven sampling. Sociological Methodology34:193-239. Sayer, J., U. Chokkalingam, and J. Poulsen. 2004. The restoration of forest biodiversity and
ecological values. Forest Ecology and Management 201:3-11.

114
Schneider, T., M. S. Ashton, F. Montagnini, and P. P. Milan. 2014. Growth performance of sixty tree species in smallholder reforestation trials on Leyte, Philippines. New Forests 45:83-96.
Shannon, C. E. and W. Weaver. 1948. A mathematical theory of communication. Bell System
Technical Journal 27:379-423. Sidle, R. C., A. D. Ziegler, J. N. Negishi, A. R. Nik, R. Siew, and F. Turkelboom. 2006. Erosion
processes in steep terrain—truths, myths, and uncertainties related to forest management in Southeast Asia. Forest Ecology and Management 224:199-225.
Sing, T., O. Sander, N. Beerenwinkel, and T. Lengauer. 2005. ROCR: visualizing classifier
performance in R. Bioinformatics 21:3940-3941. Smitinand, T., T. Santisuk, and C. Phengklai. 1980. The Manual of Dipterocarpaceae of
Mainland South-East Asia. Royal Forest Department. Bangkok, Thailand. Stedman, R. C., M. N. Patriquin, and J. R. Parkins. 2011. Forest dependence and community
well-being in rural Canada: a longitudinal analysis. Forestry 84:375-384. Sun, I. F., Y. Y. Chen, S. P. Hubbell, S. J. Wright, and N. S. M. D. Noor. 2007. Seed predation
during general flowering events of varying magnitude in a Malaysian rain forest. Journal of Ecology 95:818-827.
Timmermann, A., J. Oberhuber, A. Bacher, M. Esch, M. Latif, and E. Roeckner. 1999. Increased
El Nino frequency in a climate model forced by future greenhouse warming. Nature 398:694-697.
Tolentino, E. L. 2008. Restoration of philippine native forest by smallholder tree framers. Pages
319-342 i n D. J. Snelder and R. D. Lasco, editor. Smallholder Tree Growing for Rural Development and Environmental Services. Springer Science and Business Media B.V. , Gainville, Florida.
Trenberth, K. E. 1997. The definition of El Niño. Bulletin of the American Meteorological
Society 78:2771-2777. Tumaneng-Diete, T., I. S. Ferguson, and D. MacLaren. 2005. Log export restrictions and trade
policies in the Philippines: bane or blessing to sustainable forest management? Forest Policy and Economics 7:187-198.
Uhl, C., R. Buschbacher, and E. A. S. Serrao. 1988. Abandoned pastures in Eastern Amazonia. I.
Patterns of plant succession. Journal of Ecology 76:663-681. Vilei, S. 2009. Adoptability of a complex agro-forestry project for smallholders on a Philippine
island. Pages 292-305 in K. Piatek, B. Spong, S. Harrison, and D. McGill, editors. Seeing the Forest Beyond the Trees. New Possibilities and Expectations for Products and Services From Small-Scale Forestry. IUFRO 3.08 Small Scale Forestry Symposium, June 7-11, 2009. Division of Forestry and Natural Resources, Morgantown, West Virginia.
115
Vitug, M. D. 1993. Chapter 2: The years of plunder. Pages 11-37 in M. D. Vitug, editor. Power
from the Forest: The Politics of Logging. Philippine Center for Investigative Journalism. Quezon City, the Philippines.
Walters, B. B., A. Cadelina, A. Cardano, and E. Visitacion. 1999. Community history and rural
development: why some farmers participate more readily than others. Agricultural Systems 59:193-214.
Watt, M. S., D. J. Kriticos, S. Alcaraz, A. V. Brown, and A. Leriche. 2009. The hosts and
potential geographic range of Dothistroma needle blight. Forest Ecology and Management 257:1505-1519.
Wich, S. A. and C. P. van Schaik. 2000. The impact of El Niño on mast fruiting in Sumatra and
elsewhere in Malesia. Journal of Tropical Ecology 16:563-577. Wilcoxon, F. 1950. Some rapid approximate statistical procedures. Annals of the New York
Academy of Sciences 52:808-814 Wingfield, M., J., B. Slippers, J. Roux, and B. Wingfield, D. 2001. Worldwide movement of
exotic forest fungi, especially in the tropics and the Southern hemisphere. BioScience 51:134-140.
Wishnie, M. H., D. H. Dent, E. Mariscal, J. Deago, N. Cedeño, D. Ibarra, R. Condit, and P. S.
Ashton. 2007. Initial performance and reforestation potential of 24 tropical tree species planted across a precipitation gradient in the Republic of Panama. Forest Ecology and Management 243:39-49.
Wolfe, B., D. Dent, J. Deago, and M. Wishnie. 2015. Forest regeneration under Tectona grandis
and Terminalia amazonia plantation stands managed for biodiversity conservation in western Panama. New Forests 46:157-165.
Yap, S. K. and H. T. Chan. 1990. Phenological behaviour of some Shorea species in Peninsular
Malaysia. Pages 21-36 in M. Hadley and K. S. Bawa, editors. Reproductive Ecology of Tropical Forest Plants. Parthenon Publishing Group, Inc., Bangi, Malaysia.
Yasuda, M., J. Matsumoto, N. Osada, S. Ichikawa, N. Kachi, M. Tani, T. Okuda, A. Furukawa,
A. R. Nik, and N. Manokaran. 1999. The mechanism of general flowering in Dipterocarpaceae in the Malay Peninsula. Journal of Tropical Ecology 15:437-449.
Yonariza and S. B. Singzon. 2010. Post-logging ban timber tree planting in Thailand and the
Philippines. Pages 1-28 in G. C. J. Saguiguit, editor. 7th Society for Ecological Restoration European Conference on Restoration Ecology, 24-26 March 2010. Agriculture & Development Discussion Paper Series, Avignion, France.
Zimmerer, K. S., R. E. Galt, and M. V. Buck. 2004. Globalization and multi-spatial trends in the
coverage of protected-area conservation (1980-2000). Ambio 33:520-529.
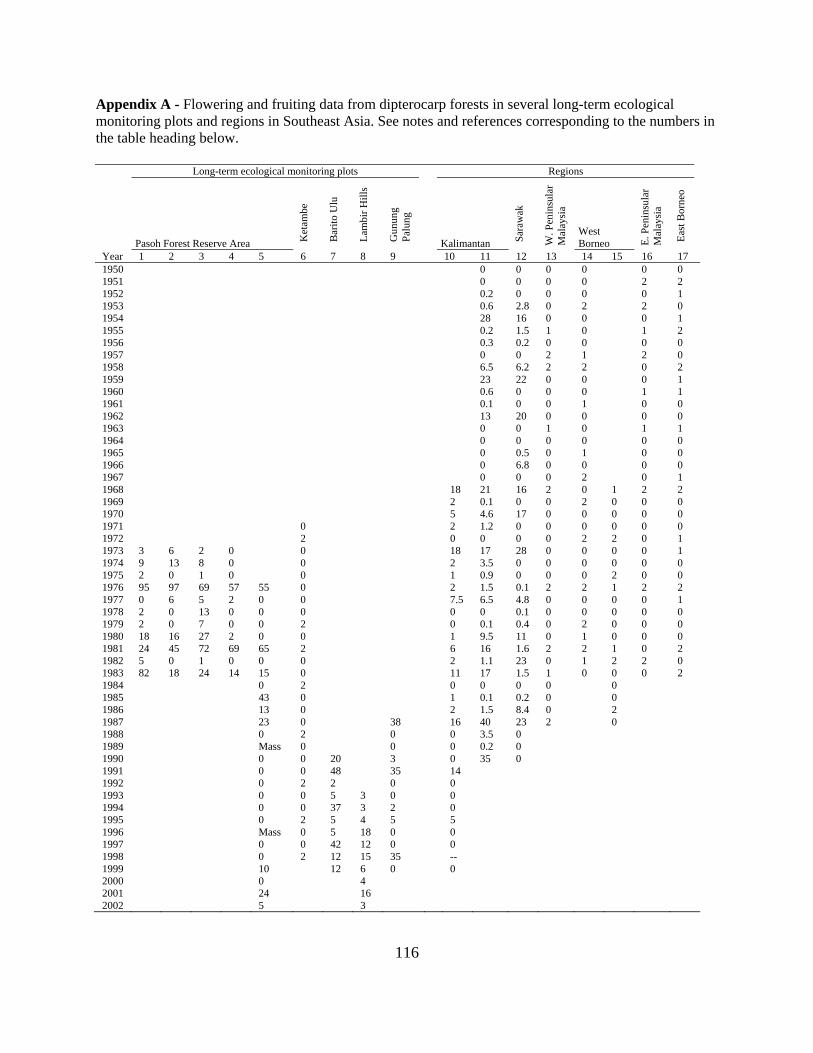
116
Appendix A - Flowering and fruiting data from dipterocarp forests in several long-term ecological monitoring plots and regions in Southeast Asia. See notes and references corresponding to the numbers in the table heading below.
Long-term ecological monitoring plots Regions
Pasoh Forest Reserve Area Ket
ambe
Bar
ito
Ulu
Lam
bir
Hil
ls
Gun
ung
Pal
ung
Kalimantan Sar
awak
W. P
enin
sula
r M
alay
sia
West Borneo E
. Pen
insu
lar
Mal
aysi
a
Eas
t Bor
neo
Year 1 2 3 4 5 6 7 8 9 10 11 12 13 14 15 16 17 1950 0 0 0 0 0 0 1951 0 0 0 0 2 2 1952 0.2 0 0 0 0 1 1953 0.6 2.8 0 2 2 0 1954 28 16 0 0 0 1 1955 0.2 1.5 1 0 1 2 1956 0.3 0.2 0 0 0 0 1957 0 0 2 1 2 0 1958 6.5 6.2 2 2 0 2 1959 23 22 0 0 0 1 1960 0.6 0 0 0 1 1 1961 0.1 0 0 1 0 0 1962 13 20 0 0 0 0 1963 0 0 1 0 1 1 1964 0 0 0 0 0 0 1965 0 0.5 0 1 0 0 1966 0 6.8 0 0 0 0 1967 0 0 0 2 0 1 1968 18 21 16 2 0 1 2 2 1969 2 0.1 0 0 2 0 0 0 1970 5 4.6 17 0 0 0 0 0 1971 0 2 1.2 0 0 0 0 0 0 1972 2 0 0 0 0 2 2 0 1 1973 3 6 2 0 0 18 17 28 0 0 0 0 1 1974 9 13 8 0 0 2 3.5 0 0 0 0 0 0 1975 2 0 1 0 0 1 0.9 0 0 0 2 0 0 1976 95 97 69 57 55 0 2 1.5 0.1 2 2 1 2 2 1977 0 6 5 2 0 0 7.5 6.5 4.8 0 0 0 0 1 1978 2 0 13 0 0 0 0 0 0.1 0 0 0 0 0 1979 2 0 7 0 0 2 0 0.1 0.4 0 2 0 0 0 1980 18 16 27 2 0 0 1 9.5 11 0 1 0 0 0 1981 24 45 72 69 65 2 6 16 1.6 2 2 1 0 2 1982 5 0 1 0 0 0 2 1.1 23 0 1 2 2 0 1983 82 18 24 14 15 0 11 17 1.5 1 0 0 0 2 1984 0 2 0 0 0 0 0 1985 43 0 1 0.1 0.2 0 0 1986 13 0 2 1.5 8.4 0 2 1987 23 0 38 16 40 23 2 0 1988 0 2 0 0 3.5 0 1989 Mass 0 0 0 0.2 0 1990 0 0 20 3 0 35 0 1991 0 0 48 35 14 1992 0 2 2 0 0 1993 0 0 5 3 0 0 1994 0 0 37 3 2 0 1995 0 2 5 4 5 5 1996 Mass 0 5 18 0 0 1997 0 0 42 12 0 0 1998 0 2 12 15 35 -- 1999 10 12 6 0 0 2000 0 4 2001 24 16 2002 5 3
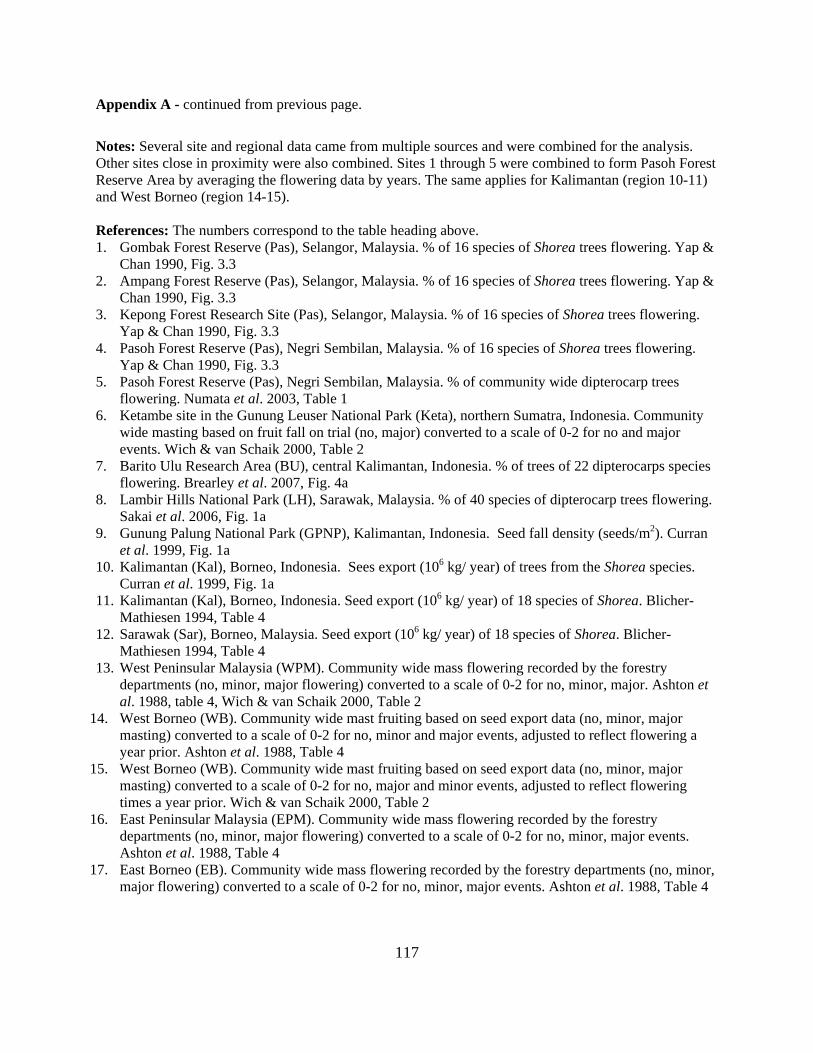
117
Appendix A - continued from previous page.
Notes: Several site and regional data came from multiple sources and were combined for the analysis. Other sites close in proximity were also combined. Sites 1 through 5 were combined to form Pasoh Forest Reserve Area by averaging the flowering data by years. The same applies for Kalimantan (region 10-11) and West Borneo (region 14-15).
References: The numbers correspond to the table heading above. 1. Gombak Forest Reserve (Pas), Selangor, Malaysia. % of 16 species of Shorea trees flowering. Yap &
Chan 1990, Fig. 3.32. Ampang Forest Reserve (Pas), Selangor, Malaysia. % of 16 species of Shorea trees flowering. Yap &
Chan 1990, Fig. 3.33. Kepong Forest Research Site (Pas), Selangor, Malaysia. % of 16 species of Shorea trees flowering.
Yap & Chan 1990, Fig. 3.34. Pasoh Forest Reserve (Pas), Negri Sembilan, Malaysia. % of 16 species of Shorea trees flowering.
Yap & Chan 1990, Fig. 3.35. Pasoh Forest Reserve (Pas), Negri Sembilan, Malaysia. % of community wide dipterocarp trees
flowering. Numata et al. 2003, Table 16. Ketambe site in the Gunung Leuser National Park (Keta), northern Sumatra, Indonesia. Community
wide masting based on fruit fall on trial (no, major) converted to a scale of 0-2 for no and majorevents. Wich & van Schaik 2000, Table 2
7. Barito Ulu Research Area (BU), central Kalimantan, Indonesia. % of trees of 22 dipterocarps speciesflowering. Brearley et al. 2007, Fig. 4a
8. Lambir Hills National Park (LH), Sarawak, Malaysia. % of 40 species of dipterocarp trees flowering.Sakai et al. 2006, Fig. 1a
9. Gunung Palung National Park (GPNP), Kalimantan, Indonesia. Seed fall density (seeds/m2). Curranet al. 1999, Fig. 1a
10. Kalimantan (Kal), Borneo, Indonesia. Sees export (106 kg/ year) of trees from the Shorea species.Curran et al. 1999, Fig. 1a
11. Kalimantan (Kal), Borneo, Indonesia. Seed export (106 kg/ year) of 18 species of Shorea. Blicher-Mathiesen 1994, Table 4
12. Sarawak (Sar), Borneo, Malaysia. Seed export (106 kg/ year) of 18 species of Shorea. Blicher-Mathiesen 1994, Table 4
13. West Peninsular Malaysia (WPM). Community wide mass flowering recorded by the forestrydepartments (no, minor, major flowering) converted to a scale of 0-2 for no, minor, major. Ashton etal. 1988, table 4, Wich & van Schaik 2000, Table 2
14. West Borneo (WB). Community wide mast fruiting based on seed export data (no, minor, majormasting) converted to a scale of 0-2 for no, minor and major events, adjusted to reflect flowering ayear prior. Ashton et al. 1988, Table 4
15. West Borneo (WB). Community wide mast fruiting based on seed export data (no, minor, majormasting) converted to a scale of 0-2 for no, major and minor events, adjusted to reflect floweringtimes a year prior. Wich & van Schaik 2000, Table 2
16. East Peninsular Malaysia (EPM). Community wide mass flowering recorded by the forestrydepartments (no, minor, major flowering) converted to a scale of 0-2 for no, minor, major events.Ashton et al. 1988, Table 4
17. East Borneo (EB). Community wide mass flowering recorded by the forestry departments (no, minor,major flowering) converted to a scale of 0-2 for no, minor, major events. Ashton et al. 1988, Table 4

118
Appendix B - R program to simulate an extended resource tracking model with more parameters than the basic model used for evaluation of a resource tracking mechanism to trigger mass flowering. With the program below we explore if resource tracking can synchronize individual trees that track resources in different inter-annual cycles through the introduction of an irregular resource anomaly (equivalent to the El Niño Southern Oscillation). The code below can be pasted as a whole into the console window of the R programming environment, an open source software package available at: http://www.r-project.org.
### Variables that can be defined by the user: ny <- 120 # Number of years (try 100 to 500) nt <- 12 # Number of trees (try 5 to 20) rb <- 20 # Resource baseline with random inter-annual variability as <- 40 # Maximum anomaly size (try 2x to 5x the resource baseline value) ai <- 12 # Maximum anomaly interval (try 5 to 15 years) ft <- 80 # Resource threshold for flowering (try 2x to 5x the anomaly size value) ### Explanation of variables used below but not controlled by the user: # i - Counter for years # j - Counter for trees # r - Resource # a - Anomaly # fm - Matrix that records flowering of each tree (years in rows, trees in columns) # rm – Matrix that accumulates resources for each tree (years in rows, trees in # columns)
### Create a table of a randomly varying resource as specified by rb, as, and ai above r <- data.frame(y=1:ny, r=1:ny) r$r <- (sample(1:rb, ny, replace=T)) y <- 1; while (y < ny-ai) { y <- y+sample(1:ai,1); r[y,2] <- r$r[y]+sample(1:as,1) } r[1:20,] # Outputs the first 20 rows of the resource data table for checking
### Create a an empty plot area to fill with results graphics.off() par(mar=c(0,0,0,0), oma=c(3,1,1,0), mfrow=c(nt+2,1))
### Resource tracking model with two loops that repeat the calculations for each tree ### (counter i), and for each year (counter j) and plots the resource status (rp) and ### the flowering events (fp) into a graphics window. rm <- as.data.frame(matrix(nrow=ny, ncol=nt)) fm <- as.data.frame(matrix(nrow=ny, ncol=nt))
for (i in 1:nt) { for (j in i:ny){
rm[i,i] <- 0 rm[j+1,i] <- ifelse(rm[j,i]<ft,((r[j+1,2])+rm[j,i]),0) }
rm <- rm[1:ny,] plot(rm[,i]~r$y,type="l", axes=F, ann=F, xlim=c(-15,ny)) abline(v=seq(0,ny,ny/5),lty=2) text(-10,ft/2,paste("Tree",i)) fm[,i] <- ifelse(rm[,i]>=ft,1,0) } fm[is.na(fm)] <- 0 # replaces missing values with zeros for graphs ### plots the frequency of flowering events across all trees plot(rowSums(fm[,1:nt])~r$y,type="l", lwd= 2, axes= F, ann=F, xlim=c(-15,ny)) abline(v=seq(0,ny,ny/5), lty=2) text(-9,nt/2,"Flowering")
### plots the randomly varying resource for reference plot(r$r~r$y, xlim=c(-15,ny), ylim=c(0,max(r$r)), axes=F, ann=F, type="l") text(-9,(as+rb)/2,"Resource") axis(1, at=seq(0,ny,ny/5)) abline(v=seq(0,ny,ny/5),lty=2)

119
Appendix C - R program to simulate a multi-species extended resource tracking model with more parameters than the basic model used for evaluation of a resource tracking mechanism to trigger mass flowering. With the program below we explore if resource tracking can synchronize individual trees of different species that track resources in inter-annual cycle through the introduction of an irregular resource anomaly (equivalent to the El Niño Southern Oscillation). The code below can be pasted as a whole into the console window of the R programming environment, an open source software package available at: http://www.r-project.org.
### Variables that can be defined by the user: ns <- 5 # Number of Species (try 2 to 10) ny <- 120 # Number of years (try 100 to 200) nt <- 12 # Number of trees (try 5 to 20) rb <- 20 # Resource baseline with random inter-annual variability as <- 40 # Maximum anomaly size (try 2x to 5x the resource baseline value) ai <- 12 # Maximum anomaly interval (try 5 to 15 years) ftv <- c(70,71,72,120,122) # Vector of flowering thresholds (length must be ns) ### For additional explanations of variables not set by the user, see Appendix B. ### Create a table of a randomly varying resource as specified by rb, as, and ai above r <- data.frame(y=1:ny, r=1:ny) r$r <- (sample(1:rb, ny, replace=T)) y <- 1; while (y < ny-ai) { y <- y+sample(1:ai,1); r[y,2] <- r$r[y]+sample(1:as,1) } r[1:20,] # Prints the first 20 rows of the resource data table fs=as.data.frame(matrix(nrow=ny, ncol=ns+1)) ### Create a an empty plot area to fill with results graphics.off() par(mar=c(0,0,0,0), oma=c(3,1,1,0), mfrow=c(ns+2,1)) ### Resource tracking model with two loops that repeat the calculations for each species ### (counter k), tree within species (counter i), and for each year (counter j) and plots ### the resource status (rp) and the flowering events (fp) into a graphics window. for (k in 1:ns) { rm <- as.data.frame(matrix(nrow=ny, ncol=nt)) fm <- as.data.frame(matrix(nrow=ny, ncol=nt))
for (i in 1:nt){ for (j in i:ny) {
rm[i,i] <- 0 rm[j+1,i] <- ifelse(rm[j,i]<ftv[k],((r[j+1,2])+rm[j,i]),0) }
rm <- rm[1:ny,] fm[,i] <- ifelse(rm[,i]>=ftv[k],1,0) }
fm[is.na(fm)] <- 0 # replaces missing values with zeros for graphs
### plot the frequency of flowering events across all trees plot(rowSums(fm[,1:nt])~r$y,type="l", col=rainbow(ns)[k], lwd=2,
axes=F, ann=F, xlim=c(-15,ny)) abline(v=seq(0,ny,ny/5),lty=2) text(-9,nt/(3+ftv[k]/max(ftv)),paste("Species",k)) fs[,k]<-rowSums(fm[,1:nt]) } ### plot the combined tree population of all species xpos=barplot(t(fs[,c(1:(ns))]),col="white",border="white", axes=F, ann=F,yaxt="n") par(new=T) x=xpos[2]-xpos[1] barplot(t(fs[,c(1:(ns))]),col=rainbow(ns), axes=F, ann=F,yaxt="n", xlim=c((-15*1.2+0.1), xpos[ny]+0.6)) abline(v=seq(xpos[1]-0.6,xpos[ny]+0.6,(xpos[ny]-xpos[1]+1.2)/5),lty=2) text(-9*1.2,(ns*nt)/3.5,"General") text(-9*1.2,(ns*nt)/5,"Flowering") ### plots the randomly varying resource for reference plot(r$r~r$y, xlim=c(-15,ny), ylim=c(0,max(r$r)), axes=F, ann=F, type="l") axis(1, at=seq(0,ny,ny/5)) abline(v=seq(0,ny,ny/5),lty=2) text(-9,(as+rb)/2,"Resource")
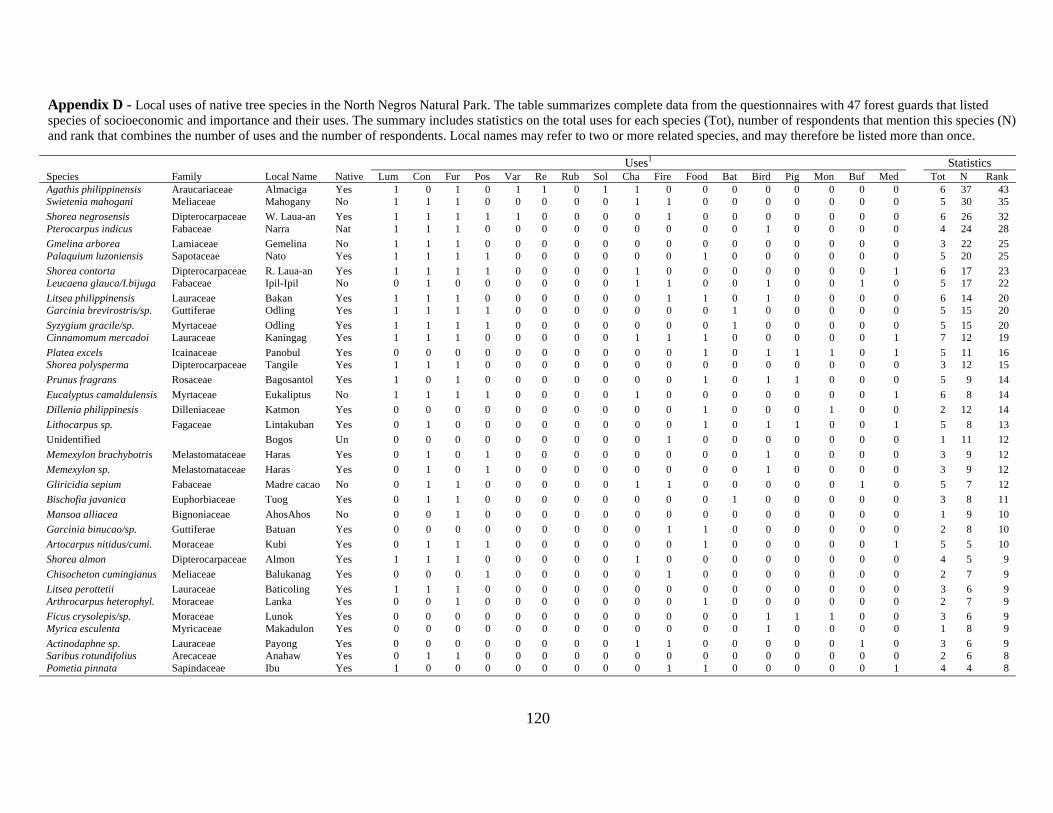
120
Appendix D - Local uses of native tree species in the North Negros Natural Park. The table summarizes complete data from the questionnaires with 47 forest guards that listed species of socioeconomic and importance and their uses. The summary includes statistics on the total uses for each species (Tot), number of respondents that mention this species (N) and rank that combines the number of uses and the number of respondents. Local names may refer to two or more related species, and may therefore be listed more than once.
Uses1 StatisticsSpecies Family Local Name Native Lum Con Fur Pos Var Re Rub Sol Cha Fire Food Bat Bird Pig Mon Buf Med Tot N Rank Agathis philippinensis Araucariaceae Almaciga Yes 1 0 1 0 1 1 0 1 1 0 0 0 0 0 0 0 0 6 37 43 Swietenia mahogani Meliaceae Mahogany No 1 1 1 0 0 0 0 0 1 1 0 0 0 0 0 0 0 5 30 35
Shorea negrosensis Dipterocarpaceae W. Laua-an Yes 1 1 1 1 1 0 0 0 0 1 0 0 0 0 0 0 0 6 26 32 Pterocarpus indicus Fabaceae Narra Nat 1 1 1 0 0 0 0 0 0 0 0 0 1 0 0 0 0 4 24 28
Gmelina arborea Lamiaceae Gemelina No 1 1 1 0 0 0 0 0 0 0 0 0 0 0 0 0 0 3 22 25 Palaquium luzoniensis Sapotaceae Nato Yes 1 1 1 1 0 0 0 0 0 0 1 0 0 0 0 0 0 5 20 25
Shorea contorta Dipterocarpaceae R. Laua-an Yes 1 1 1 1 0 0 0 0 1 0 0 0 0 0 0 0 1 6 17 23 Leucaena glauca/I.bijuga Fabaceae Ipil-Ipil No 0 1 0 0 0 0 0 0 1 1 0 0 1 0 0 1 0 5 17 22
Litsea philippinensis Lauraceae Bakan Yes 1 1 1 0 0 0 0 0 0 1 1 0 1 0 0 0 0 6 14 20 Garcinia brevirostris/sp. Guttiferae Odling Yes 1 1 1 1 0 0 0 0 0 0 0 1 0 0 0 0 0 5 15 20
Syzygium gracile/sp. Myrtaceae Odling Yes 1 1 1 1 0 0 0 0 0 0 0 1 0 0 0 0 0 5 15 20 Cinnamomum mercadoi Lauraceae Kaningag Yes 1 1 1 0 0 0 0 0 1 1 1 0 0 0 0 0 1 7 12 19
Platea excels Icainaceae Panobul Yes 0 0 0 0 0 0 0 0 0 0 1 0 1 1 1 0 1 5 11 16 Shorea polysperma Dipterocarpaceae Tangile Yes 1 1 1 0 0 0 0 0 0 0 0 0 0 0 0 0 0 3 12 15
Prunus fragrans Rosaceae Bagosantol Yes 1 0 1 0 0 0 0 0 0 0 1 0 1 1 0 0 0 5 9 14
Eucalyptus camaldulensis Myrtaceae Eukaliptus No 1 1 1 1 0 0 0 0 1 0 0 0 0 0 0 0 1 6 8 14
Dillenia philippinesis Dilleniaceae Katmon Yes 0 0 0 0 0 0 0 0 0 0 1 0 0 0 1 0 0 2 12 14
Lithocarpus sp. Fagaceae Lintakuban Yes 0 1 0 0 0 0 0 0 0 0 1 0 1 1 0 0 1 5 8 13
Unidentified Bogos Un 0 0 0 0 0 0 0 0 0 1 0 0 0 0 0 0 0 1 11 12
Memexylon brachybotris Melastomataceae Haras Yes 0 1 0 1 0 0 0 0 0 0 0 0 1 0 0 0 0 3 9 12
Memexylon sp. Melastomataceae Haras Yes 0 1 0 1 0 0 0 0 0 0 0 0 1 0 0 0 0 3 9 12
Gliricidia sepium Fabaceae Madre cacao No 0 1 1 0 0 0 0 0 1 1 0 0 0 0 0 1 0 5 7 12
Bischofia javanica Euphorbiaceae Tuog Yes 0 1 1 0 0 0 0 0 0 0 0 1 0 0 0 0 0 3 8 11
Mansoa alliacea Bignoniaceae AhosAhos No 0 0 1 0 0 0 0 0 0 0 0 0 0 0 0 0 0 1 9 10
Garcinia binucao/sp. Guttiferae Batuan Yes 0 0 0 0 0 0 0 0 0 1 1 0 0 0 0 0 0 2 8 10
Artocarpus nitidus/cumi. Moraceae Kubi Yes 0 1 1 1 0 0 0 0 0 0 1 0 0 0 0 0 1 5 5 10
Shorea almon Dipterocarpaceae Almon Yes 1 1 1 0 0 0 0 0 1 0 0 0 0 0 0 0 0 4 5 9
Chisocheton cumingianus Meliaceae Balukanag Yes 0 0 0 1 0 0 0 0 0 1 0 0 0 0 0 0 0 2 7 9
Litsea perottetii Lauraceae Baticoling Yes 1 1 1 0 0 0 0 0 0 0 0 0 0 0 0 0 0 3 6 9 Arthrocarpus heterophyl. Moraceae Lanka Yes 0 0 1 0 0 0 0 0 0 0 1 0 0 0 0 0 0 2 7 9
Ficus crysolepis/sp. Moraceae Lunok Yes 0 0 0 0 0 0 0 0 0 0 0 0 1 1 1 0 0 3 6 9 Myrica esculenta Myricaceae Makadulon Yes 0 0 0 0 0 0 0 0 0 0 0 0 1 0 0 0 0 1 8 9
Actinodaphne sp. Lauraceae Payong Yes 0 0 0 0 0 0 0 0 1 1 0 0 0 0 0 1 0 3 6 9 Saribus rotundifolius Arecaceae Anahaw Yes 0 1 1 0 0 0 0 0 0 0 0 0 0 0 0 0 0 2 6 8 Pometia pinnata Sapindaceae Ibu Yes 1 0 0 0 0 0 0 0 0 1 1 0 0 0 0 0 1 4 4 8

121
Appendix D - continued from previous page Uses1 Statistics
Species Family Local Name Native Lum Con Fur Pos Var Re Rub Sol Cha Fire Food Bat Bird Pig Mon Buf Med Tot N Rank Acacia mangium/holo. Fabaceae Acacia No 0 1 1 0 0 0 0 0 0 0 0 0 0 0 0 0 0 2 5 7 Dipterocarpus grandif. Dipterocarpaceae Apitong Yes 1 1 0 0 0 0 0 0 1 1 0 0 0 0 0 0 0 4 3 7
Memexylon cumingii Melastomataceae Bulobayabas Yes 0 0 0 0 0 0 0 0 1 0 0 0 0 0 0 0 0 1 6 7 Trema orientalis Urticaceae Hinagdong Yes 0 0 1 0 0 0 0 0 0 0 0 0 1 0 0 0 0 2 5 7
Unidentified Wild pine Yes 0 0 1 0 0 0 0 0 0 1 0 0 0 0 0 0 0 2 5 7 Calliandra calothyrsus Fabaceae Calliandra Yes 0 0 1 0 0 0 0 0 1 1 0 0 0 0 0 1 0 4 2 6
Ficus minahassae Moraceae Hagimit No 0 0 1 0 0 0 0 0 0 1 0 0 0 0 0 0 0 2 4 6 Aglaia elliptica Meliaceae Lambunau Yes 1 0 0 0 0 0 0 0 0 0 0 0 0 0 0 0 1 2 4 6
Triplaris cumingiana Polygonaceae Palusanto No 0 0 0 1 0 0 0 0 1 1 0 0 0 0 0 0 0 3 3 6 Sandoricum koetjape Meliaceae Santol Nat 1 0 1 0 0 0 0 0 0 0 0 0 0 0 0 0 0 2 4 6
Calameae sp. Arecaceae Uway Yes 1 0 1 1 0 0 0 0 0 0 0 0 0 0 0 0 0 3 3 6 Pometia pinnata Sapindaceae Alauihau Yes 0 1 0 0 0 0 0 0 0 0 0 0 0 0 0 0 0 1 4 5
Citrus microcarpa/mitis Rutaceae Kalamansi Yes 0 0 1 0 0 0 0 0 0 0 1 0 0 0 0 0 0 2 3 5 Palaquium sp. Sapotaceae Laku-laku Yes 1 0 0 0 0 0 0 0 0 0 0 0 0 0 0 0 0 1 4 5
unidentified Takenis Yes 0 0 0 0 0 0 0 0 0 1 0 0 1 0 0 0 0 2 3 5 Alphitonia excelsa Rhamnaceae Taulay Yes 0 0 0 1 0 0 1 0 0 0 0 0 0 0 0 0 0 2 3 5
Litsea tomentosa Lauraceae Bonsliak Yes 1 0 0 0 0 0 0 0 0 0 0 0 0 0 0 0 0 1 3 4 Ficus benjamina/sp. Moraceae Dalakit Yes 0 0 0 0 0 0 0 0 0 0 0 0 1 0 0 0 0 1 3 4
unidentified Malabaga Un 0 0 1 0 0 0 0 0 0 0 0 0 0 0 0 0 0 1 3 4 Azadirachta indica Meliaceae Neem No 0 1 0 0 0 0 0 0 0 0 0 0 0 0 0 0 1 2 2 4
unidentified Ronidalia No 0 0 0 0 0 0 0 0 0 0 1 0 0 0 0 0 0 1 3 4 Casuarina equisetlifolia Casuarinaceae Agoho Nat 0 0 0 0 0 0 0 0 1 0 0 0 0 0 0 0 1 2 1 3
unidentified Black Berry No 0 0 0 0 0 0 0 0 0 1 0 0 1 0 0 0 0 2 1 3 unidentified Black Virg Yes 0 0 0 0 0 0 0 0 0 1 1 0 0 0 0 0 0 2 1 3
unidentified Ero-Ero Yes 0 0 1 0 0 0 0 0 0 0 0 0 1 0 0 0 0 2 1 3 Ficus septica Moraceae Labnog Yes 0 0 0 0 0 0 0 0 0 0 0 1 0 0 0 0 0 1 2 3
Artocarpus odoratissimus Moraceae Marang Yes 0 0 1 0 0 0 0 0 0 0 1 0 0 0 0 0 0 2 1 3
unidentified Taraple Un 0 0 0 0 0 0 0 0 0 0 1 0 0 0 0 0 0 1 2 3
Pariti tiliaceum Malvaceae Balibago No 0 0 0 0 0 0 0 0 1 0 0 0 0 0 0 0 0 1 1 2
unidentified Cansilay Yes 0 0 0 0 0 0 0 0 0 0 0 0 0 0 0 0 1 1 1 2
Coffea arabica Rubiaceae Coffee No 0 0 0 0 0 0 0 0 0 0 1 0 0 0 0 0 0 1 1 2
Durio zibethinus Malvaceae Durian No 0 0 0 0 0 0 0 0 0 0 1 0 0 0 0 0 0 1 1 2
unidentified Hamogni Yes 0 0 1 0 0 0 0 0 0 0 0 0 0 0 0 0 0 1 1 2
Pittosporum moluccanum Pittosporaceae Malabuyo Yes 0 0 0 0 0 0 0 0 0 0 0 0 1 0 0 0 0 1 1 2
Mangifera indica Anacardiaceae Mango No 0 0 0 0 0 0 0 0 0 0 1 0 0 0 0 0 0 1 2 3
Nephelium lappaceum Sapindaceae Rambutan Nat 0 0 0 0 0 0 0 0 0 0 1 0 0 0 0 0 0 1 1 2
Canarium villosum Burseraceae Salong Yes 0 1 0 0 0 0 0 0 0 0 0 0 0 0 0 0 0 1 1 2
1 Uses: Lum-Lumber, Con-Construction, Fur-Furniture, Pos-Polls/posts, Var-Varnish, Re-Resin, Rub-Rubber, Sol-Paint Solvent, Cha-Charcoal, Fir-Firewood, Food-Edible fruits/seed, Bat-Food for bats, Bird-Food/nests for birds, Pig-Food for wild pig, Mon-Food for monkeys, Buf-Food for water buffalo, Med-Medicine.
Top Related