


Languages
Pages
Legal


1
Supplemental Material (Snow et al.)
Case Presentations
Patients 1-4 and 6-8 and selected relatives were evaluated at Cincinnati Children’s
Hospital Medical Center. Patient 5 was originally evaluated at Dana Farber Cancer
Institute, in consult with Dr. Nichols at Children’s Hospital of Philadelphia. Informed
consent was provided by the families according to an Institutional Review Board (IRB)-
approved research protocol. All healthy control subjects were studied according to IRB-
approved protocols.
Case 1: Patient 1 (Pt1) originally presented at 3 years of age with a history of failure to
thrive, emesis, and abdominal pain. Evaluation revealed a non-metastatic, extranodal
diffuse large B-cell lymphoma involving the GI tract. He achieved complete remission
with standard-of-care chemotherapy. At 7 years of age, routine follow-up imaging
revealed another abdominal mass, consistent with non-metastatic, extranodal diffuse
large B-cell lymphoma. He was treated with an intensified chemotherapeutic course,
including weekly rituximab for 10 months, and again achieved complete remission. At 11
years of age, he was found to have cervical adenopathy, and biopsy revealed large B-cell
lymphoma. He had no evidence of prior EBV infection/exposure by serology,
blood/tissue PCR, or in-situ staining of biopsy specimens. XLP was diagnosed following
flow cytometric analysis of SAP, which revealed the absence of protein, as shown in
Figure 1. Following re-induction of remission and confirmatory genetic testing (Table 1),
he underwent unrelated bone marrow transplantation following a reduced-intensity

2
conditioning (RIC) regimen consisting of alemtuzumab, fludarabine, and melphalan. He
is doing well > 1 year after transplant, showing full donor engraftment and immune
reconstitution.
Case 2: Patient 2 (Pt2) had a distant history of large B-cell lymphoma at the age of 2
years, characterized by a paraspinal tumor, left kidney involvement, and bone marrow
disease. He attained full remission after chemotherapy and paraspinal radiation. He then
remained healthy until age 12 when he developed respiratory failure several weeks after
varicella zoster virus (VZV) vaccine administration. CT imaging revealed bilateral
infiltrates and nodules. All cultures of BAL fluid were negative, as were PCR studies
including EBV, cytomegalovirus (CMV), herpes simplex virus (HSV), and VZV.
Streptococcus viridans was identified by blood culture. The patient was noted to have
hepatomegaly, bi-lineage cytopenia and a highly elevated ferritin. Splenomegaly was not
noted, and bone marrow aspirate did not show hemophagocytosis. He was diagnosed
with macrophage activation syndrome (MAS) and treated with methylprednisolone,
cyclosporine, IVIG, and etanercept, in addition to broad-spectrum antibiotic therapy.
Flow cytometric analysis of SAP expression revealed absence of protein, and genetic
testing confirmed the diagnosis of XLP (Figure 1, Table 1). EBV VCA-IgM and IgG
directed against EBV-Early Antigen (not transferred via IVIG) were negative.
Retrospective in-situ staining of his original lymphoma for EBV was negative. A course
of four rituximab infusions was given, followed by an unrelated donor SCT, using a RIC
preparatory regimen including alemtuzumab, fludarabine, and melphalan. At >1 year post
SCT, he is showing full donor engraftment and appropriate immune reconstitution.

3
Case 3: Patient 3 (Pt3) presented at the age of 7 years with respiratory distress and
pneumonia requiring hospital admission. He later developed vomiting and seizures.
Cerebrospinal fluid analyses showed mild pleocytosis and persistently elevated protein,
without identifying bacterial, viral, fungal or opportunistic organisms. Brain MRI
revealed bilateral mesial temporal signal abnormalities. Chest CT imaging revealed
centrally located airspace disease and peripheral lung nodules, and lung biopsy showed
nonspecific interstitial pneumonitis with bronchiolitis obliterans/organizing pneumonia.
In-Situ staining and polymerase chain reaction (PCR) for EBV were negative as well.
Tissue human herpesvirus 6 (HHV-6) PCR was positive. Bacterial, fungal,
mycobacterial, and viral cultures were negative. A brief course of methylprednisolone
therapy rapidly resolved pulmonary symptoms and abnormal CT-finding, but
discontinuation led to relapse of pulmonary disease. Repeat lung biopsy again revealed
interstitial pneumonitis, with a T-cell predominant lymphocytic infiltrate noted on
immunohistochemical staining. All infectious studies were negative. Remission was
regained with corticosteroid therapy. EBV serologies remained negative. Following
diagnosis of XLP (Figure 1, Table 1), the patient received four weekly doses of
rituximab. He underwent unrelated donor SCT transplantation following a RIC regimen,
consisting of alemtuzumab, fludarabine, and melphalan. Now >1 year post transplant, he
is showing full engraftment and early signs of immune reconstitution.
Case 4: Patient 4 (Pt4) is the 17-year old maternal half-brother of Pt3. He presented at
age 9 with a large B-cell lymphoma encasing the terminal ileum. He went into remission

4
after completing standard-of-care lymphoma treatment and has remained otherwise
healthy. EBV VCA-IgG, EBNA-IgG as well as and EBV VCA-IgM were negative, as
was blood EBV PCR. Retrospective evaluation and staining of his original lymphoma
tissue was negative for EBV. Following diagnosis of XLP, he was started on Rituximab
and IVIG, and underwent SCT in 12/08.
Case 5: Patient 5 (Pt5) is a 31-year old man with a germline deletion of the SH2D1A
gene, who was diagnosed after developing pancytopenia, splenomegaly, colitis and
coagulopathy between 14 – 17 years of age. The patient’s family history was remarkable
for 3 brothers with manifestations of XLP, including pulmonary LPD, fulminant
infectious mononucleosis and lymphoma. Splenectomy was performed over concerns of
lymphoma. Histologic evaluation of the spleen, as well as biopsies of the bone marrow,
colon and liver revealed infiltration by T and B-lymphocytes, with no evidence for
malignancy or EBV infection. His symptoms all improved spontaneously following
splenectomy, but stable pulmonary nodules developed over time. He developed primary
EBV infection at age 25, but he responded well to treatment with Rituximab and steroids.
He now has a history of chronic skin rashes akin to psoriasis, for which he receives
topical treatments.
Case 6: Patient 6 (Pt6) presented at age 2 with a large multi-compartmental Burkitt
lymphoma tumor emanating from the left posterolateral nasopharynx. During
chemotherapy, his 2-year-old brother developed a rapidly progressive EBV infection and
died within a short time. It was at this point that XLP was suspected, confirmed in Pt6 by

5
genetic testing. Further family history indicated that his maternal grandmother had lost 4
boys during childhood to a combination of viral illness and tumors. Genetic analysis of
his 2 other brothers showed them to be normal. He is currently being scheduled for
SCT.
Case 7: Patient 7 (Pt7) is the asymptomatic 2 year old brother of Pt 8 (see below),
diagnosed on the basis of family history.
Case 8: Patient 8 (Pt8) is a 4-year-old boy with a history of X-linked lymphoproliferative
syndrome and Burkitt’s lymphoma. He was in general good health for his first 2 years of
life, although he was noticed to have slow recovery from upper respiratory tract
infections. In 2006 he presented with a diffuse rash and cervical lymphadenopathy. His
biopsy was positive for Burkitt’s lymphoma, prompting chemotherapy that brought his
cancer into remission after 4 cycles. In September 2008, a chest CT showed pulmonary
nodules that were diffuse and bilateral, which worsened over 2 months. A lung biopsy
revealed mostly T-cell proliferation with no malignant cells. Concurrently, during this
period, his brother had an episode of Burkitt’s lymphoma and underwent genetic testing
for XLP. Both brothers were found to have the same mutation in SH2D1A, resulting in a
loss of SAP protein expression. Laboratory evaluation showed no evidence of prior EBV
infection, and pan bacterial, fungal and viral cultures have all been negative to date.
HHV-6 was identified by PCR in blood in 2/09, but has not been found again. He is
currently being scheduled for SCT.

6
Supplemental Methods: Clinical analysis of lymphocyte phenotype and function
Assays were completed in a Clinical Immunology Laboratory, in compliance with
all major regulatory agencies and regulations, including CLIA, CAP, JCAHO and
HIPAA. For all analyses, appropriate assay controls (healthy non-smoking subjects) were
used. Results were interpreted in the context of previously obtained age-appropriate
reference ranges.
Standard flow cytometry using whole blood was performed with fluorochrome-
labeled mAbs to a variety of T-, B- and NK-cell markers, including CD3, CD4, CD8,
CD16, CD19, CD20, CD25, CD27, CD40L, CD45, CD45RA, CD45RO, CD56, CD69,
CD71, CD95, B220, inducible costimulator (ICOS), gamma/delta T-cell receptor (TCR),
alpha/beta TCR, TCR-Valpha24, TCR-Vbeta11, perforin (Prf), and granzyme B (GrB).
All antibodies were obtained from BD Biosciences, unless otherwise specified, and all
flow cytometry was performed on a FACSCalibur or FACSCanto flow cytometer (BD
Biosciences). Appropriate gating was used to define specific T- and B-cell subsets of
interest. NK cells were defined by CD16 and/or CD56 expression on non-T cells. NKT
cells were identified by expression of TCR-Vα24 in combination with TCR-Vβ11
(obtained from Beckman Coulter) on CD3-positive lymphocytes. Determination of
intracellular perforin and GrB was measured as previously described.14 In short,
anticoagulated blood was first incubated with Abs detecting cell surface markers for 15
minutes at room temperature. This was followed by a standard permeabilization/fixation
procedure and staining with either fluorochrome-conjugated anti-Prf or anti-GrB, or
isotype-matched controls followed by washing and analysis.

7
Plasma levels of cytokines were measured using BioSource’s Human cytokine 10-
Plex kit. Samples were read on a BioRad BioPlex instrument utilizing Luminex
technology. Serial dilutions of cytokine standard and normal control samples were run
with each assay. Soluble levels of the alpha chain of the IL-2 receptor (sIL-2Rα) were
determined as previously described and compared to an established pediatric reference
range.
T-cell proliferation was measured by [3H] thymidine incorporation of peripheral
blood mononuclear cells (PBMC) following incubation with mitogens
phytohemagglutinin (PHA, 5 µg/mL), concanavalin-A (ConA, 5 µg/mL), and pokeweed
mitogen (PWM, ? concentration), and/or antigens, tetanus toxoid and Candida. ICOS up-
regulation was assessed by incubating whole blood for 5- and 12-hours with phorbol
myristate acetate (PMA) and calcium ionophore, ionomycin.16 After the respective
incubation periods, cells were labeled with fluorochrome-conjugated mAbs specific for
ICOS, CD40L, and CD69 and analyzed by flow cytometry. In Pt4, concurrently with the
PMA/ ionomycin experiments, whole blood was incubated with PHA (6 µg/ml) and rIL-2
(25 U/ml) for 24 hours, followed by flow cytometric detection of ICOS, CD40L, and
CD69 on CD3+/CD8- lymphocytes.
CTL function was determined via a 2-phase cytotoxicity assay in which PBMC
(effector cells) underwent a primary 7-day incubation period with irradiated
(8000rad/80Gy) target cells (EBV-transformed lymphoblastic cell line [LCL]) to
sensitize the effector cells. In the second phase, effector cells were incubated for 4 hours
with 51Cr-labeled LCLs at different effector/target ratios. NK-cell function was measured
by incubating 51Cr-labeled K562 target cells with PBMC. For cytotoxicity assays,

8
experiments were performed in triplicate, and both spontaneous (target cell lysis without
the presence of effector cells) and maximum (target cells incubated in the presence of
detergent to promote total cell lysis) release of 51Cr were determined. Cytotoxicity for
each ratio was calculated as % lysis = [(mean counts per minute [cpm] of the experiment
– mean spontaneous release cpm)/(mean maximum cpm – mean spontaneous release
cpm)] x 100 and converted into lytic units (LU).

9
Supplemental Table 1: Immunologic evaluations, genetic analysis, and EBV status of 4 patients seen at Cincinnati Children’s Hospital Medical Center.
A: Expressed as % of total lymphocytes B: Expressed as # cells per microliter C: Age-matched reference ranges
Patient 1 Patient 2 Patient 3 Patient 4 CD3+ T cells [52%-78%] / [700-4200]C
73%A / 2359B 85% / 709 69% / 2732 70% / 1900
CD4+ T cells [25%-48%] / [300-2100]
44% / 1408 59% / 492 46% / 1822 48% / 1310
CD8+ T cells [9%-35%] / [200-1200]
29% / 928 26% / 217 23% / 911 20% / 546
CD19+ B cells [8%-24%] / [200-600]
17% / 556 8%/ NDD 16% / 594 22% / 601
CD27+ B cells [14%-58%]
5.5%E 23% 9% 6%
CD16/56+ NK cells [6%-27%] / [70-1200]
10% / 320 15% / 125 15% / 634 7% / 191
CD8+/Prf+ T cells NDF 26%G [<12%] 16% [<12%] 32% [<28%] CD8+/GrB+ T cells ND 41% [<31%] 23% [<31%] 47% [<31%] PHA [> 138000] 191667H 143732 143732 195926 Con-A [> 99500] ND ND 186788 ND PWM [> 11600] ND ND 102599 ND Candida [> 15289] 88324 95870 107801 122822 Tetanus [> 4761] 51191 11055 147970 8903 CTL [> 6] 0I 0 12.9/18.1/0 1.6 /12.1/3.3 NK-cell [> 3.1] 0.1I 3.8 1.3 /0.6/ 0.2 1.7/ 6.3 /0.1 IgG [598-1611] 976J 931 879 1046 IgM [46-263] 54 197 168 311 IgA [68-371] 28 77 177 446 Tetanus titer Normal ND Poor Poor Dipthteria titer Normal ND Poor Poor Pneumococcal titers Normal ND Poor Poor Plasma IL-4 [<119pg/mL]
ND <5/76 433/30/7 17
Plasma IL-10 [<31pg/mL]
ND <5/38 85/21/16 <5
Plasma IFN-g [<68pg/mL]
ND 5/57 143/20/24 14
EBV PCR and/or in situ staining in tissue
Negative [lymphoma]
Negative [lymphoma]
Negative [lung]
Negative [lymphoma]
EBV PCR in fluid Negative [blood]
Negative [blood]
[BAL]K [CSF]L
Negative [blood] [CSF]
Negative [blood]
EBV VCA IgM Negative Negative Negative Negative EBV VCA IgG Negative ND Negative Negative EBV EBNA Negative ND Negative Negative EBV Early Antigen ND Negative ND ND SH2D1A analysis Gross deletion
including exons 2-4
Gross deletion including exons 1-4
195_196 insert T
(A66fsX67)
195_196 insert T
(A66fsX67)

10
D: ND = not determined E: Expressed as % of total B cells F: ND = not determined G: Expressed as % of CD8+ T cells H: Proliferation data expressed in counts per minute (cpm) I: CTL and NK-cell function data expressed in lytic units (LU) J: Expressed as mg/dL K: BAL = bronchoalveolar lavage fluid L: CSF = cerebrospinal fluid

11
Supplemental Figure Legends
Supp Figure 1. Flow cytometric analysis of intracellular SAP expression.
Intracellular flow cytometry was performed on whole blood lymphocytes, gated on CD8+
T cells and NK cells (left panel). SAP expression was determined as a percentage of the
lymphocyte subset expressing SAP in three patients and the mother of Pts 3 and 4
(Cr1=Carrier 1). SAP expression with the reference ranges of a normal control (NC) is
shown for comparison.
Supp Figure 2. Cellular changes associated with RICD are blocked in XLP patients.
(A) Activated T cells from a normal control or XLP Pt 4 were restimulated with 5 µg/ml
ConA or 2 µg/ml PHA. Apoptosis was measured 24 hr after treatment by PI staining and
flow cytometry. (B) Activated T cells from normal controls, XLP patients, or the mother
of Pts 3 & 4 (Cr1) were treated as in Figure 1 and stained with AnnexinV-FITC or
DiOC6. The % specific change (minus background) in AnnexinV+ cells (black bars) or
DiOC6lo cells (gray bars) is shown. (C) Activated T cells were treated as in (B) and
stained for intracellular, activated caspase 3. The percentage of cells positive for activated
caspase 3 (black) relative to untreated (gray) is shown. (D) Activated T cells from control
(C1) and Pt 5 were treated as in (B) and stained with AnnexinV-FITC or DiOC6.
Supp Figure 3. Impaired RICD in XLP Pts 5-8. Activated T cells from a normal
controls or XLP patients were cultured for 7-10 d in 100U/ml IL-2 were tested for
sensitivity to apoptotic stimuli, including TCR restimulation using anti-CD3 (OKT3)
mAb, agonistic anti-Fas APO1.3 mAb, staurosporine, UV-irradiation, or IL-2

12
withdrawal. Apoptosis was measured 24 hr after treatment by PI staining and flow
cytometry. Data shown is mean ± SD for triplicate wells, representative of two or more
independent experiments.
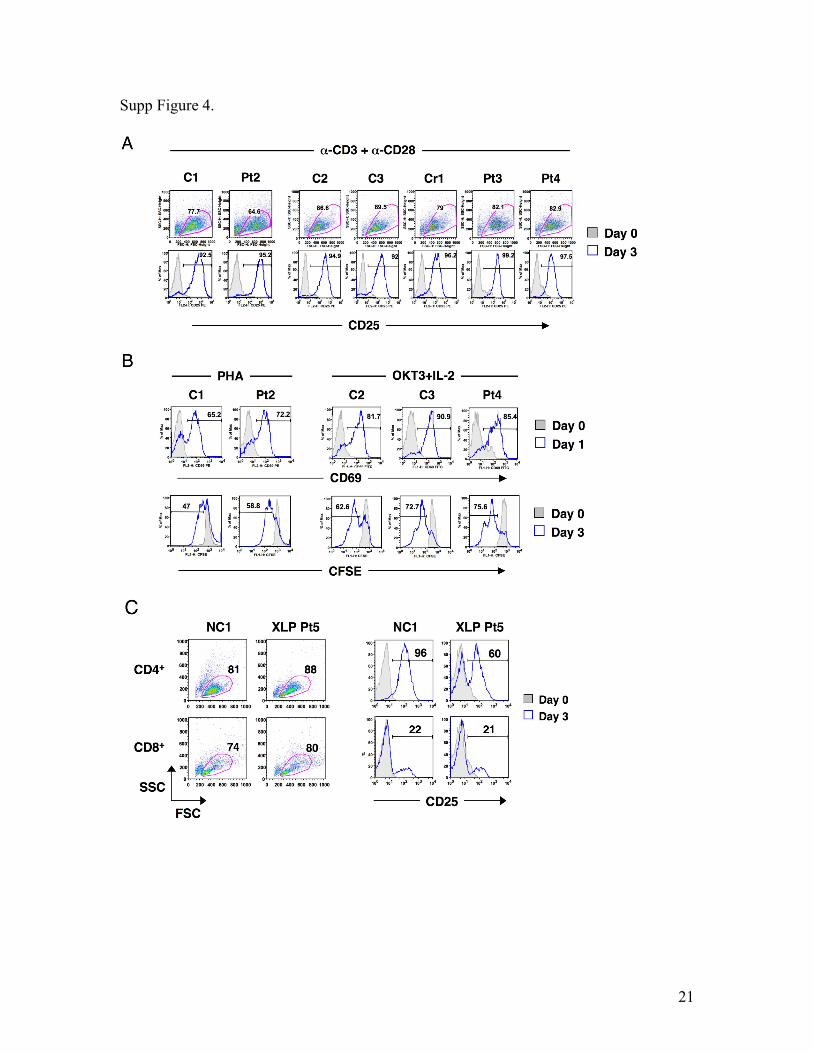
Supp Figure 4. Naïve T cell activation in patients with XLP. (A) Peripheral blood
leukocytes (PBL) were treated with 1 µg/ml of anti-CD3 and anti-CD28 for 3 days. On
day 3, blast phenotype (as assessed by forward and side scatter profile) and induction of
CD25 (open histogram) on the surface of gated CD2+ T cells was assessed by flow
cytometry compared to expression prior to activation (filled histogram). Data are
representative of two independent experiments. (B) PBL were labeled with CFSE and
activated with either 2 µg/ml PHA or 1 µg/ml OKT3 mAb plus 25 U/ml rIL-2. CD69
induction was assessed by flow cytometry 24 hr post-activation (open histogram)
compared to unstimulated cells (filled histogram). CFSE dilution was measured on day 3
by flow cytometry (open histogram), compared to unstimulated cells collected on day 0
(filled histogram). (C) CD4+ and CD8+ T cells purified from fresh PBMC were
stimulated with 1 µg/ml of anti-CD3 and anti-CD28 for 3 days. On day 3, blast
phenotype and CD25 induction (open histogram) was assessed by flow cytometry
compared to expression prior to activation (filled histogram).
Supp Figure 5. Normal naïve T cell activation with SAP knockdown. (A) Intracellular
flow cytometry for SAP expression in activated PBL 4 days post-transfection with NS- or
SAP-specific siRNA. NC and XLP Pt4 cells served as positive and negative controls,
respectively. (B) Naïve PBMC were transfected with NS- or SAP-specific siRNA. Viable

13
T cells were labeled with CFSE and activated 4 days after transfection with 1 µg/ml
OKT3 mAb plus 25U/ml IL-2. CD25 induction and CFSE dilution was measured on day
3 by flow cytometry, compared to unstimulated cells on day 0. Knockdown of SAP
expression was measured by immunoblotting lysates. (B) Naïve PBMC were transfected
with NS-, SAP-, or PKC-specific siRNA, then stimulated 2 days later with 1 µg/ml of
anti-CD3 and anti-CD28 mAbs. After 3 days, proliferation was measured by 3H-
thymidine incorporation (cpm). Knockdown efficiency of target proteins was measured
by immunoblotting lysates.
Supp Figure 6. Silencing SAP expression attenuates RICD of EBV-specific CD8+ T
cells. EBV-specific T cells transfected with designated siRNA were co-cultured for 24
hrs with irradiated, autologous LCL at various ratios, then stained with CD8 and
AnnexinV. The percentage of viable, gated CD8+ T cells based on forward scatter is
noted (A). The percentage of AnnexinV+ cells within the viable gate is noted in each
histogram (B).
Supp Figure 7. Impaired induction of FASL, BIM, and CRTAM upon TCR
restimulation of XLP patient T cells. (A) Real-time PCR analysis of FASLG, BIM, and
CRTAM mRNA expression in activated T cells from a normal control (NC), XLP Pts 2
& 3, and Cr1 following restimulation with 200 ng/ml OKT3 mAb for 6 hrs. Results are
shown as fold induction relative to untreated cells (0 hrs), normalized to GAPDH
expression at each timepoint. (B) Activated T cells were restimulated with 200 ng/ml
OKT3 mAb for 24 hrs, then stained with anti-CRTAM mAb. Percentage of CRTAM+

14
cells at 24 hrs (empty histogram) versus untreated (0 hrs, filled) is noted. (C) Activated T
cells were lysed following a timecourse of restimulation with 200 ng/ml OKT3 mAb.
Cell lysates were separated by SDS-PAGE and immunoblotted with Abs listed at right;
β-actin serves as a loading control. (D) Real-time PCR analysis of FASLG and BIM
mRNA induction in activated T cells from a normal control (C1) and XLP Pt 5. (E)
Immunoblotting of lysates from C1 versus XLP Pt 5 as described in (C). (F) Cells from a
normal control or XLP Pt 6 were stimulated and lysed as in (C). Cell lysates were
separated by SDS-PAGE and immunoblotted with Abs listed at right. (G) Activated
CD4+ and CD8+ T cells from normal control (NC) versus XLP Pt 7 (purified prior to
activation) were restimulated as in (C) and lysed. Cell lysates separated by SDS-PAGE
were immunoblotted with Abs listed at right.
Supp Figure 8. Real-time PCR confirmation of TCR-induced genes from
microarray analysis downmodulated in the absence of SAP expression. (A) NS
(black) versus SAP (gray) siRNA-transfected T cells. (B) Normal control (NC, black)
versus XLP Pt5 (gray) T cells. Results are shown as fold induction a 6 hrs post-
restimulation with 200 ng/ml OKT3 mAb relative to untreated cells (0 hr), normalized to
GAPDH expression at each timepoint.
Supp Figure 9. Knockdown of CRTAM or PD-L1 leads to a slight reduction in
RICD sensitivity. Activated PBL were transfected with designated siRNA and cultured
in IL-2 for an additional 4 days, then restimulated with increasing doses of OKT3 mAb.
Cell death at 24 hrs was assessed by PI staining and measured by flow cytometry. Data

15
shown is mean ± SD for triplicate wells.
Supp Figure 10. RNAi screen for effect of SLAM receptor silencing on TCR-
induced apoptosis sensitivity. (A) Knockdown efficiency of each SLAM-R siRNA
(dashed line) was measured by flow cytometry following staining with specific Abs or
isotype control Abs (gray filled), relative to NS siRNA transfected cells (black line). (B)
Activated T cells from a normal donor were transfected with NS- or SLAM-R-specific
siRNA as designated in 3 separate experiments. Cells were restimulated with increasing
doses of OKT3 mAb, and apoptosis was measured at 24 hrs by PI staining and flow
cytometry. SAP siRNA transfected cells serve as a positive control.
Supp Figure 11. Silencing NTB-A expression recapitulates impaired TCR-induced
target gene induction noted in SAP-deficient T cells. (A) NS (black) versus NTB-A
(gray) siRNA-transfected T cells. Results are shown as fold induction a 6 hrs post-
restimulation with 200 ng/ml OKT3 mAb relative to untreated cells (0 hr), normalized to
GAPDH expression at each timepoint.
Supp Figure 12. CD84 is not associated with SAP in restimulated T cells. SAP was
immunoprecipitated from PBL lysates prepared following a short timecourse of OKT3
stimulation. Immunoprecipitates were separated by SDS-PAGE and immunoblotted for
the presence of CD84 and SAP. CD84 expression in input lysates is shown below for
comparison.

16
Supp Figure 13. Effect of SAP on TCR-induced death is largely FYN-independent.
(A) Activated T cells were transfected with designated siRNA, cultured for 4 days, and
restimulated with OKT3 mAb. Apoptosis was measured by PI staining and flow
cytometry. Cell lysates prepared from siRNA-transfected cells were separated by SDS-
PAGE and immunoblotted with Abs listed at right to assess knockdown efficiency of
each target gene (right panel). (B) Activated XLP Pt 4 PBL were transfected with
pVenus-SAP(wild-type, WT), pVenus-SAP (R78A), or pVenus alone and incubated
overnight. After dead cell removal, cells were restimulated with 500 ng/ml OKT3 for 8
hrs. Apoptosis was measured by AnnexinV staining; the additional AnnexinV+ gate in the
upper right quadrant excludes Venus+ cells that could not be compensated due to bright
fluorescence.
Supp Figure 14. Impaired NTB-A colocalization with CD3 following restimulation
in XLP T cells. Cells were stained with mAbs detecting CD3 (OKT3, green) and NTB-A
(red) and left on ice (4C) or warmed to 37C for 30 min. Cells were imaged by confocal
microscopy, with nuclei counterstained in blue. After deconvolution, colocalization of
red and green signal (false-colored in white) was calculated using Imaris 6.2.1 software.
Percentage colocalization of CD3 with NTB-A within a standard intensity threshold is
shown in the 2-way histogram; axes differ based on maximum signal intensity for each
sample.
Supp Figure 15. Simultaneous knockdown of SHP-1 expression partially reverses
RICD resistance conferred by SAP silencing. Activated PBL were transfected with

17
SAP- (gray circles) or SHP-1-specific siRNA (filled squares), or both (empty squares)
and restimulated with increasing doses of OKT3 mAb. Apoptosis was measured by PI
staining and flow cytometry. Knockdown efficiency of SAP and SHP1 was assessed by
immunoblotting (right panel).
Supp Figure 16. OKT3 mAb hypercrosslinking or 64.1 mAb restores caspase
activation in XLP Pt4 T cells. (A) Purified CD4+ and CD8+ T cells were restimulated
with increasing doses of the anti-CD3 mAb 64.1. Apoptosis was measured by PI staining
and flow cytometry. (B) Soluble FasL was measured in supernatants by ELISA from cells
left untreated (untx, white bars) or restimulated with 200 ng/ml OKT3 without (gray) or
with (black) 1 ug/ml Protein A, or 200 ng/ml 64.1 mAb (blue) for 8 hrs. (C) Activated
PBL were treated as in (B). Caspase 8 activity was measured in prepared lysates using a
colorimetric assay. (D) Cells treated with OKT3 or 64.1 mAbs as above were stained for
intracellular active caspase 3 and analyzed by FACS.
Supp Figure 17. CD3 hypercrosslinking rescues FASL and BIM induction and
subsequent apoptosis in XLP Pt 5 T cells. (A) Activated T cells from a normal control
(NC, black) or XLP Pt5 (gray) were treated with increasing doses of OKT3 mAb in the
absence (filled) or presence (empty) of 1 mg/ml Protein A, and apoptosis was measured
after 24 hours. Data are representative of two or more independent experiments. (B) Cells
as in (A) were lysed following 0, 4 and 8 hrs of restimulation with 200 ng/ml OKT3 mAb
-/+ 1 mg/ml Protein A. Cell lysates were separated by SDS-PAGE and immunoblotted
with Abs listed at right. (C) Activated T cells from a normal control (NC) or XLP Pt 4

18
restimulated for 0 (gray filled) or 8 hrs with 200 ng/ml of OKT3 mAb in the absence
(red) or presence (blue) of 1 mg/ml Protein A. Expression of CRTAM and PD-L1 was
measured by flow cytometry, compared to cells stained with isotype control Abs (black).
Supp Fig 18. Analysis of AICD/p73 induction in SAP-deficient T cells. (A) CFSE-
labeled PBL were treated with 1 µg/ml of anti-CD3 and anti-CD28 for 4 days, then
stained with AnnexinV-PE. The percentage of AnnexinV+ (apoptotic) in dividing cells is
denoted in each dot plot. Alternatively, PBL transfected with NS or SAP-specific siRNA
were stimulated and analyzed as above. (B) PBL were activated as above over 3 days,
and p73 expression was measured in lysates made at 24 hr intervals. (C) RT-PCR
quantitation of p73 and FasL expression following 6 hr restimulation of activated PBL.

19
Supp Figure 1.
Supp Figure 2.

20
Supp Figure 3.
21
Supp Figure 4.

22
Supp Figure 5.
Supp Figure 6.

23
Supp Figure 7.

24
Supp Figure 8.
Supp Figure 9.

25
Supp Figure 10.
Supp Figure 11.

26
Supp Figure 12.
Supp Figure 13.

27
Supp Figure 14.
Supp Figure 15.

28
Supp Figure 16.
Supp Figure 17.

29
Supp Figure 18.
Top Related