


Languages
Pages
Legal


This is an electronic reprint of the original article.This reprint may differ from the original in pagination and typographic detail.
Powered by TCPDF (www.tcpdf.org)
This material is protected by copyright and other intellectual property rights, and duplication or sale of all or part of any of the repository collections is not permitted, except that material may be duplicated by you for your research use or educational purposes in electronic or print form. You must obtain permission for any other use. Electronic or print copies may not be offered, whether for sale or otherwise to anyone who is not an authorised user.
Allahyari, Pegah; Rasuli, Reza; Servati, Mahyar; Alizadeh, MahdiSuperhydrophobic and low-hysteresis coating based on rubber-modified TiO2/SiO2nanoparticles
Published in:BULLETIN OF MATERIALS SCIENCE
DOI:10.1007/s12034-021-02384-8
Published: 01/06/2021
Document VersionPublisher's PDF, also known as Version of record
Please cite the original version:Allahyari, P., Rasuli, R., Servati, M., & Alizadeh, M. (2021). Superhydrophobic and low-hysteresis coating basedon rubber-modified TiO
2/SiO
2 nanoparticles. BULLETIN OF MATERIALS SCIENCE, 44(2), 1-7. [85].
https://doi.org/10.1007/s12034-021-02384-8

Superhydrophobic and low-hysteresis coating based onrubber-modified TiO2/SiO2 nanoparticles
PEGAH ALLAHYARI1, REZA RASULI1,* , MAHYAR SERVATI1 and MAHDI ALIZADEH1,2
1Department of Physics, Faculty of Science, University of Zanjan, P.O. Box 45371-38791, Zanjan, Iran2Engineered Nanosystems Group, School of Science, Aalto University, 00076 Espoo, Finland
*Author for correspondence ([email protected])
MS received 2 July 2020; accepted 20 November 2020
Abstract. In this article, the wettability of a superhydrophobic layer from rubber-modified TiO2/SiO2 nanocomposite is
studied. The nanocomposites were prepared with various ratios of TiO2 and SiO2 nanoparticles (NPs) and then studied the
effect of annealing, UV irradiation and aging after coating on a substrate. Results show that the average contact angle of
deionized water droplets on the most hydrophobic coating is 129.5�, which increases up to 151.0� by UV irradiation. In
addition, the lowest surface energy of the prepared layers was measured as 29.61 mJ m–2. The hydrophobicity of the
coating surface was investigated after annealing (at temperatures up to 300�C), and results show that the maximum
contact angle is about 150�. The dynamics of water droplets on the most hydrophobic coating were investigated by rapid
imaging, and results show no hysteresis for surface wetting. Fourier transform infrared spectroscopy shows that UV
irradiation causes the formation of C–H functional groups on the surface without considerable change in the
hydrophobicity, while the annealing process has no significant effects on the functional groups. The morphology of the
coatings was investigated by scanning electron microscopy, and results reveal that the roughness of surfaces increases due
to annealing and UV radiation. In addition, a minimum increase in the roughness coefficient is estimated as 73% of the
initial value after annealing, which is in agreement with atomic force microscopy results.
Keywords. TiO2 nanoparticles; silica; superhydrophobic; surface energy.
1. Introduction
Fabrication and characterization of surfaces with a favour-
able degree of wettability has attracted remarkable interests
in recent years due to their potential for nanotechnology
applications, such as self-cleaning [1], anti-icing and gra-
dient surfaces [2–4]. Generally, four main features can
affect the wettability of a surface, including surface texture,
surface chemistry, coating condition and post-processing
treatment [2]. Hydrophilic and hydrophobic expressions
define the adhesion level of water droplets to the surface
[4,5]. The surface energy of a hydrophilic coating is higher
than the hydrophobic surfaces, and a water droplet can
move on it due to solid–liquid interactions [6,7], arising
from the gradient in surface energy. A gradient surface is a
coating, in which its wettability varies from superhy-
drophobic to superhydrophilic [8]. These surfaces can be
achieved by controlling the wettability of the coatings layer
on a substrate [6,7]. Wettability surface texture and surface
chemistry can be modified by coating condition and post-
processing treatment.
Fabrication of the superhydrophobic surface with
favourable properties is a challenge in the field of surface
and interface science [9,10]. As reported, Wenzel–Cassie
coexist state can be fabricated by porous surface, which
improves catalysing due to maximizing the interface of
electrode coating [11]. Extensive application of non-wetting
surfaces requires a facile and cost-effective method to
fabricate these coatings [4]. For instance, Ganne and co-
workers [7] have reported a superhydrophobic mesh by
multimodal roughness with high stability and anti-icing
performance, which shows hours of freezing delay for water
droplets. Water repellency of the coating surface could be
significantly enhanced by the use of SiO2 and TiO2 NPs due
to coating porosity [12]. Hydrophobic TiO2–SiO2 porous
composite can be synthesized by several methods [13]. For
instance, Kim et al [14] reported a cost-effective SiO2–TiO2
composite using titanium oxychloride as a TiO2 precursor,
which can be applied for the purification of the contami-
nated air and this degradation of organic contaminations
[12,15,16]. Moreover, crystal stability can be enhanced by
the addition of SiO2 as a dopant for TiO2 [17], and com-
bining silica and titania NPs can provide a significant
stable coating with a larger surface area [18]. Anitha et al[19] prepared mesoporous superhydrophobic silica without
fluorine, which guides for the use of nanoparticles (NPs) in
the composite for easily controlling the coating quality and
process. The porosity and coating technology are important
Bull. Mater. Sci. (2021) 44:85 � Indian Academy of Scienceshttps://doi.org/10.1007/s12034-021-02384-8Sadhana(0123456789().,-volV)FT3](0123456789().,-volV)

for the fabrication of a superhydrophobic surface and the
use of NPs is promising for this purpose. Fabrication of a
coating with an arbitrary degree of wettability and studying
of water droplet dynamics on a hydrophobic surface is still a
challenge for NP-based composites [19,20]. The stability of
these coatings against hazard conditions is another chal-
lenge that should be addressed for further applications.
Using hydrophilic particles and silicone elastomeric mate-
rials one can fabricate a superhydrophobic surface with
excellent stretchability [21]. In addition, desirable stability
can be achieved for myriad-lined protrusions on the surface
of the TiAl-based composite [20]. The durability of sub-
merged hydrophobic coating with flat and patterned cross-
linked polydimethylsiloxane surfaces was studied and
results show that the positive replica remains hydrophobic
for a month [22]. Coating technology and post-processing
treatments, which can convert a hydrophobic composite to
superhydrophobic, is essential for porous composite based
on NPs to fabricate a stable and optimized wettability.
In this article, the wettability of rubber-modified TiO2/
SiO2 nanocomposite as a coating layer is investigated. The
coating layer was prepared with different concentrations of
TiO2 and SiO2 NPs. Wettability of the as-prepared coating
was examined by contact angle measurement of water
droplets on the prepared coating surface. Also, UV and
annealing effects were studied separately for the most
hydrophobic surface.
2. Materials and methods
SiO2 NPs were used with an average size of 20 nm from
Kimia Gostar Poyesh Company and anatase TiO2 NPs with
an average size of 30 nm from US-Nano Company. Com-
mercial silicon rubber (SelSil 100% silicone polymer) was
prepared from SEL DIS Turkey and other materials
including n-hexane (95%), acetone (99%), 1-methyl-2-
pyrrolidinone (99%), ethylene glycol (99%) and glycerol
(99%) were purchased from Merck.
To provide the composite, two solutions were prepared
with TiO2 and SiO2 NPs, respectively. For the first solution,
5 mg of silicon rubber (SR) was added to 20 ml of n-hexane
and then solved it by stirring for 60 min with an angular
speed of 1200 RPM. Afterwards, the prepared solution was
exposed in an ultrasonic bath for 10 min with a power of
400 W. In the next step, 10 mg of TiO2 NPs were added to it
and stirred for 30 min. To prepare the second solution, 10
mg of SiO2 NPs were dissolved in 20 ml of n-hexane by
stirring at a rate of 1200 RPM for 30 min and sonicating in
an ultrasonic bath for 10 min.
Finally, TiO2/SR solution and SiO2 solution were mixed
with 20, 40, 50, 60 and 100 wt%. The composite was
deposited on a glass substrate by the drop-casting method
and then dried at 65�C. The contact angle of deionized
water droplets was measured for all samples before and
after UV irradiation under a circulating fan for 30 min.
A UV-C lamp was used as the UV source with a power of
1.40 mW cm-2 and a peak emission of 254 nm. In addition,
70
90
110
130
150
170
0 20 40 60 80 100 TiO2 concentration (wt%)
Con
tact
Ang
le (d
egre
e)
After UV
as-prepared
Figure 1. Changes in contact angle of de-ionized water droplets
vs. TiO2/SR concentration in SiO2 solution before and after UV
radiation.
100
120
140
160
50 100 150 200 250 300Temperature (°C)
Con
tact
Ang
le (d
egre
e)
(a)
100 200 300 400 50094
96
98
100
Temperature (°C)
Wei
ght (
%)
-0.03
-0.02
-0.01
0.00
DTG
A
(b)
Figure 2. (a) The annealing effect on the hydrophobicity of sample prepared by equal concentration of
TiO2 and SiO2 NPs. (b) TGA and differential thermal analysis experiment from the prepared
superhydrophobic sample.
85 Page 2 of 7 Bull. Mater. Sci. (2021) 44:85

the prepared samples were annealed for 30 min at temper-
atures of 100, 150, 200, 250 and 300�C, and then the contactangle of water droplets was measured. The surface energy
of the coatings was calculated from the contact angle of
various droplets (at least 5 different points on 3 samples),
including n-hexane, acetone, 1-methyl-2-pyrrolidinone and
ethylene glycol. Scanning electron microscopy (SEM) was
performed by an LEO 1455-VP SEM and optical
microscopy was performed by Motic BA210E Microscope.
In the SEM experiment, the samples were coated with a thin
layer of silver (around 10 nm). Fourier transform infrared
(FTIR) spectroscopy was conducted by a Perkin-Elmer
580B spectrophotometer using the KBr disk technique.
Atomic force microscopy (AFM) was performed by a
Multi-Mode AFM from Ara-Research Company. The
samples were prepared for AFM analysis by drop-casting
method on a glass substrate and then dried at 65�C. Ther-mogravimetric analysis (TGA) was performed by
NETZSCH STA 409 PC/PG instrument.
3. Results and discussion
Figure 1 shows the contact angle of prepared samples
before and after UV exposure in various TiO2/SR concen-
trations in the SiO2 solution. As shown in figure, the pre-
pared sample with the same ratio of TiO2 and SiO2 NPs is
the best hydrophobic with a contact angle value of 129.5�.However, the contact angle of water droplets increases for
all samples after UV irradiation, and the maximum contact
angle becomes 151.1� for 50 wt% of TiO2/SR solution in
the SiO2 solution. Wetness behaviour relates to the inter-
action of the fluid and the substrate, and when the liq-
uid/vapour interfacial tension is stronger than the solid/
liquid interfacial tension, the water drop on the surface can
be spherical with the contact angle larger than 150� [4,5]. Inaddition, increasing the concentration of TiO2 NPs in the
composite increases the wettability of the surface. This can
be due to SR wetting transparency, which transports the
hydrophilic properties of TiO2 NPs to the coating surface
[11,23]. Wetting transparency is allowing the ‘transmission’
of the substrate wettability to above the surface coating
[23]. When TiO2 concentration is too high, the wettability
increases due to the hydrophilicity of the NPs. The polymer
layer is wetting transparent and does not disrupt the intrinsic
wetting behaviour of the coating surfaces and therefore the
surface wettability is modified according to the concentra-
tion of TiO2 NPs.
Figure 2a shows the contact angle of water droplets for
the coating surface with equal ratios of SiO2 and TiO2 NPs
after annealing. Annealing temperatures were taken as 60,
100, 150, 200, 250 and 300�C for 30 min. Results show an
increase in hydrophobicity, and the maximum contact angle
(about 150�) was obtained for annealed samples at 300�C.As a matter of point, a critical annealing temperature can be
obtained, which induce a wetting transition between two
wetting modes; the Wenzel state and Cassie–Baxter state
[24]. Cassie–Baxter and Wenzel regimes are two well-
known models that explain the increase in contact angle due
to the roughness of the surface and its structure [25–28].
The Cassie–Baxter regime is used when the liquid does not
penetrate into the pores of the surface, and a layer of air lies
between the surfaces and water droplets while in Wenzel
model water droplet is in contact with all surfaces, and the
Table 1. Surface tension and contact angle of the test liquids,
which were used in this study. The surface tension was taken from
ref. [4].
Liquid cl (mJ m–2) Contact angle
1-Methyl-2-pyrrolidinone 40.79 30.6�n-Hexane 18.43 0�Ethylene glycol 47.99 101.7�Water 72.80 151.1�Glycerol 64.00 130.2�Acetone 25.20 9.1�
Figure 3. Fitted curve for calculation of the surface free energy
by Neumann method.
Figure 4. The FTIR spectrum of the as-prepared, UV irradiated
and annealed coating at 300�C sample.
Bull. Mater. Sci. (2021) 44:85 Page 3 of 7 85

whole surface is wetted [9,25–29]. The increase of the
surface roughness can cause trapping the air pockets under
the droplet. The Cassie–Baxter model can describe wetting
of such a heterogeneous system, and the equilibrium con-
ditions for a drop in this state are given by [27]:
CosðhCBÞ ¼ fs½RFCosðhYÞ þ 1� � 1; ð1Þ
where hCB is the apparent contact angle in the Cassie–
Baxter state, hY is Young’s contact angle for the smooth or
simple surface, fs is the area fractions of the solid and RF the
roughness ratio parameter, which is equal to the actual ratio
of the solid–liquid surface area to the apparent solid–liquid
surface area. Therefore, the value of RF on a rough surface
is higher than one. Neglecting the trapping air pockets and
taking area fractions as 1, the equilibrium conditions for a
drop can be taken as Wenzel state [26]:
CosðhWÞ ¼ RFCosðhYÞ; ð2Þ
where hW is the apparent contact angle. At low annealing
temperatures, the contact angle was lower, suggesting that
the wetting mode is in the Wenzel state, which describes
intimate contact between the surface and water. In contrast,
for higher annealing temperatures, the contact angle
increases. The wetting mode is in the Cassie–Baxter state
due to the good water-repellent property, and the interface
tension between the surface and water is dramatically
decreased due to the air trapping in the surface structures.
Figure 2b shows the TGA and differential thermal analysis
experiments from the prepared sample. As shown, 7.1%
weight loss at the first stage and 25.57% at the second stage
is observed for the most superhydrophobic composite. The
first domain of weight loss is attributed to the solvent
evaporation from the composite, while the second weight
loss (25.57%) is attributed to the SR oxidation.
To calculate the surface free energy of the most
hydrophobic coating, the Neumann equation is used [4]. For
this purpose, the contact angle of several different liquids
with different surface tensions was measured, as presented
in table 1 and figure 3, by using the Neumann equation
[30,31]:
Cos h ¼ �1þ 2
ffiffiffiffi
cscl
r
e�bðcs�clÞ2 ð3Þ
where cl and cs represent the free energy of the liquid and
the surface, respectively, h is the contact angle related to thedroplet on the surface and b is a constant, which is deter-
mined experimentally. The equation (1) can be rewritten as
follows:
Figure 5. (a) Dynamics of water droplets on the prepared surface covered with hydrophobic coating, showing the water drop after
collision and then raising due to the hydrophobicity. This continues many times until the drop leaves the surface without leaving any
residue on the surface. (b) Advancing and receding a water droplet on the prepared surface, which shows superhydrophobicity of the
surface.
0 30 60 90 120140
145
150
155
160C
onta
ct A
ngle
(deg
ree)
Time (day)
Figure 6. The contact angles of water droplets on the prepared
coating after exposing in UV irradiation.
85 Page 4 of 7 Bull. Mater. Sci. (2021) 44:85

ln clð1þ Cos hÞ2
2
!" #
¼ lnðcsÞ � 2bðcs � clÞ2 ð4Þ
To obtain the surface free energy, the left side of the
equation (4) has been plotted for the five liquids, including
water, ethylene glycol, 1-methyl-2-pyrrolidinone, acetone
and n-hexane, and then fit a second-order curve on them.
The equation of the fitted curve, in figure 3, for the contact
angle of the presented liquids in table 1 gives the surface
free energy as 29.61 mJ m–2.
FTIR spectroscopy was performed to investigate the dif-
ference between UV and annealing effect on the chemical
composition of the prepared coating. Figure 4 shows the FTIR
results for the as-prepared, UV irradiated and the annealed
samples. As shown in this figure, the absorption peak around
the wavenumber of 3450 cm–1 refers to the stretching vibra-
tions of the Si–OH bond, and the peak at the wavenumber of
2930 cm–1 is due to the asymmetric stretching vibrations of C–
H [6]. In addition, absorption peaks corresponding to the Si–
CH3 and Si–O bonds are appearing at 1260 and 1090 cm–1,
respectively [32,33].Absorption peaks in the range of 700–900
cm–1 are due to Si–O symmetric stretching, Si–CH3 bending,
Si–C stretching and alsoTi–O–Si stretching [34,35].As shown
in this figure, the relative intensity of C–H to the Si–O peak
increases by UV irradiation, which can be due to photo-oxi-
dation of the SR matrix in the presence of TiO2 NPs. This
process can increase the surface roughness by improving par-
ticle dispersion in the SR matrix, which is in agreement with
the previously reported results [36]. In addition, three effects
are observed in the annealed spectrum, in figure 4: broad water
peaks at 3270and1630cm–1decreasedue to the evaporation of
Figure 7. Photographs taken by optical microscopy for (a) as-prepared, (b) UV irradiated, (c) annealedat 150�C and (d) at 300�C samples. (e and f) AFM image of the surface for the as-prepared and annealed
sample, respectively.
Bull. Mater. Sci. (2021) 44:85 Page 5 of 7 85
water, the Si–OH peak decreases relative to Si–O–Si peaks
showing that heat condenses the silica NPs, and some of the
C–H peaks may have been lost due to oxidation.
Figure 5a shows the images of a water drop, which has
thrown at a distance of 10 cm on the surface of the super-
hydrophobic coating. As shown, the water drop is dis-
tributed after a collision with the surface and then is raised
due to the hydrophobicity of the surface and finally moves
up. This continues many times until the drop leaves the
surface without leaving any residue on the surface. This
indicates an extremely high level of hydrophobicity without
any hysteresis. Figure 5b shows the advancing and receding
of a water droplet on the surface that confirms the previous
results by exhibiting superhydrophobicity without hystere-
sis. To investigate the UV effect on the hydrophobicity of
coating, we measured the contact angle of the treated
coating for a few months. As shown in figure 6, the pre-
pared composite shows acceptable stability in 120 days.
Figure 7a–d shows the microscopic photograph of the
coating surface. As shown in this figure, the porosity of the
surface increases after annealing and UV irradiation, which
can increase the hydrophobicity of the surface, according to
Cassie–Baxter regime [9,29]. Figure 7e and f also shows the
01020304050607080
50 100 150 200 250 300Temperature (°C)
∆RF
(%)
Figure 8. Variation in roughness coefficient by annealing at
temperatures up to 300�C.
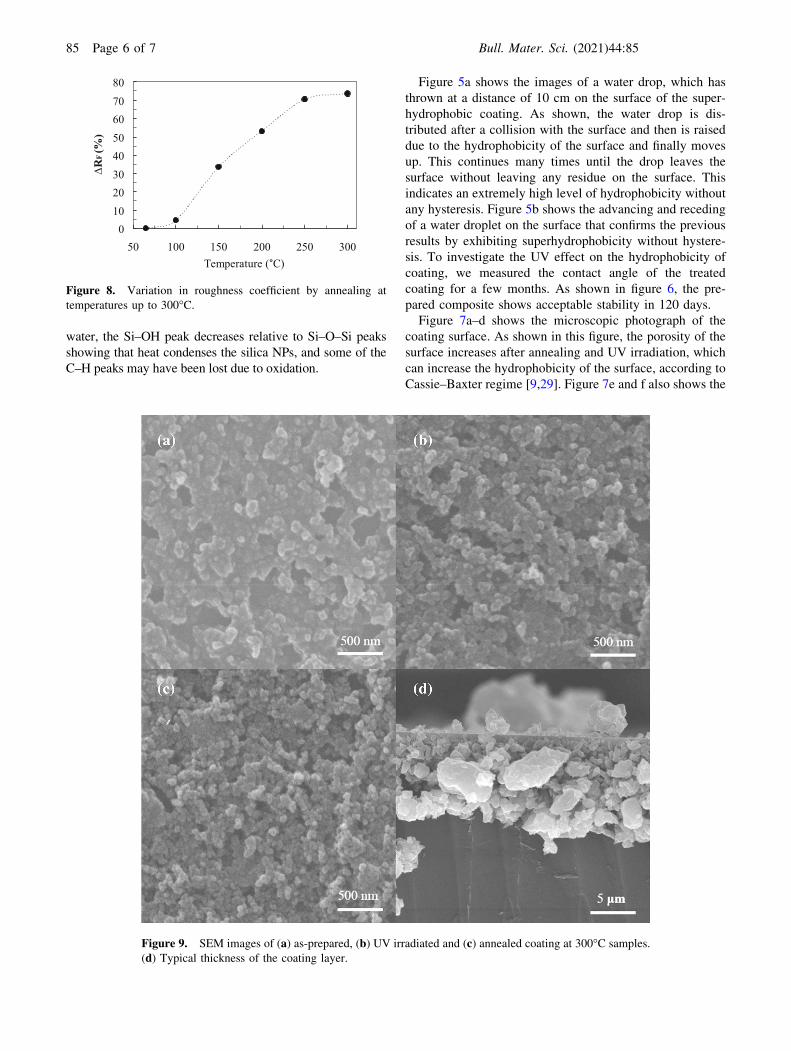
Figure 9. SEM images of (a) as-prepared, (b) UV irradiated and (c) annealed coating at 300�C samples.
(d) Typical thickness of the coating layer.
85 Page 6 of 7 Bull. Mater. Sci. (2021) 44:85

AFM image from the prepared coating. The arithmetic
average value of filtered roughness (Ra) was calculated from
deviations about the centre surface within the AFM images.
As shown, the Ra value increases from 128.2 to 287.4 nm by
annealing the coating at 300�C. According to FTIR results,
functional groups of the composite remain unchanged by
annealing, and therefore increasing of hydrophobicity is
mainly due to roughness enhancement, which is seen in
figures 7 and 8.
Assuming a simple surface for the surface of as-prepared
coating and a rough surface for the annealed samples at 300�Caccording to AFM data, we calculate minimum changes inRF
due to annealing according to equation (2). Figure 8 shows the
minimum variation in roughness coefficient after annealing
up to 73% of initial values. This is well illustrated by SEM
analysis, as presented in figure 9. SEM images of the prepared
surface for as-prepared, and UV irradiated and annealed
samples at 300�C are presented in figure 9a–c. As shown, the
prepared coating has a hierarchical structure with a rough
surface, which is desirable for hydrophobic surfaces. In
addition, the SEM image from the edge of the coated layer in
figure 9d shows a thickness of 10–15 lm.
4. Conclusions
A superhydrophobic and low-hysteresis coating from rubber-
modified TiO2/SiO2 nanocomposites were presented. The
wettability of samples was studied by contact angle mea-
surement of water droplets on the coating surface. UV and
annealing effects were reported separately for the most
hydrophobic surface, and results show that the roughness of
surfaces increases by annealing and UV radiation as well as
hydrophobicity of the samples. In addition, rapid imaging of
water droplet dynamics shows no hysteresis for the surface
wetting. FTIR spectroscopy shows that UV irradiation causes
the formation of C–H functional groups on the surface, while
annealing has no significant effect on the functional groups.
The average contact angle of the deionized water droplet on
the prepared coating was obtained at 151.1�, and its surface
energy was measured as 29.61 mJ m–2.
Acknowledgement
We thank the University of Zanjan for financial supports.
References
[1] Banik M, Chakrabarty P, Das A, Ray S K and Mukherjee R
2019 Adv. Mater. Interfaces 6 1900063
[2] Tian X, Verho T and Ras R H A 2016 Science 352 142
[3] Qing Y, Yang C, Yu N, Shang Y, Sun Y, Wang L et al 2016Chem. Eng. J. 290 37
[4] Mokarian Z, Rasuli R and Abedini Y 2016 Appl. Surf. Sci.369 567
[5] Simpson J T, Hunter S R and Aytug T 2015 Rep. Prog. Phys.78 086501
[6] Shang W, Deng S, Feng S, Xing Y, Hou Y and Zheng Y
2017 RSC Adv. 7 7885
[7] Ganne A, Lebed V O and Gavrilov A I 2016 Colloids Surf.A Physicochem. Eng. Asp. 499 150
[8] Roy S, Bhandaru N, Das R, Harikrishnan G and Mukherjee R
2014 ACS Appl. Mater. Inter. 6 6579
[9] Rasuli R, Mokarian Z, Karimi R, Shabanzadeh H and Abe-
dini Y 2015 Thin Solid Films 589 364
[10] Ghashghaee M, Fallah M and Rabiee A 2019 Prog. Org.Coat. 136 105270
[11] Wang P, Hayashi T, Meng Q, Wang Q, Liu H, Hashimoto K
et al 2017 Small 13 1601250
[12] Zhu J, Xie J, Lu X and Jiang D 2009 Colloid Surf. A 342 97
[13] Parale V G, Kim T, Lee K-Y, Phadtare V D, Dhavale R P,
Jung H-N-R et al 2020 Ceram. Int. 46 4939
[14] Kim Y N, Shao G N, Jeon S J, Imran S M, Sarawade P B and
Kim H T 2013 Chem. Eng. J. 231 502
[15] Wan F, Wang C, Han Y, Kong L, Yan J, Zhang X and Liu Y
J D T 2018 Dalton Trans. 47 13608
[16] Latthe S S, Sutar R S, Kodag V S, Bhosale A K, Kumar A M,
Kumar Sadasivuni K et al 2019 Prog. Org. Coat. 128 52
[17] Klaysri R, Wichaidit S, Tubchareon T, Nokjan S,
Piticharoenphun S, Mekasuwandumrong O et al 2015
Ceram. Int. 41 11409
[18] Kumar S R, Suresh C, Vasudevan A K, Suja N, Mukundan P
and Warrier K 1999 Mat. Lett. 38 161
[19] Anitha C, Azim S S and Mayavan S 2017 J. Alloys Compd.711 197
[20] Tang M-K, Huang X-J, Yu J-G, Li X-W and Zhang Q-X
2017 J. Mater. Process. Tech. 239 178
[21] Ju J, Yao X, Hou X, Liu Q, Zhang Y S and Khademhosseini
A 2017 J. Mat. Chem. A 5 16273
[22] Varughese S M and Bhandaru N 2020 Soft Matter 16 1692
[23] Ramos-Alvarado B, Kumar S and Peterson G P 2016 J.Chem. Phys. 144 014701
[24] Xu J, Li M, Zhao Y and Lu Q 2007 Colloids Surf. A 302 136
[25] Wenzel R N 1949 J. Phys. Chem. 53 1466
[26] Wenzel R N 1936 Ind. Eng. Chem. 28 988
[27] Cassie A and Baxter S 1944 Trans. Faraday Soc. 40 546
[28] Cassie A 1948 Discuss Faraday Soc. 3 11
[29] Lei Y, Sun R, Zhang X, Feng X and Jiang L 2016 Adv.Mater. 28 1477
[30] Taran L and Rasuli R 2017 Adv. Powd. Technol. 28 2996
[31] Rasuli R, Irajizad A and Ahadian M M 2009 Vacuum 84 469
[32] Momen G and Farzaneh M 2012 Appl. Surf. Sci. 258 5723
[33] Kim S-H, Cherney E A, Hackam R and Rutherford K G 1994
IEEE Trans. Dielectr. Electr. Insul. 1 106
[34] Das G, Mariotto G and Quaranta A 2006 J. Electrochem.Soc. 153 F46
[35] Mirabedini A, Mirabedini S, Babalou A and Pazokifard S
2011 Prog. Org. Coat. 72 453
[36] Zhang H, Yang H and Shentu B 2019 J. Appl. Polym. Sci.136 47170
Bull. Mater. Sci. (2021) 44:85 Page 7 of 7 85
Top Related