


Languages
Pages
Legal


Colombia MRP Draft
Mexico, PMR PA8 March, 2014
Sugerencia: Ya aquí, destacar el solido paraguas institucional que se ha logrado articular en esta fase, con cuatro agencias fundamentales.

Urban and Regional
Transport Policy
Massive Integrated
Transport System
(SITM)
Strategic Public
Transport Systems
(SETP)
Small Cities
Strategies
Mobility plans
(PM)
Binational Systems
(SAB)
Integrated Public
Transport Systems
(SITP)
Integrated Regional
Transport Systems
(SITR)
•Territorial Planning
Colombian
transport policy
components
•Population greater
than 600,000
habitants
•Population between
250.000 and 600,000
inhabitants
• Population lower than
250,000 inhabitants
•Strategy to improve
transport service
providing efficiency and
quality
• Multimodal
Regional Strategy •Territorial Planning
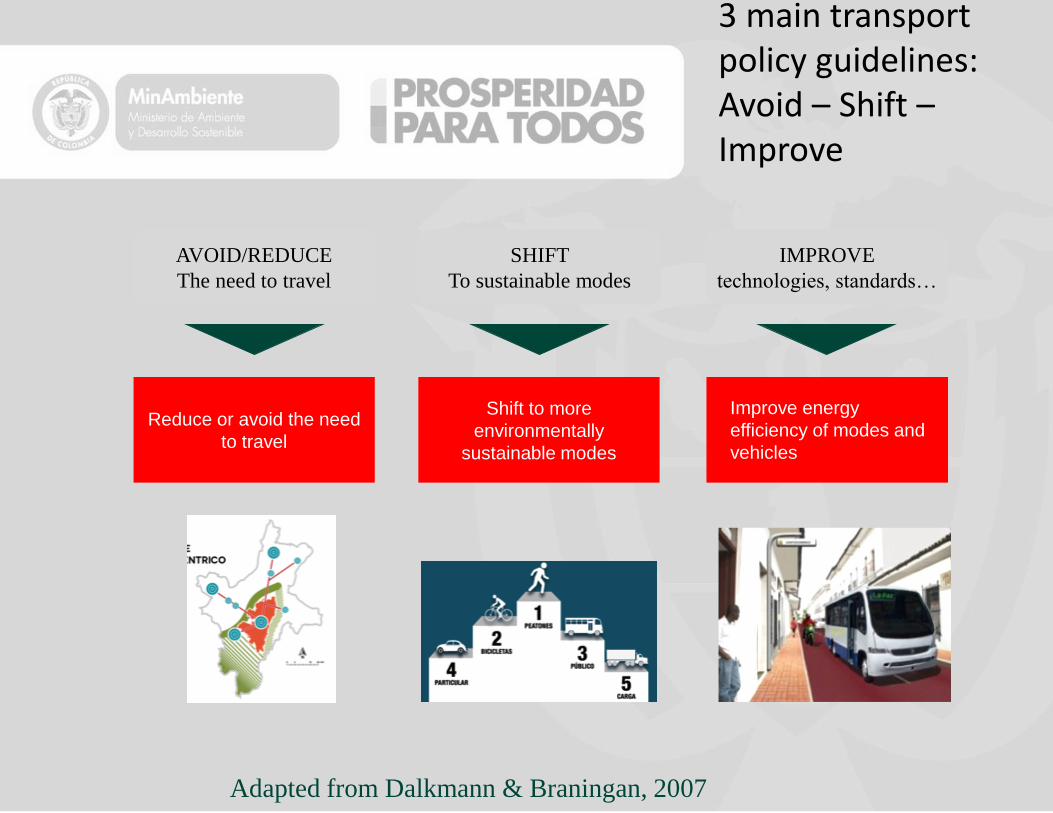
3 main transport policy guidelines: Avoid – Shift – Improve
SHIFT
To sustainable modes
Shift to more
environmentally
sustainable modes
AVOID/REDUCE
The need to travel
Reduce or avoid the need
to travel
IMPROVE
technologies, standards…
Improve energy
efficiency of modes and
vehicles
Adapted from Dalkmann & Braningan, 2007

8 Integrated Massive Transport Systems (SITM) - BRTs • Capacity building • Capital cities and/or metropolitan areas with
more than 600.000 inhabitants • High demand / trunks and feeder routes. • 6 in operation: Cali, Bogotá, Soacha, Pereira,
Bucaramanga, Medellín, Barranquilla. • 1 under construction: Cartagena 1 in design phase Cúcuta. • 3 million passengers per day mobilized • About 20 million people live in these cities.
Nearly 8 million people benefit indirectly with the service.
• Public investment of $USD 6 Billion
Cartagena
Barranquilla
Cúcuta
Bucaramanga
Medellín
Pereira
Cali
Bogotá y
Soacha
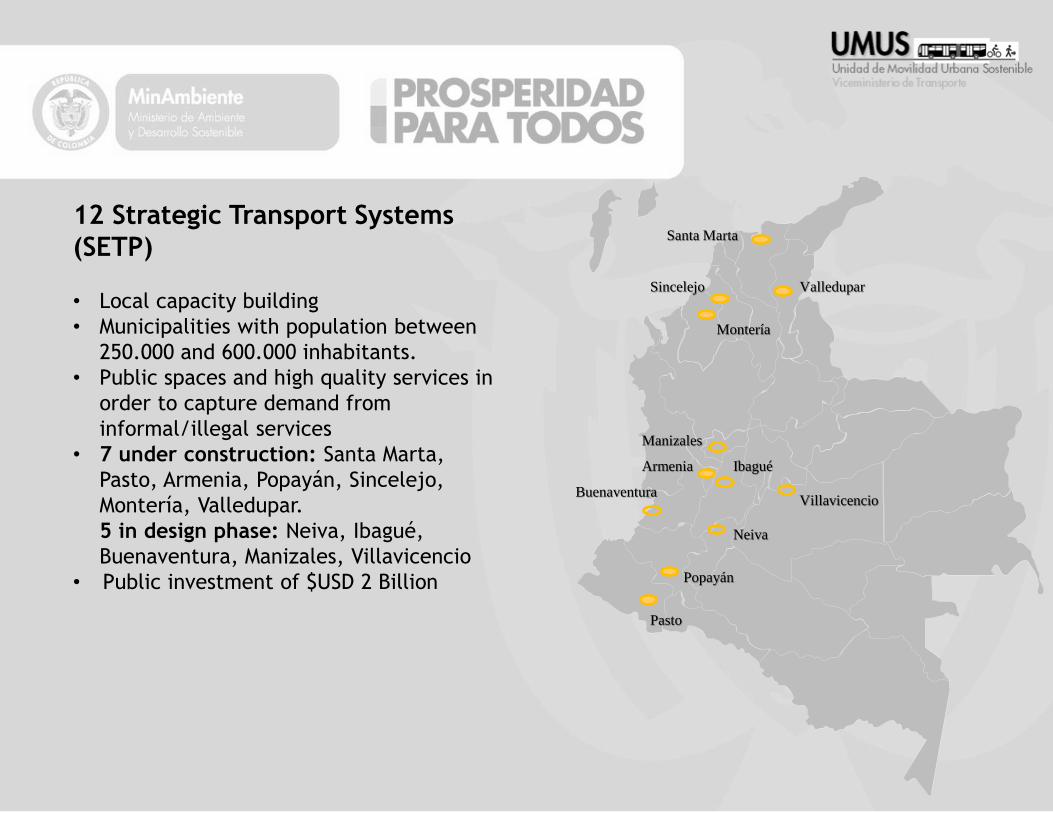
12 Strategic Transport Systems
(SETP)
• Local capacity building
• Municipalities with population between
250.000 and 600.000 inhabitants.
• Public spaces and high quality services in
order to capture demand from
informal/illegal services
• 7 under construction: Santa Marta,
Pasto, Armenia, Popayán, Sincelejo,
Montería, Valledupar.
5 in design phase: Neiva, Ibagué,
Buenaventura, Manizales, Villavicencio
• Public investment of $USD 2 Billion
Santa Marta
Valledupar Sincelejo
Montería
Buenaventura
Manizales
Armenia Ibagué
Villavicencio
Neiva
Popayán
Pasto

6
Overview MRP Objective(s) and Focus
MRP Development Process
Market Readiness Proposal 1. Policy Context and the Big Picture
2. MRP Target Areas: Assessment and Rationale
3. Core Technical and Institutional Readiness Components, including Regulatory Components
4. Planning for a Market-based Instrument
5. Organization, Communication, Consultation and Engagement
6. Schedule and Budget
General outline of Presentation

7
Overview
MRP Objectives and Focus
• The MRP presents Colombia’s draft request for funding to the PMR Assembly
– Focus on transport sector
– Selection of 3 instruments
– Opportunity to develop other “economy-wide” instruments

MRP Development Process
Activity 1 (Coordination)
Activity 2 (market readiness of transport), (support from Embarq)
June 2013 September 2013 December 2013 January 2013
Activities 3 /4 (market instruments in transport + definition of instruments), (support from Gruetter + South Pole)
Activity 5 (Carbon tax study)
= Workshops and consultations: government stakeholders, A2+A3 discussion, review of results, expert review
March 2014
expert review
Review of results with government
A2+ A3/A4 coordination
Government stakeholders (local, national) and experts
Sugerencia: Destacar que el consorcio consultor internacional, que preparo insumos para la propuesta, es indiscutiblemente lider a nivel global en asesoria de CC y Transporte. Destacar los diversos hitos de consulta con actores claves interesados.
10
Market Readiness Proposal

BB1: The Big Picture
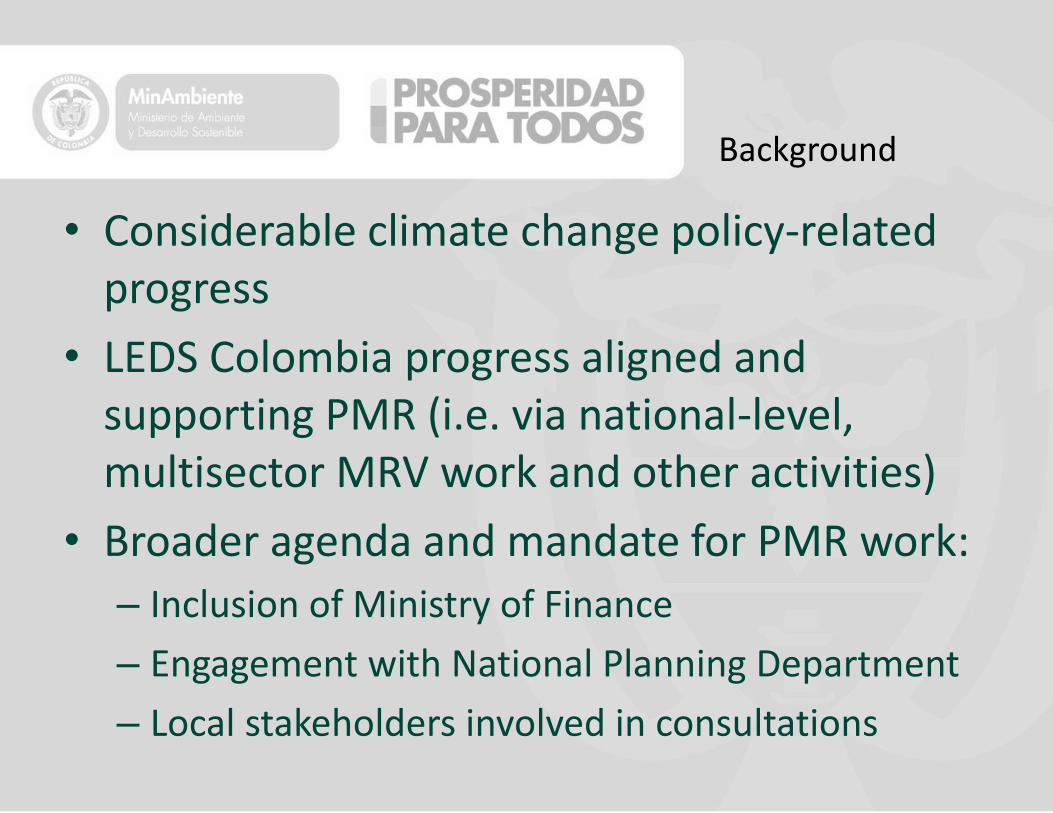
Background
• Considerable climate change policy-related progress
• LEDS Colombia progress aligned and supporting PMR (i.e. via national-level, multisector MRV work and other activities)
• Broader agenda and mandate for PMR work:
– Inclusion of Ministry of Finance
– Engagement with National Planning Department
– Local stakeholders involved in consultations
Sugerencia: Destacar que estos tres puntos son desarrollos importantes en el 2013, incluyendo desde la PA de Barcelona. Mira si el texto en rojo tiene sentido
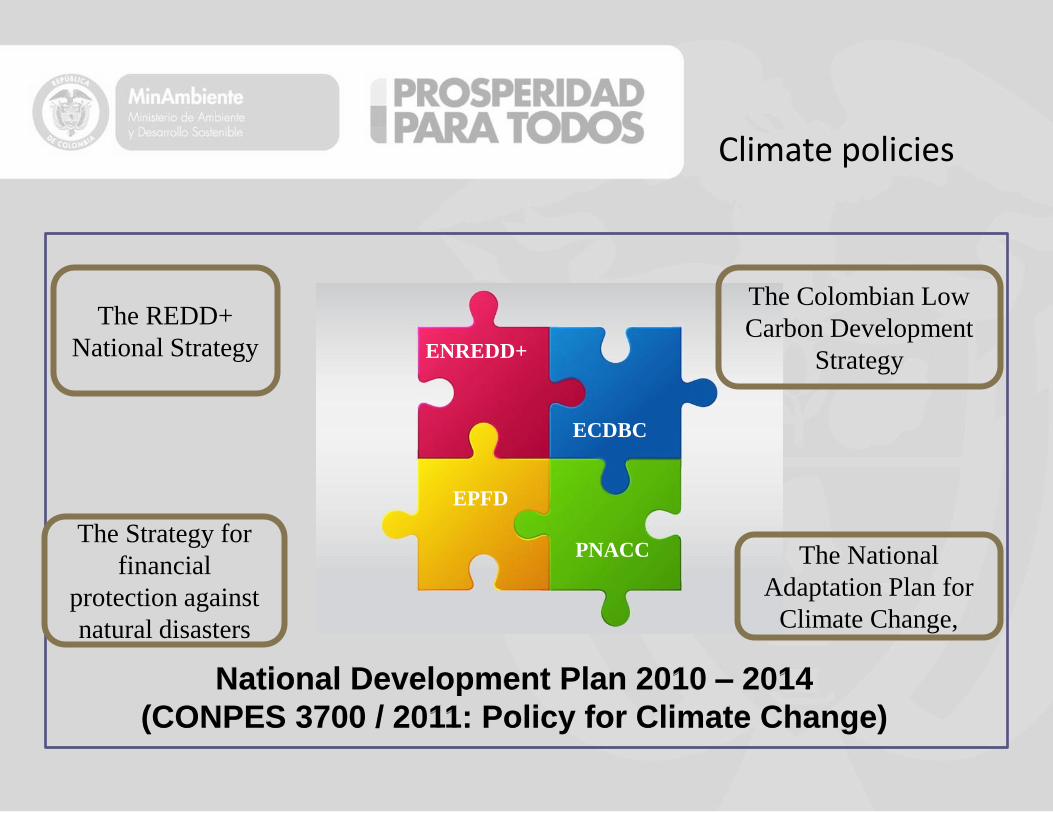
ENREDD+
ECDBC
EPFD
PNACC
National Development Plan 2010 – 2014
(CONPES 3700 / 2011: Policy for Climate Change)
The Colombian Low
Carbon Development
Strategy
The REDD+
National Strategy
The Strategy for
financial
protection against
natural disasters
The National
Adaptation Plan for
Climate Change,
Climate policies

Colombian Low Carbon Development Strategy (ECDBC) components

Institutional Arrangements
The Department of National Planning (DNP)
Ministry of Transport
Ministry of Mines and
Energy
Ministry of Commerce,
Industry and Tourism
Ministry of Agriculture and Rural
Development
Ministry of Housing, cities and territories
Ministries
leading their
SMAPs
construction
Ministry of Environment and Sustainable Development (MADS)
Climate Change
lead
(cross cutting
work)
Economic projections
(cross cutting work)
Sectors Transport
Mines and
Electricity Industry
Agricultur
e
Housing,
Waste
Sugerencia: Pasar rapidamente por estas laminas, resaltando como Transporte (y el apoyo de PMR) se inserta en esto, y que Colombia por supuesto que trabaja en los otros frentes sectoriales.
Transport
SMAP
SMAP of
Mines
SMAP of
Industry
SMAP of
Agriculture
SMAP of
Housing
SMAP of
Electricity
SMAP of
Waste
MinFinance

Agriculture 39%
Deforestation 14% Energy and mining
14%
Transport 12%
Industrial 12%
Waste 6%
Others 3%
NATIONAL EMISSIONS
2004 Total Emissions: 180M Ton CO2e
Road 90%
Aviation
Railroad
River
0.37%
5.5%
4.5%
Passenger 50%
Freight 50%
COLOMBIA
Population 46.36 million hab
Area 1,141,748 km2
Density 40.74 hab/km2

CO2 reference scenario emissions for transport sector
Source: LCDS Colombia
0
10
20
30
40
50
60
70
2010 2015 2020 2025 2030 2035 2040
CO
2
Em
issi
ons
(mil
lio
n T
on /
yea
r)
Other Modes
Urban freight
Interurban freight
Interurban Passengers
Urban Passengers
Taxi
Private - Motorcycles
Private - Light Duty
Sugerencia: Me parece muy apropiado sellar esta seccion con esta lamina. Mas allá de analizar los trends y números (que puede tomar mucho tiempo), el mensaje central creo que es que Colombia lo tiene estudiado de manera participativa, y que la propuesta MRP es coherente/apoya políticas y medidas definidas a partir de estos trends

Urban transport policies in Colombia
Sugerencia: Esta seccion es importante, pero ya se ha presentado y puede tomar mucho tiempo presentar las laminas. Quizas mantenerlas pero pasar rapidamente en la presentacion. O esconder unas dos o tres (aquellas con georeferencias?)
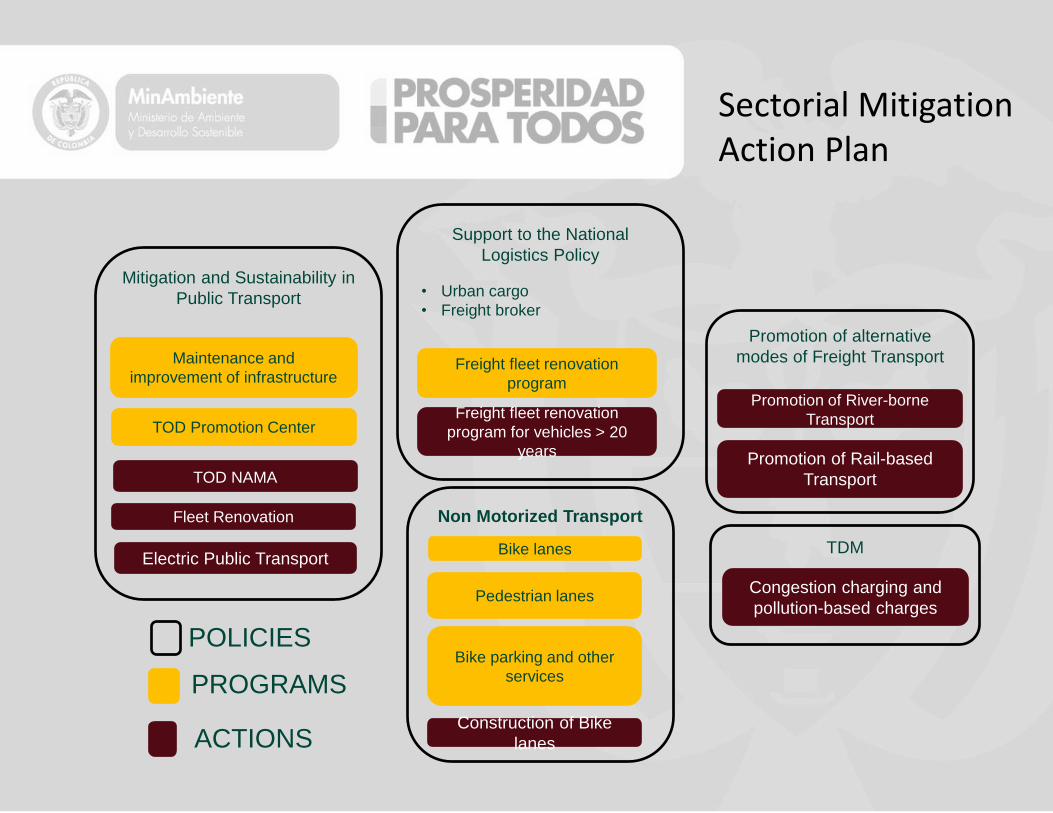
Non Motorized Transport
Bike lanes
Pedestrian lanes
Bike parking and other
services
Mitigation and Sustainability in
Public Transport
TOD Promotion Center
Fleet Renovation
TOD NAMA
Maintenance and
improvement of infrastructure
Construction of Bike
lanes
Promotion of alternative
modes of Freight Transport
Promotion of Rail-based
Transport
Promotion of River-borne
Transport
TDM Electric Public Transport
Support to the National
Logistics Policy
• Urban cargo
• Freight broker
Freight fleet renovation
program
Freight fleet renovation
program for vehicles > 20
years
POLICIES
PROGRAMS
ACTIONS
Congestion charging and
pollution-based charges
Sectorial Mitigation Action Plan
Sugerencia: Esta lamina sobre el SMAP Trasnporte es probablmente la mas importante en esta seccion. Considera detenerte unicamente en esta >>> para resaltar que el MRP apoya la implementacion del SMAP.

UMUS Viceministerio de
Transporte
+ ECDBC Dirección de Cambio
climático Sector plan of low carbon
transport
Sustainable Urban Mobility Unit LEDS Colombia
Dirección General de Política
Macroeconómica
4 Ministry-level entities integrated to development of PMR

BB2: Policy framework
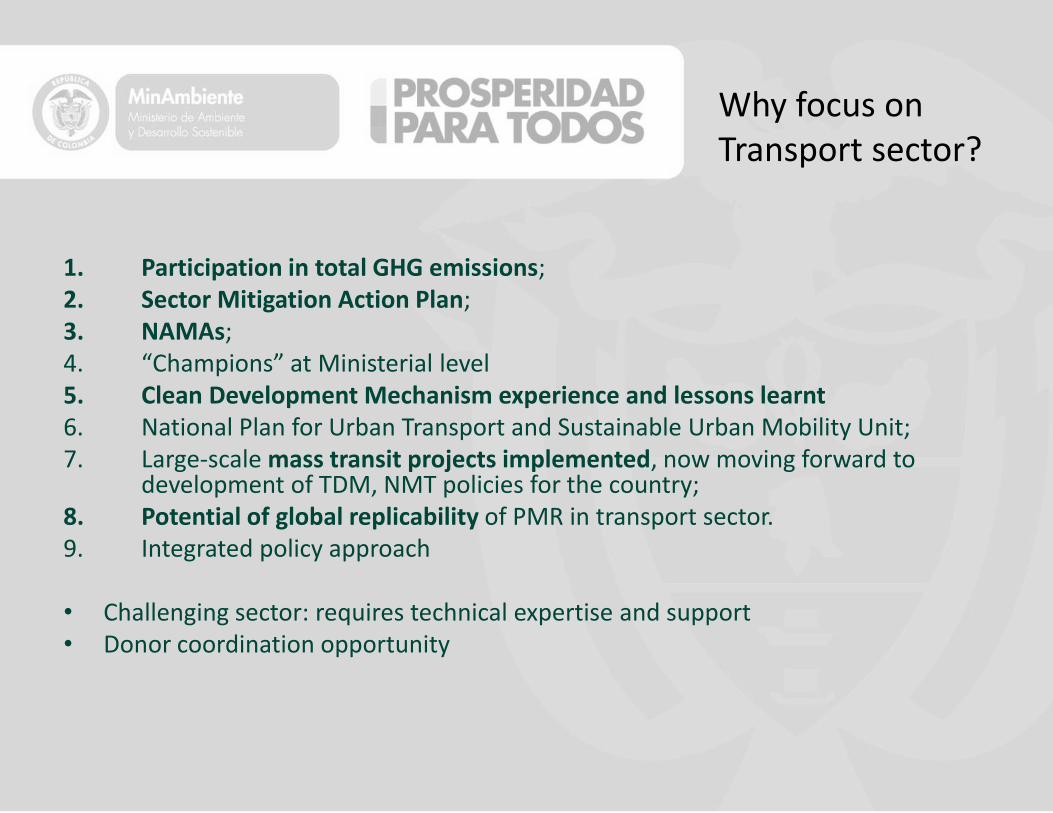
Why focus on Transport sector?
1. Participation in total GHG emissions; 2. Sector Mitigation Action Plan; 3. NAMAs; 4. “Champions” at Ministerial level 5. Clean Development Mechanism experience and lessons learnt 6. National Plan for Urban Transport and Sustainable Urban Mobility Unit; 7. Large-scale mass transit projects implemented, now moving forward to
development of TDM, NMT policies for the country; 8. Potential of global replicability of PMR in transport sector. 9. Integrated policy approach
• Challenging sector: requires technical expertise and support • Donor coordination opportunity
For each target area identified in the MRP,
include the following elements, as
appropriate. Country may wish to have a slide
for each target area, highlighting:
•Rationale for selection of given Target Area; and
•Key relevant information to indicate relevance of Target area, particular circumstances and role of a market instrument (Country may highlight suitability for market readiness activities and market instrument)

Criteria to evaluate instruments
• Mitigation/GHG reduction potential (environmental effectiveness)
• Cost-effectiveness (economic effectiveness) • Implementation cost • Technical feasibility • Political / legal / regulatory viability • Financial feasibility (barriers to public and private finance) • Policy Alignment • Co-benefits for Sustainable Development (SD)
Sugerencia: Considera eliminar esta lamina y evitar entrar en esta discusion. Sugiero ir directamente a la presentacion de los tres instrumentos identificados.
BB3: Core Technical and Institutional/Regulatory Market Readiness Components
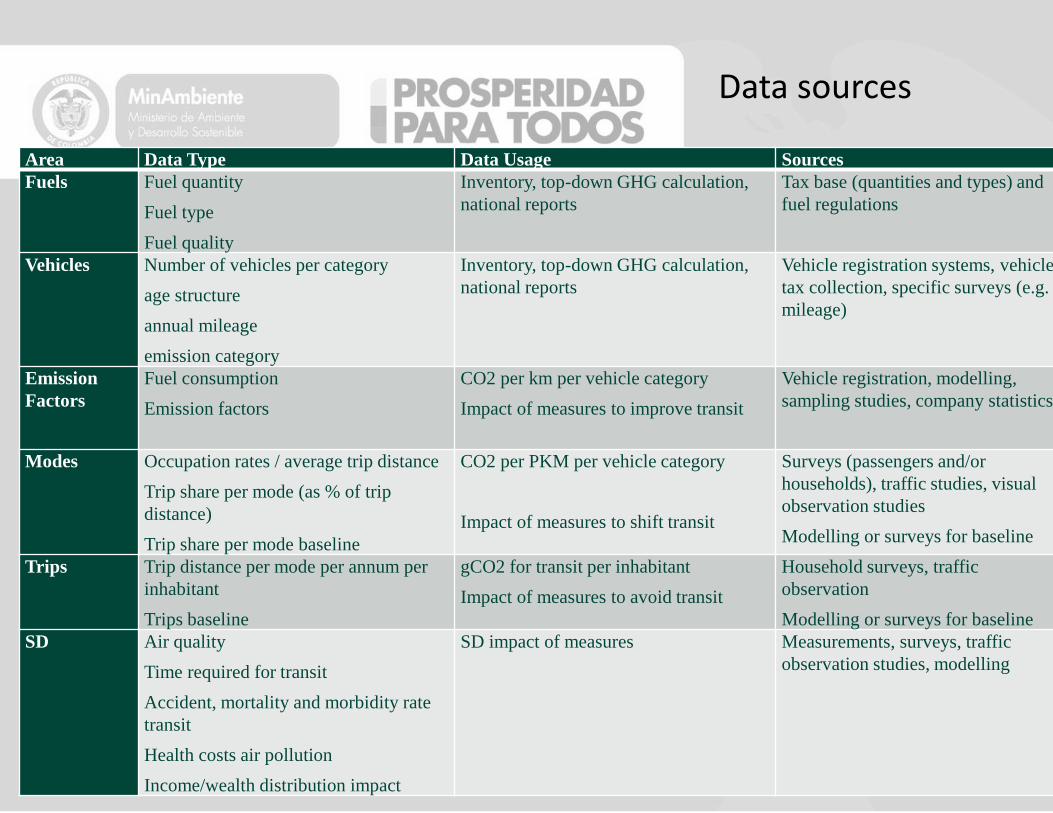
Data sources
Area Data Type Data Usage Sources Fuels Fuel quantity
Fuel type
Fuel quality
Inventory, top-down GHG calculation,
national reports Tax base (quantities and types) and
fuel regulations
Vehicles Number of vehicles per category
age structure
annual mileage
emission category
Inventory, top-down GHG calculation,
national reports Vehicle registration systems, vehicle
tax collection, specific surveys (e.g.
mileage)
Emission
Factors Fuel consumption
Emission factors
CO2 per km per vehicle category
Impact of measures to improve transit
Vehicle registration, modelling,
sampling studies, company statistics
Modes Occupation rates / average trip distance
Trip share per mode (as % of trip
distance)
Trip share per mode baseline
CO2 per PKM per vehicle category
Impact of measures to shift transit
Surveys (passengers and/or
households), traffic studies, visual
observation studies
Modelling or surveys for baseline
Trips Trip distance per mode per annum per
inhabitant
Trips baseline
gCO2 for transit per inhabitant
Impact of measures to avoid transit
Household surveys, traffic
observation
Modelling or surveys for baseline SD Air quality
Time required for transit
Accident, mortality and morbidity rate
transit
Health costs air pollution
Income/wealth distribution impact
SD impact of measures Measurements, surveys, traffic
observation studies, modelling
Sugerencia: Se presenta esta matriz para mapear la información que se requiere generar para la operación de instrunmentos economicos en el sector? Se sugiere que el sistema MRV sectorial que se arme (con apoyo PMR?) va a cubrir – en ultima instancia – estas necesidades de generacion de data y MRV?
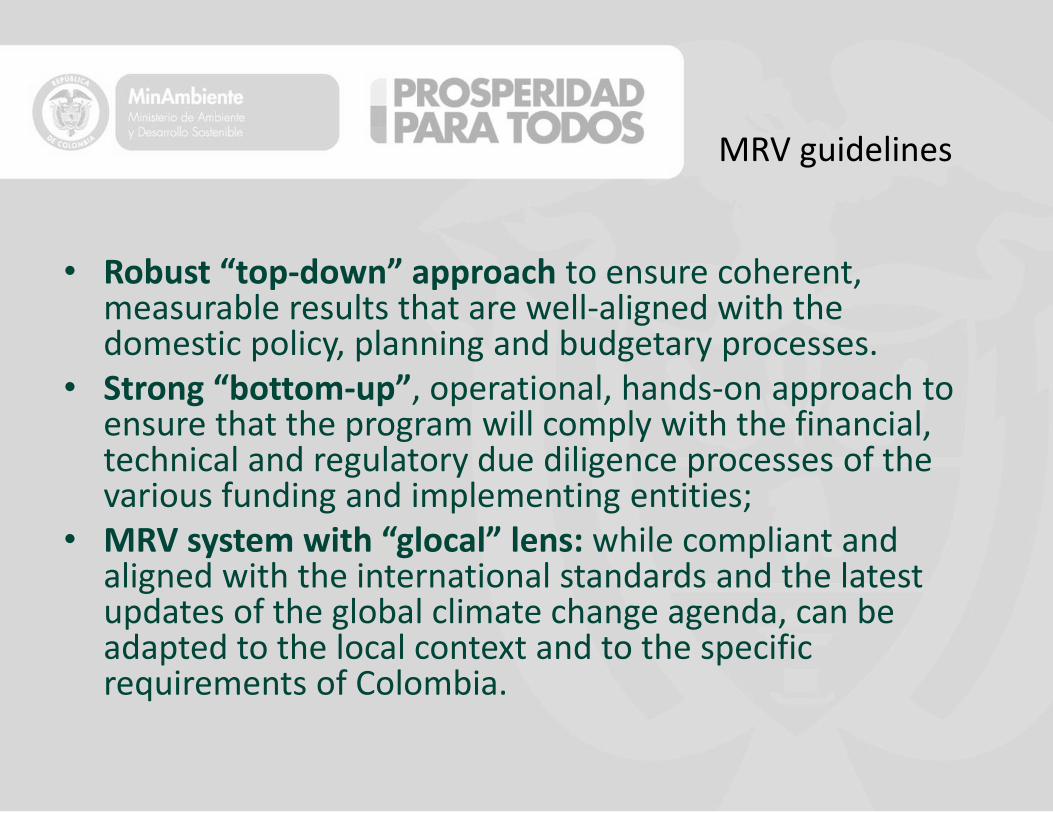
MRV guidelines
• Robust “top-down” approach to ensure coherent, measurable results that are well-aligned with the domestic policy, planning and budgetary processes.
• Strong “bottom-up”, operational, hands-on approach to ensure that the program will comply with the financial, technical and regulatory due diligence processes of the various funding and implementing entities;
• MRV system with “glocal” lens: while compliant and aligned with the international standards and the latest updates of the global climate change agenda, can be adapted to the local context and to the specific requirements of Colombia.

Regulatory framework of transport

Proposed institutional setup for PMR implementation
NAMA Entity & Domestic Offset Administrator
UMUS
Program / NAMA Participant 1
Municipality
Program / NAMA Participant 2
Private Transport Company
Program / NAMA Participant 3
Transport PPP
Second-Level
Verificator
ICONTEC/Expert Panel
Fiduciary & Fund Financial Manager
FINDETER or other
Management Board Inter-Ministerial
Committee
MinTrans
UMUS
MinHac
CONFIS
MADS
DCC
DNP
DIES
Liaison to
UNFCCC
DCC
BB4: Planning for market-based Instruments in Colombia’s transport sector

Chosen instruments
• (i) Credited NAMAs in the urban transport sector;
• (ii) Domestic offset scheme
• (iii) Assessing the introduction of a performance standard for vehicles combined with allowances

1. Scaled-Up GHG Crediting Instrument for Transport NAMAs
• NAMAs developed following a standardized and structured step-wise development methodology. Proposed:
– urban transport NAMA,
– NMT/TOD NAMA (NMT+)
– vehicle performance standard NAMA

Existing transport NAMAs in Colombia
Action Stage Sector Sub-sector Objective Improvement of
road-based freight
sector
Proposal/Planning Transport Road vehicles
cargo Accelerate the renovation of the cargo vehicle fleet
with the aim to improve economic competitiveness
and environmental performance of the freight
transport sector Electric vehicles
NAMA Concept Transport road vehicles
cargo and
passenger
Substitute conventional vehicles with electric
vehicles. The penetration of electric vehicles
should reach 20% for the passenger sector, 30%
for taxi fleets and 30% for urban freight. Transit-oriented
development Concept Transport Passenger
transport Integrate climate change mitigation variables into
local land-use plans and urban planning. Supported
by NAMA Facility. Non-Motorized
Transport idea Transport NMT No specifics yet
Urban Transport idea Transport Passenger
transport No specifics yet
Demonstration and
assessment of
battery-electric
vehicles for mass
transit in Colombia
Pilot studies (being
analyzed with GEF
cooperation)
Transport Passenger
transport Promote battery-electric, large-capacity vehicles
for mass transit in Colombia by means of
removing technology, regulatory, awareness and
financial barriers, as a measure to reduce GHG
emissions and improve local air-quality Low-carbon and
Efficient National
Freight Logistics
Initiative
Pilot studies (being
analyzed with GEF
cooperation)
Transport Freight
transport To reduce GHG and criteria pollutants emissions
from freight transportation operations in Colombia
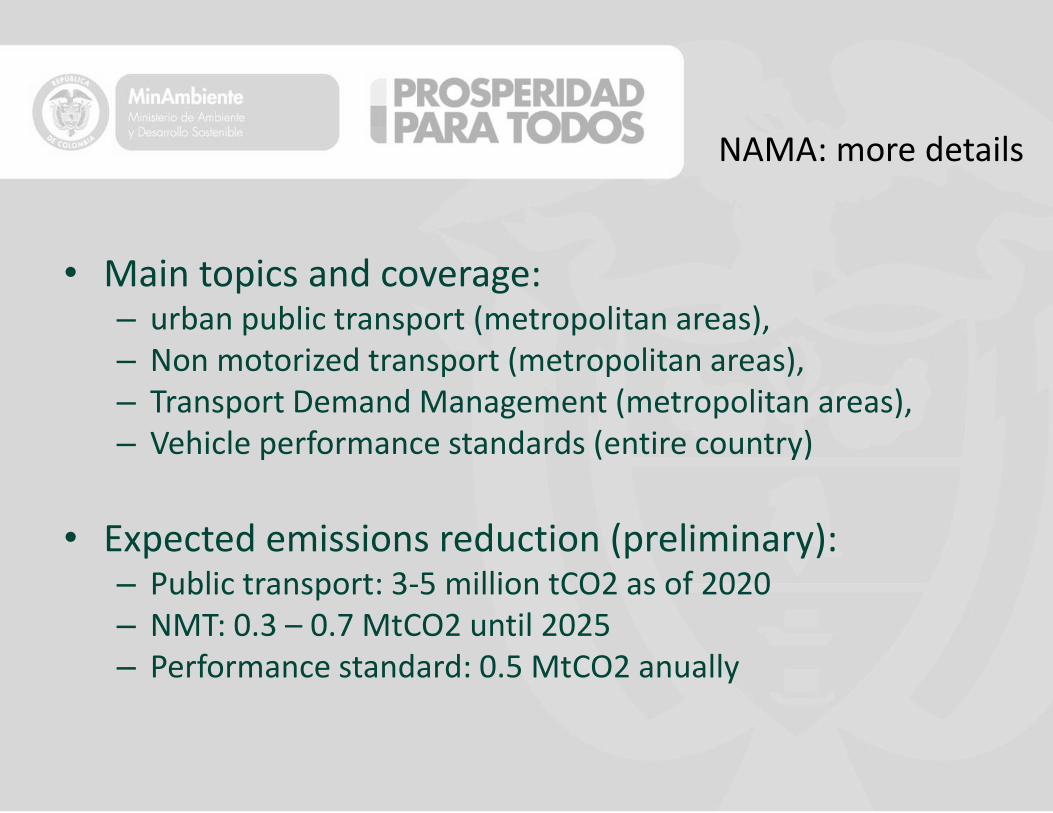
NAMA: more details
• Main topics and coverage: – urban public transport (metropolitan areas), – Non motorized transport (metropolitan areas), – Transport Demand Management (metropolitan areas), – Vehicle performance standards (entire country)
• Expected emissions reduction (preliminary):
– Public transport: 3-5 million tCO2 as of 2020 – NMT: 0.3 – 0.7 MtCO2 until 2025 – Performance standard: 0.5 MtCO2 anually

2. Domestic Offset Instrument for Transport
• National compensation fund for domestic transport offsets.
• Compensation fund financed from a carbon tax on transport fuels
• Funds used to finance domestic reduction projects in the transport sector.
• Carbon tax would partially replace the fuel surplus tax (see graph)
75 75
25 24.5
0.5
0
20
40
60
80
100
120
Existing fuel
price
composition
Proposed fuel
price
composition
carbon tax
Surcharge
Regular cost
Indicative
exercise with
1 USD / liter
consumer
price (w/ 0.5
cent carbon
tax/levy)
Sugerencia: Me parece importante presentar un poco mas sobre el concepto del domestic offset scheme, financiado a partir de una revision del transport (carbon) levy ya existente. Esto me parece importante.
Sugerencia: En una 2da lamina, se podria incluir el ejercicio de Grutter sobre el impacto de este instrumento, en cuanto a con un levy bajo, cuantos ‘offsets’ se podria comprar a proyectos nacoinales (ver tabla que incluyo en su informe).
2012
gasoline
price:
128 c/ l


Carbon Tax, Compensation Fund and Domestic Offset Price
Tax per
liter of fuel
(USD
cents)
Equivalent
Carbon Tax
(USD per
tCO2)
Annual Income
Compensation
Fund (million
USD)
Offset price with
10% ER
transport (USD
per tCO2)
Offset price with
25% ER
transport
(USD per tCO2)
0.5 2 40 20 8
1 4 80 40 16
2 8 160 80 32
3 12 240 120 48
4 16 320 160 64
5 20 400 200 80
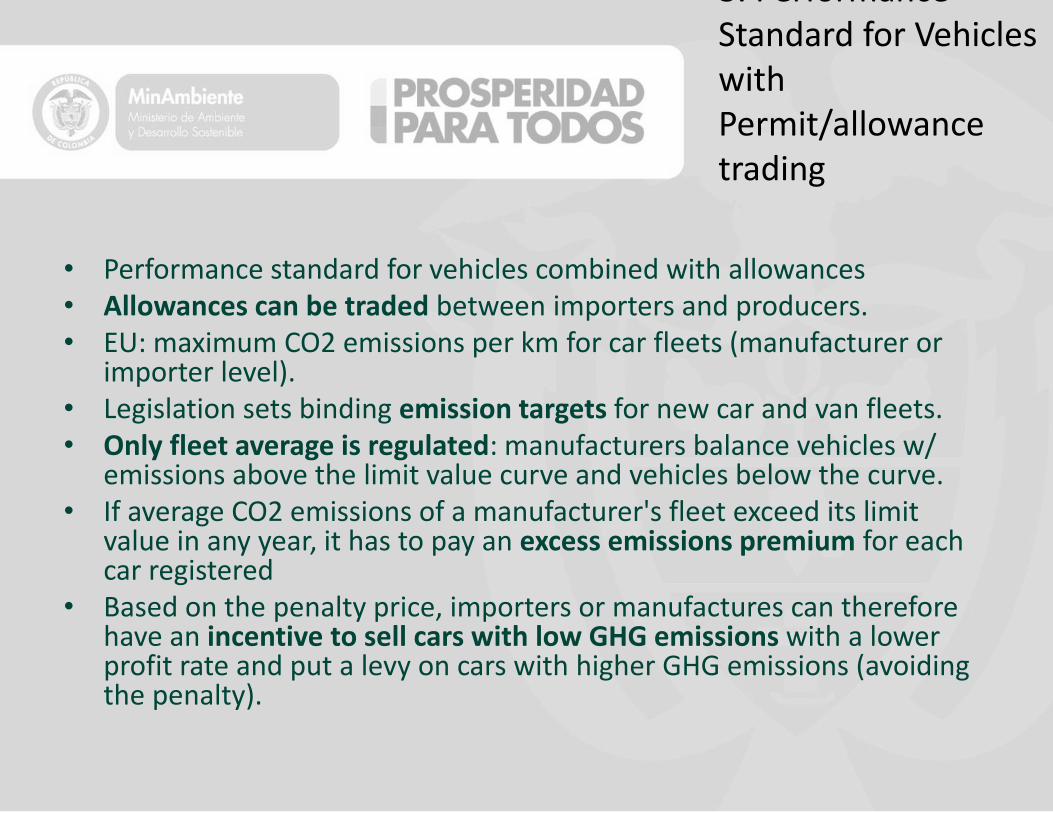
3. Performance Standard for Vehicles with Permit/allowance trading
• Performance standard for vehicles combined with allowances • Allowances can be traded between importers and producers. • EU: maximum CO2 emissions per km for car fleets (manufacturer or
importer level). • Legislation sets binding emission targets for new car and van fleets. • Only fleet average is regulated: manufacturers balance vehicles w/
emissions above the limit value curve and vehicles below the curve. • If average CO2 emissions of a manufacturer's fleet exceed its limit
value in any year, it has to pay an excess emissions premium for each car registered
• Based on the penalty price, importers or manufactures can therefore have an incentive to sell cars with low GHG emissions with a lower profit rate and put a levy on cars with higher GHG emissions (avoiding the penalty).
Sugerencia: Siilar a mi sugerencia para el instrumento 2, domestic offset instrument. En este caso, quizas aun puedes complementar con un grafico/esquema. Y/o, si se resalta el impacto potencial del performance standard (datos de Grutter)

An example scenario
146.67
177.50
125.00
0
50
100
150
200
250
300
Car A1 Car A2 Car A3 Fleet
Average
Car B1 Car B2 Car B3 Car B4 Fleet
Average
Car C1 Car C2 Car C3 Fleet
Average
Importer A Importer B Importer C
Example: Vehicle emissions (grCO2/km)
150 grCO2
max
trading
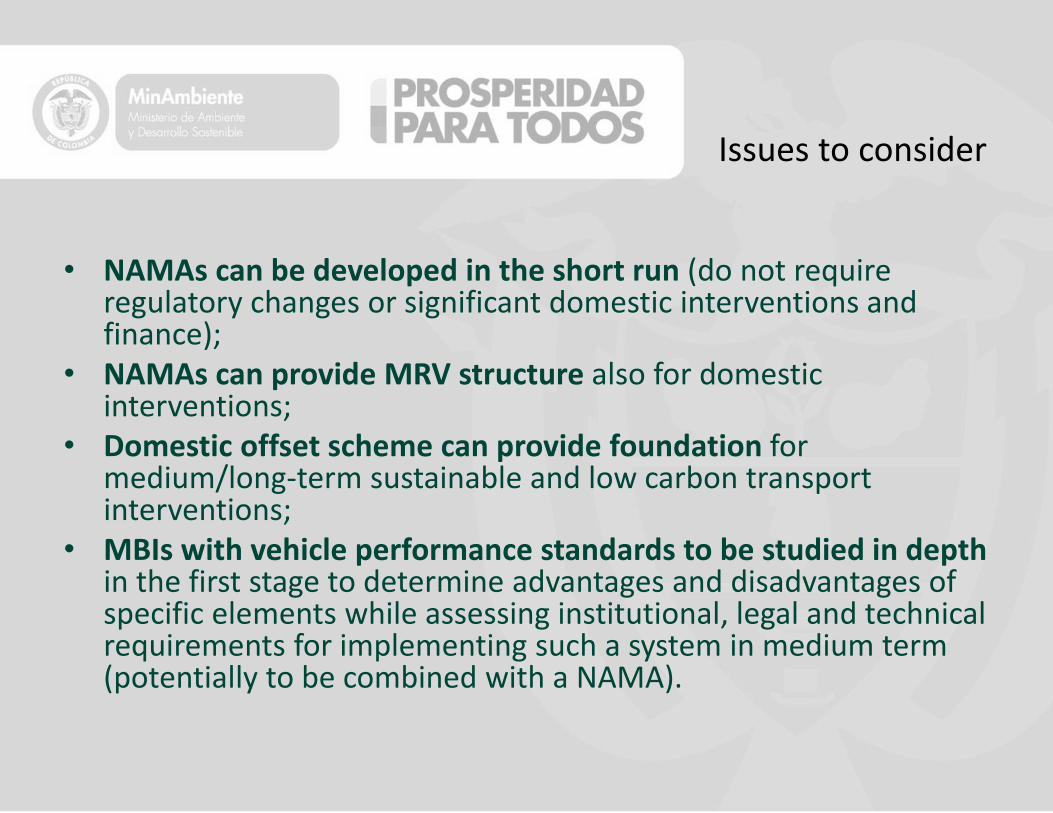
Issues to consider
• NAMAs can be developed in the short run (do not require regulatory changes or significant domestic interventions and finance);
• NAMAs can provide MRV structure also for domestic interventions;
• Domestic offset scheme can provide foundation for medium/long-term sustainable and low carbon transport interventions;
• MBIs with vehicle performance standards to be studied in depth in the first stage to determine advantages and disadvantages of specific elements while assessing institutional, legal and technical requirements for implementing such a system in medium term (potentially to be combined with a NAMA).

Implementation phases
• Phase I (short-term, 2014-2016) – PMR implementation phase: – NAMA Development steps (Design completed and piloted on priority cities) – Preparatory work for the domestic offset scheme (assessing feasibility of an
upstream carbon tax in the mid-term and testing its applicability) – Creating enabling political and institutional environment – Increasing country’s know-how and MRV preparedness – Institutional and regulatory reforms – Performance standard is designed.
• Phase II (mid-term, 2016-2020) – post – PMR implementation: – Domestic offset scheme launched into a full-fledged operational scheme – NAMA will undergo a phased implementation transition period (up to 2020) to be
fully operational in the long term (by 2020). – Performance standard is implemented.

BB5: Organization, Communication, Consultation and Engagement
Key agencies
Main agencies involved • Ministry of Environment and Sustainable Development (MADS) • Ministry of Transportation • Ministry of Finance • National Planning Department Others identified as relevant agencies: • Ministry of Mines and Energy • Ministry of Industry, Commerce and Tourism • Ministry of International Commerce
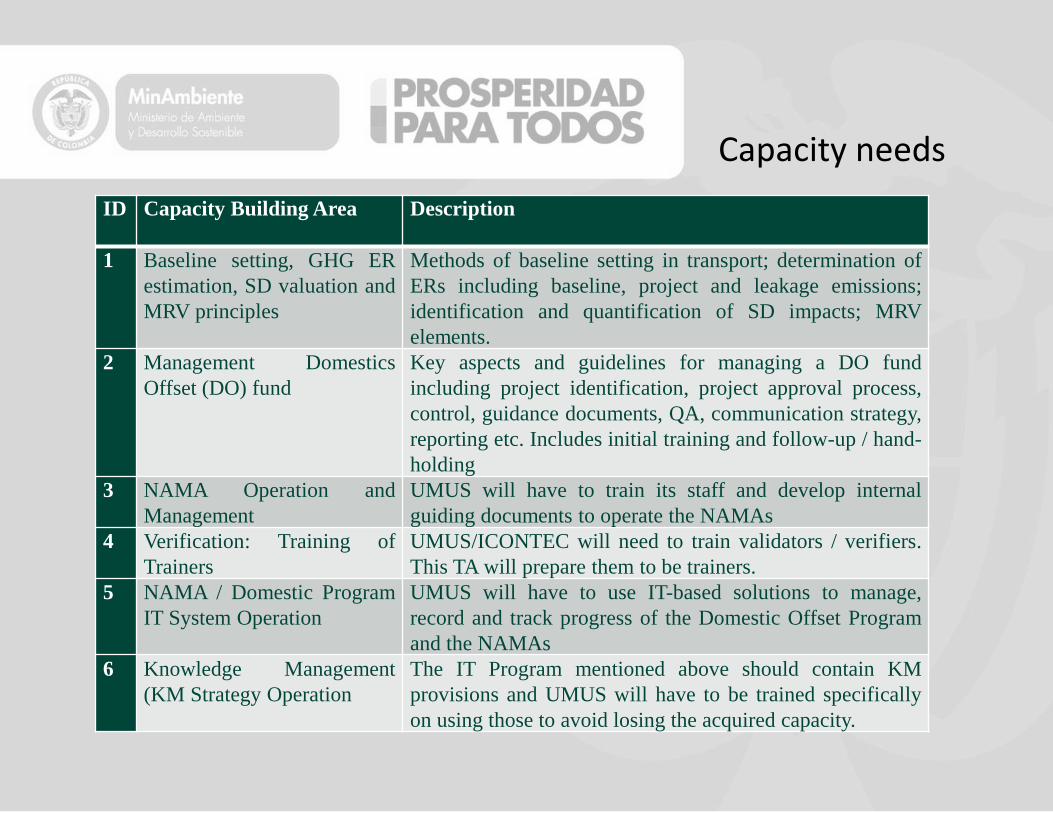
Capacity needs
ID Capacity Building Area Description
1 Baseline setting, GHG ER
estimation, SD valuation and
MRV principles
Methods of baseline setting in transport; determination of
ERs including baseline, project and leakage emissions;
identification and quantification of SD impacts; MRV
elements. 2 Management Domestics
Offset (DO) fund Key aspects and guidelines for managing a DO fund
including project identification, project approval process,
control, guidance documents, QA, communication strategy,
reporting etc. Includes initial training and follow-up / hand-
holding 3 NAMA Operation and
Management UMUS will have to train its staff and develop internal
guiding documents to operate the NAMAs 4 Verification: Training of
Trainers UMUS/ICONTEC will need to train validators / verifiers.
This TA will prepare them to be trainers. 5 NAMA / Domestic Program
IT System Operation UMUS will have to use IT-based solutions to manage,
record and track progress of the Domestic Offset Program
and the NAMAs 6 Knowledge Management
(KM Strategy Operation The IT Program mentioned above should contain KM
provisions and UMUS will have to be trained specifically
on using those to avoid losing the acquired capacity.

Other stakeholders
– Sub-national governmental agencies
– Private sector stakeholders (car, oil industry, operators, importers)
– Civil society and academia stakeholders (Main universities, Civil society organizations)
– International stakeholders (development banks, UN Agencies, bilateral aid, international NGOs)

Awareness raising
Communications strategy (improve understanding of market mechanisms). Includes: • Definition of key target groups for the communications strategy • Development of main messages depending on target group • Development of survey(s) to review overall progress of PMR implementation and
perception • Implementation of communications strategy and survey(s). Public information campaign to increase public support for price increases. Includes messages: • Encourage more efficient energy consumption and reduce the impact of future
international price increases. • Fscal reform will contribute to fiscal sustainability and economic growth, and
thus poverty reduction. • Higher income groups benefit the most from no-taxation of carbon emission. • Importance of environmental tax revenues in financing priority public
expenditures • Inform of use of revenues and evolution of mobility pattern

Consultation plans
• Initial (kick-off) workshop
• Follow-up yearly workshops
• Topic- specific workshops
• Final workshop

BB6: Summary of Activities, Timeline and Budget
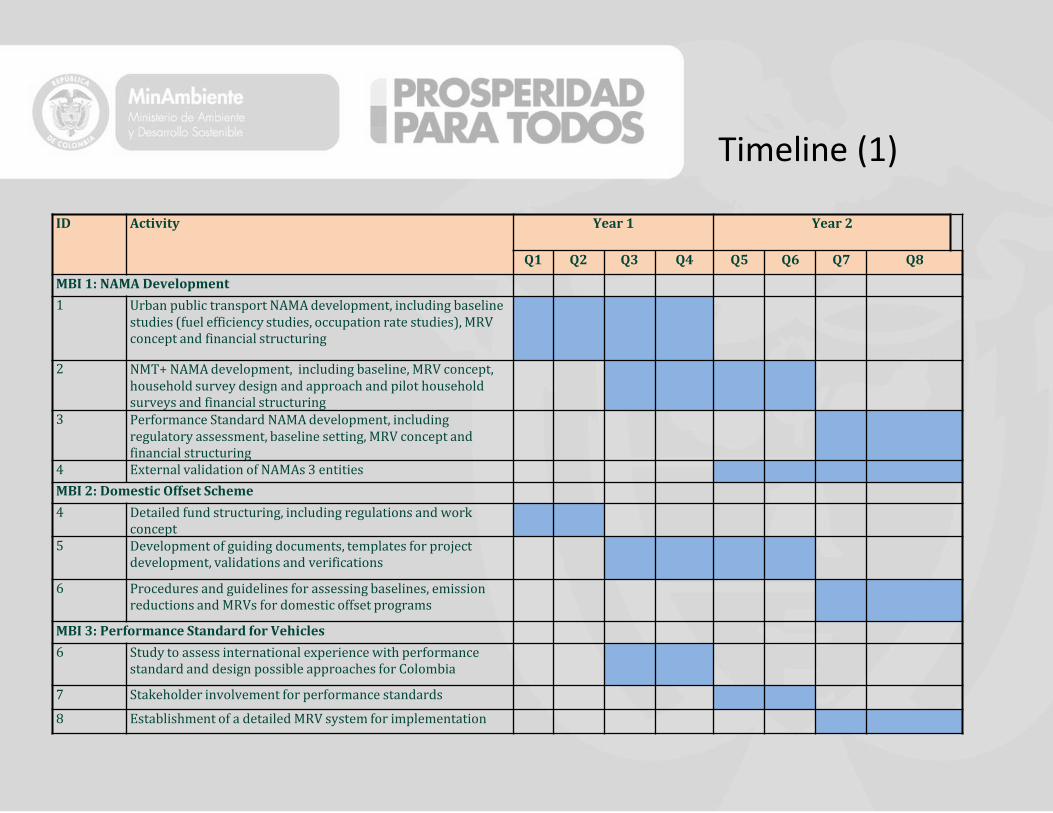
Timeline (1)
ID Activity Year 1 Year 2
Q1 Q2 Q3 Q4 Q5 Q6 Q7 Q8
MBI 1: NAMA Development
1 Urban public transport NAMA development, including baseline studies (fuel efficiency studies, occupation rate studies), MRV concept and financial structuring
2 NMT+ NAMA development, including baseline, MRV concept, household survey design and approach and pilot household surveys and financial structuring
3 Performance Standard NAMA development, including regulatory assessment, baseline setting, MRV concept and financial structuring
4 External validation of NAMAs 3 entities
MBI 2: Domestic Offset Scheme
4 Detailed fund structuring, including regulations and work concept
5 Development of guiding documents, templates for project development, validations and verifications
6 Procedures and guidelines for assessing baselines, emission reductions and MRVs for domestic offset programs
MBI 3: Performance Standard for Vehicles
6 Study to assess international experience with performance standard and design possible approaches for Colombia
7 Stakeholder involvement for performance standards
8 Establishment of a detailed MRV system for implementation
Sugerencia: Esta y las siguientes laminas con matrices sugiero mantenerlas ‘for completeness’ y para dar el mensaje que se lo tiene estudiado/programado. Mas, entiendo que no te tomaras tu tiempo en revisarlas y presentarlas, no? Sugiero simplemente saltarlas al momento de llegar aca.
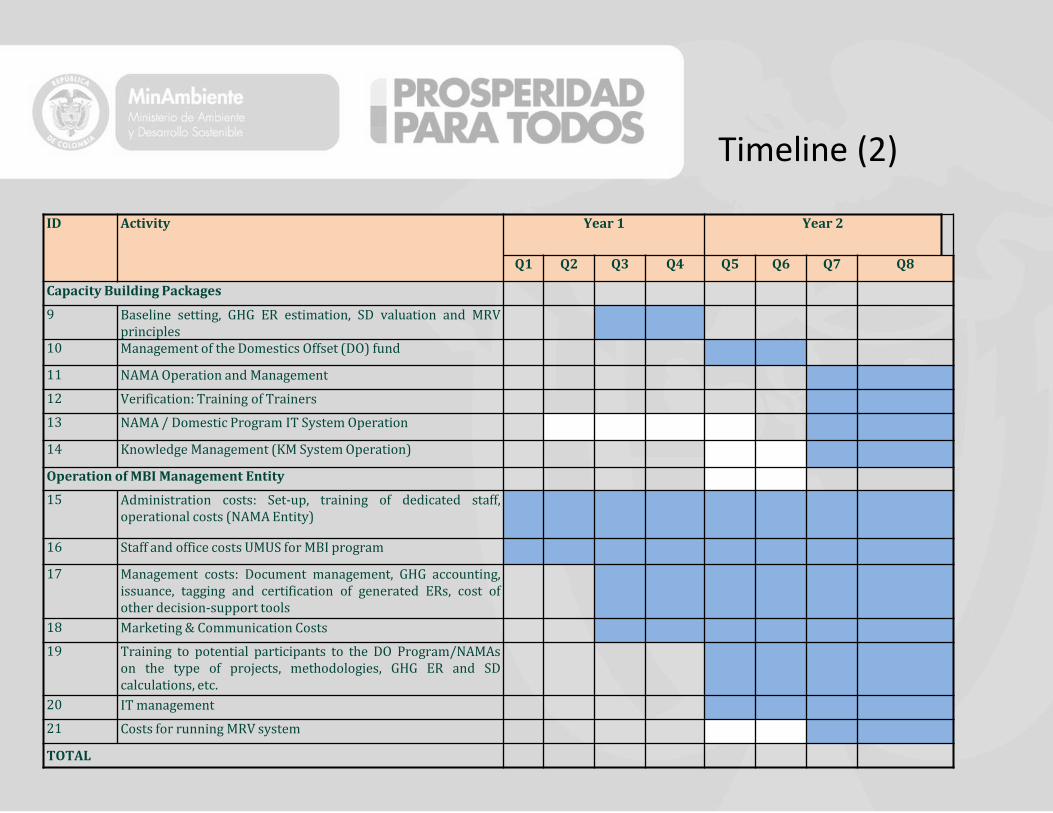
Timeline (2)
ID Activity Year 1 Year 2
Q1 Q2 Q3 Q4 Q5 Q6 Q7 Q8
Capacity Building Packages
9 Baseline setting, GHG ER estimation, SD valuation and MRV principles
10 Management of the Domestics Offset (DO) fund
11 NAMA Operation and Management
12 Verification: Training of Trainers
13 NAMA / Domestic Program IT System Operation
14 Knowledge Management (KM System Operation)
Operation of MBI Management Entity
15 Administration costs: Set-up, training of dedicated staff, operational costs (NAMA Entity)
16 Staff and office costs UMUS for MBI program
17 Management costs: Document management, GHG accounting, issuance, tagging and certification of generated ERs, cost of other decision-support tools
18 Marketing & Communication Costs
19 Training to potential participants to the DO Program/NAMAs on the type of projects, methodologies, GHG ER and SD calculations, etc.
20 IT management
21 Costs for running MRV system
TOTAL

MRV timeline
ID Activity Year 1 Year 2 Q1 Q2 Q3 Q4 Q5 Q6 Q7 Q8
Baseline Determination 1 Occupation rate studies 2 Fuel efficiency studies 3 Overall baseline urban transport 4 Household survey design and approach 5 Household surveys (pilots) 6 Overall baseline NMT+ Monitoring 7 MRV detailed approach urban transport 8 MRV detailed approach NMT+ 9 Passenger surveys year 1 (4 cities) 10 Household surveys year 1 (4 cities) 11 Monitoring report urban transport year 1 12 Monitoring report NMT+ year 1 Verification 13 Detailed system design incl. procedures and
templates
14 Capacity building verifiers 15 Capacity building registry 16 Cost validations international (2 units)

BB5 activities timeline
ID Activity Year 1 Year 2
Q1 Q2 Q3 Q4 Q5 Q6 Q7 Q8
1 Communications strategy
2 Consultation mechanisms
3 Capacity building and knowledge management
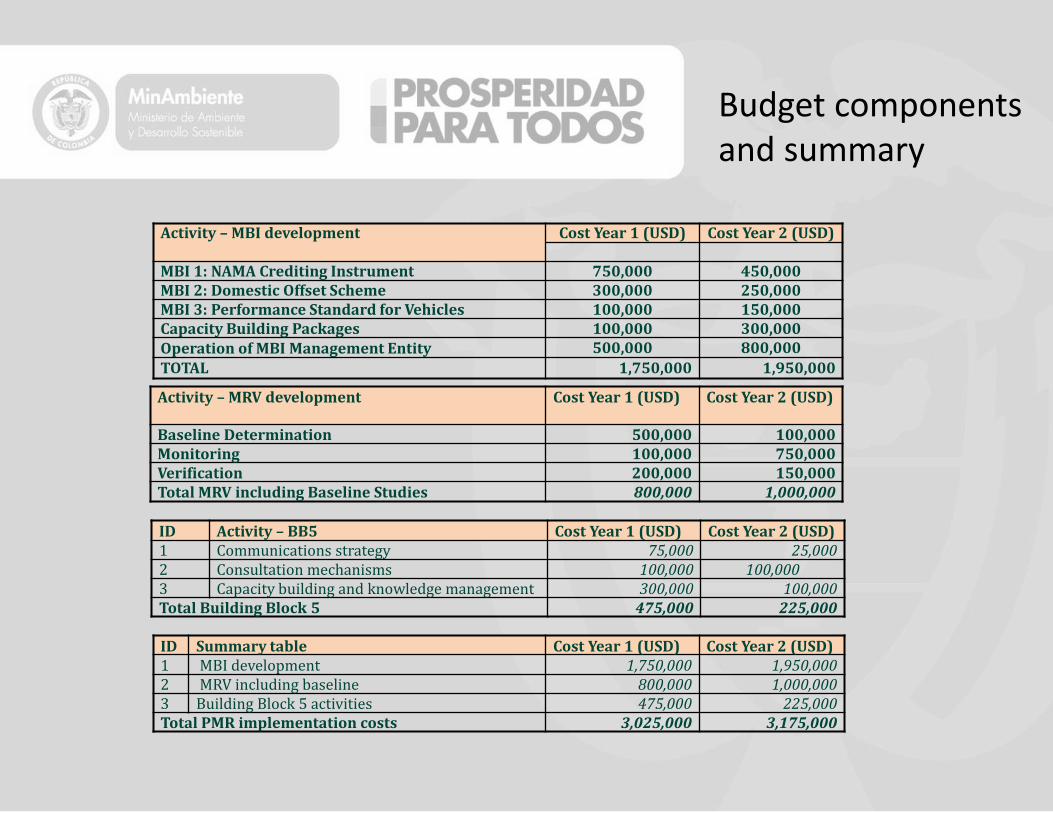
Budget components and summary
Activity – MBI development Cost Year 1 (USD) Cost Year 2 (USD)
MBI 1: NAMA Crediting Instrument 750,000 450,000 MBI 2: Domestic Offset Scheme 300,000 250,000 MBI 3: Performance Standard for Vehicles 100,000 150,000 Capacity Building Packages 100,000 300,000 Operation of MBI Management Entity 500,000 800,000
TOTAL 1,750,000 1,950,000
Activity – MRV development Cost Year 1 (USD) Cost Year 2 (USD)
Baseline Determination 500,000 100,000 Monitoring 100,000 750,000 Verification 200,000 150,000 Total MRV including Baseline Studies 800,000 1,000,000
ID Activity – BB5 Cost Year 1 (USD) Cost Year 2 (USD) 1 Communications strategy 75,000 25,000 2 Consultation mechanisms 100,000 100,000 3 Capacity building and knowledge management 300,000 100,000 Total Building Block 5 475,000 225,000
ID Summary table Cost Year 1 (USD) Cost Year 2 (USD) 1 MBI development 1,750,000 1,950,000 2 MRV including baseline 800,000 1,000,000 3 Building Block 5 activities 475,000 225,000 Total PMR implementation costs 3,025,000 3,175,000

Thank you.
Claudia Díaz – MinTransporte Nathaly Torregroza – MADS Luis Fernando Mejía [email protected] [email protected] [email protected]
Carlosfelipe Pardo – PMR Coordinator
Top Related