


Languages
Pages
Legal

PNNL-23950
Prepared for the U.S. Army Corps of Engineers, Seattle District, under an Interagency Agreement with the U.S. Department of Energy Contract DE-AC05-76RL01830
Study Plan Alternatives to Evaluate Fish Entrainment at Albeni Falls Dam Final Report BJ Bellgraph RA Harnish DE Holecek MA Weiland FA Goetz JA Vazquez JS Hughes ED Green 6 February 2015
PNNL-23950
Study Plan Alternatives to Evaluate Fish Entrainment at Albeni Falls Dam Final Report BJ Bellgraph RA Harnish DE Holecek1 MA Weiland
FA Goetz2 JA Vazquez
JS Hughes ED Green 6 February 2015 Prepared for the U.S. Army Corps of Engineers, Portland District, under an Interagency Agreement with the U.S. Department of Energy Contract DE-AC05-76RL01830 Pacific Northwest National Laboratory Richland, Washington 99352
1 U.S. Army Corps of Engineers, Walla Walla, Washington 2 U.S. Army Corps of Engineers, Seattle, Washington
Final Report
iii
Executive Summary
Albeni Falls Dam (AFD) on the Pend Oreille River in northern Idaho is located within an important migration route for fish passing between the upstream lentic habitats of Lake Pend Oreille and downstream lotic habitats of the Pend Oreille River and its tributaries. However, because of its presence as an upstream migration barrier, the potential effects of the dam on downstream migrating fish, and consequent to stipulations by the U.S. Endangered Species Act (ESA), 2000 Biological Opinion (BiOp, USFWS 2000), and a 10-year Memorandum of Understanding with the Kalispel Tribe of Indians (KTI), the U.S. Army Corps of Engineers (USACE) Seattle District (NWS) is working to develop a study plan to monitor both volitional and non-volitional fish entrainment through the turbines and spillway of AFD in conjunction with the Bonneville Power Administration (BPA), KTI, the USACE Walla Walla District (NWW), and the Pacific Northwest National Laboratory (PNNL).
The purpose of this study plan, and the implementation of a fish entrainment study, is to meet several stewardship goals of the USACE, assist with future management of natural resources at AFD, and potentially improve operations at AFD to minimize impacts to fish. The USACE has a stewardship policy that outlines the guidelines for management, protection, compliance, and restoration practices where baseline information is essential to track resource management practices. Specifically, the “Special Status Species” section of the USACE stewardship policy states that both species and their critical habitats that occur within water resource development projects shall be protected and/or conserved in accordance with the ESA, as amended, and with existing state statues. Bull trout are currently the only ESA species impacted by AFD and thus, are of critical importance to stewardship by the USACE; however, westslope cutthroat trout and kokanee salmon also have special conservation status as part of the Idaho Department of Fish and Game’s Natural Heritage Program.
Additionally, the USFWS BiOp requires that the USACE conduct a feasibility study for reestablishment of two-way passage of adult and subadult bull trout at AFD. Several studies have been accomplished, or are currently being conducted to meet these requirements; however, a downstream entrainment evaluation is still outstanding. A previous study quantified movements of adult bull trout in the AFD tailrace and determined that bull trout are most frequently located at the river-left bank of the powerhouse tailrace. Consequently, an ongoing feasibility effort by the KTI and USACE is working to provide temporary upstream passage of bull trout via a fish trap installed near the river-left bank of the powerhouse tailrace. In 2013, a downstream survivability study quantified survival rates varying from 97.6–100% for spill bay 4 (including 1 and 48 hr direct survival estimates for both subadult and adult rainbow trout) and pooled survival rates varying from 90.1–99.5% for turbine unit 1 (1 and 48 hr direct survival estimates for subadult and adult rainbow trout). Although these survival rates are relatively high, only one turbine and one spill bay were assessed and it is currently unknown which specific routes fish primarily use to pass downstream through AFD. Thus, information on the volitional and non-volitional passage routes of bull trout or other species with special conservation status have yet to be determined to meet the USFWS BiOp requirement. Thus, this study plan is focused on outlining potential alternatives to study downstream fish entrainment through AFD.
The objectives of this study were as follows:
• Develop a better understanding of downstream passage conditions for non-anadromous salmonids and other native and non-native species at Pacific Northwest dams through a brief literature review of
Final Report
iv
published and grey literature, and with an emphasis on entrainment studies, to include as background information for the introduction.
• Review passage route conditions at AFD (spillway and turbine) and assess potential opportunities to study fish movement through one or more of the outlets. PNNL and NWW would each provide input on different entrainment alternatives, focusing on the highest priority areas for plans, such as whether to use draft tube or spill bay nets, hydroacoustic monitoring of turbine intakes and spill bays, and gatewell sampling of turbine intakes or spill bays.
• Develop a collaborative study plan for fish entrainment monitoring with the USACE, KTI and BPA.
Several potential study alternatives to assess fish entrainment through AFD were discussed initially during a site visit on 15 May 2014. This and other discussions led to the formation of several preliminary methods that could be used; however, this list was pared down to a priority list that included net-capture methods of the intakes and outlets of the turbines and spillway, mark-recapture, hydroacoustics, and acoustic imaging. These alternatives were deemed appropriate for further expansion within a formal study plan intended to provide sufficient detail so that feasible alternatives could be compared and contrasted, and an ultimate decision to be agreed upon later by the action agencies (USACE and BPA) and stakeholders.
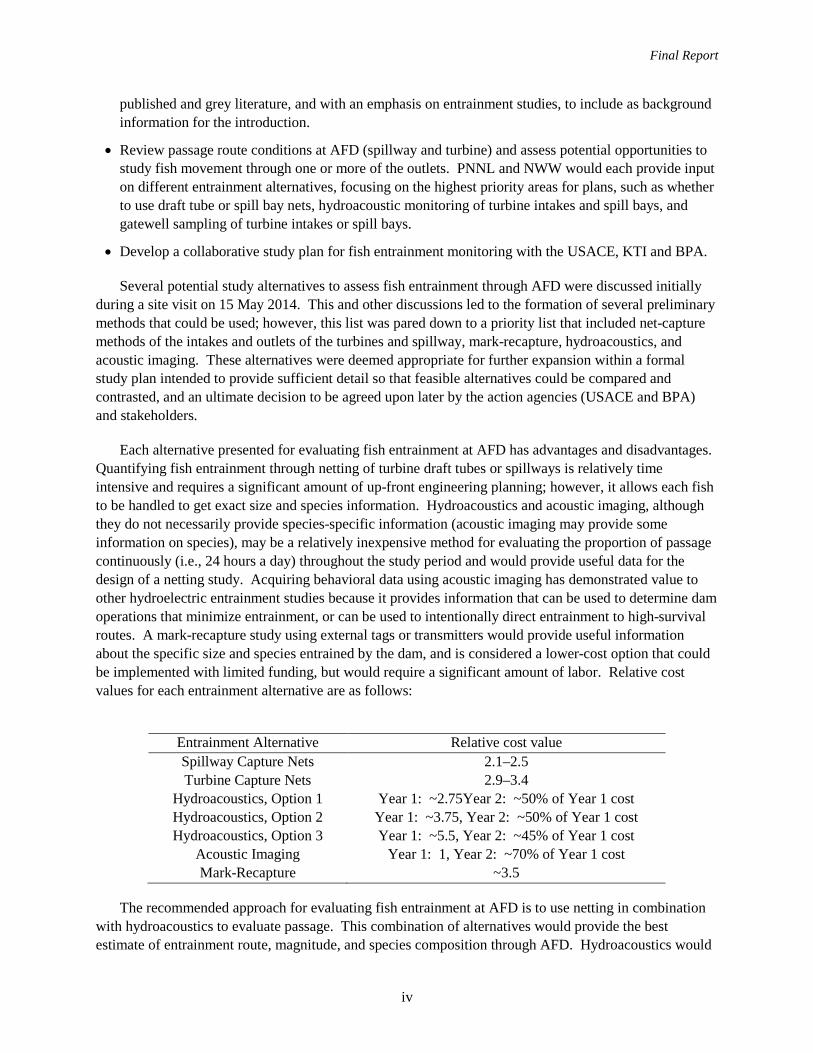
Each alternative presented for evaluating fish entrainment at AFD has advantages and disadvantages. Quantifying fish entrainment through netting of turbine draft tubes or spillways is relatively time intensive and requires a significant amount of up-front engineering planning; however, it allows each fish to be handled to get exact size and species information. Hydroacoustics and acoustic imaging, although they do not necessarily provide species-specific information (acoustic imaging may provide some information on species), may be a relatively inexpensive method for evaluating the proportion of passage continuously (i.e., 24 hours a day) throughout the study period and would provide useful data for the design of a netting study. Acquiring behavioral data using acoustic imaging has demonstrated value to other hydroelectric entrainment studies because it provides information that can be used to determine dam operations that minimize entrainment, or can be used to intentionally direct entrainment to high-survival routes. A mark-recapture study using external tags or transmitters would provide useful information about the specific size and species entrained by the dam, and is considered a lower-cost option that could be implemented with limited funding, but would require a significant amount of labor. Relative cost values for each entrainment alternative are as follows:
Entrainment Alternative Relative cost value Spillway Capture Nets 2.1–2.5 Turbine Capture Nets 2.9–3.4
Hydroacoustics, Option 1 Year 1: ~2.75Year 2: ~50% of Year 1 cost Hydroacoustics, Option 2 Year 1: ~3.75, Year 2: ~50% of Year 1 cost Hydroacoustics, Option 3 Year 1: ~5.5, Year 2: ~45% of Year 1 cost
Acoustic Imaging Year 1: 1, Year 2: ~70% of Year 1 cost Mark-Recapture ~3.5
The recommended approach for evaluating fish entrainment at AFD is to use netting in combination with hydroacoustics to evaluate passage. This combination of alternatives would provide the best estimate of entrainment route, magnitude, and species composition through AFD. Hydroacoustics would
Final Report
v
provide relatively inexpensive data on year-round fish entrainment (24 hours per day) through time (e.g., by diel period or seasons) and by passage route (i.e., 10 spill bays and 3 turbines). Year-round hydroacoustic data would then be used to focus the netting effort on the routes (and times of year) with the highest entrainment and would allow researchers to enumerate the size and species being entrained. Using these methods in tandem would then allow corroboration of entrainment data and extrapolation of species- and size-specific data to estimate total-project entrainment.
Because of the potentially significant cost and time required to design and deploy capture nets, and to determine the appropriate routes to place nets (assuming that nets could not be constructed for all potential passage routes), a phased approach is recommended whereby hydroacoustics would be implemented in the first year of study followed by netting in year two of the study. In this scenario, hydroacoustic data would be used to identify the passage routes with the greatest fish entrainment rates, and these areas would then be sampled with nets to quantify specific fish sizes and species entrained. It is estimated that from funding through completion, a study combining the hydroacoustic and netting alternatives would take about 2.5 years and would be divided into the following major milestones:
Year 1: Plan and deploy hydroacoustic gear; Design and construct fyke nets; Sample passage routes with hydroacoustics; Determine primary routes of passage for net-sampling
Year 2: Continue hydroacoustic sampling; Deploy fyke nets; Begin data analysis and study report
Year 3: Finish data analysis and study report.
One potential concern related to implementing a phased approach is that dam operations could vary significantly between study years and may bias the entrainment estimates collected with different methods in different flow years. To quantify the potential for bias, hydroacoustics-derived entrainment rates and dam operations would be compared between years to understand whether net-entrainment data, collected in a later year of study, could be extrapolated back to prior years when only hydroacoustic data were collected. If hydroacoustic entrainment results were similar between years, it might be assumed that net-entrainment results would have been similar between years. However, this also assumes that the composition of fish species and sizes was similar in the forebay between years and thus, if this assumption cannot be verified, then it is possible that back-calculated entrainment estimates could be biased. Despite this consideration of bias, using hydroacoustics in year one would provide much value in determining the proper passage routes to be sampled using capture nets in year two.
The exact method to be used to assess entrainment through the passage routes at AFD, whether a combination of hydroacoustics and netting, or a less-expensive mark-recapture study, would ultimately be determined in consultation between the USACE, BPA, KTI, and other stakeholders. However, final implementation should consider the guidelines suggested in this study plan to evaluate the advantages, disadvantages, and assumptions of each outlined alternative. Management goals for the resource should also be considered to ensure that the alternative chosen is able to sufficiently inform fisheries management and dam operations decision-making.

Final Report
vi
Acronyms and Abbreviations
2D two-dimensional AFD Albeni Falls Dam BiOp Biological Opinion BPA Bonneville Power Administration BRZ boat-restricted zone deg degree DIDSON Dual Frequency Identification Sonar EBA effective beam angle EFH Essential Fish Habitat ESA Endangered Species Act FCRPS Federal Columbia River Power System ft foot(feet) JSATS Juvenile Salmon Acoustic Telemetry System K thousand kcfs thousand cubic feet per second KTI Kalispel Tribe of Indians m meter(s) mm millimeter(s) MOU Memorandum of Understanding MSL mean sea level NWS Seattle District (USACE) NWW Walla Walla District (USACE) PIT passive integrated transponder PNNL Pacific Northwest National Laboratory s second(s) USACE U.S. Army Corps of Engineers VI Visible Implant
Final Report
vii
Contents
Executive Summary .............................................................................................................................. iii Acronyms and Abbreviations ............................................................................................................... vi 1.0 Introduction .................................................................................................................................. 11
1.1 Objectives ............................................................................................................................. 12 1.2 Background .......................................................................................................................... 12
1.2.1 Alternatives Prioritization ......................................................................................... 13 1.2.2 Legal Requirements ................................................................................................... 14
1.3 Report Overview .................................................................................................................. 15 2.0 Literature Review ......................................................................................................................... 15 3.0 Entrainment Alternatives .............................................................................................................. 17
3.1 Spillway and Turbine Capture Nets ..................................................................................... 18 3.1.1 Implementation Plan ................................................................................................. 18 3.1.2 Data Types Acquired; Processing and Analysis ........................................................ 21 3.1.3 Project Impacts and Support...................................................................................... 21 3.1.4 Cost ........................................................................................................................... 22 3.1.5 Assumptions and Limitations .................................................................................... 23 3.1.6 Expected Results and Applicability .......................................................................... 24
3.2 Hydroacoustics ..................................................................................................................... 24 3.2.1 Implementation Plan ................................................................................................. 25 3.2.2 Data Types Acquired; Processing and Analysis ........................................................ 31 3.2.3 Project Impacts and Support...................................................................................... 32 3.2.4 Cost ........................................................................................................................... 33 3.2.5 Assumptions and Limitations .................................................................................... 33 3.2.6 Expected Results and Applicability .......................................................................... 33
3.3 Acoustic Imaging ................................................................................................................. 34 3.3.1 Implementation Plan ................................................................................................. 34 3.3.2 Data Types Acquired; Processing and Analysis ........................................................ 35 3.3.3 Project Impacts and Support...................................................................................... 36 3.3.4 Cost ........................................................................................................................... 37 3.3.5 Assumptions and Limitations .................................................................................... 37 3.3.6 Expected Results and Applicability .......................................................................... 37
3.4 Mark-Recapture .................................................................................................................... 37 3.4.1 Implementation Plan ................................................................................................. 38 3.4.2 Data Types Acquired; Processing and Analysis ........................................................ 40 3.4.3 Project Impacts and Support...................................................................................... 42 3.4.4 Cost ........................................................................................................................... 42
Final Report
viii
3.4.5 Assumptions and Limitations .................................................................................... 43 3.4.6 Expected Results and Applicability .......................................................................... 43
4.0 Conclusions and Recommendations ............................................................................................. 44 4.1 Alternatives Comparison ...................................................................................................... 44 4.2 Recommended Approach ..................................................................................................... 45
5.0 References .................................................................................................................................... 47 Appendix A – Alternatives Matrix........................................................................................................ A.1 Appendix B − Albeni Falls Dam Government Budgetary Estimate ..................................................... B.1
Final Report
ix
Figures
1. Example of Lake Pend Oreille elevation from spring through summer and discharge at Albeni Falls Dam. ..................................................................................................................... 13
2. Computational fluid dynamic model renderings of the bathymetry of the Albeni Falls Dam tailrace, 2010. ....................................................................................................................... 18
3. Fyke-net configuration concept for entrainment evaluation of the Albeni Falls Dam spillway. ........................................................................................................................................ 19
4. General configuration of the floating platform locations that would be attached to a fyke net sampling a spill bay of Albeni Falls Dam or attached to the cod-end of a net sampling a turbine draft tube ........................................................................................................ 20
5. Plan view of Albeni Falls Dam showing proposed sampling locations for transducers for the three potential sampling options ........................................................................................ 27
6. Example of single-beam transducer mount that could be used at spill bays. ................................ 28 7. Single-beam transducer deployment location with two 10-deg “side-looking”
transducers optimally aimed for sampling during normal spill operations and two 10-deg transducers optimally aimed to sample during “free-flow” operations ............................ 29
8. Cross section through one of three turbine units that would be sampled at AFD to estimate fish passage. Drawing is not to scale. Original drawing courtesy of the USACE. ....... 30
9. Vertical distribution transducer deployment ................................................................................. 30 10. Cross-sectional view of the BlueView deployment in a turbine unit at Albeni Falls
Dam ............................................................................................................................................... 35 11. Screen capture of a frame from the BlueView underwater sonar, showing a school of
juvenile fish and some larger fish in front of a hydropower project in the Willamette River Basin. .................................................................................................................................. 36
12. Radio telemetry detection zones at Albeni Falls Dam as of December 2014 ............................... 40
Tables
1. Percentage of total cost for AFD entrainment evaluation by passage route and study component. .................................................................................................................................... 22
2. Estimated numbers of fish, by taxonomic family and species that are estimated to be captured while sampling to acquire 20 bull trout. All or a proportion of these fish could be affixed with an external tag for a mark-recapture study to evaluate fish entrainment through Albeni Falls Dam. ......................................................................................................................... 41
3. Relative cost values by alternative. Spillway and turbine capture net alternatives are for a 1-year period; the mark-recapture alternative would occur over about 3.5 years. ........................... 44
Final Report
11
1.0 Introduction
Albeni Falls Dam (AFD) on the Pend Oreille River in northern Idaho is located within an important migration route for fish passing between the upstream lentic habitats of Lake Pend Oreille and downstream lotic habitats of the Pend Oreille River and its tributaries. However, because of its presence as an upstream migration barrier, the potential effects of the dam on downstream migrating fish, and consequent to stipulations by the U.S. Endangered Species Act (ESA), 2000 Biological Opinion (BiOp, USFWS 2000), and a 10-year Memorandum of Understanding with the Kalispel Tribe of Indians (KTI), the U.S. Army Corps of Engineers (USACE) Seattle District (NWS) is working to develop a study plan to monitor both volitional and non-volitional fish entrainment through the turbines and spillway of AFD in conjunction with the USACE Walla Walla District (NWW), Bonneville Power Administration (BPA), the KTI, and the Pacific Northwest National Laboratory (PNNL).
The purpose of this study plan, and the implementation of a fish entrainment study, is to meet several stewardship goals of the USACE, assist with future management of natural resources at AFD, and potentially improve operations at AFD to minimize effects on fish. The USACE has a stewardship policy (USACE 1996) that outlines the guidelines for management, protection, compliance, and restoration practices where baseline information is essential to track resource management practices. Specifically, the “Special Status Species” section of the USACE stewardship policy states that both species and their critical habitats that occur within water resource development projects shall be protected and/or conserved in accordance with the ESA, as amended, and with existing state statues. Bull trout are currently the only ESA species impacted by AFD and thus, are of critical importance to stewardship by the USACE; however, westslope cutthroat trout and kokanee salmon also have special conservation status as part of the Idaho Department of Fish and Game’s Natural Heritage Program.
Additionally, the USFWS BiOp requires that the USACE conduct a feasibility study for reestablishment of two-way passage of adult and subadult bull trout at AFD. Several studies have been accomplished, or are currently being conducted to meet these requirements; however, a downstream entrainment evaluation is still outstanding. A previous study quantified movements of adult bull trout in the AFD tailrace and determined that bull trout are most frequently located at the river-left bank of the powerhouse tailrace (Bellgraph et al. 2010). Consequently, a current ongoing feasibility effort by the KTI and USACE is working to provide temporary upstream passage of bull trout via a fish trap installed near the river-left bank of the powerhouse tailrace. In 2013, a downstream survivability study quantified survival rates varying from 97.6–100% for spill bay 4 (including 1 and 48 hr direct survival estimates for both subadult and adult rainbow trout) and pooled survival rates varying from 90.1–99.5% for turbine unit 1 (1 and 48 hr direct survival estimates for subadult and adult rainbow trout; Normandeau 2014). Although these survival rates are relatively high, only one turbine and one spill bay were assessed and it is currently unknown which specific routes fish primarily use to pass downstream through AFD. Thus, information on the volitional and non-volitional passage routes of bull trout or other species with special conservation status have yet to be determined to meet the USFWS BiOp requirement. Thus, this study plan is focused on outlining potential alternatives to study downstream fish entrainment through AFD.
Final Report
12
1.1 Objectives
The objectives of this study were as follows:
• Develop a better understanding of downstream passage conditions for non-anadromous salmonids and other native and non-native species at Pacific Northwest dams through a brief literature review of published and grey literature, and with an emphasis on entrainment studies, to include as background information for the introduction.
• Review passage route conditions at AFD (spillway and turbine) and assess potential opportunities to study fish movement through one or more of the outlets. PNNL and NWW would each provide input on different entrainment alternatives, focusing on the highest priority areas for plans, such as whether to use draft tube or spill bay nets, hydroacoustic monitoring of intakes and spill bays, and gatewell sampling of turbine intakes.
• Develop a collaborative study plan for fish entrainment monitoring with the USACE, KTI, and BPA.
1.2 Background
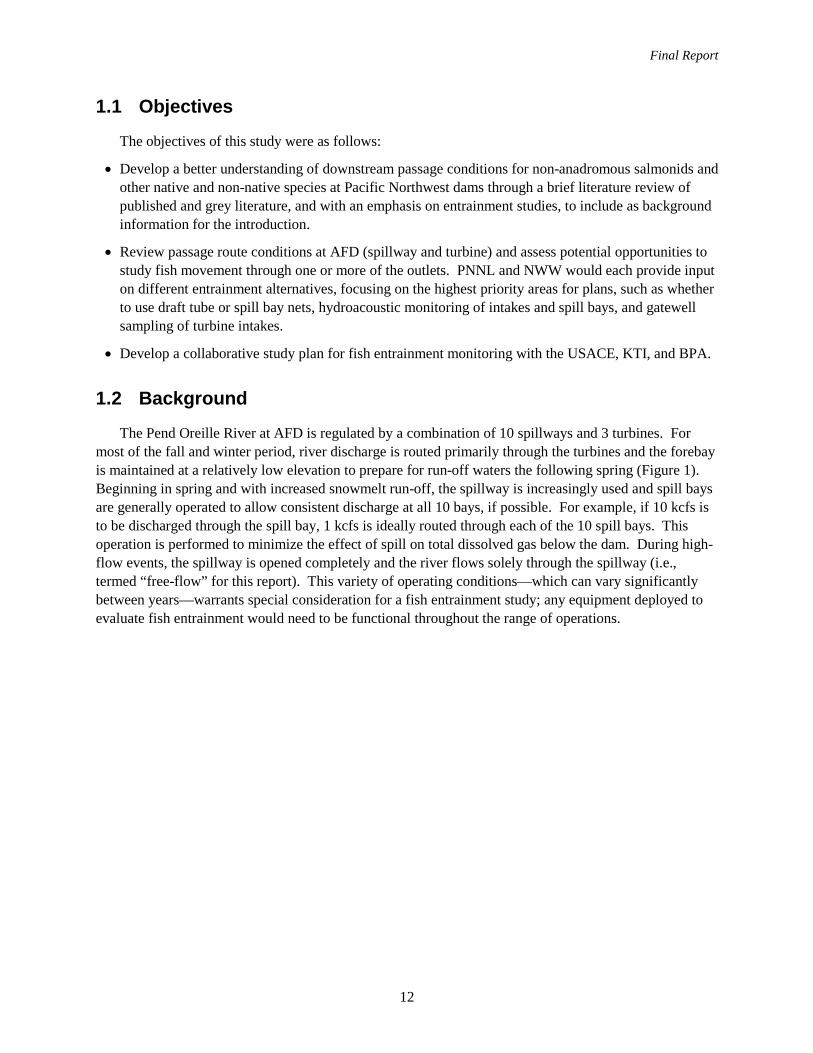
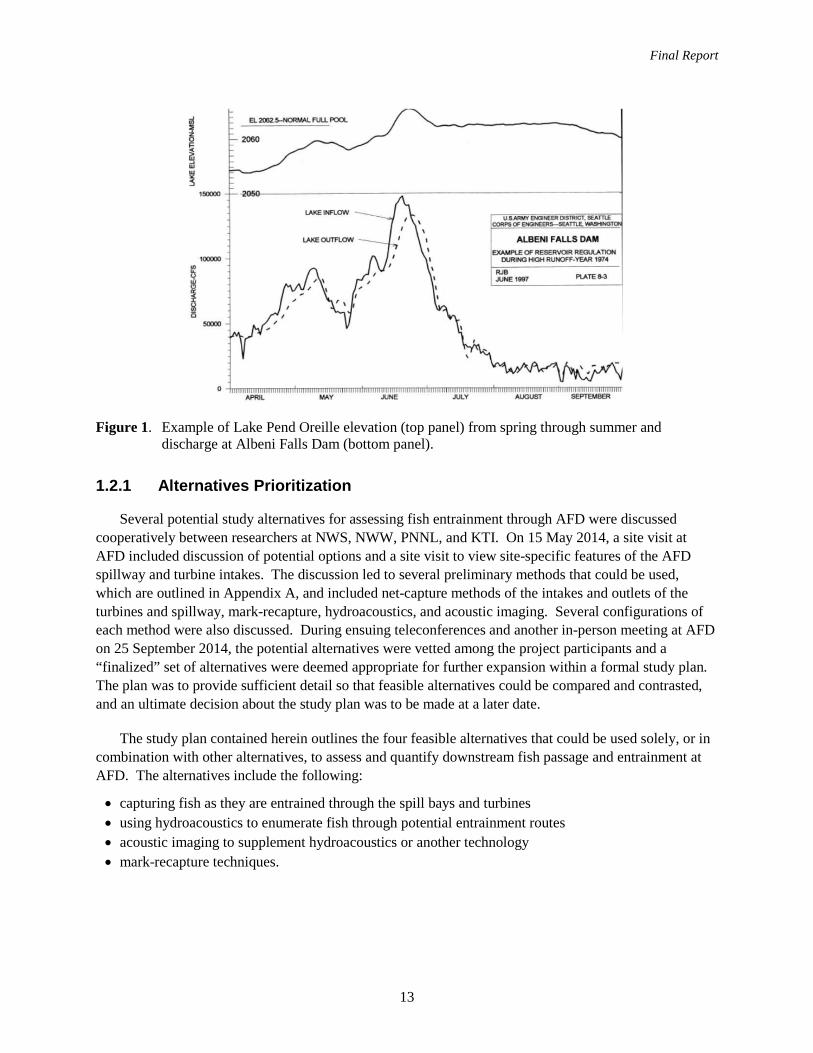
The Pend Oreille River at AFD is regulated by a combination of 10 spillways and 3 turbines. For most of the fall and winter period, river discharge is routed primarily through the turbines and the forebay is maintained at a relatively low elevation to prepare for run-off waters the following spring (Figure 1). Beginning in spring and with increased snowmelt run-off, the spillway is increasingly used and spill bays are generally operated to allow consistent discharge at all 10 bays, if possible. For example, if 10 kcfs is to be discharged through the spill bay, 1 kcfs is ideally routed through each of the 10 spill bays. This operation is performed to minimize the effect of spill on total dissolved gas below the dam. During high-flow events, the spillway is opened completely and the river flows solely through the spillway (i.e., termed “free-flow” for this report). This variety of operating conditions—which can vary significantly between years—warrants special consideration for a fish entrainment study; any equipment deployed to evaluate fish entrainment would need to be functional throughout the range of operations.
Final Report
13
Figure 1. Example of Lake Pend Oreille elevation (top panel) from spring through summer and
discharge at Albeni Falls Dam (bottom panel).
1.2.1 Alternatives Prioritization
Several potential study alternatives for assessing fish entrainment through AFD were discussed cooperatively between researchers at NWS, NWW, PNNL, and KTI. On 15 May 2014, a site visit at AFD included discussion of potential options and a site visit to view site-specific features of the AFD spillway and turbine intakes. The discussion led to several preliminary methods that could be used, which are outlined in Appendix A, and included net-capture methods of the intakes and outlets of the turbines and spillway, mark-recapture, hydroacoustics, and acoustic imaging. Several configurations of each method were also discussed. During ensuing teleconferences and another in-person meeting at AFD on 25 September 2014, the potential alternatives were vetted among the project participants and a “finalized” set of alternatives were deemed appropriate for further expansion within a formal study plan. The plan was to provide sufficient detail so that feasible alternatives could be compared and contrasted, and an ultimate decision about the study plan was to be made at a later date.
The study plan contained herein outlines the four feasible alternatives that could be used solely, or in combination with other alternatives, to assess and quantify downstream fish passage and entrainment at AFD. The alternatives include the following:
• capturing fish as they are entrained through the spill bays and turbines • using hydroacoustics to enumerate fish through potential entrainment routes • acoustic imaging to supplement hydroacoustics or another technology • mark-recapture techniques.

Final Report
14
1.2.2 Legal Requirements
Legal requirements regarding the effects of AFD on fish survivability and migration are most notably found in the BiOp released by the U.S. Fish and Wildlife Service in 2000 and in a 10-year agreement (i.e., Memorandum of Understanding [MOU]) between the KTI and the action agencies (USACE and BPA). The MOU recognizes the KTI’s unique interests in operations of AFD in relation to the impacts on fish and wildlife and outlines specific mandates for participation between the KTI and the action agencies in management decisions that affect fish, wildlife, and water quality.
The 2000 BiOp is focused specifically on the effects of AFD on ESA threatened bull trout; however, language in the BiOp also implies the importance of providing safe downstream passage for all species that may pass the dam. Reasonable and Prudent Measure #3 (RPM) for the Upper Columbia River in the 2000 BiOp states the following:
The action agencies shall evaluate the feasibility of reestablishing bull trout passage at Albeni Falls Dam. If the information from these studies warrants consideration of modifications to the Albeni Falls facility, then the Service will work with the action agencies to implement these measures, as appropriate, or to reinitiate consultation, if necessary.
Language previous to the definition of RPM 3 as stated in the 2000 BiOp also includes supporting statements such as the following:
Entrainment of bull trout through turbines may also occur at various projects including…Albeni Falls [dam]… [pg 35]
Albeni Falls Dam was constructed without fishways to accommodate safe upstream and downstream passage of fish…In the absence of passage, migratory bull trout remaining in the Pend Oreille River will continue to be harmed. [pg 43]
The primary potential for entrainment exists at Hungry Horse, Libby, Albeni Falls, and Dworshak dams, affecting eight bull trout populations. [pg 61]
Terms and conditions to implement RPM #3 for the Upper Columbia River in the 2000 BiOp further state the following:
By October 1, 2004, the action agencies shall conduct a feasibility study for reestablishment of two- way passage of adult and subadult bull trout at Albeni Falls Dam. This study must include observations of movement and survival of radio-tagged bull trout from Lake Pend Oreille, and survival of adult and subadult bull trout passing through or over Albeni Falls Dam. The study must also analyze the feasibility of structural improvements such as fish ladders and measures to guide fish away from turbines.
Although the legal requirements are focused most specifically on evaluating the effects of AFD on bull trout, it is reasoned that while conducting a study specific to bull trout, a study examining other fish species affected by AFD would require little extra work. This is due to the low capture rates of bull trout in the study area. For example, in 2013, Paluch et al. (2014) calculated capture rates of bull trout in the
Final Report
15
AFD tailrace of 0.0418 fish per hour. Thus, in order to capture an appropriate amount of bull trout for any evaluation, numerous individuals of other species could be interrogated also for an evaluation.
Previous studies have been conducted in recent years to work toward the BiOp requirements. For example, a series of radio tracking efforts were conducted to study the migratory behavior of bull trout captured at AFD (Scholz et al. 2005; Bellgraph et al. 2010). The results of these studies have been used to identify appropriate locations for entrance(s) of a future fishway for upstream migrating bull trout. Consequently, NWS is currently working on a feasibility study for a conceptual fishway. Additionally, a balloon-tag survival study was completed in 2013 that evaluated the survival and injury rate for subadult and adult rainbow trout passing through a turbine and a spill bay at AFD (Normandeau 2014).
1.3 Report Overview
The ensuing sections of this report include a review of the peer-reviewed and grey literature pertaining to entrainment studies that have been performed at Pacific Northwest dams per Objective 1 of this study (Section 2.0). Section 3.0 outlines several alternatives for assessing fish entrainment through the AFD spillway and powerhouse. The alternatives discussed include netting methods (Section 3.1), hydroacoustics (Section 3.2), acoustic imaging (Section 3.3), and mark-recapture methods employing externally visible tags or telemetry (Section 3.4). A summary comparing the various alternatives, as well as a recommended approach, is given in Section 4.0. Lastly, Appendix A includes an alternatives matrix that was used to prioritize the advantages and disadvantages of each methodology prior to compilation of the study plans.
2.0 Literature Review
Hydroacoustic systems have been widely used since the 1980s to study fish entrainment at dams in the Pacific Northwest (Ransom and Stieg 1994; Ferguson et al. 2004). The Willamette, lower Columbia, and Snake Rivers, in particular, have been studied extensively using fixed-aspect acoustic transducers to measure salmonid passage and fallback at regional projects. Studies at these dams typically involve the deployment of fixed-location transducers at points of interest. These transducers have been used individually to measure entrainment at specific sites, such as at weir or sluiceway entrances (Buchanan et al. 1993; Johnson et al. 2005; Khan et al. 2010) or, when deployed together as part of whole-dam arrays, to quantify total-project entrainment (Khan et al. 2012a; Hughes et al. 2014). Single and split-beam transducers are by far the most commonly used transducer types because of their established use and the existence of software that can autonomously compile and evaluate the large amounts of data associated with hydroacoustic systems (Ransom et al. 1998; Smith et al. 2009). More recent technologies including Dual Frequency Identification Sonar (DIDSON) and BlueView acoustic cameras allow the capture of fine-scale imagery that can be used to monitor individual behavioral responses (Ploskey et al. 2005) or even differentiate species (Burwen et al. 2010). However, DIDSON and BlueView technologies have not been used solely to evaluate project-wide fish entrainment; typically they are used only to measure select passage routes at certain projects because of their expense and the current lack of autonomous processing software.
The ability of hydroacoustics to quantify the absolute passage through a monitored route, and the size of entrained fish, have made the method well suited for studies attempting to document total or seasonal
Final Report
16
project entrainment, or the entrainment of specific size classes. Numerous studies have successfully used hydroacoustics to estimate the size of juvenile salmonid runs (Thorne and Johnson 1993; Ferguson et al. 2004) and kelt fallback (Khan et al. 2010; Hughes et al. 2014). Hydroacoustics have also been effectively used to evaluate behavioral responses to structural configurations at dams, such as Cougar Dam, where Khan et al. (2010) used hydroacoustics to demonstrate that juvenile salmonids were avoiding deep entrainment points and instead engaging in milling behavior near surface structures in the forebay. Hydroacoustics has several known limitations, though, that have affected past entrainment research at Pacific Northwest dams. Notable limitations include not being able to observe fish passing through solid features such as intake gates (Ploskey et al. 2003), difficulty in differentiating small-sized fish targets from air bubbles and debris (Ploskey et al. 2004), and passage estimates that may be skewed by large numbers of non-target species (Khan et al. 2012b; Hughes et al. 2014).
Direct-capture methods provide more information about species composition and biological characteristics of entrained fish than can be ascertained from hydroacoustics alone (FERC 1995). However, direct-capture methods (primarily netting) for evaluating entrainment of fish at hydropower dams are usually two to four times more expensive relative to hydroacoustic methods for estimating entrainment (FERC 1995). Ransom et al. (1996) identified strong correlations between hydroacoustic and direct-capture estimates of total fish entrainment suggesting that hydroacoustics could solely be used to quantify the magnitude of fish entrainment. However, if the objective of the entrainment evaluation requires specific knowledge about a species of interest (such as those listed under the ESA) direct capture may be a necessary component of the study plan.
Direct-capture methods typically use nets deployed in the tailrace of a dam to capture fish in a passive manner (Hubert 1996). This netting can be full-flow netting or partial-flow netting. Full-flow netting samples the entire volume of water being discharged and reduces the potential for sample bias. Partial-flow netting only samples a subset of water being discharged and is often used when full-flow netting is not feasible due to high discharge or other physical limitations (FERC 1995). However, partial-flow netting may increase the possibility of capturing fish that were already in the tailrace and were not actually entrained through the dam. Full-flow netting, which would minimize or disallow fish from entering the draft tube from the tailrace would have a lower chance of capturing tailrace-origin fish.
Partial-flow netting is usually accomplished by attaching a net with a large opening facing the draft tube exit that tapers down to a closed “cod” end (Schilt et al. 1995). The net is most efficient and minimally biased if it is placed in high-water–velocity environments. Net shape, size, mesh diameter, and material are all important considerations for meeting study objectives in entrainment evaluations (HDR 2009). Stone and Webster Environmental Services (1992) recommend a net length-to-width ratio of 3:1, because they generally found longer nets handled better than short ones. Mesh size is also an important consideration that will have a direct influence on gear selectivity. Smaller mesh size will capture a greater size range of fish, but can be more difficult and costly to maintain as it can be more likely to collect debris.
Whereas most net arrays are deployed in the tailrace of dams near a passage outlet, it is also feasible to place an array of nets in the intake of a dam passage to sample fish before they become entrained in the dam (e.g., Ransom et al. 1996; Ploskey and Carlson 1999; Monk et al. 2004). Nets can also be placed further downstream in some cases if flow conditions are unfavorable near the dam or the passage routes are limited (James 2002).
Final Report
17
Mark-recapture experiments can also produce estimates of entrainment in dams (Giorgi and Sims 1987). Dam entrainment can be estimated by marking fish with an identifying mark and releasing the marked fish upstream of the dam and subsequently recapturing a portion of the fish downstream of the dam. Potential marks include fin clips, Visible Implant elastomer tags, Floy tags, freeze brands, and spray dyes (Hanson 2001). Recapture of marked fish can be accomplished using a number of methods, but fish must be directly captured for the vast majority of marked fish to be detected (e.g., fish with externally visible tags would need to be recaptured whereas fish with active transmitters would only need to be detected after being entrained). Active capture methods such as dip netting, seining, and electrofishing are possible methods for recapture, but they cannot capture fish continuously and may be biased toward capturing fish that are either living (e.g., electrofishing) or dead (e.g., nets that live fish may attempt to avoid). Passive capture methods, such as net arrays or bypass collectors, deployed at or near the dam continuously capture fish and can provide a more accurate estimate of entrainment of marked fish. In addition, marked fish can provide a means of calculating net efficiency so that accurate estimates of dam entrainment can be calculated (FERC 1995).
Radio and acoustic telemetry technologies have been used extensively to monitor volitional and non-volitional passage through dams and consequently are another method available for evaluating fish entrainment. Biotelemetry equipment configurations can vary widely depending on the dam being researched (Ferguson et al. 2004), but most acoustic and radio telemetry studies conducted at regional projects involve the deployment of hydrophones (acoustic) or underwater and aerial antennas (radio) at individual entrainment points (Wertheimer 2007) or along the entire dam face as part of a cabled array (Axel et al. 2010; Weiland et al. 2011). Autonomous receivers or aerial antennas are also often deployed in the tailrace and further downstream, and have been used successfully to measure route-specific survival (Beeman et al. 2010) and delayed mortality (Ferguson et al. 2006; Harnish et al. 2012) following entrainment. The use of telemetry has also allowed the ability to quantify forebay residence times (Ham et al. 2009), determine species-specific entrainment rates (Flatter et al. 1999; Wertheimer and Evans 2005; Evans et al. 2008), and to follow individual fish behavior such as escaping insufficient entrainment velocities or behavior indicating poor passage options (Beeman et al. 2013). As with hydroacoustics, biotelemetry is not without its limitations. The high cost of tags limits sample sizes and project scopes, and regional research comparing radio telemetry data to live capture or hydroacoustic data has found that samples of radio-tagged fish do not always reflect the assemblage composition of entrained fish, and thus bias passage estimates (Ploskey et al. 2004).
3.0 Entrainment Alternatives
Several methods have been traditionally used to evaluate fish entrainment at hydroelectric dams throughout the Pacific Northwest as explained in the Introduction. Detailed below are individual study plans to specifically evaluate fish entrainment through the spillway and turbines of AFD. Also covered are the types of data that would be acquired, how they could be analyzed, potential impacts on the AFD project and support needed, a relative cost estimate, assumptions and limitations of the proposed study plan, and the expected results and applicability.
Final Report
18
3.1 Spillway and Turbine Capture Nets
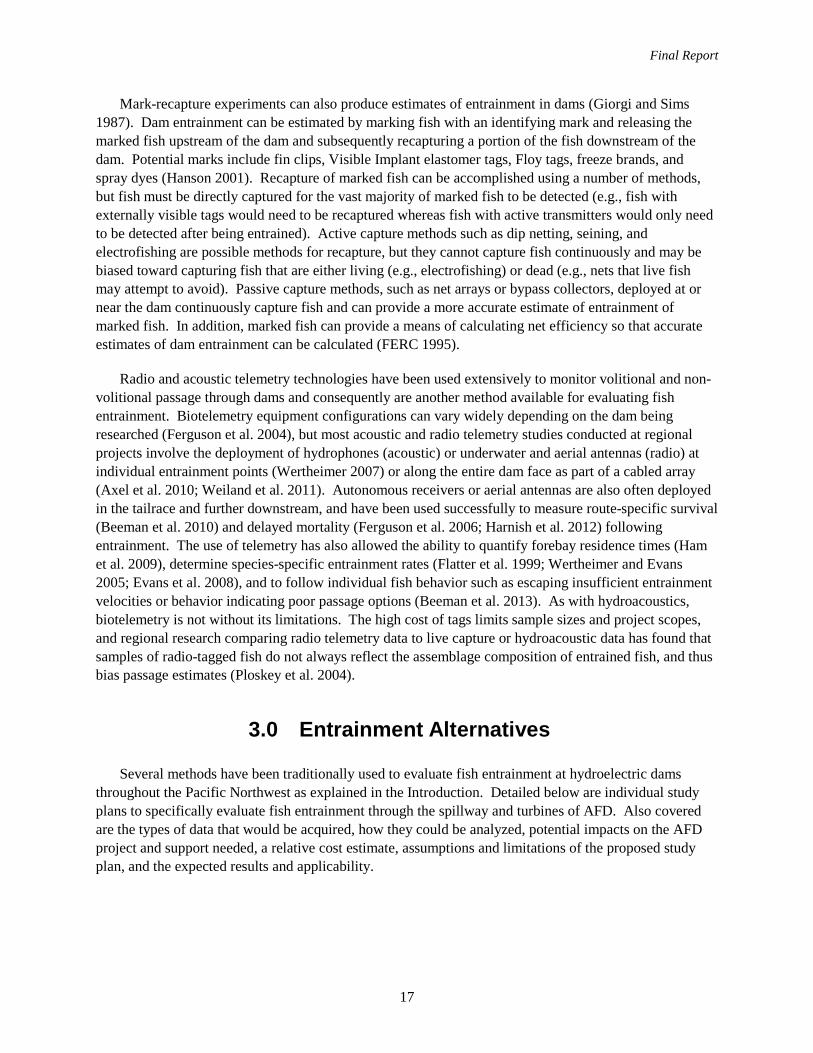
Sampling fish entrained through spill bays will be logistically challenging. We initially considered three potential options. The first option was to place a rigid frame structure in the spill bay gate slots with a net attached to the frame, which could be lifted (or put in place) via a crane stationed on the deck over the spill bays. The second option was to deploy nets in the tailrace immediately downstream of spill bays to attempt to capture fish immediately after they were entrained. The third option was to place nets in the forebay immediately upstream of spill bay entrances, but near capture velocities that allowed us to be confident that a fish entering the net would not have been able to escape being entrained. It is unlikely that tailrace netting or using a frame net configuration in the gate slots of the spill bays would be practical for several reasons. The tailrace hydraulics and bathymetry immediately downstream of the spill bays (Figure 2) are not conducive to any type of netting due to shallow, high velocity and turbulent water. Tailrace netting would require sampling a substantial distance downstream, which significantly increases the potential bias that fish already in the tailrace are captured and included in estimates of entrainment.
Figure 2. Computational fluid dynamic model renderings of the bathymetry of the Albeni Falls Dam
tailrace, 2010.
The alternative of placing a frame net structure in the gate slots of the spill bays was not further evaluated given the limited workspace and access above the spill bays and because placing a rigid frame structure in the spill bays poses additional unnecessary risks, including structural damage and operational constraints. The general approach we think is most feasible is to deploy a net upstream of spill bays where capture velocities are sufficient to prevent fish from swimming upstream out of the nets.
Net-sampling of the powerhouse turbines would use a net configuration similar to the one described for spillway sampling with a fyke net to capture fish that exit the draft tube. The draft tube for each turbine splits into three barrels. The exit of a single barrel would be sampled and extrapolated (i.e., multiplied by nine barrels from three turbines) to estimate total entrainment through the powerhouse.
3.1.1 Implementation Plan
Below are the proposed implementation plans for evaluating entrainment at both the AFD spillway and powerhouse.
Final Report
19
3.1.1.1 Spillway
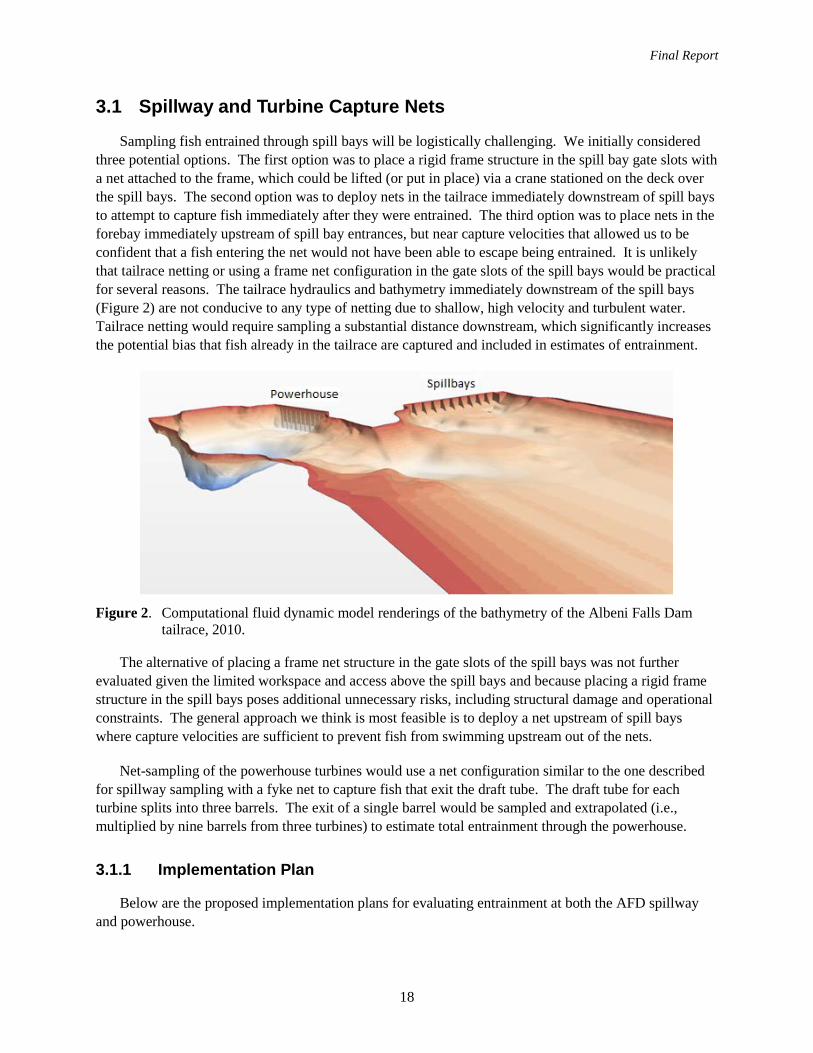
Our preferred alternative is to use a large fyke net (30 ft wide and 90 ft long) with a cod-end trap box deployed from a floating platform anchored in the forebay just upstream of the spillway (Figure 3). However, depending on fish approach, which could be determined by hydroacoustics (see Section 3.2 for details), a shorter and wider net may be necessary if fish approach and move laterally across the spillway. The net would be deployed from the platform such that the cod-end of the trap is located in sufficient water velocities (approximately 6–8 ft/s) to prevent fish from escaping and at a depth near the top of the spillway crest. One lead end of the net would be dropped to the bottom of the river and held in place by an anchor. The other lead end of the net would be anchored to the upstream floating platform. A separate line would run from a second, downstream floating platform to the cod-end of the trap. This separate line would be attached to a winch mounted on the platform, which would allow the cod-end of the net to be retrieved without removing and re-deploying the entire net. Fish could be sampled on the floating platform or transported to shore.
Figure 3. Fyke-net configuration concept for entrainment evaluation of the Albeni Falls Dam spillway.
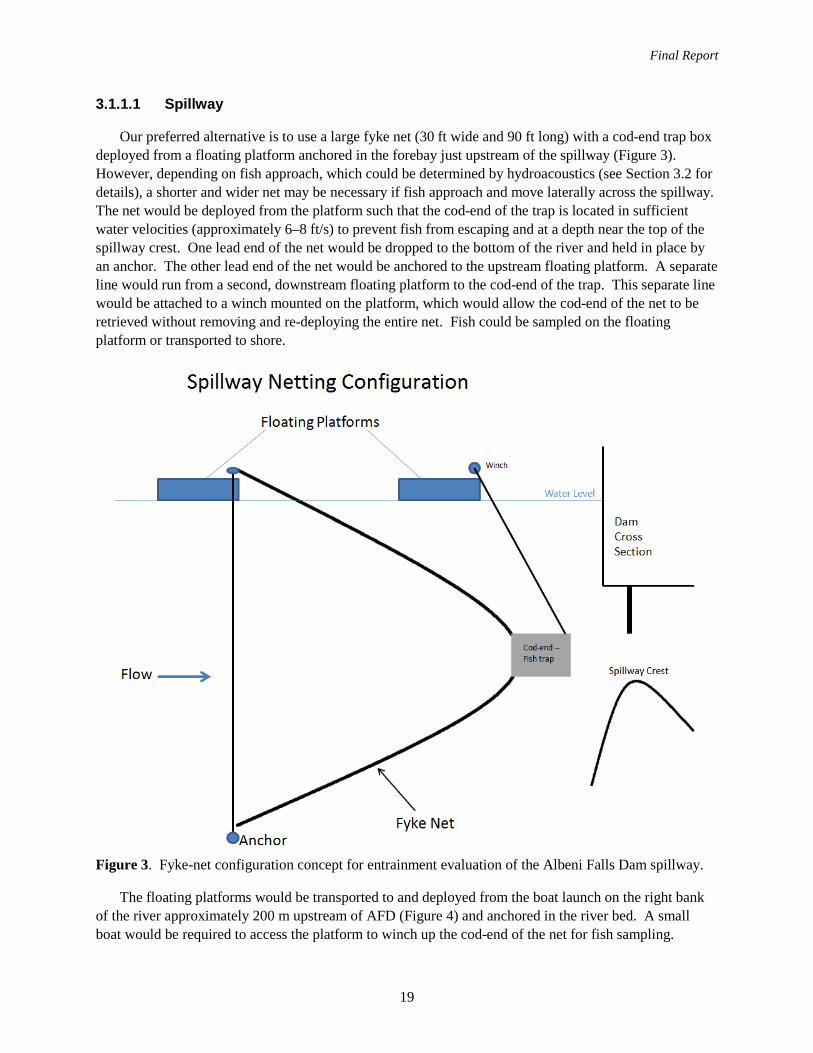
The floating platforms would be transported to and deployed from the boat launch on the right bank of the river approximately 200 m upstream of AFD (Figure 4) and anchored in the river bed. A small boat would be required to access the platform to winch up the cod-end of the net for fish sampling.
Final Report
20
Anchoring the platforms will require coordination with appropriate environmental agencies that have permitting jurisdiction for state aquatic lands. In addition, permits from the U.S. Fish and Wildlife Service and Idaho Department of Fish and Game will need to be obtained for collecting and sampling fish.
Figure 4. General configuration of the floating platform locations that would be attached to a fyke net
sampling a spill bay of Albeni Falls Dam (two horizontal red dashes) or attached to the cod-end of a net sampling a turbine draft tube (vertical red dash).
3.1.1.2 Powerhouse
Sampling entrained fish through the powerhouse would occur by capturing fish as they exit the draft tube. A fyke net similar in design to that used for spillway sampling (Figure 3) would be attached to two beams that would fit in the bulkhead slot. The bottom of the fyke-net lead would be attached to the bottom beam and lowered into the bulkhead slot, and the upper lead of the fyke net would be attached to a separate beam and also lowered into the bulkhead slot. Also similar to the spillway sample design, a floating platform would be anchored to the river bed just downstream of the cod-end of the fyke net so
Final Report
21
that fish could be sampled by retrieving the cod-end from the floating platform. A unit outage would likely be required to raise the lower beam to the upper beam, and both beams would be raised well above the turbine intake and above tailwater elevation for removal. The net would then be pulled onto the tailrace deck with a roller (used on fishing boats to wind up nets onto a spool). The cod-end could first be separated from the beams from the floating platform, before removal of the bulkhead beams and net.
3.1.2 Data Types Acquired; Processing and Analysis
The net used to sample the spillway intake could be deployed at a randomly selected spill bay or at a bay determined to pass a majority of the fish (determined from hydroacoustics, Section 3.2), and a fyke net would be deployed at a randomly selected draft tube exit. More than one bay and draft tube exit could potentially be sampled; however, this would incur further cost. Sampling effort would be refined by further cost and precision requirements; however, the nets would not be deployed continuously. Typically, the nets would be deployed on randomly selected days and for time periods according to the sampling plan; a randomized complete block design could be used to account for operations differences between night and day, or between days. The number of days and hours of deployment would be subject to estimates of study needs, budgetary constraints, precision, and other statistical sampling requirements. Sampling of the spillway would be restricted to the period of the year when water is most likely being passed through the spillways (May–July), whereas fyke-net sampling of the turbine outlets could be performed year-round.
The type of data collected by the spillway and turbine-outlet nets would include fish species and number. Depending on sample sizes, lengths of all captured species would also be recorded or if sample sizes were high, a subsample of lengths would be recorded. AFD operations data, environmental data (e.g., air and water temperature, river discharge), and net deployment data (e.g., hours sampled, location) would also be collected and would allow for an evaluation of the effects of operations and environmental factors on factors such as species, fish size, and catch per unit effort of fish entrainment through the spillway and turbines.
3.1.3 Project Impacts and Support Researchers would require access to the forebay boat-restricted zone (BRZ) to deploy nets and
sample fish upstream of the spill bays. This project access would require coordination with project staff as well as BPA to minimize disruption of normal operations, maintenance activities, and downstream impacts to the hydrosystem. Net placement and associated installation infrastructure would require coordination so that no water is being spilled in or near the spill bays at the time of installation. Net deployment would need to occur on days when the project is spilling water and this would also require coordination with project staff.
Project operations would need to be coordinated for the placement of the beams and net in the bulkhead slot of the powerhouse tailrace, which would require a turbine unit outage of 1–2 days. The netting would only occur in one draft tube exit so the unit outage could be coordinated to not impact power production as AFD usually only has 2 units operating at any one time. In the event that the study requires an outage while all 3 units are operating, the outage would be coordinated with BPA at least 30 days in advance. Once the outage has been coordinated and approved, BPA real-time operations staff will be notified 72 hours prior to an actual outage. A jib crane would be temporarily installed and used to
Final Report
22
install and remove the beams on days and at times selected for fish sampling. Project access and coordination would be required for tailrace BRZ entry to sample fish. Finally, powerhouse access would be required for bringing beams, net, jib crane onsite, installing, and removing after conclusion of the study.
3.1.4 Cost
Costs for the options of this alternative were based on NWW rates and are only meant to give a relative idea of cost for comparison with other alternatives; actual cost estimates would be provided by the contractor(s) performing the study. Changes in scope from that outlined above would change the relative cost. Relative cost values are presented so that the various study alternatives can be compared and contrasted based on relative cost. A relative cost value of “1” equates to the study alternative with the lowest estimated cost (i.e., Acoustic Imaging). A relative cost value of “3” would be approximately three times the cost of the alternative with a relative cost of 1.
The relative cost value for the spillway sampling concept varies from 2.1–2.5 for the sampling and associated assumptions as described. This cost estimate includes all construction, installation, mobilization, demobilization, and approximately 5 days of sampling. The cost estimate assumptions, detailed estimates, and breakdown are included in Appendix B. The sampling effort is provided as an initial and minimum effort required, but the sampling plans and design will need further evaluation and will likely add additional cost.
The relative cost value for the powerhouse tailrace sampling concept varies from 2.9–3.4 for the sampling and associated assumptions as described in this section. This cost estimate includes all construction, installation, mobilization, demobilization, and approximately five days of sampling. The cost estimate assumptions, detailed estimates, and breakdown are included in Appendix B. The sampling effort is provided as an initial and minimum effort required, but the sampling plans and design will need further evaluation, which may increase cost.
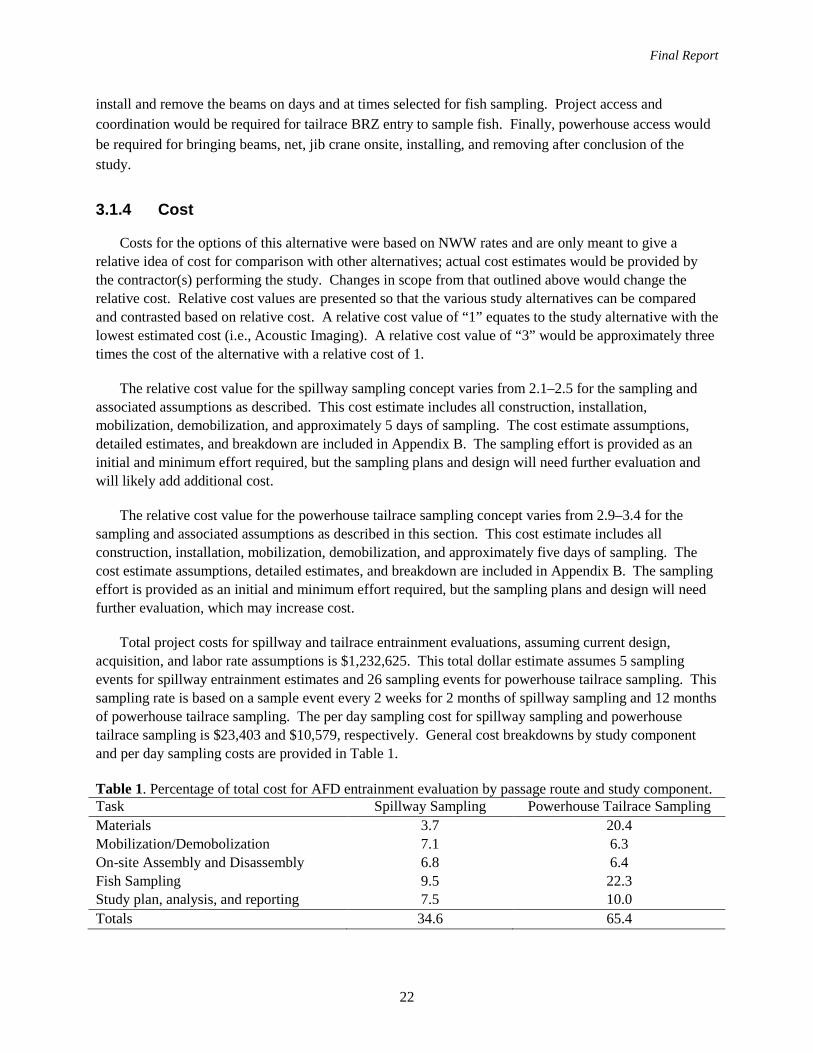
Total project costs for spillway and tailrace entrainment evaluations, assuming current design, acquisition, and labor rate assumptions is $1,232,625. This total dollar estimate assumes 5 sampling events for spillway entrainment estimates and 26 sampling events for powerhouse tailrace sampling. This sampling rate is based on a sample event every 2 weeks for 2 months of spillway sampling and 12 months of powerhouse tailrace sampling. The per day sampling cost for spillway sampling and powerhouse tailrace sampling is $23,403 and $10,579, respectively. General cost breakdowns by study component and per day sampling costs are provided in Table 1. Table 1. Percentage of total cost for AFD entrainment evaluation by passage route and study component. Task Spillway Sampling Powerhouse Tailrace Sampling Materials 3.7 20.4 Mobilization/Demobolization 7.1 6.3 On-site Assembly and Disassembly 6.8 6.4 Fish Sampling 9.5 22.3 Study plan, analysis, and reporting 7.5 10.0 Totals 34.6 65.4
Final Report
23
3.1.5 Assumptions and Limitations
If the spillway capture net is placed in a location with sufficient water velocities such that fish cannot escape (i.e., entrainment velocities), there will be minimal sampling bias concerns. However, one potential limitation is that fish sampled using nets are likely to die and thus, this alternative may only be permitted if a take permit for all species is approved by the Idaho Department of Fish and Game or other government agency. To offset potential take, the length of time sampled using nets could be reduced to reduce take. Other limitations include the feasibility of keeping a net in place in this relatively high-water−velocity environment. In addition, if fish approach from the sides of the net they will encounter the net before they encounter the net opening, which has the potential to bias the sample.
Net location-siting at the spillway should include:
• Assessment of viable capture velocities between spill bay locations (i.e., is one bay in a better position for higher velocities or higher capture probabilities than another bay),
• Determination of the maximum distance upstream of the spill bay gate that has viable velocities,
• Validation of whether changes in flow volume (and/or spill gate position) change the capture velocity distance upstream of the gate (previous calculations indicated a drop in velocity 6–10 ft upstream of a 1-ft gate opening), and
• Consideration that spillway operations may need to be managed to ensure fish capture during net-sampling events,
• Evaluation of risk to the nets from floating debris including large logs, branches, and aquatic vegetation, and anthropogenic structures that are present particularly during spring runoff.
The largest assumption of assessing entrainment using turbine-outlet nets is that fish captured in the nets were actually entrained and did not simply swim into the net having never passed AFD. Those determining net placement and design would consider this issue in an effort to minimize any such bias. Netting combined with hydroacoustic sampling of the turbine intakes would allow for some evaluation of this potential bias. Comparative hydroacoustic and netting studies (e.g., Ransom et al. 1996) have found strong correlations between entrainment estimates using both methods. If hydroacoustic data and fish-capture data were inconsistent it could suggest “swim-ins” are biasing the entrainment data. However, if hydroacoustics and net-capture data are strongly correlated it would suggest this type of sample bias is minimal.
An additional assumption of turbine-outlet sampling is that the randomly selected turbine unit exit is representative of the other exits in terms of fish passage, which could be deduced by first sampling with hydroacoustics to determine net location based on expected fish passage. Limitations also relate to the lethal sampling of fish using this method which minimizes the time and length of sampling that may be permitted and the number and duration of outages that might be allowed to accomplish this work. Limitations on sampling will require greater extrapolation and may reduce our precision of fish entrainment estimates. The risk of potential damage to nets caused by accumulation of aquatic vegetation in late summer and fall should also be considered.
Final Report
24
It is assumed that all necessary permits can be obtained to perform the work herein. These permits may include:
• Permit to install spillway netting structure to substrate of Pend Oreille River.
• Collection/sampling/take permit from the U.S. Fish and Wildlife Service (USFWS Section 10 Native Threatened Species Recovery Permit for bull trout) and Idaho Department of Fish and Game (Application for Scientific Banding, Collecting, or Possession Permit for all species collected).
Lastly, the cost estimates are considered a scoping level estimate, which have a higher level of uncertainty than obtaining a competitive bid to complete the study. Cost estimates cannot be finalized until a final and approved design and study plan has been accepted and agreed upon. To mitigate the inherent uncertainty around this cost estimate, a 30% contingency has been factored into the netting cost estimates.
3.1.6 Expected Results and Applicability
The results of direct-capture sampling would provide information about species composition, abundance, and the age or size class being entrained through the spillway and powerhouse at AFD. The extrapolation of capture data, using appropriate statistical analysis, would provide estimates of species, size, and numbers entrained through the AFD spillway and powerhouse. Combined with hydroacoustic results, the direct-capture information could be used to estimate total numbers of fish being entrained at AFD.
3.2 Hydroacoustics
The project research objectives could be addressed by applying scientific hydroacoustic techniques using single- and split-beam transducers deployed in fixed locations. Fixed-location hydroacoustic techniques, explained in general by Thorne and Johnson (1993) and in detail by Ploskey et al. (2003, 2005), could be used to estimate fish-passage rates at AFD. Transducer sampling volumes would be strategically placed to minimize ambiguity in ultimate fish-passage routes and maximize the potential for multiple detections. The hydroacoustic method would provide detailed data, i.e., high temporal and spatial resolution, on fish-passage rates and distributions for both descriptive and comparative purposes.
Fixed-location hydroacoustics is good for estimating fish-passage rates into portals at dams because it has high sampling intensity and is non-obtrusive. A disadvantage of this method is its inability to identify species, which is why direct-capture sampling methods paired with hydroacoustic estimates is a more holistic option compared to using hydroacoustic estimates alone. Hydroacoustics has provided useful information to the USACE and fisheries managers for many studies conducted at Columbia, Snake, and most recently Willamette River dams. Some example topics over the last 25 years include spill passage efficiency, fish guidance efficiency, horizontal and vertical distribution, seasonal and diel distribution, surface flow outlet efficiency, and turbine operations (Johnson et al. 1992, 2005; Ploskey et al. 2009). Therefore, we believe hydroacoustics is a valid approach to addressing fish-passage objectives at AFD.

Final Report
25
In general, a hydroacoustic system consists of an echosounder, cables, transducers, an oscilloscope, and a computer system with the necessary operating software. Echosounders and computers would be plugged into uninterruptible power supplies. An echosounder generates electric signals of a specific frequency and amplitude at the required pulse durations and repetition rates. Cables conduct and transmit signals from the echosounder to transducers. Transducers convert the electric voltages into mechanical energy by deforming the transducers piezoelectric ceramic disk, thus generating sound energy. This sound energy signal is transmitted into the water. When this energy signal comes in contact with a medium of a different density than the water, a portion of the energy is reflected back to the transducer. This received energy again distorts the piezoelectric ceramic disk and the signal is converted back into an electric voltage and transmitted back through the cable to the echosounder and to the computer where the characteristics of the returned voltage are recorded to a file on the hard drive. The oscilloscopes are used to display echo voltages and calibration tones as a function of time. The oscilloscopes are also used for system monitoring and troubleshooting of issues.
Fish-passage data that can be obtained through non-obtrusive hydroacoustic sampling methods include, but are not limited to the following:
• seasonal and diel juvenile-size1 and adult-size2 fish-passage rates
• route distribution and effectiveness for each of the major passage routes relative to total-project passage
• analysis of the relationships between daily fish passage and Julian day, total-project discharge, forebay elevation, forebay elevation delta, and water temperature
• estimation of the vertical distribution for juvenile-size fish in the forebay near the upstream face of the powerhouse
• estimation of the acoustic sizes of fish passing the dam by season or other specified time periods.
3.2.1 Implementation Plan
The general approach involved in deploying hydroacoustics on a broad scale is a four-step process from mount design to final system configuration:
1. Choose a mount design. Mount designs successfully used for previous hydroacoustic deployments in the Willamette River Basin (Khan et al. 2012a, b), which were reviewed and approved by USACE engineers and project personnel and met strict structural integrity standards, would be a good starting point in determining optimal design. Mount design will vary by location and specific objectives.
2. Perform field trials to perfect the mount design.
3. Deploy transducers and test aiming angles and ping rates in the field.
4. Establish an optimum configuration for each hydroacoustic system.
1 For the purpose of this document, juvenile-size fish will be defined as ranging from 75 to 299 mm. The lengths
are approximations based on acoustic target strength (Love 1977). 2 For the purpose of this document, adult-size fish will be defined as ranging from 300 to 800 mm. The lengths are
approximations based on acoustic target strength (Love 1977).
Final Report
26
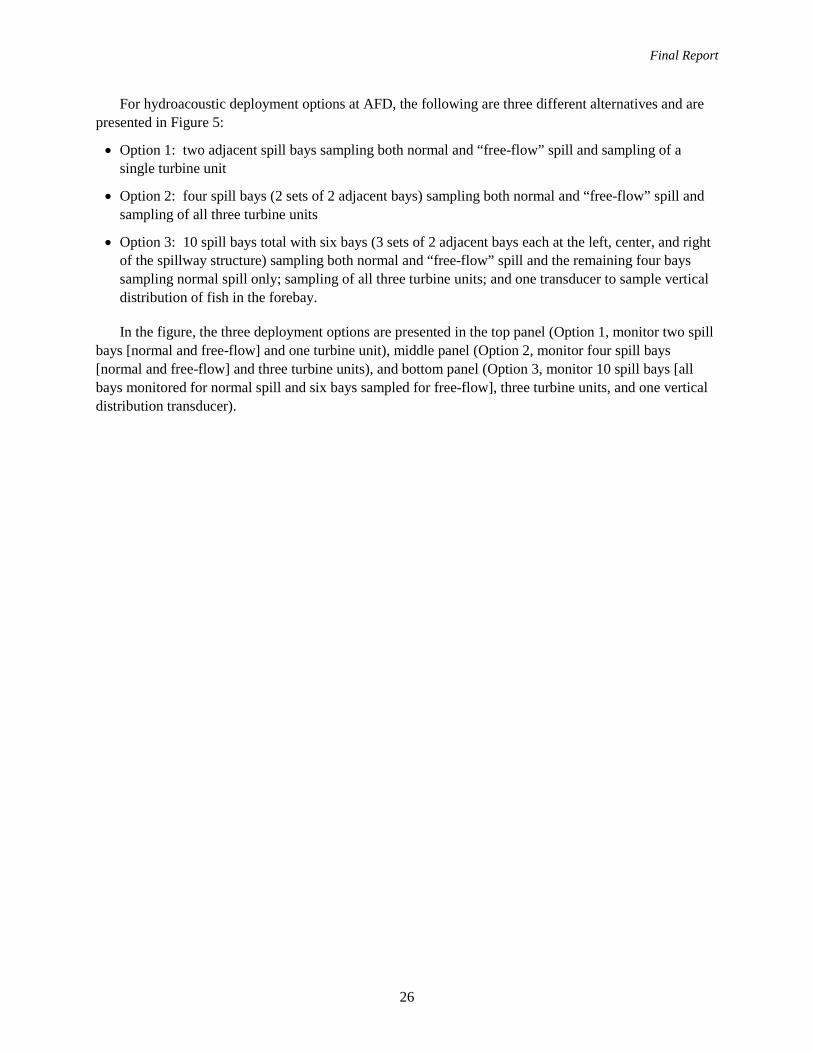
For hydroacoustic deployment options at AFD, the following are three different alternatives and are presented in Figure 5:
• Option 1: two adjacent spill bays sampling both normal and “free-flow” spill and sampling of a single turbine unit
• Option 2: four spill bays (2 sets of 2 adjacent bays) sampling both normal and “free-flow” spill and sampling of all three turbine units
• Option 3: 10 spill bays total with six bays (3 sets of 2 adjacent bays each at the left, center, and right of the spillway structure) sampling both normal and “free-flow” spill and the remaining four bays sampling normal spill only; sampling of all three turbine units; and one transducer to sample vertical distribution of fish in the forebay.
In the figure, the three deployment options are presented in the top panel (Option 1, monitor two spill bays [normal and free-flow] and one turbine unit), middle panel (Option 2, monitor four spill bays [normal and free-flow] and three turbine units), and bottom panel (Option 3, monitor 10 spill bays [all bays monitored for normal spill and six bays sampled for free-flow], three turbine units, and one vertical distribution transducer).
Final Report
27
Figure 5. Plan view of Albeni Falls Dam showing proposed sampling locations for transducers for the
three potential sampling options. The finalized spill bays to be studied would be decided after an analysis of priority dam spillway operations. Red triangles represent 10-deg single-beam transducers for sampling bays during normal bottom draw spill operations. Blue triangles represent 10-deg single-beam transducers for sampling bays during “free-flow” spill operations. Split-beam transducers for sampling the turbine units and select spill bays during normal spill operations are represented as yellow triangles. One 6-deg single-beam transducer would be used for sampling vertical distribution of fish in the forebay near the powerhouse (orange triangle).
Final Report
28
Data collection using a BlueView underwater sonar (or another similar technology) is a supplemental task that would further inform hydroacoustics results for any of the three options above that may be chosen by the USACE. Details about the underwater sonar camera are provided in Section 3.3.
3.2.1.1 Spillway
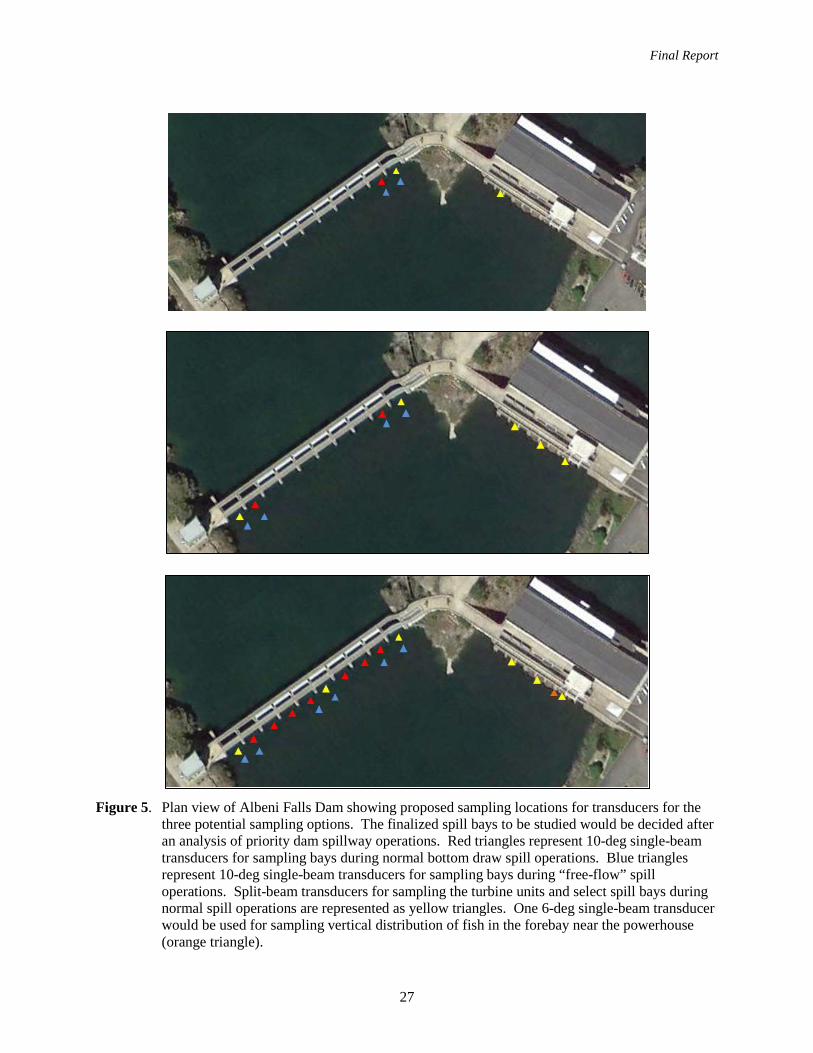
For the spillway, up to ten 10-deg single- and split- beam transducers in spill bays 1–10 (Figure 5; yellow and red triangles) could be deployed at an approximate elevation of approximately 2028 ft mean sea level (MSL) using divers. These transducers would be optimally aimed to sample normal spill operations during the study period. In select bays, up to six 10-deg single-beam transducers would sample during “free-flow” operations if such operations occur during the study period (Figure 5; blue triangles). The total number and location of transducers deployed would depend on the deployment option selected for implementation (Options 1–3). The transducer mount for the regular spill bays consists of a triangular base that attaches to the concrete face of the dam with concrete anchors (Figure 6). A stanchion with a right-angle bracket would be welded to the base. A stainless steel cage(s) containing a single- or split- beam transducer would be attached to the bracket. One or two underwater mounts can accommodate up to four transducers and therefore sample two bays simultaneously (Figure 7). To account for both “normal” and “free-flow” spill operations, 10-deg transducers are ideal to ensure the largest volume of water can be sampled for the two differing spill types. The optimal aiming angle of all spillway-mounted transducers is to be determined.
Figure 6. Example of single-beam transducer mount that could be used at spill bays.
Final Report
29
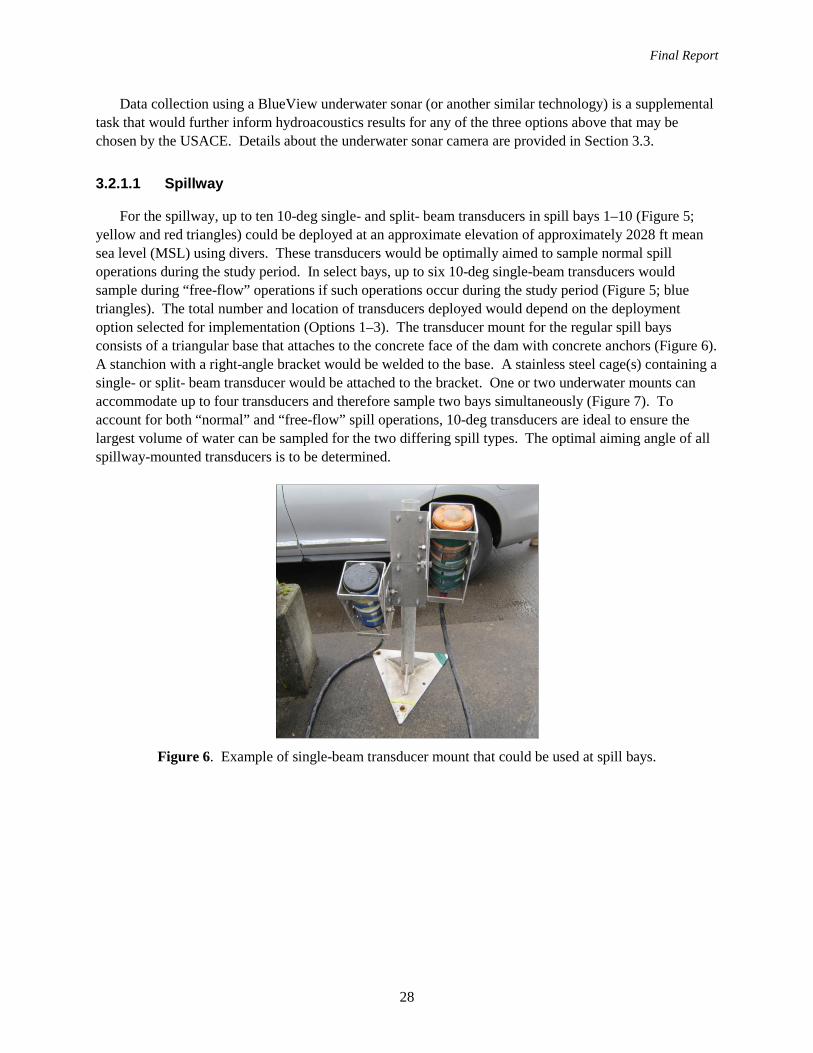
Figure 7. Single-beam transducer deployment location with two 10-deg “side-looking” transducers
optimally aimed for sampling during normal spill operations (red) and two 10-deg transducers optimally aimed to sample during “free-flow” operations (blue). Drawing is not to scale. Original drawing courtesy of the USACE.
3.2.1.2 Powerhouse
For the turbine units, up to three 6-deg split-beam transducers could be mounted at an approximate elevation of 2038 ft MSL. Deployment in the three turbine units would be randomized to ensure fish-passage bias estimates for the powerhouse is minimized. The transducers would be installed on a retractable mount and lowered into the service gate slot ~40 ft upstream of the turbine (Figure 8) or attached to the service gate and lowered into the slot. The optimal angle of deployment has yet to be determined but the sampling volume would need to be immediately upstream of the wicket gates of each turbine to ensure the maximum likelihood of fish sampled in the acoustic beam are moving into and passing the turbine. Split-beam transducers allow for a two-dimensional (2D) analysis, which will allow accounting for all fish moving through the acoustic beam and into the turbine, and also for those moving back upstream and away from the turbine. Even if most fish are distributed near the ceiling of the scroll case, a representative proportion should pass through the sample beam of the transducer.
Final Report
30
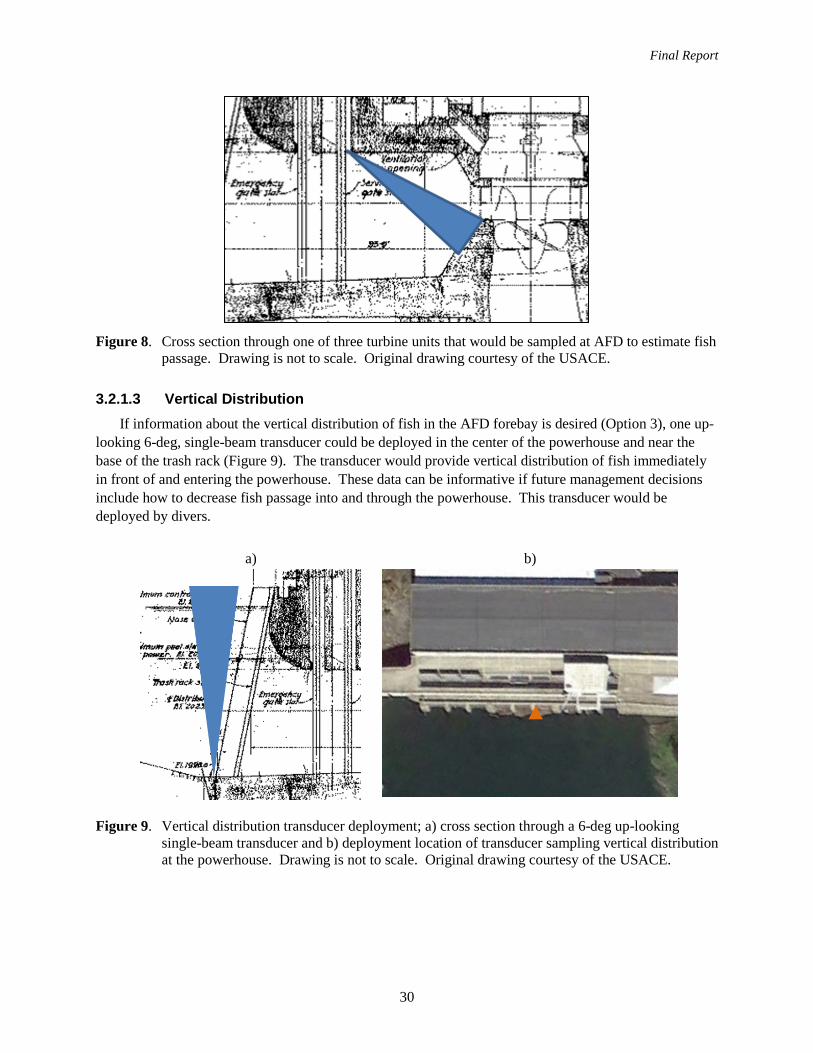
Figure 8. Cross section through one of three turbine units that would be sampled at AFD to estimate fish
passage. Drawing is not to scale. Original drawing courtesy of the USACE.
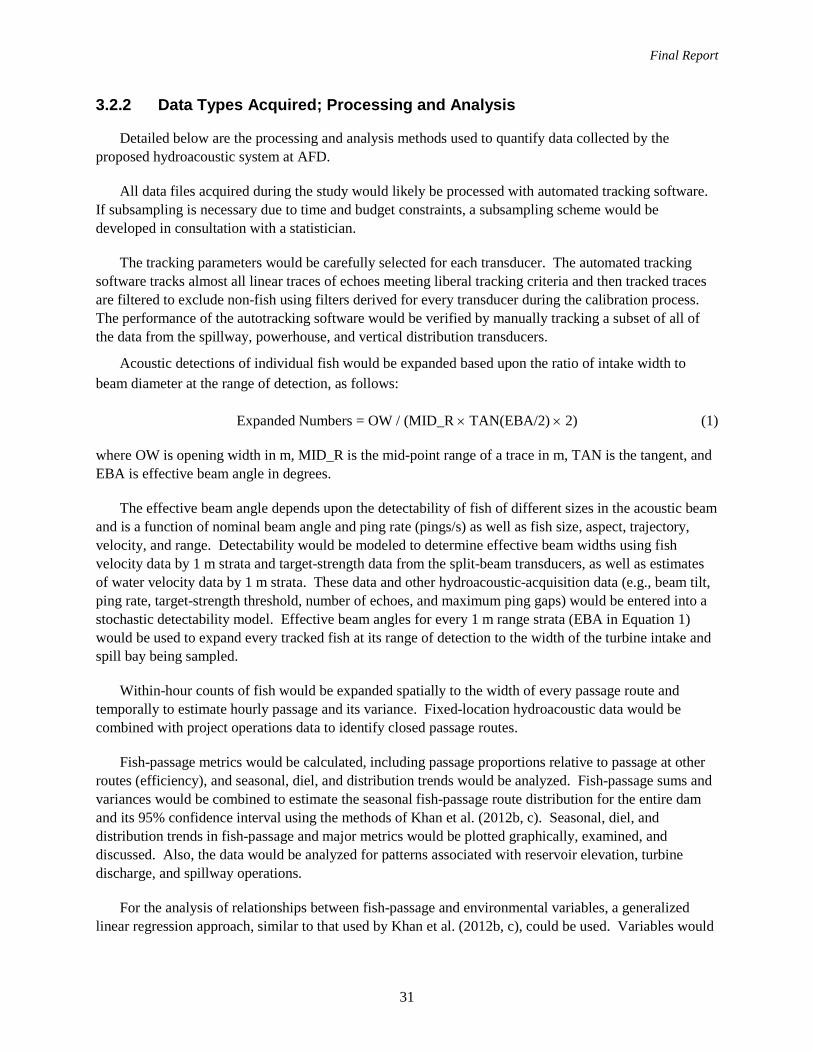
3.2.1.3 Vertical Distribution If information about the vertical distribution of fish in the AFD forebay is desired (Option 3), one up-
looking 6-deg, single-beam transducer could be deployed in the center of the powerhouse and near the base of the trash rack (Figure 9). The transducer would provide vertical distribution of fish immediately in front of and entering the powerhouse. These data can be informative if future management decisions include how to decrease fish passage into and through the powerhouse. This transducer would be deployed by divers.
a)
b)
Figure 9. Vertical distribution transducer deployment; a) cross section through a 6-deg up-looking single-beam transducer and b) deployment location of transducer sampling vertical distribution at the powerhouse. Drawing is not to scale. Original drawing courtesy of the USACE.
Final Report
31
3.2.2 Data Types Acquired; Processing and Analysis
Detailed below are the processing and analysis methods used to quantify data collected by the proposed hydroacoustic system at AFD.
All data files acquired during the study would likely be processed with automated tracking software. If subsampling is necessary due to time and budget constraints, a subsampling scheme would be developed in consultation with a statistician.
The tracking parameters would be carefully selected for each transducer. The automated tracking software tracks almost all linear traces of echoes meeting liberal tracking criteria and then tracked traces are filtered to exclude non-fish using filters derived for every transducer during the calibration process. The performance of the autotracking software would be verified by manually tracking a subset of all of the data from the spillway, powerhouse, and vertical distribution transducers.
Acoustic detections of individual fish would be expanded based upon the ratio of intake width to beam diameter at the range of detection, as follows:
Expanded Numbers = OW / (MID_R × TAN(EBA/2) × 2) (1)
where OW is opening width in m, MID_R is the mid-point range of a trace in m, TAN is the tangent, and EBA is effective beam angle in degrees.
The effective beam angle depends upon the detectability of fish of different sizes in the acoustic beam and is a function of nominal beam angle and ping rate (pings/s) as well as fish size, aspect, trajectory, velocity, and range. Detectability would be modeled to determine effective beam widths using fish velocity data by 1 m strata and target-strength data from the split-beam transducers, as well as estimates of water velocity data by 1 m strata. These data and other hydroacoustic-acquisition data (e.g., beam tilt, ping rate, target-strength threshold, number of echoes, and maximum ping gaps) would be entered into a stochastic detectability model. Effective beam angles for every 1 m range strata (EBA in Equation 1) would be used to expand every tracked fish at its range of detection to the width of the turbine intake and spill bay being sampled.
Within-hour counts of fish would be expanded spatially to the width of every passage route and temporally to estimate hourly passage and its variance. Fixed-location hydroacoustic data would be combined with project operations data to identify closed passage routes.
Fish-passage metrics would be calculated, including passage proportions relative to passage at other routes (efficiency), and seasonal, diel, and distribution trends would be analyzed. Fish-passage sums and variances would be combined to estimate the seasonal fish-passage route distribution for the entire dam and its 95% confidence interval using the methods of Khan et al. (2012b, c). Seasonal, diel, and distribution trends in fish-passage and major metrics would be plotted graphically, examined, and discussed. Also, the data would be analyzed for patterns associated with reservoir elevation, turbine discharge, and spillway operations.
For the analysis of relationships between fish-passage and environmental variables, a generalized linear regression approach, similar to that used by Khan et al. (2012b, c), could be used. Variables would
Final Report
32
be selected using a best subsets approach and ranking of models based upon Akaike Information Criteria (Anderson et al. 1994).
3.2.3 Project Impacts and Support
This project will require coordination between the research entity performing the research and staff with the AFD and USACE District office, as detailed below.
Deployment of hydroacoustic gear may require collaboration with other research that is ongoing at AFD, including the radio telemetry study being conducted by the KTI and PNNL (as of December 2014). However, because hydroacoustic equipment would be spatially isolated from the radio telemetry equipment (in the water vs. above water, respectively), there would likely be little concern about interference between the studies.
The transducers for monitoring fish passage at the spillway would have to be installed and removed by divers. This would require a dive safety program and could involve unit outages. All diving and boat operations would occur only after receiving approval from the USACE regarding the safety of the procedures and equipment. The dive contractor would be required to conduct operations from a dive platform (boat) in the forebay for spillway deployment and the transducer sampling vertical distribution at the powerhouse. A safety boat would also be required.
Split-beam transducers deployed at the powerhouse would require coordination with project staff to either allow for deployment of a mount deployed in the service gate slot or on the service gate itself that is lowered into the slot.
The USACE and AFD staff would have to coordinate the necessary unit outages for all dive work. Any special operations (to be determined) required for the study (for example, unit and spill bay outages or manipulations) would also be coordinated with the USACE and project staff before the work would begin.
Mobile equipment trailers would have to be placed on the spillway and powerhouse decks to store hydroacoustic equipment if space to house equipment is not available at the project. This would require space for the trailers and adequate power to operate all computers, sounders, etc. Alternatively, hydroacoustic gear could be routed to and stored within the new storage warehouse located on the mid-dam island.
All of the hydroacoustic equipment necessary for this study is currently owned by PNNL and thus would not need to be purchased or borrowed by the USACE if PNNL conducts the study and if sufficient equipment is available (i.e., not being used by another study). However, this study as proposed may require the purchase of some additional equipment, and the replacement of broken cables or computer parts may also be necessary.
Coordination of turbine outages would be required both locally, with AFD staff, and with the BPA to install hydroacoustic equipment; however, the total hours of outage will likely be low (<1 day). The BPA requires that coordination begin at least 30 days to agree on an outage, and the real-time operations center of BPA requires 72 hours of notice prior to any actual turbine outage.
Final Report
33
3.2.4 Cost
Costs for the options of this alternative were based on PNNL rates and are only meant to give a relative idea of cost for comparison with other alternatives; actual cost estimates would be provided by the contractor(s) performing the study. Changes in scope from that outlined above would change the relative cost. The relative cost values below for each option assume a dive contractor cost of ~$30K, ~$50K, and ~$70K for Options 1, 2, and 3, respectively. However, divers are typically contracted directly by the USACE to avoid PNNL overhead rates (i.e., reduce project cost). It is important to note that as the total number of transducers deployed increases, the cost per transducer goes down. This indicates a cost savings related to the level of effort for installing additional transducers and analyzing the additional data. The cost of the hydroacoustic deployment and monitoring also assumes 5, 11, and 20 transducers for Options 1, 2, and 3, respectively for a 365-day period. Relative cost value of a second year of hydroacoustic data collection is also included and is much cheaper assuming that gear would be installed in year 1; diving costs are included also assuming that repairs may need to be made. Equipment uninstallation costs are included in the Year 1 cost estimates.
Relative cost values are presented so that the various study alternatives can be compared and contrasted based on relative cost. A relative cost value of “1” equates to the study alternative with the lowest estimated cost. A relative cost value of “3” would be approximately three times the cost of the alternative with a relative cost of 1.
Option Year 1 Relative Cost
Value (diving included) Year 2 Relative Cost
Value Cost per Transducer 1 ~2.75 ~50% of Year 1 cost $$$ (most expensive) 2 ~3.75 ~50% of Year 1 cost $$ 3 ~5.5 ~45% of Year 1 cost $ (least expensive)
3.2.5 Assumptions and Limitations
Applying fixed-location hydroacoustic techniques at a new location always requires diligence and adaptive management to successfully conduct a study. The initial deployment and testing of hydroacoustic equipment would be very useful in identifying any limitations of the technology and approaches to minimize or eliminate any sampling bias or other issues. For example, during free-flow spill, the possibility exists for transducers sampling the spillway to have reduced detection efficiency as noise increases, due to air bubbles, debris, turbulence, etc. Further refinement of system settings would be required as operational patterns change.
A limitation of hydroacoustics technology is that it is not able to appropriately identify fish fry because of their small size. Another limitation of hydroacoustics is its inability to identify species of fish detected; however, the ability exists to filter candidate fish by target strength and any direct-capture data available can be used to verify hydroacoustic targets.
3.2.6 Expected Results and Applicability
Fixed-location hydroacoustics is appropriate for estimating fish-passage rates into portals at dams because it has high sampling intensity and is non-obtrusive. Hydroacoustics has provided useful information to the USACE and fisheries managers over many studies at Columbia and Snake River dams.
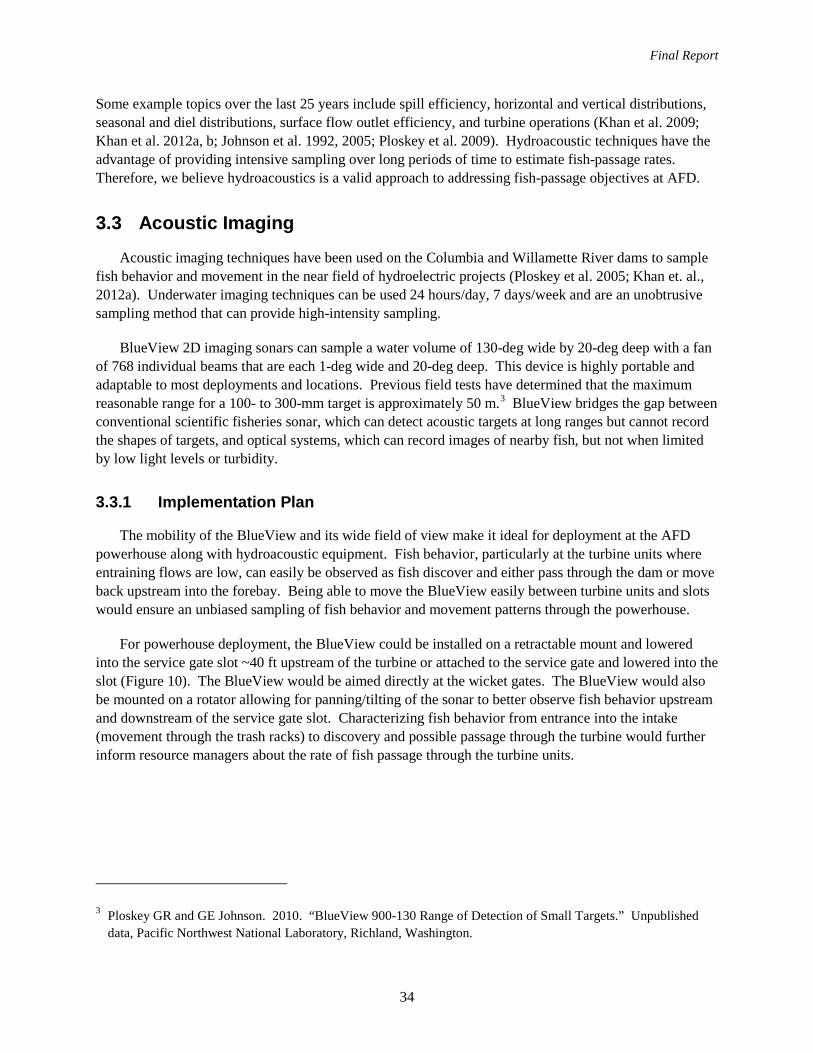
Final Report
34
Some example topics over the last 25 years include spill efficiency, horizontal and vertical distributions, seasonal and diel distributions, surface flow outlet efficiency, and turbine operations (Khan et al. 2009; Khan et al. 2012a, b; Johnson et al. 1992, 2005; Ploskey et al. 2009). Hydroacoustic techniques have the advantage of providing intensive sampling over long periods of time to estimate fish-passage rates. Therefore, we believe hydroacoustics is a valid approach to addressing fish-passage objectives at AFD.
3.3 Acoustic Imaging
Acoustic imaging techniques have been used on the Columbia and Willamette River dams to sample fish behavior and movement in the near field of hydroelectric projects (Ploskey et al. 2005; Khan et. al., 2012a). Underwater imaging techniques can be used 24 hours/day, 7 days/week and are an unobtrusive sampling method that can provide high-intensity sampling.
BlueView 2D imaging sonars can sample a water volume of 130-deg wide by 20-deg deep with a fan of 768 individual beams that are each 1-deg wide and 20-deg deep. This device is highly portable and adaptable to most deployments and locations. Previous field tests have determined that the maximum reasonable range for a 100- to 300-mm target is approximately 50 m.3 BlueView bridges the gap between conventional scientific fisheries sonar, which can detect acoustic targets at long ranges but cannot record the shapes of targets, and optical systems, which can record images of nearby fish, but not when limited by low light levels or turbidity.
3.3.1 Implementation Plan
The mobility of the BlueView and its wide field of view make it ideal for deployment at the AFD powerhouse along with hydroacoustic equipment. Fish behavior, particularly at the turbine units where entraining flows are low, can easily be observed as fish discover and either pass through the dam or move back upstream into the forebay. Being able to move the BlueView easily between turbine units and slots would ensure an unbiased sampling of fish behavior and movement patterns through the powerhouse.
For powerhouse deployment, the BlueView could be installed on a retractable mount and lowered into the service gate slot ~40 ft upstream of the turbine or attached to the service gate and lowered into the slot (Figure 10). The BlueView would be aimed directly at the wicket gates. The BlueView would also be mounted on a rotator allowing for panning/tilting of the sonar to better observe fish behavior upstream and downstream of the service gate slot. Characterizing fish behavior from entrance into the intake (movement through the trash racks) to discovery and possible passage through the turbine would further inform resource managers about the rate of fish passage through the turbine units.
3 Ploskey GR and GE Johnson. 2010. “BlueView 900-130 Range of Detection of Small Targets.” Unpublished data, Pacific Northwest National Laboratory, Richland, Washington.
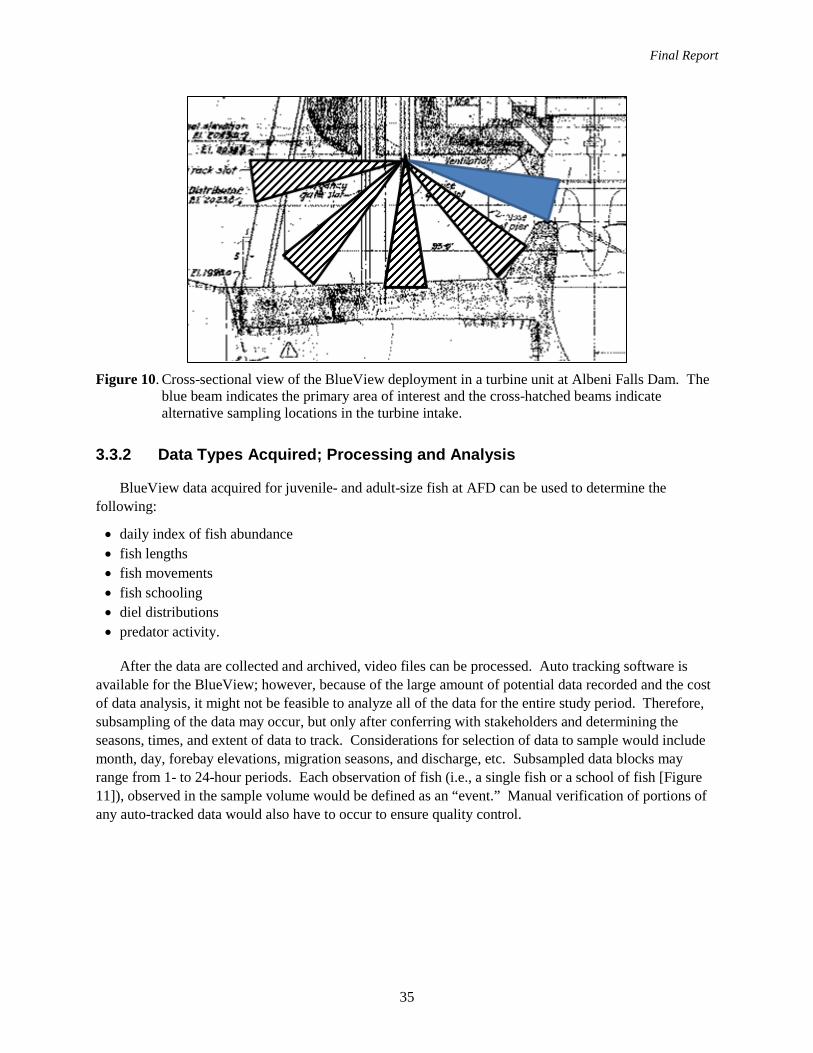
Final Report
35
Figure 10. Cross-sectional view of the BlueView deployment in a turbine unit at Albeni Falls Dam. The
blue beam indicates the primary area of interest and the cross-hatched beams indicate alternative sampling locations in the turbine intake.
3.3.2 Data Types Acquired; Processing and Analysis
BlueView data acquired for juvenile- and adult-size fish at AFD can be used to determine the following:
• daily index of fish abundance • fish lengths • fish movements • fish schooling • diel distributions • predator activity.
After the data are collected and archived, video files can be processed. Auto tracking software is available for the BlueView; however, because of the large amount of potential data recorded and the cost of data analysis, it might not be feasible to analyze all of the data for the entire study period. Therefore, subsampling of the data may occur, but only after conferring with stakeholders and determining the seasons, times, and extent of data to track. Considerations for selection of data to sample would include month, day, forebay elevations, migration seasons, and discharge, etc. Subsampled data blocks may range from 1- to 24-hour periods. Each observation of fish (i.e., a single fish or a school of fish [Figure 11]), observed in the sample volume would be defined as an “event.” Manual verification of portions of any auto-tracked data would also have to occur to ensure quality control.
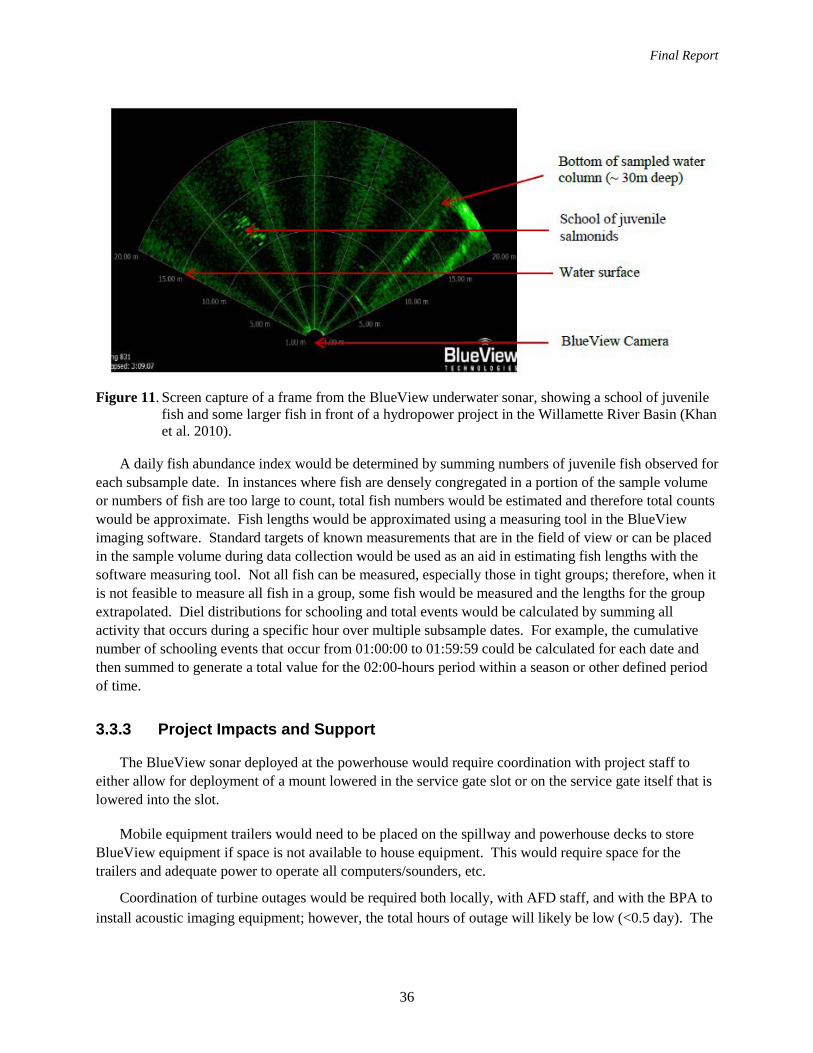
Final Report
36
Figure 11. Screen capture of a frame from the BlueView underwater sonar, showing a school of juvenile
fish and some larger fish in front of a hydropower project in the Willamette River Basin (Khan et al. 2010).
A daily fish abundance index would be determined by summing numbers of juvenile fish observed for each subsample date. In instances where fish are densely congregated in a portion of the sample volume or numbers of fish are too large to count, total fish numbers would be estimated and therefore total counts would be approximate. Fish lengths would be approximated using a measuring tool in the BlueView imaging software. Standard targets of known measurements that are in the field of view or can be placed in the sample volume during data collection would be used as an aid in estimating fish lengths with the software measuring tool. Not all fish can be measured, especially those in tight groups; therefore, when it is not feasible to measure all fish in a group, some fish would be measured and the lengths for the group extrapolated. Diel distributions for schooling and total events would be calculated by summing all activity that occurs during a specific hour over multiple subsample dates. For example, the cumulative number of schooling events that occur from 01:00:00 to 01:59:59 could be calculated for each date and then summed to generate a total value for the 02:00-hours period within a season or other defined period of time.
3.3.3 Project Impacts and Support
The BlueView sonar deployed at the powerhouse would require coordination with project staff to either allow for deployment of a mount lowered in the service gate slot or on the service gate itself that is lowered into the slot.
Mobile equipment trailers would need to be placed on the spillway and powerhouse decks to store BlueView equipment if space is not available to house equipment. This would require space for the trailers and adequate power to operate all computers/sounders, etc.
Coordination of turbine outages would be required both locally, with AFD staff, and with the BPA to install acoustic imaging equipment; however, the total hours of outage will likely be low (<0.5 day). The
Final Report
37
BPA requires that coordination begin at least 30 days to agree on an outage, and the real-time operations center of BPA requires 72 hours of notice prior to any actual turbine outage.
3.3.4 Cost
Costs for this alternative were based on PNNL rates and are only meant to give a relative idea of cost for comparison with other alternatives; actual cost estimates would be provided by the contractor(s) performing the study. Changes in scope from that outlined above would change the relative cost. The cost value below assumes the total cost for deployment of one BlueView sonar as well as monitoring, analysis, and reporting the sonar data at AFD for a 365-day period. Equipment uninstallation costs are included in the Year 1 estimate; Year 2 cost estimate is also provided in case acoustic imaging is used in consecutive years.
Relative cost values are presented so that the various study alternatives can be compared and contrasted based on relative cost. A relative cost value of “1” equates to the study alternative with the lowest estimated cost. A relative cost value of “3” would be approximately three times the cost of the alternative with a relative cost of 1.
Relative cost value for Year 1 = 1 (Year 2 costs ~70% of Year 1 costs, if desired)
3.3.5 Assumptions and Limitations
Because of the large amount of data recorded by the BlueView camera, it may not be possible to analyze all recorded files. Instead, subsamples of data ranging from 1 to 4 hours may have to be processed by replaying the recordings and examining them for fish activities.
3.3.6 Expected Results and Applicability
BlueView underwater sonar is appropriate for determining discovery and entrainment rates into portals at AFD because it has the ability to orient directly at the wicket gates and is non-obtrusive. BlueView sonar has provided useful information to the USACE and fisheries in the Willamette River Basin (Khan et al. 2012a). Therefore, we believe the BlueView sonar is a valid approach to address fish-passage objectives at AFD.
3.4 Mark-Recapture
A mark-recapture study could be used to evaluate fish entrainment at AFD. Several marking technologies could potentially be used, including acoustic or radio telemetry or more conventional and less-expensive, marking techniques (e.g., passive integrated transponder [PIT] tags or externally visible tags such as Floy tags or Visible Implant [VI] tags). Fish would be captured upstream of AFD and affixed with an inexpensive tag or a telemetry transmitter in combination with an inexpensive tag. Sampling would also occur in the AFD tailrace to recapture tagged fish to estimate probabilities of entrainment through the dam. Telemetry could identify the route of passage at either a macro-scale (e.g., spillway versus powerhouse) or at a micro-scale (i.e., through each of the 10 spill bays and three turbine units). Telemetry would also allow the estimation of emigration from the study area, which would allow
Final Report
38
the calculation of a more accurate estimate of entrainment rate. Use of telemetry would be relatively inexpensive to implement if only a subset of marked fish were also implanted with a transmitter. Telemetry would allow high detection probability through AFD and would supplement entrainment information from the more abundant, inexpensively tagged fish.
A radio telemetry system is already deployed at AFD and thus no additional installation or purchasing of telemetry equipment would be required if radio telemetry were used. However, the current system is only configured to differentiate passage of radio-tagged fish through the spillway or powerhouse; route-specific passage through the 10 spill bays or three turbines is currently not possible, but could be deployed if desired. Alternatively, using acoustic telemetry such as the Juvenile Salmon Acoustic Telemetry System (JSATS) would likely be the best telemetry method possible because it would detect fish in three dimensions through each potential route of passage at AFD with high accuracy, and could additionally be used to calculate survival rates through each passage route; however, it would be relatively expensive compared to radio telemetry because a receiver network does not currently exist at AFD. Consequently, a study plan using JSATS is not covered in this plan, but PNNL is able to provide a study plan alternative with this information in the future, if desired.
3.4.1 Implementation Plan
The proposed methods and assumptions of a study plan to evaluate fish entrainment at AFD using mark-recapture are outlined below.
3.4.1.1 Capture, Tagging, and Recapture
A combination of electrofishing or netting would be used to capture study fish in the forebay of AFD—fish that are most likely to be either volitionally or non-volitionally entrained. All fish captured would be affixed with an inexpensive marking technique that identifies individuals unique to the study. If information about individuals is not desired, a batch-marking technique could be used (e.g., Visible Implant Elastomer or Floy tags). Or, if individual information is desired, an individually identifiable technology could be used (e.g., Visible Implant Alpha system, individually identifiable Floy tags, or PIT tags). A subset of fish of each species would also be implanted with a telemetry transmitter. Currently, a Lotek radio telemetry system is installed and operational at AFD; thus, it is assumed for the purposes of this study plan that Lotek-compatible transmitters would be implanted in study fish to minimize project cost.
Telemetry study fish would be surgically implanted with transmitters so that tag burden (i.e., the weight of transmitter/weight of fish in air) would not exceed 6.7% based on previous research by Brown et al. (2010); however, this represents a maximum tag burden and if at all possible, tag burdens would be set as low as possible (ideally less than 3−4%). The exact ping rate and transmitter models would be determined based on the size of the fish expected to be tagged, and the tag life required to meet the study objectives. Ideally, three different telemetry transmitter sizes would be ordered to tag juvenile, subadult, and adult-sized fish. Ping rates would be chosen to maximize transmitter life so that as much information could be obtained about a fish as possible. Tag life greater than 1 year would be ideal in order to account for fish entrainment throughout the yearly life cycle of a fish; i.e., a fish may be present in the AFD forebay at one time, but may not desire to pass downstream of the dam until a different time of the year. Ping rates would be staggered to minimize the probability of code collisions (i.e., inability of receivers to
Final Report
39
detect codes due to overlapping waveforms) and maximize tag life. Although many recent studies evaluating entrainment at Federal Columbia River Power System require a minimum of 24 hours of post-surgery recovery time prior to releasing fish back into the wild (Axel et al. 2011), it is likely that study fish tagged at AFD would be immediately released following surgery and recovery from anesthesia (e.g., within 30 minutes of surgery) because holding the numbers of fish for a 24-hr recovery period would likely not be logistically feasible and sampling permits may preclude holding of endangered or threatened species.
Sampling to recapture tagged, entrained fish would occur in the tailrace of AFD. The length of tailrace to be sampled should be consistent with the distance that entrained fish may migrate downstream between recapture periods. The maximum expected distance that the farthest-migrating fish might move could be used to delineate the recapture zone. For example, if a bull trout were considered the most migratory fish and it would be expected that, following entrainment, they might move 2 miles within a 24-hour period (assuming a recapture frequency of once every 24 hours), then the 2 miles of river downstream of AFD could be sampled every 24 hours to maximize the probability of recapturing study fish.
3.4.1.2 Telemetry Detection
A Lotek radio telemetry system is currently installed at AFD to detect radio-tagged bull trout for an ongoing study of bull trout behavior in the Pend Oreille River Basin. Detection ranges at the dam include differentiable forebay and tailrace detection (Figure 12). The forebay detection zone does not specify specific locations, but only the immediate forebay to approximately 200 m upstream. Radio-transmitter detectability in the tailrace is more defined. Near-field detection zones are differentiable at the left and right sides of the powerhouse tailrace, the left bank of the powerhouse tailrace at mid-island, and the left and right sides of the spillway. Far-field detection zones in the tailrace include the mid-powerhouse tailrace, the downstream entrance to the powerhouse tailrace, and a zone extending from the immediate tailrace of the spillway and downstream past the confluence of the separate tailrace supplies.
Detection probability of the current receivers at AFD is near 100% and thus, it is likely not necessary for additional radio receivers to be deployed. Fish that are implanted with radio transmitters in the forebay would be detected moving downstream of the dam and could be assigned to either a powerhouse or spillway entrainment location based on the location of their last detection upstream and first detection downstream. If, however, it is desired that individual spill bays or individual turbines be differentiated, underwater radio antennas would need to be installed at each of these locations. However, due to the increased cost of adding this additional telemetry equipment, this deployment is not considered in this study alternative.
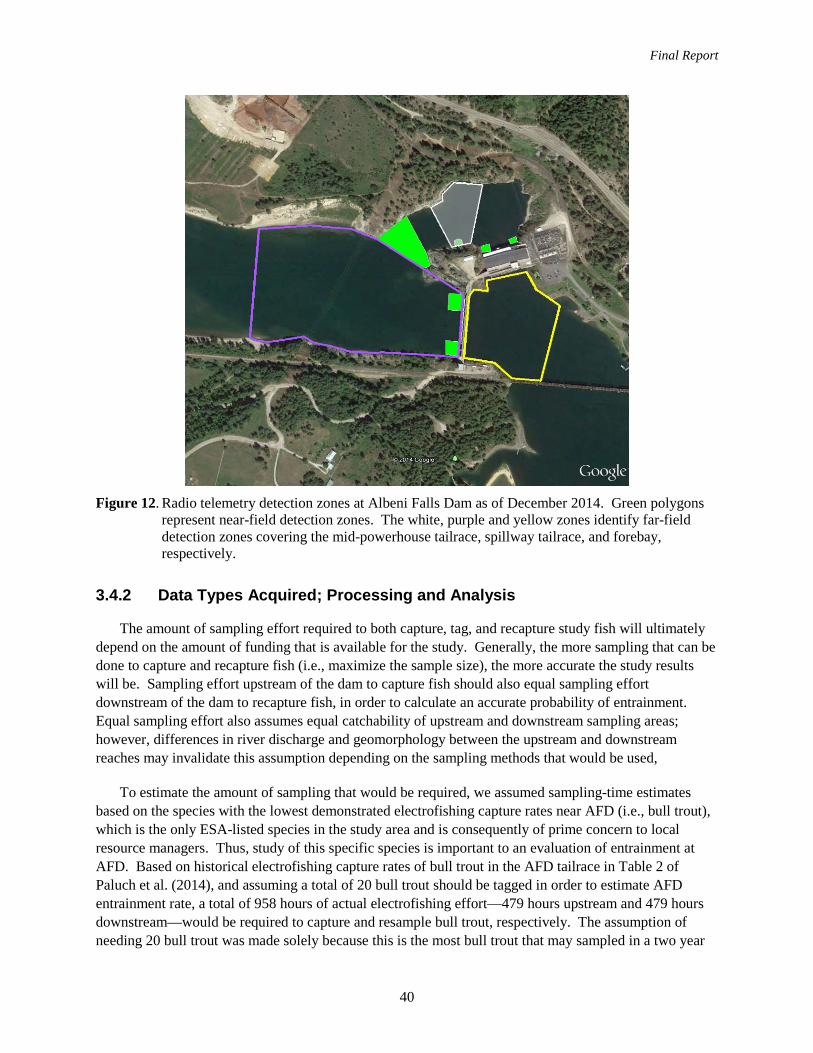
Final Report
40
Figure 12. Radio telemetry detection zones at Albeni Falls Dam as of December 2014. Green polygons
represent near-field detection zones. The white, purple and yellow zones identify far-field detection zones covering the mid-powerhouse tailrace, spillway tailrace, and forebay, respectively.
3.4.2 Data Types Acquired; Processing and Analysis
The amount of sampling effort required to both capture, tag, and recapture study fish will ultimately depend on the amount of funding that is available for the study. Generally, the more sampling that can be done to capture and recapture fish (i.e., maximize the sample size), the more accurate the study results will be. Sampling effort upstream of the dam to capture fish should also equal sampling effort downstream of the dam to recapture fish, in order to calculate an accurate probability of entrainment. Equal sampling effort also assumes equal catchability of upstream and downstream sampling areas; however, differences in river discharge and geomorphology between the upstream and downstream reaches may invalidate this assumption depending on the sampling methods that would be used,
To estimate the amount of sampling that would be required, we assumed sampling-time estimates based on the species with the lowest demonstrated electrofishing capture rates near AFD (i.e., bull trout), which is the only ESA-listed species in the study area and is consequently of prime concern to local resource managers. Thus, study of this specific species is important to an evaluation of entrainment at AFD. Based on historical electrofishing capture rates of bull trout in the AFD tailrace in Table 2 of Paluch et al. (2014), and assuming a total of 20 bull trout should be tagged in order to estimate AFD entrainment rate, a total of 958 hours of actual electrofishing effort—479 hours upstream and 479 hours downstream—would be required to capture and resample bull trout, respectively. The assumption of needing 20 bull trout was made solely because this is the most bull trout that may sampled in a two year
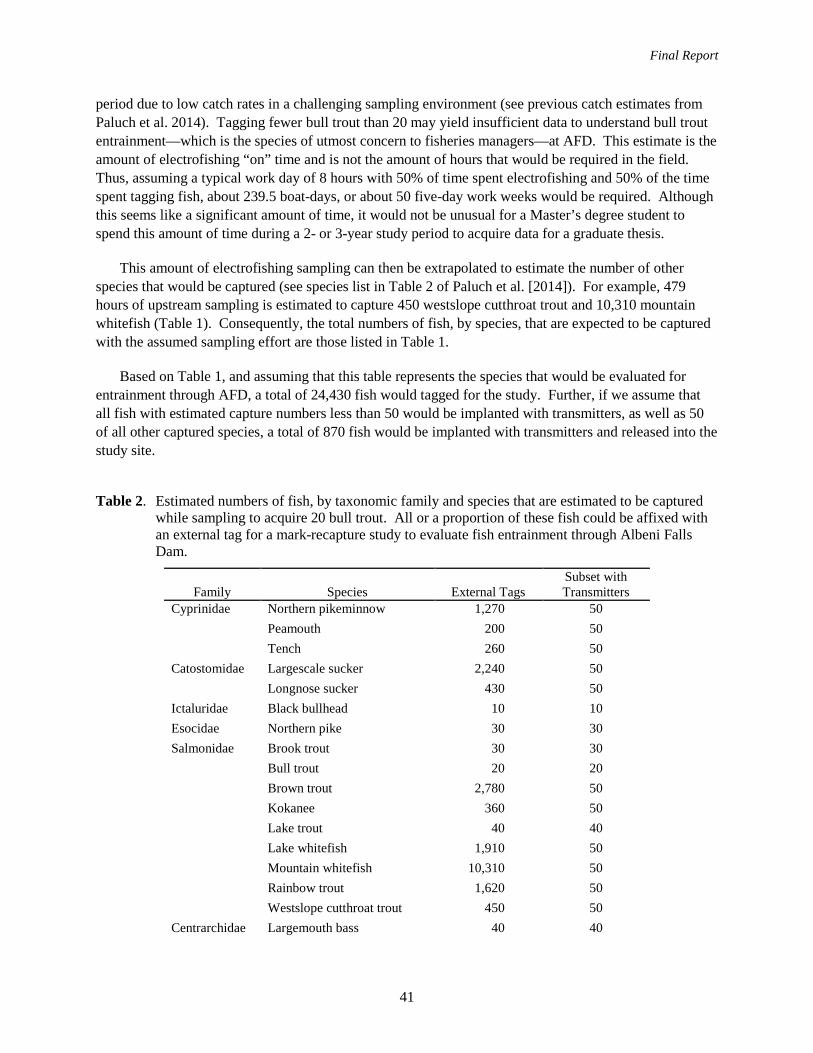
Final Report
41
period due to low catch rates in a challenging sampling environment (see previous catch estimates from Paluch et al. 2014). Tagging fewer bull trout than 20 may yield insufficient data to understand bull trout entrainment—which is the species of utmost concern to fisheries managers—at AFD. This estimate is the amount of electrofishing “on” time and is not the amount of hours that would be required in the field. Thus, assuming a typical work day of 8 hours with 50% of time spent electrofishing and 50% of the time spent tagging fish, about 239.5 boat-days, or about 50 five-day work weeks would be required. Although this seems like a significant amount of time, it would not be unusual for a Master’s degree student to spend this amount of time during a 2- or 3-year study period to acquire data for a graduate thesis.
This amount of electrofishing sampling can then be extrapolated to estimate the number of other species that would be captured (see species list in Table 2 of Paluch et al. [2014]). For example, 479 hours of upstream sampling is estimated to capture 450 westslope cutthroat trout and 10,310 mountain whitefish (Table 1). Consequently, the total numbers of fish, by species, that are expected to be captured with the assumed sampling effort are those listed in Table 1.
Based on Table 1, and assuming that this table represents the species that would be evaluated for entrainment through AFD, a total of 24,430 fish would tagged for the study. Further, if we assume that all fish with estimated capture numbers less than 50 would be implanted with transmitters, as well as 50 of all other captured species, a total of 870 fish would be implanted with transmitters and released into the study site.
Table 2. Estimated numbers of fish, by taxonomic family and species that are estimated to be captured while sampling to acquire 20 bull trout. All or a proportion of these fish could be affixed with an external tag for a mark-recapture study to evaluate fish entrainment through Albeni Falls Dam.
Family Species External Tags Subset with Transmitters
Cyprinidae Northern pikeminnow 1,270 50 Peamouth 200 50 Tench 260 50 Catostomidae Largescale sucker 2,240 50 Longnose sucker 430 50 Ictaluridae Black bullhead 10 10 Esocidae Northern pike 30 30 Salmonidae Brook trout 30 30 Bull trout 20 20 Brown trout 2,780 50 Kokanee 360 50 Lake trout 40 40 Lake whitefish 1,910 50 Mountain whitefish 10,310 50 Rainbow trout 1,620 50 Westslope cutthroat trout 450 50 Centrarchidae Largemouth bass 40 40
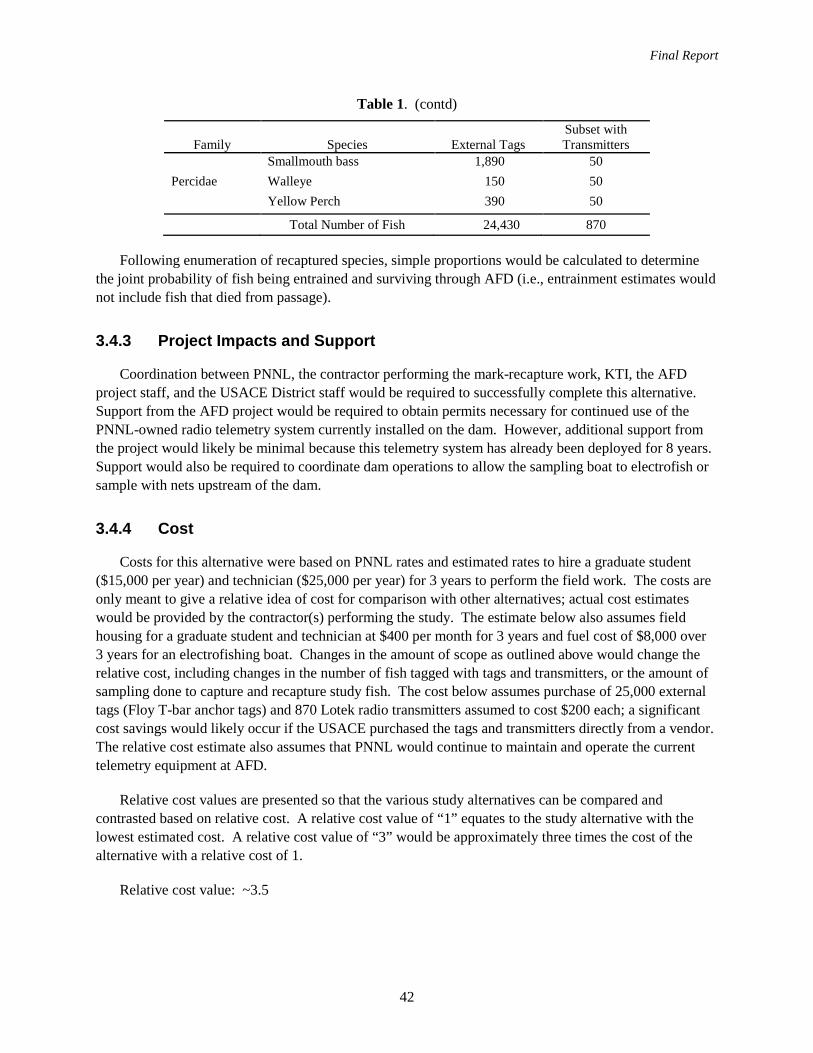
Final Report
42
Table 1. (contd)
Family Species External Tags Subset with Transmitters
Smallmouth bass 1,890 50 Percidae Walleye 150 50 Yellow Perch 390 50
Total Number of Fish 24,430 870
Following enumeration of recaptured species, simple proportions would be calculated to determine the joint probability of fish being entrained and surviving through AFD (i.e., entrainment estimates would not include fish that died from passage).
3.4.3 Project Impacts and Support
Coordination between PNNL, the contractor performing the mark-recapture work, KTI, the AFD project staff, and the USACE District staff would be required to successfully complete this alternative. Support from the AFD project would be required to obtain permits necessary for continued use of the PNNL-owned radio telemetry system currently installed on the dam. However, additional support from the project would likely be minimal because this telemetry system has already been deployed for 8 years. Support would also be required to coordinate dam operations to allow the sampling boat to electrofish or sample with nets upstream of the dam.
3.4.4 Cost
Costs for this alternative were based on PNNL rates and estimated rates to hire a graduate student ($15,000 per year) and technician ($25,000 per year) for 3 years to perform the field work. The costs are only meant to give a relative idea of cost for comparison with other alternatives; actual cost estimates would be provided by the contractor(s) performing the study. The estimate below also assumes field housing for a graduate student and technician at $400 per month for 3 years and fuel cost of $8,000 over 3 years for an electrofishing boat. Changes in the amount of scope as outlined above would change the relative cost, including changes in the number of fish tagged with tags and transmitters, or the amount of sampling done to capture and recapture study fish. The cost below assumes purchase of 25,000 external tags (Floy T-bar anchor tags) and 870 Lotek radio transmitters assumed to cost $200 each; a significant cost savings would likely occur if the USACE purchased the tags and transmitters directly from a vendor. The relative cost estimate also assumes that PNNL would continue to maintain and operate the current telemetry equipment at AFD.
Relative cost values are presented so that the various study alternatives can be compared and contrasted based on relative cost. A relative cost value of “1” equates to the study alternative with the lowest estimated cost. A relative cost value of “3” would be approximately three times the cost of the alternative with a relative cost of 1.
Relative cost value: ~3.5
Final Report
43
3.4.5 Assumptions and Limitations
The technical scope and cost estimate for this alternative are based on the assumptions outlined in the Cost section above. Additional assumptions include the following:
• The study scope is performed during normally occurring operations at AFD. If entrainment through individual flow scenarios (e.g., “free-flow” or turbine-only entrainment, etc.) were desired, the study plan methodology would need to be re-evaluated to determine if operation-specific entrainment could be differentiated.
• Only currently existing radio telemetry equipment and zones would be used. Increase in the precision of zones (e.g., to cover individual passage routes) would increase the cost estimate.
• Catchability of fish upstream and downstream of AFD is assumed to be the same.
• Capture rates of fish downstream of AFD are sufficient to calculate proportions with reasonable accuracy.
• The proportion of fish with active transmitters emigrating from the study area would be representative of fish tagged with other tags.
• Fish sizes to be studied would be limited by telemetry and external tags. Telemetry and T-bar Floy tags can both be used to tag fish down to a minimum size of about 100 mm.
• The ability to obtain sampling permits for the species to be studied in this project as well as the continuation of currently existing permits that AFD holds with the USACE Division office to allow placement of telemetry equipment on AFD. Animal sampling permits would include an Idaho Department of Fish and Game collection permit (Application for Scientific Banding, Collecting, or Possession Permit) and USFWS Section 10 Native Threatened Species Recovery Permit for bull trout.
3.4.6 Expected Results and Applicability
It is expected that by following the implementation guidelines of this alternative, proportions of all fish species entrained by AFD would be estimated. These results could then be used to determine if entrainment rates of individual species are higher than desired, and management actions could be implemented to either reduce or mitigate entrainment, or guide fish through preferred passage routes through the dam.
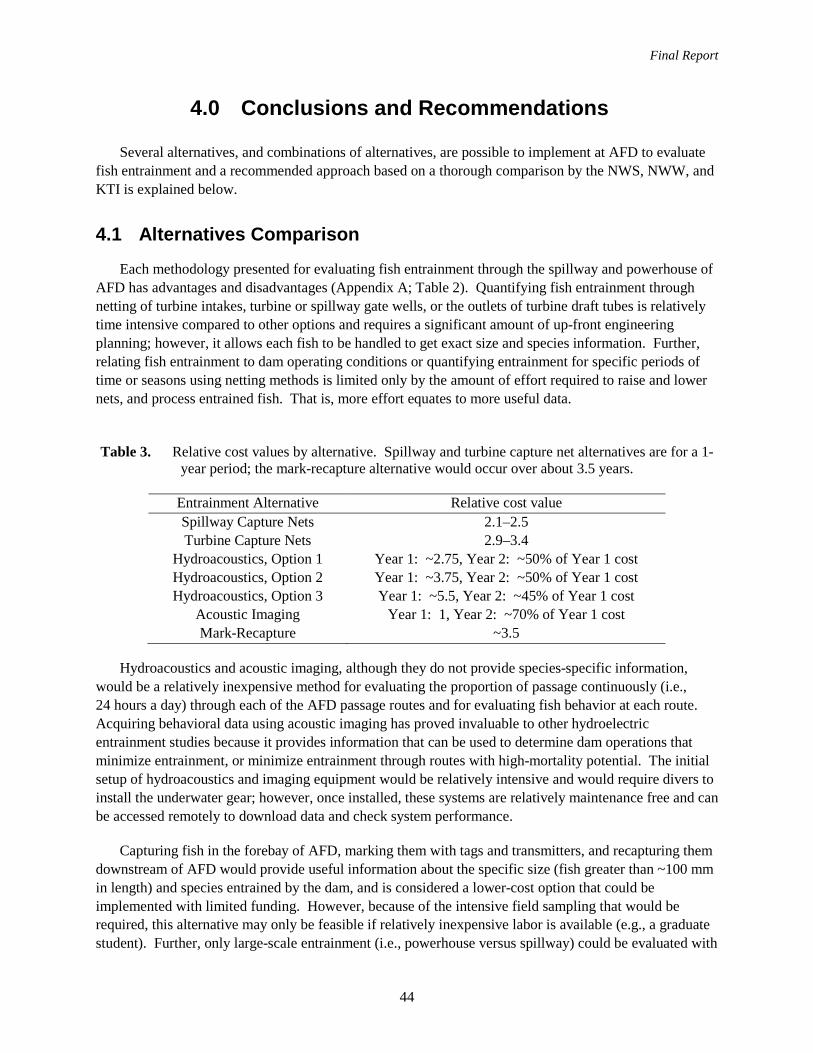
Final Report
44
4.0 Conclusions and Recommendations
Several alternatives, and combinations of alternatives, are possible to implement at AFD to evaluate fish entrainment and a recommended approach based on a thorough comparison by the NWS, NWW, and KTI is explained below.
4.1 Alternatives Comparison
Each methodology presented for evaluating fish entrainment through the spillway and powerhouse of AFD has advantages and disadvantages (Appendix A; Table 2). Quantifying fish entrainment through netting of turbine intakes, turbine or spillway gate wells, or the outlets of turbine draft tubes is relatively time intensive compared to other options and requires a significant amount of up-front engineering planning; however, it allows each fish to be handled to get exact size and species information. Further, relating fish entrainment to dam operating conditions or quantifying entrainment for specific periods of time or seasons using netting methods is limited only by the amount of effort required to raise and lower nets, and process entrained fish. That is, more effort equates to more useful data.
Table 3. Relative cost values by alternative. Spillway and turbine capture net alternatives are for a 1-
year period; the mark-recapture alternative would occur over about 3.5 years.
Entrainment Alternative Relative cost value Spillway Capture Nets 2.1–2.5 Turbine Capture Nets 2.9–3.4
Hydroacoustics, Option 1 Year 1: ~2.75, Year 2: ~50% of Year 1 cost Hydroacoustics, Option 2 Year 1: ~3.75, Year 2: ~50% of Year 1 cost Hydroacoustics, Option 3 Year 1: ~5.5, Year 2: ~45% of Year 1 cost
Acoustic Imaging Year 1: 1, Year 2: ~70% of Year 1 cost Mark-Recapture ~3.5
Hydroacoustics and acoustic imaging, although they do not provide species-specific information, would be a relatively inexpensive method for evaluating the proportion of passage continuously (i.e., 24 hours a day) through each of the AFD passage routes and for evaluating fish behavior at each route. Acquiring behavioral data using acoustic imaging has proved invaluable to other hydroelectric entrainment studies because it provides information that can be used to determine dam operations that minimize entrainment, or minimize entrainment through routes with high-mortality potential. The initial setup of hydroacoustics and imaging equipment would be relatively intensive and would require divers to install the underwater gear; however, once installed, these systems are relatively maintenance free and can be accessed remotely to download data and check system performance.
Capturing fish in the forebay of AFD, marking them with tags and transmitters, and recapturing them downstream of AFD would provide useful information about the specific size (fish greater than ~100 mm in length) and species entrained by the dam, and is considered a lower-cost option that could be implemented with limited funding. However, because of the intensive field sampling that would be required, this alternative may only be feasible if relatively inexpensive labor is available (e.g., a graduate student). Further, only large-scale entrainment (i.e., powerhouse versus spillway) could be evaluated with
Final Report
45
the current telemetry setup; further refinement of route-specific passage would require significant expansion of the radio telemetry system, or installation of a highly precise technology such as JSATS. Externally visible tags that would be attached to all captured individuals upstream of the dam would allow the proportion of entrained fish to be calculated based on recaptures in the AFD tailrace; however, the exact site of entrainment could not be determined using this method.
4.2 Recommended Approach
The recommended approach for evaluating fish entrainment at AFD is to use netting in combination with hydroacoustics. This combination of alternatives would provide the best estimate of entrainment route, magnitude, and species composition through AFD. Hydroacoustic technology has been widely used to evaluate fish entrainment at large dams throughout the Pacific Northwest (Ransom and Stieg 1994; Ferguson et al. 2004). Netting is an accepted technique used to evaluate fish entrainment, but has likely not been as widely used because of the manual labor and expense required; however, capturing fish is necessary if fish species and size information is required at AFD. Hydroacoustics would provide relatively inexpensive data on fish entrainment continuously (24 hours per day) through time (e.g., by diel period or seasons) and by passage route (i.e., 10 spill bays and 3 turbines). Netting would allow researchers to enumerate the size and species being entrained. Using these methods in tandem would also allow corroboration of entrainment data and extrapolation of species- and size-specific total-project entrainment.
Because of the potentially significant cost and time required to design and deploy capture nets, and to determine the appropriate routes to place nets (assuming that nets could not be constructed for all potential passage routes), a phased approach is recommended whereby hydroacoustics would be implemented in the first year of study followed by netting in year two of the study. In this scenario, hydroacoustic data would be used to identify the passage routes with the greatest fish entrainment rates, and these areas would then be sampled with nets to quantify specific fish sizes and species entrained. It is estimated that from funding through completion, a study combining the hydroacoustic and netting alternatives would take about 2.5 years and would be divided into the following major milestones:
• Year 1
– Plan and deploy hydroacoustic gear – Design and construct fyke nets – Sample passage routes with hydroacoustics – Determine primary routes of passage for net-sampling – Complete preliminary data analysis for Year 1
• Year 2
– Continue hydroacoustic sampling – Deploy fyke nets – Incorporate Year 2 data into data analysis – Begin study report
• Year 3
– Finish data analysis and study report.
One potential concern of implementing a phased approach is that dam operations could vary significantly between study years and may bias the entrainment estimates collected with different
Final Report
46
methods in different flow years. To quantify the potential for bias, hydroacoustics-derived entrainment rates and dam operations would be compared between years to understand whether net-entrainment data, collected in a later year of study, could be extrapolated back to prior years when only hydroacoustic data were collected. If hydroacoustic entrainment results were similar between years, it might be assumed that net-entrainment results would have been similar between years. However, this also assumes that the composition of fish species and sizes was similar in the forebay between years and thus, if this assumption cannot be verified, then it is possible that back-calculated entrainment estimates could be biased. Despite this consideration of bias, using hydroacoustics in year one would provide much value in determining the proper passage routes to be sampled using capture nets in year two.
An alternative method to assess entrainment is using a mark-recapture study. This option may be advantageous to determine species entrained, but it would not be able to determine specific routes of passage, which may be desired if future dam operations may be manipulated to purposefully manage the desired routes of passage. This option is also likely to be significantly less expensive than the hydroacoustics/netting alternative. It is estimated that from funding through completion, a study using mark-recapture techniques to estimate fish entrainment at AFD would take about 3 years and would be divided into the following major milestones:
• Year 1
– Finalize study design (Corps and University professor) – Hire graduate student – Begin sampling, tagging, and recapturing study fish
• Year 2
– Continue fish sampling, tagging, and recapturing
• Year 3 – Wrap-up fish sampling, tagging, and recapturing – Complete data analysis and Master’s thesis.
The exact method to be used to assess entrainment through the passage routes at AFD, whether a combination of hydroacoustics and netting, a phased approach, or a less-expensive mark-recapture study, would ultimately be determined in consultation between the USACE, BPA, KTI, and other stakeholders. However, final implementation should consider the guidelines suggested in this study plan to evaluate the advantages, disadvantages, and assumptions of each outlined alternative. Management goals for the resource should also be considered to ensure that the alternative chosen is able to sufficiently inform fisheries management and dam operations decision-making.
Final Report
47
5.0 References
Anderson DR, KP Burnham, and GC White. 1994. “AIC Model Selection in Overdispersed Capture-Recapture Data.” Ecology 75:1780−1793.
Axel G, J Beeman, R Brown, B Eppard, S Fielding, E Hockersmith, T Liedtke, C Peery, and C Woodley. 2011. Surgical Protocols for Implanting JSATS Transmitters into Juvenile Salmonids for Studies Conducted for the U.S. Army Corps of Engineers. U.S. Army Corps of Engineers, Portland, Oregon. Available online: http://jsats.pnnl.gov/Publications/Technical/2011/Axel_et_al_2011_USACE_SurgicalProtocols_V1_2011.pdf. Accessed 11 December 2014. Axel AA, EE Hockersmith, BJ Burke, K Frick, BP Sandford, WD Muir, RF Absolon, N Dumdei, JJ Lamb, and M.G. Nesbit. 2010. Passage Behavior and Survival of Radio-Tagged Yearling and Subyearling Chinook Salmon and Juvenile Steelhead at Ice Harbor Dam, 2009. National Marine Fisheries Service, National Oceanic and Atmospheric Administration, Seattle, Washington. Beeman JW, AC Braatz, HC Hansel, SD Fielding, PV Haner, GS Hansen, DJ Shurtleff, JM Sprando, and DW Rondorf. 2010. Approach, Passage, and Survival of Juvenile Salmonids at Little Goose Dam, Washington—Post-Construction Evaluation of a Temporary Spillway Weir, 2009. U.S. Geological Survey Open-File Report 2010-1224, U.S. Geological Survey, Reston, Virginia. Beeman JW, HC Hansel, AC Hansen, PV Haner, JM Sprando, CD Smith, SD Evans, and TW Halton. 2013. Behavior and Dam Passage of Juvenile Chinook Salmon at Cougar Reservoir and Dam, Oregon, March 2011–February 2012. U.S. Geological Survey Open-File Report 2014-1177, U.S. Geological Survey, Reston, Virginia.
Bellgraph BB, LA Ortega, JA Carter, M Paluch, RA Harnish, and MS Hughes. 2010. Movement Patterns of Adult Bull Trout in the Albeni Falls Dam Tailrace, Pend Oreille River, Idaho, 2008–2009. PNWD-4168, report prepared for the U.S. Army Corps of Engineers, Seattle District, by Pacific Northwest National Laboratory, Richland, Washington.
Brown RS, RA Harnish, KM Carter, JW Boyd, KA Deters, and MB Eppard. 2010. “An evaluation of the maximum tag burden for implantation of acoustic transmitters in juvenile Chinook salmon.” North American Journal of Fisheries Management 30:499−505. Buchanan DV, MG Wade, and DL Higley. 1993. Restoration of the Native Winter Steelhead Run on the South Santiam River above Foster Dam. Final report submitted to the U.S. Army Corps of Engineers, Portland District, by Oregon Department of Fish and Wildlife, Corvallis, Oregon. Burwen DL, SJ Fleischman, and JD Miller. 2010. Accuracy and precision of salmon length estimates taken from DIDSON sonar images. Transactions of the American Fisheries Society 139:1306−1314.
Endangered Species Act (ESA) of 1973, as amended. 7 USC § 136, 16 USC § 1531 et seq. Evans SD, NS Adams, DW Rondorf, JM Plumb, and BD Ebberts. 2008. Performance of a prototype surface collector for juvenile salmonids at Bonneville Dam's first powerhouse on the Columbia River, Oregon. River Research and Applications 24(7):960−974

Final Report
48
Federal Energy Regulatory Commission (FERC). 1995. Preliminary assessment of fish entrainment at hydropower projects: A report on studies and protective measures. Paper no. DPR-10, Washington, D.C. Ferguson JW, RF Absolon, TJ Carlson, and BP Sandford. 2006. Evidence of delayed mortality on juvenile Pacific salmon passing through turbines at Columbia River dams. Transactions of the American Fisheries Society 135:139−150. Ferguson JW, GM Matthews, RL McComas, RF Absolon, DA Brege, MH Gessel, and LG Gilbreath. 2004. Passage of Adult and Juvenile Salmon through Federal Columbia River Power System Dams. NOAA Technical Memorandum NMFS-NWFSC-64, Fish Ecology Division, Northwest Fisheries Science Center, National Marine Fisheries Service, Seattle, Washington. Flatter BJ. 1999. Investigation of bull trout (Salvelinus confluentus) in Arrow Rock Reservoir, Idaho. Study Agreement # 1425-6-FC-10-02170, report prepared by Idaho Department of Fish and Game, Boise, Idaho, and submitted to U. S. Bureau of Reclamation, Pacific Northwest Region, Boise, Idaho.
Giorgi AE and CW Sims. 1987. “Estimating the daily passage of juvenile salmonids at McNary Dam on the Columbia River.” North American Journal of Fisheries Management 7:215−222. Ham KD, CI Arimescu, MA Simmons, JP Duncan, MA Chamness, and A Solcz. 2009. Synthesis of biological research on juvenile fish passage and survival 1990–2006: Ice Harbor Dam. PNNL- 15041, report prepared for the US Army Corps of Engineers, Walla Walla, Washington, by Pacific Northwest National Laboratory, Richland, Washington.
Hanson CH. 2001. Are juvenile Chinook Salmon entrained at unscreened diversions in direct proportion to the volume of water diverted? Contributions to the Biology of Central Valley Salmonids 2:331−342. Harnish RA, GE Johnson, GA McMichael, MS Hughes, and BD Ebberts. 2012. Effect of migration pathway on travel time and survival of acoustic-tagged juvenile salmonids in the Columbia River estuary. Transactions of the American Fisheries Society 141:507−519.
HDR, Inc. 2009. Direct capture of turbine passed fish: development of test methods. Alternatives analysis report for the U.S. Army Corps of Engineers, Portland District, Portland, Oregon.
Hubert WA. 1996. Passive capture techniques. Pages 157-182 in BR Murphy and DW Willis (eds.), Fisheries Techniques, 2nd edition. American Fisheries Society, Bethesda, Maryland. Hughes JS, J Kim, JA Vazquez, and GE Johnson. 2014. Hydroacoustic Evaluation of Juvenile Salmonid Passage and Distribution at Foster Dam, 2013 – 2014. PNNL-23645, draft final report submitted to the U.S. Army Corps of Engineers, Portland District, Portland, Oregon, by Pacific Northwest National Laboratory, Richland, Washington.
James PW. 2002. Rimrock Lake Fish Entrainment Study, 2001. Report prepared for U.S. Bureau of Reclamation, Yakima, Washington.
Johnson GE, CM Sullivan, and MW Erho. 1992. “Hydroacoustic Studies for Developing a Smolt Bypass System at Wells Dam.” Fisheries Research 14:221−237.
Final Report
49
Johnson GE, SM Anglea, NS Adams, and TO Wik. 2005. “Evaluation of the Prototype Surface Flow Bypass for Juvenile Salmon and Steelhead at the Powerhouse of Lower Granite Dam, Snake River, Washington, 1996-2000.” North American Journal of Fisheries Management 25:138−151.
Khan F, GE Johnson, and MA Weiland. 2009. Hydroacoustic Evaluation of Overwintering Summer Steelhead Fallback and Kelt Passage at The Dalles Dam 2008-2009. PNNL-18590, final report to the U.S. Army Corps of Engineers, Portland District, Portland, Oregon, by Pacific Northwest National Laboratory, Richland, Washington.
Khan F, GE Johnson, and MA Weiland. 2010. Hydroacoustic Evaluation of Overwintering Summer Steelhead Fallback and Kelt Passage at The Dalles Dam, 2009-2010. PNNL-19615, final report to the U.S. Army Corps of Engineers, Portland District, Portland, Oregon, by Pacific Northwest National Laboratory, Richland, Washington.
Khan F, GE Johnson, IM Royer, JS Hughes, ES Fischer, DM Trott, and GR Ploskey. 2012a. Hydroacoustic Evaluation of Juvenile Salmonid Passage and Distribution at Lookout Point Dam, 2010. PNNL-20362, final report to the U.S. Army Corps of Engineers, Portland District, Portland, Oregon, by Pacific Northwest National Laboratory, Richland, Washington.
Khan F, IM Royer, GE Johnson, and KD Ham. 2012b. Hydroacoustic Evaluation of Juvenile Salmonid Passage and Distribution at Detroit Dam, 2011. PNNL-21577, prepared for the U.S. Army Corps of Engineers, Portland District, Portland, Oregon, by the Pacific Northwest National Laboratory, Richland, Washington.
Love RH. 1977. “Target Strength of an Individual Fish at Any Aspect.” Journal of the Acoustical Society of America 62:1397−1403.
Monk BH, BP Sandford, DA Brege, and JW Ferguson. 2004. Evaluation of Turbine Intake Modifications at the Bonneville Dam Second Powerhouse, 2002. Report prepared for U.S. Army Corps of Engineers, Portland, Oregon.
Normandeau (Normandeau Associates, Inc). 2014. Direct Survival/Condition of Subadult and Adult Rainbow Trout Passing Through a Spillbay and Turbine at Albeni Falls Dam, Pend Oreille River, Idaho. Report to the U.S. Army Corps of Engineers, Seattle District, Seattle, Washington.
Paluch M, S Warehime, A Scholz, and J Connor. 2014. Temporary restoration of bull trout passage at Albeni Falls Dam. Document ID P137413, Bonneville Power Administration, Portland, Oregon.
Ploskey GR and TJ Carlson. 1999. “Comparison of hydroacoustics and net estimates of fish guidance efficiency of an extended submersible bar screen at John Day Dam.” North American Journal of Fisheries Management 19:1066−1079.
Ploskey GR, CR Schilt, J Kim, CW Escher, and JR Skalski. 2003. Hydroacoustic Evaluation of Fish Passage Through Bonneville Dam in 2002. PNNL-14356, final report to the U.S. Army Corps of Engineers, Portland District, Portland, Oregon, by Pacific Northwest National Laboratory, Richland, Washington. Ploskey GR, MA Weiland, DM Faber, Z Deng, GE Johnson, JS Hughes, SA Zimmerman, TJ Monter,

Final Report
50
AW Cushing, MC Wilberding, RE Durham, RL Townsend, JR Skalski, RA Buchanan, J Kim, ES Fischer, MM Meyer, RL McComas, and JP Everett. 2009. Survival Rates of Juvenile Salmonids Passing Through the Bonneville Dam and Spillway in 2008. PNNL-18748, Pacific Northwest National Laboratory, Richland, Washington.
Ploskey GR, MA Weiland, and CR Schilt. 2004. Evaluation of Fish Losses through Screen Gaps at Modified and Unmodified Intakes of Bonneville Dam Second Powerhouse in 2003. PNNL-14539, prepared for the U. S. Army Engineer District, Portland, Oregon, by the Pacific Northwest National Laboratory, Richland, Washington.
Ploskey GR, MA Weiland, CR Schilt, J Kim, PN Johnson, ME Hanks, DS Patterson, JR Skalski, and JB Hedgepeth. 2005. Hydroacoustic Evaluation of Fish Passage Through Bonneville Dam in 2004. PNNL-15249, final report to the U.S. Army Corps of Engineers, Portland District, Portland, Oregon, Pacific Northwest National Laboratory, Richland, Washington. Ransom BH, SV Johnston, and TW Steig. 1998. Review on monitoring adult salmonid escapement using fixed-location split-beam hydroacoustics. Fisheries Research 35:33−42. Ransom BH and TW Steig. 1994. Using hydroacoustics to monitor fish at hydropower dams. Lake and Reservoir Management 9:163−169.
Ransom BH, TW Steig, and PA Nealson. 1996. “Comparison of hydroacoustic and net catch estimates of Pacific salmon smolt (Oncorhynchus spp.) passage at hydropower dams in the Columbia River Basin, USA.” ICES Journal of Marine Science 53:477−481.
Schilt CR, PD Vu, and JM Nestler. 1995. “Learning the ropes at Richard B. Russell Dam: Net systems for medium head hydropower pumpback and generation fish sampling.” In Waterpower ’95: Proceedings of the International Conference on Hydropower held in San Francisco, California, July 25-28, 1995, edited by John Cassidy, America Society of Civil Engineers, New York. Scholz AT, HJ McLellan, DR Geist, and RS Brown. 2005. Investigations of migratory bull trout (Salvelinus confluentus) in relation to fish passage at Albeni Falls Dam. PNWD-3521, report to the U.S. Army Corps of Engineers, Seattle District, Seattle Washington. Smith DL, JM Nestler, GE Johnson, and RA Goodwin. 2009. Species-specific spatial and temporal distribution patterns of emigrating juvenile salmonids in the Pacific Northwest. Reviews in Fisheries Science 18:40−64.
Sorenson KM, WL Fisher, and AV Zale. 1998. “Turbine passage of juvenile and adult fish at a warmwater hydroelectric facility in northeastern Oklahoma: monitoring associated with relicensing.” North American Journal of Fisheries Management 18:124−136.
Stone and Webster Environmental Services. 1992. Fish Entrainment and Turbine Mortality: Review and Guidelines. TR-101231, Electric Power Research Institute, Palo Alto, California. Available online: http://www.epri.com/search/Pages/results.aspx?k=Fish%20Entrainment%20and%20Turbine%20Mortality%20Review%20and%20Guidelines Accessed 16 December 2014.

Final Report
51
Thorne RE and GE Johnson. 1993. “A Review of Hydroacoustic Studies for Estimation of Salmonid Downriver Migration Past Hydroelectric Facilities on the Columbia and Snake Rivers in the 1980s.” Reviews in Fisheries Science 1:27−56.
USACE (U.S. Army Corps of Engineers). 1996. Project Operations: Environmental Stewardship Operations and Maintenance Policies. Regulation No. 1130-2-540. Department of the Army, Washington, D.C. Available online: http://corpslakes.usace.army.mil/employees/policy/ER/ER-1130-2-540.pdf Accessed 4 February 2015.
USFWS (U.S. Fish and Wildlife Service). 2000. Biological Opinion, Effects to Listed Species from Operations of the Federal Columbia River Power System. Report by the U.S. Fish and Wildlife Service to the U.S. Army Corps of Engineers, Bonneville Power Administration, and Bureau of Reclamation. Weiland MA, ZD Deng, TA Seim, BL LaMarche, EY Choi, T Fu, TJ Carlson, AI Thronas, MB Eppard. 2011. A Cabled Acoustic Telemetry System for Detecting and Tracking Juvenile Salmon: Part 1. Engineering Design and Instrumentation. Sensors 116:5645−5660. Wertheimer RH. 2007. Evaluation of a Surface Flow Bypass System for Steelhead Kelt Passage at Bonneville Dam, Washington. North American Journal of Fisheries Management 27:21−29. Wertheimer RH and AF Evans. 2005. Downstream Passage of Steelhead Kelts Through Hydroelectric Dams on the Lower Snake and Columbia Rivers. Transactions of the American Fisheries Society 134:853−865.

Final Report
Appendix A –
Alternatives Matrix

Final Report
A.1
Appendix A −
Alternatives Matrix
The alternatives matrix used to prioritize the advantages and disadvantages of each methodology prior to compilation of the study plans is provided below.
The varying levels of cost presented (i.e., $, $$, or $$$) are qualitative values only used to compare the relative cost between alternatives. Actual costs for these tasks are included within the relative cost values presented in the text portion of the report for each alternative.
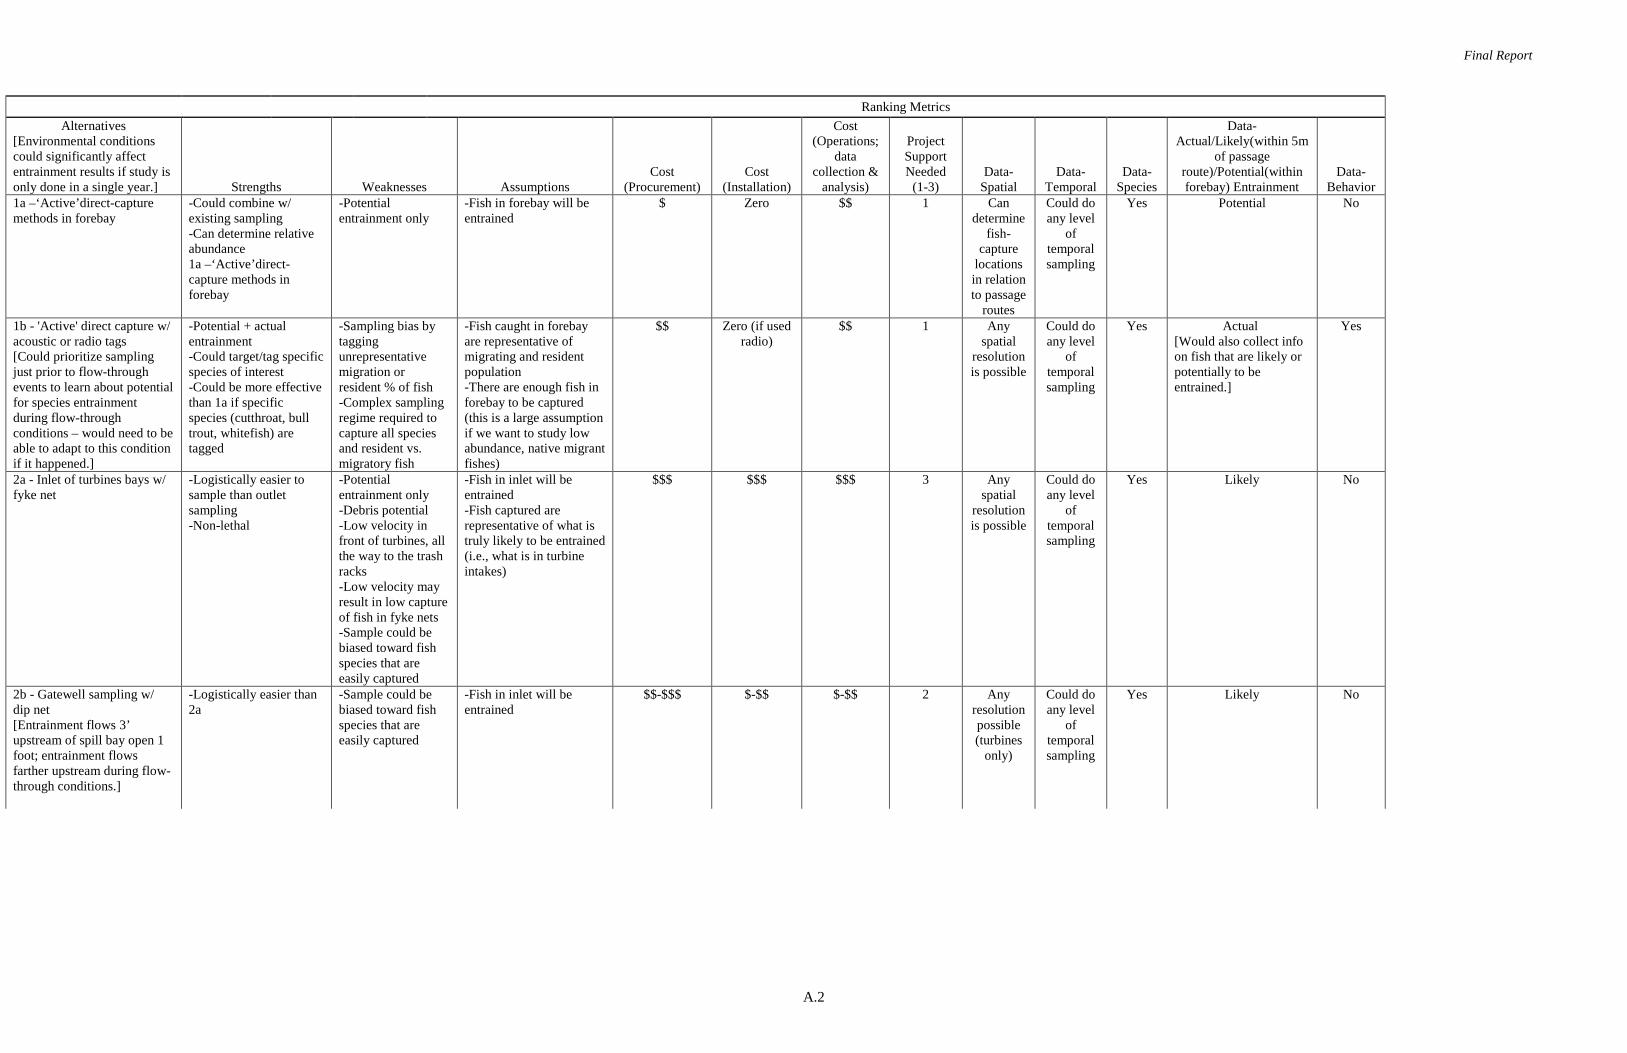
Final Report
A.2
Ranking Metrics Alternatives
[Environmental conditions could significantly affect entrainment results if study is only done in a single year.] Strengths Weaknesses Assumptions
Cost (Procurement)
Cost (Installation)
Cost (Operations;
data collection &
analysis)
Project Support Needed
(1-3) Data-
Spatial Data-
Temporal Data-
Species
Data-Actual/Likely(within 5m
of passage route)/Potential(within forebay) Entrainment
Data-Behavior
1a –‘Active’direct-capture methods in forebay
-Could combine w/ existing sampling -Can determine relative abundance 1a –‘Active’direct-capture methods in forebay
-Potential entrainment only
-Fish in forebay will be entrained
$ Zero $$ 1 Can determine
fish-capture
locations in relation to passage
routes
Could do any level
of temporal sampling
Yes Potential No
1b - 'Active' direct capture w/ acoustic or radio tags [Could prioritize sampling just prior to flow-through events to learn about potential for species entrainment during flow-through conditions – would need to be able to adapt to this condition if it happened.]
-Potential + actual entrainment -Could target/tag specific species of interest -Could be more effective than 1a if specific species (cutthroat, bull trout, whitefish) are tagged
-Sampling bias by tagging unrepresentative migration or resident % of fish -Complex sampling regime required to capture all species and resident vs. migratory fish
-Fish caught in forebay are representative of migrating and resident population -There are enough fish in forebay to be captured (this is a large assumption if we want to study low abundance, native migrant fishes)
$$ Zero (if used radio)
$$ 1 Any spatial
resolution is possible
Could do any level
of temporal sampling
Yes Actual [Would also collect info on fish that are likely or potentially to be entrained.]
Yes
2a - Inlet of turbines bays w/ fyke net
-Logistically easier to sample than outlet sampling -Non-lethal
-Potential entrainment only -Debris potential -Low velocity in front of turbines, all the way to the trash racks -Low velocity may result in low capture of fish in fyke nets -Sample could be biased toward fish species that are easily captured
-Fish in inlet will be entrained -Fish captured are representative of what is truly likely to be entrained (i.e., what is in turbine intakes)
$$$ $$$ $$$ 3 Any spatial
resolution is possible
Could do any level
of temporal sampling
Yes Likely No
2b - Gatewell sampling w/ dip net [Entrainment flows 3’ upstream of spill bay open 1 foot; entrainment flows farther upstream during flow-through conditions.]
-Logistically easier than 2a
-Sample could be biased toward fish species that are easily captured
-Fish in inlet will be entrained
$$-$$$ $-$$ $-$$ 2 Any resolution possible (turbines
only)
Could do any level
of temporal sampling
Yes Likely No
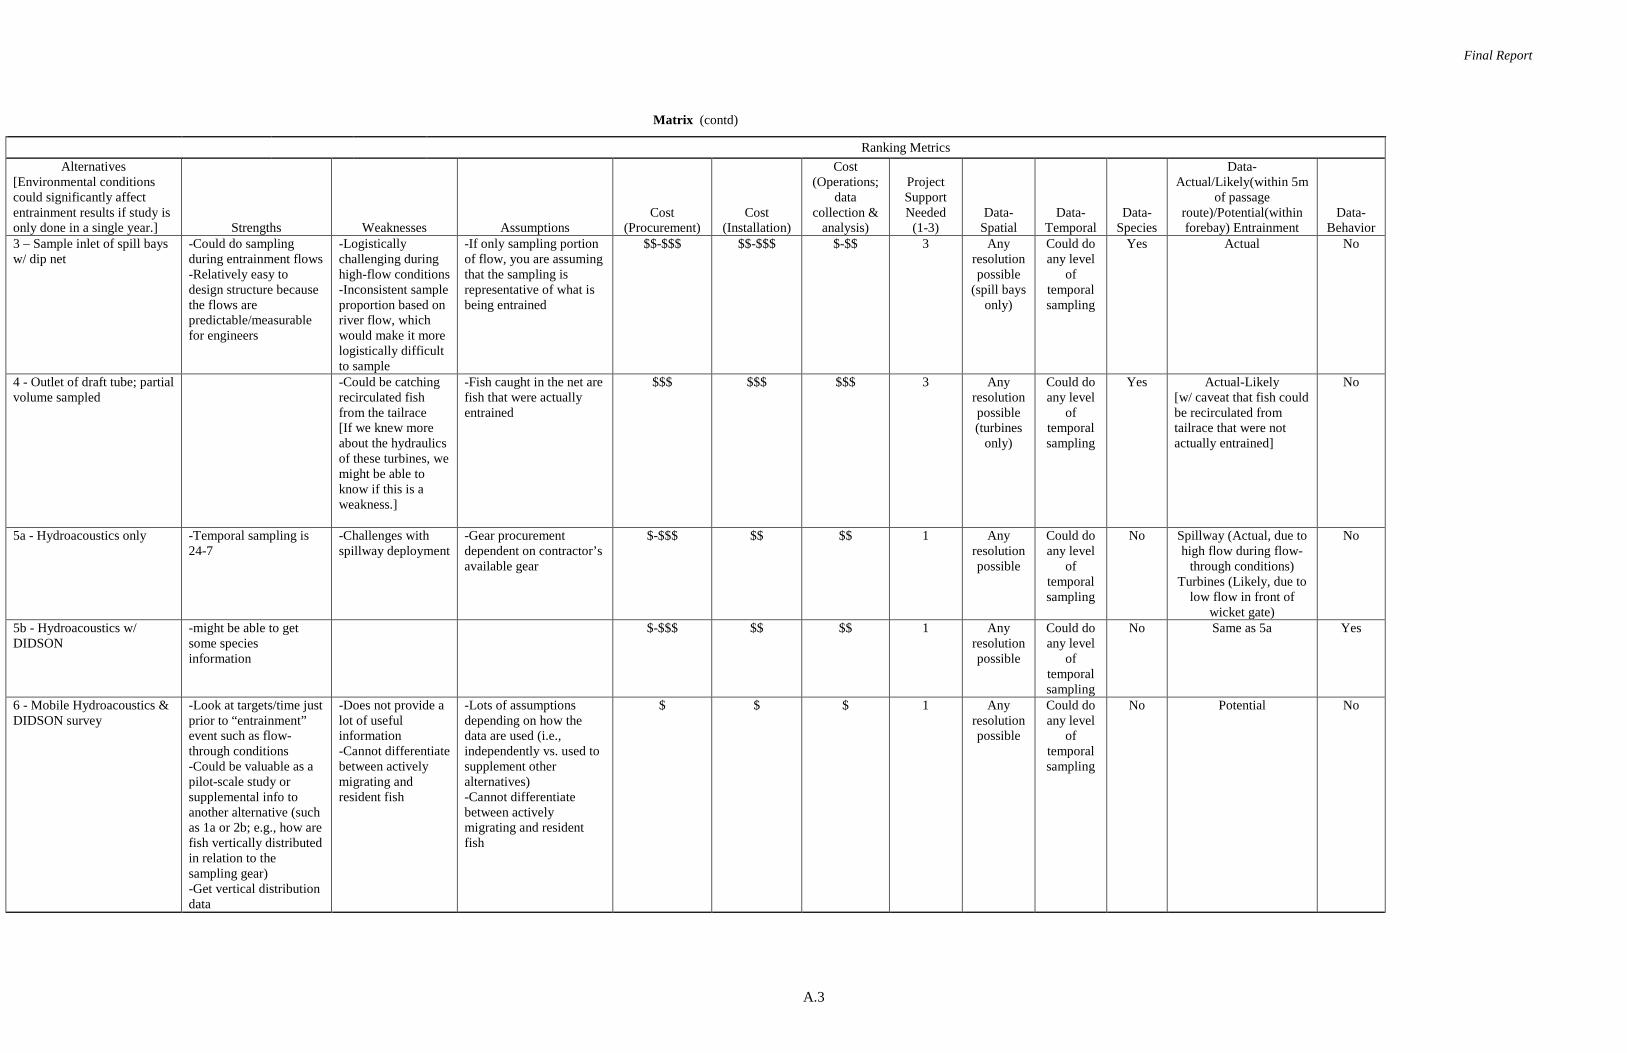
Final Report
A.3
Matrix (contd)
Ranking Metrics Alternatives
[Environmental conditions could significantly affect entrainment results if study is only done in a single year.] Strengths Weaknesses Assumptions
Cost (Procurement)
Cost (Installation)
Cost (Operations;
data collection &
analysis)
Project Support Needed
(1-3) Data-
Spatial Data-
Temporal Data-
Species
Data-Actual/Likely(within 5m
of passage route)/Potential(within forebay) Entrainment
Data-Behavior
3 – Sample inlet of spill bays w/ dip net
-Could do sampling during entrainment flows -Relatively easy to design structure because the flows are predictable/measurable for engineers
-Logistically challenging during high-flow conditions -Inconsistent sample proportion based on river flow, which would make it more logistically difficult to sample
-If only sampling portion of flow, you are assuming that the sampling is representative of what is being entrained
$$-$$$ $$-$$$ $-$$ 3 Any resolution possible
(spill bays only)
Could do any level
of temporal sampling
Yes Actual No
4 - Outlet of draft tube; partial volume sampled
-Could be catching recirculated fish from the tailrace [If we knew more about the hydraulics of these turbines, we might be able to know if this is a weakness.]
-Fish caught in the net are fish that were actually entrained
$$$ $$$ $$$ 3 Any resolution possible (turbines
only)
Could do any level
of temporal sampling
Yes Actual-Likely [w/ caveat that fish could be recirculated from tailrace that were not actually entrained]
No
5a - Hydroacoustics only -Temporal sampling is 24-7
-Challenges with spillway deployment
-Gear procurement dependent on contractor’s available gear
$-$$$ $$ $$ 1 Any resolution possible
Could do any level
of temporal sampling
No Spillway (Actual, due to high flow during flow-
through conditions) Turbines (Likely, due to
low flow in front of wicket gate)
No
5b - Hydroacoustics w/ DIDSON
-might be able to get some species information
$-$$$ $$ $$ 1 Any resolution possible
Could do any level
of temporal sampling
No Same as 5a Yes
6 - Mobile Hydroacoustics & DIDSON survey
-Look at targets/time just prior to “entrainment” event such as flow-through conditions -Could be valuable as a pilot-scale study or supplemental info to another alternative (such as 1a or 2b; e.g., how are fish vertically distributed in relation to the sampling gear) -Get vertical distribution data
-Does not provide a lot of useful information -Cannot differentiate between actively migrating and resident fish
-Lots of assumptions depending on how the data are used (i.e., independently vs. used to supplement other alternatives) -Cannot differentiate between actively migrating and resident fish
$ $ $ 1 Any resolution possible
Could do any level
of temporal sampling
No Potential No

Final Report
Appendix B
Albeni Falls Dam Budgetary Estimate for Netting Alternative

Final Report
Appendix B
Albeni Falls Dam Budgetary Estimate for Netting Alternative
The detailed cost estimate for the netting alternative was provided by the U.S. Army Corps of Engineers, Walla Walla District.

Final Report
B
.1
Final Report
B
.2
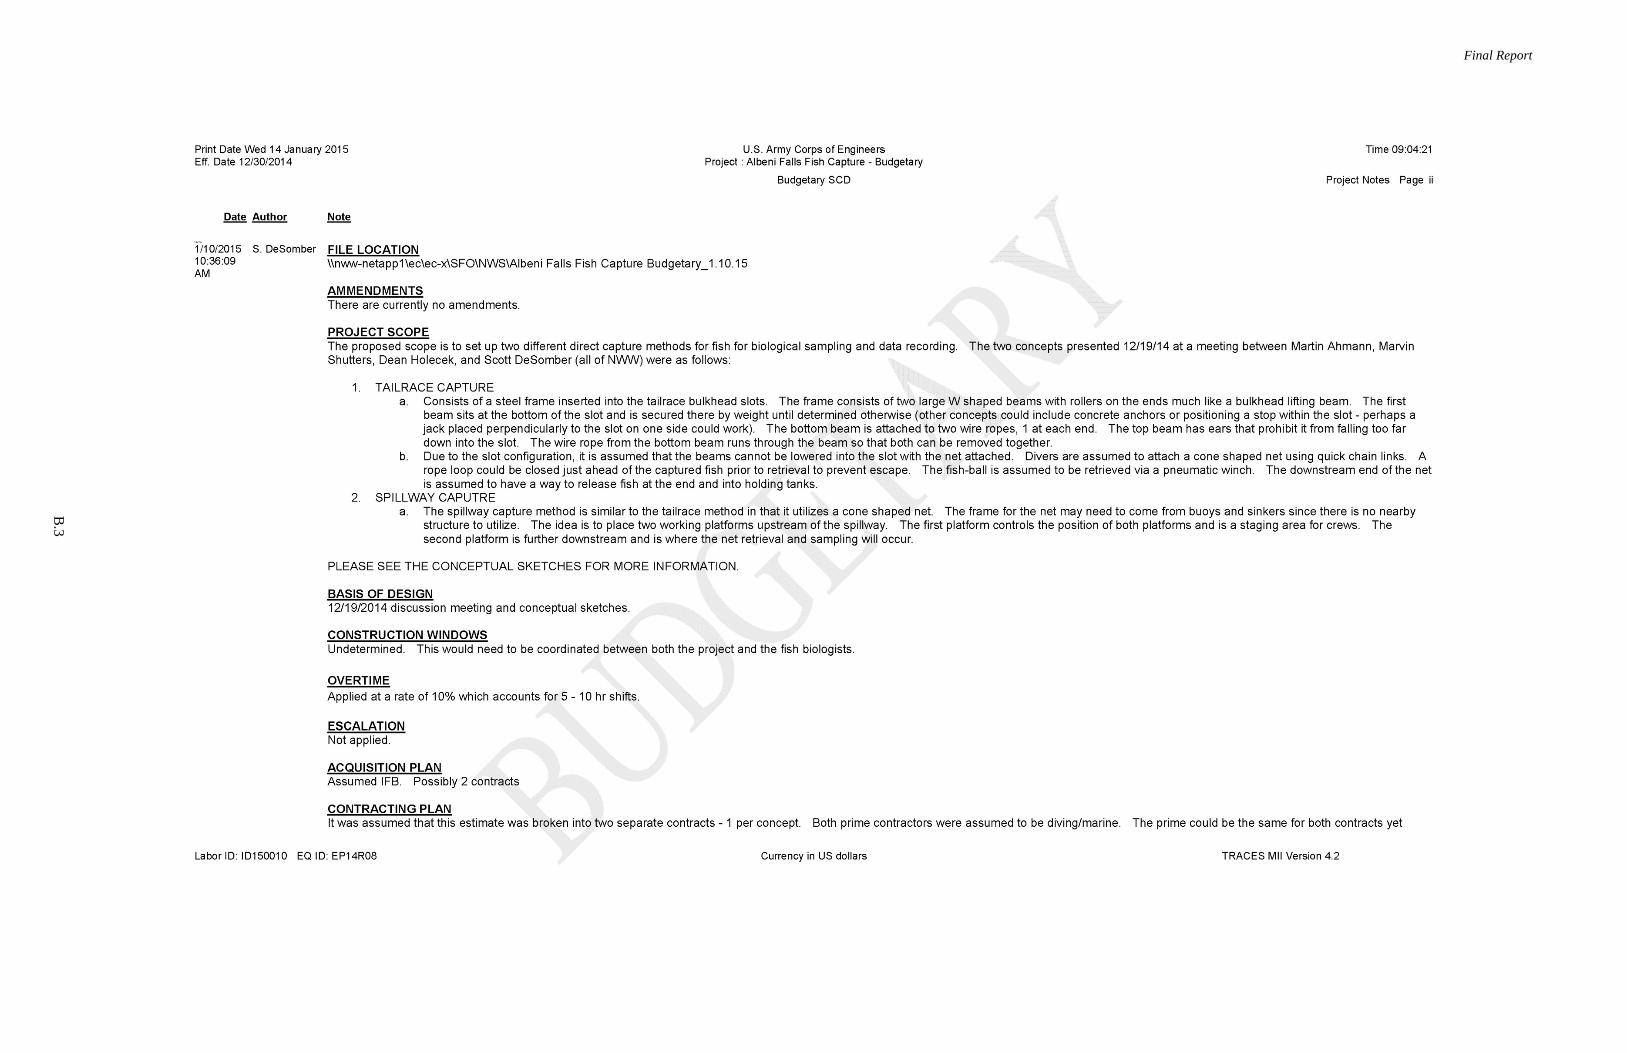
Final Report
B
.3

Final Report
B
.4

Final Report
B
.5

Final Report
B
.6
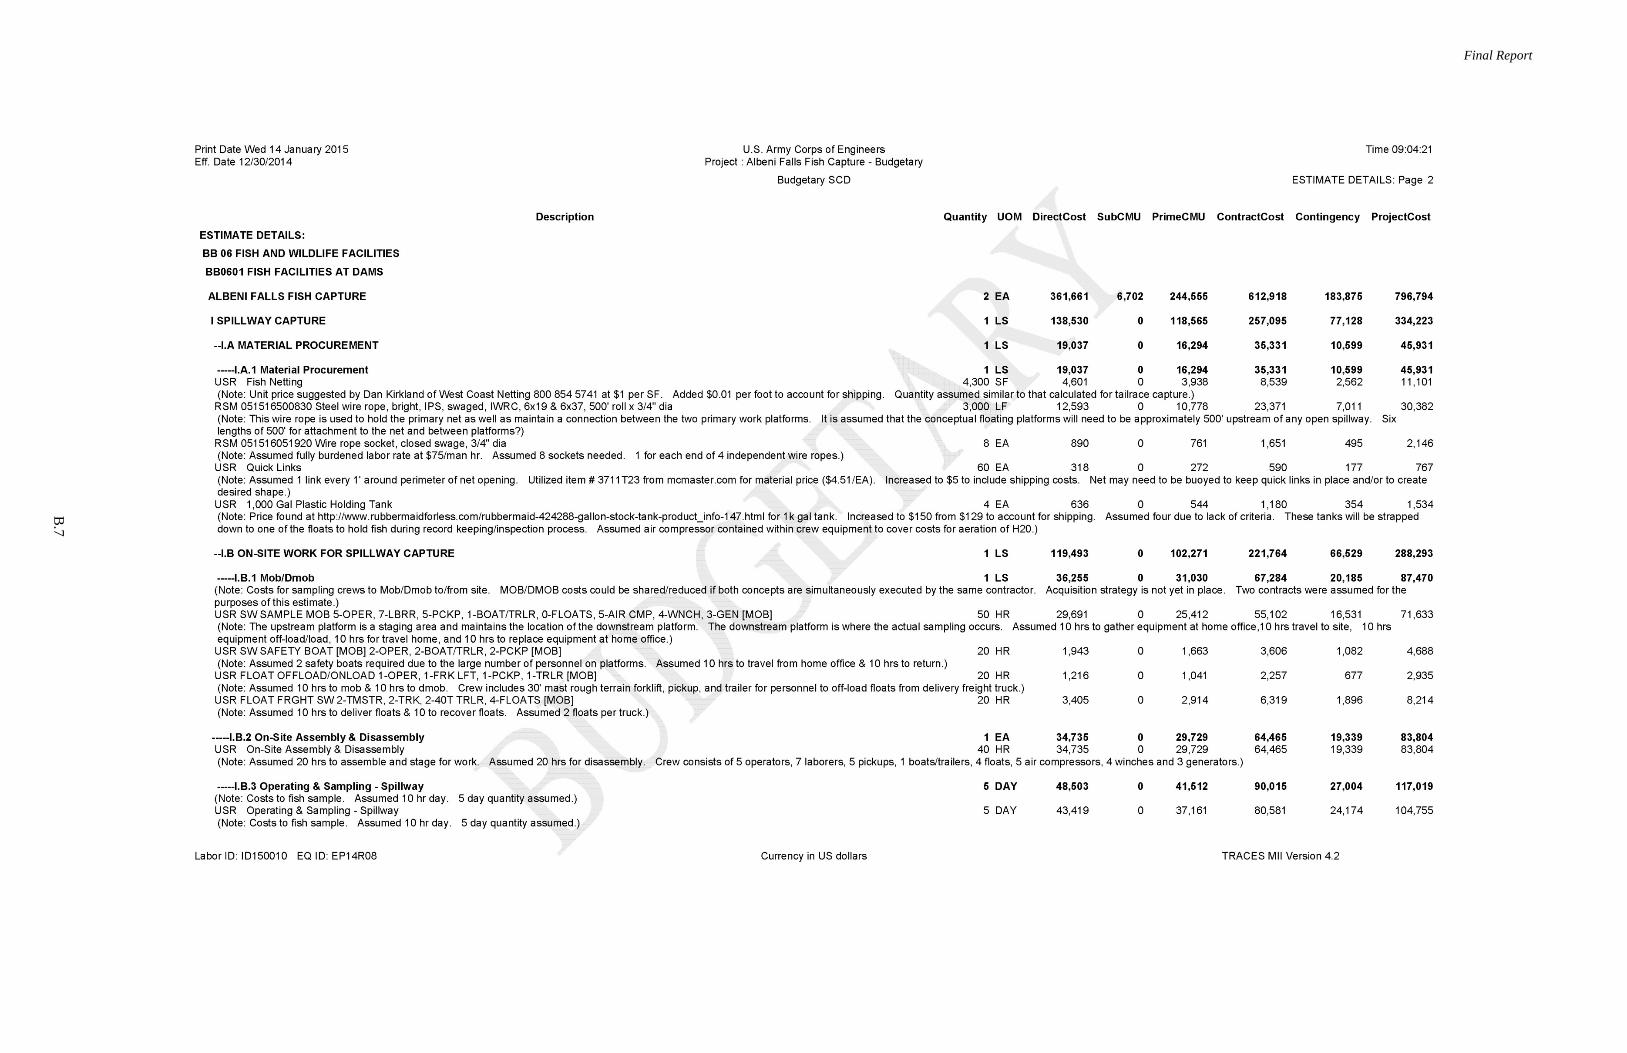
Final Report
B
.7
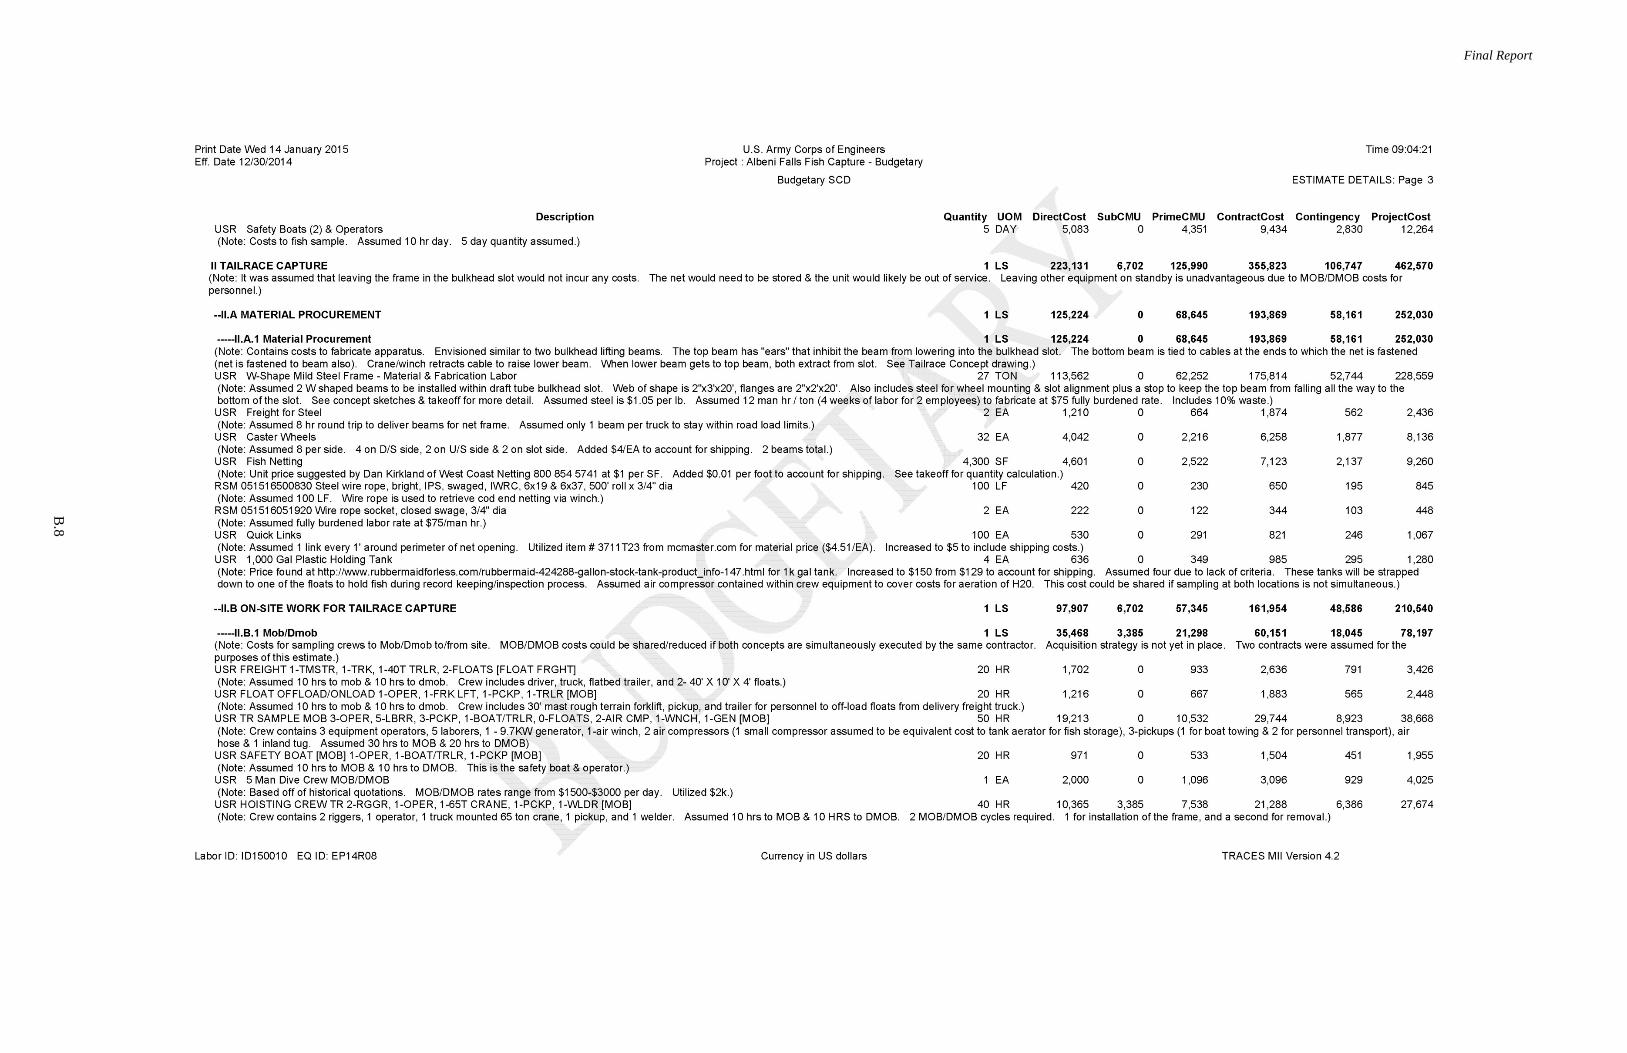
Final Report
B
.8

Final Report
B
.9

Top Related