


Languages
Pages
Legal


Study of Catalyst Particle Emissions From a FluidizedCatalytic Cracker Unit
Author
Whitcombe, Joshua Matthew
Published
2003
Thesis Type
Thesis (PhD Doctorate)
School
School of Environmental Engineering
DOI
https://doi.org/10.25904/1912/490
Copyright Statement
The author owns the copyright in this thesis, unless stated otherwise.
Downloaded from
http://hdl.handle.net/10072/367301
Griffith Research Online
https://research-repository.griffith.edu.au

Study of Catalyst Particle Emissions from a
Fluidized Catalyst Cracker Unit
Joshua Matthew Whitcombe BEng (ENV) Hons 1
School of Environmental Engineering Faculty of Environmental Sciences
Griffith University
Submitted in fulfilment of the requirements of the degree of Doctor of Philosophy
February 2003
-1- -

Abstract The control of particle emissions from an oil refinery is often difficult, due to changing
operational conditions and the limited range of available treatment options. Excessive particle
emissions have often been attributed start up problems with Fluidized Catalytic Cracker Units
(FCCU) and little information is available regarding the exact composition and nature of
these excessive emissions. Due to the complex nature of a FCCU, it has in the past been
difficult to identify and control emissions, without the use of expensive end of pipe
technologies. An Australian Oil Refinery, concerned with their catalyst emissions, sponsored
this study of FCCU particle emissions. Due to the industrial nature of the project, a holistic
approach to the management of emissions was taken, instead of a detailed investigation of a
single issue. By looking at the broader range of issues, practical and useful outcomes can be
achieved for the refinery.
Initially, detailed emissions samplings were conducted to investigate the degree of particle
emissions under start up conditions. Stack emissions were collected during a standard start
up, and analysed to determine the particle size distribution and metal concentration of the
emitted material. Three distinct stages of emissions were discovered, initially a high
concentration of larger particles, followed by a peak in the very fine particles and finally a
reduction of particle emissions to a more steady or normal operational state.
The variation in particle emissions was caused by operational conditions, hardware design
and catalyst characteristics. Fluctuations in the gas velocity through the system altered the
ability of the cyclones to collect catalyst material. Also, the low bed level allowed air bypass
to occur more readily, contributing to the increased emissions levels seen during the initial
stage of the start up. Reduced fluidity characteristics of the circulating catalyst also affected
the diplegs operations, altering the collection efficiency of the cyclone. During the loading of
catalyst into the system, abraded material was quickly lost due to its particle size,
contributing to fine particle emissions levels. More importantly, thermal fracturing of
catalyst particles occurred when the cold catalyst was fed into the hot regenerator. Catalyst
particles split causing the generation of large amounts of fine particle material, which is
easily lost from the system. This loading of catalyst directly linked to the period of high
concentration of fine particles in the emissions stream.
-i- -

It was found that metals, and in particular iron, calcium and silicon form a thick layer on the
outside of the catalyst, with large irregular shaped metal ridges, forming along the surface of
the particle. These ridges reduce the fluidity of the catalyst, leading to potential disruptions
in the regenerator. In addition to this, the metal rich ridges are preferentially removed via
attrition, causing metal rich material to be emitted into the atmosphere.
To overcome these high particle emissions rates from the FCCU the refinery should only use
calcinated catalyst to reduce the influence of thermal process and particle fracture and
generation. Although the calcinated catalyst can fracture when added to the system, it is far
less than that obtained with uncalicinated catalyst. To further reduce the risk of particle
fracture due to thermal stresses the refinery should consider reducing the temperature
gradients between the hot and cold catalyst. Due to the economics involved with the
regenerator, possible pre-warming of catalyst before addition into system is the preferred
option. This pre-heating of catalyst should also incorporate a controlled attrition stage to help
remove the build up of metals on the surface of the particles whilst allowing this material to
be collected before it can be released into the atmosphere. The remove of the metal crust will
also improve the fluidity of the system and reduce the chance of catalyst blockages occurring.
Finally, modelling of the system has shown that control of key parameters such as particle
size and gas velocity are essential to the management of air emissions. The refinery should
look at adjusting start up procedures to remove fluctuations in these key parameters. Also the
refinery should be careful in using correlation found in the literature to predicted operational
conditions in the system as these correlations are misleading when used under industrial
situations.
-ii- -

Table of Contents
Abstract ...........................................................................................................................i
Table of Contents......................................................................................................... iii
List of Figures ..............................................................................................................vii
List of Tables ...............................................................................................................xii
Acknowledgments..........................................................................................................1
Signed Statement ...........................................................................................................2
1 Introduction............................................................................................................3
2 Literature Review...................................................................................................5
2.1 Introduction to the oil industry ......................................................................5
2.2 The Industrial Oil Refinery............................................................................5
2.2.1 Processing Units.....................................................................................8
2.3 Catalytic Cracker .........................................................................................10
2.3.1 Rising Main..........................................................................................11
2.3.2 Reactor .................................................................................................11
2.3.3 Regenerator ..........................................................................................12
2.4 Catalyst Used at The Refinery .....................................................................12
2.4.1 Catalyst Management...........................................................................13
2.4.2 Impacts of Catalyst lost........................................................................14
2.5 Cyclones.......................................................................................................15
2.5.1 Design Theory......................................................................................16
2.5.2 Particle loading rates............................................................................19
2.5.3 Other Design Considerations ...............................................................20
2.6 Diplegs .........................................................................................................21
2.6.1 Valves ..................................................................................................23
2.7 Fluidization ..................................................................................................24
2.7.1 Brief History of Fluidized Beds...........................................................25
2.7.2 Main Processes Involved .....................................................................25
2.7.3 Transport Disengaging Height.............................................................28
2.7.4 Operating Velocities ............................................................................29
2.7.5 Fluidized Powders................................................................................31
2.7.6 Types of Fluidization ...........................................................................32
-iii- -

2.7.7 Fine Particle Fluidization and Agglomeration.....................................33
2.8 Catalyst Properties .......................................................................................33
2.8.1 Reaction rates.......................................................................................34
2.8.2 Types of FCC Catalyst.........................................................................35
2.8.3 Catalysts Deactivation .........................................................................36
2.8.4 Sintering...............................................................................................38
2.9 Particle Attrition...........................................................................................39
2.9.1 Attrition Mechanics .............................................................................40
2.9.2 Natural Grain size ................................................................................42
2.9.3 Attrition Models...................................................................................43
2.10 Entrainment..................................................................................................48
2.10.1 Theory ..................................................................................................48
2.10.2 Elutriation Rate Constant.....................................................................49
2.10.3 Modeling..............................................................................................51
2.10.4 Large Scale Systems ............................................................................53
2.10.5 Reducing Entrainment .........................................................................54
2.11 Emissions Problems.....................................................................................55
2.11.1 Overcoming Emissions limitations ......................................................56
2.11.2 Trouble-Shooting .................................................................................57
3 Research Proposal................................................................................................60
3.1 Methodology................................................................................................61
3.2 Experimental Equipment and Methodology ................................................61
3.2.1 Measuring Emissions levels.................................................................61
3.2.2 Catalyst Samples..................................................................................62
3.2.3 Particle Size Distribution .....................................................................62
3.2.4 Sample Inspections ..............................................................................62
3.2.5 Heavy Metal Tests ...............................................................................63
4 Identification of Start Up Emissions....................................................................64
4.1 Methodology and Procedure ........................................................................64
4.1.1 Emissions Sampling.............................................................................64
4.1.2 Identification of emitted catalyst .........................................................65
4.1.3 Theoretical Analysis ............................................................................65
4.2 Particle Emissions Results ...........................................................................66
4.3 Operational Results......................................................................................72
-iv- -

4.4 Catalyst Investigation Results......................................................................75
4.5 Discussion....................................................................................................79
4.5.1 Initial Stage ..........................................................................................79
4.5.2 Second Stage........................................................................................81
4.5.3 Third Stage...........................................................................................83
4.6 Conclusions..................................................................................................84
5 Particle Fracture ...................................................................................................85
5.1 Methodology for Investigating Particle Fracture.........................................85
5.2 Experimental Materials and Equipment Particle Fracture ...........................86
5.3 Experimental Procedure...............................................................................87
5.3.1 Catalyst ................................................................................................87
5.3.2 Mixing Tests ........................................................................................88
5.3.3 Particle Size Distribution .....................................................................89
5.4 Results and Discussion ................................................................................92
5.4.1 Experiments 1 & 2 ...............................................................................94
5.4.2 Mixing Tests ........................................................................................97
5.4.3 Filter Tests .........................................................................................104
5.5 General Discussion ....................................................................................115
5.6 Conclusions................................................................................................117
6 Particle Investigation .........................................................................................119
6.1 SEM Procedure ..........................................................................................119
6.2 Results & Discussion SEM........................................................................119
6.3 Conclusion .................................................................................................132
7 Fluidization Characteristics ...............................................................................133
7.1 Experimental Procedures ...........................................................................133
7.1.1 Fluidization tests ................................................................................134
7.1.2 Determination of Catalyst Physical Properties ..................................136
7.1.3 Contaminant Metal Tests – Total Levels ...........................................136
7.2 Results........................................................................................................136
7.2.1 Abrasion Tests ...................................................................................142
7.3 Discussion..................................................................................................146
7.4 Conclusion .................................................................................................147
8 Lab Emissions Tests ..........................................................................................149
8.1 Methodology..............................................................................................149
-v- -

8.2 Experimental Procedure.............................................................................151
8.3 Results........................................................................................................152
8.4 Discussions ................................................................................................161
8.5 Conclusion .................................................................................................165
9 Modelling...........................................................................................................166
9.1 Model Construction ...................................................................................166
9.2 Sensitivity Analysis ...................................................................................168
9.3 Genetic Algorithm .....................................................................................170
9.4 Results and Discussions.............................................................................171
9.4.1 Model Results: Stage 1 ......................................................................171
9.4.2 Sensitivity Results: Stage 1 Model ....................................................179
9.4.3 Sensitivity Results: Stage 2 Model ....................................................183
9.4.4 Genetic Algorithm Results.................................................................189
9.4.5 Comparison to Actual Data................................................................191
9.5 General Discussions...................................................................................198
9.6 Conclusion .................................................................................................199
10 Conclusions and Recommendations ..............................................................201
References..................................................................................................................205
Appendix A: Experimental Plans...............................................................................218
Appendix B: Modeling ..............................................................................................219
-vi- -

List of Figures Figure 2-1 Flow diagram of processes used at the Refinery..........................................8
Figure 2-2: Schematic of the FCCU used at the refinery.............................................10
Figure 2-3: Different regions of a standard dipleg.......................................................22
Figure 2-4: Representation of the various zones in a fluidized bed (Geldart 1986d) ..26
Figure 2-5: Four phases in the freeboard of a fluidized bed. .......................................27
Figure 2-6: Types of fluidization (Geldart 1986b) ......................................................32
Figure 4-1: A log particle size distribution of e-cat used during the start up, including
standard deviations................................................................................................66
Figure 4-2: Total emissions of catalyst over start up period........................................67
Figure 4-3: Coarse, mid-sized and fine particle emissions rates during start up. ........68
Figure 4-4: Emissions levels from the FCCU, 8 and 44 hours from commencement of
operations (the first stage). ....................................................................................69
Figure 4-5: Emissions levels from the FCCU, 66 and 91 hours from commencement
of operation (the second stage)..............................................................................69
Figure 4-6: Emissions levels from the FCCU 142 and 460 hours from commencement
of operation (the third stage). ................................................................................70
Figure 4-7: Stack temperature and volumetric flow rate obtained from the stack.......71
Figure 4-8: Percent catalyst level in the regenerator bed during start up. Crosses
indicate times of emissions sampling....................................................................72
Figure 4-9: FCCU cyclone inlet velocity (m/s) during the start up period. Crosses
indicate time of emissions sampling. ....................................................................73
Figure 4-10: Regenerator bed temperatures over the start up period. Crosses indicate
time of emissions sampling ...................................................................................74
Figure 4-11: Calculated removal efficiencies, Ei, for the regenerator's cyclone for
various velocities (m/s) and particle size (µm). ....................................................75
Figure 4-12: Plot of metal concentrations found in the emissions per unit weight vs
time since start up..................................................................................................76
Figure 4-13: Plot of metal concentration per unit weight according to particle size for
e-cat (right side), and of emissions at 460hrs (left side). ......................................77
Figure 4-14: Plot of metal concentrations according to particle size, found in the
emissions, per unit weight vs time since start up. ‘Small’ are particle less than
-vii- -

5.5µm in size while ‘Large’ are particles greater than 5.5µm. Note, the y-axis has
been truncated to allow detail to be seen in the lower ranges. ..............................78
Figure 5-1: Schematic of experimental setup ..............................................................87
Figure 5-2: Example of the optimization techniques used to derive the integrals for all
experiment. Figure ‘a’ shows the development of the curve for experiment 3,
using the 5 modes with Figure ‘b’ illustrating the splitting up of the curves into
intervals for area comparison. Note that pi = 1, i = 1, 2…5. ................................92
Figure 5-3: Plot of original particle size distributions for both fresh and e-cat samples
including standard deviation of measurements .....................................................93
Figure 5-4: Graph of the particle size distribution for fresh catalyst before and after
heating, including all standard deviations (Experiment 1)....................................95
Figure 5-5: Graph of the particle size distribution for e-cat catalyst before and after
heating, including all standard deviations (Experiment 2)....................................95
Figure 5-6: Influence of mixing on particle size for fresh catalyst..............................98
Figure 5-7: The before and after PSD for Experiment 3 (hot fresh mixed with cold
fresh), including standard deviations ....................................................................99
Figure 5-8: The before and after PSD for Experiment 4 (hot e-cat mixed with cold e-
cat), including standard deviations........................................................................99
Figure 5-9: The before and after PSD for Experiment 5 (hot e-cat mixed with cold
fresh), including standard deviations ..................................................................100
Figure 5-10: The before and after PSD for Experiment 6 (hot fresh mixed with cold e-
cat), including standard deviations......................................................................100
Figure 5-11: The before and after PSD for Experiment 7 (hot coarse e-cat mixed with
cold coarse fresh), including standard deviations ...............................................102
Figure 5-12: The before and after PSD for Experiment 8 (hot coarse e-cat mixed with
cold coarse e-cat), including standard deviations................................................102
Figure 5-13: The before and after PSD for Experiment 9 (hot coarse fresh mixed with
cold coarse fresh), including standard deviations. ..............................................103
Figure 5-14: Back Scattering SEM Images of the collection filter used with only fresh
catalyst (Experiment 3), with an image scale of 100µm. ....................................107
Figure 5-15: Back Scattering SEM Images of the collection filter used with only
coarse e-cat catalyst (Experiment 8), with an image scale of 100µm. ................108
Figure 5-16: High magnification Backscattered image of particles collected from
Experiment 3 at 4000x magnification (scale on image is 1.0µm).......................110
-viii- -

Figure 5-17: Average concentrations of metals found in catalyst samples, including
standard deviations..............................................................................................111
Figure 5-18: Average percentage concentration of Nickel found on the filters used to
collect aerosol emissions during the mixing experiments...................................112
Figure 5-19: Average percentage concentration of Iron found on the filters used to
collect aerosol emissions during the mixing experiments...................................112
Figure 5-20: Average percentage concentration of Vanadium found on the filters used
to collect aerosol emissions during the mixing experiments...............................113
Figure 5-21: Average percentage concentration of Molybdenum found on the filters
used to collect aerosol emissions during the mixing experiments ......................113
Figure 6-1: SEM backscattered image of a fresh catalyst particle (a) and an e-cat
particle (b). ..........................................................................................................120
Figure 6-2: Magnified SEM image of the fresh (a) and e-cat (b) particle surfaces, with
a scale of 1µm. ....................................................................................................121
Figure 6-3 SEM backscattered image of the cross section of a fresh catalyst particle
.............................................................................................................................123
Figure 6-4: Individual elemental image taken of the cross section of the fresh catalyst
showing the concentration of 8 elements. The intensity or brightness of the image
relates to the concentration present. ....................................................................124
Figure 6-5: SEM backscattered image of the cross section of an e-cat particle ........125
Figure 6-6: Individual image taken of the cross section of an e-cat particle showing
the concentration of eight elements.....................................................................126
Figure 6-7: SEM backscattered image of two joined e-cat........................................127
Figure 6-8: Individual images taken of the surface two joined e-cat particles showing
the concentration of eight elements.....................................................................128
Figure 6-9: SEM backscattered image of e-cat..........................................................129
Figure 6-10: The X-ray spectra obtained from the center of the fresh catalyst (a) and
the e-cat (b) particles. The scale provided in the top right corner reflects the total
count obtained from the X-ray detector and represents the scale of the y-axis, thus
the two graphs are almost identical in scale. The horizontal scale is the energy of
the detected X-rays .............................................................................................130
Figure 6-11: SEM image and X-ray spectra of the inside of a split e-cat particle.....131
Figure 7-1: Experimental setup for determining Umf.................................................135
Figure 7-2: Pressure drop as function of velocity showing onset of fluidzation .......138
-ix- -

Figure 7-3: Concentrations (wt%) of Iron and Nickel in each of the catalyst samples,
including standard deviations..............................................................................141
Figure 7-4: Backscatter SEM image of an e-cat particle after attrition. ....................143
Figure 7-5: SEM Images of collected catalyst material from the abrasion tests .......144
Figure 8-1: Photograph of the inside of the experimental regenerator showing the
cyclone diplegs and a viewing port on the right hand side. ................................150
Figure 8-2: Total emissions under normal operating conditions ...............................152
Figure 8-3: Total emissions under sealed dipleg conditions......................................153
Figure 8-4: Emissions rates under normal conditions, for various particle sizes ......154
Figure 8-5: Emissions rates under sealed dipleg conditions, for various particle sizes.
.............................................................................................................................155
Figure 8-6: Emissions rate of 0.8µm particles under normal conditions ...................156
Figure 8-7: Emissions rate of 0.8µm particles under sealed dipleg conditions .........156
Figure 8-8: Emissions rates of 4µm particles under normal conditions ....................157
Figure 8-9: Emissions rate of 4µm particles under sealed dipleg conditions ............157
Figure 8-10: Emissions rate of 20µm particles under normal conditions ..................158
Figure 8-11: Emissions rate of 20µm particles under sealed dipleg conditions ........159
Figure 8-12: Particle size distribution (PSD) of the catalyst before and after
experiments .........................................................................................................160
Figure 8-13: Particle size distribution of catalyst collected from the diplegs............160
Figure 8-14: Plot of emissions rate vs gas velocity under normal conditions ...........161
Figure 8-15: Plot of emissions rate vs gas velocity for sealed dipleg conditions. .....161
Figure 9-1: The main sections of the model ..............................................................167
Figure 9-2: Plot of Minimum Fluidization velocity against particle size. .................171
Figure 9-3: Plot of Terminal velocities using the Haider method (H) and the MaCabe
method (M)..........................................................................................................172
Figure 9-4: Elutriation rate constant vs particle size, for various bed velocities, with
average elutriation values indicated. ...................................................................174
Figure 9-5: Plot of Entrainment rates vs particle size for various bed velocities. .....175
Figure 9-6: Graph of cyclone removal effeciency as a function of particle size, for
various bed velocities ..........................................................................................176
Figure 9-7: Emissions rates (kg/s) vs particle size (µm), from the primary cyclone for
various bed velocities. .........................................................................................178
-x- -

Figure 9-8: Emissions rates (kg/s) vs particle size (µm) from the secondary cyclone ,
for various bed velocities. ...................................................................................178
Figure 9-9: Plot of the first order effects (mean and standard deviation) from using the
Morris Method.....................................................................................................179
Figure 9-10: Output from the New Morris Method with significant parameter pairings
highlighted...........................................................................................................180
Figure 9-11: Mean values for first order SA results for the Industrial and experimental
initial conditions..................................................................................................184
Figure 9-12: Standard deviations for the first order SA results for the Industrial and
experimental initial conditions. ...........................................................................184
Figure 9-13: Mean values (Lambda) for the second order SA results for the Industrial
initial conditions..................................................................................................185
Figure 9-14: Mean values (Lambda) for the second order SA results for the
Experimental initial conditions. ..........................................................................186
Figure 9-15: Standard deviation of lambda (second order SA) results for the industrial
condition..............................................................................................................187
Figure 9-16: Standard deviation of lambda (second order SA) results for the
experimental condition........................................................................................187
Figure 9-17: Predicted emissions rate vs time for experimental conditions using
different elutriation correlations..........................................................................191
Figure 9-18: Predicted emissions rate vs time for industrial condition using various
elutriation correlations.........................................................................................192
Figure 9-19: Predicted emissions rates from the industrial conditions without attrition
.............................................................................................................................193
Figure 9-20: Predicted attrition rates for the three predominate attrition sources. ....193
Figure 9-21: The mean first order sensitivity results for altered attrition terms.......194
Figure 9-22: The first order standard deviation results for altered attrition terms.....195
Figure 9-23: The second order lambda sensitivity results for the altered attrition terms.
.............................................................................................................................195
Figure 9-24: Total emissions rates predicted from the model when each attrition term
is altered by a fixed amount. ...............................................................................196
Figure 9-25: Predicted and actual PSD obtained from running the stage 2 model and
the experimental regenerator...............................................................................197
-xi- -

List of Tables
Table 5-1: List of experiments including the percentage of mass lost to the filters and
their corresponding rank order in terms of mass loss............................................88
Table 5-2: The change in the ‘before’ (Ib) and ‘after’ (Ia) particle size distribution
curves for each experiment including paired t-test significance for specific sized
particles within the range of integration................................................................94
Table 5-3: Rank order of metal concentrations obtained from the filters..................114
Table 6-1: Occurrence of Metals found on the surface of fresh catalyst as well as the
surface ridges and gullies of e-cat, including standard deviation .......................122
Table 7-1: Physical properties of the catalyst samples including standard deviations.
.............................................................................................................................137
Table 7-2: Experimental results for Umf, Umb and Umb/Umf .......................................139
Table 7-3: Comparison of experimental results with published correlations. ...........141
Table 7-4: Elemental analysis of collected material ..................................................145
Table 9-1: Ranges of values for each input parameter fro the FCCU model ............167
Table 9-2: TDH values under refinery conditions (velocity approximately 0.6m/s).173
Table 9-3: Optimal operating conditions to minimise particle emissions from the stage
2 model using both Industrial and Experimental initial conditions determined
from the Genetic Algorithm, including coefficient of variance. .........................189
-xii- -

Acknowledgements I would like to acknowledge and thank my school, facility and university for the
countless number of people that have helped me through the last three years. The
library staff, research assistants, lab technicians and of course the school and faculty
administrators who are always around when needed. To Igor and Roger, my thanks
for the continual guidance, meetings, discussions and of course proof reading which
you two have silently endured over the past three years - you were of great help to
me. I would like to thank Martin, Rob, Mark and the Lytton refinery as well as staff
at the QUTGU electron microscope facility and, for their support, guidance and
willingness to answer all sorts of questions over the past years. To my family, thank
you for both the emotional and financial support throughout my university studies.
Finally, I would like to thank the one person who has made all of this possible, my
loving wife Julie. If I didn’t have you in my life then none of this would be possible,
thank you.
-1- -

Signed Statement This work has not previously been submitted for a degree or diploma in any
university. To the best of my knowledge and belief, the thesis contains no material
previously published or written by another person except where due reference is made
in the thesis itself.
-2- -

1 Introduction The oil industry is a major part of the world economy, with direct investments of over
US$111 billion per year, and with further investments in subsidiary activities related
to the industry. The refinery capacity for the world is approximately 80.4 million
barrels per day (Armengol and Germain 2000a; b). However, the average age of
operational refineries is becoming older, with fewer new refineries being constructed,
due mainly to the increase in construction costs. Despite the size of the industry, it is
highly competitive and any improvements that can be made to existing facilities will
prolong the life of the existing refineries as well as increasing their profitability.
An essential part of an oil refinery is a Fluidized Catalytic Cracker Unit (FCCU)
which uses catalyst to break up long chained hydrocarbon molecules into shorter
more valuable ones such as petrol. The catalyst is an essential part of the refining
process, and it suffers both contamination and deactivation in the FCCU. The
catalyst is also subject to particle attrition and erosion as it circulates through the
FCCU. The fine particles which are generated may escape to the atmosphere in the
exhaust streams of the refinery. The catalyst is expensive, thus any reduction in
emissions losses will impact positively on the economic position of a refinery. In
most refineries, attempts are made to capture these fine particles using cyclones.
Other more expensive ‘end-of-pipe’ technologies, such as scrubbers and electrostatic
precipitators are also used. It has been observed that the particle emissions can be
elevated when a FCCU is started up (Agranovski and Whitcombe 2001; Agranovski
and Whitcombe 2002)
There is a growing awareness of pollution problems and emissions from industrial
plants such as oil refineries and FCCU’s. The increasing strictness of legislation
world wide has led to a situation where by oil refineries must continually reduce their
emissions (Eagleson and Weaver 1999). This legislative pressure is also forcing oil
refineries to update and upgrade plant and operating procedures on an ongoing basis.
Any decrease in the emissions levels during start up, or under normal operations will
assist the oil refineries to meet legislative requirements as well as reduce financial
losses. In terms of air pollution and particle emissions, fine particles (or fines) are
smaller than 2.5µm in size.
-3- -

Due to a lack of understanding on the causes of the elevated start up emissions, and
how emissions generally can be reduced, an Australian oil refinery sponsored a
research project at Griffith University, to investigate these problems. As an industry
based project, the refinery sought a practical assessment of the causes of the start up
emissions, and advice on how to manage both the start up and operating emissions.
The refinery sought both scientific understanding as well as practical
recommendations to help them control and manage the emissions without the need
for expensive ‘end of pipe’ air pollution control equipment.
Do to the complexity of the issues involved with the study of particle emissions from
a FCCU, a wide range of issues needed to be studied and analysed to provide a
holistic approach to the control of emissions. A detailed assessment of one factor,
although a more standard approach to a thesis, would not provide the overview of
issues required by the refinery. The project was therefore developed with the
industrial aims in mind and with the need to address a large number of operational
issues. In particular, the refinery was interested in a measurement of the actual
emissions from the system, a study of the operational conditions that lead to
emissions and how aspects of the operation influence emissions. To achieve these
goals the project was initiated with a detailed literature review of issues relating to
FCCUs.
This thesis uses a detailed literature review to introduce the oil refinery processes
generally, and the details of the Australian oil refinery which initiated and funded the
research. The detailed aims and objectives of the thesis will be developed following
the literature review. Although this thesis is not confidential the exact Australian oil
refinery is not explicitly identified. The reference “the refinery” is used when
referring to the facility.
-4- -

2 Literature Review
2.1 Introduction to the oil industry
The oil industry world wide accounts for over US$111 billion a year in direct investments not
to mention all of the subsidiaries which survive on the oil industry (Armengol and Germain
2000a). Part of that investment is spent in oil refineries world wide, and although the recent
Asian and Russian economic crises have slowed the development of refineries, world oil
refining capacity is still 80.4 million barrels per day (Armengol and Germain 2000b).
Another major sub-industry, worth over US$10.2 billions a year is the world wide demand
for catalyst with 18% of this demand being for petroleum production, either FCC or
hydrotreating catalyst (Armengol and Germain 2000b).
There is a large variation in the quality and type of crude oil produced, and each crude supply
has different distillation properties. No two oil refineries are exactly the same as they are
designed and built for a specific crude, or range of crude, as feed stock. Crude oil production
and the properties of the crude oil produced, are not static and actually change over time,
even within the same production fields. Accurately forecasting the type and composition of
crude oil available to a refinery is difficult, therefore modern oil refineries are designed to
operate on a range of crude oil, thus maximise productivity while ensuring the facility is
robust enough to handle non-optimal feedstock if the need arises (Stittig 1978).
Operational oil refineries are becoming older, with fewer new refineries being constructed,
due mainly to the increase in construction costs of new refineries. This means that any
improvement that can be made to existing facilities, no matter how small, will increase
profitability and enable old plants to be used longer. No two refineries are the same, although
they can be broadly grouped into one of five styles of refinery depending on the end product.
These five categories are topping, fuel oil, gasoline, lube oil and petrochemical (Stittig 1978).
2.2 The Industrial Oil Refinery
The petroleum refining industry is by far one of the most complex and technically
sophisticated industries in the world today (Stittig 1978). Each refinery has a wide range of
-5- -

integrated process units, depending on the feedstock being processed and the desired end
product
Australia currently has eight operating refineries with a total capacity of approximately
800,000b/sd (barrels per stream day). As refining is a very capital intensive process, with
large fixed and low variable costs, maximising throughput is necessary to achieve a
reasonable profit. The capacity utilisation in Australia has increase from 80% in 1983 to
90% in 1995 (ACIL 1997). To ensure a greater return is made on investments, it is essential
that risks are minimised and cost saving techniques implemented.
The refinery used in this thesis is situated on the bank of the Brisbane river. The refinery was
designed and built by Bechtel International and came on line in 1965. The refinery was
originally designed to process sweet Indonesian crude with a capacity of 6,000 tonnes or
45,000 barrels per day, of raw crude oil. With the discovery and subsequent exploration of
the Bass Strait oil reserves the facility changed to a feed stock of 100% Australian produced
crude oil (Caltex 2000). The refinery is Queensland’s largest, suppling two thirds of the
state’s petrol (Caltex 1995). It is a gasoline refinery which uses extensive cracking and
upgrading units to maximise the production of gasoline from crude oil. The raw crude is split
into its fractions, with the heavy and light fractions being further treated to increase gasoline
production. The final gasoline product is a mixture of the various streams and is blended at
the end of the refining process.
Throughout the 1970’s and 1980’s the refinery has under gone several expansions, the most
recent being in 1997, to lift throughput capacity to 13,200 tonnes of raw crude oil per day
(Caltex 2000). Some of the changes also relate to the increasingly stringent environmental
constraints being applied to the emissions from the refinery. With the deregulation in the
Australian crude oil market, the refinery has a larger selection of crude oils, in respect to both
price and quality, to process.
After the deregulation of the Australian oil industry, supply options increased and now the
main source of crude oil is sweet South East Asian region, Papua New Guinea, Timor Sea
fields and South West Queensland. The facility is not equipped to process the more sour
Middle East crude oils (Caltex 1995).
-6- -
One third of the refinery’s product is distributed along the eastern seaboard of Australia by
tankers, with the rest being piped under the river to mainland terminals along the Northern
shore of the Brisbane river. There is also a Lytton terminal situated alongside the refinery for
road distribution. Current typical yields for the facility are given in Table 2.1.
Table 2.1: Current typical yields for the Refinery
Product Type Weight % Yield
Gas and LPG 1
Gasoline (Premium, Unleaded, Leaded) 50
Kerosene / Jet Fuel 12
Diesel 30
Fuel Oil 2
Refinery Fuel Used 2
The refinery produces three types of gasoline, lead replacement, unleaded regular and
unleaded premium. Lead is used as an additive in the gasoline to raise the octane level of the
gasoline and prevent pre-ignition (knocking) from occurring. In line with Queensland
regulations, lead is to be phased out of gasoline in the coming years (Caltex 2000).
-7- -
2.2.1 Processing Units
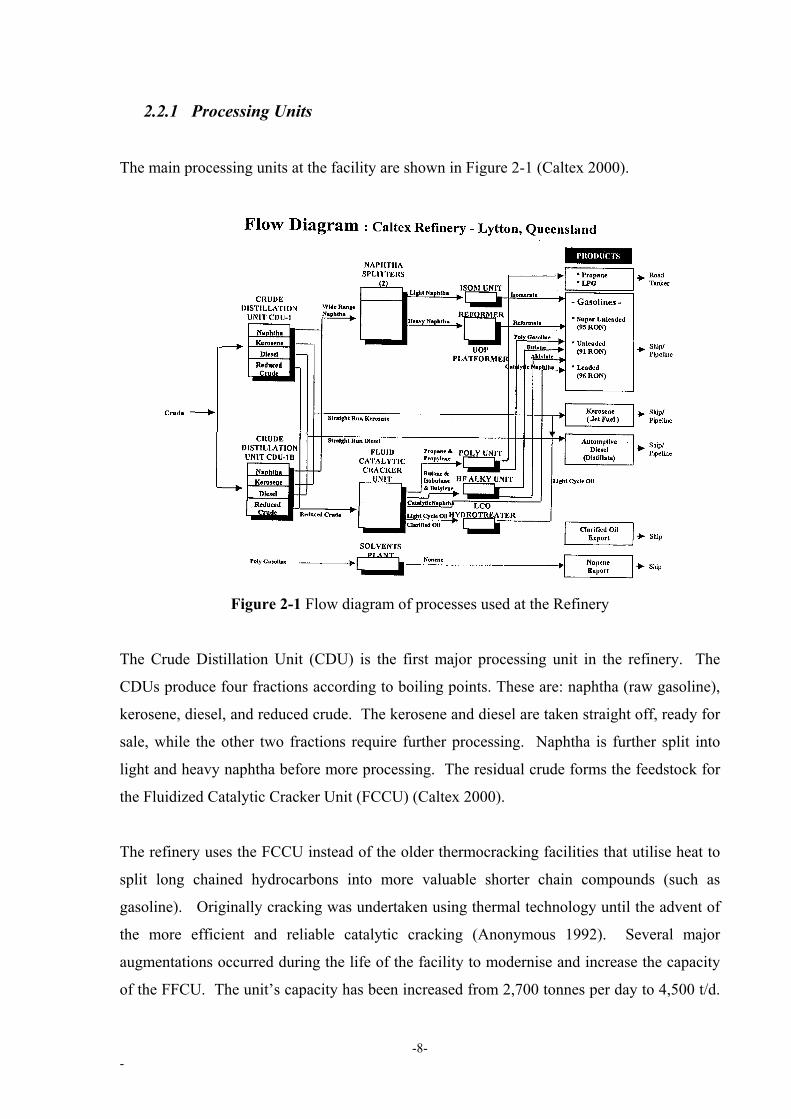
The main processing units at the facility are shown in Figure 2-1 (Caltex 2000).
Figure 2-1 Flow diagram of processes used at the Refinery
The Crude Distillation Unit (CDU) is the first major processing unit in the refinery. The
CDUs produce four fractions according to boiling points. These are: naphtha (raw gasoline),
kerosene, diesel, and reduced crude. The kerosene and diesel are taken straight off, ready for
sale, while the other two fractions require further processing. Naphtha is further split into
light and heavy naphtha before more processing. The residual crude forms the feedstock for
the Fluidized Catalytic Cracker Unit (FCCU) (Caltex 2000).
The refinery uses the FCCU instead of the older thermocracking facilities that utilise heat to
split long chained hydrocarbons into more valuable shorter chain compounds (such as
gasoline). Originally cracking was undertaken using thermal technology until the advent of
the more efficient and reliable catalytic cracking (Anonymous 1992). Several major
augmentations occurred during the life of the facility to modernise and increase the capacity
of the FFCU. The unit’s capacity has been increased from 2,700 tonnes per day to 4,500 t/d.
-8- -

The FCCU represents a major component of the refinery and any improvements in this
system will deliver substantial and palpable improvements to the entire refinery, both in
profit margin and product supply (Caltex 2000).
The cracking reaction is catalysed by acidic surfaces and proceeds with carbonium ion
intermediates on the surface of the catalyst (Heinemann 1983). The vaporised oil is brought
into contact with a free flowing catalyst in a rising main. In the presence of the catalyst, the
longer chained molecules are cracked (split) into smaller chained molecules. This process
unit forms the basis of this thesis and is described in detail later.
Other important process units used on site are the polymerisation and alkylation units.
Polymerization is where propylene and butylene are transformed into gasoline stocks through
the use of phosphoric acid and crushed quartz or other porous catalyst containing kieselguhr
clay (Anonymous 1992).
Alkylation is the process of reacting aromatic or paraffinic hydrocarbons and oelfin
components of the feed stock together in the presence of an acid to produce high octane
gasoline. The refinery utilises the hydrofluric design for alkylation (Stittig 1978).
-9- -

2.3 Fluidized Catalytic Cracker
Figure 2-2: Schematic of the FCCU used at the refinery
Fluidized Catalytic Cracking (FCC) is a high temperature, low pressure system used to
convert long chained hydrocarbons into shorter, more valuable compounds. As seen in Figure
2-2, a FCCU has three main components, the rising main, reactor and regenerator. The
FCCU used at the refinery utilises a two-stage cyclone configuration for solids removal on
the flue gas stream. There are six pairs of cyclones present, the primary cyclones being
7,576mm long by 1,466mm wide and the secondary cyclones being 7,934mm long by
1,331mm wide.
A FCCU is a very complex machine to understand and operate correctly. Reaction kinetics,
catalyst hydrodynamics, coke combustion, process economics, heat balances between reactor
and regenerator, and finally operating constraints all affect and impact on the FCCU's
-10- -

operation. All of these processes are in balance with each other, meaning that changing one
will impact on others, either immediately or over a longer period of time (Lin 1993).
The major operational constraints placed on the cracking process are the metallurgical limits
of the equipment and flow rate through the system. As the nature of the feedstock being
processed is continually changing, pressure is placed on the FCCU, often reducing the
flexibility of the process and making optimal running of the facility a challenge (Lin 1993).
2.3.1 Rising Main
The vaporised feed oil is fed into the bottom of the rising main where it is mixed with catalyst
from the regenerator. In the rising main, the catalyst and vaporised oil mix, causing the long
chained oil compounds to react with the catalyst, splitting them into smaller chained
molecules. During the reaction, coke (carbon) is deposited onto the surface of the catalyst ,
thus reducing its ability to further crack hydrocarbons.
2.3.2 Reactor
The reactor is situated at the top of the rising main. Historically the cracking reaction would
occur inside this vessel, but with the increase in catalyst reactivity and process design, this is
no longer the case. Modern FCCUs units use the reactor as a separating device, to separate
the catalyst and cracked vapours as fast as possible. If this is not done, the vapours will be
cracked again, shortening the compounds further and reducing gasoline yields (Hodgson
2000).
The hydrocarbon and catalyst mixture hit a deflector at the top of the rising main, causing the
majority of the catalyst to fall to the bottom of the vessel. The volatile hydrocarbons are
withdrawn from the top of the vessel through a series of cyclones (Hodgson 2000).
The catalyst falls through a stream stripper, which injects stream through the catalyst to
dislodge any remnant hydrocarbons from the catalyst. The catalyst is then transported into
the regenerator. Correct operation of the steam stripper is important to ensure minimal
quantities of hydrocarbons are carried into the regenerator with the catalyst. Once in the
regenerator, hydrocarbons will combust generating temperature volatility and reducing the
overall efficiency of the system (Hodgson 2000).
-11- -

2.3.3 Regenerator
As the name suggests, the regenerator is used to regenerate the catalyst which has had high
levels of coke deposited onto its surface, thus enabling it to be used again. The regenerator
contains a fluidized bed of catalyst. A controlled amount of air is supplied to the fluidized
bed and the coke is burnt off the catalyst, although complete combustion is not achieved. The
heat released from this reaction heats the catalyst, which in turn provides the necessary
energy for the cracking process in the rising main. Flue gas exits the regenerator though a
series of internal cyclones located at the top of the system (Stittig 1978). Regenerated
catalyst passes from the regenerator, back into the rising main.
Coke levels are determined by feed quality and reactor specifications and alteration of the
coke level will reduce/increase heat generation. The change in one operating condition will
impact on the equilibrium operation of another, normally in a non-linear manner (Lin 1993).
The flue gas exiting the regenerator contains catalyst material and is released into the
atmosphere. As the regenerator is the only source of catalyst emissions directly into the
atmosphere, this specific unit needs to be studied to reduce particle emissions from the
FCCU.
All components of the regenerator (including cyclones) are covered in an erosion and heat
resistant non-metallic layer. This layer is worn away during the operational life of the
regenerator, but as it is only replaced once every 4 to 5 years, the rate of wear is minimal.
This low rate of wear, combined with the non-metallic, almost cement like nature, of the
coating, is not significant to this study.
2.4 Catalyst Used at The Refinery
The refinery currently uses an extra coarse grade catalyst supplied by Akzo Nobel. There are
four catalyst suppliers worldwide and the refinery selects its catalyst based on catalyst
properties, cost and technical support from the vendor. The refinery only uses fresh catalyst,
as the cost and logistics of obtaining e-cat outweighs the possible benefits gained from it
(Hodgson 2000). E-cat (equilibrium catalyst) is catalyst which has been circulated inside a
FCCU and is removed to allow room for the addition of fresh catalyst. Often e-cat still has
-12- -
some residual activity which can be of benefit to another refinery, and thus may be purchased
as discarded e-cat for use in conjunction with fresh catalyst.
2.4.1 Catalyst Management
To ensure required activity levels in the FCCU, catalyst is removed from the system on a
regular basis (15-20 tonnes per month) and is replaced with fresh catalyst. This balance of e-
cat and fresh catalyst inside the FCCU enables a relatively constant activity level to be
maintained. Removed catalyst is disposed at a regulated land fill. In addition to the active
removal of catalyst from the FCCU, catalyst is also lost through the reactor and regenerator.
Some catalyst will not be completely removed from the product stream in the reactor and will
flow along with the cracked hydrocarbon further along the product stream, eroding hardware
in the main fractionator, until it collects in a slurry settler. It is then recycled back into the
rising main. Any additional catalyst material which settles out in the product line is cleaned
out as required and sent to cement factories as the hydrocarbon content provide extra fuel for
their kilns (Hodgson 2000).
The other source for catalyst loss is through the regenerator and into the atmosphere.
According to the results of air tests conducted by the refinery, an average of 400g/min
(210,240 kg/year or approximately 270mg/m3) of catalyst is lost from the regenerator, based
on a four year average. This average does not take into account non standard conditions
(start ups) which occur on average 1–2 times per year and are believed to have substantially
higher emissions rates, although this has not been confirmed by stack tests (Preslmaier 2000,
Caltex, 1998 #138).
Currently the Queensland EPA license agreement for the emissions from the refinery is 690
g/min of total suspended particulates (TSP), with a drop to 600g/min (approximately 405
mg/m3) likely in the future. Catalyst deposition rates around the refinery are monitored and
modelled using a Gaussian plume model (Ausplume) annually. Modelling results indicate
that on the basis of a 24 hour average for the annual average, all concentrations were usually
below the guidelines for TSP and particles below 10 microns in size (PM10) (Caltex 1998).
-13- -

2.4.2 Impacts of Catalyst lost
Obviously the greatest impact of catalyst loss is the financial cost of purchasing new catalyst
to maintain activity rates. Reducing catalyst loss will reduce the overall consumption of fresh
catalyst.
2.4.2.1 Potential Health Impacts
In recent years there has been an increase in environmental regulations relating to air
pollution in industry. Stricter legislation world wide, as well as increased concern regarding
the possible environmental and health effects caused by industrial air pollution, has led to a
situation where industries, including oil refineries, must continually reduce the level of
pollution emitted from their facilities (Eagleson and Weaver 1999; Gelevan and Siegell 2000;
Hogue 2000; Johnson 2000; Yang 2000; Johnson 2001).
It has been estimated that over 350,000 metric tonnes of spent catalyst (or e-cat) is produced
per year worldwide (Schmitt 1991). As catalyst is deactivated via contamination with
compounds such as heavy metals, spent catalyst has over 2,000ppm on average of total nickel
and vanadium (Schmitt 1991).
Oil companies and catalyst suppliers such as Chevron and WR Grace have preformed
leachate tests on spent catalyst. They have found that the heavy metals did not generally
migrate into the leachate and even if they did, it was below hazardous levels, although no
quantitative levels were quoted (Rodwell 1998).
Although scientific information on the health impacts of e-cat is sparse, a Refinery in NSW
was recently fined $25,000 for an accidental release of e-cat from their FCCU (Lloyd 1998).
In that case, it was found that the e-cat material “Would have the potential to cause
irritation…” and “There is insufficient information to comment on the long term effects of
exposure to the catalyst” (Lloyd 1998).
Although fined, there was conflicting evidence submitted to the court on the toxicity of the e-
cat. An affidavit from Hyne (1998) concludes that the catalyst matrix structure of silica and
aluminium oxide was very stable and non toxic, although the e-cat was deemed to have a
medium toxicity. The findings were based on two main conditions, firstly leachate tests with
-14- -

the results applied to marine biota and secondly, general concern over the presence of heavy
metals such as nickel oxide and vanadium pentoxide, which may cause cancer (Hyne 1998).
Another affidavit by Bryant (1998) describes the discomfort and irritation caused by the
catalyst cloud as it reached nearby homes. It was concluded that the irritation was caused by
the contaminants on the catalyst material and/or because of the fine respirable nature of the
catalyst cloud. Bryant (1998) also described how some of his plants had developed black
markings on their leaves and stunted growth after exposure to the e-cat, although no scientific
evidence was presented identifying the e-cat as directly responsible.
Material Safety Data Sheets (MSDS) for the FCCU catalyst, class the material as non-toxic,
but caution against inhalation due to the fine nature of the particles (AKZOCHEM 1998).
Obviously, more research is needed into the possible toxic impacts of e-cat, as the
contaminants, rather than the catalyst material could pose health risks. Another concern is
that the research to date concentrates on leachate tests and possible toxic impacts to marine
biota, with no direct reference to human health impacts due to long term exposure.
Whatever the case, reducing catalyst emissions from FCCU’s would reduce particulate
emissions as well as reduce the potential for environmental harm caused by the particles. As
start ups are the largest cause of emissions, a practical and cost effective management
strategy is needed.
2.5 Cyclones
Internal cyclones are widely used in FCCU regenerators to remove catalyst particles from the
flue gas stream and return these particles back to the fluidized bed. Since their development
in the late 1800’s, cyclones have become the most common mechanical separation device
used in industry (Ray et al. 1997). Cyclones operate by rotating the entering gas stream,
causing the heavier particulate material to be drawn out of the air stream, towards the outer
wall of the cyclone where a laminar barrier exists. Once the particle contacts this laminar
region, gravitational forces cause the particle to slide down the vessel and out of the gas
(Cooper and Alley 1994; Alley 1998). The collected particles then exit through a dipleg at
the bottom of the cyclone, while the exhaust gas is expelled at the top.
-15- -

Cyclones are an integral part of modern FCCUs, and under normal operating conditions, will
have a peak removal efficiency at approximately 30-40µm, allowing all particles larger than
that to be fully recovered with the degree of collection of smaller particles depending on the
type of cyclone and material in question (Cooper and Alley 1994; Fletcher 1995; Rhodes
1998).
The use of cyclone separators to remove particle contamination still remains one of the most
attractive forms available to industry. Cyclones have a lower capital investment and lower
operating costs compared with cloth filtration or electrostatic precipitation (Schmidt 1993).
The refinery in question utilizes a series of 12 internal cyclones, arranged in six groups of
two. This arrangement provides a larger primary cyclone to remove the majority of the
particles from the air stream, before entering the secondary cyclone. The cyclone
configuration used at the refinery is sufficient to remove the majority of the particles from the
air stream and allows the refinery to meet all required environmental licenses.
2.5.1 Design Theory
The majority of cyclones are designed and operated on a force balance principle. Air enters
the cyclone and is spiraled into the cylindrical separating chamber. Gas flows through the
cylindrical section in a spiral or vortex, towards the center and discharges though the exit
pipe. As the gas moves spirally, centrifugal forces act on the particles, causing the larger
particles to be thrown against the wall of the cyclone. The finer particles remain suspended
in the gas through drag forces and exit the cyclone in the gas stream (Schmidt 1993; Cooper
and Alley 1994).
Little significant change has been made to design theory for cyclones since the original work
done by Rosin et al, as discussed in Theodore and Buonicore (1988). This original work
defined the particles that could be collected as those which could cross the width of the gas
stream lines (cyclone inlet width) during the residence time of the gas in the cyclone
(Theodore and Buonicore 1988; Cooper and Alley 1994). Although reasonably accurate, the
theory did not take into account changes in cyclone performance due to the physical
dimensions of the cyclone or loss of cyclone performance due to excessive velocity, and an
-16- -

assumed simplistic approach to drag force calculations (Cooper and Alley 1994). The
minimum particle size completely collected is given by:
( )21
min, 29
−=
Gpit
cGp vN
Bd
ρρπµ
, (2-1)
where dp,min is the minimum particle diameter completely separated from the gas stream; µG is
the gas viscosity; Bc is the width of the cyclone inlet duct; Nt is the Number of turns of the
gas stream in the cyclone; vi is the gas inlet velocity; ρp is the particle density and ρG is the
gas density (Theodore and Buonicore 1988; Cooper and Alley 1994).
The overall collection efficiencies can be calculated by determining the individual particle
fraction collection efficiency from
2
1
1
+
=
dd c
iε , (2-2)
where εi is the size fraction collection efficiency, d is the particle diameter and dc is the cut
diameter of the cyclone. The cut diameter is the particle size which is collected by the
cyclone at an efficiency of 50%.
Later, this theory was extended by Lapple, as discussed in Theodore and Buonicore (1988)
using the assumption that the gas flow through a cyclone consists of a rigid spiral motion
where the rotational velocity of that spiral equals the average cyclone inlet velocity.
Although simplistic, this theory was widely used until Leith and Licht, as discussed in
Theodore and Buonicore (1988), identified three mechanisms leading to back mixing and
reduced efficiencies. These main mechanisms are: 1) as gas below the exit duct moves
inward, it tends to drag particles with it; 2) turbulence and eddies will aid in back-mixing;
and 3) particles can bounce off walls and be re-suspended in the gas stream.
-17- -
There have been several attempts to develop cyclone theory from first principles, such as a
novel approach outlined by Kalen and Zenz (Theodore and Buonicore 1988) who used
saltation velocity theory (particle precipitation out of gas), but none have been successful.
Presently there is a tendency to rely on well known empirical relationships to determine
cyclone efficiencies as described in equation 2-1.
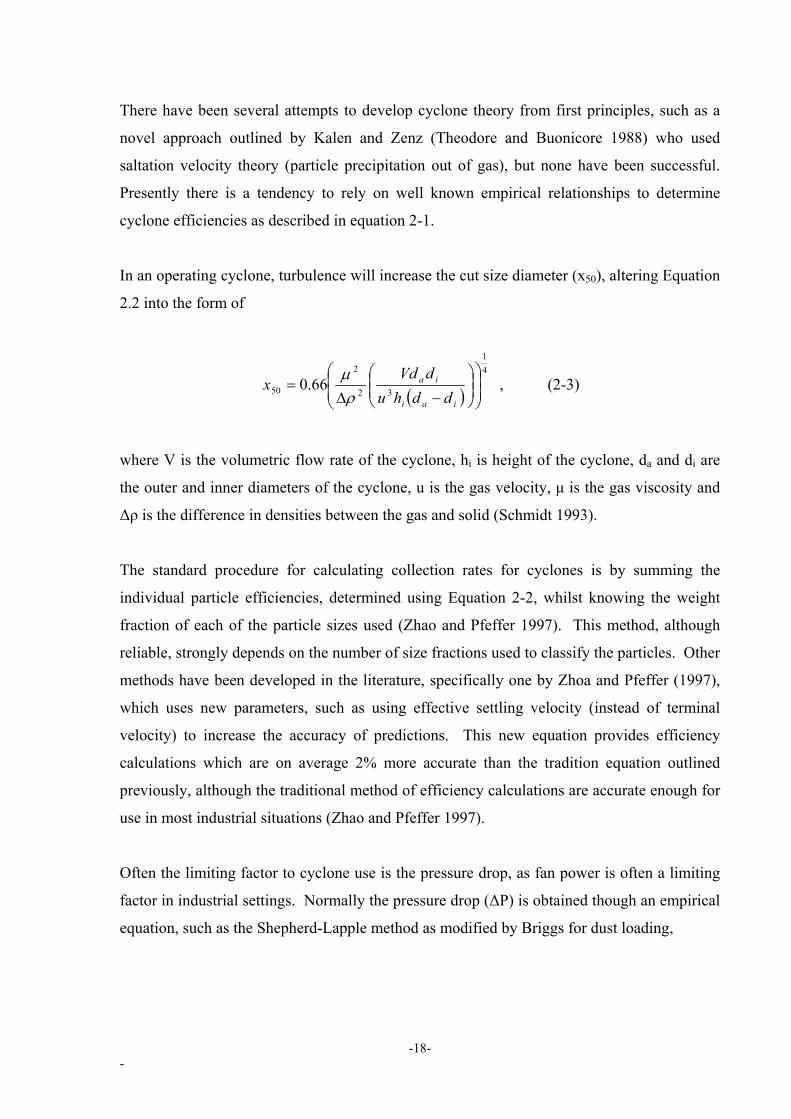
In an operating cyclone, turbulence will increase the cut size diameter (x50), altering Equation
2.2 into the form of
( )41
32
2
50 66.0
−∆=
iai
ia
ddhudVd
xρ
µ , (2-3)
where V is the volumetric flow rate of the cyclone, hi is height of the cyclone, da and di are
the outer and inner diameters of the cyclone, u is the gas velocity, µ is the gas viscosity and
∆ρ is the difference in densities between the gas and solid (Schmidt 1993).
The standard procedure for calculating collection rates for cyclones is by summing the
individual particle efficiencies, determined using Equation 2-2, whilst knowing the weight
fraction of each of the particle sizes used (Zhao and Pfeffer 1997). This method, although
reliable, strongly depends on the number of size fractions used to classify the particles. Other
methods have been developed in the literature, specifically one by Zhoa and Pfeffer (1997),
which uses new parameters, such as using effective settling velocity (instead of terminal
velocity) to increase the accuracy of predictions. This new equation provides efficiency
calculations which are on average 2% more accurate than the tradition equation outlined
previously, although the traditional method of efficiency calculations are accurate enough for
use in most industrial situations (Zhao and Pfeffer 1997).
Often the limiting factor to cyclone use is the pressure drop, as fan power is often a limiting
factor in industrial settings. Normally the pressure drop (∆P) is obtained though an empirical
equation, such as the Shepherd-Lapple method as modified by Briggs for dust loading,
-18- -

+
=∆ −
10057.0110*19.8
20
23
i
iiig CD
WLvQP , (2-4)
where vi is the inlet velocity (cm/s), Ci is the inlet dust loading (g/m3), Qg is gas flow rate and
L, W, D are cyclone parameters obtained from design tables (Theodore and Buonicore 1988;
Cooper and Alley 1994).
An increase in inlet velocity and pressure drop will increase removal rates as the centrifugal
forces acting on the particle increases, but only up to a point. At some maximum velocity, re-
entrainment (re-suspension) will occur due to the formation of turbulence in the system.
Particle re-entrainment can also occur when the bottom of the cyclone vortex comes into
contact with dust material, either though direct contact with the dust hopper or particles
remaining at the bottom of the cyclone (Theodore and Buonicore 1988).
As cyclones have no moving parts, it is very difficult to increase removal efficiencies once
the cyclone has been installed. Reducing leaks from the cyclone and ensuring correct
collection hopper design will reduce the chance of re-entrainment and improve collection
efficiencies.
2.5.2 Particle loading rates
Cyclone removal efficiencies and pressure drop are the two main parameters of interest to
engineers. Generally cyclones are used in situations where solid loading rates are less than 1
kg solid/kg gas and it is not fully understood how increasing these particle loading rates will
influence collection rates (Fassani and Leonardo Jr 2000).
It is known that a decrease in pressure drop across a cyclone occurs when particles are
introduced into the gas stream. This phenomena is attributed to particle inertia as particles
will tend to equalise the gas momentum of adjacent layers as well as decreasing the tangential
velocity inside the cyclone due to particle friction (Fassani and Leonardo Jr 2000). Thus, the
addition of particles into a gas stream will cause the cyclone to gain efficiency.
-19- -
It is also believed that a slight increase in the cyclone collection rate can be achieved through
an increase in particle loading. There are a number of mechanisms proposed in the literature
for this phenomenon. A limited carrying capacity of the gas would allow larger particles to
sweep across the cyclone, carrying smaller particles along with them. Another possible
reason for increased efficiencies is changes in the flow characteristics of the gas stream (Ray
et al. 1997; Fassani and Leonardo Jr 2000). A review of the literature by Fassini and
Leonardo Jr. (2000) has shown that a number of researchers carrying out experiments using
cyclone loading rates of between 10-3 and 6kgs solids per kg air, have all shown an increase
in removal efficiencies with an increase in the solid loading. Most of the researchers agree
that the smaller sized particles exhibited the largest gain in removal rates due to increased
particle loading (Fassani and Leonardo Jr 2000). In contrast to this, Ray et al (1997)
mentioned that size distribution of emitted particles is relatively independent of the cyclone
loading rates. Obviously there is some dispute about whether cyclone loading rates affect
particle distributions exiting the system or just total collection rates, although it is likely that
both are linked to each other.
Further experimental work done by Fassini and Leonardo Jr. (2000) showed that collection
rates were increased by approximately 1.5% with an increase in the solid loading until a
maximum of 12 kg solid per kg air was reached. At this loading rate, the collection rate
began to decline. The work by Fassini and Leonardo Jr. (2000) further supports that belief
that it is the larger particles sweeping through the cyclones which help to increase the
collection efficiency of the finer particle sizes.
2.5.3 Other Design Considerations
In addition to adjusting operating conditions, alternative cyclone designs have been suggested
to increase cyclone collection efficiencies. Through the use of vortex finders, post cyclone
attachments and adjusting the inlet configurations, particle attrition as well as overall
collection efficiencies can be increased (Molerus and Gluckler 1996; Ray et al. 1997). The
use of these designs is beyond the scope of this thesis, due to cost and other constraints
placed on the thesis project. However it must be noted that slight adjustments to cyclone
design may help to reduce overall emissions from the industrial FCCU.
-20- -

2.6 Diplegs
Diplegs or downcomers are pipes used to transport collected solids from a cyclone back into
a fluidized bed. As primary cyclones used in FCCUs remove roughly 98% of entrained free
flowing particles and secondary cyclones collect 98% of the remaining cohesive fine particle
material, diplegs need to effectively transport this material back into the bed. The solid
material transported in the diplegs can be deposited either into the freeboard area of the
fluidized bed or into the dense phase area of the bed (Geldart and Kerdoncuff 1993).
Diplegs are designed within two main constraints: firstly, they must be free of blockages
which can lead to a build up of material inside the cyclone and eventual re-entrainment.
Secondly, they serve as pressure seals, preventing gas from entering the cyclone from the
dipleg (Kunii and Levenspiel 1991). To avoid this gas bypass, simple valves, such as trickle
or flap valves are used at the end of the dipleg to seal them when solid material is not flowing
through (Kunii and Levenspiel 1991).
Dipleg diameters should become progressively smaller from the primary cyclone to the
additional cyclones in the system. This reduction reflects the lower solid loads being
captured by the additional cyclone stages (Kunii and Levenspiel 1991; Geldart and
Kerdoncuff 1993). Although used widely in industry, cyclone diplegs are not yet fully
understood (Geldart et al. 1993; Geldart and Kerdoncuff 1993).
Li et al (1997) summarised four distinct zones or regions in a dipleg, with the summarisation
presented in Figure 2-3.
-21- -

Figure 2-3: Different regions of a standard dipleg
From Figure 2-3, zone I is a dilute bubbling phase which only exists within a short distance
of the gas entry point. The second zone is a stable dense phase region where no bubbles
exist. The third zone is the gas escape region, where there is an interface between gas and
solid (ie identifiable bubbles), and the final zone is the dilute phase, where there is a
continuous gas phase and discontinuous solid phase.
It has been reported that this description of the regions inside a dipleg is only valid in the
diplegs of the second and third stage cyclones, where mass loading rates are lower. For
primary cyclones, Geldart et al. (1993) found no distinction between the top and bottom
sections of the dipleg, with a gradual pressure drop being noticed down the dipleg. In this
-22- -

way, it was suggested that a primary cyclone dipleg can be treated as a downward flowing
pneumatic transport line (Geldart et al. 1993).
The amount of solids that can flow through a dipleg depends on the size of the dipleg and the
nature of the solid. Lower density material, such as FCCU catalyst, requires a higher level of
solids through the dipleg to ensure a steady flow of material. Thus a balance is needed
between too much solid material in the dipleg, which can lead to blockages, and not enough,
whereby gas may leak back into the cyclones, disrupting collection efficiencies. Also changes
in the solid circulation rate in the dipleg may influence pressure drop, depending on the initial
conditions of the system (Li et al. 1997).
Li et al (1997) concluded that dipleg flooding (when the dipleg is completely full of solids
causing re-entrainment to occur) is caused by the first region of the dipleg being transformed
into a localised dead zone (ie no solid movement) of solids, leading to a reduced solids flux
and a build up of material.
2.6.1 Valves
Trickle valves or other valves, are used at the end of the dipleg to prevent short circuiting of
gas (gas bypass). Broadly speaking there are two types of valves used on diplegs, mechanical
or non-mechanical. Mechanical valves are the simplest form, and consist of a solid
obstruction at the end of the dipleg. These obstructions are opened by pressure exerted on
them from the material collected inside the dipleg, and close once the pressure is relieved
(Sinclair et al. 1983). Thus, there is a continual process of material building up inside the
dipleg until a certain pressure is reached, after which the valve opens, allowing the material
to escape before closing again. Non-mechanical valves use air or bends to alter and control
the flow rate of material from the dipleg (Sinclair et al. 1983).
It has been shown that trickle and flapper valves do not continually drain but have a periodic
and regular discharge into the fluidized bed according to the pressure balance across the
system (Geldart and Kerdoncuff 1993). At no time is the dipleg completely emptied, and the
frequency at which the dipleg opens is related to the individual pressure balance of each
cyclone system.
-23- -

The diplegs used at the refinery are trickle valves, consisting of a large metal plate hinged
over the outlet of the dipleg. The plate provides resistance against air passing up into the
dipleg, sealing the end of the dipleg. When catalyst is collected inside the dipleg it presses
against the plate, and at some point will open the plate allowing the collected catalyst to
empty. The plate then seals again and the process is continued.
2.7 Fluidization
Fluidization is the process of passing a fluid, normally gas, upwards through a bed of
particles. The particles remain as a packed bed until the gas velocity passing through the bed
reaches the minimum fluidization velocity (Umf), when the particle bed expands and is
deemed to be fluidized. Although the particles in the bed are still in contact for most of the
time, the fluid/solid assembly behaves like a liquid with a density equal to the bulk density of
the material. Pressure increases linearly with distance below the surface, wave motion is
observed, lighter objects float on the bed and heavier ones sink through the bed (Geldart
1986a; Kunii and Levenspiel 1991; Rhodes 1998).
The relatively large surface area of fine particles combined with the stirring action generated
by the bubbles in the bed allow excellent heat transfer through the bed, both radially and
axially. Pressure drops are also reduced when compared with fixed bed systems, making a
fluidized bed an excellent tool for chemical and physical processing (Geldart 1986a).
One of the main disadvantages of a fluidized bed system relates to the scale up of the
equipment and processes from well understood laboratory systems, to larger scale industrial
units. Particle entrainment, attrition, mechanical wear and erosion are other mechanisms
which may adversely affect a fluidized bed system (Geldart 1986a).
Fluidized bed processes can be broadly characterised into two main types; physical or
chemical. Physical processes are concerned with heat or mass transfer reactions such as the
drying of solids. Chemical reaction processes deal with catalytic or transformation reactions,
such as combustion processes or catalytic cracking (Geldart 1986a). The refinery’s
regenerator can be classed as a physical fluidized bed.
-24- -

2.7.1 Brief History of Fluidized Beds
The earliest work with fluidization was the gasification of coal in the early 1920’s. With the
onset of World War II, demand for fuels dramatically increased. This increase in the demand
for petrol and the desire for a more efficient cracking system, led to the development of the
first Fluidized Catalytic Cracker Unit in the early 1940’s (Geldart 1986a).
Not all fluidized technologies have progressed smoothly. The design of gasoline conversion
plants using fluidized beds to convert natural gas into petroleum have had major set backs
(Geldart 1986a). Processes highly dependent on bubble hydrodynamics are very difficult to
scale up from smaller laboratory-based trial systems. This has led to a number of disastrous
incidents where scale-up was not properly understood and pilot plants performed
dramatically below expectations. With the development of the Middle East oil fields during
the 1950’s, emphasis on conversion systems declined and mass transfer systems were
developed for a wide range of processes (Geldart 1986a).
2.7.2 Main Processes Involved
Maintaining optimal fluidization inside the regenerator bed is essential to allow correct
recharging of the catalyst, as well as to improve circulation throughout the FCCU (Brown
1990; Murphy 1994).
A fluidized bed has two distinct sections or zones, a dense zone, and a lean, or dispersed
zone. The dense zone is the actual bed itself, with a distinct upper surface. The dispersed
zone is the zone above the surface of the bed that particles are ejected into (Kunii and
Levenspiel 1991). The freeboard is loosely defined as the space between the surface of the
bed and the gas off-take point (Geldart 1986d; Kunii and Levenspiel 1991). The freeboard
can also be defined in relation to the properties of the gas and particle flow above the bed.
Refer to Figure 2-4 below for a schematic representation.
-25- -

Figure 2-4: Representation of the various zones in a fluidized bed (Geldart 1986d)
Particles can be lifted out of the bed by the movement of gas and bubbles through the catalyst
material. Depending on the particle’s size, its terminal velocity (maximum speed a falling
particle will reach) may be large enough to overcome the force exerted by the gas (drag),
allowing the particle to fall back to the bed. Obviously, fine particles are less likely to be
returned to the bed, and this fractional removal of fines from a system is referred to as
elutriation. The term entrainment is often used instead of elutriation although entrainment is
the actual lifting of particles into the gas stream, and does not take into account the separation
of particles due to size in the freeborad. Carryover of the entrainment flux is the term used to
describe the amount of material that exits the system (Geldart 1986d; Kunii and Levenspiel
1991; Rhodes 1998).
-26- -

Researchers such as Kunii and Levenspiel (1969) developed a three phase picture of particle
movement in the freeboard. This picture was later expanded to include a fourth phase after
further research (Geldart 1986d). Figure 2-5 is a schematic of the four phases in the
freeboard, where TDH is the Transport Disengaging Height.
Figure 2-5: Four phases in the freeboard of a fluidized bed.
The four phases represented above are, 1) the gas stream carrying dispersed particles
upwards, 2) material being ejected into the freeboard, 3) material falling back into the bed
surface and finally, 4) the more concentrated emulsion moving downwards at the wall.
-27- -

Due to the continued entrainment and elutriation of fines from the bed, cyclones are used to
remove the carryover from the air and return the particles to the bed. Some solid material
will inevitably be lost from the system, so a gradual change in particle characteristics and size
distribution in the bed will occur (Kunii and Levenspiel 1969; Geldart 1986d; Rhodes 1998).
2.7.3 Transport Disengaging Height
The concept of the Transport Disengaging Height (TDH) is important to the location of the
outlet, and several definitions exist in the literature. The TDH is a function of the vessel
geometry and operating conditions, and also varies with the definition of the freeboard and its
zones. As bubbles break through the surface of the bed, particles are ejected into zone 2 of
the freeboard. Gravity, the air drag forces, and momentum transfer between particles govern
the subsequent motion of the particles in the freeboard. The larger particles have terminal
velocities which are larger than the upward gas velocity, and these larger particles fall back to
the bed. The smaller particles have terminal velocities which are lower than the gas velocity,
and these are continually carried upwards by the gas stream
Kunii and Levenspiel (1969) defined the TDH as the point where entrainment becomes
approximately constant, ie the point in the freeboard where particle concentration becomes
steady. This corresponds to the boundary between zones 1 and 2 in Figure 3.4. On the other
hand, Geldart (1986d) has a more open definition of the TDH, as the region within which the
solid loading falls.
Most fluidized beds operate with superficial gas velocities around 0.6 - 0.8 m/s, and at these
velocities entrainment of particles is significant. Often the entire bed is circulated through
the cyclones every couple of hours. Because of this, the TDH is extremely important,
especially with regards to the location of the outlet (Geldart et al. 1995).
There have been a number of methods and equations developed for the determination of TDH
outlined by Geldart, et al. (1995). The majority of these methods and equations appear to be
taken from measurements on smaller laboratory scale fluidized beds and not industrial sized
beds. As previously mentioned, TDH is a function of vessel geometry and operational
conditions which are all beyond the scope of this research. Therefore the main consideration
-28- -

of TDH in this thesis is with the calculation of particle characteristics (terminal velocity,
entrainment etc) for use in the modeling section of this thesis.
2.7.4 Operating Velocities
Two terms widely used in the refining industry to assess the fluidized state of a FCCU are the
minimum fluidization velocity (Umf) and the minimum bubbling velocity (Umb). Umf is the
minimum gas velocity at which, when gas is passed through a bed of particles, the packed
bed becomes fluidized. Umb is the velocity at which bubbling first appears in the fluidized
bed, and is either greater than or equal to Umf (Geldart 1986a; Kunii and Levenspiel 1991;
Rhodes 1998). From an engineering viewpoint, Umf is a key indicator of the overall behaviour
of a fluidized bed (Hartman et al. 2000; Reina et al. 2000). The ratio, Umb/Umf is a key
indicator of the flow characteristics of a powder (Abrahamsen and Geldart 1980; Geldart and
Radtke 1986; Brown 1990; Murphy 1994).
Many experimental studies have provided correlations between operating parameters and
Umf, while less work has been directed at Umb (Lippens and Mulder 1993; Whitcombe et al.
2002c). The first detailed equation allowing the calculation of Umf was derived by Ergun
(1952) from the relationship between the pressure drop over a packed bed of spherical
particles. The rearranged version of the Ergun equation as seen in Bin (1994) is:
Re75.11150Re 332
mfsmfs
mArεφεφ
ε+
−= , (2-5)
with
( )2
3
µρρρ gd
Ar gppg −= , (2-6)
and
µρ pmfg dU
=Re , (2-7)
whilst for fine particles (<100µm), Umb can be calculated from
( ) 347.0
06.0
716.0exp07.2µ
ρgpmb
dFU = , (2-8)
-29- -

where Ar, Re, φ, εm, εmf and F are the Archimedes number, Reynolds number, shape factor,
bed porosity and bed porosity at Umf, and fraction of powder less than 45µm for the fluidized
particles, respectively. Gas density (ρg), particle density (ρp), gravitational acceleration (g),
gas viscosity (µ) and particle diameter (dp) are also used. The original Ergun equation is the
most accurate for calculating Umf. However, it is not often used since specific powder
characteristics, such as the shape factor (φ) and bed porosity at the point of minimum
fluidization (εmf) must be known (Lippens and Mulder 1993; Bin 1994; Reina et al. 2000).
The shape factor is defined as the ratio of the surface area of a sphere having the same
volume as a particle, and the surface area of the particle itself (Reina et al. 2000). Shape
factors of particles can be arranged into three groups; shape factors of 0.8 to 1 for easy to
fluidize, relatively spherical particles, shape factors of 0.5 to 0.8 for ‘sharp’ particles, and
shape factors of 0.1 to 0.5 for ‘other’ particles (Reina et al. 2000). As FCC catalysts are
usually relatively spherical and easy to fluidize, they have a shape factor between 0.8 and 1
(Kunii and Levenspiel 1991; Rhodes 1998; Reina et al. 2000).
Bed porosity at the point of minimum fluidization (εmf) is more difficult to determine. It can
be approximated by determining the porosity of the powder after it has been slowly poured
from one container to another (Hartman et al. 2000).
Due to the difficulty in determining φ and εmf, correlations based on experimental results are
often used to predict Umf for design purposes. As the characteristics of FCC catalyst are
altered during the time spent inside a FCCU (Fletcher 1995; McLean 2000), it is unclear how
the fluidization characteristics of the catalyst inside a FCCU will change over time. Some of
these changes, such as the gain in fine material through attrition, may be beneficial to the
fluidized state, while other changes such as metal compounds deposited onto the surface of a
catalyst particle during use inside a FCCU, may not (Whitcombe et al. 2002c).
As Umf and Umb are dependent on the particle characteristics, altering the surface of the
catalyst may impact on the ability of the catalyst to circulate in the FCCU. This statement is
supported by the fact that circulation properties of catalyst inside a FCCU change over time,
and it is recommended that continued monitoring of the fluidized state is essential for optimal
-30- -

operation of a FCCU (Brown 1990; Murphy 1994; Engelhard 2000a; b; c; Whitcombe et al.
2002c).
2.7.5 Fluidized Powders
Geldart realised that the type of particle used in fluidized beds had a significant impact on the
type of fluidization achieved (Geldart 1986c). He therefore grouped materials into four
groups based on their fluidization characteristics. These groupings are not discrete as various
materials placed between two groups may have some properties relevant to both groups. The
groups of powders are referred to as Geldart Group A, B, C and D.
Group A particles are the second smallest of all the groups with average particle size of
around 100µm, and are very aeratable. Beds expand considerably between Umf and Umb until
the bed consolidates slightly due to the large numbers of bubbles weakening the metastable
structure of the expanded dense phase. Group A particles are very easy to move through
fluidized beds and pneumatic conveyors. They mix well, with few bubbles and when the
airflow is turned off, their beds collapses at a steady rate. The best example of a Group A
material is FCC catalyst (Geldart 1986c).
Group B particles are larger, with a range of particle diameters between 60µm and 1000µm.
Interparticle forces are negligible, so bubbling occurs easily slightly above Umf, and the bed
collapses rapidly after the fluidization gas flow is stopped. There is no mixing without
bubbles, which normally rise faster than the interstitial gas velocity. Bubbling coalescence is
predominant with no evidence to suggest a maximum bubble size. With a high enough
velocity, slugging occurs, first axisymmetric, then as velocity increases further, the flow
become asymmetric, moving up the bed wall. Beach sand is a typical Group B particle
(Geldart 1986c).
Group C particles are made up of small (generally < 20µm) cohesive particles. Due to the
cohesive nature of the particles in Group C, fluidization of any type is extremely difficult.
Complete plug flow is seen in small tubes, while significant channelling occurs in larger
beds. The cohesive forces are stronger than the force exerted by the gas so heat transfer and
mixing is limited. The physical properties of the particles (ie. size, moisture content, shape
-31- -

etc) also have an effect on the cohesiveness of the bed. External vibrators or mechanical
stirrers can be used to break up the material and allow fluidization. Flour is a good example
of a group C particle (Geldart 1986c).
Group D particles are larger and more dense than other particle groups. Bubble rise occurs
more slowly than the interstitial gas velocity and poor mixing and heat transfer characteristics
are seen. De-aeration occurs rapidly after the fluidization gas is turned off. Coffee beans are
a prime example of group D powders (Geldart 1986c).
2.7.6 Types of Fluidization
Depending on the type of material being fluidized, five distinct fluidization types can occur.
These are bubbling, slugging, channelling, jetting and spouting. Refer to Figure 2-6 for a
diagrammatic representation.
Figure 2-6: Types of fluidization (Geldart 1986b)
Bubbling fluidization is used in a FCCU regenerator, and is characterised by a slowly
expanding bed between Umf and Umb. Agitation in the bed increases and large bubbles are
formed, which rise up through the bed. The distinction between the dense and lean phase is
reduced as bed material is thrown up by the bubbles breaking through the surface. Small
-32- -
amounts of bubbling are advantageous as mixing rates are increased in the bed, although
entrainment rates are also increased which may lead to an increase in particle loss or reduced
efficiency (Clift 1986; Kunii and Levenspiel 1991). The other forms of fluidization are not
relevant to this thesis.
2.7.7 Fine Particle Fluidization and Agglomeration
Technically FCC catalyst particles are not categorised as fine particles. However, the size
distribution of normal FCC catalyst is such that a large proportion of catalyst is fine enough
to have considerable cohesive forces similar to group C particles (Wang et al. 1998). In
terms of fluidization fine particles are less than 20µm.
Agglomeration of fine particles during fluidization can have both a positive and negative
impact on fluidized beds. On the one hand agglomerated particles are larger and will remain
in the bed for longer, while on the other hand excessive agglomeration will lower the fines
content and adversely affect fluidization, leading to channelling (Wang et al. 1998).
Wang et al (1998) found experimentally that fluidization of fine particle results in the
reduction of fluidity and in particular the development of agglomerates and channelling in the
fluidized bed. It was also found that at some characteristic gas velocity, a general and sudden
disruption to the bed occurred when dealing with fine particles. This disruptive effect was
thought to be associated with the cohesiveness of the particles being fluidized.
Separate work done by Barsukov et al (1998) has shown that pre-treatment of catalyst
through calcination can help to increase agglomeration and thus reduce fines. As fresh
catalyst has a large amount of fines when delivered, pre-treatment to encourage
agglomeration will increase particle size and reduce the amount of losses from the system
(Whitcombe et al. 2003d).
2.8 Catalyst Properties
Catalysts have been utilised in industry for many years with over 90% of all chemical
manufacturing processes being catalytic in nature (Pratt 1983a). A catalyst, by definition is a
-33- -

substance that influences the rate of reaction without influencing the ultimate equilibrium of
the system (Pratt 1983a). A typical catalyst has several components (Pratt 1983a):
• The active material, usually a metal
• Promoters and Dopants: additives which modify the active component
• The support: as catalytic material is often expensive, small particles of catalyst are spread
out on a supporting matrix to enable better handling and thermodynamic properties.
Normally the matrix structure is inert.
• The Stabilizer: stabilizers are added to prevent contact between the active material on the
surface of the particle when the particle is heated,
The actual processes of catalytic reactions are summarised by Pratt (1983b) as follows:
1. Diffusion of the reactants from the bulk phase through the thin film surrounding the
catalyst particle
2. Diffusion of the reactant through the porous structure of the catalyst particle
3. Adsorption of the reactant on to the catalyst surface
4. Reaction on the surface
5. Desorption of product from the surface
6. Diffusion of product through the pores
7. Diffusion of products into the bulk phase
It is not the aim of this thesis to provide a detailed discussion on the nature of catalysts, only
to provide a background on catalyst types and important features, which may influence
catalyst emissions rates from the FCCU.
2.8.1 Reaction rates
The surface area per unit mass of catalyst increases as the particle size decreases, thus
providing more sites for possible reactions. As particle size decreases, it eventually leads to a
state where the observed reaction rate becomes independent of particle size (Pratt 1983a).
This catalyst reaction process is rate dependent on the slowest step in the chemical reaction
series (Anderson 1983a). Maximum catalyst activity can be seen to occur at an intermediate
-34- -

strength of chemisorption. If absorption is too low, little perturbation occurs. If, however,
adsorption is too strong, stable surface compounds are formed and self poisoning occurs
(Anderson 1983a).
Reactions occur on the active sites of a catalyst, which are the metal containing sections.
Under oxidation conditions, most metals will form oxides, thus lowering the metal
concentration and reactivity. Platinum is the best known metal for use in oxidative
conditions due to its ability to withstand oxide formation (Anderson 1983a).
2.8.2 Types of FCC Catalyst
Over the years a variety of different manufacturing processes have been used to provide a
wide number of catalysts. Catalysts were originally solid amorphous structures comprised of
clays. Later, the development of synthetic silica alumina beads allowed granular catalyst to
be used in a fluidized bed system. Granular catalyst enabled greater activity to be achieved
with less catalyst input
The next major development in catalyst technology was the development of synthetic zeolite
(X and Y type) which presented an enormous advance in catalyst technology. Currently over
90% of catalyst cracking units world wide use zeolite based catalysts (Heinemann 1983;
Weitkamp 2000). Zeolites are natural materials, more commonly referred to as
aluminosilicate minerals (Weitkamp 2000). Natural zeolites have little value due to
impurities, lack of uniformity in chemical composition, and non-optimised properties for
specific uses, such as in a FCCU (Weitkamp 2000).
Stabilised porous metal, skeletal metal and alloy catalysts are all examples of catalysts
commonly manufactured today. The most widely used, versatile and stable catalyst is the
supported dispersed metal type. Very small metal particles (1 – 5 nm) are distributed over a
large surface area. Very high surface areas can be obtained from a limited amount of metal
mass; important for the economic production of noble metal catalysts (Anderson 1983a). All
catalyst activity is related to the degree of surface acidity and whether that acidity is from
Bronsted or Lewis acids (Anderson 1983b; Heinemann 1983). The elementary units of
zeolite which comprise the matrix of the catalyst, are SiO4 and AlO4 tetrahedra, linked at
their corners by a common oxygen atom (Weitkamp 2000). There are two common
-35- -

manufacturing techniques used for zeolites, liquid or solid phase conversion. The type of
catalyst used at the refinery is an alumina-gel zeolite. The main binder used in this type of
catalyst is alumina with the confidential manufacturing process producing catalyst with good
attrition rates, high accessibility and a higher tolerance to surface contamination (Fosket
2001). The catalyst which is produced has a narrow size distribution with smooth rounded
particles.
2.8.3 Catalyst Deactivation
The deactivation of FCC catalysts is the most significant drawback to the overall economics
of the process. The fundamental causes behind catalyst deactivation have been known for
some time, although methods to reduce and prevent deactivation from occurring are more
elusive. The main mechanisms for deactivation involve catalyst poisoning, coking and
sintering of the solid. As the catalyst particle ages it begins to produce less gasoline and
more coke and hydrogen as the zeolite crystalline structure deteriorates and more non-
framework alumina is formed. This leads to less selective cracking and reduced gasoline
production. With time, levels of contaminant metal concentrations increase on the catalyst
surface, leading to undesirable dehydrogenation reactions, further reducing the activity of the
zeolite (Goolsby et al. 1997).
Catalyst deactivation occurs in two broad steps, the first being rapid deactivation, followed
by a second, slower stage of deactivation (Trimm 1996). The initial deactivation is
associated with the deposition of coke onto the particles (Kikkinides et al. 2002). The
deposition of coke leads to the blocking of both active sites and of the physical pores present
in the catalyst, leading to reduced accessibility into the catalyst particle. This loss of
accessibility can lead to reduced yields and over cracking (Forzatti and Lietti 1999; Moulijn
et al. 2001; Kikkinides et al. 2002). It appears that this rapid deactivation stage is dependent
on the composition of the catalyst (Trimm 1996).
After the initial rapid deactivation occurs, a steady state, or slower phase of deactivation
begins. During this stage, the amount of coke on the particle is reduced as metal deposition
occurs (Trimm 1996). Although coke can be burnt off, thus regenerating the catalyst, other
forms of deactivation (such as metal deposition causing poisoning) are irreversible. The
-36- -
deposition of metals such as nickel and vanadium lead to an overall deactivation of the
catalyst, as well as reducing the selectivity of the catalyst (Forzatti and Lietti 1999).
The majority of deactivation mechanisms involve impurities in the feedstock such as metals
(vanadium, nickel, iron and sodium) or coke that is not completely removed through
combustion. This build up of coke on the surface of the catalyst also deactivates the catalyst
particles (Lin 1993). Although major advances have been made over time with regards to a
better understanding of catalytic deactivation, complete elimination of catalytic deactivation
is extremely unlikely, therefore the emphasis must be placed on managing catalyst activity
(Trimm 1983). As catalyst activity decreases, more fresh catalyst is needed in the system to
maintain conversion rates.
The rate of catalyst poisoning obviously depends on the contaminants present in the feed
stock and the chemical composition of the catalyst, and can be considered as an
adsorption/deposition reaction. In general, deactivation caused by poisoning occurs by very
strong adsorption on the surface or depositing of material around the catalyst, blocking the
active site (Trimm 1983).
Catalyst poisoning tends to be a very selective process, with sulphur compounds, carbon
monoxide and mercury being the most common poisons found. Other material such as some
nitrogen compounds and metal ions can also poison catalysts if present in the feed stock
(Trimm 1983).
Fouling is less selective than the process of coke formation on to the catalyst surface or the
deposition of non-organic material such as heavy metals. Although the spread of metal
contaminants through a catalyst particle may look like poisoning, according to Trimm (1983),
it is actually fouling. Metals remain in the oil until a point where the hydrocarbon is reduced
to such a size that the metal precipitates out. In this way large compounds which easily
hydrogenate will deposit metal on the outside of the particle, while smaller compounds will
deposit in the middle.
Trimm (1996) in later work refined his theory on metal deposition on catalyst particles. He
found that the location of metal deposits within a catalyst particle depends on the type of
-37- -

metal in question. It has been shown in laboratory tests that metal impurities deposit after a
series of reactions take place. That is, metallic deposition is a staged occurrence, forming
deposits at various depths in the catalyst particles. For example, it was found that the two
stage nickel reaction was 85 times slower than the vanadium reaction. That explains why
nickel is almost always found to be deposited on the inside of a particle with vanadium
deposited on the outside (Trimm 1996). In addition iron normally deposits on the outside of
the particle, with vanadium and nickel deeper, and molybdenum on the particle's surface
(Trimm 1983; Nielsen and Doolin 1993; Trimm 1996). Whether these lab-based
observations can be completely transferred to metal concentrations found inside FCCU e-cat
is unclear. However, the literature does suggest that there are different deposition locations
for various metals present inside a catalyst particle (Whitcombe et al. 2002d).
2.8.4 Sintering
Sintering can be seen as one of the most damaging mechanisms for a catalyst particle, as it
relates to the destruction of surface area and porosity, which unlike other mechanisms is very
difficult, if not impossible, to reverse. Catalysts are designed and manufactured to maximise
surface area, and as a result there is an underlying thermodynamic driving force to minimise
the surface free energy. The activational energy of the particle surface is the only barrier to
sintering and as the particle temperature increases to maximise conversion rates in the FCCU,
sintering can become a problem (Trimm 1983). In addition to loss of surface area, sintering
may lead to particle agglomeration, which reduces fluidity and alters the particle size
distribution found in the system (Barsukov et al. 1998; Whitcombe et al. 2003d).
As temperatures increase, the metal atoms become more mobile and smooth across the
surface of the particle (surface diffusion) and develop a faceted or spherical particle. Also at
elevated temperatures, gross changes in the solid structure can occur through volume
diffusion and even evaporation-condensation processes. This process can be enhanced by the
presence of gases, such as water vapour. It is suggested on theoretical and experimental
grounds that sintering appears to take place at one-third of the melting point of the metal,
although impurities can affect this dramatically (Trimm 1983). It has also been shown by
Stephens et al. (1999) that a relationship between particle size and sintering effect occurs,
allowing some increase in sintering as particle size decreases. Therefore, particle sintering,
-38- -

although destructive in terms of catalyst activity, is likely to reduce the presence of fine
particles in the system.
The use of steam strippers in the reactor vessel, was shown to increase the average particle
size in the system (Barsukov et al. 1998). It is normally assumed that loss of fines is the main
reason for an increase in the average particle size as a commercial FCCU is operated.
Barsukov et al (1998) states that it is actually the stripper that helps to change the particle size
distribution in the direction of larger particles. Steam strippers, through sintering of particles,
lead to an increase in agglomeration, thus reducing fines in the system (Barsukov et al. 1998).
This change in size is apparently linked to the density of the bed of particles flowing in the
vessel. In a dense bed situation sintering and recrystallization of particles will occur to a large
extent (Barsukov et al. 1998).
2.9 Particle Attrition
Attrition, in a simplistic form, is the altering of the particle size distribution inside a fluidized
bed by wear or erosive process. The actual mechanisms of attrition are contested by
researchers and often the exact definition depends on the research being conducted.
The processes of attrition in fluid-bed systems were first studied in the latter 1940's. Although
substantial research has been carried out on attrition, it is still not well understood (Ray et al.
1987; Baraletta and Barbosa-Canovas 1993; Hutchings 1993; Werther and Reppenhagen
1999; Wu et al. 1999).
Attrition, and more specifically the development of fines in a system, is often the major
obstacle in the development of new fluidized technologies (Werther and Reppenhagen 1999).
Attrition has an enormous impact on a variety of industries with regards to cost, lost
production, erosion and wear on equipment and environmental regulations (Wu et al. 1999).
Another consequence of attrition is the change in the composition of the bed, either causing
fines to be produced over time, or resulting in the loss of fines due to increased particle
carryover rates, causing the bed to become coarse (Werther and Reppenhagen 1999).
Under normal conditions, attrition occurs very rapidly for fresh material, and then the
attrition pace slows to a steady level (Ray et al. 1987; Santana et al. 1999). Ray et al. (1987)
-39- -

found that this steady state rate was reached after approximately 3 to 5% of the original
particle mass had been eroded away. This relationship between the ratio of initial attrition
and steady state attrition with regards to the degree of attrition appears to be independent of
gas. Ray et al (1987) also suggests that the effect of particle size and velocity on fines
distribution is not significant. It is also known that particles possess a memory of previous
treatments which can effect attrition rates severely. After time, this memory fades, moving
the system towards a normal Markov process, where attrition of that material is unique and
free from other memories outside of the system (Ray et al. 1987). This natural memory may
be similar to the theories of Barsukov et al (1998), dealing with uncompensated mechanical
stresses and other experimental results found in the literature (Whitcombe et al. 2003d).
2.9.1 Attrition Mechanics
All materials have some sort of surface flaws, and when a force is applied, cracks appear and
smaller sections will fracture off (Mullier et al. 1991). Attrition has been studied in terms of
change of particle size distributions, kinetics, compact characteristics and structure and
morphology of the actual particles (Baraletta and Barbosa-Canovas 1993).
Baraletta and Barbosa-Canovas (1993) described attrition in terms of energy, this time
concerning particles absorbing energy from collision with other particles or static structures
such as walls, or through the direct application of a compressive force.
Wu et al (1999) defined specific mechanisms for attrition in fluid-bed systems as: thermal
stress (heating and cooling of particles causing thermal expansion/contraction); chemical
stress; static mechanic stress and kinetic stress. The search for specific mechanisms for
attrition has been going on for some time. Earlier research has tried to identify the process of
attrition quantitatively and it was first suggested by Blinichev et al, as discussed in Baraletta
and Barbosa-Canovas (1993) and Wu et al (1999), that two mechanisms occur. The first
being shattering or fragmentation of large particle, and erosion or abrasion of small chips off
of a large particle. Both processes are followed by the loss of fines through elutriation. More
recent work has led to the belief that the second mechanism of abrasion and erosion is the
most significant in fluidized beds (Wu et al. 1999).
-40- -

Mullier et al. (1991) found during experiments using agglomerated particles that the original
shape varies only slightly, although a large proportion of their mass had been removed. They
also noticed that collisions between agglomerated particles in the jet regions were of two
types; collisions between fast moving agglomerates in the jet stream with other entrained
agglomerates. The second are collisions higher up in the core of the gas stream between two
agglomerates with similar velocities (similar to two particles sliding over each other). Both
types of collision appear to remove fines with little gross fragmentation occurring, adding
weight to the theory that erosion is the main mechanism in attrition. Further attrition may
occur by particle interaction in the dense phase of the fluidized beds by low velocity
interactions at low angles of incidence, which can be seen as abrasive wear opposed to
conventional impact damage.
As agglomeration of larger particles normally occurs in sticky environments, it is not likely to
influence the particle distribution in a FCCU under normal operating conditions (Ray et al.
1987; Wu et al. 1999). However, research has shown that fines agglomerate, due to
interparticle forces (cohesion), to form larger particles or coat the surface of larger particles.
If this is correct it could mean that the majority of fines produced by attrition will form
agglomerates with only a small percentage remaining as free fines (Santana et al. 1999). This
mechanism of agglomeration may influence bed and particle characteristics during abnormal
situations such as start up and shut downs.
Santana et al (1999) suggested that attrition is closely related to particles agglomerated in the
bed. In this way the generation of fines by attrition is dependent on the amount of
agglomerated material. Santana and his colleagues also put forward the belief that attrition
increases the amount of free flowing particles and reduces the agglomeration in the bed.
Therefore, it is essential to understand agglomeration and how the particle distribution of the
bed changes over time.
Work by Barsukov et al (1998) completely contradicts the belief that wear is the major
contributor to attrition in a fluidized bed. They outlined that both microsphere and bead type
catalyst normally have strengths of 92 - 94% as per standard abrasion tests. However, in
practical experience the amount of wear is considerably higher than would be expected from
the strength of the catalyst. Therefore it is known that no more than 25% of wear is due to
-41- -

abrasive wear with the main attrition process being the complete breakdown of catalyst
particles by processes which cannot be evaluated by standard strength tests and particle
characteristics (Barsukov et al. 1998). This leads to a situation where large catalyst particles
are split into sections, with these smaller particles being worn away at higher rates than
typical for the original material. This leads to a large amount of material being lost from the
system (Barsukov et al. 1998). Tests were conducted by boiling catalyst samples in water to
simulate particle fracture inside a FCCU however, how well these experiments can be related
to industrial processes is unknown (Barsukov et al. 1998).
Barsukov et al (1998) go further by stating that particle losses are most significant at the
moment fresh catalyst is added to the FCCU. They explain this phenomenon as the
"explosive" break down in particles as the colder particles come into contact with both the
feed and hotter particles (Barsukov et al. 1998). The research was conducted on fresh
catalyst only, with no results provided on how e-cat, most widely used in the FCCU, would
react to thermal fracture.
2.9.2 Natural Grain size
Amorphous (non-crystalline) materials have a natural grain size such that as they undergo
abrasive attrition they produce certain fines with similar characteristics. For materials
without a natural grain size, attrition rates under different conditions become harder to
compare and interpret due to the changing nature of the fines produced (Ray et al. 1987).
The idea of a material having a natural grain size matches well with the energy theory of
particles (Ray et al. 1987). For materials with a natural grain size, the total surface area of
fines is proportional to total volume or mass, while for particles without a natural grain size,
any created surface area is attributed to fines production via attrition. Therefore both Kick's
volume theory and Rittinger's surface theory, as discussed in Ray et al (1987), lead to the
same conclusion that the mass ratio of fines produced is proportional to effective breaking
energy in the system (Ray et al. 1987).
As Kick's volume theory and Rittinger's surface theory are very different, it is hard to credit
that they would lead to the same theories. Also this idea of natural grain size, although
conceptually different, does have a lot of similarities to the work done by Barsukov et al
-42- -

(1998) on uncompensated mechanical stresses. In both theories the particles split early,
producing smaller particles, which are then worn away.
Attrition maybe studied as an energy transfer problem, with a specific range of fines being
produced according to particle properties and the system’s energy balance. Rittingers theory
stated that energy consumption is proportional to the area of the newly formed surface. On
the other hand, Kick stated that energy is proportional to volume, or weight of the product
(Ray et al. 1987). Due to the difficulty in precisely following the energy balance of
individual particles and separating energy absorption between particles and the equipment in
the system, neither theory can be tested completely (Ray et al. 1987). It is possible that the
process of agglomeration due to particles sticking together may counteract the forces which
move the particles to a smaller natural size due to attrition. More work is needed in this area
to understand how these ideas may or may not apply inside an operating FCCU.
2.9.3 Attrition Models
The majority of work carried out on FCC catalyst has been undertaken in laboratory tests
intended to rank or classify various types of catalyst against their propensity for attrition. The
results, however, cannot guarantee or predict the nature of attrition once the catalyst is placed
inside a fluid-bed system as the stress mechanisms are exceedingly complex compared with
the laboratory work (Werther and Reppenhagen 1999; Imhof and Louwen Undated). For this
reason, a quantitative procedure needs to be developed to predict and explain the
fundamentals of attrition and the products which it produces. Unfortunately, there is still
some lack of understanding and confusion concerning attrition processes (Werther and
Reppenhagen 1999). It appears that for every researcher who has studied the processes of
attrition, there is a different model produced, each with different underlying assumptions
(Werther and Reppenhagen 1999).
These discrepancies occur through differences in experimental techniques, underlying
assumptions and particle characteristics. A thorough and systematic investigation of particle
characteristics and system design is needed to understand attrition completely (Werther and
Reppenhagen 1999). In addition, attrition needs to be studied at various locations around the
fluidized bed system, as conducted by Zenz and Kelleher (1980). As explained by Werther
and Reppenhagen (1999), each area of the system will contribute to attrition in its own unique
-43- -

way due to localised forces and attrition mechanisms. Thus, each source of attrition needs to
be studied separately, with the combination of these models used for prediction. Another
issue not fully described in the literature is how scale up issues, already identified as a serious
problem in fluidization research, influence attrition and in particular attrition models. As it
appears that the majority of the research is conducted on small scale laboratory devices, it is
possible that scale up issues relating to attrition are not known.
Zenz and Kelleher (1980) view attrition as a continuous process that occurs while a particle is
in motion or when motion is abruptly interrupted. Through their studies Zenz and Kelleher
proposed regions in the fluidized bed system where attrition may occur. These areas can be
summarised as:
A) Grid holes as high velocity gas enters the bed
B) Particle interactions with each other in the bed or in transport lines
C) Cyclone attrition
D) Inside rotating parts as particles may be crushed
E) At change of direction points in transport lines
F) When particles are moved in straight sections and can bump/graze surfaces at high
velocities
G) Free fall situations
Further study by Zenz and Kelleher (1980) has identified the most common areas of attrition
to be A, C, E, G. Due to the impact effect with cyclones (C), attrition there far exceeds the
grazing effect (F). Mechanisms C and E were considered to be identical. Zenz and Kelleher
(1980) highlight the need for more research in the non-evident sources of attrition such as
submerged jets (B), free fall (G) and centrifugal impacts.
Werther and Reppenhagen (1999) take a more simplistic view of attrition with only three
areas of attrition identified; grid jet, the bubbling bed itself and cyclone attrition. The rate
and type of attrition found in the cyclone was assumed to directly relate to total entrainment
in the system, as entrained particles are the only particles that can interact with the cyclone.
-44- -

2.9.3.1 Free Fall Attrition
Although free fall shatter attrition is more relevant in the pharmaceutical or other industrial
manufacturing industries, it may contribute considerably to FCC catalytic attrition. Tests
conducted by Zenz and Kelleher (1980) have shown that only specific size fractions are prone
to attrition under free fall shatter. This is not to say that the exact size fractions found by the
researchers are conclusive, only that particles react differently depending on their size and
that attrition will occur accordingly.
2.9.3.2 Submerged Jets/ Grid Attrition
Zenz and Kelleher (1980) state that submerged jet attrition is the result of occasional layers of
particles being accelerated from individual grid holes and therefore is not just a function of
particle composition but also other parameters such as hole size, jet direction and gas jet
density. Werther and Reppenhagen (1999), through further study concluded that attrition in
the jet region is produced predominantly by interparticle impacts, which may or may not be
affected by changing grid parameters.
The main assumption for the Zenz and Kelleher (1980) series of experiments were that the
fines generated were continually removed from the bed as fast as they were formed. Particles
remaining in the bed were therefore undergoing a gradual but continual change in their size
distribution. These assumptions are at odds with Wu et al (1999) who state that fines
generated by attrition are preferentially elutriated out of the bed gradually, not
instantaneously, leading to excess fines remaining in the bed. However, Werther and
Reppenhagen (1999) supported the Zenz and Kelleher (1980) assumptions that as long as
abrasion or erosion are the predominate sources of attrition, particles produced will be small
enough to be entrained and avoid capture by the cyclone.
Generic curves for steady state grid attrition were developed by Zenz and Kelleher (1980)
and used to predict attrition rates. It was found that catalyst grid attrition, although small
compared to attrition rates in other regions of the fluidized reactor, were still well within the
range of particle loading leaving a two-stage cyclone recover system. Therefore, grid
attrition rates may become important for the overall reduction of particle loss through the
system (Zenz and Kelleher 1980).
-45- -

2.9.3.3 Bubble Induced Attrition
Bubble attrition is attrition which is caused by the movement of gas bubbles though the
fluidized bed, causing particles to interact with each other. The mechanisms involved in
bubble induced attrition are not fully understood, although Werther and Reppenhagen (1999)
summarised various theoretical and empirical approaches based on the relationship between
the actual gas velocity, a threshold velocity required to produce bubble attrition, a bubble
attrition constant and the mass of material in the bed. Further work is needed before their
equation can be applied in detail, although it is recommended as sufficient for most needs
(Werther and Reppenhagen 1999).
2.9.3.4 Attrition in Cyclones
An obvious source of attrition is the particle impact on the sides of the cyclone (Zenz and
Kelleher 1980). Through experimentation, Zenz and Kelleher (1980) showed that particles
in the 70 - 100 micron range decreased in concentration, the 60 – 70 and 30 - 45 micron
ranges increased while smaller particles showed no significant change. It is likely that the
concentration of smaller particles remained relatively constant in the bed, as any particles lost
from the system via entrainment, would be replaced through attrition processes.
Werther and Reppenhagen (1999) believed that particle friction and impact on the cyclone
wall is the main mechanism for cyclone attrition. It was also suggested that sensitivity of
cyclone attrition is affected by changes in gas velocity (Werther and Reppenhagen 1999).
Work by Molerus and Glucker (1996) has shown that altering the cyclone inlet to allow a
more homogeneous gas acceleration can reduce particle collisions and attrition rates.
For concentrations to remain relatively steady in a fluidized bed, any smaller particles (sub 45
micron) formed in the bed, via attrition, will be entrained into the freeboard. Zenz and
Kelleher (1980) postulate that this increase in fines into the cyclone will reduce cyclone
attrition as fewer coarser particles are present to provide the source material for attrition.
Also smaller particles will provide a cushioning effect preventing larger coarse particles from
impacting on the cyclone surfaces.
This has implications for the relationship between grid and cyclone attrition. Under normal
conditions cyclone attrition exceeds grid attrition by a factor of two but, in a situation where
-46- -
high efficiency cyclones are used with a large proportion of sub 44micron particles in the
bed, cyclone attrition will be reduced and grid attrition will become more predominant (Zenz
and Kelleher 1980).
Although this work provides evidence of reducing cyclone attrition, the complete re-design of
the internal cyclone inside the FCCU is beyond the scope of this thesis.
2.9.3.5 Total Attrition
After combining the individual components, Werther and Reppenhagen (1999) derived
equations for the total loss rate of material from the system. The revised form of the equation,
to produce an a-priori model (based on first principles) for use in a variety of situations is,
clossblossjlosstotloss mmmm ,,,,
••••
++= , (2-9)
where loss,tot is the total elutriable fines produced per unit time with jet attrition ( loss,j),
bubble attrition ( loss,b) and cyclone attrition ( loss,c). This equation expands into the form
m& m&
m& m&
+−+= 3*324
6
, )(****
*** mfbboror
tfpbjtoloss uumKu
ndDdCm ρ&
75.32,
3
*4.5exp****)(**81.3 uuuw
AAudC
i
tii
inc
tfpcc ∑
−ρ , (2-10)
where nor is the number of orifices in the air distributor, dor is the diameter of the orifice, ρf is
the density of gas (kg/m3), dpb is the surface mean diameter of bed solid, dpc is the surface
mean diameter of bed solid (m), u is the superficial gas velocity (m/s), umf is the velocity of
minimum fluidization (m/s), uti is the terminal velocity of particle i, Cj is the particle-size
independent material-specific constant (jet attrition), Cc is the particle-size independent
material-specific constant (cyclone attrition), Dt is the diameter of the fluidized bed, Ac,in is
the cross sectional area of the cyclone inlet, At is the cross sectional area of the fluidized bed
column (m2), wi is the weight fraction of particle size i in the bed, is the bubble attrition
constant, and mb is the bed mass (kg).
*bK
-47- -

As mentioned before, the cyclone attrition factor is generally greater than the bubble or jet
attrition under high gas velocity situations (Werther and Reppenhagen 1999). The attrition
model proposed by Werther and Reppenhagen (1999) was seen as the best model to use to
investigate attrition inside the FCCU. The ability of an a-priori model that is recently
published was the main reason for this choice.
2.10 Entrainment
As mentioned earlier, entrainment is the continual process whereby particles are picked up by
the gas and transported upwards away from the bed surface. Other important mechanisms in
a fluidized bed system are carryover and elutriation (Geldart 1986d).
Elutriation and entrainment can be seen as a continual cycle where particles are injected into
the freeboard with the larger particles falling back to the surface and the finer fraction being
elutriated off. Although cyclones are used to clean the exit gas and return as much of the
solids as possible their efficiencies drop as particle size decrease (Tasirin and Geldart 1998c).
Understanding how entrainment occurs and more importantly how to predict with some
accuracy what is occurring is very valuable in understanding the intimate working of a
fluidized bed and in particular, emissions from the system.
2.10.1 Theory
Entrainment occurs when solid particles are ejected into the freeboard by bubble eruptions in
the bed. Once in the freeboard, particles can either rise or fall depending on particle size and
gas velocity. Smaller finer particles with a terminal velocity less than that of the superficial
gas velocity, are carried up while the coarser particles fall back down to the bed surface
(Tasirin and Geldart 1998a).
This process of separation, where larger particles fall back to the bed and finer particles rise,
is referred to as elutriation (Geldart 1986d). There is still considerable controversy
concerning entrainment and elutriation as there has been a wide range of experiments and an
equally wide range of correlations developed. Earlier experiments have showed that very
fine particles did indeed move through the bed due to contact with the fluidizing gas (Milioli
and Foster 1995b). Only larger particles moved through the bed due to the wake effect.
-48- -

Work has also shown that products of attrition are negligible in the bed, but are dominant in
the freeboard (Milioli and Foster 1995b).
Although there is a level of agreement in the literature in terms of the physical aspects which
effect particle elutriation, no one model or equation is available which can accurately predict
particle loss rates from a fluidized bed. Most models are likely to have a plus or minus 100%
prediction rate with uncertainty regarding the validity of assumptions used in the
development of the equations (Milioli and Foster 1995b; Tasirin and Geldart 1998a). To
overcome this, models are either simplified correlations based on a specific lab based unit
(inaccurate in different situations), or comprehensive large scale models which try to include
all possible interactions found in a fluidized bed system (Milioli and Foster 1995a).
2.10.2 Elutriation Rate Constant
To determine total carryover or entrainment from a fluidized bed an elutriation rate constant
(normally referred to as K∞*) needs to be determined, however this constant cannot be
calculated from first principles (Geldart 1986d; Milioli and Foster 1995b; Rhodes 1998). The
elutriation constant is calculated for each particle size in the bed and provides a mechanism
for determining the mass flux (kg/m2s) of that particle size from the bed over a period of time
(Geldart 1986d; Tasirin and Geldart 1998b). Knowing the elutriation constants for the
fluidized bed, total entrainment rates can be calculated, permitting the estimation of the
particle size distribution being carried over time (Geldart 1986d; Tasirin and Geldart 1998b).
Due to the complexity of elutriation, it is beyond the scope of this thesis to fully discuss all
aspects and correlations developed to predict the elutriation rate constants, refer to Milioli
and Foster 1995b or Tasirin and Geldart 1998a for a review.
Interparticle forces can also be seen as an important player in entrainment and elutriation
mechanisms. The addition of Geldart-C particles (ie fine particles) into a fluidized bed can
reduce entrainment by smaller particles attaching themselves onto larger particles (Santana et
al. 1999). Santana et al (1999) also reviewed other experiments that were conducted with
Geldart group A (ie FCC catalyst) and C particles, and showed that at lower velocities
adhesive forces reduced entrainment rates. Li (1999) also highlighted how agglomeration
can reduce entrainment as particles are larger and either aren't injected into the bed or are
-49- -

recycled back into the system from the cyclones. Conversely, too much attraction can cause
the bed properties to change and increase bubble and channel formation (Santana et al. 1999).
In contrast Tasirin and Geldart (1998c) suggest that the addition of finer material into the bed
will cause an increase in the elutriation of coarser particles. Thus, the overall residence time
of fines in the system is increased. They believe this is due to a momentum interchange that
occurs as fines attach themselves to the coarser particles. Others state that the entrainment
rate has been shown to exponentially decrease along the freeboard (Choi et al. 1999).
The work of Tasirin and Geldart (1998c) agreed with previous experimental results
suggesting that the fines concentration has a limited effect on the elutriation rate (RT) and on
the elutriation rate constant (Ki∞*) until approximately 25% concentration is reached. After
such a point is reached, Ki∞* appears to decrease as the fines concentration increases, or
simply: as the concentration of fines in the bed increases the percentage of those elutriated
decreases. They also postulate that this decrease in elutriation, as fines increase, occurs
because a saturation point in the freeboard is reached. At this point particles that are trying to
leave the bed collide with particles in suspension and are knocked back into the bed. This is
referred to as the obstruction effect (Tasirin and Geldart 1998c).
Other work by Milioli and Foster (1995b) concludes that the particle distribution varies
considerably depending on the region being considered inside the system. Closer to the bed
surface the variation in particle distributions increases due to the particles being constantly
ejected into the bed (Milioli and Foster 1995b).
In general the literature suggests that Ki∞* increases with a decrease in particle size until a
certain size is reached. At this size Ki∞* begins to level off. Although no answer has been
proven for this phenomena, it is believed that the leveling-off effect is caused by super fines
attracting themselves to larger particles, or agglomerating together, therefore not being
elutriated (Tasirin and Geldart 1998c).
Choi et al (1999) have highlighted the limited amount of research that has been carried out on
the effect of gas properties and other hydrodynamic conditions on gas fluidization, and in
-50- -

particular on particle entrainment rates. Studies carried out previously by Choi et al (1999),
have shown that particle entrainment rates increase, after an initial decrease with temperature.
Other studies by Wouters and Geldart on FCC catalyst particles, as discussed in Choi et al
(1999) showed a decrease in entrainment rates with an increase in temperature up to 400°C.
The exact way in which temperature affects entrainment rates in unclear. However, Choi et
al (1999) postulate that the increase in particle entrainment is due to a decrease in gas density
and increase in gas viscosity with negligible interparticle forces.
The mechanics of particle entrainment are so complicated that as yet no generalised model is
available. Normally either a dynamic or empirical/semi empirical model is used to predict
elutriation. A dynamic model needs to be based on a momentum balance and therefore needs
theories to handle a wide range of phenomena including particle clustering, turbulence, non-
uniform gas flow distributions and gas re-circulation, just to name a few (Milioli and Foster
1995a). Although it is suggested that empirical models should be used in preference to
experimental correlations (Choi et al. 1999), empirical models have limited accuracy in "real
life" situations as they are generally limited to small scale and process specific situations
(Milioli and Foster 1995a).
2.10.3 Modeling
Tasirin and Geldart (1998a) have reviewed a wide range of empirical equations developed
over the years to model entrainment and elutriation mechanisms. They found that most of the
published models predicate a wide variation in carry-over rates when the models are applied
to systems which are different to the ones for which they were developed. A complete list of
the various models can be seen in their original paper.
Another problem identified was the absence of chemical, hydrodynamic or mechanical
breakdown constants for the solids in the system, and this can lead to an over or under
estimation of carry-over rates (Tasirin and Geldart 1998a).
Tasirin and Geldart (1998a) found that the majority of elutriation models either over or under
predicted the actual value by as much as a factor of 5. They also found the Zenz and Weil
equation is the best for fine elutriated particles (< 100µm), or in cases where the entire bed
-51- -

could be elutriated (ie even the largest particles have a terminal velocity below superficial gas
velocity) such as FCC catalyst of coal char. On the whole, high accuracies are not expected
from this model (Tasirin and Geldart 1998a).
Tasirin and Geldart (1998a) modified an earlier published model to fit their experimental
results dealing with elutriation constants, with respect to gas velocities and bed diameter.
Their model was found to be good for predicting carry-over rates for FCC catalyst in
turbulent conditions, similar to larger industrial facilities. Their results show that
experimental data was ±50% compared with the predicted values. It should also be noted that
their model was developed under the assumptions that particles behave individually in the
bed and agglomerations are thus neglected (Tasirin and Geldart 1998a).
Temperature impacts on entrainment rates are not fully understood and this has potential
impacts on all models, as the vast majority are based on cold systems. The usefulness of
these 'cold' models on real life 'hot' situations is not yet clear.
Choi et al (1999) attempted to develop an empirical correlation for particle entrainment rate,
inclusive of temperature effects based on previous experimental work, using the following
assumptions:
1) The entrainment flux of particles for size ι (Ki*) at the freeboard exit consists of a cluster
flux (Kih*) and a dispersed noncluster flux (Ki∞
*). Cluster flux exponentially decreases
with freeboard height while the dispersed noncluster flux remains constant with freeboard
height, which corresponds to the elutriation rate constant above the transport disengaging
height (TDH).
2) The exponential decrease of the cluster flux decay constant as the freeboard height
increases is linearly proportional to that of the axial solid hold-up profile.
3) The configuration of the gas exit does not affect the particle entrainment rate.
Choi et al (1999) nominated four previously published decay constants for axial solid hold-up
profiles and compared them with published experimental results to obtain the best one. After
-52- -

comparing the normalised mean deviation of the four models, they concluded that their own
earlier model was the best. Choi et al (1999) claimed that unlike other models examined,
their model does not require the total entrainment rate (an unknown) to determine the decay
constant. Also, their model was correlated from hot and cold experimental fluidized bed
systems.
Using over a thousand experimental data points from other researchers, Choi et al (1999)
performed a non-linear regression to improve the performance of the resulting equations.
Gravitational and hydrodynamic forces but not interparticle adhesive forces, were considered.
It is interesting to note that Choi et al (1999) expressed concern with regards to some
experimental data and the lack of fit to their correlation. They postulate that the correlation
may under-predict the amount of entrained solids in cases of high attrition.
2.10.4 Large Scale Systems
It is commonly accepted that wake ejection is paramount in fluidized beds with large
velocities, as in commercial fluidized beds. However, according to Milioli and Foster
(1995b) there is no literature at present that has considered the detailed mechanisms and
parameters involved in these large scale fluidized beds. It is also known that bubble ejection
accounts for entrainment in cases where there are low concentrations of fine material. Milioli
and Foster (1995b) assumed that there are two parallel mechanisms at work in large scale
fluidization systems. Firstly, the direct entrainment mechanism for particles with terminal
velocities much lower than bed velocities and, secondly, the bubble ejection mechanism for
all particles with similar terminal velocities to that of the fluidizing velocity.
Milioli and Foster (1995b) have made several key assumptions to allow the modeling of
critical fines. Firstly, critical fines are instantaneously lost from the system. Critical fines are
produced mainly from attrition, although they do not under go attrition. The concentration of
critical fines in the bed is low, and finally, the largest sized critical fines are determined
experimentally.
Milioli and Foster (1995b) developed an equation for calculation of entrainment through
bursting bubbles using several assumptions. The two-phase theory of fluidization is assumed,
-53- -

only coalescing bubbles produce enough energy to eject particles and this energy is provided
by the wake of the bubbles. Finally, the ejected material has the same particle distribution as
the bed material. Again, specific assumptions where used in the development of Milioli and
Foster (1995b).
Santana et al (1999) took a different approach to study entrainment. They found that the
majority of literature dealt with attrition of large particles where interparticle forces are
negligible. Therefore, because of this focus on entrainment of large agglomerates they found
the entrainment of fines not to be fully understood. As the majority of material lost from a
system are fines, it is important to understand how fine particles are entrained.
As entertainment is closely interrelated with attrition the underlying assumptions made by
Santana et al (1999) are:
♦ Attrition is a process of the removal of fines from the surface of a parent material
♦ Generation of fines by attrition is a nonlinear function of time and depends on the
percentage of agglomerated fines
♦ The attrition of large particles is negligible
♦ Fine particles in the bed are in one of the following forms:
• elutriable freely moving fines
• agglomerated fine and fine attached to larger particles
Santana et al (1999) believe that their model is superior to other previously published models
because, in their belief, it represents the actual physical process in a fluidized bed more
realistically for Geldart A and C particles.
2.10.5 Reducing Entrainment
Tasirin and Geldart (1998b) outlined a number of techniques developed in the literature that
have been used to reduce entrainment rates. The use of baffles above the bed to help particles
disengage by forcing them through a series of abrupt directional changes, or changes to the
actual bed fluidization. The use of stirrers, screens, or floating contractors can also be used to
reduce bubble size and velocity in the hope of reducing entrainment (Tasirin and Geldart
-54- -

1998b). They also found that increasing the freeboard area above the bed will cause
velocities and entertainment rates to be decreased, although there is only a limited amount of
material published on these topics (Tasirin and Geldart 1998b). As the use of baffles or other
expanded freeboards would involve the redesign of the FCCU regenerator, it is beyond the
scope of this thesis.
2.11 Emissions Problems
In recent years there has been a marked increase in environmental standards concerning air
pollution. Stricter legislation world-wide, as well as increased concern regarding the possible
environmental and health effects caused by industrial air pollution has led to a situation
where industries, including oil refineries must continually reduce the level of pollution
emitted from their facilities (Eagleson and Weaver 1999; Gelevan and Siegell 2000; Hogue
2000; Johnson 2000; Yang 2000; Johnson 2001).
FCCUs are the main source of particle emissions from oil refineries, and correct operation
and management of this system is essential to minimise particle emissions (Eagleson and
Weaver 1999; Gilman et al. 1999). During the past 50 years, the improvements in FCCU
design have led to a 90% reduction in particle emissions rates, while increasing production 3-
fold (Evans and Quinn 1993). To achieve such large reductions in particle emissions,
refineries have had to rely on expensive end of pipe technologies such as wet scrubbers or
electrostatic precipitators (Eagleson and Weaver 1999; Gilman et al. 1999). The normal
particle emissions level experienced from a FCCU regenerator with a 2 stage cyclone is
approximately 300mg/Nm3, with limits being reduced to 40-60mg/Nm3 with additional air
pollution control devices being used (Evans and Quinn 1993). This reference compares
favourably with the refineries’ own estimation of their emissions being approximately
270mg/Nm3, based on a four year average.
The literature generally identifies strategies and operational considerations for the reduction
and management of catalyst emissions for normal operating conditions. These include
correct unit monitoring, proper design of air pollution control devices and controlling catalyst
attrition rates (Fletcher 1995; Tenney and Gardner 1998; Salbilla 1999). However, it is
widely accepted in the industry that large variations between the quantity and composition of
catalyst emissions during start up situations occur, although specific references are limited in
-55- -

the literature. Only a few sources have been identified which specifically look at the
emissions spectra occurring during a start up situation (Agranovski and Whitcombe 2001;
Agranovski and Whitcombe 2002; Whitcombe et al. 2002a; Whitcombe et al. 2002b;
Whitcombe et al. 2003a). It is commonly assumed that these higher than normal start up
emissions are caused by dynamic changes in the operating procedures causing temporary
cyclone problems or direct failure of specific equipment (Ezernack 1997; Tao 2000).
Whilst shut down, no feed stock (crude oil) enters the FCCU and the unit is allowed to cool.
The regenerator is then either partially or fully emptied of catalyst. During FCCU start up,
the unit is brought on line gradually over several days. When the start up commences, hot air
is fed into the unit to heat and fluidize the partially full catalyst bed. As temperatures
increase, more catalyst (normally e-cat), is fed into the FCCU, with fresh catalyst added to
top up the unit. Finally, when operating conditions (temperature, catalyst level etc) have
returned to normal, the feedstock is re-introduced and the FCCU is fully operational
(Agranovski and Whitcombe 2002; Whitcombe et al. 2003a).
It is important for refiners to understand causes of start up emissions, as they are often
significantly larger than normal operating emissions levels (Agranovski and Whitcombe
2002). Refineries may need to utilise expensive end of pipe treatment options to adhere to set
standards or limits on particle emissions, which may only be broken during a start up. By
understanding why start up emissions occur, operational changes could be implemented,
reducing the need for expensive treatment alternatives.
2.11.1 Overcoming Emissions limitations
Salbilla (1999) has outlined several ways in which refineries can overcome excessive particle
emissions from their FCCU. This includes identifying variables that affect emission rates,
optimizing operating conditions, modifying catalyst physical properties and through the use
of additional air pollution control devices (Salbilla 1999).
Fletcher (1995) argues that a thorough understanding of the entire FCCU during normal
operations is needed to develop baseline data to compare against periods of high particle
emissions which may occur later. This will allow refineries to identify peak emissions times
and conduct investigations to rectify the situation. These periods of high emissions usually
-56- -
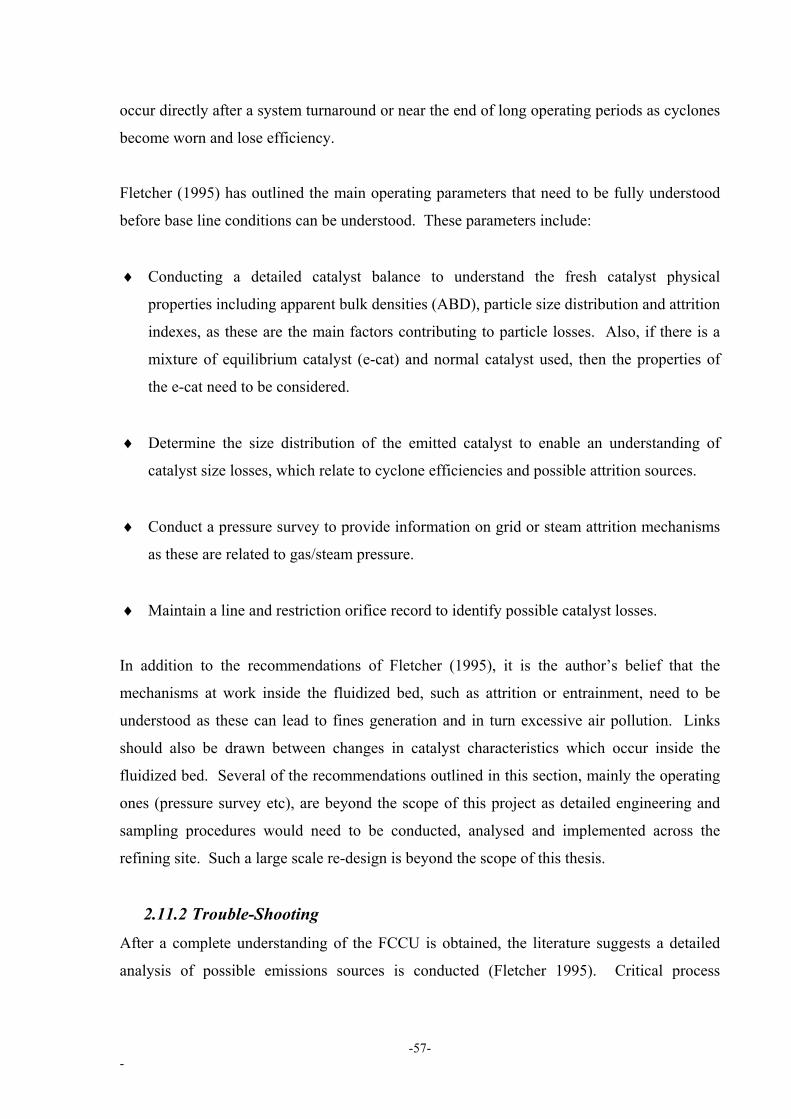
occur directly after a system turnaround or near the end of long operating periods as cyclones
become worn and lose efficiency.
Fletcher (1995) has outlined the main operating parameters that need to be fully understood
before base line conditions can be understood. These parameters include:
♦ Conducting a detailed catalyst balance to understand the fresh catalyst physical
properties including apparent bulk densities (ABD), particle size distribution and attrition
indexes, as these are the main factors contributing to particle losses. Also, if there is a
mixture of equilibrium catalyst (e-cat) and normal catalyst used, then the properties of
the e-cat need to be considered.
♦ Determine the size distribution of the emitted catalyst to enable an understanding of
catalyst size losses, which relate to cyclone efficiencies and possible attrition sources.
♦ Conduct a pressure survey to provide information on grid or steam attrition mechanisms
as these are related to gas/steam pressure.
♦ Maintain a line and restriction orifice record to identify possible catalyst losses.
In addition to the recommendations of Fletcher (1995), it is the author’s belief that the
mechanisms at work inside the fluidized bed, such as attrition or entrainment, need to be
understood as these can lead to fines generation and in turn excessive air pollution. Links
should also be drawn between changes in catalyst characteristics which occur inside the
fluidized bed. Several of the recommendations outlined in this section, mainly the operating
ones (pressure survey etc), are beyond the scope of this project as detailed engineering and
sampling procedures would need to be conducted, analysed and implemented across the
refining site. Such a large scale re-design is beyond the scope of this thesis.
2.11.2 Trouble-Shooting
After a complete understanding of the FCCU is obtained, the literature suggests a detailed
analysis of possible emissions sources is conducted (Fletcher 1995). Critical process
-57- -

parameters and operational conditions such as, catalyst physical properties, cyclone
performance and identifying possible attrition sources should be considered (Fletcher 1995).
2.11.2.1 Operating Variables
Three main operational parameters influencing air emissions have been identified (Salbilla
1999). These are percentage throughput above design specifications, the transport
disengaging height (TDH), and the frequency of shutdowns / start ups (as catalyst is lost
during these procedures) (Salbilla 1999). Generally, it is believed that running the system at
an over design capacity is the largest cause of particle emissions. Throughput is an economic
factor relating to profitability, and serious consideration is needed before reducing throughput
(Salbilla 1999). Throughput levels are related to general emissions levels and are unlikely to
be the cause of start up emissions, as the system is not fully operational and would be below
maximum design capacity.
The study of normal operational conditions requires research that relates directly with the
economic and safety requirements of the refinery and is therefore beyond the scope of this
project. Only start ups / shut downs will be investigated as operational procedures may need
to be altered to minimise impact during these discrete phases of operation. As start ups
should only occur once every few years (although they are often more prevalent), and
considering the nature of employment in the refining industry, shut downs and start ups can
often be a once-in-a-career event for engineers (Ezernack 1997). This allows some flexibility
in the procedure in which start ups are conducted to allow for the control of excessive
emissions from the system.
2.11.2.2 Catalyst Physical Properties
The main physical properties of the catalyst, which have been identified as important to the
understanding of particle emissions, can be grouped into three areas: changes in the attrition
rates with time, alterations in the particle size distribution and finally changes in the catalyst
apparent bulk density which can lead to a reduction in TDH and increases cyclone loading
rates. Bulk densities can lead to TDH dropping and increase loading through cyclones
(Fletcher 1995).
-58- -

2.11.2.3 Cyclones
The design and operation of cyclones at a refinery can have an enormous impact on the level
of particle emissions from that site. Under normal operations, a normal bell shaped curve of
the particle size distribution of fines should be obtained from sampling exit points of the
cyclone. If this is not the case, then the actual cyclone may be damaged or faulty. Bimodal
curves indicate a hole has developed in one of the cyclones, as a second peak is appearing
from catalyst being sucked into the system from the bed (Fletcher 1995).
-59- -

3 Research Proposal The main objective of this thesis is to identify management strategies for particle emissions
from the current physical design of the operating industrial FCCU. As the thesis is based on
an industrial problem, namely reducing emissions during a start up, constraints from the
industry are placed onto the thesis, in particular cost and operational issues pertaining to the
FCCU. There are no plans for the current FCCU being used at the refinery to be redesigned.
The literature is lacking in knowledge of the composition and concentration of particle
emissions from FCCU regenerators under normal conditions, and particularly lacking in
information on start ups. There is evidence of higher than normal emissions rates from
FCCU during start up, when thermal attrition mechanisms are occurring to the catalyst. One
aim of the thesis is to obtain a detailed assessment of particle emissions from a FCCU under
start up conditions.
There are three areas i.e. catalyst characteristics, operational conditions, and finally the
physical design of the system, which influence emissions. The main catalyst characteristics,
which may influence emissions rates, are rates of attrition or particle strength, the ability of
the catalyst to remain fluidized in all areas of the system and the possibility that contaminant
species in the feedstock, contribute to the emissions. The contribution of thermal
mechanisms to the fracture and attrition of catalyst has not been extensively covered in the
literature. A further aim of the thesis is to test various types of catalyst under simulated start
up conditions to allow the true extent of particle fracture due to thermal shock to be
investigated.
The literature has also suggested that metal contamination of catalyst is a major cause of
catalyst deactivation. If metal coating does occur, then this material may contribute to
agglomeration and emissions rates. Also, the study of metal contamination may have
secondary benefits to the refinery in terms of increased yield rates and reduced catalyst
expenditure. Another aim of the thesis is to measure the levels of catalyst contamination, and
to investigate how it occurs.
-60- -

Excessive emissions rates can be an indicator of poor cyclone efficiencies, which can be
caused by poor dipleg operations. Of interest is whether catalyst has the ability to become
de-fluidized under specific conditions, or whether time spent in the system can alter these
characteristics. Further aims of the thesis are to investigate how changes to the particles
physical structure, whilst in the FCCU, impacts on fluidity and whether dipleg operations
influence catalyst emissions rates.
The refinery also needs predictive models which can be incorporated into the operating
procedures. This is a difficult task given the current state of knowledge of the processes
involved. A final aim of the thesis is to develop a model of the system and test it using
sensitivity analysis to determine the optimal operating conditions needed to reduce emissions
rates. The refinery will then have a better understanding of what operational conditions
influence emissions.
3.1 Methodology
Due to the diverse range of issues studied in this thesis, a detail methodology is provided in
each section. A scaled prototype of the regenerator will also be built and tested in the
laboratory under simulated start up conditions to see whether start up emissions profiles can
be observed. However, there are several experiments conducted throughout this thesis, with
methodologies outlined below.
3.2 Experimental Equipment and Methodology
3.2.1 Measuring Emissions levels
All sampling conducted at the refinery will have to be in accordance with published
environmental standards and procedures. Filtration will be used as the preferred sampling
tool due to its simplicity, cost effectiveness and accuracy when dealing with particulates
(Wight 1994).
The US EPA Method 5, " Determination of Particulate Emissions from Stationary Sources"
will be used as the sampling method for all field samples at the refinery. EPA Method 5 will
-61- -

ensure the integrity and comparability of all samples throughout the project's time frame. For
a detailed explanation of US EPA Method 5 methodology refer to Wight (1994).
3.2.2 Catalyst Samples
Fresh and equilibrium catalyst (e-cat) used were sourced from the refinery, unless stated, and
were manufactured by Akzo Nobel. Catalyst samples were collected in 0.5kg amounts from
an existing access point in the regenerator. Refinery staff collected all of the samples
according to their own sampling procedures to ensure representative samples were collected.
After collection the catalyst samples were allowed to cool naturally in sealed containers, and
stored in the same location to prevent environmental conditions, such as moisture content,
altering the catalyst samples.
3.2.3 Particle Size Distribution
All particle size analysis was undertaken using a Mastersizer S, laser particle size analyser
with a small volume sample handling unit attached (Malvern Instruments, UK). As per the
Mastersizer operational guide, all catalyst samples were suspended in filtered water and
passed through the Mastersizer, ensuring the necessary operational conditions such as
obscurity and residual levels. To ensure representative results, sub samples used with the
Mastersizer were obtained from quartering the original 0.5kg catalyst sample.
3.2.4 Sample Inspections
Where needed, samples of filters and catalyst were inspected using a Scanning Electron
Microscope (JOEL JSM 35LFF, Japan) with a JEOL Silicon Lithium X-ray Detector. The
detector used an energy dispersion X-ray spectrometer containing a Beryllium window
(JEOL, Japan). The JEOL was interfaced with a Moran Scientific PC based X-ray Micro
Analysis System.
A small amount of each sample was mounted onto aluminum stubs using double sided carbon
tape. After mounting, the catalyst was coated in carbon using a vacuum evaporator, and was
placed inside the JEOL Scanning Electron Microscope (SEM). Once an area of interest on
the sample was identified, its image was captured using the Moran Scientific PC
microanalysis system. The image can then be saved on to disk or edited using photo editing
-62- -

software. If X-ray analysis is required the system allows a curser to be used to pin point an
area on the image to be analyzed using the X-ray detector.
Instead of normal SEM images, backscattered images were taken. Unlike standard electron
microscope images, backscattered images are formed by detecting areas containing different
elements. Thus, the brightness of an area on the image is proportional to the atomic number,
i.e. the larger the atomic number of a material the brighter it appears, relative to other
compounds in the image (Bozzola and Russell 1992).
3.2.5 Heavy Metal Tests
All totals in terms of metal contamination were determined using acid digestion. Digestions
were carried out in glass 75ml test tubes with a standard block digester using concentrated
nitric acid (69%). An Atomic Absorbance Spectrometer (Varian SpectraAA, USA) was used
to determine concentrations of metals.
Approximately 0.3 grams of each of the catalyst sample or the complete filter were weighed
and placed into individual glass test tubes. Test tubes were placed into a block digester and
allowed to digest for 24 hours. The digested solutions were transferred into 10ml plastic
containers with 5ml-distilled water used to rinse the test tube and top up the samples. All
containers were centrifuged and passed though the Atomic Absorbance Spectrometer. All
concentrations obtained from the spectrometer were converted into percentage weight of the
original sample. Blanks of clean filters and known standards were also used to determine the
relative accuracy of the testing procedure.
-63- -

4 Identification of Start Up Emissions
Little has been reported in the literature on the properties of the emissions from FCCU
regenerators. Information is particularly lacking on the nature and properties of the start up
emissions, and a detailed assessment is required. This assessment needs to look at the
quantity, size range and composition of emitted material.
4.1 Methodology and Procedure
4.1.1 Emissions Sampling
The sampling techniques employed for measuring emissions levels are described in Section
3.2.1 Measuring Emissions Levels. Particle concentration and size distribution monitoring
were preformed during the first five days of a standard start up operation. Approximately
two weeks after the start up, another set of sampling was conducted to determine normal
running conditions, against which all results could be compared (Agranovski and Whitcombe
2001; Agranovski and Whitcombe 2002; Whitcombe et al. 2002a; Whitcombe et al. 2003a).
Samples were taken soon after the re-loading of equilibrium catalyst (e-cat) into the fluidized
bed, with the frequency of sampling declining over the start up period as conditions in the
FCCU returned to normal. Samples were taken at approximately 7.5 hours, 44 hours, 66
hours, 91 hours, 142 hours and 460 hours after start up. Each sample was taken over a period
of between 3 and 7 minutes, depending on particle loading, with alterative stack traversing
points used to ensure standard EPA Method 5 results. After each test, the filters were
changed and repeat tests conducted, ensuring at least 3 sets of filters were obtained.
Approximately 2 weeks (460 hours) after start up, the final sample was taken to identify
standard operating emissions levels, as this was seen as an appropriate time frame according
to refinery advice.
The size distribution of particles in the exhaust gas was determined with the use of an eleven
stage University of Washington Mark 5 Cascade Impactor (Pilat et al. 1970). Calibration of
the impactor with that of the gas stream velocity was carried out in order to determine the
exact size fractions collected. Three types of filters were used during the sampling period.
-64- -

These were impactor’s donut-shape filter substrates (Pollution Control Systems Corp.,
Seattle, WA), an absolute ultra-fine glass fibrous filter (Pollution Control Systems Corp.,
Seattle, WA), and a ceramic thimble filter (used once for calibration purposes). After each
sample, the probe was withdrawn and the filter changed, ensuring the used filter was placed
back into the sealed container to prevent contamination. After all samples were collected,
filters were returned to the laboratory for analysis.
Catalyst (e-cat) was taken from the FCCU after the final air sample was completed. The
FCCU has a small valve which is used to remove approximately 0.5kg samples of catalyst
from the regenerator (2kg in total taken). This catalyst was used as the base line, for
comparison with the collected emissions to determine how the emissions differ over time.
4.1.2 Identification of emitted catalyst
Iron, nickel, vanadium and molybdenum were selected as indicator metals to identify how
metal contamination fluctuates in the flue gas emissions. It is known experimentally, that
these metals deposit to various depths, starting from the surface of the catalyst particle, and
working inwards, although the exact extent to which this occurs in industrial situation is not
clear (Nielsen and Doolin 1993; Trimm 1996). These four metals provide information
regarding the formation of fine particles inside the regenerator, as formed particles will
exhibit concentrations of metals according to their origin in a larger parent particle. In
addition to these tests conducted on the collection filters and catalyst samples, tests were also
undertaken to determine the relationship between particle size and metal concentrations.
Samples of the catalyst used during the start up as well as the actual filters were analyzed
using acid digestion and scanning electron microscopes (SEM) to determine particle
characteristics, refer to Chapter 3.2 for methodologies.
4.1.3 Theoretical Analysis
A detailed description of the regenerator, including cyclone details, is provided in Chapter
3.3. Operational data used in this study, was obtained from the refinery's real time
computerized control system, which continually records operating parameters across the
entire facility. Cyclone velocities, regenerator temperature and catalyst loading rates were
identified as the most likely conditions affecting emissions rates. By combining the operating
-65- -

conditions and cyclone specifications, cyclone collection efficiencies were calculated for
operating conditions experienced during the start up period.
Cyclone efficiencies were determined from Equation 2.2 and 2.3 using operational data
obtained from the refinery (temperature and flow rate). Evenly spaced particle sizes, between
1 and 100µm in size, were used to generate a theoretical efficiency curve for the cyclones at
various gas velocities, refer to Figure 4-9 in the results section for the results
4.2 Particle Emissions Results
Figure 4-1: A log particle size distribution of e-cat used during the start up, including
standard deviations
A log particle size distribution (PSD) for the e-cat used during the start up, obtained from 4
different samples, is given in Figure 4-1. The e-cat used during the start up had a narrow
PSD with the majority of the particles between 60µm and 120µm.
-66- -

Figure 4-2: Total emissions of catalyst over start up period.
The results of total particle emissions during the start up period are given in Figure 4-2, and
show that the start up air emissions fluctuate considerably over the sampling period. Total
levels peak at over 900mg/Nm3 after approximately 2 days from the commencement of start
up, well above the new maximum limit of 405mg/Nm3 set by the EPA. This peak level is
considerably higher than the normal emissions level of approximately 80mg/Nm3, which is
below the 4 year average of 270mg/Nm3, outlined in Chapter 2.4. Three samples were
conducted at each sampling point, with standard deviations being obtained from the results of
these tests. Although illustrated in Figure 4-2, the relatively small magnitude (between 10
and 15mg/Nm3) of the standard deviation makes it difficult to see on the graph. The average
Sauter diameter of particles in the emissions (calculated as mean particle volume/ mean
particle surface) is also plotted on Figure 4-2 to show the variations during the first 450 hours
since start up, and provides a standard method of assessing particle size.
-67- -
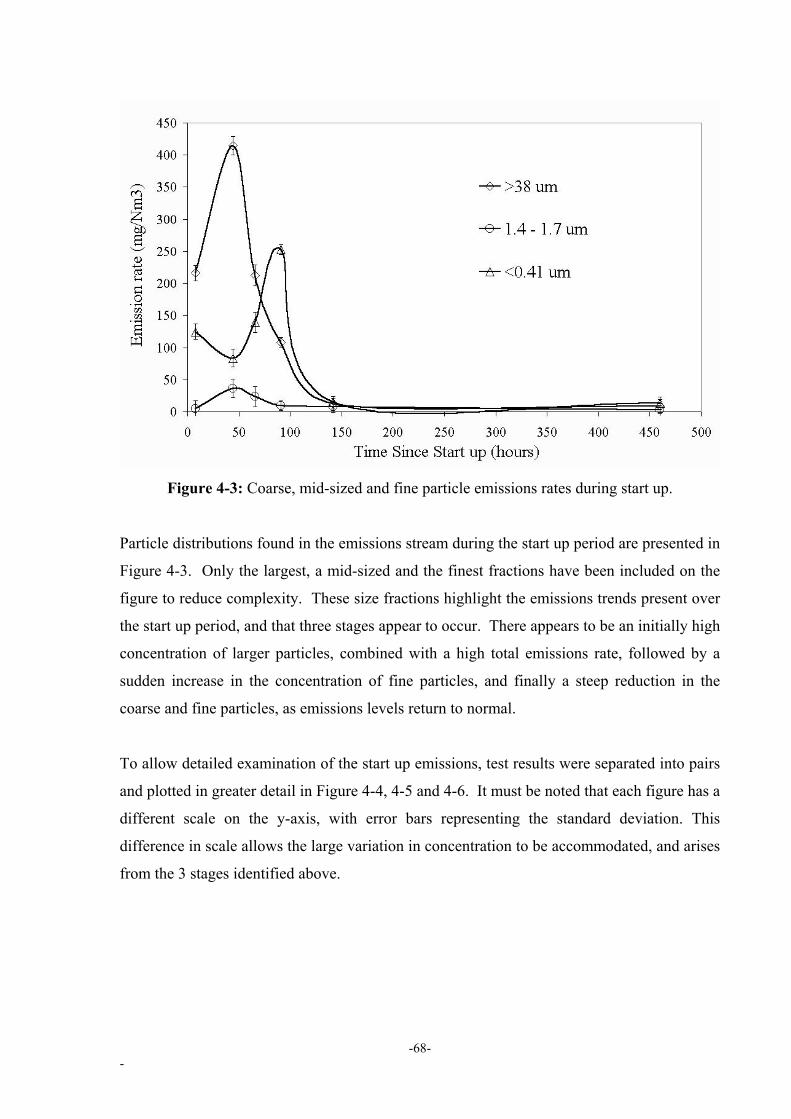
Figure 4-3: Coarse, mid-sized and fine particle emissions rates during start up.
Particle distributions found in the emissions stream during the start up period are presented in
Figure 4-3. Only the largest, a mid-sized and the finest fractions have been included on the
figure to reduce complexity. These size fractions highlight the emissions trends present over
the start up period, and that three stages appear to occur. There appears to be an initially high
concentration of larger particles, combined with a high total emissions rate, followed by a
sudden increase in the concentration of fine particles, and finally a steep reduction in the
coarse and fine particles, as emissions levels return to normal.
To allow detailed examination of the start up emissions, test results were separated into pairs
and plotted in greater detail in Figure 4-4, 4-5 and 4-6. It must be noted that each figure has a
different scale on the y-axis, with error bars representing the standard deviation. This
difference in scale allows the large variation in concentration to be accommodated, and arises
from the 3 stages identified above.
-68- -

Figure 4-4: Emissions levels from the FCCU, 8 and 44 hours from commencement of
operations (the first stage).
Figure 4-5: Emissions levels from the FCCU, 66 and 91 hours from commencement of
operation (the second stage).
-69- -

Figure 4-6: Emissions levels from the FCCU, 142 and 460 hours from commencement of
operation (the third stage).
Figure 4-4 shows the size classes based on emissions at 7.5 and 44 hours after start up, and
note that the size class fractions above 1µm actually increase in concentration, while others
declined. Taking into account the changed scale, Figure 4-5 indicates that the earlier trend is
reversed and the larger fraction now decreases in concentration with an increase in the finer
fractions. Figure 4-6, shows a dramatic drop off in all particle concentrations in the
emissions, with dramatically higher than normal levels not seen after the 142 hour mark.
Although emissions are dramatically reduced after 142 hours, there is still considerable
fluctuation in the concentration and composition of the emissions.
-70- -

Figure 4-7: Stack temperature and volumetric flow rate obtained from the stack.
Stack conditions monitored during the start up are shown in Figure 4-7. The air temperature
fluctuates over the start up period from an initial low of 578°C, rising to almost 650°C at
approximately 50 hours after start up, before falling to 626°C at the last sample. The change
in air temperature is caused by the heating of the catalyst bed, which occurs over this period.
The volumetric flow rate started at 24 Nm3/s before reducing to 15 Nm3/s, 66 hours after start
up. The lower air flow rate seen around 50 hours after start up, is commonly used for more
uniform fluidization of the catalyst in the bed when the thickness of the catalyst layer is
below the operational level and also because there is less coke to be burnt off of the catalyst.
However, the flow rate increased with the growth in the thickness of the catalyst layer, and
reached 25 Nm3/s at the time when the last sample was taken. Initially the bed is essentially
empty of catalyst, with it being rapidly filled to it’s normal operational condition of 80% full
(approximately 300 tones), between the period of 50 to 100 hours after the start up, refer to
Figure 4-8.
-71- -

4.3 Operational Results
The changing operational conditions during the start up period, as described earlier are
represented in Figure 4-8, 4-9 and 4-10. The 24 hour average of operational conditions, as
obtained from the computerised control system, are plotted as a solid line with the
approximate time period of each air sample indicated by a cross on the line, in each of the
figures. The crosses placed on the figures are approximate only, and are based on the average
time at which each set of emissions samples were taken.
Figure 4-8: Percent catalyst level in the regenerator bed during start up. Crosses indicate
times of emissions sampling.
The percentage of catalyst in the regenerator bed during the start up period is given in Figure
4-8. Note, that the percentage is the difference between the lowest and highest operational
sensor points inside the FCCU. For this reason, a reading of 0% does not indicate a
completely emptied bed, just that the level is below the lowest level required for detection.
For the first 50 hours the bed was at its lowest level. Approximately 50 hours from start up
the catalyst level rose dramatically from almost 0% to 78% at the 100hour mark. The
catalyst level then remained relatively constant for the remainder of the sampling period.
-72- -

Figure 4-9: FCCU cyclone inlet velocity (m/s) during the start up period. Crosses indicate
time of emissions sampling.
The velocity of gas in the cyclone inlet, given in Figure 4-9, fluctuated greatly over the start
up period. At first cyclone velocities were relatively low, approximately 12m/s, before
increasing to 18m/s, after 30 hours. The velocity then reduced, before steadily increasing
from the 50 hour mark until the 250 hour mark. Velocities continued to fluctuate between 20
and 23m/s for the remainder of the sampling period.
-73- -

Figure 4-10: Regenerator bed temperatures over the start up period. Crosses indicate time of
emissions sampling
The regenerator bed temperature in °C for the start up period is provided in Figure 4-10. Bed
temperatures start at 100°C, before rapidly increasing over the first 50 hours to approximately
620°C. The temperature then steadily increased to approximately 700°C, at the 100 hour
mark, where it remained for the duration of the sampling period. Feedstock is re-introduced
to the FCCU when the regenerator temperature stabilize at approximately 700°C, just after
100 hours of operation. It must be noted that Figure 4-10 is the catalyst temperature in the
bed, and is initially much lower than the stack gas temperature shown in Figure 4-7. The
catalyst is initially heated in the bed via the hot air used to fluidize the catalyst, it is this pre
heated air which causes the high initial stack temperature.
Predicted cyclone efficiencies, Ei, for the regenerator's cyclones at various gas velocities,
calculated using Equations 2-2 & 2-3 (Section 2.5.1) for various particle sizes, are shown in
Figure 4-11. All calculated efficiency curves have the same shape, varying slightly in
magnitude only. The three curves are close at low velocities and particle sizes, diverging in
the mid-range and again converging as gas velocities and particle sizes increase.
-74- -

Figure 4-11: Calculated removal efficiencies, Ei, for the regenerator's cyclone for various
velocities (m/s) and particle size (µm).
4.4 Catalyst Investigation Results
Concentrations of metals found in the stack emissions over the start up period are given in
Figure 4-12. A general pattern for all metals can be seen, with increases in concentration
over the first 50 hours followed by a sudden drop during the next 50 hours. After
approximately 100 hours the levels increase suddenly before reducing slightly, to a stable
concentration. The only exception is that of vanadium which has an almost steady increase
over the start up period to its highest concentration at the 450 hour mark. Overall iron was
found to be the contaminant with the highest concentration in all samples with a peak of
3.1%wt (142 hours) and a low concentration of 0.28%wt (460 hours). Nickel and vanadium
had similar concentrations throughout the sampling period with the highest and lowest levels
found for nickel being 0.39%wt (44 hours), and 0.01%wt (7.5 hours), respectively and for
vanadium the highest being 0.27%wt (460 hours) and the lowest being 0.02%wt (7.5 hours).
Only trace concentrations of molybdenum were found in the fourth sample, with zero
concentration in all other samples.
-75- -

Figure 4-12: Plot of metal concentrations found in the emissions per unit weight vs time
since start up.
Concentrations of contaminant metals present in the e-cat, along with those obtained through
air emissions samples are shown in Figure 4-13. All emissions results presented in Figure
4-13 were based on the final air sample (460 hours after start up, based on advice from the
refinery) to ensure a steady state emissions sample was obtained. Iron is again the most
prevalent in all samples, with a wide variation in concentrations being found depending on
particle size. In general the samples obtained through air sampling contained the highest
levels of all contaminant metals.
-76- -

Figure 4-13: Plot of metal concentration per unit weight according to particle size for e-cat
(right side), and of emissions at 460hrs (left side).
A peak iron concentration of 8%wt was obtained in the 0.41-0.52µm size fraction, with the
lowest concentration being of 0.08%wt found in the 3–5.5µm size fraction. Nickel and
vanadium are the next largest contributors with their concentrations also varying widely
according to particle size. Nickel generally had the second largest concentration. Nickel and
vanadium reach their peak concentrations of 0.91%wt and 1.5%wt in the 0.7-0.85 and 1.7-
2.2µm size fractions, respectively. The lowest values are 0.002%wt (nickel) and 0.005%wt
(vanadium), found in the 3.0-5.5 and 106-125µm size fraction. Molybdenum had the lowest
concentration, with all samples having concentrations below 0.002%wt. In terms of the e-cat
sample, there is a slight reduction in the concentration of metals found in the mid sized
particles (90 - 250µm), with the largest concentration of metals in the larger and smaller
particle fractions. However, the concentration of metals is relatively constant, compared with
the fluctuations found in the air emissions. As with the air emissions, iron is the most
predominant metal found in the e-cat particles.
-77- -

Figure 4-14: Plot of metal concentrations according to particle size, found in the emissions,
per unit weight vs time since start up. ‘Small’ are particle less than 5.5µm in size while
‘Large’ are particles greater than 5.5µm. Note, the y-axis has been truncated to allow detail to
be seen in the lower ranges.
Metal emissions according to particle size are shown in Figure 4-14. Note that all particle
sizes collected were classified into two particle sizes, as shown in Figure 4-14, with Large
(>5.5µm) and Small (<5.5µm) sized particles. This cut off size was selected due to the
particle ranges collected as well as as it showed the greatest contrast in data when plotted. To
improve visualization of the trends present in the graph, the y-axis has been truncated; this
affects only the Large iron graph.
Initially the smaller sized particles contribute the most to the metal emissions until
approximately 50 hours since start up. After 50 hours when the contribution rate changes,
with the large sized particles becoming the largest contributors. Again, iron was found to be
the most prevalent metal, with the maximum concentration being approximately 26.5%wt in
the coarse size fraction at 91 hours.
-78- -

4.5 Discussion
There is a wide variation in the particle size distribution of the emissions during start up and
that of normal operations. Generally three stages of emissions are identified from the stack
samples, and are described individually.
4.5.1 Initial Stage
Initially the majority of the emissions are comprised of the largest two size fractions (>38µm
& 5.5 - 38µm). The first stage of emissions coincides with several specific operational
conditions. Cyclone velocities (Figure 4-9) were lower than normal, which from Figure 4-11
translates to approximately 5 to 10% reduction in removal efficiencies. Catalyst level and
temperature levels inside the regenerator are also at their lowest.
These conditions combine to generate larger than normal emissions rates. As the amount of
catalyst in the bed is low, the bed will experience greater turbulence and instability. This is
due to the fact that the pressure drop in the bed is related to the weight of the bed per unit
area (Geldart 1986b). The gas being fed into the bed will have less material above it to
distribute the energy, thus causing the gas jets to push larger than expected particles into the
freeboard of the regenerator. This increase in turbulence, at a lower velocity, would lead to a
situation where larger then normal particles can reach the cyclone inlet, while cyclone
collection efficiencies are reduced due to the lower gas velocity.
In addition to lower gas velocities impacting on cyclone collection rates, less catalyst in the
FCCU would imply a reduction in the catalyst loading rates inside the cyclone. As cyclone
efficiencies are related to particle loading rates (Fassani and Leonardo Jr 2000), less catalyst
flowing into the cyclone would theoretically reduce the cyclone's ability to retain catalyst
particles (refer to Chapter 2.5). Therefore a situation is formed whereby larger particles reach
the cyclone, in a reduced concentration, yet higher than normal emissions rates are
experienced due to a reduction in cyclone efficiencies.
The low level of catalyst in the regenerator also causes the cyclone diplegs to be above the
catalyst bed. Without the additional force of catalyst pushing against the dipleg’s tickle
value, air bypass is likely to occur. This would allow air to flow up the diplegs, re-entraining
-79- -

solid material in the cyclone. As shown in Figure 4-8, as the catalyst bed inventory is
increased, a reduction in the emissions of large particles is experienced, suggesting that the
cyclone and diplegs have begun operating correctly. Although contributing to the initial
increase in large particle emissions, cyclone and dipleg factors are unlikely to be the only
cause of the initial increase in particle emissions.
The combination of reduced cyclone velocities and exposed diplegs allows larger particles
not normally found in the flue gas, to be there. With the lack of other start up emissions tests
in the literature, no comparisons can be made to determine the true normality of this start up.
Further consultation with the refinery supports the view that this was a 'normal' start up,
therefore the fact that large particles are present indicates that there is a general lack of
understanding about how start up situations influence catalyst particle emissions (Agranovski
and Whitcombe 2001; Agranovski and Whitcombe 2002; Whitcombe et al. 2002b;
Whitcombe et al. 2003a).
The second largest emissions source during this initial period is that of the finest size fraction
(<0.41µm). It is commonly accepted that the fine fractions are generated through attrition of
larger particles (Werther and Reppenhagen 1999; Wu et al. 1999). This is supported by the
results in the initial stage, as a large amount of coarse material is accompanied by fine
material, although there is little of this sized material originally in the e-cat (Figure 4-1).
During this initial stage, there is a noticeable lack of mid sized particles, with a slight increase
found in the second sample. The lack of mid-sized particles (0.52 µm – 5.5 µm) and the
sudden decrease in fines may be explained by the presence of agglomerates early in the start
up process, thus causing the mid-range and fine particles to stick together and be retained in
the system. This reduction of the medium and fine size fraction in the emissions tends to
support the theory of Santana et al. (1999) that there is an attrition/agglomeration process
occurring in fluidized beds. As the temperature in the stack is increasing over this initial
period (Figure 4-7), the influence of this temperature rise in generating emissions is unclear.
As catalyst loading has not yet started, it is unlikely that the reduction of fines in the
emissions is due to particle loss in the loading stages.
-80- -

It has been reported that e-cat is able to form stronger agglomerates than fresh catalyst, and
that it may become 'sticky' due to mild sintering of the e-cat particle's surface (Barsukov et al.
1998; Whitcombe et al. 2002b). It has been shown that smaller particles do undergo sintering
(mild burning) more rapidly than larger particles (Stephens et al. 1999), this combined with
the higher concentrations of metals on the smaller particles would provide a source of particle
adhesion via heat. As the regenerator’s bed temperature increases rapidly (Figure 4-10,
Sample 1 and 2), the concentration of small particles is reduced. It is possible that the rapid
increase in temperature causes the e-cat inside the regenerator to become slightly sticky,
causing the very small particles to stick to the larger particles, thus preventing them from
escaping the cyclones. Alternatively, any sticky particles that enter the flue gas may
agglomerate before the particles were collected onto the filter, hence some of the larger
particles may actually be the product of agglomerations in the stack.
During the initial 50 hours of operations, the concentration of metals found in the emissions
steadily increased, with iron showing the greatest increase (Figure 4-12). As the system is
slowly brought on line, velocities will increase (Figure 4-9) leading to greater turbulence and
particle interactions, which will all contribute to greater particle attrition. As seen in Figure
5-14, finer sized particles have higher weight percentage of metals, indicating these particles
have been removed from the surface of an e-cat particle. As the internals of the regenerator
are covered in a non-metallic coating (refer to Chapter 2.4), the only source of metals in the
emissions would be from contaminants found in the e-cat.
4.5.2 Second Stage
The second stage of the start up process is characterised by a sudden reversal in the particle
distribution found in the emissions. Coarser particles (>38µm) in the emissions decrease in
concentration, whilst the smallest size fraction (<0.41µm) increases dramatically. Again, the
middle size fraction, although fluctuating in number, remain relatively low compared with the
larger contributors to the emissions in the stack. Cyclone velocity, bed temperatures and
catalyst level in the bed all increase (Figure 4-8, 4-9 and 4-10) during this stage.
The sudden drop in coarse material emitted, together with a subsequent rise in fines suggests
that the cyclones have started operating correctly and that the bed is sufficiently full of
-81- -

catalyst to induce bubbling rather than turbulent jets of gas. The reduction of coarse material
would only be achieved through correct cyclone operations, but as the gas flow rate is
actually decreasing during this stage (Figure 4-7), theoretical cyclone efficiencies should be
dropping. The increase in cyclone velocity would allow increased particle retention for larger
particles, thus lowering both total emissions rates and the concentration of larger sized
particles. In addition to cyclone efficiencies being increased due to increased gas velocities,
it is also expected that the increased amount of catalyst in the bed will enhance cyclone
efficiencies through increased loading rates (Fassani and Leonardo Jr 2000).
The increase in emissions of fines would be due to attrition, with the products being lost from
the system as they are formed (Werther and Reppenhagen 1999; Wu et al. 1999). The e-cat
would have been unloaded from the system, stored, then re-loaded during the start up. Any
particles formed during this stage will accumulate until the catalyst is added to the fluidized
bed. Once added, fluidization will occur, and any build up of fines in the catalyst will be lost
rapidly. The initial increase in fines during between 44 and 66 hours would be caused largely
by the sudden flood of fine material into the system. The continual increase in the
concentration of fine particles between 66 and 91 hours of operation are likely to be caused
by an additional attrition source.
Results in the literature show that the mixing of hot and cold catalyst, regardless of type (e-
cat or fresh), produces significant particle destruction and a consequent production of fines
(<1µm) (Whitcombe et al. 2002a; Whitcombe et al. 2002b; Whitcombe et al. 2003c;
Whitcombe et al. 2003d). This production of fine particles due to catalyst mixing is the likely
the cause for the sudden increase in fine particles present in the second emissions stage. This
is suggested by the fact that the maximum concentration of fine particles in the emissions is
at the 91 hour of operation point, which coincides with the catalyst bed being almost 70%
full. The rapid filling of the regenerator results in large amounts of cold catalyst contacting
hot catalyst inside the system, thus inducing thermal fracture and the generation of fine
particles. As these particles come into contact, they fracture, generating significant numbers
of fine particles, which cannot be retained in the cyclones due to their size, and are
consequently lost from the system. As the loading of catalyst slows (Figure 4-8, Samples 4 to
5), the concentration of small particles in the emissions drops significantly.
-82- -

Interestingly, the emissions of fine particles coincides with a decrease in metal concentrations
seen in the emissions stream, contradicting the results showing that smaller particles have
higher metal levels. As only e-cat is present during the initial heating stage, e-cat is the only
source of particle attrition and generation. This means that any new particles formed via
attrition will be sourced from the e-cat containing metals. As the system is operated without
oil, no new source of metals is available to the system. Therefore, the maximum
concentration of all contaminant metals in the e-cat is present at the very beginning of the
start up.
As attrition generates small particles which are lost from the system, a gradual reduction in
the concentration of contaminant metals occurs. From Figure 4-14, it appears that iron is
found on smaller particles, indicating any fragments generated from attrition are likely to be
iron rich, thus causing high levels of iron in the emissions stream as well as an over all loss of
iron from catalyst particles inside the FCCU. Nickel and vanadium are found more evenly
distributed throughout the particle's structure, implying that emissions of these species will be
steadier as a longer period of time is required to remove them via attrition.
The longer the system is operated without crude oil, the greater the concentration of metals
which are lost from the e-cat surface, and are not replaced. After time, there is a reduction in
levels of contaminant metals in the e-cat, and consequently less metals lost via the generation
of fine particles. Figure 4-12 shows that as the actual concentration of fines increases in the
emissions during the second stage, their levels of contaminant metals decrease. Thus, it can
be clearly seen that during the first 50 to 75 hours of operation the surface of the catalyst is
being worn away, removing any previous build up of metals. This implies that the e-cat
particle will have lower metal concentrations and possibly an increase in activity, although
this cannot be confirmed or disproved at this stage.
4.5.3 Third Stage
Approximately 125 hours after the initial start up, catalyst loading rates, bed temperature and
cyclone velocities all return to normal. Oil has been re-introduced into the unit and operating
conditions stabilize. At this stage, fine particle generation is reduced and cyclone collection
rates and emissions rates return to normal. However, as the particle emissions rates start to
return to normal there is a sudden and dramatic increase in the amount of contaminant metals,
-83- -

and in particular, iron which is released from the system (Figure 4-12) in the form of fine
particles (Figure 4-14).
When the oil is introduced, a new source of metals are available to the e-cat. Due to the
reduced levels of contaminant metals in the circulating e-cat, rapid metal deposition occurs.
Iron would rapidly coat the outside of the catalyst particle while the other metals move
deeper into the particle's structure. This sudden increase in the concentration of contaminant
metals within the catalyst will provide a fresh source of metal rich particles to be emitted.
From Figure 4-14 it can be seen that the concentration of metals in the emissions are found
on smaller particles, with a drop in the contributions due to the larger particles. This
supports, the idea that the particle is rapidly being coated on the outside, whilst at the same
time this outer layer is being worn away by attrition processes.
After this initial surge in metal deposition and consequent emissions via attrition products, an
equilibrium between the loss and gain of metal contaminants is reached allowing emissions
levels to become steady. This is not to say that a perfect steady state would be reached, only
that rapid increases and decreases in metal concentrations would be unlikely. Also as no 2
types of crude oil are the same, metal concentration in the feedstock will continually change,
again altering the concentration of metals in the e-cat and in the air emissions.
4.6 Conclusions
These emissions tests are the first emissions tests to be conducted under start up conditions
and have enabled the quantity and composition of the particle emissions to be determined.
Three distinct stages of emissions were identified during the start up procedure, with specific
operational conditions occurring during each stage. The emissions data supports the theory
that operational conditions as well as catalyst properties and hardware design influence
emissions rates. This chapter has also identified additional information on how emissions can
be related to catalyst characteristics and in particular metal concentrations on e-cat in the
system.
-84- -

5 Particle Fracture
As outlined in the literature review the extent of particle fracture and wear inside a FCCU is
unknown. Particle fracture, due to the thermal shock of cold catalyst being added into a hot
system, is a major source of particle loss when using fresh catalyst (Barsukov et al. 1998),
although little is known about how e-cat is affected. Conventional wisdom is that calcinated
catalyst (ie heat treated fresh catalyst) is stronger than uncalcinated catalyst and should not
undergo particle fracture, due to this thermal shock mechanism (Barsukov et al. 1998;
Whitcombe et al. 2003d). As the majority of catalyst loading occurring during a start up is
comprised of e-cat, and not fresh catalyst, it is important to identify how e-cat influences
particle emissions. This chapter investigates, firstly, the extent of particle fracture in fresh
and e-cat due to thermal mechanisms, and secondly whether this fracture generates particle
emissions.
5.1 Methodology for Investigating Particle Fracture
To determine the importance of thermal stresses on catalyst particle fracture, a series of
experiments were conducted to simulate the conditions found inside a FCCU when cold
catalyst is added to a hot system. The aim of the experiments was to investigate whether
fresh and e-cat catalyst undergoes thermal fracture and whether the interaction produced
entrainable material. Adding cold catalyst into a larger volume of hot catalyst is an
appropriate simulation to what occurs inside a FCCU when cold catalyst is added into the
regenerator (Whitcombe et al. 2002b; Whitcombe et al. 2003c; Whitcombe et al. 2003d).
Unfortunately this aspect of FCCU operation cannot currently be observed or measured on
site. Inside a FCCU the cold catalyst is added via a pipe opening in one side of the unit,
resulting in the immediate and localized mixing contact between hot and cold catalyst. This
will result in only a portion of the inventory of hot catalyst present in the bed being exposed
to the cold particles. A ratio of 70% hot to 30% cold catalyst was chosen for this experiment
in an attempt to approximate these localized conditions. In addition to the mixing ratio
selected, the pouring of the samples and gentle stirring allows the physical interaction
between the hot and cold catalyst inside a FCCU to be simulated (Whitcombe et al. 2003d).
-85- -

To test the significance of heating alone on particle fracture, samples of fresh and e-cat were
heated and allowed to cool inside an oven. By comparing the ‘before’ and ‘after’ particle
size distributions (PSD), the importance of thermal shock on particle size change can be
measured. Note that heating stationary e-cat could lead to mild agglomeration via metal
contamination on the surface, thus adding errors to the results. As this research is intended
only to investigate particle fragmentation, heating stationary non-fluidized catalyst samples is
the only way of eliminating particle generation due to attrition processes. As well as
comparing the change in particle size distributions, the experiments were conducted inside a
specially designed hood to allow collection and testing of any particle emissions through the
mixing process.
A normal regenerator temperature of around 600°C, was selected for all experiments to
simulate conditions which are as close as possible to the ‘real life’ processes inside a FCCU.
5.2 Experimental Materials and Equipment Particle Fracture
All experiments were conducted inside a 100mm diameter and 250mm high hood constructed
out of PVC, Figure 5-1. The hood had a front hinged door (60mmx100mm) to allow access
to the inside space. Air was drawn through a collecting filter media by a vacuum pump
connected to the top conical part of the hood. A stainless steel box (50mmx80mmx80mm)
placed inside the hood was used to mix the hot and cold catalyst samples for all experiments.
Samples were gently mixed using a glass rod 3mm diameter and 250mm long. Porcelain
crucibles (30ml) were used inside a Furnace (Lenton, UK) to heat all samples.
Forty seven millimetre diameter quartz fibre filters (Whatman, UK) housed in a filter holder
were used to collect air samples. All filters used during the experiments were weighed before
and after each experiment on an electric balance (Sartorius, Japan) with an accuracy of 1µg.
-86- -

Figure 5-1: Schematic of experimental setup
Fresh catalyst and e-cat samples were obtained from the refinery in an ‘as is’ condition.
Catalyst samples were sized using a Mastersizer and were analysed using SEM and acid
digestion. Refer to Chapter 3 for further detail of these analytical techniques.
5.3 Experimental Procedure
5.3.1 Catalyst
To test whether particle size influenced particle fracture, both fresh and e-cat catalyst samples
were sieved to obtain an artificially coarse (>150µm) size fraction. Nine experimental runs
were conducted with at least 2 repeats of each, ensuring at least 2 complete sets of samples
and filters. All catalyst samples, except two, were weighed to achieve an approximate
average ratio of 70% hot catalyst to 30% cold catalyst for each experiment (refer to Table
5-1). The other two catalyst samples (one fresh the other e-cat) were heated but not mixed
with cold catalyst; these served as base line experiments, and are referred to as Experiment 1
and Experiment 2, respectively.
-87- -

Table 5-1: List of experiments including the percentage of mass lost to the filters and their
corresponding rank order in terms of mass loss
Exp. Mixing Combination Total Mass (g) Loss to Filters Rank order
Hot Sample Cold Sample (%wt of total sample)
1 Fresh None 11.1944 0.0027 9
2 E-cat None 13.0103 0.0261 6
3 Fresh Fresh 16.2909 0.4456 1
4 E-cat E-cat 14.422 0.0118 7
5 E-cat Fresh 13.6197 0.0653 3
6 Fresh E-cat 17.8909 0.0274 5
7 E-cat Coarse Fresh Coarse 13.7857 0.0305 4
8 E-cat Coarse E-cat Coarse 14.6261 0.0903 2
9 Fresh Coarse Fresh Coarse 10.6044 0.0041 8
Note: All Samples were approximately 70% hot mixed with 30% cold
5.3.2 Mixing Tests
The collecting filter was weighed and placed into the filter holder. Catalyst to be used as hot
and cold samples were weighed and placed in separate sealed plastic containers. The catalyst
sample for heating was poured into an individual porcelain crucible and placed inside the
oven for 1.5 hours at 600°C to ensure complete heating of the catalyst.
After heating, the hot sample was removed from the oven and poured into the stainless steel
box housed inside the hood and containing the cold catalyst sample at room temperature
(20°C). The sample was gently mixed for 30 seconds using a glass rod, through the front
hinged door. Immediately prior to the sample being poured into the stainless steel container,
the vacuum pump was started to provide a continuous airflow passing over the container as
the samples were mixed. After the initial 30, seconds the hinged door was shut and the
mixed catalyst cooled inside the hood for another 2.5 minutes, with the vacuum pump on.
After three minutes, the sample had cooled sufficiently (down to approximately 30˚C) to
allow its removal from the metal box into a clean plastic container. The container was then
sealed to prevent contamination. The filter was also removed and weighed to assess the
change in mass, representing the material released from the mixing zone. For the two
-88- -

experiments containing hot catalyst only, Experiment 1 and 2, identical experimental
procedures were followed, with the exception that no cold catalyst was added to the stainless
steel container. These formed the base line experiments.
The particle distributions were analyzed using the Mastersizer S following the procedures
outline in Chapter 4. The largest contaminated region (center section) of the first set of
filters, were removed and mounted on aluminum stubs using double side carbon tape. After
mounting, the filters were coated in carbon using a vacuum evaporator and placed inside the
JOEL Scanning Electron Microscope (SEM). Filters were inspected to determine the relative
concentration of collected material as well as particle size.
Normal SEM images could not be taken due to the electric charging of the filter material due
to the filter conducting electrons and subsequently becoming significantly brighter than the
collected catalyst. To reduce the impact of charging, backscattered images were taken.
Unlike standard electron microscope images, backscattered images are formed by detecting
areas containing different elements. Thus areas containing materials of a higher atomic
number, such as the catalyst material, show up brighter, compared with the darker filter
material consisting of lower atomic number elements (Bozzola and Russell 1992).
Total levels of contaminant metals were identified in the catalyst samples and filters using
acid digestion and an Atomic Absorbance Spectrometer (refer to Chapter 3 for details).
5.3.3 Particle Size Distribution
Particle size distribution (PSD) plots obtained from the Mastersizer, were visually examined
to determine changes in particle size distribution due to thermal shock. To avoid subjective
visual interpretation between the ‘before’ and ‘after’ distributions, plots were quantitatively
analyzed using integration techniques. Firstly, a fitting of the experimental data by using an
appropriate analytical relation was conducted, followed by the calculation of the integral of
this analytical expression. This method is based on techniques widely used for analyzing
experimental data in terms of particle size distribution or size frequency data (MacDonald
and Pitcher 1979). The representative function, g(x), of the experimental data is chosen as:
-89- -

( ) ( ) ( ) ( ) ( )1 1 2 2 i i N Ng x p f x p f x ... p f x ... p f x= + + + + , (5-1)
where fi(x) represents the probability density function for the mode i, N is the number of
modes (curves), and pi is the weighting term relative to the proportion of each mode. In this
study, the function fi(x) is chosen as the normal distribution function expressed as:
( )
−−
==2
2
2
21),,( i
x
iiii exf σ
µ
πσσµ . (5-2)
The general expression of the function g can be written in the form:
( )( )
∑=
−−
=N
i
x
i
iiii
i
i
eppxg1
2 2
2
2,,, σ
µ
πσσµ , (5-3)
where N represents the number of modes, , ip iµ and iσ represent the proportion (mass), the
average, and the standard deviation of each mode i, respectively.
These parameters are then fitted by using a numerical optimization technique. For M
experimental data points, the squared error between the experimental, y, and theoretical, g,
distributions is defined by:
( ) ( )(∑=
−=M
jjj xgxyph
1
2),,( σµ ) , (5-4)
where M is the number of observations or data points, and j is a counter. This expression is
then minimized with respect to µi and σi using the numerical Newton’s algorithm.
For each plot analyzed, the number of modes has been fixed at N = 5 (5×3 = 15 parameters to
fit). When N is very large and equal to the number of particles, then each fi is a fit to the
proportion of the ith particle. Such a fit would require a large amount of computation. For
N=1, the process fits a single normal curve to the full set of data. We are interested in
-90- -

changes in the distribution of a particle size, and need to select N to provide a sufficient
number of ‘normal modes’, so that changes can be assessed. The choice of the value of N is
a balance between computational burden (N large), and adequate representation of changes in
the distribution. The analytical function g is then integrated using standard computation
software (MATLAB 5.3.1, integral toolbox). Let Ib and Ia be the respective integrals (areas
under curve) of g, estimated ‘before’ and ‘after’ the mixing process on a defined interval of
particle sizes. The change of the particle size distribution occurring in the process can be
easily quantified by calculating the differences Ib – Ia.
The results can be interpreted in terms of intervals in the particle size distribution. The
intervals were set by visually identifying the areas of the plots that appeared to increase or
decrease due to thermal shock. Therefore a gain in the area under the curve (a negative Ib –
Ia), for a given particle size range, would represent a net gain in the percentage volume of
that particle class, related to the original volume, due to thermal shock. Figure 5-2 shows the
graphs derived using the optimization technique on the data from Experiment 3. This figure
shows the normal modes fi, i = 1, 2, 3, 4, 5, as well as the corresponding function g
(Whitcombe et al. 2003d). As the fit using the normal distribution is good, we can assume
that the data is normally distributed and that the original selection of the normal curves was
appropriate.
-91- -

Figure 5-2: Example of the optimization techniques used to derive the integrals for all
experiments. Figure ‘a’ shows the development of the curve for Experiment 3, using the 5
modes with Figure ‘b’ illustrating the splitting up of the curves into intervals for area
comparison. Note that pi = 1, i = 1, 2…5.
To check that the integral approximations outlined above were accurate, standard paired t-
tests were preformed on selected particle sizes (Byrkit 1987). Particle sizes were chosen
from each size range obtained from the integrals and were tested at a 95% confidence level.
5.4 Results and Discussion
Figure 5-3 shows the original PSD of the 4 types of catalyst used in the experiments as
obtained from the Mastersizer. Standard deviations points are included in the plot. It can be
seen in Figure 5-3 that the e-cat has a narrower distribution and the fresh catalyst has a
broader distribution, both in their natural and sieved forms.
-92- -

Figure 5-3: Plot of original particle size distributions for both fresh and e-cat samples
including standard deviation of measurements
The amount of material lost to the filters is given in Table 5-1.
The largest amount of material emitted during the mixing and heating experiments occurred
in Experiment 3 (fresh mixed with fresh), with the least amount occurring in Experiment 1
(Fresh mixed with nothing). There is no clear relationship between the amount of material
being emitted and the type of catalyst being mixed.
-93- -

5.4.1 Experiments 1 & 2
Results of the integrals and paired t-tests comparing the ‘before’ and ‘after’ particle size
distributions for all experiments are presented in Table 5-2.
Table 5-2: The change in the ‘before’ (Ib) and ‘after’ (Ia) particle size distribution curves for
each experiment including paired t-test significance for specific sized particles within the
range of integration.
Experiment Size Range Ib-Ia % Change Particle Size (µm)
95% Confident
0 - 104 -33.4 5 13 Yes 1 104 - 500 103.3 12 280 Yes
0 - 92 104 20 20 Yes 92-206 -232 25 60 Yes
206-266 0 0 112 Yes
2
266 - 500 12 200 280 No 0 - 206 -57 49 96 Yes 3
206 - 500 67 44 280 No 0 - 124 26 3 82 No
124-152 0 0 177 No 4
152 - 500 -62 25 240 No 0 - 108 24` 3 70 Yes
108-206 47 16 152 Yes 5
206 - 500 0 0 240 No 0 - 100 56 10 44 Yes
100 - 280 -193 22 177 Yes 6
280 - 500 23 85 326 No 0 - 130 49 7 70 No
130 - 296 -109 8 240 Yes 7
296 - 500 26 37 326 No 0 - 130 -51 5 96 Yes 8
130 - 500 161 17 206 Yes 0 - 130 84 26 96 Yes
130 - 196 -349 30 150 Yes 9
196 - 500 432 34 280 Yes
The distributions of the fresh catalyst and e-cat samples including standard deviations for
‘before’ and ‘after’ heating are given in Figure 5-4 and 5-5 respectively.
-94- -

Figure 5-4: Graph of the particle size distribution for fresh catalyst before and after heating,
including all standard deviations (Experiment 1).
Figure 5-5: Graph of the particle size distribution for e-cat catalyst before and after heating,
including all standard deviations (Experiment 2).
-95- -

The fresh catalyst sample shows a shift toward small particle sizes in its particle size
distribution due to the heating process. Overall, approximately 12% of the area under the
curve between 104-500µm was lost due to heating.
These integral values are supported by the paired t-test results in Table 5-2, showing a
statistically significant change in the mass concentration of 13µm and 280µm sized particles.
As the fresh catalyst used in these experiments was uncalcinated, the shift in the particle size
distribution can be attributed to the catalyst particles fracturing due to thermal stresses. This
indicates that there are uncompensated mechanical forces present in fresh FCC catalyst,
which is responsible for catalyst particle fracture upon heating (Barsukov et al. 1998;
Whitcombe et al. 2003d).
E-cat on the other hand, shows a shift to larger particles sizes in its particle size distribution
during the heating process (Figure 5-5). There was a 25% and 200% increase in area under
the particle size distribution curve for the 92-206µm and > 266µm size ranges, respectively.
Although the integral values seem significant, the change in the > 266µm size range was not
statistically different using a paired t-test at 95% confidence. One possible explanation for
the discrepancy between the integral and statistical results is the low concentration of
particles found in this larger size range. In some sample runs, no particles were found in this
size range, reducing the accuracy of both the paired t-tests and integral approximations.
This suggests that heating e-cat actually promotes agglomeration, again supporting the results
of Basukov et al (1998) that sintering will cause an increase in the average particle size of
FCC catalyst. Interestingly, although both the fresh and e-cat samples were heated, only the
e-cat underwent agglomeration. The results presented by Barsukov et al (1998) made no
distinction between e-cat and fresh catalyst in terms of agglomeration potential due to
sintering. As only e-cat underwent agglomeration due to heating in the above experiments, it
appears that the e-cat structure or surface is more prone to agglomeration due to sintering
than the surface of fresh catalyst.
One possible reason for the agglomeration in the e-cat is the presence of a metal rich outer
skin on a catalyst particle which provides a ‘sticky’ surface for particles to adhere to under
high temperatures. Besides the deposition of coke onto the catalyst particle during the oil
-96- -

cracking process, a number of impurities such as metal compounds are also deposited onto
the catalyst surface. The agglomeration evident in the e-cat sample is likely to be caused by
an increase in particle ‘stickiness’ caused by an increase in temperature. Although 600°C is
below the melting temperature of most of the elementary forms of commonly found
contaminants on catalysts (eg iron, nickel, vanadium), 600°C is above the melting point of
elementary sodium and close to the melting point of oxides such as vanadium pentoxide, also
found on the surface of catalyst particles (Nielsen and Doolin 1993; Shackelford 1996;
Tangstad et al. 1997). Experiments conducted on copper shots have shown that particle
agglomeration, due to the sintering of copper, occurs well below the actual melting point of
the metal (Kunii and Levenspiel 1991). As only the e-cat sample showed an increase in
agglomeration, it is likely that the heating process causes the surface of the e-cat particle to
become sticky either by the complete or partial melting of some contaminant metals on the
surfaces of particles. Particles that are in contact at a higher temperature will then be fixed
together as the contaminant metals harden during cooling of the catalyst.
Obviously, in an operating FCCU the turbulent condition inside the regenerator would limit
the amount of agglomeration occurring at high temperatures. However under stationary
conditions, e-cat should experience significant agglomeration at high temperatures. The
change in the 92-206µm particle size range supports the assumption that heating e-cat in a
stationary position actually promotes agglomeration. As the PSD of the e-cat sample from a
FCCU (Figure 5-3) was much narrower, it is likely that the agglomeration experienced during
the heating of the e-cat is mild enough to be broken whilst inside a fluidized bed. If the
agglomeration seen in the heated e-cat was strong, then the e-cat PSD obtained from a FCCU
would be skewed to the larger particle sizes; this is not the case.
5.4.2 Mixing Tests
For the mixing tests all attrition sources were minimized during the experiment so that only
particle fragmentations are considered. To ensure that the mild mixing of samples did not
produce attrition, additional fresh catalyst samples were mixed for 30 seconds using the same
glass rod. Particle size distributions were taken before and after mixing with no change in
distributions observed, when considering experimental error, refer to Figure 5-6 for results.
-97- -

Figure 5-6: Influence of mixing on particle size for fresh catalyst
5.4.2.1 Total distributions
The results of the four experiments using the unsieved catalyst samples (Experiments 3, 4, 5
& 6) can be seen in Figure 5-7, 5-8, 5-9 and 5-10, respectively. Experiments 3, 5 and 6
showed a decrease in the mass of larger particles present in the sample (greater than
approximately 250µm). Experiment 4 however, showed a slight increase in the mass of larger
particles present when the before and after distributions are compared.
-98- -

Figure 5-7: The before and after PSD for Experiment 3 (hot fresh mixed with cold fresh),
including standard deviations.
Figure 5-8: The before and after PSD for Experiment 4 (hot e-cat mixed with cold e-cat),
including standard deviations.
-99- -
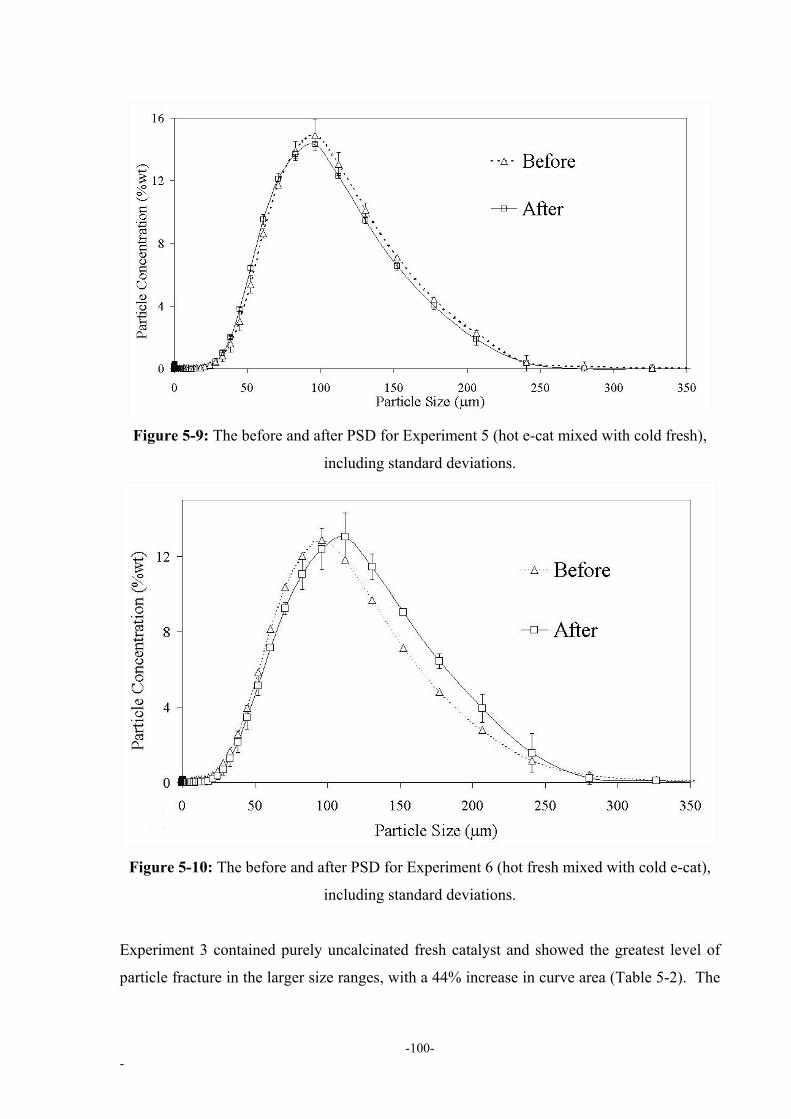
Figure 5-9: The before and after PSD for Experiment 5 (hot e-cat mixed with cold fresh),
including standard deviations.
Figure 5-10: The before and after PSD for Experiment 6 (hot fresh mixed with cold e-cat),
including standard deviations.
Experiment 3 contained purely uncalcinated fresh catalyst and showed the greatest level of
particle fracture in the larger size ranges, with a 44% increase in curve area (Table 5-2). The
-100- -

loss of particles in the greater than 200µm range was accompanied by an increase in the
100µm range, indicating that the larger particles are fracturing into several mid sized particles
(Figure 5-7). Experiment 4 only experienced agglomeration, with an increase in the amount
of larger particles with a loss in the smaller size fractions (Figure 5-9.). This is not to say that
Experiment 4 did not undergo agglomeration, it is likely that the sticky nature of the heated e-
cat caused any formed particles to be re-agglomerated, therefore increasing the particle size
distribution.
Experiment 5 showed an overall decrease in the size of the particles present with a general
shift in the size distribution. Experiment 6 also showed a reduction in the very large size
fractions (greater than 280µm), but this was accompanied by a loss in the 0-100µm size range
and a large gain in the 100-280µm size fraction (Figure 5-10). As both samples contained
fresh and e-cat samples (but in different proportions) the variation in the amount of fracture
and agglomeration is likely due to the quantities of each catalyst type used in the
experiments.
It is evident from the differences in Experiments 5 and 6 that the quantity of fresh catalyst
controls the level of particle fracture experienced due to thermal shock. Experiment 6 (70%
fresh catalyst) had larger amounts of particle fracture compared to Experiment 5 (30% fresh
catalyst). Further the increased quantities of e-cat in Experiment 6 lead to an 85% increase
in the area under the curve for the 280-500µm, while Experiment 5 only had a modest 16%
increase in area for a similar particle size range (Table 5-2).
5.4.2.2 Coarse Size Fractions
The change in the size distribution for the coarse e-cat and coarse fresh catalyst particles in
experiments 7, 8 and 9 are given Figure 5-11, 5-12 and 5-13, respectively.
-101- -

Figure 5-11: The before and after PSD for Experiment 7 (hot coarse e-cat mixed with cold
coarse fresh), including standard deviations.
Figure 5-12: The before and after PSD for Experiment 8 (hot coarse e-cat mixed with cold
coarse e-cat), including standard deviations.
-102- -

Figure 5-13: The before and after PSD for Experiment 9 (hot coarse fresh mixed with cold
coarse fresh), including standard deviations.
Experiment 7 showed a loss in particles greater than 296µm (37% of area under curve) in size
and smaller than 130µm (7% of area), with a gain in all other size ranges (Figure 5-11).
Experiment 8 showed a more even change in its particle distribution with a loss in the 130-
500µm size range and subsequent gains in the lower size ranges (Figure 5-12). Experiment 9
showed the largest amount of change in its particle size distribution with a loss of particles
greater than 196µm (34% of area) and smaller than 130µm (26% of area) (Figure 5-13).
Experiment 9, consisting of only fresh coarse catalyst, showed the greatest evidence of
particle fracture, with a large decrease in the mass of particles greater than 200µm in size. In
addition to the loss of larger particles, there is a sharp increase in the mass of particles in the
100 -200µm size range, indicating that the larger particles are fracturing into several medium
size particles with the possible generation of fine particles.
When only coarse e-cat (Experiment 8) is mixed, a reduction in its particle size distribution is
also evident, although it was more evenly spread across a wide particle size range. This
indicates that coarse e-cat also undergoes particle fracture due to thermal shock but that this
-103- -

process is less severe, when compared with fresh coarse catalyst. When both coarse catalyst
types are mixed (Experiment 7) the change in the particle size distribution appears to be a
combination of the other two Experiments (8 & 9). The very large particles fracture with the
rest of the particle size distribution altering slightly, indicating that some agglomeration is
also occurring.
It is evident that in the case of larger coarse catalyst particles, both calcinated and un-
calcinated catalyst will undergo some form of particle fracture generating medium sized (75-
200µm) particles and possible fines. As this process occurs, the e-cat particles may re-
agglomerate, further increasing the quantity of medium sized catalyst particles in a FCCU.
The particle fracture shown in these results proves that e-cat does fracture due to thermal
shock (Whitcombe et al. 2003d). It is likely that the agglomeration shown in Figure 5-11 is
caused after the particles have fractured. The heating results for the e-cat experiment (Figure
5-5) shows just how much e-cat is likely to agglomerate when heated. The finer particles
contained within the pure e-cat sample would be agglomerated onto larger cracked or split
particles, producing a net gain in particle size. As an operational fluidized bed has increased
turbulence and particle interactions, this agglomeration is likely to be overcome, causing the
fine particles to be released in the atmosphere.
5.4.3 Filter Tests
The filter tests were used to determine the amount of material emitted during the
experiments. The experiments are ranked by the percentage weight of sample lost to the
filters, and this ranking is given in the last column of Table 5-1; ranking 1 means highest
emitter. The largest amount of material emitted during the mixing experiments was obtained
from Experiment 3 (Fresh mixed with Fresh), with the least amount obtained in Experiment 1
(Fresh mixed with nothing). With the exception of Experiment 3, experiments containing e-
cat experienced the largest loss of material onto the filters (Table 5-1). In general the
experiments conducted with no mixing (Experiment 1 & 2) had lower mass losses, with no
clear difference between the amount of material generated and whether the experiment
contained the total distributions, coarse or fine fraction of the catalyst samples.
-104- -

As the e-cat containing samples generally had the largest loss of material in the mixing
experiments, it appears that e-cat is more likely to produce fine particles and aerosols than
fresh catalyst. It is known from the literature and earlier results, that fresh catalyst undergoes
the most significant particle size distribution change due to thermal shock, explaining the
very large emissions recorded for Experiment 3. It is however, the generation of aerosols and
emitted particles from the e-cat and in particular the coarse e-cat sample (Experiment 8) that
suggests the contaminant material on the surface of the e-cat particles contributes to the
production of fine particles and aerosols due to thermal shock.
As the collection air did not pass directly through the catalyst sample any material collected
on the filter would have to be ejected from the container during the mixing process. It is
likely that as the hot catalyst is added to the cold one, any trapped air or moisture in the cold
sample would be rapidly heated, causing a short burst of air or steam to be emitted. It has
been shown in the literature that fresh FCC catalyst can absorb up to 50% of its own weight
in moisture before altering its fluidizing characteristics (Davidson et al. 2001). This ability to
absorb moisture implies that even seemingly dry fresh catalyst could contain high levels of
ambient moisture providing a possible cause of the rapid bubbling and particle ejection seen
during the experiments. It is possible that the rapid heating of trapped moisture is another
cause of thermal fracture and particle ejection for fresh catalyst. However, as e-cat is likely
to have a metal layer deposited onto its surface, it is unlikely that humidity variations would
be an important factor in e-cat particle fracture.
The experiments which had no cold catalyst added (1 & 2) experienced low emissions levels,
supporting the theory that the air or moisture trapped inside the cold sample is the source of
the particles being ejected from the container. This rapid bubbling and ejection of fine
particles through the addition of cold catalyst is likely to occur inside an operating FCCU,
with generated particles being carried up from the catalyst bed due to the gas stream inside
the system. As cold catalyst is fed into the hot system with no pretreatment or preheating,
some amount of fine aerosol particles will be produced.
Terminal velocity calculations using Stokes equation, with an average air temperature taken
as 150˚C and a gas velocity of 0.08m/s were calculated for the experimental system. It was
determined that any particle larger than 48µm would be unable to reach the filters. It is more
-105- -

than likely that the actual size of particle able to reach the filters would be much less than this
theoretical figure. A cut off size of 48µm particles would allow any original catalyst present
in the sample under this size to be directly ejected during the mixing process. However, the
concentration of sub 38µm particles in the other catalyst samples were very low (especially in
the coarse size fractions), the majority of the particles collected on the filter must have been
generated due to thermal shock. For example, Experiment 8 produced a loss of 0.09%wt to
the filter although the catalyst used for that experiment had only approximately 0.05%wt
under 38µm in the original sample. It is possible that the source of fine particles being
emitted are those already present in the catalyst sample. Fines can be agglomerated, by Van
der Waal forces, onto the surface of larger particles, even after sieving. These particles may
be removed through the interactions between hot and cold catalyst, causing the emissions.
However, it is unlikely that the original concentration of fine particles present in the catalyst
sample can completely explain the rate of particle and aerosol production due to thermal
shock (Whitcombe et al. 2002b; Whitcombe et al. 2003c).
5.4.3.1 SEM Images
The SEM images taken of the two representative filters, one used in an experiment with
purely e-cat (Experiment 8) and the other purely fresh catalyst (Experiment 3) are given in
Figure 5-14 and 5-16. From these images, it is clear that the different catalyst samples
ejected different materials.
-106- -

Figure 5-14: Back Scattering SEM Images of the collection filter used with only fresh
catalyst (Experiment 3), with an image scale of 100µm.
-107- -

Figure 5-15: Back Scattering SEM Images of the collection filter used with only coarse e-
cat catalyst (Experiment 8), with an image scale of 100µm.
The filter obtained from the Experiment 3 (Figure 5-14) has a low number of particles, with
the material collected consisting of reasonably large particles. The majority of the particles
are in the 20- 40µm size with minimal fines being visible, although the original catalyst was
unsieved and contained higher concentrations of fine particles. The smaller particles are
more spread out over the filter. The size of the particles collected on this filter suggests that
the material is either directly emitted from the sample or is formed from particle fracture
mechanisms, producing larger particles with small amounts of aerosol.
The filter from the e-cat mixed with e-cat sample (Figure 5-15) had a greater amount of small
sized particles with very few large particles being present. Interestingly, Experiment 8 had
been sieved to 150µm, therefore only fines adhering to the surface of larger particles via Van
der Waals forces would have been in the original mixture of particles. As seen in the image,
-108- -

the majority of the particles collected on the filter are below 40µm in size with a large
amount of fine particles visible in the left hand side of the image. The material on this filter
suggests that particle fracture was the main source of aerosol generation, as it is unlikely that
the level of fines originally present in the sample was that significant. Also, the large amount
of material on the filter suggests that e-cat has the potential to be a major source of fine
particle (sub 20µm) production inside a FCCU.
One possible source for this particle fracture in e-cat is through the deposition of metals, such
as iron, on the surface of the particle. As metal is able to diffuse heat and expand at a greater
rate than the catalyst material (similar to clay), this differential rate of expansion would lead
to the fracturing of the particles’ surface and the production of metal rich particles.
Figure 5-16 is a higher magnification of collected particles on the filter from Experiment 3,
and illustrates the variations found in terms of size and shape of the fine particles produced
due to thermal shock.
-109- -

Figure 5-16: High magnification Backscattered image of particles collected from Experiment
3 at 4000x magnification (scale on image is 1.0µm).
5.4.3.2 Metal Concentrations
The average concentration of the four target metals found in the two types of catalyst used in
these experiments and obtained from atomic absorbance are given in Figure 5-17. It is clear
that the e-cat sample has led to significantly higher concentrations of metals compared with
that obtained from fresh catalyst.
-110- -

Figure 5-17: Average concentrations of metals found in catalyst samples, including standard
deviations.
Average levels of metals found on the filters used during the mixing experiments are given in
Figure 5-18, 5-19, 5-20 and 5-21. Note the different scales used to represent the concentration
as % of wt, for each metal. As expected, iron is the most prevalent metal in the filters,
followed by vanadium and nickel, with molybdenum found only in filters obtained from
Samples 8 and 3. Overall Sample 8 had the greatest concentration of contaminant metals
collected on the filters.
-111- -

Figure 5-18: Average percentage concentration of Nickel found on the filters used to collect
aerosol emissions during the mixing experiments.
Figure 5-19: Average percentage concentration of Iron found on the filters used to collect
aerosol emissions during the mixing experiments.
-112- -

Figure 5-20: Average percentage concentration of Vanadium found on the filters used to
collect aerosol emissions during the mixing experiments.
Figure 5-21: Average percentage concentration of Molybdenum found on the filters used to
collect aerosol emissions during the mixing experiments.
-113- -

The rank order of the concentrations of each contaminant metal for each sample is given in
Table 5-3. Samples containing e-cat generated the largest amounts of contaminant metals on
the filters.
Table 5-3: Rank order of metal concentrations obtained from the filters
Rank order
Exp Type Exp. Ni Fe V Mo
1* 8 8 6 - No Mixing 2** 9 3 3 -
3* 6 9 8 2
4** 1 2 7 -
5 4 6 9 -
Total
Distributions 6 7 5 4 -
7 5 7 5 -
8** 2 1 1 1
Coarse Fraction
9* 3 4 2 -
*Fresh catalyst only **E-cat only
The fact that e-cat is the primary source of contaminant metals and that these metals are
found in samples where e-cat is either hot or cold, suggests that particle fracture occurs
within both the hot and cold particles. One possible reason for this is that when the cold
particle contacts the hot one, the hot particle experiences localised and rapid cooling, causing
contraction of the particle surface. As the surface contracts rapidly, it may exfoliate, causing
the surface layer to break apart, generating fine particles. It is envisaged that the rapid
contraction is more likely to produce smaller sized particles, ie surface chips, rather than
larger particles.
While contraction is occurring in the hot particle, the rapid localised heating of the cold
particle would cause particle expansion to occur. In addition to exfoliation, this expansion
may also result in the release of the uncompensated mechanical stresses mentioned earlier,
causing particles to split into large chunks. Uneven expansion of the particle could also
generate internal forces, de-stabilising the catalyst particle. It is likely that this expansion
would cause the particle to fracture, producing both small and large particles. Some of these
-114- -

particles would be released into the atmosphere whilst others would be re-agglomerated
together, re-forming large particles. It is also possible that the localized heating of the cold
particle will cause metals on the surface of the particle to vaporize forming tiny airborne
particles.
Iron is the most accumulated metal on the filters, with all filters having levels of iron greater
than what was found in the original e-cat sample. As iron is deposited on the outside of the
catalyst particle, the fact that most filters contained significantly higher amounts of iron than
seen in the e-cat, suggests that a thin layer of the particle’s surface of is removed during the
mixing process.
The level of iron indicates that mainly the surface chips reach the filters. There is a reduced
accumulation of vanadium and nickel in the filters. These metals are usually deposited
deeper inside the catalyst particle. This supports the theory of exfoliation as the predominant
outcome of thermal fracture in e-cat, with complete fracture occurring to a lesser degree. In
addition to the changes in the particle size distributions during the experiments there was a
visible ‘bubbling’ and release of gas in all experiments, immediately after the mixing process.
5.5 General Discussion
Results indicate that there is a sudden reduction in particle size distribution induced by
mixing catalyst particles at various temperatures. In general, samples containing fresh
catalyst are most severely affected, although e-cat samples also undergo particle fracture
(Whitcombe et al. 2002b; Whitcombe et al. 2003c; Whitcombe et al. 2003d). As seen from
the heating results, samples containing e-cat do fracture, although some re-agglomeration
occurs. The extent of agglomeration may be related to the experimental design which does
not allow the samples to be fluidized when mixed, thus allowing mild agglomerates to form.
If the experimental system was fluidized, as seen in an operating FCCU, the agglomeration of
the e-cat is likely to be less, thus leading to greater e-cat fracture.
When particle size changes occur in the e-cat samples, this change is less extreme, with a
more even change occurring across the entire size range. Fresh catalyst on the other hand,
experiences a dramatic loss of larger particles, generating a gain in the mid sized particle
ranges (75-200µm). Interestingly, both types of catalyst (e-cat and fresh) appear to have a
-115- -

‘natural grain size’ of around 70 - 120µm. Particles larger than this size undergo thermal
fracture whilst smaller particles tend to re-agglomerate together. This suggests that the
catalyst particle is most stable within this size range.
The fracture of the fresh catalyst maybe due to the same “uncompensated mechanical forces”
described by Barsukov et al (1998). The fracture of the e-cat may also be due to remnant
uncompensated forces, but it is likely that the majority of such stresses would already have
been dissipated during the catalyst’s time in the fluidized bed. In addition to these forces,
impurities, both within and on the e-cat particle could induce stress-strain relationships which
cause the particle, when heated or cooled, to undergo fracture. The concentration of
contaminant metals, and in particular iron, released during the mixing process supports the
belief that the surface of the e-cat is removed during particle fracture/ exfoliation.
It appears that there are two different processes at work to generate aerosol particles due to
thermal fracture in FCC catalyst. Fresh catalyst appears to generate larger sized chips,
presumably from the fracture of fresh catalyst particles. E-cat on the other hand appears to
produce large quantities of metal rich aerosols. This production of aerosols is likely to be
caused by the combination of several processes. Firstly, the outer surface of the e-cat particle
(metal rich) is likely to expand rapidly when heated, cracking the surface of the particle and
preferentially removing this layer. This causes metal rich aerosols to be produced through
mechanical stresses or through rapid heating of trapped moisture inside the catalyst particle.
The second process would be the sudden vaporization of contaminant metals found on the
cold e-cat particle. This vapor once removed from the particle surface would condense and
be collected on the filter. Finally, any fine particle adhered to the surface of the catalyst
would be ejected due to the rapid expansion of the air trapped in the cold sample.
These results have significant implications for FCCUs, as any addition of low temperature
catalyst into a hot system will lead to a sudden reduction in the particle size distribution of
the system. This will consequently lead to increased particle emissions from the unit as well
as a need for additional catalyst to be added. Of even greater concern is that when fresh
active catalyst is added to an operating FCCU, it will undergo the most dramatic changes in
its particle size distribution, causing it to be rapidly lost from the unit, reducing the overall
-116- -

activity of the system. In situations such as FCCU start up, where the addition of large
quantities of cold e-cat is required, greater particle fracture and catalyst loss will still occur.
5.6 Conclusions
Significant information on how thermal mechanisms inside a FCCU impacts on the
generation of fine particles and aerosols has been obtained. During mixing of hot and cold
FCC catalyst, as experienced in an operating FCCU, fine particles are formed. During this
mixing, fresh catalyst particles fracture, producing larger sized fragments and some aerosols,
while e-cat particles can produce significant amounts of aerosol particles, probably through
exfoliation. Both fresh and e-cat emit material which is higher in metals than expected. This
work supports the theory that fresh catalyst fractures completely due to thermal shock while
e-cat under goes a less dramatic change, producing large quantities of metal rich fine
particles. Therefore, regardless of catalyst type (calcinated or uncalcinated), when cold
catalyst particles are mixed with catalyst at a significantly higher temperature, fracturing of
the larger particles occurs.
As the experiments were conducted in a laboratory setting it can be assumed that the level of
particle generation due to particle fracture is a conservative estimate of the true nature of
particle loss which occurs in an operating FCCU. Under operating conditions in an industrial
regenerator, fine particle generation due to thermal fracture is likely to be a major source of
particle emissions into the atmosphere. As particle mixing is greatest under startup
conditions it is likely that this particle fracture is the predominate source of the fine, metal
rich particles observed during the stack tests outlined in Chapter 4.
There are several other secondary conclusions, not directly related to air emissions which can
be obtained from this work. Obviously current attrition tests would not be able to accurately
predict catalyst attrition inside an operational FCCU, as thermal fracture is not included in the
standard attrition tests. It is probable that various catalyst types have different propensities to
fracture under thermal conditions, something that refineries are not likely to know prior to
selecting a catalyst for use in their FCCU. More work should be carried out to provide better
assessment of the true degree of particle attrition for various catalyst types.
-117- -

Finally, this work has shown that the conventional belief that pre-treatments, such as
calcination, are able to increase the strength of catalyst is not fully supported. Only a certain
level of added strength is provided by calcinations, as e-cat still fractures under thermal
shock. Obviously calcinated catalyst is a better option for the reduction of air emissions
during a start up, although it does not completely solve the problem of excessive particle
emissions.
-118- -

6 Particle Investigation Previous experimental work has indicated that metal contaminants found on e-cat could have
an impact on start up emissions. The review of the literature has also indicated possible de-
activation mechanisms which occur due to preferential deposits of metals onto and into
catalyst particles. The literature is not clear whether the degree of metal contamination found
in laboratory assessments of catalyst is the same as seen in an operating refinery. To
understand the relationship between metal contamination and air emissions, a series of
investigations were conducted on fresh and e-cat particles. It is not the aim to provide a
detailed review of catalyst deactivation, only to identify the level of metal deposition onto the
surface of catalyst and if this material is a possible source of particle emissions.
Additionally this work has boarder implications for refineries in terms of catalyst deactivation
and management issues which are beyond the scope of this thesis.
6.1 SEM Procedure
To identify the degree of metal contamination present in e-cat, catalyst samples were taken
and examined using a Scanning Electron Microscope (SEM) with a Silicon Lithium X-ray
Detector (refer to Chapter 3). The SEM provides detailed images of the surface features of
the catalyst particles, whilst the X-ray detector allows the elementary composition of the
material to be determined.
In addition to the standard SEM images, catalyst samples were embedded in resin and
polished to expose the center of the particle, providing a cross sectional view of the particle.
Using the Moran Scientific PC microanalysis system, the cross section of each catalyst
particle was mapped, allowing a detailed examination of the inside of the catalyst particle to
be obtained. The particle map, provides relative concentrations of contaminant metals
throughout the catalyst particle.
6.2 Results & Discussion SEM
SEM backscattered images of the surfaces of a fresh and e-cat particle are given in Figure
6-1.
-119- -
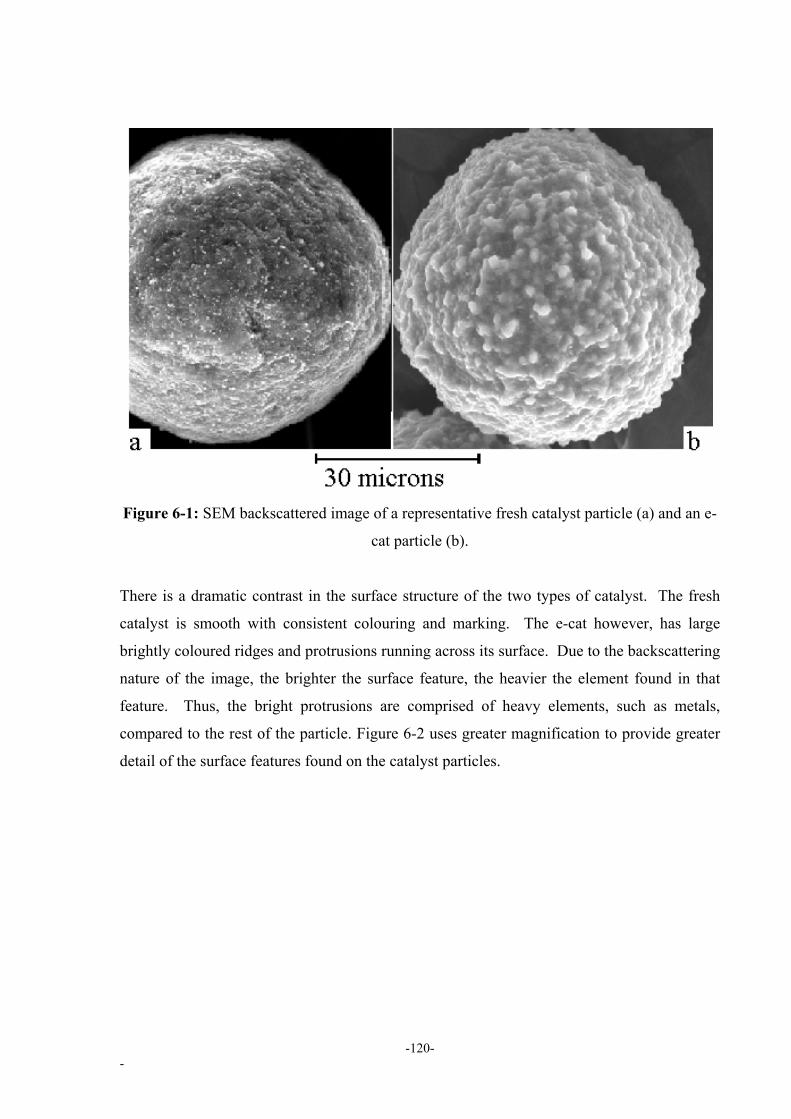
Figure 6-1: SEM backscattered image of a representative fresh catalyst particle (a) and an e-
cat particle (b).
There is a dramatic contrast in the surface structure of the two types of catalyst. The fresh
catalyst is smooth with consistent colouring and marking. The e-cat however, has large
brightly coloured ridges and protrusions running across its surface. Due to the backscattering
nature of the image, the brighter the surface feature, the heavier the element found in that
feature. Thus, the bright protrusions are comprised of heavy elements, such as metals,
compared to the rest of the particle. Figure 6-2 uses greater magnification to provide greater
detail of the surface features found on the catalyst particles.
-120- -

Figure 6-2: Magnified SEM image of the fresh (a) and e-cat (b) particle surfaces, with a
scale of 1µm.
To directly compare the composition of the surface features of the e-cat and fresh catalyst
particles, X-ray analysis was conducted to determine the approximate composition of selected
elemental metals, with the average results presented in Table 6-1. Presented results were
obtained from averaging the results obtained from 2 sets of catalyst samples.
-121- -

Table 6-1: Occurrence of Metals found on the surface of fresh catalyst as well as the surface
ridges and gullies of e-cat, including standard deviations.
Fresh cat E-cat Ridges E-cat Gullies
Element Weight % Weight % Weight %
Na 0.11 ±0.16 0.05 ±0.08 0.10 ±0.11
Al 27.07 ±1.86 16.13 ±2.47 24.81 ±3.93
Si 20.45 ±1.52 29.02 ±2.00 22.11 ±3.17
Ca 0.04 ±0.02 0.30 ±0.14 0.40 ±0.16
Ti 0.37 ±0.44 0.34 ±0.06 0.41 ±0.04
V 0.01 ±0.02 0.03 ±0.04 0.05 ±0.01
Fe 0.17 ±0.15 3.15 ±0.60 1.27 ±0.42
Ni 0.00 ±0.00 0.20 ±0.07 0.20 ±0.06
La 2.03 ±0.26 1.08 ±0.23 1.69 ±0.04
Cu 0.16 ±0.14 0.21 ±0.02 0.17 ±0.01
Mo 1.00 ±0.11 0.37 ±0.13 0.15 ±0.13
Cr 0.00 ±0.00 0.00 ±0.00 0.03 ±0.06
Mn 0.00 ±0.00 0.00 ±0.00 0.04 ±0.06
O 48.63 ±0.29 49.18 ±0.14 48.62 ±0.25
The approximate elementary composition found in the catalyst samples varied according to
the area that was tested. The surface of the fresh catalyst had very little variation over its
surface, as evident in Figure 6-1. The composition of the e-cat particle varied considerably
with significant variations in terms of the material found on the protruding ridges and the
material found between these protrusions. The protruding ridges found on the e-cat contained
high levels of silicon, iron, molybdenum and copper, with less aluminium, titanium and
calcium than the gullies or low points between the ridges. The gullies on the e-cat surface
appeared to have less contaminants compared with the surface ridges, and concentrations of
aluminium and silicon closer to that of fresh catalyst. Interestingly, the fresh catalyst
contained the highest concentrations of aluminium and molybdenum on its surface,
suggesting that in e-cat these metals are covered over by deposits of other metals, such as
iron.
-122- -

As discussed earlier, cross sections of catalyst particles were produced for each catalyst
sample and then X-ray mapped to provide details on the location of metal deposition
throughout the particle. Key elements (Al , Si, Ca, Ni, Fe, Na, Ti and V) were selected and
their locations identified on individual images. Refer to Figure 6-3 for the SEM image and
Figure 6-4 for the individual elemental images produced from mapping the fresh catalyst
particle. Similarly, Figure 6-5 and 6-6 represent the SEM image and elemental images for
the e-cat particle, respectively.
Figure 6-3 SEM backscattered image of the cross section of a fresh catalyst particle.
-123- -

Figure 6-4: Individual elemental image taken of the cross section of the fresh catalyst
showing the concentration of 8 elements. The intensity or brightness of the image relates to
the concentration present.
The fresh catalyst appears to be uniform in its composition, as seen in Figure 6-3 and 6-4.
Low levels of contaminant metals, such as iron and sodium are distributed throughout the
particle. These low levels of contamination are generated during the manufacturing process
and have little impact on the activity of the catalyst. Some of the other rare earth metals
(such as lanthanum, which is not shown) are added to the catalyst to improve activity,
although the exact composition and elements added are confidential.
-124- -
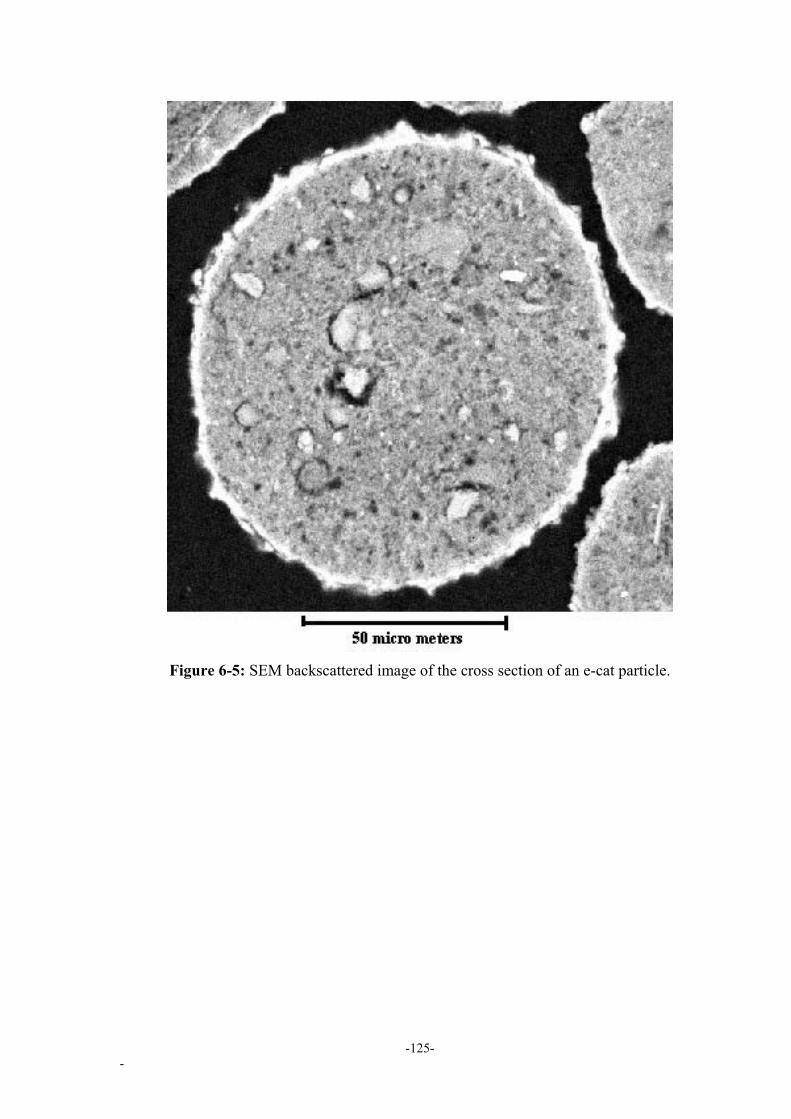
Figure 6-5: SEM backscattered image of the cross section of an e-cat particle.
-125- -

Figure 6-6: Individual image taken of the cross section of an e-cat particle showing the
concentration of eight elements. The intensity or brightness of the image relates to the
concentration present.
From Figure 6-5 the e-cat particle varies considerably to that of the fresh particle, with
greater levels of metals being found in the e-cat. There is a very bright, metal rich outer
coating surrounding the entire e-cat particle. This coating, several microns in thickness
exhibits a very uneven texture, with the ridges and protrusions clearly visible. This outer
coating of the catalyst appears to contain mainly iron, calcium and silicon, producing a thick
halo surrounding the entire surface of the particle. Other metals such as vanadium, nickel
and sodium are more evenly distributed throughout the particle. Of interest is the fact that the
silicon appears to have been either drawn out of the catalyst matrix or been deposited out
from the oil, forming a coating on the outside of the particle. Figure 6-6 also shows sections
of other particles, visible in the top and bottom right hand corners of the individual images.
These part particles also exhibit the same pattern of metal deposition visible on the large
centred particle.
Overall the brightness of the sodium, nickel and vanadium in the fresh and e-cat particles are
similar. Also, the iron brightness on the inside of the e-cat particle is very similar to that of
fresh catalyst, showing that iron tends to deposit on the outside of the particle. Although not
widely spread throughout the particle, the increase in the brightness of the titanium in Figure
6-6 indicates that it is found in highly concentrated segments within the particle. Although
-126- -

not fully understood at this time, there appears to be a very distinct migration of silicon out of
the matrix of the catalyst and towards the outer surface of the particle as the catalyst is used
in the FCCU. One possible explanation is that the silicon is chemically drawn out of the
catalyst matrix by one or a combination of the metals depositing on the surface.
Figure 6-7: SEM backscattered image of two joined e-cat.
To determine how particles agglomerate together inside the FCCU, two joined e-cat particles
were located using the SEM and mapped. The original image of the joined particles is shown
in Figure 6-7 with the individual elements of the particle map presented in Figure 6-8. From
these two images it is clear that two e-cat particles have been fused together whilst in the
FCCU. It appears that the particles were initially joined through an impact, cleaning or
displacing the material immediately surrounding the impact zone. This is evident by the
disruptions in the metal ridges along the surface of the two particles. However, the individual
elements mapped in Figure 6-8 show high levels of iron and nickel in the join. This implies
-127- -
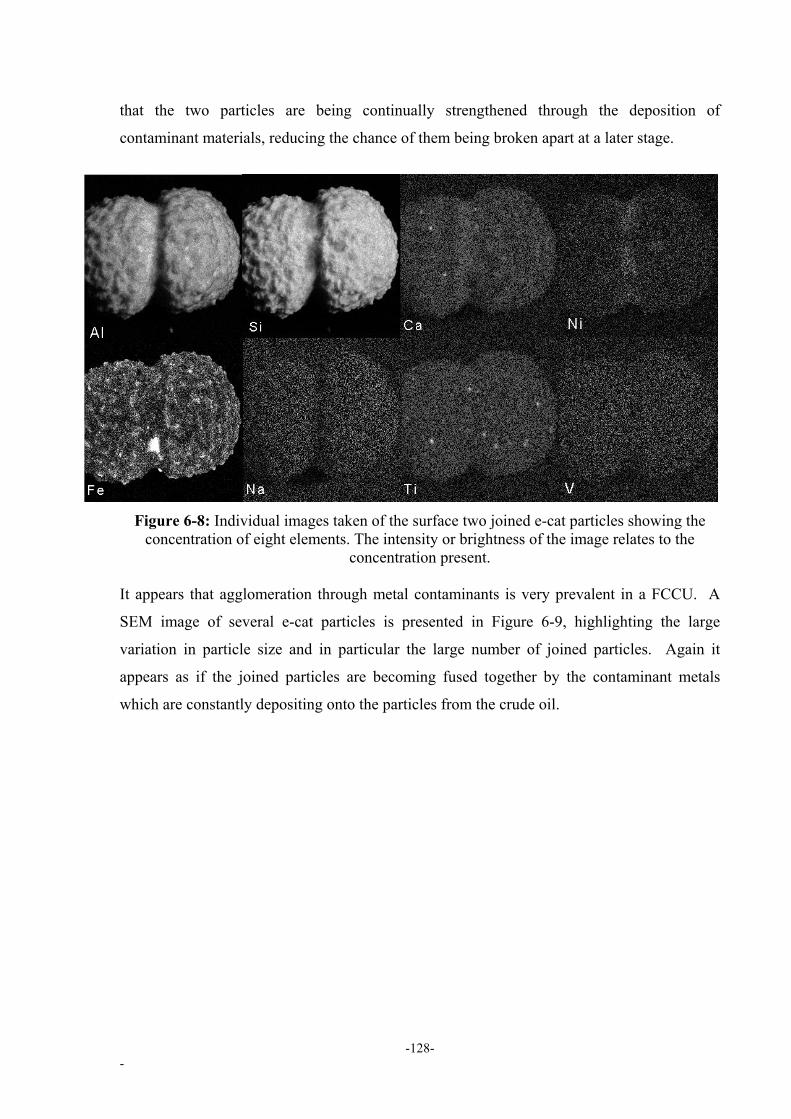
that the two particles are being continually strengthened through the deposition of
contaminant materials, reducing the chance of them being broken apart at a later stage.
Figure 6-8: Individual images taken of the surface two joined e-cat particles showing the
concentration of eight elements. The intensity or brightness of the image relates to the concentration present.
It appears that agglomeration through metal contaminants is very prevalent in a FCCU. A
SEM image of several e-cat particles is presented in Figure 6-9, highlighting the large
variation in particle size and in particular the large number of joined particles. Again it
appears as if the joined particles are becoming fused together by the contaminant metals
which are constantly depositing onto the particles from the crude oil.
-128- -

Figure 6-9: SEM backscattered image of e-cat
To better understand if the outer coating of the e-cat particle prevents further metal diffusion
inside the particle, X-ray analysis was conducted in the centre region of both the fresh and e-
cat particles. To aid in comparison between the centre regions of the two particles, the X-ray
spectra obtained by the X-ray detector are given in Figure 6-10. A circular area,
approximately 25µm in diameter from the centre of each of the fresh and e-cat particles, were
used for this analysis.
-129- -

Figure 6-10: The X-ray spectra obtained from the center of the fresh catalyst (a) and the e-cat
(b) particles. The scale provided in the top right corner reflects the total count obtained from
the X-ray detector and represents the scale of the y-axis, thus the two graphs are almost
identical in scale. The horizontal scale is the energy of the detected X-rays .
Figures 6-10‘a’ and ‘b’ appear to have similar X-ray signatures, indicating that the centre
region of both e-cat and fresh catalyst are very similar in composition. No activity tests were
-130- -

conducted to determine the activity of the centre of the e-cat particle. However, as the content
is similar to that of the fresh catalyst, the centre region should have activity levels similar to
that of fresh catalyst. Thus, as metal deactivation contributes to the pore blockade of a
catalyst particle, it seals the particle, enabling the centre to remain active, yet unused.
Figure 6-11: SEM image and X-ray spectra of the inside of a split e-cat particle.
The SEM image of a split e-cat particle showing the internal structure of the catalyst is
presented in Figure 6-11, along with the elemental analysis of the inside portion of the
-131- -

particle. Figure 6-11 further supports the theory that the inside of an e-cat particle is free of
metal contaminants. The split e-cat particle has the same visible signs of metal
contamination on its surface, however the X-ray spectra of the inside of the particle has low
levels of metals present as well as the Al/Si ratio being Al dominate, as found in fresh
catalyst.
6.3 Conclusion
This chapter has provided detailed information with regards to the location of metal deposits
in e-cat particles. It appears that metals deposit on the outside of a particle forming metal
rich ridges. This outer layer is several microns in thickness and is predominantly comprised
of iron, silicon and calcium. The formation of this metal layer promotes particle
agglomeration as the particles become fused together. The original ratio of, Si/Al appears to
change near the surface of the particle, as Si migrates to the surface. The reasons for this
migration are not clear and are beyond the scope of this project. Interestingly, the internal
composition of the e-cat is very similar to that of fresh cat, indicating a higher level of
activity than suggested by the metal content of the particle.
In terms of air emissions, these metal rich protrusions may interfere with fluidity leading to
temporary blockages during start up. In addition to changes in the particle surfaces, the metal
contaminants allow particles to be fused together, forming strong agglomerates in the
fluidized bed. It is also likely that during start up these metal ridges will be removed via
attrition, decreasing the metal concentration of the catalyst particle whilst generating the
elevated levels of metals seen in the emissions sampling results section. Further work is
needed to determine the processes involved with the migration of silicon out of the matrix
and into the surface of the e-cat as this is beyond the scope of this thesis.
-132- -

7 Fluidization Characteristics The literature review identified possible dipleg blockages as a potential cause of excessive
emissions from a FCCU. In the previous chapter, metal ridges were discovered on the
surface of e-cat, possibly altering the physical characteristics of e-cat, such as fluidity, and
leading to potential blockages. To determine how metal deposits alter the physical
characteristics of e-cat, the values of Umf, (minimum fluidization velocity) and Umb/Umf (ratio
of bubbling velocity to minimum fluidization velocity) of fresh catalyst and e-cat were
compared. Also, in order to provide details on how accurate current predictions of fluidity are
in terms of e-cat, experimental results were compared to several Umf correlations found in the
literature.
7.1 Experimental Procedures
To determine the change in fluidization properties between e-cat and fresh catalyst over time,
two e-cat samples were sourced from the operating FCCU under investigation, with samples
taken approximately 3 days apart (Sample 1 and 2 respectively). The third catalyst sample
was e-cat sourced from the refining company’s second refinery, which uses the same catalyst
type to process a different type of crude oil. The second refinery, on average had higher
levels of metal contamination (iron) in their e-cat, compared with the refinery under
investigation (Hodgson 2000). Selecting catalyst from these two refineries, ensured that the
catalysts used in this research were exposed to a variety of FCCU conditions. The fourth and
final catalyst sample was fresh catalyst of the type used at both refineries, as described in
Chapter 3.
The Umf of these different catalyst samples was calculated and compared to values
determined by experimental testing. Experimental values of Umf were determined by a
standard procedure of plotting the change in pressure against the change in velocity over
time. This plots will initially rise before level off, thus using regression techniques the
intersection between the horizontal and vertical components of the line can be determined
(Gauthier et al. 1999; Hartman et al. 2000; Reina et al. 2000; Lin et al. 2002). Plots were
done for both increasing and decreasing velocity situations (Whitcombe et al. 2002c).
-133- -

7.1.1 Fluidization tests
To ensure an appropriate comparison of the results, fluidization tests were conducted in a
80mm I.D. clear acrylic tube, 2 meters in length with the top of the tubing having a
detachable lid to provide access, refer to Figure 7-1. A stainless steel plate evenly punctured
with 1mm holes and covered with a thin layer of coarse filter fabric was used to provide an
even air distribution. The air distributor was placed 15mm from the bottom of the fluidizing
tube, and a filter box was attached downstream of the fluidizing tube to collect emitted
catalyst particles. The fluidizing media used was filtered air, at essentially atmospheric
pressure and room temperature. The flow rate was monitored and controlled by an air flow
meter attached downstream of the fluidizing tube. The pressure drop across the system was
monitored using a TSI VelociCalc Plus digital sensor with a 1 Pa resolution.
The experimental apparatus was of a similar size or slightly larger than those used previously
in the literature for Umf experiments (Lucas et al. 1986; Hartman et al. 2000; Reina et al.
2000; Matsuda et al. 2001; Rao and Bheemarasetti 2001). This ensured the accuracy of the
results.
Each catalyst sample was poured into the fluidizing tube to a height of 80mm. The
compressed air was slowly turned on, with the flow rate and velocity being continually
monitored. The flow rate was slowly increased, with pressure measurements being recorded.
Approximate values of both velocities Umf and Umb were recorded visually, with the flow rate
increased until very turbulent fluidization had been achieved. The air flow was then slowly
reduced, again with pressure and velocity data being recorded. These experimental runs were
repeated 5 times for each catalyst sample before the attrition tests were conducted. Results
were determined by the average of the increasing and decreasing velocity situation for all 5
test runs.
A controlled attrition test was conducted to determine whether fluidization characteristics
were influenced by a build up of surface contaminates. The catalyst sample was left in the
fluidizing tube and allowed to bubble gently for a period of 24 hours. The flow rate was set at
approximately Umb to ensure only bubbling attrition was present. After 24 hours the
fluidization tests, as outlined previously, were repeated. This gentle bubbling was deemed
sufficient to promote bubbling bed attrition, which is less severe than other forms of attrition
-134- -

(Wu et al. 1999). This ensures that only the surface of the catalyst particles are exposed to
attrition forces. As before samples denoted with a ‘b’ represent samples before attrition
whilst samples denoted with an ‘a’ are after attrition.
After completing the fluidization tests, samples were examined using a scanning electron
microscope with an X-ray detector, allowing the elementary compositions of the catalyst
surface to be determined. To allow catalyst samples to be compared quantitatively in terms
of metal concentration, acid digestions and an atomic absorbance spectrometer were used to
determine total metal composition.
Figure 7-1: Experimental setup for determining Umf
-135- -

7.1.2 Determination of Catalyst Physical Properties
Particle size distributions (PSD) of the catalyst samples were obtained using the procedures
outlined in Chapter 3, with an average particle size determined for each sample. Catalyst
densities were determined for each sample before and after testing. The standard cracking
end-point method of determining particle density was selected (Abrahamsen and Geldart
1980; Geldart 1986a). Although this method is not the most accurate, it does allow a
relatively quick and easy assessment of particle densities and provides sufficient accuracy; it
is also the standard test used in the oil industry.
Particle size analysis was carried out using a Mastersizer. Catalyst samples were also
inspected using a Scanning Electron Microscope (SEM) and acid digestion, refer to Chapter 3
for further detail.
FCC catalyst is usually classed as a round particle with a shape factor between 0.8 and 1,
therefore a shape factor value of 0.9 was selected for all catalyst samples. Catalyst porosity at
Umf was approximated by measuring the mass and volume of a catalyst sample after it had
been gently poured from one container into another (Hartman et al. 2000).
7.1.3 Contaminant Metal Tests – Total Levels
Iron and nickel were selected as indicator metals to identify how metal contamination
influences catalyst fluidity. These metals were selected for two main reasons: firstly, the
refinery advised that the e-cat samples should have significantly different levels of iron and
nickel and secondly, previous work has shown iron deposits on the surface of e-cat, forming
metal ridges (refer to previous Chapter).
7.2 Results
The results of the density and particle distribution tests are given in Table 7.1. All of the
catalyst samples had approximately the same particle density with Sample 1a having the
highest particle density and Sample 2a having the lowest at 1,551kg/m3 and 1,430kg/m3,
respectively.
-136- -

Table 7-1: Physical properties of the catalyst samples including standard deviations.
Catalyst Sample Particle density (kg/m3) Average diameter (µm)
1b (E-cat) 1550 ±46.5 80.39 ±1.38
1a 1551 ±46.5 82.14 ±0.69
2b (E-cat) 1480 ±44.4 80.82 ±1.52
2a 1430 ±42.9 85.77 ±1.49
3b (E-cat) 1450 ±43.5 80.38 ±1.57
3a 1460 ±43.8 82.16 ±1.79
4b (Fresh) 1460 ±43.8 72.04 ±1.93
4a 1500 ±45.0 87.57 ±2.42
All of the after attrition ‘a’ samples have the largest average particle size. This is expected,
as the attrition test is likely to cause the loss of the finer fraction of particles present in the
bed through elutriation processes. As no material was returned from the collection device to
the fluidizing tube, all particles elutriated from the bed were lost.
The fluidity of all four catalyst samples were tested before and after attrition, and plots of the
pressure drop as a function of the flow rate were drawn (Figure 7-2). Both the ‘increasing’
and ‘decreasing’ velocity situations were plotted with Umf determined from the average of
these values. All results were cross checked with visual observations and no discrepancies
were noted. As mentioned earlier the value of Umf was determined by the intersection of the
two lines formed by regression, refer to Figure 7-2 for an example. The values of Umb were
determined from direct experimental observations (Whitcombe et al. 2002c).
-137- -

Figure 7-2: Pressure drop as function of velocity showing onset of fluidization.
The experimentally determined values of Umf, Umb and Umb/Umf are given in Table 7-2.
Before the attrition test, catalyst samples had a wider range of fluidity values (Umb/Umf),
whilst after the attrition tests, values for Umb/Umf are closer together. Sample 3b had the
lowest Umb/Umf ratio, with 3a and 4a having the highest Umb/Umf, and thus, fluidity. The two
catalyst samples obtained from the same refinery, 3 days apart (1 and 2) had a 24% variation
in their respective fluidity before the attrition test, yet only a 13.5% variation after. In all of
the e-cat samples (1, 2, 3) the after attrition test, ‘a’ samples, had increase fluidity as
measured by the Umb/Umf ratio, compared with their original ‘b’ sample.
-138- -

Table 7-2: Experimental results for Umf, Umb and Umb/Umf
Sample Umf (cm/s) Umb (cm/s) Umb/ Umf
1b 0.66 ±0.05 1.25 ±0.06 1.91
1a 0.41 ±0.05 0.90 ±0.08 2.21
2b 0.51 ±0.04 1.20 ±0.03 2.37
2a 0.40 ±0.04 1.00 ±0.05 2.51
3b 0.80 ±0.05 1.40 ±0.11 1.75
3a 0.45 ±0.05 1.10 ±0.08 2.45
4b 0.53 ±0.10 1.30 ±0.08 2.45
4a 0.30 ±0.06 0.70 ±0.09 2.33
Estimations of the Umf can be calculated from a number of equations found in the literature.
These calculated values can then be compared with the experimental, using the relative error
(E) given by:
(exp)/)]((exp)[*100 mfmfmf UcalUUE −= , (7-1)
The calculated Umf was obtained using several correlations found in the literature. The first
correlation used was by Geldart and Abrahamsen, as described in Geldart (1986a),
( )066.087.0
8.1934.0934.0
1111 g
pgpmf
dgU
ρµ
ρρ −= , (7-2)
where ρp, ρg, dp and µ are the particle density, gas density, particle diameter and gas viscosity,
respectively.
The next correlation selected was developed by Wen and Yu (1966) and is described by
( ) 7.330408.07.33Re 5.02 −+= Armf , (7-3)
where Remf is the Reynolds number at Umf
-139- -

µρ vmfg
mf
dU=Re , (7-4)
and Ar is the Archimedes number,
( )2
3
µρρρ gppgd
Ar−
= . (7-5)
The next correlation used was developed be Lucas et al. (1986)
( ) 5.290357.05.29Re 5.02 −+= Armf , (7-6)
and finally the Ergun (1952) equation was used,
Re75.11150
Re 332mfsmfs
m
mf
Arεφεφ
ε+
−= , (7-7)
where φ, εm and εmf are the shape factor of the particles, the normal bed voidage and the bed
voidage at Umf, respectively.
As shown in Table 7-3 the four correlations all produced similar results, except for the Ergun
correlation. The three similar correlations under estimated the before attrition samples by
approximately 30% to 60%, whilst only under or over estimating the after samples by 5% to
20%. The Ergun equation, using an φ and εmf of 0.9 and 0.4 respectively for both situations,
showed the opposite trend, closely predicting the before samples while producing larger
errors for the after attrition samples.
-140- -

Table 7-3: Comparison of experimental results with published correlations.
Relative Error (%)
Sample Exp. Results (cm/s)
Geldart and
Abranhamsen
(Geldart 1986a)
Wen and Yu
(1966)
Lucas et al
(1986)
Ergun
(1952)
1b 0.66 ± 0.05 37.9 50.0 50.0 -18.8
1a 0.41 ± 0.05 -3.7 16.1 16.2 -103.6
2b 0.51 ± 0.04 22.5 37.7 37.70 -48.9
2a 0.40 ± 0.04 -6.5 13.5 13.6 -119.1
3b 0.80 ± 0.05 52.2 61.6 61.6 8.8
3a 0.45 ± 0.05 10.8 28.1 28.1 -74.5
4b 0.64 ± 0.10 50.7 61.3 61.3 17.5
4a 0.30 ± 0.06 -53.4 -25.5 -25.4 -224.5
A sub sample of each of the catalyst ‘before’ and ‘after’ attrition, were digested in acid and
passed through a Atomic Absorbance Spectrometer (refer to Chapter 3 for details). The
relative change in metal concentrations before and after attrition are provided in Figure 7-3.
Figure 7-3: Concentrations (wt%) of Iron and Nickel in each of the catalyst samples,
including standard deviations.
-141- -

The relative concentrations of iron and nickel vary considerably between each sample. Iron
was found to be the main contaminant, with almost double the concentration of nickel in all
samples. Samples 1b and 3b had the greatest concentrations of iron, with approximately
0.9wt% found in those samples, with sample 2a having the lowest concentration at just under
04.wt%. Sample 2b had the highest concentration of nickel, at 0.39wt%, with both fresh
catalyst samples having approximately 0wt%. All of the after attrition ‘a’ samples had less
iron and nickel, than that of the before attrition samples. As samples 1b and 2b were taken 3
days apart from the same FCCU, wide variations of metal deposition can occur over a short
period of time inside an operating FCCU.
7.2.1 Abrasion Tests
Since the majority of metal contaminants found in the e-cat were located on the outer surface
of the particle, removal of these contaminates via mild attrition was identified as a feasible
removal strategy. Abrasion tests were conducted in an 80mm internal diameter fluidized bed
for a period of 24 hours. E-cat samples were allowed to fluidize to a point that allowed
gentle bubbling to occur, promoting bubbling bed attrition, which is less severe than other
forms of attrition (Wu et al. 1999). Air samples were taken during the first 2 hours of the
bubbling process, to collect any particles generated via the attrition process.
The detailed surface characteristics of the fresh and e-cat catalyst particles have been
described in the previous chapter; refer to Figure 6-1 and 6-2 and 6-3 for details. As
discussed previously, the fresh catalyst has a smooth appearance, while the e-cat has
protruding metal rich ridges along its surface. After the attrition tests, the catalyst samples
were investigated using SEM, with the image of an e-cat particle (3a) given in Figure 7-4.
-142- -

Figure 7-4: Backscatter SEM image of an e-cat particle after attrition.
Although the e-cat particle shows some degree of ridging on the surface, it is less severe than
compared with the before attrition samples in the previous chapter. The particle in Figure 7-4
has a section removed from the top, with a reduction in the severity of ridging around this
area. The particle on the left also appears to be significantly ridged, although it is difficult to
tell, as only half of the particle is visible.
The collected material was again analysed using a SEM, with any particles found being tested
for their composition using the X-ray detector. A representative image of fine material
collected on a filter is given in Figure 7-5.
-143- -

Figure 7-5: SEM Images of collected catalyst material from the abrasion tests
Particles found on the filters were identified into three broad categories: larger particles (10 –
20µm), medium (5-10µm) and small (less than 5µm). The approximate elemental
composition of these 3 size classes, determined by X-ray analysis are provided in Table 7-4.
-144- -

Table 7-4: Elemental analysis of collected material
Element Weight % in Large
Particle (10 – 20µm),
Weight % in Medium
Particle (5-10µm)
Weight % in small
Particle (<5µm)
Na 0.11 ± 0.13 0.53 ± 0.07 0.87 ± 0.80
Al 23.54 ± 4.38 0.10 ± 0.00 2.92 ± 2.76
Si 18.50 ± 6.64 0.00 ± 0.00 1.95 ± 2.11
Ca 0.27 ± 0.45 0.06 ± 0.00 0.41 ± 0.29
Ti 0.95 ± 0.90 0.00 ± 0.00 0.20 ± 0.33
V 0.00 ± 0.01 0.29 ± 0.01 0.07 ± 0.10
Fe 1.69 ± 1.25 35.77 ± 16.36 44.69 ± 2.71
Ni 0.12 ± 0.23 6.66 ± 1.45 15.84 ± 10.93
La 7.40 ± 7.01 0.34 ± 0.02 0.74 ± 0.86
Cu 0.47 ± 0.68 0.23 ± 0.01 0.71 ± 0.24
Mo 1.44 ± 0.47 0.02 ± 0.00 0.91 ± 0.18
Cr 0.01 ± 0.02 29.39 ± 9.93 5.99 ± 3.10
Mn 0.10 ± 0.14 0.38 ± 0.02 0.41 ± 0.19
O 45.47 ± 4.06 26.28 ± 6.03 26.23 ± 3.15
Table 7-4 identifies a major difference in the composition of emitted material according to
particle size. Larger particles appear to have lower levels of contaminant metals, with a
composition similar to that of fresh catalyst. The medium to small sized particles, however
contain mainly iron and nickel. These results again compare favourably with Figure 4-13,
showing smaller particles to have higher concentrations of metals. This suggests that only
surface attrition occurs, as smaller particles are formed by the removal of the outer layer of
the particle’s surface. As the size of the formed particle increases, so does the amount of
internal material that is removed. Before and after the abrasion test, iron levels were tested
using acid digestion. It was found that the abrasion caused a decrease in the total weight
percent of iron from approximately 0.8% to 0.7%, or an approximate 0.125% absolute loss.
As fresh catalyst has an approximate 0.4% iron content due to manufacturing, the actual
reduction of contaminant iron in e-cat, due to attrition is in the order of 25%. Thus, mild
attrition is an option refineries can use to help remove unwanted metals, in particular iron and
nickel.
-145- -
7.3 Discussion
As the variation in particle size distribution and densities are not significantly different
between samples, the variation in fluidity must be partially caused by the different surface
structure of the catalyst particles (Whitcombe et al. 2002c). In fact, increasing particle size
distribution, as seen in all ‘a’ samples, would actually lead to decreased fluidity as the
concentration of fine particles is essential to efficient fluidization (Kunii and Levenspiel
1991; Rhodes 1998). As all of the catalyst samples were originally identical before loading
into the FCCU, the variation of fluidity between the samples and inparticular, the before and
after attrition samples, suggests that, whilst in the FCCU, the deposition of metals leads to
particle ridging, reducing fluidity.
Models which use correlated constants, and not actual φ and εmf values appear to predict,
more accurately the fluidity of the after attrition samples compared to the before attrition
samples. The Ergun equation which uses φ and εmf, has the opposite accuracy, better
predicting the Umf in the before attrition samples. This suggests that it is those parameters, φ
and εmf, which are causing the variations in the experimental results between the before and
after attrition tests. For the particles used in this paper, increasing the bed voidage by
approximately 10% will increase the calculated Umf by almost 40%. The large ridges on the
surface of the particles, will impact on the φ and εmf characteristics of the catalyst particles.
These ridges lead to particles being unable to pack closely together, and increase the εmf of
the sample. Increases in particle drag forces and changes in the particle’s shape will also
occur. Finally, the development of irregular ridges on the surface of particles will lead to
individual particles being locked together. All of these factors would lead to higher Umf,
lower Umb/Umf, and a reduction in overall fluidity compared to clean or non ridged catalysts.
This hypothesis is supported by Table 7-2, as the attrition process will gradually remove any
surface ridges, causing the particles to become more rounded, encouraging easier fluidization.
It is also seen from the results that it is not the total level of iron or other metals that
contributes to poor fluidity but the amount of ridging formed on the surface of the catalyst
particle. From Figure 7-3, no relationship between the loss of metal and the reduction in Umf
between the ‘a’ and ‘b’ samples can be determined. All samples lost iron, due to the wearing
-146- -

away of the iron rich ridges. This suggests that it is not the total loss of metals which is
important, but just the reduction in ridging associated with each particle. As high levels of
metal contaminants are found in the gullies, gentle attrition would not be sufficient to
completely remove all traces of metals from the particle surface.
Of importance to refineries, is that metal ridges can cause changes to catalyst fluidity over a
relatively short period of time. In the three days between collecting samples 1a and 2a from a
FCCU, there was a 24% change in their Umb/Umf ratio, indicating a potentially significant
change in fluidity throughout the FCCU (Whitcombe et al. 2002c).
7.4 Conclusion
Investigations of four FCC catalyst samples of the same original type, concludes that
operational conditions inside a FCCU can reduce the fluidity of FCC catalyst via the
accumulation of contaminants on the surface of the particle. With the use of SEM imaging
and X-ray analysis, accumulated metal compounds were identified forming long ridges on the
surface of e-cat particles. Although other metals are present in these ridges, it appears that
iron is the primary component of these ridges. Through the use of mild bubbling attrition,
catalyst particles had their surfaces gently abraded, removing some of these ridges from the
surface of the particles.
Fluidization tests of each catalyst sample, before and after attrition, shows that all of the
before attrition samples exhibited lower fluidity. After attrition, all e-cat samples
experienced a net reduction in the level of contaminant iron present in the catalyst particle,
although no correlation between the loss of iron and increase in fluidity was found. As the
entire surface of the catalyst particle contains iron, the attrition tests would only have
removed parts of the ridging and not all of the metals found on the particle surface. It is the
physical ridging and not total metal surface deposits that influence fluidity.
Correlations from the literature were tested and those found to use approximations, not actual
values for φ and εmf, were more accurate in predicting the after attrition Umf values. The
Ergun equation, which uses φ and εmf, had the opposite trend, only predicting the before
attrition Umf values with any accuracy.
-147- -

Where circulation difficulties arise in operational FCCUs it may be due to an accumulation of
iron onto the catalyst particles. As an operating FCCU has both sources for the loss of metal
ridging (attrition) and the production of metal ridging (crude oil), variations in fluidity can be
related to these factors. Refiners should therefore watch for short term variations in iron
levels present in the crude oil being processed, or a sudden reduction/increase in attrition
process to help identify changes in fluidity in FCCUs.
Overall, changes in fluidity and iron concentration can also influence rates of catalyst
emissions due to dipleg blockages or increased attrition rates due to the removal of the metal
rich ridges on the surface of the e-cat particle. As start up situations cause abnormal operating
conditions, the influence of metal ridges is likely to influence the quantity and composition of
particle emissions.
-148- -

8 Lab Emissions Tests As discussed earlier, a wide range of experimental data concerning fluidized beds can be
found in the literature. The majority of experiments on fluidized beds were conducted on
fluidized vessels and not FCCU style regenerators, with the aim of modeling specific aspects
of the fluidized state and not the emissions from the systems. Several papers were found in
the literature which dealt with modeling the FCCU process (Ercan et al. 1995; Han and
Chung 2001a; Han and Chung 2001b), although no realistic experimental test rig has been
used to study air emissions. As no reliable source can be found in the literature, a 1:8.5 scale
model of the FCCU regenerator was designed and built using the industrial regenerator as the
reference system. The objective of the experimental program was to look at trends in
emissions under simulated start up conditions.
8.1 Methodology
An approximate 1:8.5 scale model of the FCCU regenerator was designed and built in the
laboratory. The design of the laboratory regenerator ensured operating conditions such as
cyclone velocity and efficiency were as close to the real industrial FCCU as possible. All
aspects of the original industrial FCCU regenerator were maintained, except, instead of 6 sets
of 2 cyclones, only 1 set of 2 cyclones were installed. To offset the loss of 2 sets of cyclones,
the FCCU was constructed with a diameter less than the 1:8.5 ratio used for the cyclone
design. This reduction in the width of the system adjusts the air flow entering the cyclones,
allowing the same operating conditions inside the scaled cyclones as in the real industrial
fluidized bed. The experimental regenerator was operated at room temperature with a level
of catalyst similar to the level used in the operational FCCU. The catalyst level was selected
to allow conditions at the beginning of the start up cycle to be simulated. Two different
operating conditions were tested, firstly with the diplegs valves operating under normal
conditions (i.e. the valves free to open and close to allow catalyst to exit the dipleg) and when
the diplegs were artificially sealed (simulating a blockage), as these two situation are most
likely to occur under start up situations. Air by pass has been identified as a possible cause of
emissions during start up, and these experiments were designed to test this hypothesis. The
dipleg was sealed using plastic containers, placed over the end of each dipleg, and sealed
with industrial ducting tape. The plastic containers provided an effective seal as well as
-149- -

enabling catalyst collected in each dipleg to be sampled. In this way the ‘normal’ conditions
represent the early stages of a start up, when the dipleg valves are under reduced pressure to
seal. The sealed dipleg experiments simulate conditions inside the cyclone if it were to block
during the start up. Although attempted, experiments with the diplegs forced open caused
emission levels to be so great that they exceeded the monitoring capabilities of the equipment
used. Therefore these experiments were not completed.
Figure 8-1: Photograph of the inside of the experimental regenerator showing the cyclone
diplegs and a viewing port on the right hand side.
The laboratory system was constructed out of galvanized steel 0.5m diameter pipe, with clear
acrylic viewing portals installed (refer to Figure 8-1). As no previous studies have been
conducted on larger scale regenerator apparatuses, the 1:8.5 scale was selected as it was the
largest size that could be feasibly built in the laboratory, as well as providing a fluidized bed
significantly larger than others found in the literature (Whitcombe et al. 2002c). An internal
-150- -

light was located on the top of the system to allow detailed observations to be made.
Sampling points were placed at the inlet of the first cyclone, in between the two cyclones and
at the gas exit. Catalyst samples were collected from the test rig before and after the
emissions experiments were conducted as well as from both diplegs. These samples were
sized using a Mastersizer, following the same sampling procedure as outlined in Chapter 3.
Detailed drawings of the laboratory system are provided in Appendix A.
8.2 Experimental Procedure
Sampling points were connected to a real time particle counter, providing total and size
specific results in terms of particle concentrations from each sampling point. An Autocounter
300A (Malvern, UK) was used with sampling nozzles being designed to allow USEPA
Method 5 isokinetic sampling conditions to be maintained. Catalyst used in the laboratory
was sourced from the industrial FCCU and filled to the standard operating level used in the
industrial FCCU, ensuring standard results.
The test rig was started using a maximum superficial velocity of 0.6m/s and operated
continuously for a period of 7 hours (the maximum capabilities of the continuous monitoring
system). Data collected was exported to excel for graphing purposes. Due to fluctuations in
the emissions samples, a data filtering procedure was conducted to emphasise the emissions
trends over the sampling period. The data smoothing reduced the number of sampling points
by a factor of two, and was conducted using the following formula
0
100
1 *25.0*5.0*25.0 +− ++= sssf
s yyyy , (8-1)
where y0s-1, y0
s and y0s+1 are three consecutive observed data values and ys
f is the filters value
at s. this equation is applied to the full time series of observed data, to obtain the filtered
data. All graphs contain both the original and the smoothed emissions data.
As no previous studies were found to compare and calibrate results, only the accuracy of the
sampling methodology could be assessed. To ensure the accuracy of the automatic testing
equipment, gravimetric samples were taken using an air sampling probe containing a quartz
-151- -

filter. There was found to be no variation between the sampling equipment results and the
quartz filter results.
After all of the experiments were conducted, the experimental regenerator was operated at
0.25, 0.4 and 0.6 m/s, with four gravitational filter samples taken at intervals of 5 minutes.
These tests were conducted under normal and sealed dipleg conditions to gauge the
importance of gas velocity on particle emissions rates.
8.3 Results
The observed and filtered data of the emissions from the experimental regenerator under
normal operating conditions are given in Figure 8-2. Initially the emissions from the system
are very high, peaking at almost 90mg/m3 before reducing over the first 2 hours of operation,
to a level of approximately 1 to 2 mg/m3. There appears to be a regular fluctuation in the
emissions rates occurring at approximately a 12 minute period (based on filtered emissions
trends), where the emissions rates spike before reducing. This cycle continues for the
duration of the sampling period although it is reduced in severity after the first hour of
operation.
Figure 8-2: Total emissions under normal operating conditions
-152- -

Emissions from the experimental system when the diplegs are sealed shut are presented in
Figure 8-3. The emissions rates initially peaked at approximately 0.35mg/m3, before reducing
to less than 0.05mg/m3 after the first 4 hours. The emissions levels were relatively smooth
for the first 3 hours before becoming more erratic after that point.
Figure 8-3: Total emissions under sealed dipleg conditions
The emissions rates according to particles size for the normal operating conditions are
presented in Figure 8-4. Although a wide range of particle sizes are presented in Figure 8-4,
only the larger particles sizes can be seen, as they are dominant in the emissions stream. The
emissions rate of each particle size fluctuates with a period of approximately 12 minutes.
-153- -

Figure 8-4: Emissions rates under normal conditions, for various particle sizes
The emissions according to particle size under sealed dipleg conditions are presented in
Figure 8-5. To reduce the complexity of the figure, only representative particle sizes are
presented. When the diplegs are sealed there is a reduction in the quantity of the mid sized
particles (0.8 and 4µm particles), with a fluctuation in the larger sized particles (represented
by the 25µm particle), combined with a steadily increasing concentration of fines (0.3µm
particles).
-154- -

Figure 8-5: Emissions rates under sealed dipleg conditions, for various particle sizes.
Figure 8-6 and 8-7 show the total collection rate of 0.8µm sized particles under normal and
sealed dipleg conditions, respectively. Under normal conditions, the collection rate of these
sized particles is negative, indicating that more of these particles exit the cyclones than are
present at the intake. This negative collection rate indicates the level of cyclone attrition
which is occurring in the system. Only after approximately 3.5 hours of operation does the
collection rate return to the positive, indicating a reduction of attrition. Again, approximately
every 12 minutes there is an alteration in the collection rates. A similar situation is seen
under sealed dipleg conditions, although the collection rate is has a larger negative value, and
remains negative for the duration of the experiment, the rate of attrition does reduce after 3
hours of operation.
-155- -

Figure 8-6: Emissions rate of 0.8µm particles under normal conditions
Figure 8-7: Emissions rate of 0.8µm particles under sealed dipleg conditions
Collection rates for 4µm particles under normal and sealed conditions are given in Figure 8-8
and 8-9, respectively. Collection rates are positive for the duration of the sampling period
under normal conditions, approaching 100% after 3 hours. Regular spikes in the collection
rates are seen until the 3 hour mark when they are reduced. Under sealed conditions the
-156- -

collection rate is relatively steady, slowly increasing from an initial low of 80% to almost
100% after 2 hours.
Figure 8-8: Emissions rates of 4µm particles under normal conditions.
Figure 8-9: Emissions rate of 4µm particles under sealed dipleg conditions.
-157- -
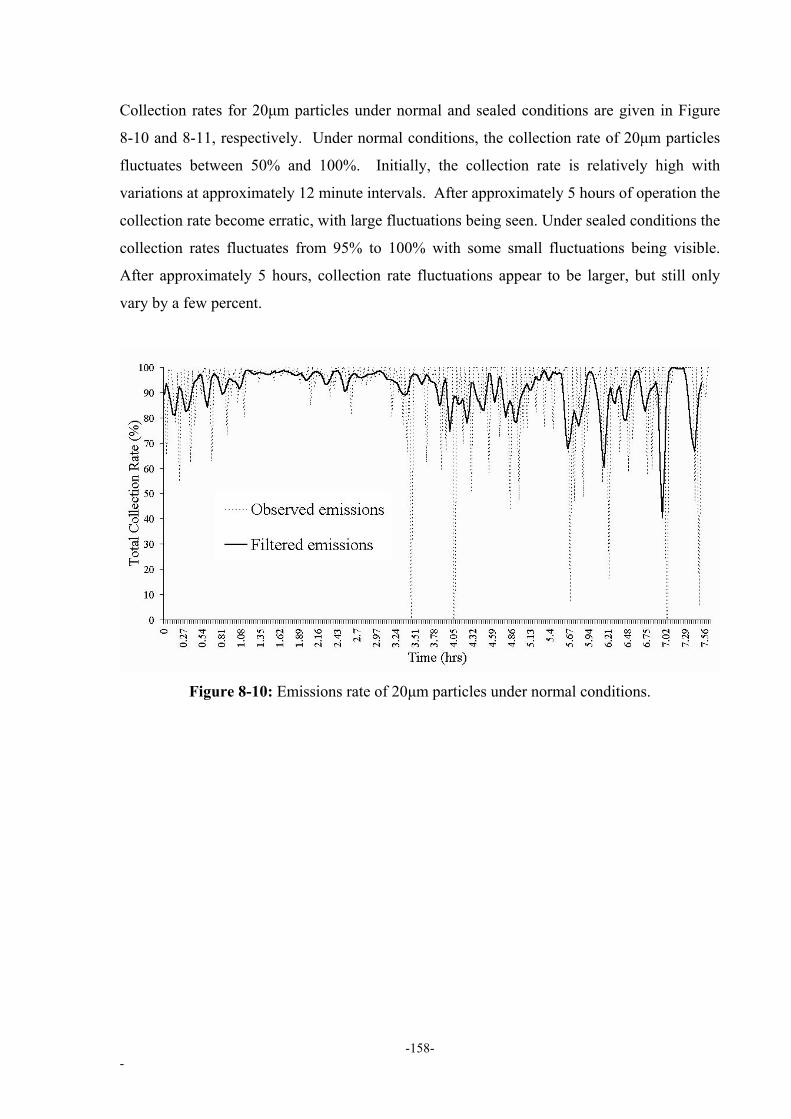
Collection rates for 20µm particles under normal and sealed conditions are given in Figure
8-10 and 8-11, respectively. Under normal conditions, the collection rate of 20µm particles
fluctuates between 50% and 100%. Initially, the collection rate is relatively high with
variations at approximately 12 minute intervals. After approximately 5 hours of operation the
collection rate become erratic, with large fluctuations being seen. Under sealed conditions the
collection rates fluctuates from 95% to 100% with some small fluctuations being visible.
After approximately 5 hours, collection rate fluctuations appear to be larger, but still only
vary by a few percent.
Figure 8-10: Emissions rate of 20µm particles under normal conditions.
-158- -

Figure 8-11: Emissions rate of 20µm particles under sealed dipleg conditions.
The changes in the particle size distribution (PSD) of the original catalyst before and after the
experiments, and of the catalyst collected from the diplegs are presented in Figure 8-12 and
8-13, respectively. The difference between the PSD before and after the experiments is
evident between the 180 to 250µm and 80 to 120µm size ranges, with a slight variation seen
around the 30 to 40µm size range. The catalyst sample after the experiments appears to be
slightly finer in terms of total PSD, although taking into account experimental error the
differences are not conclusive. The catalyst collected in cyclone 1 has a peak size of under
50µm whilst cyclone 2 has a peak size slightly above 50µm. All catalyst from the dipleg was
sampled under sealed dipleg conditions and was collected after each experimental run.
-159- -

Figure 8-12: Particle size distribution (PSD) of the catalyst before and after experiments.
Figure 8-13: Particle size distribution of catalyst collected from the diplegs.
The emissions vs bed velocity, under normal conditions and with the diplegs sealed are given
in Figure 8-14 and 8-15, respectively. As expected, both conditions showed an increase in
particle emissions rates with increased bed velocity. Of interest is that under the sealed
dipleg conditions the emissions rate of particles is much less, although emissions begin to
increase once the gas velocity has dropped below approximately 0.35m/s.
-160- -

Figure 8-14: Plot of emissions rate vs gas velocity under normal conditions
Figure 8-15: Plot of emissions rate vs gas velocity for sealed dipleg conditions.
8.4 Discussions
Both the sealed and open dipleg conditions simulated in the experiments, supported the
industrial emissions samples which showed that the emissions levels from the regenerator are
initially much higher immediately following a start up than normally expected, and that after
-161- -

some time these emissions reduce. Obviously the 7 hour lab based time period is
considerably less than the 142 hours needed at the refinery to stabilise the emissions.
Although this is true, the emissions trends (Figure 8-2 and 8-3) are similar to those obtained
from the industrial FCCU (Chapter 4). The differences in the emissions patterns obtained
from the normal and sealed dipleg conditions indicate that the diplegs play an important role
in controlling catalyst emissions during start up situations. Emissions were considerably
higher under normal conditions than when the diplegs were sealed, indicating the possibility
of air bypass occurring in the diplegs.
In terms of total emissions, the concentration of large particles present in the initial
emissions, indicates that the diplegs are allowing air by pass to occur. As seen in the sealed
experiments (Figure 8-5), the larger particles should be retained in the cyclone, however this
is not the case under normal conditions (Figure 8-4). When there is a reduced level of
catalyst in the fluidized bed, the dipleg valves are easier to open with any surges of gas
though the bed, causing re-entrainment to occur inside the cyclones. Over time, the diplegs
will fill from the cyclone above, reducing the risk of air bypass and the overall emissions
from the system.
Under the normal operating conditions, there appears to be a regular peak in emissions levels
with a period of approximately 12 minutes. There is certainly some periodic event occurring
in the system, with the exact period fluctuating slightly. This indicates that the dipleg valve
is regularly opening, allowing collected catalyst to be returned to the bed. As the catalyst bed
level was maintained below the dipleg valve, less resistance would be present to prevent air
by pass from occurring. It is likely that as the dipleg opens, air enters the dipleg, causing
entrainment of particle to occur inside the cyclone and a temporary spike in emissions levels.
Although there were observation windows built into the experimental regenerator, the amount
of particles entrained into the freeboard made it impossible to visually verify the rate at which
the diplegs opened and closed.
In contrast, the emissions rate from the experiments that had the diplegs artificially sealed are
much smoother. As the diplegs cannot open, air is prevented from entering the valve,
reducing the level of particle re-entrainment. There is still a slight period in the emissions
rates, indicating possible oscillations in the air flow and that the initial spikes in emissions,
-162- -

shown in Figure 8-2, are caused by additional instability during the initial start up of the
system. The increased fluctuations in the emissions levels, approximately 4.5 hours after the
starting of the experiment with sealed diplegs, indicates that fluctuations in the cyclone’s
efficiency is occurring. It is likely that after some time either air, catalyst, or both, will be
filling the dipleg and causing the cyclone vortex to become disrupted. This would lead to
particle re-entrainment and fluctuations in the emissions rates. As the volatility in the
emissions took approximately 4 hours to start, it is likely this is the minimal time required to
partially back up the diplegs. After 7 hours of operation, the diplegs were opened and were
found to be only partially full (approximately half full). Therefore it is likely that trapped air
is causing the emissions fluctuations as the spikes in the emissions rates are brief in duration
and the dipleg is only partially full. If the diplegs became completely filled with catalyst, it is
likely that the cyclones will block and emissions levels would increase rapidly. As emissions
are only briefly increased it is likely that trapped air is escaping the diplegs, causing
temporary internal disruptions in the cyclone flow fields and the corresponding spikes in
emissions levels. This trapped air inside the dipleg can explain why under sealed conditions it
takes approximately 3 hours for the emissions rates to stabilise, compared with only 1 hour
under normal conditions.
The difference in emissions is also seen when looking at specific size fractions found in the
emissions. Under normal conditions the collection rates of the cyclones are lower for all size
ranges, except the very fine particles. It appears that allowing the diplegs to open and close,
reduces the overall collection efficiency of the cyclone whilst minimising the attrition
formation of fine particles. Although not directly measured, the collection rate for the fine
0.8µm sized particle allows the net formation of these particles to be predicted. If the
collection rate is negative, that implies that greater numbers of these sized particles are
exiting the cyclones than entered. Obviously, even if the collection rate is positive there will
be some attrition, just that the products of attrition will not be significant.
Initially both conditions produced attrition generated fines, although under normal conditions
their concentration is relatively low, and does not appear in Figure 8-4. After approximately
3 hours the attrition rate reduces under normal conditions with a positive collection efficiency
being reached. It is also possible that the higher catalyst loading rates experienced under
these conditions leads to greater collection efficiencies for finer particles as the larger
-163- -

particles will sweep them towards the cyclone wall (Fassani and Leonardo Jr 2000).
Contrasting this is the generally high level of particle attrition experienced when the dipleg is
sealed. Figure 8-5 shows a steady increase in the concentration of 0.3µm particle being
emitted during the experiments, contradicting the belief of attrition reducing with time (Zenz
and Kelleher 1980).
The variations between the PSD of the original e-cat and the sample taken after the
experiments were expected. Continual use inside the experimental regenerator would expose
the catalyst in the bed to attrition processes, leading to the wearing away of the larger
particles and the formation of smaller ones. Therefore over time there is a gain in the 80 –
120µm size ranges due to the slow attrition of the larger particles, combined with the loss of
finer catalyst particles to the atmosphere.
The variation of the cyclone dipleg samples is interesting with the material collected in
cyclone 1 being finer than that found in cyclone 2. It is likely that the higher flow rates into
the first cyclone allows particles normally too fine to be collected, to be swept against the
wall of the cyclone by the forces acting on larger particles. Also, the high concentrations of
particles would lead to increased particle interaction and the production of fines in the
collected material. The fine nature of the material in the primary cyclone could also be
enhanced due to scaling issues evolved in the design of the experimental system.
Finally, the emissions trends with respect to bed velocity shown in Figure 8-14 and 8-15 are
reasonable and support the literature. What is of interests is the variation in the emissions
rate under low gas velocity, and in particular the increase in emissions seen when the diplegs
are sealed at velocities below 0.35m/s. It is possible that at lower velocities, the material
trapped inside the dipleg is re-entrained leading to an increase in emissions rates. Under
normal conditions, this would not occur as the diplegs would clear, and gas by pass would
reduce as the pressure difference caused by the gas velocity would be reduced.
-164- -

8.5 Conclusion
The results in this chapter indicate that the cyclone diplegs play an important role in
controlling emissions during the start up. The same pattern of high initial emissions,
followed by a gradual decrease to a more steady state is seen in the experimental results. By
comparing the results from both experiments, it was found that if the diplegs are opened,
allowing gas bypass to occur, a greater proportion of larger particles are found in the
emissions stream. As the diplegs seal, a reduction of larger and mid sized particles occurs,
with the finer particles becoming the predominate source of emissions. This suggests that the
initially high emissions rate of coarse particles in the first stages of the industrial start up are
caused by the diplegs failing to seal correctly and allowing air by pass to occur. The
experiments also showed that if the diplegs became artificially blocked, emissions rates
would initially reduce until the dipleg became full, which inturn causes increased instability
and higher emissions rates to develop.
-165- -

9 Modelling The unstable operational conditions during start up are the main possible cause of the
excessive emissions found during start ups. To study how operational conditions
influence emissions, a model was developed and tested using second order sensitivity
analysis (SA) and a genetic algorithm (GA). The aim is to develop a model of a
FCCU regenerator, using detailed models from the literature, to simulate the physical
processes involved. The modelling was done in two parts, firstly, Matlab was used to
develop a model to predict catalyst emissions from the fluidized bed, through the use
of operating parameters of the system. The objective of the model was to produce
qualitative trends of emissions, rather than a tool for representative estimates. Then
the model was expanded to stage two, to take into account attrition and the feedback
between the cyclones and the fluidized bed. This more accurate model was then
tested using the same sensitivity software and a genetic algorithm to test the accuracy
of the model.
9.1 Model Construction
The regenerator of a FCCU includes a fluidized bed, the freeboard, the 2 stage
cyclones and the exhaust stream. The essential processes include fluidization,
elutriation, entrainment and attrition, and several models are available in the literature
for each process. The aim is to include a selection of these sub models in a broader
model, or simulation, of the regenerator of a FCCU. This will provide a simulation
package of the regenerator, where the simulated emissions can be studied in terms of
the system parameters.
The main structure of the model is given in Figure 9-1.
-166- -

Figure 9-1: The main sections of the model
The particular equations used in for each sub sections (routines) are given in
Appendix B, and will not be repeated here. The model is of the form y = f(x) where x
is a vector of 12 input parameters, and these are listed in Table 9-1. The output y is
the emissions level in mg/m3 of catalyst particles, and the function f(x) is essentially
algebraic.
Table 9-1: Ranges of values for each input parameter for the FCCU model
Factor Parameter Lower bound Upper bound
1 Bed Velocity (m/s) 0.1 1.5
2 300µm size fraction (% mass) 0.001 0.20
3 200µm size fraction (% mass) 0.001 0.40
4 100µm size fraction (% mass) 0.05 0.60
5 80µm size fraction (% mass) 0.1 0.90
6 60µm size fraction (% mass) 0.1 0.90
7 40µm size fraction (% mass) 0.05 0.60
8 20µm size fraction (% mass) 0.001 0.40
9 1µm size fraction (% mass) 0.001 0.20
10 Feed rate (kg/s) 1 350
11 Catalyst density (kg/m3) 1197 1323
12 Shape factor (perfect sphere = 1) 0.70 1
-167- -

The model accepts the input variable, and steps through a series of subroutines to
calculate specific process outcomes in the regenerator. The non linear equation
representing each process, uses a combination of operating parameters and the
solution of previous routines, to implement its particular process. The result of one
calculation then becomes the input to subsequent routines, until the emissions levels
are determined.
The stage 1 model deals with a simplified system and does not incorporate attrition or
feedback between the 2 cyclones and fluidized bed. Worked examples from the
literature were used to validate the stage 1 model and to check its accuracy. The stage
1 model was found to be approximately 95% accurate when dealing with worked
examples from the literature, which were based on small scale systems (Whitcombe et
al. 2001; Whitcombe et al. 2002e).
Once the model was operating correctly, industrial operating conditions at the refinery
were used to track predicted emissions. The stage 1 model was further developed to
indicate the affects of attrition and to add a particle feedback loop from each of the 2
cyclones (through the diplegs) to the bed. The greater detail and complexity of the
stage 2 model provides a more realistic simulation of the emissions (Whitcombe et al.
2003b).
9.2 Sensitivity Analysis
Sensitivity analysis was used to determine which operating parameters influenced
emissions from the FCCU regenerator. The stage 1 model used for the refinery, is
relatively simple in that it deals only with steady state conditions. It is incomplete in
that dynamic ie effects in time, are not considered. Inclusion of such effects leads to a
much more computationally demanding model. Given the preliminary nature of this
model, a 'one-factor-at-a-time" (OAT) screening method was selected as the preferred
sensitivity analysis technique. The use of an OAT method for this initial test, also
allows future, more computationally demanding models to be tested and results
compared using the same standard sensitivity method. The Morris method is one such
OAT method which provides sensitivity estimates of total effects and an overall
-168- -

sensitivity measure of curvature and interactions between factors (Campolongo and
Braddock 1999).
To further understand the interactions inside the FCCU and how these interactions
influence catalyst emissions, a higher order sensitivity analysis was also used on the
model. The New Morris Method, as developed by Campolongo and Braddock (1999)
and corrected by Cropp and Braddock (2002), was selected and used to test for second
and third order interactions in the model's input parameters. The New Morris Method is
an extension of the original Morris method extended to identify second order
interactions between input parameters. In doing so, the New Morris Method provides an
estimate of the output sensitivity for any pair of input parameters, while minimising the
computational cost of the evaluation (Campolongo and Braddock 1999). The sensitivity
analysis was conducted on the entire stage 1 model and not specific sub-routines.
The sensitivity software requires the identification of the input factors, and the range of
values to be set for these factors (refer to Table 9-1), number of sample runs, the
discretisation of the parameter space, and the output file. The data transfer required for
the New Morris Method is via the use of text files. The software calls the FCCU model,
obtaining the input parameters from the file, varying individual parameters to determine
the sensitivity of the output to variations in input parameters. The 12 input variables
seen in Table 1 were selected as they are both essential to the operation of a FCCU and
also are able to be altered by operating staff, without compromising the FCCU
performance. In particular, the 8 discrete size fractions were chosen as these are the
most important sizes in terms of indicating performance of a FCCU, as well as the
easiest size fractions to obtain operating information on. The upper and lower bounds
were determined by the absolute maximum and minimum possible values that could be
seen in an operating FCCU. All selections of parameters and bounds were done in
conjunction with the practical operations of the refinery. Due to the preliminary nature
of this work and the use of an OAT technique, any errors developed by possible
correlations in the input values were deemed to be reasonable.
The software calculates a mean (µ) and standard deviation (δ) from the first order Morris
Method, as well as a new mean for the second order effects, lambda (λ), and its standard
-169- -

deviation, to be determined for the input factors of the model. The mean allows the
overall influence of the factors to be determined, while the standard deviation identifies
factors with possible interactive effects. The new term, lambda, provides a global
sensitivity measurement for 2-factor interactions (Campolongo and Braddock 1999).
The standard deviation of lambda has been shown to accurately predict possible third
order interactions in the system (Cropp and Braddock 2002).
9.3 Genetic Algorithm
Genetic Algorithms (GA) are optimization algorithms based on the mechanics of
genetics, that is the idea of the survival of the fittest (Karr et al. 1995). The algorithm
allows for the search space of the model output to be optimized through the use of
previously determined calculations. Random strings are developed based on the
parameter set provided, the output of the model is then determined with each string
being assessed on the quality of the solution provided (its fitness). This information is
then used to generate the next generation of strings, as the fittest ones will generate
the largest copies, allowing the parameter space to be optimized, in this case, to
provide a minimum level of emissions from the fluidized bed (Karr et al. 1995). The
GA requires the upper and lower bounds of the parameter space (Table 9-1), the
number of generations, the size of the populations and the number of bits used in each
population. The GA calculates the optimal parameters and displays their value along
with the minimal emissions rate (in mg/m3) achieved from the fluidized bed. As the
GA utilizes random numbers and the generation of successive populations, the
optimized values of the parameters can change with each run. To overcome this, the
GA was run 10 times with the average and standard deviation for each parameter and
the minimum emissions determined. The GA was only applied to the more realistic
stage 2 model so that realistic operating conditions could be determined.
-170- -

9.4 Results and Discussions
9.4.1 Model Results: Stage 1
The following results were obtained from the stage 1 model and are provided to allow
operational and emissions trends to be seen.
9.4.1.1 Minimum Fluidization Velocity
The minimum fluidization velocity was modelled over the particle distribution of the
fresh catalyst. This allows the relationship between particle size and fluidization
velocities to be seen, and these results are given in Figure 9-2.
Figure 9-2: Plot of Minimum Fluidization velocity against particle size.
In Figure 9-2, note that the minimum fluidization velocity increases with an increase
in particle size. The weighted or average minimum fluidization velocity was
determined to be approximatly 0.14m/s, well below the velocities that are commonly
used at the refinery.
-171- -

9.4.1.2 Terminal Velocity
Two methods, the Haider (H) and the McCabe (M), were used to calculate the
terminal velocities of the various size fractions and the results are shown in Figure 9-
3.
Figure 9-3: Plot of Terminal velocities using the Haider method (H) and the MaCabe
method (M)
In Figure 9-3, there is little difference between the results using the two methods. The
averaging of the two results would provide a good estimate. The difference appears
to increase as the particle size increases, but even this is increase is small. As the
majority of the particles are below 120µm the slight increase in variation is not
significant.
-172- -
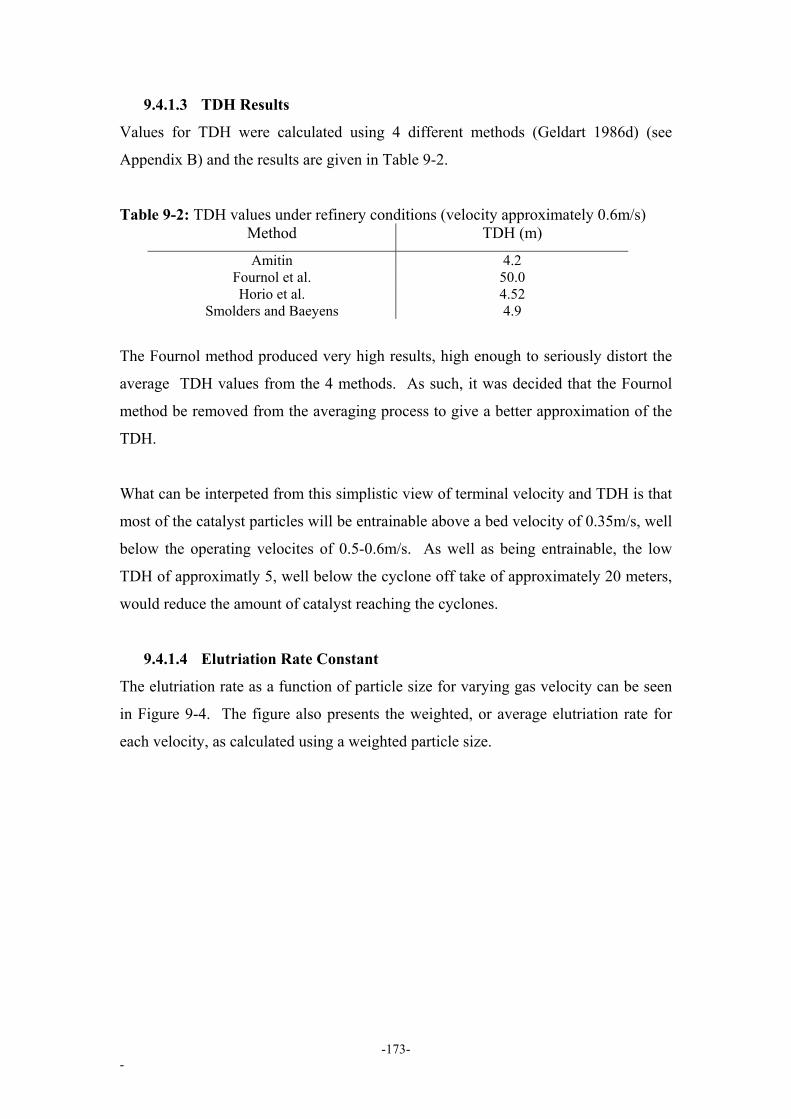
9.4.1.3 TDH Results
Values for TDH were calculated using 4 different methods (Geldart 1986d) (see
Appendix B) and the results are given in Table 9-2.
Table 9-2: TDH values under refinery conditions (velocity approximately 0.6m/s) Method TDH (m)
Amitin 4.2 Fournol et al. 50.0 Horio et al. 4.52
Smolders and Baeyens 4.9
The Fournol method produced very high results, high enough to seriously distort the
average TDH values from the 4 methods. As such, it was decided that the Fournol
method be removed from the averaging process to give a better approximation of the
TDH.
What can be interpeted from this simplistic view of terminal velocity and TDH is that
most of the catalyst particles will be entrainable above a bed velocity of 0.35m/s, well
below the operating velocites of 0.5-0.6m/s. As well as being entrainable, the low
TDH of approximatly 5, well below the cyclone off take of approximately 20 meters,
would reduce the amount of catalyst reaching the cyclones.
9.4.1.4 Elutriation Rate Constant
The elutriation rate as a function of particle size for varying gas velocity can be seen
in Figure 9-4. The figure also presents the weighted, or average elutriation rate for
each velocity, as calculated using a weighted particle size.
-173- -

Figure 9-4: Elutriation rate constant vs particle size, for various bed velocities, with
average elutriation values indicated.
As expected the elutriation rate constant increases with an increase in bed velocity
and a decrease in particle size. There is a greater change in the elutriation rate
constant for varying the particle size when the particle size is below 40µm, than
above.
9.4.1.5 Total Entrainment
Figure 9-5 shows the entrainment rate as a function of the particle size, for a number
of gas velocities.
-174- -

Figure 9-5: Plot of Entrainment rates vs particle size for various bed velocities.
As expected the stage 1 model shows that the amount of material being removed from
the bed surface is dependent on the concentration of that size fraction in the bed.
Obvisouly the smaller particle are more likely to be removed, but are not present in
large enough concentrations to have the maximum entrainment rate. Under low
velocity conditions, the majority of fines are entrained. However, as the bed velocity
increases larger particles begin to be entrained into the freeboard.
As the bed velocity increases past 1m/s, larger particles are very easily elutriated and
the entrainment rate for those particles jumps significantly. At these high velocities
the larger particles become the most prevelant in the freeboard region.
-175- -

9.4.1.6 Cyclone efficiency
Figure 9-6: Graph of cyclone removal effeciency as a function of particle size, for
various bed velocities
The cyclone efficiency from the stage 1 model is given in Figure 9-6, where cyclone
removal effeciency is greatly dependent on the size of the particle. Removal rates are
relatively stable until the particle size drops below 40µm, then the effeciency begins
to drop substantially. When particle sizes are below the 10µm level, removal rates
are as low as 10%.
As the bed velocity increases, the velocity through the cyclone also increases. This
increase in velocity causes the cyclones to perform better and actually increase their
removal effeciency. This means that although more particles are entrained with high
bed velocities, the corresponding increase in cyclone efficiencies may lead to a
situation where less particles are being lost from the system.
The increase in efficiency is most apparent when dealing with small velocities. Each
line on the graph represents an equal increase in bed velocity, although the most
-176- -

dramatic increase in cyclone efficiency is caused by the first increase in bed velocity
from 0.1 to 0.25m/s. This implies that the system may be very sensitive to small bed
velocities and that a small change in this velocity can be used to alter emissions.
While an increase in bed velocity increases the over all removal rates of particles, this
increase has little impact on the small particles sizes (<10µm). The cyclone has a
very poor collection efficiency for fine material and there is little that can be done for
this through velocity manipulation.
As expected, the main source of emissions are from the sub 20µm size fractions. The
primary cyclone works well at removing a large amount of reasonably large material,
but has little effect on the fines. The secondary cyclone again removes the majority of
the medium to large particles but has little effect on the fines. This leads to a dilemma
where by the main source of emissions are in a size fraction that can't be easily
removed by velocity fluctuations in the bed or even the addition of a tertiary cyclone.
9.4.1.7 Emissions Rates
Figure 9-7 and 9-8 show a sample of the standard output obtained from running the
FCCU model using industrial operating conditions. Figure 9-7 corresponds to the
emissions of the primary cyclone, which are fed into the secondary cyclone for further
cleaning. The emissions from the secondary cyclone, into the atmosphere, are given
in Figure 9-8. Both figures show emissions rates (kg/s) for bed velocities from 0.1m/s
to 1.2m/s as a function of particle size.
-177- -

Figure 9-7: Emissions rates (kg/s) vs particle size (µm), from the primary cyclone for
various bed velocities.
With an increase in bed velocity, higher emissions rates are generated, except at 1m/s,
where emissions rates are less than the 0.7m/s bed velocity for particles in the 80µm
size fraction.
Figure 9-8: Emissions rates (kg/s) vs particle size (µm) from the secondary cyclone,
for various bed velocities.
-178- -

In Figure 9-8, the higher the bed velocity the larger the emissions from the secondary
cyclone, with a dramatic increase in emissions being seen above the 1m/s bed
velocity. From Figure 9-8 the greatest source of particle emissions into the
atmosphere is in the 30 to 40µm size range.
9.4.2 Sensitivity Results: Stage 1 Model
Figure 9-9 shows the results of the first order sensitivity analysis for the stage 1
model, showing both mean and standard deviation. In Figure 9-9 there appears to be a
wide spread in sensitivity between all parameters. The gas velocity (1) and particle
density (11) appear to be the most sensitive while emissions are also affected to a
lesser extent by the 80µm (5), 60µm (6), 100µm (4), 40µm (7) and 200µm (3) particle
sizes.
Figure 9-9: Plot of the first order effects (mean and standard deviation) from using
the Morris Method.
The lambda (λ) values generated from the second order sensitivity analysis are given in
Figure 9-10. Pairs of factors are altered (others remain constant) and their influence on
emissions levels are calculated, producing λ values. The higher the λ value the more
influence those factor pairs have on emissions levels. It is not the value of λ that is
-179- -

important but the rank order of these values. From Figure 9-10 it is clear that some
parameter pairs have much larger λ values (sensitive parameter interactions), while
others are very low (non-sensitive parameter interactions). The parameter pairs that
total emissions rates are most sensitive to are highlighted in Figure 9-10. The first order
sensitivity results are supported by Figure 9-10, which show that bed velocity (1) and
particle density (11) interact with particles in the 80µm (5), 60µm (6) and 40µm (7) size
group.
Figure 9-10: Output from the New Morris Method with significant parameter pairings
highlighted.
The overall sensitivity analysis (Morris Method) indicates that the emissions are most
sensitive to the bed velocity and particle density. Surprisingly, medium sized
particles (60 and 80µm), which are normally too large to be emitted, appear to have a
relatively high sensitivity - higher than that of the smallest fines.
The reasons why medium to large particles influence total emissions levels in a
fluidized bed is not understood completely. Some researchers suggest that larger
-180- -

particles influence emissions rates due to attrition (formation of fines) (Fletcher
1995), while others suggest that larger particles have negligible attrition and therefore
would not influence emissions levels (Santana et al. 1999). However, as the model
neglects attrition, the sensitivity analysis indicates that medium to coarse particles do
influence emissions rates in other non-attrition ways. One possible reason is that as
this size range was shown in Figure 9-5 to have the highest entrainment rate, it is
likely that particles of this size are small enough to be influenced by changes in gas
velocity although they are the optimal particle size for use in a FCCU. The fact that
this model is built using published models from other researchers, may result in
unforeseen interactions due to assumptions or other errors within each of the sub-
routines used.
The New Morris Method also indicates that these medium sized particles (parameters
3, 4, 5 and 6) have several key interactions in the bed, especially with the velocity and
density terms. This suggests that in a physical sense, the medium particles could be
lifted out of the bed and emitted depending on the density or gas velocity present. As
particles in the 40 to 200µm size range (parameters 3, 4, 5, 6 & 7) interact with the
velocity parameter, this indicates that at high velocity levels, considerably larger
particles than normally considered, can be emitted from the unit. As only particles in
the 60 to 80µm size range (parameters 5 & 6) interact with density, the reduction or
gain of particle density appears to be important only for a very narrow size range of
particles.
The sensitivity of air emissions, gas velocity and particle density is understandable.
For particles to be emitted from the system, they must first be entrained from the
fluidized bed and carried up in the gas stream and through the cyclones. An increase
or decrease in either the density of particles or the gas velocity will alter both gravity
and drag forces acting on a particle and the forces inside the cyclones, allowing
fluctuations in emissions rates.
The low sensitivity seen in the feed rate (10) and shape factor (12) is reasonable, as
feed rate and shape factor are not normally considered important in terms of
emissions. In terms of other low ranking parameters such as the fine particles (8 and
-181- -

9), their lack of sensitivity does not necessarily indicate that these parameters are not
influential towards emissions rates, in a physical or operational sense. It is possible
that there may be less variation possible in their parameters, due to the upper and
lower bounds set in the model. As the upper and lower bounds are based on actual
and realist operating conditions, the lack of sensitivity towards finer particles is
possibly due to the fact that the majority of finer particles are already emitted under
reasonably low velocity conditions. As seen in Figure 9-7, emissions levels of
smaller particles are initially so great, there is little room for emissions rates of fine
particles to change. It may be possible to alter the boundary conditions to artificially
increase the sensitivity rankings of fine particles, but there is little point to this
exercise as the conditions represented will be one not normally seen in industry.
The calculated emissions rates from the stage 1 model are much higher than actual
samples taken during operation of a FCCU. It is assumed that the main reasons for
this are two-fold: errors in the model and errors in confirmation data. The main
sources of errors in the model are believed to be the lack of a feedback loop for
collected material, the use of 8 discrete particle classes and the lack of an accurate
way of determining the shape factor for the catalyst in the system.
In conjunction with the sensitivity results, trends can also be seen in the model output,
which help to explain how emissions levels are affected inside the FCCU. The spike
in emissions rates for particles in the 40 -60µm size fraction (Figure 9-7 and 9-8) is
believed to be caused not by a decrease in cyclone efficiency, but through an
increased amount of that size fraction in the cyclone. The 40-60µm size faction is the
first size fraction that is significantly increased by an increase in bed velocity. Thus,
assuming constant cyclone removal rates, a larger increase in the amount of material
reaching the cyclones corresponds to a larger number exiting.
The emissions rates obtained using various bed velocities indicate that increasing the
bed velocity may not lead to the largest emissions rates. It can be seen from Figure
9-7, that an increase in bed velocity to around 1m/s will actually decrease emissions
levels in the primary cyclone. This may be due to the relationship between cyclone
removal rates and inlet velocity. As velocity in the bed increases, more particles are
-182- -

carried up into the gas stream, leading to high loading rates in the cyclone, and high
velocities, which in turn increase the removal efficiencies, causing less emissions to
occur (Fassani and Leonardo Jr 2000). This theory, that increased loading rates
actually decreases emissions is supported by the fact that only the primary cyclone,
with its larger loading rates, and not the secondary cyclone, experience reduced
emissions for larger velocities. However, beyond the 1m/s bed velocity, emissions
levels again increase, as the shear volume of material flowing into the cyclone
exceeds the increase in cyclone efficiency.
As the model does not directly take into account loading effect, it is likely that gas
velocity is the most important. This is supported by the sensitivity analysis, which
indicates that emissions levels are sensitive to velocity (Figure 9-9). The relatively
large lambda values for most 2-factor interactions with velocity (Figure 9-10) further
supports this idea that velocity fluctuations can increase or decrease emissions levels
(Whitcombe et al. 2002e).
9.4.3 Sensitivity Results: Stage 2 Model
The stage 1 model was adjusted to include an attrition term as well as a feed back
loop from the cyclones. This stage 2 model was then run using the initial conditions
from the industrial FCCU as well as for the experimental regenerator used in the
previous chapter. The mean values for the first order sensitivity results for both
modelled conditions are given in Figure 9-11. Overall both modelled conditions
produced similar results with the gas velocity (1), 1 and 5µm particle size classes (9
and 8) and finally the density parameter (11) being sensitive to emissions rates.
Although these parameters were all calculated to be sensitive, the experimental
conditions produced a higher ranking for velocity, 1µm sized particles and the particle
density compared with the industrial conditions. Again it is not the value of the
sensitivity but the rank which is important. The sensitivity values obtained for the
second model are higher than those obtained from the first model. This is due to the
random starting point that the SA uses and does not alter the results.
-183- -

Figure 9-11: Mean values for first order SA results for the industrial and
experimental initial conditions.
Figure 9-12: Standard deviations for the first order SA results for the Industrial and
experimental initial conditions.
Standard deviations for the first order sensitivity analysis are shown in Figure 9-12 for
both modelled situations. Again the gas velocity (1), 1 and 5µm particle size classes
-184- -

(9 and 8) and finally the density parameter (11), generated the highest ranking in
terms of sensitivity to the emissions rate. The experimental conditions produced
higher values for sensitivity compared with the industrial conditions.
The second order mean value (or lambda) for the industrial and experimental
conditions are shown in Figure 9-13 and 9-14, respectively. The industrial conditions
show interactions between gas velocity (1), the 1, 5 and 20µm sized particles (9, 8,
and 7) and particle density (11). Overall the interaction between particle density and
the 1µm sized particle (9, 11) and gas velocity (1,11) are the most significant. Again
the results for the experimental conditions are similar but with gas velocity having a
higher level of interaction with other parameters.
Figure 9-13: Mean values (Lambda) for the second order SA results for the Industrial
initial conditions
-185- -

Figure 9-14: Mean values (Lambda) for the second order SA results for the
Experimental initial conditions.
The second order standard deviations, which indicate third order effects, for the
industrial and experimental conditions are shown in Figure 9-15 and 9-16,
respectively. The same pattern is shown with high interactions between the gas
velocity, particle density and the 3 finest size fractions (1, 5 and 20µm). Particle
density also appears to interact with the fine particle sizes in the industrial system but
to a lesser degree in the experimental system.
-186- -

Figure 9-15: Standard deviation of lambda (second order SA) results for the
industrial condition.
Figure 9-16: Standard deviation of lambda (second order SA) results for the
experimental condition.
-187- -

The SA results of the updated model clarify the influential parameters in the system.
Overall, the sensitivity analysis indicates that the emissions are most sensitive to the
bed velocity, the fine particle sizes (factors 1 and 5µm) and particle density and is
insensitive to the mid sized particles (factors 5, 6 and 7) identified in the preliminary
assessment. These results support the theory that velocity, particle density and the
fine particles are the most sensitive in terms of influencing emissions rates. Both
modelled conditions produce similar results, although the exact sensitivity of
parameters does vary. As the model is essentially the same for both cases, with only
the physical dimensions of the system changing, these results indicate that the over all
sensitivity of aspects of fluidized beds may be influenced by physical dimensions of
the system.
In terms of first order interactions, both models indicate the same relative levels of
sensitivity to input parameters for the predicted emissions level. However, under
industrial conditions the input parameters interact with each other, in terms of higher
order effects to a greater extent than when using the experiential conditions. This
increase in the second order effects is illustrated through the comparison of Figure
9-13 and 9-14. Figure 9-13 has a higher degree of interaction between gas velocity,
particle size and density parameters than shown in Figure 9-14. The same trend is
seen in Figure 9-15 and 9-16 where again the industrial conditions indicate a greater
degree of third order interactions.
In a physical sense, the interaction of the particle density, gas velocity and smaller
particle sizes relates to the ability of particles to be removed from the bed and the rate
at which attrition occurs. The original SA work outlined previously and by
Whitcombe et al (2002e) showed a mid range of parameter sensitivities (mid sized
particles), which is not seen in this upgraded model. This suggests that the addition of
the attrition tem has led to an increase in sensitivity of the model towards the smaller
particle sizes and gas velocity whilst reducing the influence of the mid sized particles.
One reason for this is that at high gas velocities, particle attrition is likely to produce a
significant amount of fine particle emissions, thus reducing the influence of other
parameters.
-188- -

The sensitivity of air emissions towards gas velocity and particle density is
understandable. For particles to be emitted from the system, they must be first
entrained from the fluidized bed and carried up in the gas stream and though the
cyclones. An increase or decrease in either the density of particles or the gas velocity
will alter both forces acting on a particle and the forces inside the cyclones, allowing
fluctuations in emissions rates. The low sensitivity seen in the larger sized particles
(parameters 2 ,3 and 4) as well as the shape factor (parameter 12) is reasonable, larger
sized particles and shape factor are not normally considered important in terms of
emissions.
9.4.4 Genetic Algorithm Results
Optimised parameter values for the minimisation of particle emissions were generated
using the genetic algorithm and are presented in Table 9-3. Results are the average
value obtained from 10 separate runs from different initial points of the GA program.
Table 9-3: Optimal operating conditions to minimise particle emissions from the
stage 2 model using both Industrial and Experimental initial conditions determined
from the Genetic Algorithm, including coefficient of variance.
Parameters Experimental Conditions Industrial Conditions
Average CV (%) Average CV (%)
Emissions rate (mg/m3) 13.04 1.51 4.61 2.52
Velocity (m/s) 0.40 12.10 0.32 15.55
200µm particles (%) 11.43 60.65 9.54 39.39
150µm particles (%) 18.92 42.99 20.79 52.96
100µm particles (%) 18.32 93.77 22.35 69.09
70µm particles (%) 47.20 53.19 37.08 54.30
40µm particles (%) 46.61 51.95 17.36 51.93
20µm particles (%) 9.38 39.51 5.71 15.50
5µm particles (%) 1.08 10.66 1.03 3.61
1µm particles (%) 1.00 0.15 1.02 2.44
Feed Rate* - - - -
Cat Density (kg/m3) 1681.35 0.83 1659.23 2.13
Shape Factor 0.63 15.61 0.88 12.42
* Feed rate was not considered in this GA as this parameter is used to control processes inside the FCCU and is therefore fixed due to operational constraints.
-189- -

The minimised rate of particle emissions was calculated as 4.61 mg/m3 for the
industrial conditions and 13.04 mg/m3 for the experimental conditions. The predicted
value compared well in the experimental case with the actual emissions range shown
in Figure 8-2, from approximately 90mg/m3 to 5mg/m3. However the GA was very
poor in predicting the optimal emissions level for the industrial regenerator as the
final emissions sample taken 2 weeks after the start up (Figure 4-2) was
approximately 70mg/m3. Obviously the low optimal emissions rate predicted for the
industrial system is caused by the low optimal velocity of 0.3m/s, about half the gas
velocity actual used in the regenerator. This low optimal velocity will lower the
emissions rate as seen in the emissions rate vs gas velocity plots presented in Figures
8-14 and 8-15.
The low coefficient of variation (CV), indicates parameter sensitivity at the optimal
value is found in a narrow range. The velocity, 5 and 1µm sized particles, catalyst
density and shape factors are shown in Table 9-3 to be sensitive
When the SA results are compared to the GA results, some interesting trends are seen.
Firstly, the large values for the coefficient of variance obtained from the GA runs for
the larger sized particles (parameters 2, 3 and 4) indicate that a large range of these
parameter values can be used to minimize the emissions results, ie they are not
sensitive. This supports the SA results that these factors are not influential in
controlling particle emissions. Of interest is that the optimal shape factor was 0.66
and 0.88 for the experimental and industrial conditions respectively. This indicates
that a round but not perfectly spherical particle is the preferred shape to minimize
emissions in the industrial system. However, an irregular particle shape is optimal in
the smaller experimental fluidized bed. No reason can be given to explain this.
-190- -

9.4.5 Comparison to Actual Data
Figure 9-17: Predicted emissions rate vs time for experimental conditions using
different elutriation correlations.
The predicted emissions rate over time for the experimental system is shown in Figure
9-17. As mentioned earlier, several elutriation correlations are used in the model to
predict overall emissions. To determine whether the over prediction of the emissions
rate was determined by one of these elutriation correlations, the model was run using
the standard configuration (averaging several correlation) and compared with using
the newest correlation developed by Tasirin and Geldart (1998a). It appears that the
model predicts the overall emissions from the laboratory scale FCCU with a
reasonable level of accuracy, in terms of trends but over predicts the actual emissions
rate. The newer elutriation correlations developed by Tasirin and Geldart (1998a) was
the most accurate in terms of predicting the actual trends of the emissions with
predicted results between 120 to 100mg/m3. This result compares well to the lab
results presented in Figure 8-2, where particle emissions fluctuated between 90 and
5mg/m3. Although this may seem excessive it is well known in the literature that
fluidized beds models are notoriously poor at predicting realistic results in situations
outside of those for which they were developed (Milioli and Foster 1995b).
-191- -

Figure 9-18: Predicted emissions rate vs time for industrial condition using various
elutriation correlations.
As mentioned previously, a number of elutriation correlations were used to allow the
model to calculate an average elutriation rate, before moving on to other calculations.
To test which correlation best predicts emissions rates in an industrial setting, the
model was run using the average and the elutriation rate calculated from the Tasirin
and Geldart (1998a) equation, with results presented in Figure 9-18. The model
predicts the lowest emissions rate with Tasirin and Geldart (1998a) correlation
predicting the highest at over 11000 mg/m3. From Stack tests conducted during the
start up (refer to Chapter 4), FCCU emissions ranged from a peak of approximately
1000mg/m3 to a low of approximately 100mg/m3, well below the results predicted
above.
To identify possible reasons for the over estimation of emissions, the stage 2 model
using industrial FCCU conditions was tested without an attrition term. Results are
presented in Figure 9-19. Removing the attrition term from the model generates
predicted emissions rates of approximately 850mg/m3, using the average elutriation
rate constant and approximately 1350mg/m3 using the Tasirin and Geldart (1998a)
correlation.
-192- -

Figure 9-19: Predicted emissions rates from the industrial conditions without attrition
The predicted rates of attrition for the three predominant attrition sources (bubble, jet
and cyclone) are presented in Figure 9-20. The total rate of attrition is relatively
steady at just above 0.41 kg/s, comprising mainly cyclone attrition. The other two
forms of attrition, bubble and jet attrition are relatively low at below 0.01kg/s.
Figure 9-20: Predicted attrition rates for the three predominate attrition sources.
-193- -

To test the influence of the attrition terms on the sensitivity of the output, each of the
three attrition co-efficients (bubble, cyclone, jet) were altered, with the model run
again to determine emissions rates. This process was conducted firstly by altering
each attrition term individually, and then by altering all of them by the same amount,
thus either increasing or decreasing the influence of attrition on total emissions rates.
Due to the influence of the cyclone attrition term, there was no difference between the
results obtained when each attrition term was altered individually, and when they
were all altered by the same amount together. For this reason only results obtained
when all three attrition terms were altered together are shown.
Due to the small size of the attrition coefficients (cyclone, 1.22*10-3, bubble 45x10-9
and jet 52.6x10⁻⁶), the software could not be used to optimized the value of each
attrition term to produce the minimal emissions rate. For this reason only total
emissions rates and sensitivity rankings were compared. There was no change in the
sensitivity rankings of the operational parameters due to the alteration in the attrition
terms as seen with the first and second order results presented in Figure 9-21, 9-22
and 9-23, respectively.
Figure 9-21: The mean first order sensitivity results for altered attrition terms
-194- -

Figure 9-22: The first order standard deviation results for altered attrition terms
Figure 9-23: The second order lambda sensitivity results for the altered attrition
terms.
Although the comparisons between the first model and second model indicate that the
addition of an attrition term does affect the sensitivity of operating parameters
towards air emissions, the previous three figures indicates that sensitivity is
independent of the actual attrition constants used in the modeling process. This
-195- -

means that the level of attrition will not alter the underlying relationships between the
operating parameters but only the physical quantity of emissions generated in the
system.
To gauge the importance of the attrition terms on the physical quantity of catalyst
emitted from the system, the model was run using altered attrition co-efficients.
Unlike the previous sensitivity results, each of the attrition co-efficient were altered
independently of each other to gauge the most important attrition source in terms of
minimizing air emissions. In this way, one of the three attrition terms was increased
or decreased by a fix amount, while the other two remained at their normal level, and
the model was run to calculate the total emissions rate from the stack. Results of the
model for each attrition terms are given in Figure 9-24.
Figure 9-24: Total emissions rates predicted from the model when each attrition term
is altered by a fixed amount. From Figure 9-24 it is clear that the cyclone attrition term is the most important in
minimizing emissions. When the cyclone attrition term is increased by a factor of 10,
whilst all other attrition terms are maintained at their normal rates, the total emissions
rate from the system jumps from just above 5000mg/m3 to just under 9000mg/m3.
Alternatively, altering the bubble or jet attrition terms, has little impact on over all
emissions rates. This supports the findings presented in Figure 9-20 that cyclone
-196- -

attrition contributes the majority of attrition forces. Although the GA could not
optimize the attrition co-efficients, reducing the cyclone attrition term, produced a
leveling out of the emissions rate to approximately 2500mg/m3, which is half of the
original optimization of the model using the normal attrition terms, indicating that
accuracy of the model could be greatly improved by a better understanding of cyclone
attrition in an industrial setting (Whitcombe et al. 2003b).
To gauge how accurate the model is in terms of predicting changes in the particle size
distribution in the fluidized bed, modelled results were compared with actual catalyst
samples obtained from the experimental laboratory system used in Chapter 8. The
changes in the actual and predicted PSD are shown in Figure 9-25. The PSD after the
laboratory experiments is compared with the PSD obtained from the stage 2 model
using laboratory conditions. All elutriation correlations produce similar PSDs and
compare well with that determined by experimentation. All predicted values are close
to the actual, until the 200µm particle size. At this point the predicted vs actual PSD
curves deviate with a lower concentration of the larger particle present compared with
predicted.
Figure 9-25: Predicted and actual PSD obtained from running the stage 2 model and
the experimental regenerator.
-197- -

9.5 General Discussions
Overall, the model predicted the final emissions rate of the laboratory regenerator
reasonably well. As expected the newer elutriation correlation developed by Tasirin
and Geldart (1998a) was the best correlation for the smaller laboratory system. The
attrition equation also appears to work well with predicted emissions being similar to
what was found from the laboratory experiments. Emissions rates from the
experiments were initially very high before decreasing rapidly, with a semi steady
state being reached after some time. The model appeared to predict this reduction in
emissions rates over time reasonably well.
Although the model appears to be accurate in terms of experimental conditions, it
grossly over estimates the actual emissions under industrial conditions. The model
predicted values in excess of 11000mg/m3, well above the maximum rate determined
during the stack testing outlined in Chapter 4. The high level of error was not
expected as the model worked well for the experimental conditions.
Concerns regarding the robustness of the different correlations developed in the
literature are well founded, as the stage 2 model breaks down under the industrial
conditions. The removal of the attrition term caused the model to better predict the
emissions from the industrial regenerator, although they were still relatively
inaccurate compared with the results obtained from the experimental conditions. It
appears that the model predicts the highest emissions rate seen during a start up and
not the rate that would be considered during steady operations. Of interest, the newest
elutriation correlations used (Tasirin and Geldart, 1999a) actually preformed the worst
in being able to predict emissions from a large scale fluidized bed. This suggests that
although correlations have been developed using experimental fluidized beds, they
have not increased the accuracy of the predictions when used on much larger
industrial sized fluidized beds.
Isolating the attrition term showed that it was actually the cyclone attrition rate which
was being over estimated, leading to the excessive emissions being predicted. As the
attrition calculation was derived using a small experimental fluidized bed (Werther
and Reppenhagen 1999), it is likely that the attrition equations are unable to predict
-198- -

accurately the attrition rates in larger scale devices. Again, this suggests that the
correlations accurately developed on a small scale system are inaccurate when dealing
with the larger system. As the attrition model was developed using FCC catalyst and
was tested on a smaller scale system, it is obvious that larger scale industrial cyclones
have considerably less attrition then smaller scale systems. This is a result not
directly discussed in the literature and one that is not mentioned when dealing with
the modeling of air emissions from fluidized beds (Whitcombe et al. 2003b). It must
also be noted that particle generation through thermal fracturing has also not been
incorporated in the attrition terms used in the model.
In terms of predicting the change in the particle size distribution, the model is
relatively accurate. The shift in the before and after PSD curves is very similar for all
of the correlations as well as the actual PSD after running. The only inaccuracies
were observed in the 200µm and greater size range, with a lower concentration of
these particles actually present than predicted. This is likely to occur because the
attrition component assumes that larger particles are not broken, when in reality the
results shown in chapter 6 indicate that larger particles are indeed broken into several
mid sized particles, lower their concentration in the bed.
9.6 Conclusion
With the use of mathematical modeling is has been shown that particle emissions are
heavily linked to the gas velocity, concentration of fine particles and the particle
density. The inaccuracies of both the elutriation and attrition equations are the likely
cause of the inaccuracies of the model and the increased sensitivity of parameters seen
under industrial conditions. This said, the trends and interactions observed through
the model should still be valid. This theory is supported by the lower predicted
emissions rates for the smaller experimental system. As the objective of this chapter
is to identify significant parameters which influence emissions, the possible over
estimation of attrition is not of concern.
The genetic algorithm results support the findings of the sensitivity analysis and also
indicate that the model is less accurate in predicting emissions from the larger system.
It has also been shown that the particle shape and feed rate of material into the system
-199- -

does not influence the emissions rates. The use of sensitivity analysis coupled with a
genetic algorithm has enabled a better understanding of how emissions are influenced
by operational parameters. This indicates that start up emissions could be heavily
induced by fluctuations in the gas velocity during the bed filling stage. Also the
presence of fines due to attrition and particle fracture would quickly increase
emissions. The sensitivity of the particle density and the different optimal shape
factors, indicate that the deposition of metals would directly influence the particle
emissions rate from the regenerator.
As a secondary point, it was found that the current correlations found in the literature
are reasonably accurate for smaller sized fluidized beds, however their accuracy is
reduced when dealing with large industrial systems. It was also found that attrition
correlation was not very useful when dealing with larger sized systems as it over
estimated the real rate of cyclone induced attrition. This has wider implications for
the refinery as standard equations/correlation which are used may not provide
accurate assessments of a operational FCCU.
-200- -

10 Conclusions and Recommendations The concerns of the refinery that particle emissions are greatest during the start up of
a FCCU have been supported by this work. A detailed review of the literature
revealed a lack of knowledge regarding FCCU emissions and more specifically the
emissions during a start up. A detailed air sampling procedure was conducted to
investigate what factors are actually causing FCCU emissions during start ups. Stack
emissions were collected during a standard start up, and analysed to determine the
particle size distribution and metal concentration of the emitted material. It was found
that the emissions rate fluctuated in terms of quantity and composition over the start
up period. Three distinct stages of emissions were discovered, initially a high
concentration of larger particles, followed by a peak in the very fine particles and
finally a reduction of particle emissions to a more steady or normal operational state.
Concentration of metal emissions also varied with a steady increase of metal
containing particles before a sudden drop, which occurred just prior to the system
becoming operational. Once the unit became operational the metal emissions peaked
rapidly, before slowly reducing to a more steady state level.
The variation in particle emissions was caused by operational conditions, hardware
design and catalyst characteristics. Fluctuations in the gas velocity through the
system altered the ability of the cyclones to collect catalyst material. Also, the low
bed level allowed air by pass to occur more readily, contributing to the increased
emissions levels seen during the initial stage of the start up. Reduced fluidity
characteristics of the e-cat also affected the operations of the diplegs, altering the
collection efficiency of the cyclone. During the loading of catalyst into the system,
abraded material is quickly lost due to its particle size, contributing to fine particle
emissions levels. More importantly, thermal fracturing of catalyst particles occurred
when the cold catalyst was fed into the hot regenerator. Catalyst particles split
causing the generation of large amounts of fine particle material, which is easily lost
from the system. This loading of catalyst is directly linked to the period of high
concentration of fine particles in the emissions stream.
-201- -

In terms of fluctuations in the metal concentration found in the emissions, there is
direct link between the metal levels in the emissions and the deposition of metals onto
the catalyst particle from the feed stock. It was found that metals, and in particular
iron, calcium and silicon form a thick layer on the outside of the catalyst, with large
irregular shaped metal ridges forming along the surface of the particle. These ridges
reduce the fluidity of the catalyst, leading to potential disruptions in the regenerator.
In addition to this, the metal rich ridges are preferentially removed via attrition,
causing metal rich material to be emitted into the atmosphere.
The following recommendations are made for the reduction and management of
FCCU particle emissions under start up and normal conditions.
♦ The refinery should only use calcinated catalyst to reduce the influence of thermal
processes which cause particle fracture and aerosol generation. Although the
calcinated catalyst will undergo particle fracture when added to the hot system, it
is far less than that obtained with uncalcinated catalyst.
♦ The refinery should consider reducing the temperature gradients between the hot
and cold catalyst. Due to the economics involved with the regenerator, possible
pre-warming of catalyst before addition into the system is the preferred option.
♦ Prior to being re-fed into the regenerator, e-cat particles should under go pre-
treatment. This treatment should involve controlled attrition to remove the build
up of metals on the surface of the particles, and collecting this metal rich material
before it can be released into the atmosphere. The remove of the metal crust will
also improve the fluidity of the system and reduce the chance of occurrence of
catalyst blockages. Although beyond the scope of this project, additional benefits
may be achieved though the removal of the metal rich surface, such as an increase
in catalyst activity or better yield structures being achieved; more work is needed
to test this hypothesis.
♦ The modelling of the system has shown that control of key parameters such as
particle size, density and gas velocity are essential to the management of air
-202- -

emissions. The refinery should look at adjusting start up procedures to remove
fluctuations in these key parameters and investigate the viability of using a denser
catalyst. Also the refinery should be careful in using correlations found in the
literature to predict operational conditions for their system. As it was found that
often the newer correlations based on small scale experimental data are less
accurate than older models, when applied to industrial plants.
♦ The refinery should consider additional end of pipe technologies to further treat
the flue gas stream if continually high emissions rates are experienced. Wet
scrubber and electrostatic precipitators are currently used in the USA and may be
a viable long term option.
♦ Although outside the scope of this thesis, the refinery should consider evaluating
the use of additional technologies to improve the cyclone and dipleg performance.
The use of cyclone vortex finders, expanded freeboards or better mechanical
valves on the diplegs are some possibilities that should be considered.
Further experimental work identified by this thesis includes
♦ Catalyst manufactures should investigate changes in the particle size distribution
of the catalyst to reduce the quantity of larger particles prone to thermal
fracturing.
♦ Investigation into how catalyst particles deactivate, and in particular if e-cat can
be reactivate through attrition should be undertaken. This will help reduce catalyst
usage and reduce metal emissions from refineries.
♦ Further work should be conducted to identify the exact cause of thermal fracture
in fresh catalyst and e-cat.
♦ More research is needed into the toxicity of spent catalyst and airborne catalyst
particles
-203- -

♦ Research is needed to investigate the relationship between the elasticity of catalyst
particles and the effect heating and cooling has on particle fracture.
♦ Further work is needed to investigate whether the changes in the Al / Si ratio of
fresh catalyst and e-cat can be used to predicted the age or activity of the e-cat
particle.
♦ A more representative way of modelling attrition sources in large scale systems is
needed. Of concern is the lack of accuracy of current models in predicting
attrition in large cyclones.
♦ More research is needed into the fusing of e-cat particles observed in this thesis.
It is unclear if fused particles are stronger than normal particles or for how long
they remain in the system.
♦ Further work is needed to try and optimise the catalyst voidage and shape factors
to allow better fluidity inside the system.
-204- -

References Abrahamsen, A R and Geldart, D, 1980. Behaviour of Gas-Fluidized Beds of Fine
Powders Part I. Homogeneous Expansion. Powder Technology 26: 35-46.
ACIL, 1997. Turning Point or Crisis, A Study of the Australian Oil Refining and
Marketing Industry. Australian Institute of Petroleum: Australia.
Agranovski, I and Whitcombe, J, 2001. Study of Emissions Rate from Fluidized
Catalytic Cracker Units During Start up Situations. Journal of Aerosol Science
32(S1): S625-S626.
Agranovski, I E and Whitcombe, J M, 2002. Study of Emissions Rates from Fluidized
Catalytic Crackers During Start up Situations. Oil & Gas Science and
Technology In Press.
AKZOCHEM, 1998. Material Safety Data Sheet: Fluid Catalytic Cracking Catalyst.
AKZOCHEM: Australia: 1.
Alley, R, 1998. Air Quality Control Handbook, (McGraw-Hill: USA).
Anderson, J R 1983a. Section 2: Catalyst by Metals and Alloys. Catalyst in Petroleum
and Petrochemical Processing. CSIRO. Australia, CSIRO Division of Material
Science & The Australian Institute of Petroleum.
Anderson, J R 1983b. Section 3: Catalyst by Metal Oxides. Catalyst in Petroleum and
Petrochemical Processing. CSIRO. Australia, CSIRO Division of Material
Science & The Australian Institute of Petroleum.
Anonymous, 1992. Modern Refinery Operation & Practice - 1993. Hydrocarbon
Publishing Company: USA.
-205- -

Armengol, C and Germain, J, 2000a. Worldwide Review 1: Growth Rate in E&P
Investments Slowed to 3% since 1998. Oil and Gas Journal 98(11): 36-38.
Armengol, C and Germain, J, 2000b. Worldwide Review - Conclusion: Cost
Reduction yet to Pull Refiners out of Doldrums. Oil and Gas Journal 98(14):
45-46.
Baraletta, B J and Barbosa-Canovas, G V, 1993. An Attrition Index to Assess Fines
Formation and Particle Size Reduction in Tapped Agglomerated Food
Powders. Powder Technology 77: 89-93.
Barsukov, O V, Nasirov, R K, Artemova, N B and Toptygina, L A, 1998. Mechanical
Strength, Activity, and Integrity of Cracking Catalysts under Service
Conditions. Chemistry and Technology of Fuels and Oils 34(4): 235-240.
Bin, A K, 1994. Prediction of the Minimum Fluidization Velocity. Powder
Technology 81: 197-199.
Bozzola, J J and Russell, L D, 1992. Electron Microscopy: Principles and Techniques
for Biologists, Jones and Bartlett Publishers: USA.
Brown, G W, 1990. Direct Measurements of Fcc Fluidizability Helps Spot Problems.
Oil and Gas Journal Jan 18: 46-49.
Bryant, G, 1998. Affidavit. (Land and Environment Court of New South Wales:
Australia.
Byrkit, D R, 1987. Statistics Today: A Comprehensive Introduction, Benjamin
Cummings: USA.
Caltex, 1995. Ampol Refinery Brisbane, S. V. Productions: Toowoomba.
Caltex, 1998. Ampol Attachment to 1998 Annual Return for Ampol Refineries
(Q'land) Environmental Authority No. Sr439. Unpublished: Australia.
-206- -

Caltex, 2000. Internal Report, Lytton Refinery: How the Refinery Works.
Unpublished Internal Report: Caltex Oil Refinery: Brisbane.
Campolongo, F and Braddock, R, 1999. The Use of Graph Theory in the Sensitivity
Analysis of the Model Output: A Second Order Screening Method. Reliability
Engineering and System Safety 64: 1-12.
Carpenter, C R, 1983. Calculate Settling Velocities for Unrestricted Particles or
Hindered Settling. Chemical Engineering 90(23): 227-231.
Choi, J-H, Chang, I-Y, Shun, D-W, Yi, C-K, Son, J-E and Kim, S-D, 1999.
Correlation on the Particle Entrainment Rate in Gas Fluidized Beds. Ind. Eng.
Chem. Res. 38: 2491-2496.
Clift, R 1986. Hydrodynamics of Bubbling Fluidized Beds. Gas Fluidization
Technology. D. Geldart. UK, John Wiley & Sons: 53-96.
Cooper, C D and Alley, F C, 1994. Air Pollution Control Design Approach,
Waveland Press, inc: USA.
Cropp, R and Braddock, R, 2002. The New Morris Method: An Efficient Second
Order Screening Method. Reliability Engineering and System Safety 78(1): 77-
83.
Davidson, J F, Thorpe, R B, Al-Mansoori, O, Kwong, H, Peck, M and Williamson, R,
2001. Evaporation of Water from Air-Fluidized Porous Particles. Chemical
Engineering Science 56: 6089-6097.
Eagleson, S T and Weaver, E H, 1999. Controlling FCCU Emissions. International
Journal of Hydrocarbon Engineering 4(3): 76-80.
Engelhard, 2000a. Troubleshooting FCC Circulation Problems-Practical
Considerations, Technical Paper. Englehard Corporation.
-207- -

Engelhard, 2000b. How Catalyst Characteristics Affect Circulation, Technical Paper.
Engelhard Corporation.
Engelhard, 2000c. Troubleshooting FCC Unit Circulation and Fluidization Problems,
Technical Paper. Engelhard Corporation.
Ercan, C, Arnold, S C and Barner, H E, 1995. Investigation of Dispersion
Characteristics of a Fluidized Bed Reactor. AIChE Symosium Series, 51-60.
Ergun, S, 1952. Fluid Flow through Packed Columns. Chemical Engineering
Progress 48(2): 89-94.
Evans, R E and Quinn, G P (1993). Environmental Considerations Affecting FCC. in
Fluid Catalytic Cracking: Science and Technology, Studies in Surface Science
and Catalysis, Vol 76. Ed J. S. Magee and J. M. M. Mitchell. USA, Elsevier
Science Publishers B.V.: 563-585.
Ezernack, D D, 1997. Minimize FCCU Startup Problems. Hydrocarbon Processing
76(6): 67-72.
Fassani, F L and Leonardo Jr, G, 2000. A Study of the Effect of High Inlet Solids
Loading on a Cyclone Separator Pressure Drop and Collection Efficiency.
Powder Technology 107: 60-65.
Fletcher, R, 1995. Stepwise Method Determines Source of FCC Catalyst Losses. Oil
and Gas Journal 93(35).
Forzatti, P and Lietti, L, 1999. Catalyst Deactivation. Catalysis Today 52: 165-181.
Fosket, S, 2001. Personal Communications from Akzo Nobel. Akzo Nobel: Australia.
Gauthier, D, Zerguerras, S and Flamant, G, 1999. Influence of the Particle Size
Distribution of Powders on the Velocities of Minimum and Complete
Fluidization. Chemical Engineering Journal 74: 181-196.
-208- -

Geldart, D 1986a. Introduction. in Gas Fluidization Technology. Ed D. Geldart. UK,
John Wiley & Sons: 1-10.
Geldart, D 1986b. Single Particles, Fixed and Quiescent Beds. in Gas Fluidization
Technology. Ed D. Geldart. UK, John Wiley & Sons: 11-32.
Geldart, D 1986c. Characterization of Fluidized Powders. in Gas Fluidization
Technology. Ed D. Geldart. UK, John Wiley & Sons: 33-52.
Geldart, D 1986d. Particle Entrainment and Carryover. in Gas Fluidization
Technology. Ed D. Geldart. UK, John Wiley & Sons: 123-154.
Geldart, D, Broodryk, N and Kerdoncuff, A, 1993. Studies on the Flow of Solids
Down Cyclone Diplegs. Powder Technology 76: 175-183.
Geldart, D and Kerdoncuff, A, 1993. The Behavior of Secondary and Tertiary Stage
Cyclone Diplegs. AIChE Symposium Series: Fluid-Particle Processes
89(296): 162-169.
Geldart, D and Radtke, A L, 1986. The Effect of Particle Properties on the Behavior
of Equilibrium Cracking Catalysts in Standpipe Flow. Powder Technology 47:
157-165.
Geldart, D, Xue, Y and Xie, H Y, 1995. Measurement of Bottom Bed and Transport
Disengagement Heights in Beds of Fresh FCC Catalyst. AIChE Symposium
Series, 93-102:
Gelevan, W D and Siegell, J H, 2000. Combustion Toxics: Available Data and
Additional Needs. Environmental Progress 19(1).
Gilman, K, Eagleson, S T and Weaver, E H, 1999. Technologies for Meeting MACT
II - Controlling FCCU Regenerator Emissions. 16th Annual World Fuels
Conference on Refining and Automotive Technologies, Clean Fuels and Public
Policy: Belco Technologies corporation USA.
-209- -

Goolsby, T L, Moore, H F, Kowalczyk, D C, Johnson, T E, Zampieri, M L and
Bussey, B K, 1997. A New Approach to FCC Unit Optimisation. Refining.
Han, I-S and Chung, C-B, 2001a. Dynamic Modeling and Simulation of a Fluidized
Catalytic Cracking Process. Part I: Process Modeling. Chemical Engineering
Science 56: 1951-1971.
Han, I-S and Chung, C-B, 2001b. Dynamic Modeling and Simulation of a Fluidized
Catalytic Cracking Process. Part Ii: Property Estimation and Simulation.
Chemical Engineering Science 56: 1973-1990.
Hartman, M, Trnka, O and Svoboda, K, 2000. Fluidization Characteristics of
Dolomite and Calcined Dolomite Particles. Chemical Engineering Science 55:
6269-6274.
Heinemann, H 1983. Section 4: Petroleum Processing. Catalyst in Petroleum and
Petrochemical Processing. CSIRO. Australia, CSIRO Division of Material
Science & The Australian Institute of Petroleum.
Hodgson, M, 2000. Refinery Fccu Operating Information. Unpublished: Australia.
Hogue, C, 2000. Two Major Refiners Agree to Cut Air Pollution. Chemical &
engineering News 78(31): 12.
Hutchings, I M, 1993. Mechanisms of Wear in Powder Technology: A Review.
Powder Technology 76: 3-13.
Hyne, R, 1998. Affidavit. (Land and Environment court of New South Wales:
Australia.
Imhof, P and Louwen, J, Undated. Simulation of Attrition under Realistic Conditions.
Akzo Nobel Catalysts.
Johnson, H J, 2001. The Next Battle over Clean Air, Rolling Stone. 860: 48-53.
-210- -

Johnson, J, 2000. Houston Air Is Focus of $20 Million Study. Chemical &
Engineering News 78(45): 32-33.
Karr, C L, Weck, B, Massart, D L and Vankeerberghen, P, 1995. Least Median
Squares Curve Fitting Using Genetic Algorithm. Eng Applic. Artif. Intell 8(2):
177-189.
Kikkinides, E S, Lappas, A A, Nalbadian, A and Vasalos, I A, 2002. Correlation of
Reactor Performance with Catalyst Structural Changes During Coke
Formation in Fcc Processes. Chemical Engineering Science 57: 1011-1025.
Kunii, D and Levenspiel, O, 1969. Fluidization Engineering. John Wiley & Sons
INC.: USA.
Kunii, D and Levenspiel, O, 1991. Fluidization Engineering 2nd. Butterworth-
Heinemann: USA.
Li, H, Hong, R and Wang, Z, 1999. Fluidizing Ultrafine Powders with Circulating
Fluidized Bed. Chemical Engineering Science 54: 5609-5615.
Li, Y, Lu, Y, Wang, F, Han, K, Mi, W, Chen, X and Wang, P, 1997. Behavior of Gas-
Solid Flow in the Downcomer of a Circulating Fluidized Bed Reactor with a
V-Valve. Powder Technology 91: 11-16.
Lin, C, Wey, M and You, S, 2002. The Effect of Particle Size Distribution on
Minimum Fluidization Velocity at High Temperature. Powder Technology
126.
Lin, T D V, 1993. FCCU Advanced Control and Optimization. Hydrocarbon
Processing 72(4): 107-114.
Lippens, B C and Mulder, J, 1993. Prediction of the Minimum Fluidization Velocity.
Powder Technology 75: 67-78.
-211- -

Lloyd, J, 1998. Record of Hearing: EPA Vs Ampol Refineries (Nsw). (Land and
Environment Court of New South Wales: Australia.
Lucas, A, Arnaldos, J, Casal, J and Puigjaner, L, 1986. High Temperature Incipient
Fluidization in Mono and Polydisperse Systems. Chemical Engineering
Communications 41: 121-132.
MacDonald, P D M and Pitcher, T J, 1979. Age Groups from Size Frequency Data: A
Versatile and Efficient Method of Analyzing Distribution Mixtures. 36: 987-
1001.
Matsuda, S, Hatano, H and Tsutsumi, A, 2001. Ultrafine Particle Fluidization and Its
Application to Photocatalytic Nox Treatment. Chemical Engineering Journal
82: 183-188.
McLean, J, 2000. FCC Catalyst Properties Can Affect Cyclone Erosion. Oil and Gas
Journal 98(1): 33-36.
Milioli, F E and Foster, P J, 1995a. A Model for Particle Size Distribution and
Elutriation in Fluidized Beds. Powder Technology 83: 265-280.
Milioli, F E and Foster, P J, 1995b. Entrainment and Elutriation Modeling in
Bubbling Fluidized Beds. Powder Technology 83: 233-243.
Molerus, O and Gluckler, M, 1996. Development of a Cyclone Separator with New
Design. Powder Technology 86: 37-40.
Moulijn, J A, Diepen, A E v and Kapteijn, F, 2001. Catalyst Deactivation: Is It
Predictable? What to Do?. Applied Catalysis A: General 212: 3-16.
Mullier, M A, Seville, J P K and Adams, M J, 1991. The Effect of Agglomerate
Strenght on Attrition During Processing. Powder Technology 65: 321-333.
-212- -

Murphy, M, 1994. Analysis, Calculation Techniques Predict FCC Erosion and
Fluidization. Oil and Gas Journal 92: 54-58.
Nielsen, R H and Doolin, P K 1993. Metals Passivation. in Fluid Catalytic Cracking:
Science and Technology Studies in Surface Science and Catalysis, Vol. 76. Ed
J. S. Magee and M. M. Mitchell Jr. USA, Elsevier Science Publishers B.V.:
339-384.
Pilat, M J, Ensor, D S and Bosch, J C, 1970. Source Test Cascade Impactor.
Atmospheric Environment 4: 671 - 679.
Pratt, K C 1983a. Section 1: Introductory Material. Catalyst in Petroleum and
Petrochemical Processing. CSIRO. Australia, CSIRO Division of Material
Science & The Australian Institute of Petroleum.
Pratt, K C 1983b. Section 6: Catalyst in Synthetic Fuels. Catalyst in Petroleum and
Petrochemical Processing. CSIRO. Australia, CSIRO Division of Material
Science & The Australian Institute of Petroleum.
Preslmaier, R, 2000. Refinery Environmental Testing Results. Unpublished:
Australia.
Rao, T R and Bheemarasetti, J V R, 2001. Minimum Fluidization Velocities of
Mixtures of Biomass and Sand. Energy 26: 633-644.
Ray, M B, Luning, P E, Hoffman, A C, Plomp, A and Beumer, M I L, 1997. Post
Cyclone (Poc): An Innovative Way to Reduce the Emissions of Fines from
Industrial Cyclones. Ind. Eng. Chem. Res. 36: 2766-2774.
Ray, Y C, Jiang, T S and Wen, C Y, 1987. Particle Attrition Phenomena in a
Fluidized Bed. Powder Technology 49: 193-206.
-213- -

Reina, J, Velo, E and Puigjaner, L, 2000. Predicting the Minimum Fluidization of
Polydisperse Mixtures of Scrap-Wood Particles. Powder Technology 111:
245-251.
Rhodes, M, 1998. Introduction to Particle Technology, John Wiley & Sons: Australia.
Rodwell, P, 1998. Internal Report - Caltex, Unpublished: Australia.
Salbilla, D L, 1999. Refiners Have Several Options to Overcome FCCU Opacity
Limitations. Oil and Gas Journal 97(2).
Santana, D, Rodriguez, J M and Macias-Machin, A, 1999. Modeling Fluidized Bed
Elutriation of Fine Particles. Powder Technology 106: 110-118.
Schmidt, P, 1993. Unconventional Cyclone Separators. International Chemical
Engineering 33(1): 8-17.
Schmitt, R, 1991. Fcc Catalyst Finds Three Safe Reuse Outlets in Europe. Oil and
Gas Journal 89(46): 101-102.
Shackelford, J F, 1996. Introduction to Materials Science for Engineers, Prentice-
Hall, Inc.: USA.
Sinclair, P G, Katterson, A M, Klinzing, G E and Bachovchin, D, 1983. An Analytical
Study of Dipleg Flow Stability Using Controlled Non-Mechanical Valve.
Powder Technology 36: 259-266.
Smolders, K and Baeyens, J, 1998. The Transport Disengaging Height in Fluidized
Beds. Powder Handling and Processing 10(1): 27-36.
Stephens, M D, Scott A. MacDonald, N F L and Miller, S A, 1999. Influence of
Particle Size Distribution on Sintering Behavior of Fine Titanium Powders.
Advances in Powder Metallurgy & Particulate Materials - 1999: 3/197- 3/206.
-214- -

Stittig, M, 1978. Petroleum Refining Industry: Energy Saving and Environmental
Control, Noyes Data Corporation: USA.
Tangstad, E, Bendiksen, M and Myrstad, T, 1997. Effect of Sodium Deposition on
Fcc Catalyst Deactivation. Applied Catalysis A: General 150: 85-99.
Tao, Z, 2000. Operational Changes Fix Fccu. Oil and Gas Journal 98(32): 48-53.
Tasirin, S M and Geldart, D, 1998a. Entrainment of FCC from Fluidized Beds - a
New Correlation for the Elutriation Rate Constant K*I. Powder Technology 95:
240-247.
Tasirin, S M and Geldart, D, 1998b. Entrainment of Fines from Fluidized Beds with
an Expanded Freeboard. Chemical Engineering Communications 166: 217-
230.
Tasirin, S M and Geldart, D, 1998c. The Entrainment of Fines and Superfines from
Fluidized Beds. Powder Handling and Processing 10(3): 203-268.
Tenney, E and Gardner, A, 1998. Fluid Catalytic Cracking Cyclone Design and
Modification. Today's Refinery: 23-32.
Theodore, L and Buonicore, A, 1988. Air Pollution Control Equipment Volume 1:
Particulates, CRC Press: USA.
Trimm, D L 1983. Section 7: Mechanism of Catalyst Activity Decay. in Catalyst in
Petroleum and Petrochemical Processing. Ed CSIRO. Australia, CSIRO
Division of Material Science & The Australian Institute of Petroleum.
Trimm, D L 1996. Catalytic Deactivation. in Catalysts in Petroleum Refining and
Petrochemical Industries 1995. Ed M. Absi-Halabi, Elservier Science.
Wang, Z, Kwauk, M and Li, H, 1998. Fluidization of Fine Particles. Chemical
Engineering Science 53(3): 377-1998.
-215- -

Weitkamp, J, 2000. Zeolites and Catalysis. Solid State Ionics 131: 175-188.
Wen, C Y and Yu, Y H, 1966. A Generalized Method for Predicting the Minimum
Fluidization Velocity. AIChE Journal 12(3): 610-612.
Werther, J and Reppenhagen, J, 1999. Catalyst Attrition in Fluidized-Bed Systems.
AIChE Journal 45(9): 2001-2010.
Whitcombe, J, Agranovski, I and Braddock, R, 2003a. Categorisation of Aerosol
Emissions from a Fluidized Catalytic Cracking Unit. Aerosol Science and
Technology Under Review.
Whitcombe, J, Braddock, R and Agranovski, I, 2003b. The Use of Sensitivity
Analysis and Genetic Algorithms for the Management of Catalyst Emissions
from Oil Refineries. MODSIM 2003, MSSANZ: Australia.
Whitcombe, J M, Agranovski, I E and Braddock, R D, 2002a. Study of Aerosol
Composition Emitted from a Fluidized Catalytic Cracker. Sixth International
Aerosol Conference, 831 Chinese Association for Aerosol Research in
Taiwan: Taipei.
Whitcombe, J M, Agranovski, I E and Braddock, R D, 2002b. Generation of Aerosol
at Oil Refineries' Fluidized Catalytic Cracking Units. Sixth International
Aerosol Conference, 793 Chinese Association for Aerosol Research in
Taiwan: Taipei.
Whitcombe, J M, Agranovski, I E and Braddock, R D, 2002c. Impact of Metal
Ridging on the Fluidization Characteristics of FCC Catalyst. Chemical
Engineering & Technology 25(10): 981-987.
Whitcombe, J M, Agranovski, I E and Braddock, R D, 2002d. Identification of Metal
Contaminantes on FCC Catalyst. Oil and Gas Journal Submitted For
Publication.
-216- -

Whitcombe, J M, Agranovski, I E and Braddock, R D, 2003c. Production of Fine
Particles and Aerosols from FCC Catalyst Due to Thermal Shock. Powder
Technology Accepted subject to Corrections.
Whitcombe, J M, Agranovski, I E, Braddock, R D, Gandola, F and Hammond, A,
2003d. Catalyst Attrition and Fracture Due to Thermal Shock in Fluidized
Catalytic Cracker Units. Chemical Engineering Communications In Press.
Whitcombe, J M, Braddock, R D and Agranovski, I E, 2001. Identification of
Operating Parameters Critical to the Reduction of Particlulate Emissions from
Oil Refineries. MODSIM 2001, 1007-1012 MSSANZ: Australia.
Whitcombe, J M, Braddock, R D and Agranovski, I E, 2002e. Application of
Sensitivity Analysis to Oil Refinery Emissions. Reliability Engineering and
System Safety In Press.
Wight, G, 1994. Fundamentals of Air Sampling, Lewis Publishers: USA.
Wu, S Y, Baeyens, J and Chu, C Y, 1999. Effect of the Grid-Velocity on Attrition in
Gas Fluidized Beds. The Canadian Journal of Chemical Engineering 77: 738-
744.
Yang, C, 2000. Female Lung Cancer Mortality and Sex Ratios at Birth near to a
Petroleum Refinery Plant. Environmental Research 83(1): 33-40.
Zenz, F A and Kelleher, E G, 1980. Studies of Attrition Rates in Fluid-Particle
Systems Via Free Fall, Grid Jets, and Cyclone Impact. Journal of Powder &
Bulk Solids Technology 4: 13-20.
Zhao, Z M and Pfeffer, R, 1997. A Simplified Model to Predict the Total Efficiency
of Gravity Settlers and Cyclones. Powder Technology 90: 273-280.
-217- -

Appendix A: Experimental Plans
-218- -

Appendix B: Modeling
Initialization Step
Before the model was run all operating parameters were initialized. This included
such calculations as the average particle size, Reynolds number, drag coefficient and
Archimedes number.
Minimum Fluidization Velocity
The minimum fluidization velocity (Umf) was calculated as a vector, allowing trends
between particle sizes and gas velocity to be seen. The weighted average particle size
was also used to calculate the predicted Umf of the entire bed.
Two equations were used for the calculation of Umf, one for particles smaller than
100µm and the other for particles greater than 100µm (Geldart 1986b).
( )[ ]7.330408.07.1135 2/1 −+= Ard
Upg
gmf ρ
µ,
for use with large particles and
( )066.087.0
8.1934.0934.0
1111 g
pgpmf
dgU
ρµ
ρρ −= ,
for use with small particles.
Bubble size
The surface bubble size is needed in order to calculate the TDH and elutriation
valules. The Darton et al method as discussed in (Clift 1986) was used to
approximate the surface bubble size using the following
( ) ( ) 2.08.04.0, 454.0 −+−= gAzUmfUd oseq ,
where deq,s is the bubble diameter at the bed surface (m), z is the height of bed surface, A0 is
the Area of distributor nozzle (m2), and g is gravitational acceleration (m/s2)
-219- -

Terminal Velocity
The terminal velocity (ut) of each particle and the weighted average was then
calculated. Two methods were used to determine terminal velocity to allow a
comparison to be made.
Haider and Levenspeil Method
The method outlined by Haider and Levenspeil as discussed in Kunii and Levenspiel
(1991) was used to calculate the terminal velocity (ut). Their method comprises three
steps.
Step 1: d , 3/1* Arp =
Step 2: ( ) ( )
−+= 5.0*2*
2
* 744.1335.218
p
tdd
u φ ,
Step 3: ( )
−= 2
*
g
gptt
guu
ρρρµ
.
Where ut is the terminal velocity (m/s), ut* is a transitional velocity used in the
calculations (m/s), d2* is the diameter of the vessel (m) and dp
* is the diameter of the
particle (m).
McCabe and Smith method
The McCabe and Smith (in Carpenter 1983) method for determining terminal
velocities was also used as a check to ensure an accurate calculation. Thus
( ) ( )n
ng
ngp
np
t bgd
v−
−
+
−=
2/1
11
1
34
ρµρρ
,
where:
-220- -

Range b1 ν
K < 3.3 24.0 1.0
3.3 ≤ K ≤ 43.6 18.5 0.6
K > 43.6 0.44 0
( ) 3/1
2
*
−=
µρρρ gpgg
dpK .
The final terminal velocity used for further calculations in the model was the average
of these two methods.
Transport Disengaging Height
As before the transport disengaging height (TDH) is calculated using several different
equations with the average of the results taken.
Amitin Method
The Amitin (1968) method as discussed in Geldart (1986d) calculates TDH(F) which
is the TDH above which entrainment rates are relatively steady. The equation is:
( )UUTDH 102.1 log2.133.785.0 −= ,
where U is gas velocity (m/s).
Fournol Method
The Fournol et al (1973) as discussed in Geldart (1986d) calculates TDH(F) which is
the TDH above which entrainment rates are relatively steady, using
gUTDH
2
1000= .
Horio Method
The Horio et al (1980) as discussed in Geldart (1986d) uses the equation
-221- -
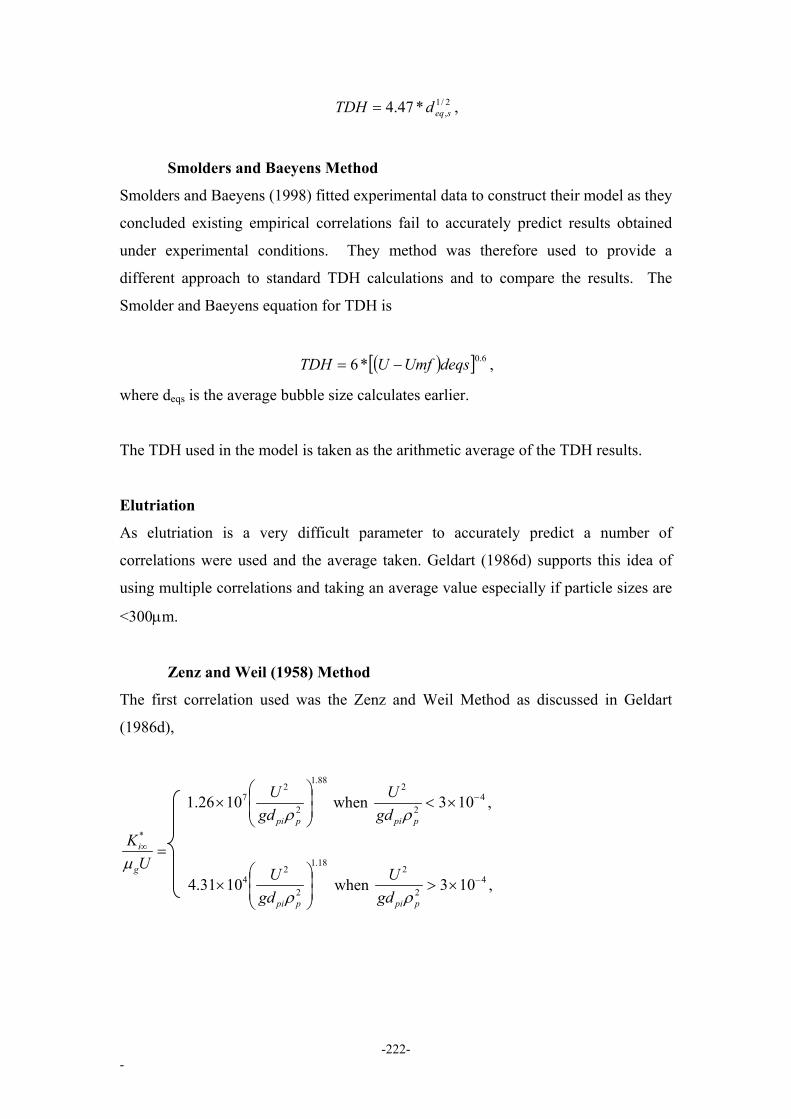
2/1,*47.4 seqdTDH = ,
Smolders and Baeyens Method
Smolders and Baeyens (1998) fitted experimental data to construct their model as they
concluded existing empirical correlations fail to accurately predict results obtained
under experimental conditions. They method was therefore used to provide a
different approach to standard TDH calculations and to compare the results. The
Smolder and Baeyens equation for TDH is
( )[ ] 6.0*6 deqsUmfUTDH −= ,
where deqs is the average bubble size calculates earlier.
The TDH used in the model is taken as the arithmetic average of the TDH results.
Elutriation
As elutriation is a very difficult parameter to accurately predict a number of
correlations were used and the average taken. Geldart (1986d) supports this idea of
using multiple correlations and taking an average value especially if particle sizes are
<300µm.
Zenz and Weil (1958) Method
The first correlation used was the Zenz and Weil Method as discussed in Geldart
(1986d),
88.1
2
271026.1
×
ppigdU
ρ when 4
2
2
103 −×<ppigd
Uρ
,
=∞
UK
g
i
µ
*
18.1
2
241031.4
×
ppigdU
ρ when 4
2
2
103 −×>ppigd
Uρ
,
-222- -

where K*i∞ is the component elutriation rate constant (kg/m2 s), U is superficial gas
velocity (m/s), g is gravitational acceleration (m/s2), dpi is the particle diameter, µg the
viscosity of the gas (kg/m s) and ρp is the density of the particle (kg/m3).
Geldart et al (1979) Method
The next correlation selected was by Geldart et al as discussed in Geldart (1986d),
and was
−=∞
Uv
UK t
g
i 4.5exp7.23*
ρ.
Tasirin and Geldart (1998) Method
The final correlation selected was the method from Tasirin and Geldart (1998a),where
−=∞ U
VUK tgi 4.5exp5.14 5.2* ρ .
This equation is valid only when the flow regime above the fluidized bed is turbulent
(Re> 3000), with respect to the diameter of the column (Tasirin and Geldart 1998a),
which is true for all cases in which the model is used.
Equilibrium Concentration
The equilibrium concentration was determined using a method outlined in Geldart
(1986d). It is assumed for the model that the elutriation rate constant above the TDH
(K*i:) is approximately that of the elutriation rate constant below the TDH at some
height, h (K*ih). This simplifies the calculations and
Tih
FiBi RFAK
Fxx−+
= *
* ,
where xBi is the equilibrium of size fraction, i , xFi is the concentration of size fraction,
i in the incoming feed, F is the feed rate of fresh particles into the bed (kg/s) , A is the
cross-sectional area of the bed surface (m2) and RT is the rate of removal of solids in
that size fraction (kg/s)
-223- -

Rt is calculated iteratively and at the first iterations Rt is assumed to be zero and xBi is
calculated. The entrainment flux above the TDH is then calculated to enable RT to be
found. This uses
Biii xKE **∞∞ = ,
where Ei: is the entrainment flux of solids above TDH (kg/m2s).
From here, RT is calculated by:
AERT ∞= ,
The calculated RT is inserted back into the original equation and a better estimate of
xBi is obtained. Three interations are conducted to determine the equilibrium
concentrations of each size fraction in the bed. The sum of RT divided by the cross
section area then gives the total amount of solids entrained from the bed surface at
equilibrium above the TDH (Geldart 1986d)..
The Ejection Flux
The ejection flux calculates the amount of material coming off the bed surface. The
Wen and Chen equation as discussed in Geldart (1986d) is used to approximate the
ejection flux (entrainment flux at surface), where
( ) 5.25.2
5.05.390 10*07.3
*UmfU
gdeqsA
E g −= −
µρ
,
where E0 is the ejection flux or entrainment flux at surface (kg/m2s).
Geldart (Geldart 1986d) notes that the equation is based on small scale beds and that
it may be unwise to use this equation on a large scale system, although no alternative
was provided.
Cyclones
-224- -

The cut diameter, or the particle size that is 50% removed from the cyclone is
calculated to determine collection efficiencies (Theodore and Buonicore 1988), using
( )gpie
igc vN
Wd
ρρπµ
−=
29
,
where dc is the cut diameter (m), Wi is the cyclone inlet width (m), Ne is the effective
number of gas spirals and vi is the inlet velocity (m/s)
Using the cut diameter the individual particle size fraction collection efficiency is
determined. This allows the actual removal efficiency for each particle size fraction
to be determined, as
( )2/11
pci dd
e+
= ,
where ei is the fraction collection efficiency.
Attrition
The a-priori model outlined by Werther and Reppenhagen (1999) was selected and
used in the second stage of the modelling exercise.
75.32,
33*3
24
6
, *4.5exp****)(**81.3)(****
*** uuu
wAA
udCuumKund
DdCm
i
tii
inc
tfpccmfbb
oror
tfpbjtoloss ∑
−+−+= ρρ&
.
-225- -
Top Related