


Languages
Pages
Legal


Structure, Scale, and Scope
Structure, Scale, and Scope in the Global Computer Industry*
Matthew S. Bothner
Word count: 11,254
* For helpful comments, I thank Peter Bearman, Frank Dobbin, Stanislav Dobrev, Damon Phillips, Paul Ingram, Toby
Stuart, and Harrison White. An earlier version of this paper received the Louis R. Pondy Award from the OMT
Division of the Academy of Management and the Newman Award from the Academy of Management for the best
paper based on a dissertation. Direct correspondence to Matthew Bothner, University of Chicago, Graduate School of
Business, 1101 E. 58th Street, Chicago, IL 60637, [email protected] 773-834-5953

Structure, Scale, and Scope
Structure, Scale, and Scope in the Global Computer Industry
Abstract: Scholars in many fields have often noted that size and diversification raise the
performance of firms in the most significant sectors of our economy. Using longitudinal network
data on the personal computer industry, this paper identifies the main effects and complex
interplay of two attributes of a firm’s role in a system of competitive relations: (a) its size relative
to that of its structurally equivalent rivals and (b) its level of diversification. The results show
first that, net of absolute size, relative size raises sales growth; second, that the main effect of
scope is positive; and third, that the effect of scope follows an inverted U-shaped pattern over the
distribution of relative size. Diversification thus lowers growth when firms are relatively small,
raises growth after a threshold before a maximum, but has a negative effect again for extreme
levels of relative size. Theories of diversification, which have been disparate historically, are
integrated and jointly find support in the analysis.

Structure, Scale, and Scope
Structure, Scale, and Scope in the Global Computer Industry
Scholars in many fields have often claimed that scale and diversification further the
growth of firms in the major sectors of our economy. Fligstein (1990a, 1990b) described the role
of scale in the formation of the U.S. steel industry and underscored the impact of diversification
on firm growth during the Great Depression. Chandler (1990) traced the early expansion of
capitalist firms almost entirely to the advantages of scale and scope. Sugar refiners, aluminum
producers, and automakers all benefited from the economies of size. Makers of dyes and
pharmaceuticals grew by using the same raw materials and machinery to turn out a portfolio of
related products. By Chandler’s account, our economy is the byproduct of firms—General
Motors, Ford, and DuPont—that harnessed the benefits of scale and diversification. What is
thought to have caused the growth of the early titans has also been seen as crucial for the drivers
of today’s economy, such as makers of semiconductors and personal computers. Apple, IBM,
and NEC have enjoyed huge scale economies for years (Brock 1975; Scherer 1996). Compaq’s
creation of the portable market and Dell’s entry into the PC server market exemplify the
importance of widening scope for performance.
In light of the importance of scale and scope for the growth of firms—and thus of
industries and even whole economies—it is surprising that researchers have not yet considered
the effects of scale advantages and diversification jointly in models of firm growth rates.
Whether these factors have unique effects—net of other covariates, such as market size or
managerial skill—remains unresolved. Although scale and scope advantages are often thought to
amplify each other, scholars have not theorized the ways in which they may interact, nor have
they explored their joint effects empirically. Doing so may further illuminate how the effects of

Structure, Scale, and Scope
strategy depend on context, and thus start to resolve tensions in our theories of how firms behave
and perform.
Using a panel of over 400 computer vendors, in this paper I extend the literature on
social structure and economic performance (White 1981; Burt 1992; Podolny, Stuart, and Hannan
1996; Ingram and Roberts 2000) by identifying the main effects and complex interplay of two
features of a firm’s position in a network of competitive relations: its size relative to that of its
strategically proximate rivals and its scope or diversification across market segments. Consistent
with the implications of prior research, the analyses reveal three important findings: first that,
adjusting for absolute size, relative size raises sales growth; second, that the main effect of
diversification on sales growth is positive; and third, that the effect of scope follows an inverted
U-shaped pattern over the distribution of relative size.
In the analyses that follow, I take a structural approach by focusing on the locations of
firms in a network of competitive relations. This marks a departure from studies in economics,
which have modeled firm growth rates without considering the structure of inter-firm rivalry.
Economists have focused on “internal growth,” that is, on how the features of individual firms
raise their performance. Except for considering the impact of acquisitions (Hannah and Kay
1981), the effects of the conduct and performance of a firm’s competitors have been overlooked.
In a classic paper, Edith Penrose (1952:808) noted: “We have every reason to think that the
growth of a firm is willed by those who make the decisions of the firm and are themselves part of
the firm, and … no one can describe the development of a given firm or explain how it came to
be the size it is except in terms of decisions taken by individual men.” Consistent with this
approach, common predictors of growth in the economics literature are size, age, and the number
of manufacturing plants (e.g., Evans 1987).

Structure, Scale, and Scope
Conversely, a main tenet of the sociological approach is that relations among economic
actors—managers, firms, industries, and even nations—shape economic outcomes (Granovetter
1985; White 1981; Burt 1992; Smith and White 1992). White’s (1981; 2001) model of markets,
for example, rests on the claim that the profitability and growth of any firm is driven by the
procurement and production behavior of its competitors. Correspondingly, Smelser and
Swedberg (1994:6) noted that economic sociology is marked by the notion that “other actors
either facilitate, deflect, or constrain individuals’ actions in the market.” This approach has
recently been developed by Uzzi (1996; 1999) in studies pinpointing optimal network structures
and by Ingram and Roberts (2000) in a study clarifying how friendships among rival managers
increase firm performance.
Efforts to clarify how inter-firm connections affect performance have also informed most
if not all analyses of firm growth and decline in sociology. The kinds of external factors thought
to shape growth have been many. They range from global metrics of competition, such as
industry density (Barron, West, and Hannan 1994), to localized metrics of status and
technological crowding (Podolny et al. 1996), to measures as diverse as the depth of competition
faced by a firm over its history (Barnett and Sorenson 1998) to the size of its alliance partners
(Stuart 2000). The theme that unites these studies is an effort to show how social interactions—
competitive, deferential, or collaborative—between organizations shape their future prospects.
Extending this stream of research, I begin by estimating the effect of relative size to see if
scale advantages raise growth. But that aim begs the question, relative to whom? Clarifying who
competes with whom and to what degree is crucial for any field that studies competition.
Economics, corporate strategy, organizational ecology, and structural sociology all have ways of
demarcating the limits of rivalry.

Structure, Scale, and Scope
In economics, markets have been circumscribed on the basis of gaps in chains of
substitute goods (Robinson 1933), price correlations (Slade 1986), and spatial proximity (Eaton
and Lipsey 1989). Students of corporate strategy have used the notion of “strategic groups,”
which have been identified by similarities in performance (Porter 1979), conduct (Oster 1982),
and the beliefs managers have about who their peers are (Porac and Rosa 1996). Ecologists have
argued that the rivalry between two firms rises with their proximity on a given dimension, such as
size (Hannan and Freeman 1977), technology (Barnett 1990), or geographical space (Baum and
Mezias 1992).
Network analysts have also used patterns of resource dependence to define competition.
Burt’s analyses of aggregate markets use measures of structural equivalence to capture
competitive boundaries (Burt and Carlton 1989). Market sectors—such as those of electronic
components and scientific instruments—are defined as structurally equivalent because of their
similar profiles of purchasing from, and selling to, other sectors. Sectors in “compete in the
sense of depending on similar levels of purchases from the same supplier markets and similar
levels of sales to the same customer markets” (Burt 1992:88).
Using Burt and Carlton’s (1989) approach, I identify a firm’s closest rivals by comparing
patterns of shipping computers across markets segments, which are defined by technology,
geography, and distribution channel. Gateway and Dell are thus structurally, or strategically,
similar since they both mostly sell desktops in the U.S. by direct methods. This tack is well
suited to the realities of the computer industry—in which PC vendors compete with those of
similar strategies, who are in their “market space”—and it yields a metric of conduct that is
“clean” performance itself. In measuring relative size, I place ego’s sales over the weighted
average of the sales of its peers, where the weights are the varying levels of structural equivalence
between a firm and its rivals. This approach reflects the stratified nature of most networks (Stuart

Structure, Scale, and Scope
1998) and is suited to the coexistence of competitive overlap and segmentation characteristic of
the computer industry. As I later discuss, in identifying the effect of relative size on growth, this
paper adds to literatures in economics (Sutton 1997) and sociology (Carroll and Hannan 2000),
which have long sought to clarify the nature of the size-growth link, but have yet to reach
consensus (in either discipline) about the effect of size.
But I also use relative size to clarify the complex effects of diversification. The
“specialize or diversify” question is in no way unique to the executive suites of large
organizations; rather, it is ubiquitous to social life, for it confronts individuals and organizations
of almost every kind. Entry-level workers have to choose between “borrowing” the network of a
sponsor and spreading their time and energy over a range of contacts (Burt 1998). Social and
political organizations must weigh the benefits of sticking with their stated mission against those
of diversifying into new activities, which may be vital for their longevity (Zald and Denton
1963). Even as cities court multinational corporations, they have to balance focus on a core
competence with the task of building the cultural institutions that keep firms and workers in the
long run (Kanter 1995).
Since Lawrence and Lorsch’s (1967) work, sociologists often have claimed that such
questions of design and strategy have a contingent answer—that what a firm should do hinges on
the nature of its task environment. Freeman and Hannan (1983), for example, developed a
contingent theory of niche width, which they defined as the diversity of activities in which a firm
involves itself. They showed that broad scope raised life chances only in contexts that were
highly variable and marked by seasonal change. Davis, Diekmann, and Tinsley (1994) linked the
impact of diversification to the institutional environment, demonstrating that the once sacrosanct
strategy of growth by merger was risky in the takeover frenzy of the 1980s. Other studies have

Structure, Scale, and Scope
also started from assumptions about the nature of the environment and then hypothesized the
effect of diversification (e.g., Haveman 1992).
I also take a contingent approach. But rather than assume that the effect of scope varies
by industry or time, I expect it to depend on a key attribute of a firm’s role, namely its relative
size. This approach yields brings together otherwise disparate, and seemingly conflicting, views
of diversification and its consequences. Some theories suggest that organizations should
specialize to elude competition (White 1981, 2001; Carroll 1985); others imply that firms should
specialize to reduce barriers to learning (e.g., Teece 1980); still others, that they should diversify
in order to grow (e.g., Chandler 1990). An aim of this paper is to clarify when each of these
different viewpoints apply.
In the next section, I set forth hypotheses whose aim is to clarify the effects of relative
size, scope, and their interaction. In section two, I describe the data and the measures of
substantive interest. I move to the modeling strategy and control variables in section three. The
results of nine within-firm models of quarterly sales growth appear in section four. In section
five, I conclude by discussing the results and their implications for future research.
1. Theory and Hypotheses
1.1. Relative size
The effect of size on growth has been the object of study for decades. Scholars have
repeatedly tested Gibrat’s (1931) “law of proportionate effect,” which claims that a simple
stochastic process accounts for the skewed size distributions seen in many industries (see Sutton
[1997] and Carroll and Hannan [2000] for reviews). Gibrat asserted that growth in absolute terms
(of revenue, assets, or employees) was a function of prior size multiplied by random error. Even
if all firms were of equal size at an industry’s birth, it is easy to imagine that small random

Structure, Scale, and Scope
differences in growth could yield a severely skewed distribution (i.e., market concentration) in
due time. In that spirit, one of the main causal mechanisms thought to underlie Gibrat’s law is
luck (Scherer 1970); another is information (Jovanovich and Rob 1987), in that larger firms may
have better knowledge of buyer tastes, make better products, and thus grow more than their
smaller counterparts.
But many, if not most, studies in economics and sociology point to the failure of Gibrat’s
law (e.g., Kumar 1985; Barron et al. 1994), showing that smaller firms grow at a faster rate than
larger firms. Explanations of this pattern range in emphasis from the problems of panel attrition
(Mansfield 1962), to the claim that size may be an asset only in certain industries (Jovanovich
and Rob 1987), to attention to how growth is defined (Carroll and Hannan 2000). Carroll and
Hannan (2000:318) noted that even if Gibrat’s law fails, large firms can often grow more than
smaller firms in absolute terms. They also suggested that relative size, net of absolute size, may
yield new insights about firm growth. Considering relative size as a predictor of growth may add
to the literatures on size and growth, whose lack of consensus in economics Sutton (1997:42)
expressed in his review, stating that, “there is no obvious rationale for positing any general
relationship between a firm’s size and its expected growth rate.”
Early insights on the relative size-growth link are evident in the work of Hannan and
Ranger-Moore (1990), who used simulations to explore the role of size-localized competition in
the evolution of firm size distributions. Measuring the absence of competition by ego’s distance
on size from all others in the sample, simulations showed that monopolization occurred quickly,
particularly once the large firm broke away from its rivals. While they did not frame their study
around the effects of relative size, their results imply that growth may rise with relative size in
actual industries.
Structure, Scale, and Scope
Considering relative size directly, Hannan et al. (1998) estimated the effects of relative
size on survival in the British, French, German, and American automobile industries. Adjusting
for absolute size, they showed that size relative to the largest firm in the industry lowered the
likelihood of death, a result held across all four national markets. Carroll and Swaminathan
(2000) showed that firms in the U.S. beer industry with many and large competitors were more
likely to perish. They argued as well that a relative measure of size is fitting whenever firms
compete on scale. The higher cost structures of smaller firms endanger their survival precisely
because of their larger, more efficient rivals, in whose absence these smaller firms would be
better off. It is because of their low position in a hierarchy defined by size that smaller
organizations face a greater risk of extinction (Carroll and Swaminathan 2000). Carroll and
Hannan (2000) also noted three closely related domains in which relative size should matter:
Beyond superior efficiency in production, they suggested that relative size could also yield
greater influence over suppliers and distributors.
While these insights apply widely, they particularly concern the performance of
computer firms, which compete in an environment marked by scale advantages in
purchasing, production, and distribution. Upstream, the larger vendors enjoy significant
discounts, especially when buying software, processors, disk drives, and keyboards.
Given their bargaining power over suppliers, they are also less likely to have to assume
inventory risk. In manufacturing, the advantages of scale are especially important (Brock
1975; Scherer 1996, pp. 244-6), because of the amortization of development costs. While
only an ex post account, Michael Dell’s description of Dell’s trajectory emphasized the
crucial role of scale, explicitly noting the importance of catching up with its rivals: “I
realized we had to decide whether to stay the size we were—and face the consequences—

Structure, Scale, and Scope
or go for big time growth. Though we were at $1 billion in sales at the time, it didn’t
really matter. We were not growing in increments that would allow us to compete on a
global level when the market started to consolidate, and it was clearly going to—soon. If
we stayed the size we were, we wouldn’t be able to amortize our development costs over
a large enough volume, and our cost structure would be too high. We’d run the risk of
being uncompetitive, and we could easily get left in the dust” (1999:43). Lastly,
downstream, larger firms get the best space on the shelves of retailers and are the first
priority of major distributors. Given the benefits of size, I expect that relative size is
associated with future growth.
H1: Sales growth rises with relative size.
1.2. Market scope
The next hypothesis marks a shift away from a firm’s relative standing by considering the
structure of its ties to its buyers. Central to any firm’s strategy, regardless of industrial setting,
are decisions about how to allocate goods or services over a set of possible market segments.
Some firms, such as IBM, ship outputs of all form-factors, through many channels, and nearly
evenly across the geographical markets in which they have a presence. Sanyo, on the other hand,
has focused primarily on Japan and the U.K., with modest forays into the French market starting
in 1996.
Many studies have shown that diversifying—shifting away from Sanyo’s strategy, toward
IBM’s—raises firm performance. Various researchers have focused on economies of scope,
which arise when making two goods jointly is cheaper than making them separately (e.g., Willig
1979). Scholars of corporate strategy have taken this notion beyond the case of producing similar

Structure, Scale, and Scope
goods to embrace all instances in which a firm parlays the skills or resources it acquired in one
domain into another. Chandler (1990), for example, stressed the importance of economies of
scope for the growth of large industrial enterprises, noting that capabilities honed in one market
enabled firms to expand successfully into new ones. Haveman (1992) offered a complementary
perspective on the link between scope and competencies, noting that related diversification yields
added resources, which then sharpen a firm’s set of capabilities in its original area of competence.
Haveman’s analysis of the effects of diversification in the savings and loan industry showed that
broadening scope increased a firm’s life chances. In many industries, firms often grow by
widening their reach into new markets, selling through new channels, and by expanding
technologically. As they widen in scope, they can purchase components more cheaply—suppliers
often want their products to reach a broad range of buyers—and they can exploit skills that they
built up in earlier areas of focus in new ones. Consequently, I expect that:
H2: Sales growth rises with market scope.
1.3. The interaction of market scope and relative size
In spite of the support for hypothesis two, prior research also suggests that the impact of
diversifying may be subtler. Several lines of work imply that scope is beneficial only under
certain conditions. Sociologists often claim that specialization raises the life chances of
organizations, but rely on very different accounts of why this might be the case. Studies that look
outside the firm imply that diversification is a means of eluding competition. Conversely, other
lines of work, which look within the firm, suggest that organizations should steer clear of
diversification to avoid diseconomies of scope. Are these different mechanisms reconcilable? If
so, it is then possible to square them with the claim that firms should diversify to exploit the

Structure, Scale, and Scope
advantages of scope? To anticipate my response, I first describe research whose premise is that
firms specialize to differentiate; next, I consider studies that imply that they should not diversify
because of the complexities of scope; I then bring these views together by suggesting reasons to
expect the effect of scope to vary curvilinearly over the distribution of relative size.
The idea that specialization reduces competitive pressure has appeared in several
literatures. In an early institutionalist work, Selznick (1957:42-44) noted the importance of a
“distinctive competence” when dealing with the inimical interests of other organizations. His
classic (1949) study of the Tennessee Valley Authority described how the agency narrowed its
focus, giving up many of its original goals to the control of local interests to preserve its most
important programs, such as the development of electric power facilities.
More recently, ecologists have noted that specialized firms enjoy advantages when
competing with their diversified counterparts. These include the absence of organizational slack
and the many benefits of focusing resources and time on a particular segment of the market
(Freeman and Hannan 1983; Carroll 1985). Carroll’s model hinges on the idea that competition
makes specialization necessary. A firm’s focus on a single customer segment means it has
differentiated itself from its competitors. In related work, Baum and Haveman (1997) developed
a model of organizational foundings, which focused on the choices of new firms to pursue
distinctive locations congenial to their longevity.
Taking a formal approach, White’s (1981; 2001) theory of markets rests on the notion
that firms establish inimitable identities to turn a profit and survive. Each firm specializes by
procuring a unique bundle of inputs so that its cost structure and price points attract a set of
consumers whose tastes differ from those buying from its rivals. White’s model, which draws on
Chamberlin’s (1962) theory of product differentiation, carries strategic implications based on the
benefits of a distinctive reputation and set of capabilities. Central to the model is the idea that

Structure, Scale, and Scope
specialization raises a firm’s life chances by conferring first-mover advantages in its current role,
reducing the competition it would otherwise face if it migrated onto the roles of other firms.
Conversely, other studies offer a very different reason for not diversifying. They focus
not on the shelter found by specializing, but on the negative effect of diversification on a firm’s
ability to perform its tasks and to learn. This could be called an intra-firm perspective on the
effects of scope. Teece (1980:232-233) argued that the advantages of scope have limits, noting
that as a firm transfers the knowledge it gained in one market to its other units, evaluating and
acting on that knowledge may grow increasingly costly. Such costs surface because of “a
congestion factor that may attend the transfer process… know-how is generally not embodied in
blueprints alone: the human factor is critically important. Accordingly, as the demands for
sharing know-how increases, bottlenecks in the form of over-extended scientists, engineers, and
manufacturing/marketing personnel can be anticipated.”
In related work, Chandler (1990) noted that a firm could not achieve scope economies
just by leveraging its technologies and resources; managers who are highly skilled and arranged
in a hierarchy of roles figure centrally in his account. Consequently, because of the human
propensity for error, diseconomies of scope are always a looming possibility. Similarly, Barnett,
Greve, and Park (1994) discussed the costs of diversification in terms of firm-level learning.
Their insights imply that as a firm diversifies, it will face weaker incentives to better its practices
due stronger protection from competition; suffer losses in local adaptability because of its
growing lack of focus; and have greater difficulty using the skills it acquired in one market in
others. The literature thus contains three views of diversification: (1) it furthers performance
because of scope economies; (2) it weakens performance by removing protection from rivalry;
and (3) worsens performance by creating inefficiencies within the firm. Can relative size clarify
the matter?

Structure, Scale, and Scope
Earlier, I stressed the benefits of size in terms of scale economies. But since Weber
(1924), sociologists have also studied the link between size and bureaucracy and in turn the
negative effect of size on performance (Whetten 1987). Michel’s (1966) classic study showed
that large size causes even the most unlikely organizations to ossify. More recently, Haveman
(1993) found support for the claim that changes in strategy are difficult for large firms due to
creeping bureaucracy and attendant inflexibilities. Barron (1999) found evidence of a “liability of
bigness” in models of firm growth, showing that the negative effect of absolute size on growth
worsened with the number of firms in the industry.
This research suggests that size may elicit and intensify the inefficiencies that result from
diversification. In her influential book, Penrose (1959:206) noted that, “The large and diversified
firms, although undoubtedly wielding much power and occupying strong monopolistic positions
in some areas, do not, as far as we can see, hold their position without extensive managerial
effort.” Especially in the computer industry, firms who are exceedingly large relative to their
rivals, such as Compaq, Apple, and IBM, may become vulnerable to those rivals the more they
themselves widen their reach. By diversifying, they may face problems with coordinating tasks,
obstacles to learning, and inertia, which in turn weaken their position relative to their smaller
counterparts and thus lower their rates of growth.
But I expect that the “interference” of relative size with scope will occur only for the
largest values of relative size. Consistent with hypothesis two, increments in scope should raise
performance of at least certain kinds of firms. Comparably large firms may be able to expand by
moving into new markets. When vendors consider diversifying, one of the first questions
managers ask is whether they have the scale advantages necessary to compete with the members
of those markets. I also expect that because of scale-based competition, the best course of action
for relatively small firms is to target a specific segment. Specialization for them is optimal

Structure, Scale, and Scope
insofar as it enables them to gain a competitive advantage over larger, strategically proximate
firms by learning their markets better. Considered together, these observations suggest the effect
of scope on sales growth will follow an inverted U-shaped pattern over the distribution of relative
size. I expect that the small firms suffer from increments in scope, moderately large firms benefit
from these shifts, and, finally, that the growth of exceedingly large firms also declines when they
diversify further:
H3: The effect of scope on sales growth follows an IUS pattern over the distribution of relative size.
2. Data and Measures
The International Data Corporation (IDC) assembled the data I use in this paper. IDC is
the largest data consultancy worldwide to information technology firms and industries. With over
575 analysts and research centers in 43 countries, IDC collected shipment and selling price data
for over 400 vendors since the start of its quarterly tracking program. While not complete, its
coverage of the global PC industry is nearly exhaustive. The vendors tracked accounted for 83%
of the worldwide PC sales over the course of my observation window, which starts with the first
quarter of 1995 and ends at the first quarter of 1999. Most consumers of the data are makers of
PCs, who use the data to locate their positions relative to their rivals, follow trends in specific
segments, and make decisions about market entry.
IDC reports quarterly sales as well as shipment breakdowns for each vendor by national
market, technological emphasis, and distribution channel. It tracked fifty-seven national markets,
ranging from Canada and the U.K. to Japan and Chile. This number includes five aggregated
regional markets, such as “rest of Asia Pacific” and “rest of Latin America,” to cover areas in
which demand is not individually tracked.

Structure, Scale, and Scope
Coupled with a firm’s implication in national markets, its choice of “form-factor”
technology and channel defines its market position. These “form-factor” types—literally
concerning the “form,” or appearance, of the product—are desktops, notebooks, sub-notebooks,
and servers. IDC also codes the units shipped by each firm as belonging to one of five channels:
(1) direct inbound, (2) direct outbound, (3) reseller, (4), retail, and (5) other.
Machines flow through the direct inbound channel if the buyer initiates the transaction by
phone, Internet, or a vendor-specific catalog. Conversely, the direct outbound channel is marked
by the use of a sophisticated in-house sales force. A well-known example is the IBM
representative selling to large corporations. When buyers require unusually specialized solutions,
they often turn to the reseller channel. In IDC’s coding scheme, this category includes dealers,
system integrators, and value-added resellers. The retail channel consists of well-known chains,
such as Circuit City in the U.S. and Dixons in the U.K. Lastly, the fifth “other” channel
combines a number of distinct outlets, such as catalog sales and military exchanges.
With IDC’s coverage of 57 national markets, 4 form-factor categories, and 5 channels,
there are 1,140 possible segments in which vendors ship PCs. A virtue of this dataset is that it
includes time-varying information on each firm’s strategy. Such data are sufficient for defining
each firm’s unique set of closest competitors, which I do with the techniques of social network
analysis (Burt and Carlton 1989).
My measure of relative size hinges on structural equivalence between firms having
market contact. Market contact occurs between firms i and j at time t if they “meet” by selling
jointly in at least one of 1,140 possible technology-by-channel-by-nation market segments. Even
in the same country, if firm i only sells PC servers—entirely through the direct outbound
channel—whereas j sells only notebooks—solely through retail chains—then i and j have zero
contact. Under that condition, I assume that they do not affect each other’s rates of growth. After

Structure, Scale, and Scope
defining market contact as a binary outcome, the next step in quantifying relative size is to weight
by the degree of structural equivalence between firms i and k. I denote i’s alters by k, rather than
j, because i is likely to have contact with less than the total number of firms in the panel at t, so
that max(k) ≤ max(j).
Consider a well-known vendor, such as IBM, for illustration. IBM shares segments with
Compaq, which suggests that one’s level of sales at t affects the other’s rate of growth at t+1.
But IBM overlaps in segments with scores of other firms k at t—all of which are more or less
structurally equivalent to IBM than Compaq. Dell and Everex are also taken to bear on IBM’s
performance, for instance. Consequently, in quantifying IBM’s relative size, I follow a known
strategy in social network analysis (Burt 1987; Strang and Tuma 1993) by allowing the sales of
these firms k to receive weights proportional to their degree of equivalence to IBM.
The relative size of the ith firm at time t thus takes the form:
1
it
it
itK
ikt kt
k
SR
w S=
=
∑ (1)
where itS and ktS are the sales of the ith and kth firms. The integer itK is a time-varying count of
other firms with which i has market contact. The coefficient iktw is the degree of structural
similarity between firms i and k. Calculating iktw first entails rescaling the shipment vectors of
each firm by dividing through by the maximum number of PCs a firm sells in any segments (Burt
and Carlton 1989). The second step is to compute a firm-by-firm matrix of Euclidean distances,
so that

Structure, Scale, and Scope
( )1/ 221,140
1/ ( ) / ( )ikt ijt ijt kjt kjt
jd Y max Y Y max Y
=
= − ∑ (2)
where ijtY denotes the shipments of the ith firm in segment j at time t. I then convert each firm’s
vector of distances into structural equivalence coefficients by subtracting each vector from its
maximum distance and making the weights on ktS sum to unity.
1
( )
( )it
it iktikt K
it ikt
k
max d dwmax d d
=
−=
−∑ (3)
This measure of relative size has many desirable properties. It takes into account only
those firms that an ego firm meets tangibly in at least one market segment and then weights those
alters by the extent of their structural similarity to ego. Because notions of size as a competitive
asset necessarily entail arguments about a firm’s standing in relation to others, this measure uses
similarity of strategy to define each firm’s set of rivals. The incumbents of this set are members
in gradations based on their strategic similarities with the ego firm. This measure is also sensitive
to strategic change, allowing a competitor’s influence on ego’s relative size to increase or decay
with time, depending on whether they get closer or more distant strategically.
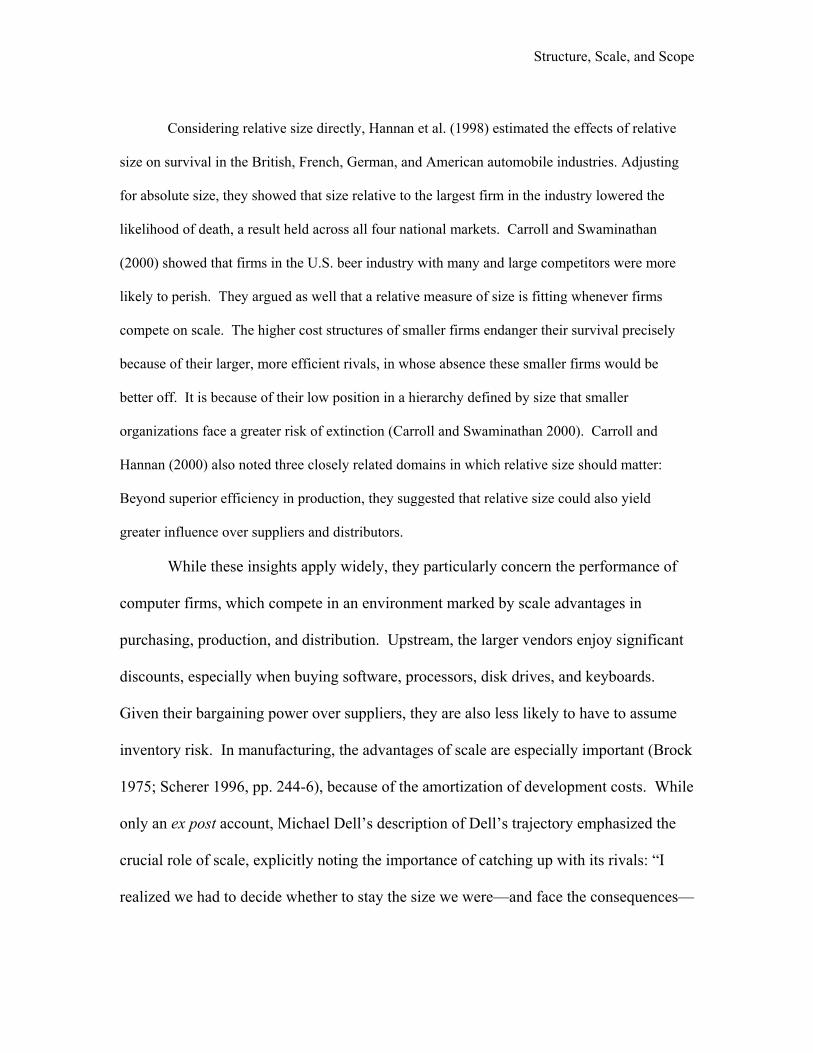
Consider the multidimensional scaling plot (Johnson and Wichern 1982) of the 25 largest
firms in figure 1, for a depiction of the stratification by strategy that marks the computer industry.
(Figure 1 about here)
Closely positioned vendors, such as Gateway and Micron, followed similar strategies in the
fourth quarter of 1995. Specifically, they had comparable profiles of shipping computers across

Structure, Scale, and Scope
market segments, which are defined by technology, geography, and method of distribution. I
used a matrix of Euclidean distances among normalized patterns of shipping PCs to generate this
plot. Gateway is close to Micron because they both majored in desktops in the U.S. through the
direct methods, but they are distant from Epson, which sold primarily through resellers and
retailers, and was almost as focused on Japan as it was on the U.S. Consequently, Gateway and
Micron may be assumed to be competing more intensely with each other than they are with
Epson, Digital, or IBM
Given that firms differ by conduct, a plausible assumption is that inter-firm competition
rises with similarity in strategy. The idea that firms occupy a strategic position that is more or
less occupied by other firms is taken for granted in the industry. Commenting on Toshiba’s
changing role in Japan, one analyst noted: “The sub-note category saw Protege and Libretto
shipments decline, partly due to more competition for the former, and less than ideal execution
from one Libretto series to another. Indeed, competition is becoming fiercer in the mini-NB
[notebook] space and what used to be Toshiba’s space is now getting awfully crowded” (IDC
1998, p. 53).
I used the same data on shipments through market segments, again defined by form-
factor, channel, and national market, to measure firm scope. I constructed an entropy index
(Coleman 1964; Hannan and Freeman 1989) of the form:
1
1 ln(1/ )itJ
it ijt ijt
j
E P P=
= +∑ (4)

Structure, Scale, and Scope
where ijtP is the proportion of the ith firm’s shipments to market category j at t, and itJ is a time-
varying count of the number of market categories in which i ships at t. I added unity to the
measure so that I could reduce its skewness by transforming it logarithmically.
3. Estimation and Control Variables
To test the preceding hypotheses, I used a power law framework of the form:
1 1exp( )it it it itS S α ε+ += X β (5)
After transforming (5) and adding further covariates, the model may be estimated by OLS as:
1 1 1ln ( ) = ln ( ) + + γ + + it it it i t itS Sα τ ε+ + +X β (6)
where 1itS + is the future sales of firm i, itX contains covariates of interest, and β is a vector of
parameters. The third term, γi , denotes a fixed effect for each firm, for which I accounted by
mean-deviating each time series. Such effects absorb all time-invariant, firm-specific features,
such as the time and place of market entry, and almost undoubtedly managerial skill and
corporate culture. Statistically, this procedure also has advantage of eliminating all the
autocorrelation arising from the unchanging features of firms that would otherwise bias the
estimates. I also included a set of quarter specific indicator variables, 1tτ + , for all periods but the
second quarter of 1995. These terms adjust for temporal autocorrelation, controlling for the
macroeconomic features of each quarter, such as microprocessor costs, market size, and the
number of firms in the industry. When fixed effects and time dummies are included jointly, the

Structure, Scale, and Scope
effects of firm age are also accounted for. The error term, 1itε + , is then taken to conform to
standard OLS assumptions of constant variance and serial independence.
The matrix of covariates contains three additional variables. The first is a control for
mergers. Over the four-year window of this study, a number of mergers took place, including
highly publicized events, such as Compaq’s purchase of Digital, but also less known
combinations, such as Gateway’s purchase of Advanced Logic Research, IBM’s purchase of
Lucky Gold Electronics, and Packard Bell’s acquisition of Zenith Data Systems, which was in
turn acquired by NEC. I created an indicator of a firm’s acquisition phase which I coded 1 for the
surviving firm if it made the merger final at time t+1, or if the merger had already occurred, and 0
otherwise. This measure is thus a time-varying indicator variable. For example, in the case of
Gateway, it equals 1 only for and after the fourth quarter of 1996, which is the quarter before
which the sales of Gateway and ARL were no longer measured separately. Second, I devised a
measure of market size. IDC reports the size of each of the 57 national markets in shipments
across time. To compute a measure of national market size for each firm, I used a weighted
average by calculating a firm’s proportion of shipments to each of the 57 markets and using them
as weights on these various sizes.1 Third, I constructed a measure of strategic or profile change.
Changes in a firm’s strategy, so that its focus at one time point differs significantly from its prior
focus, may affect its performance. To account for this possibility, I devised a Euclidean distance
1 Specifically, let 57
1
it ijt jt
j
M Uπ=
= ∑ where ijtπ is the proportion of the ith vendor’s output sold in market j and jtU is the
size of that market at time t.

Structure, Scale, and Scope
measure of strategic change,2 capturing the difference between a firm’s shipment profile at t and
t-1.
Table 1 reports descriptive statistics for these controls and other predictors included in
the analysis. Since I use a fixed-effects specification, I report only within-firm standard
deviations and within-firm correlations.
(Table 1 about here)
4. Results
Table 2 shows results from nine within-firm models of sales growth. In each model, the
standard errors have been widened to account for the incompleteness of the panel, due to firm
entries and exits.
(Table 2 about here)
This adjustment entails multiplying the standard errors resulting from the within transformation
by a constant great than one, which reflects the difference between the actual and largest possible
number of firm-quarters (Wansbeek and Kapteyn 1989; Baltagi 1995).
Model one includes only the lagged sales and temporal indicators. The estimate of .5424
on lagged sales at t falls well below unity, which means that proportional growth declines with
size. The negative effect of size on growth is immediately evident after re-arranging terms as
follows:
2 More formally, let profile change ( )1 / 221,140
, 1 1 1
1
/ ( ) / ( )it t ijt ijt ijt ijt
j
C Y max Y Y max Y− − −
=
= − ∑ where ijtY is the number of the
ith firm’s shipments to market segment j at time t. The shipment profiles used to compute structural equivalence
distances are here being used to capture within-firm changes in strategy between the prior and the current quarter,
which in turn predict growth at t+1.

Structure, Scale, and Scope
1 .5424 1 .4576
1it
it it itit
SG S SS+ − −
+ ≡ ≡∝ (7)
The control for acquisitions is also significant, which suggests that firm performance may hinge
on whether it has undergone a merger. The time effects mirror the seasonal demand known to
mark the computer industry. The fourth quarter effects are especially pronounced, reflecting the
push of large-scale advertising, the pull of holiday consumer spending, and the tendency for
corporate buyers to drain capital budgets at the close of the year (Coyle 1996:18). Also, all
models in this table include a fixed effect for each firm. A test of the significance of firm effects
(Hausman 1978) was strongly significant (chi-square = 867.50, on 17 d.f.), meaning that the
estimates changed significantly once the within transformation was applied.
In Model 2, linear and quadratic terms are included to consider the effect of relative size
on growth. Coefficients on ln ( )itR and 2ln ( )itR are both positive and strongly significant (12.00
and 15.30 t-tests). I entered first and second order terms to capture the potentially nonlinear
effects of relative size. It seemed likely that the advantages of scale might yield a pattern
resembling an accelerative production function, where growth rises faster than linearly with
relative size. Casual inspection could yield the inference that marginal growth rises with relative
size. But the fact that , 1ln ( )i tS + rises faster than linearly with ln ( )itR is insufficient for
increasing returns. Manipulating the terms of model 3 yields:
)(1
itRitit RG θ∝+ (8)
( ) .3493 .0413ln ( )it itR Rθ ≡ + (9)

Structure, Scale, and Scope
As (8) indicates, the effect of a unit increase ln ( )itR is a function of itself, ( )itRθ . And inspection
of (9) does show as well that the relative size elasticity, ( )itRθ , is increasing in itR . Expressed
simply, the effect of a small percentage change in relative size is larger further out in the
distribution of relative size. But ( )itRθ never exceeds unity over the range of the data because
max( )itR (shown in table 1) is only 40.34. Therefore, the effect of a unit change in relative size
drops with its level. Clearly, for increasing returns:
( ) 1 6,958,315it itR Rθ > → > (10)
However:
6,958,315 max ( ) 40.34itR>> = (11)
In addition, the impact of raising relative size is strong over much of its range.3 Consider the
upward shift in the growth rate, given a one within-firm standard deviation increase in relative
3 Careful exploration of θ(Rit) also reveals that for values of relative size < exp(-.3493/ .0412) = 0.000207962 the effect of relative is
negative. And table 1 shows that the range of observed values contains this cutoff. Inspection of the panel shows that 1.5 % (62/4022)
of the observations fell beneath this threshold. To see if the results hinged in any way on these observations, I created an indicator
variable, coded 1 if relative size < 0.000207962, 0 otherwise, and added it to model two. Changes in coefficients and test statistics on
the log of relative size and its quadratic term were nearly undetectable and t-tests remained very strong for each. Positive externalities
may account for the fact that very small firms actually benefit from the growth of their rivals. Consider scenario in which Apple or
IBM grows but not all consumers can afford their products. As they increase in size, they may also increase awareness of and demand
for computers broadly defined. Smaller vendors may in turn benefit from “cleaning up” those pockets of demand that Apple and IBM
do not satisfy.

Structure, Scale, and Scope
size, holding all else fixed. At its mean of .57, such a shift yields a 42% increase in the growth
rate. This effect may be computed by arranging terms from model 2 as follows:
2
2
exp[.3493ln (.57 1.00) .0413ln (.57 1.00) ] 1.42exp[.3493ln (.57) .0413ln (.57) ]
+ + +=
+ (12)
This effect is very large. Vendors at this point in the distribution enjoy substantial returns
to enhancing their relative size. And while these effects do taper off, they stay strong until
relative size reaches about 10—the frontier of Compaq, Dell, and IBM’s domain. At Compaq’s
relative size in the fourth quarter of 1998, which was 32, the same shift yields a 2% rise in the
rate—showing that the effect of relative size atrophies as vendors further dominate their strategic
neighborhoods. But even a 2% increase in the rate is substantively significant over the course of
this observation window. Imagine that firms j and k are fully comparable, except that j’s
quarterly growth rate is 2% less than k’s. Then, over the course of 16 quarters, j’s size will be
more than a quarter less the size of k (since [.98]16 = .72 < .75).
Model 3 shows that scope has a positive effect on sales growth. This effect is also
strongly significant if scope is entered linearly, rather than logarithmically, but a normality test
and plotting its distribution confirmed that scope should be logged. The estimate shows that as
vendors diversify across market segments, their quarterly rates of growth rise. Scope is strongly
significant even with the inclusion of firm-specific effects. Chandler’s (1990) analysis stressed
the role that managers play in the realization of scope economies. Fligstein (1991:320-21) traced
diversification and its benefits to the actions of particular kinds of managers. More recently, the
management literature (e.g., Hagel and Singer 2000) has also called attention to the importance of
developing a strongly service-oriented culture if firms are to capture economies of scope. Hence,

Structure, Scale, and Scope
it is easy to imagine that managerial skill might at once drive diversification as well as its positive
impact on performance, rendering the scope effect itself entirely endogenous. But since fixed
effects wash out the influence of firm-specific talent, the result in model 3 suggests that the nature
of a firm’s pattern of ties to its customers affects growth, net of that firm’s unique constellation of
managerial talents.
However, it is model 4 that best clarifies the impact of diversifying, for it shows how the
effects of scope hinge on a firm’s size relative to that of its strategically proximate competitors.
Earlier, I expected that diversification would have negative consequences when firms were very
small, a positive impact near the middle of the relative size distribution, but then a negative effect
once again for firms very large in comparison to their rivals. Does model 4 support this
hypothesis? The estimates reveal that:
( )1
itRit itG E Θ+ ∝ (13)
where
2( ) .2824 -.0952ln ( ) -.0226ln ( )it it itR R RΘ ≡ (14)
and
( ) -.0952-.0452ln ( ) = = 0it it
it it
R RR R
∂Θ∂
(15)
so that from equation (15), the scope effect is most strongly positive at itR = .1217. To clarify
equation (13), note that the magnitudes of the log of relative size range from -13.82 to 3.70.
The plot of ( )itRΘ over the observed range of ln( )itR is shown in figure 2. This figure
shows the contingent nature of the scope effect, depicting its behavior from negative to positive
and back to negative.

Structure, Scale, and Scope
(Figure 2 about here)
The horizontal line of no effect, coupled with the two lines cutting through values of ln( )itR at
which ( )itRΘ equals zero, trisects figure 2 into distinct zones. Each section carries a strategic
implication for the firms within them. Specialization favors performance in the left-most region.
Conversely, diversification raises the growth rate in the middle region, and de-diversifying leads
to growth in the right-most region.
In each section, I included a representative firm, whose level of relative size during at
least one quarter fell within the defined range. Olympia is a small vendor, which majored in
desktops and sold in only two countries, the U.K. and Chile. The results suggest that for firms
like Olympia, the best course of action is to specialize to find protection from competitive
pressure. Daewoo’s relative size, particularly in the third quarter of 1996, was conducive to the
greatest effect of increasing scope.4 The behavioral implication of model four is that firms
resembling Daewoo will expand into new markets, which is exactly what Daewoo happened to do
over the course of the panel. But for behemoths like Compaq, who are exceedingly large relative
to their rivals, the pattern of effects suggests that further scope hinders growth. Model four thus
offers strong support for hypothesis three. Adjusted classical tests of the interaction effects are
strong (t-tests of –1.97 and –4.61 for the first and second order interactions, respectively). And, t-
tests of the main effects of relative size stay strong at 9.02 and 12.46. That the main effect of
4 To get a sense of the magnitude of these effects, consider the largest coefficient on the log of scope, which is .3842, when relative
size, from equation (15), equals .1217. Turning to table 1, a one within-firm standard deviation increase in scope at the mean yields a
4% increase in the growth rate (since [1.92+.23].3824 / [1.92].3824 = 1.04). Such an effect over 16 quarters is very strong: 1.0416 = 1.87,
which is nearly a doubling in size. Similar calculations may be performed for the effect of scope over the entire distribution of relative
size.

Structure, Scale, and Scope
scope vanishes with the entrance of additional terms means that its impact is meaningful only
together with relative size.
While the scale-by-scope interaction effect is statistically strong, a potential concern is
that it is an artifact of high correlation between the main and interaction terms. Table 1 shows
that these correlations are not especially high, but any argument based on interaction effects calls
for an assessment of their robustness. Multicollinearity does not yield biased coefficients, but can
produce estimates that are sensitive to small pertubations in the data. An established method for
evaluating the robustness of interaction effects is to mean deviate each of the terms involved. If
interactions of globally demeaned terms show instability, far less confidence may be placed in the
results. In this case, I rescaled the scope and relative size terms by subtracting the overall mean
from each and then using the products of these demeaned terms for the two interactions.
However, model five shows that the estimates are entirely unaffected by this procedure. The t-
tests on the two relative size-by-scope terms are exactly as they were in model four. The only
difference is that, due to reduced collinearity between scope and the multiplicative terms, the
coefficient on scope is now significant by conventional standards.
Models six and seven address a competing interpretation of model four. Earlier, I
suggested that model four supported hypothesis three—that relative size determines whether
diversification has negative or positive consequences. But an alternative account is that as firms
gain ground on their peers, they engage in unrelated diversification, which in turn pulls down
their rates of growth. To address this possibility, I entered the measure of profile change as a
covariate in model six. Because this factor captures the effect of recent change on future growth,
an additional time period lost, which is why one less quarter dummy and fewer spells are in
model six. Vendors who underwent a large amount of profile change from t-1 to t by definition
follow strategy that is unrelated to that of its recent past, and it may consequently perform less

Structure, Scale, and Scope
well in the future. But the effect of profile change is insignificant, and the coefficients on scope
and its interactions with relative size remain almost identical. The number of firm-quarters drops
by more than 10%, which why is the first of the scope-by-relative size interactions is no longer
significant.
Another potential concern has to do with functional form. Perhaps large scope itself,
rather than large relative size, accounts for the negative effect of scope in the case of firms like
Compaq, IBM, and Dell. If so, an optimum level of diversification would exist, beyond which
the complexities and social frictions of being in multiple market segments would make further
expansion detrimental. Entering linear and quadratic terms for scope can test this account. A
negative effect of scope after a certain threshold would call for a refinement of hypothesis three.
But as model six shows, an inverted U-shaped pattern is unsupported by the data. Consequently,
it is plausible to assume that relative size, not scope itself, is the factor that conditions the effect
of scope on sales growth.
Models eight and nine address the possibility that fixed effects and time dummies may
not sufficiently adjust for the impact of market size. If temporal patterns of demand varied
significantly across national markets, then the combination of fixed effects and time dummies
might not entirely sweep out the effects of market size. Model eight includes market size and
calendar time together. Entering time linearly does not adjust fully for temporal heterogeneity in
the way a set of time indicators does. Model eight shows that the effect of market size is
negative, suggesting that it is easier to grow in smaller markets. (Here it is important to recall
that growth, not size, constitutes the left hand side, since lagged size is included as a predictor.)
But in model nine, where the time dummies reappear, the effect of market size vanishes. This
pattern offers support the claim that fixed effects and quarterly indicators control for market size,

Structure, Scale, and Scope
as they have been assumed to do in other studies of firm growth involving sales in multiple
countries (Podolny et al. 1996; Stuart 2000).
A final concern is that the effect of relative size may in fact reflect relative age. But
notice that the effect of (absolute) age is in fact present in model eight. Because of the within
transformation, if age were entered in model eight instead of calendar time, the coefficient on age
would be exactly as it is now on time—which is negative. This finding is consistent with studies
of aging in the ecological literature, which has shown it to be a liability once size is controlled for
(Carroll and Hannan 2000). Consequently, it is difficult to argue that by being older than its
peers, a firm develops a competitive advantage and can thus grow at a faster rate. Unfortunately,
since many of the firms in the panel are foreign and IDC does not collect date of entry data, it is
not possible to see if relative age has an effect. But even if such data were available, the
theoretical argument could not be that as a firm increasingly competes with younger rivals
(through strategic change and turnover), its growth rate rises. And if it were the opposite—that
by being increasingly younger than its peers, a firm grows faster—then relative age could not be
meaningfully collinear with relative size, and therefore it is extremely unlikely that by adding
such covariate, the effect of relative size would change.
5. Conclusion
The focus of this paper has been on the sources of firm growth, which has long been
vibrant area of theoretical and empirical inquiry in sociology and in economics. More broadly, to
understand the growth and decline of organizations is to grasp the main drivers of market
concentration, industry size, and the consolidation of social power (Blau 1977:229-234). In this
paper, I took a sociological approach by attending to the effects of each firm’s position in a
system of competitive relations that I inferred from similarities in strategy. What is novel about

Structure, Scale, and Scope
this approach is the structurally oriented predictors of firm growth I have considered, and equally
important, the interactions I have identified among them. The analysis showed that the
dimensions of a firm’s role—specifically relative size and diversification—have a strong impact
on future growth and, further, that the effects of these attributes of a firm’s position hinge on each
other.
Unlike studies of organizational mortality, which almost always report that size lowers
the risk of exit (e.g., Delacroix and Swaminathan 1991), analyses of firm growth have had
difficulty showing that size is an advantage in economic markets. Studies of exit have often
pictured size as a rampart against rivalry and environmental shocks. Conversely, with the
exception of Jovanovich and Rob’s (1987) model, which pictures size as an asset, and Barron’s
(1999) study, which portrays size as a liability, theoretical renditions of size in the context of firm
growth have been less clear.
The result that growth falls with ego’s size, but rises with ego’s size over that of its alters,
calls for a refinement of theories of size in systems whose actors rival each other in degrees
proportional to their closeness in a social space. The effect of absolute size, if considered alone,
could suggest that scale is only a liability—contradicting what we have known to be true of the
advantages of scale since the writings of Adam Smith (1791). Clearly, developing theory only on
the basis of absolute size is undesirable. Considered relationally, however, the size effect has
ready appeal: Vendors benefit in the future by gaining ground on their peers in the present. And
they do so strongly. This finding contributes to the literatures on size and growth in sociology
and economics, which so far have dealt solely with the impact of absolute size—as if each firm’s
growth is unaffected by the scale advantages or disadvantages of the other firms in the industry.
But this paper makes an additional contribution by considering relative size as
conditioning factor and thus starts to resolve theoretical debates over the effect of diversification.

Structure, Scale, and Scope
Specifying the causal interdependencies among the dimensions of a firm’s position is perhaps the
most intriguing aspect of a structural approach to markets. Clarifying the conditions under which
shifts in role most strongly affect performance is central to advancing a contingent theory of
social structure. The findings of this paper may well be “scale invariant” (White 1992), in that
they may apply to the “specialize-or-diversify” decisions faced by other kinds of social actors.
These might include workers climbing through a hierarchy, political protest organizations facing
new environments, and larger social aggregates—all of which have to make decisions about what
to do and what to leave undone in the context of how they stand in relation to other actors.
Should firms specialize, or should they broader their reach into different markets? This
paper showed that the answer is not uncomplicated. Within a certain zone of the relative size
distribution, diversification is beneficial. But on either side of it, firms narrow their scope if their
aim is to grow. This implies that firms maintain their positions for different reasons. If size and
flexibility vary inversely, relatively small firms do not specialize to reduce coordination costs,
which is a concern for large firms. They do so instead to master a specific market and outperform
their larger rivals whose scale advantages are formidable.

Structure, Scale, and Scope
References Baltagi, Badi H. 1995. Econometric Analysis of Panel Data. New York: John Wiley & Sons. Barnett, William P. 1990. "The Organizational Ecology of a Technological System."
Administrative Science Quarterly 35:31-60. Barnett, William P., Henrich R. Greve, and Douglas Y. Park. 1994. "An Evolutionary Model of
Organizational Performance." Strategic Management Journal 15:11-28. Barnett, William P., and Olav Sorenson. 1998. "The Red Queen in Organizational Creation and
Development." Working Paper. Barron, David N. 1999. "The Structuring of Organizational Populations." American Sociological
Review 64:421-445. Barron, David, Elizabeth West, and Michael T. Hannan. 1994. "A Time to Grow and a Time to
Die: Growth and Mortality of Credit Unions in New York City, 1914 - 1990." American Journal of Sociology 100:381-421.
Baum, Joel A.C., and Stephen J. Mezias. 1992. "Localized Competition and Organizational
Failure in the Manhattan Hotel Industry, 1898-1990." Administrative Science Quarterly 37:580--604.
Baum, Joel A.C. and Heather A. Haveman. 1997. "Love Thy neighbor? Differentiation and
Agglomeration in the Manhattan Hotel Industry, 1898-1990." Administrative Science Quarterly 42:304-338.
Brock, Gerald. 1975. The U.S. Computer Industry: A Study of Market Power. Cambridge:
Ballinger. Burt, Ronald S. 1987. "Social Contagion and Innovation: Cohesion versus Structural
Equivalence." American Journal of Sociology 92:1287-1335. —. 1992. Structural Holes: The Social Structure of Competition. Cambridge: Harvard University
Press. —. 1998. "The Gender of Social Capital." Rationality and Society 10:5-46. Burt, Ronald S., and Debbie S. Carlton. 1989. "Another Look at the Network Boundaries of
American Markets." American Journal of Sociology 94:723-753. Carroll, Glenn R. 1985. "Concentration and Specialization: Dynamics of Niche Width in
Populations of Organizations." American Journal of Sociology 90:1262-1283. Carroll, Glenn R., and Michael T. Hannan. 2000. The Demography of Corporations and
Industries. Princeton, New Jersey: Princeton University Press.

Structure, Scale, and Scope
Carroll, Glenn R., and Anand Swaminathan. 1998. "Why the Microbrewery Movement? Organizational Dynamics of Resource Partitioning in the American Brewing Industry after Prohibition." University of California at Berkeley, University of California at Davis.
Chamberlin, Edward. 1962. The Theory of Monopolistic Competition. Cambridge, Mass: Harvard
University Press. Chandler, Alfred D. Jr. 1990. Scale and Scope: The Dynamics of Industrial Capitalism.
Cambridge: Harvard University Press. Coleman, James S. 1964. Introduction to Mathematical Sociology. London: The Free Press of
Glencoe, Collier-Macmillan Limited. Coyle, John C. 1996. "Computers: Hardware." Standard and Poor's Industry Surveys 164:1-32. Davis, Gerald F., Kristina A. Diekmann, and Catherine H. Tinsley. 1994. "The Decline and Fall
of the Conglomerate Firm in the 1980s: The Deinstitutionalization of an Organizational Form." American Sociological Review 59:547-570.
Delacroix, Jacques, and Anand Swaminathan.1991. "Cosmetic, Speculative, and Adaptive
Organizational Change in the Wine Industry: A Longitudinal Study." Administrative Science Quarterly 36:631-661.
Dell, Michael. 1999. Direct from Dell: Strategies that Revolutionized an Industry. New York:
Harper Business. Dobrev, Stanislav D. and Glenn R. Carroll. 2001. "Scale (and Competition) among
Organizations: Modeling Scale-Based Selection among Automobile Producers in Four Major Countries, 1885-1981." Working Paper.
Eaton, B. Curtis, and Richard G. Lipsey. 1989. "Product Differentiation." Pp. 725-768 in
Handbook of Industrial Organization, edited by Richard Schmalensee and Robert D. Willig. Amsterdam: Elsevier Science Publishing.
Evans, David S. 1987. "Tests of Alternative Theories of Firm Growth." Journal of Political
Economy 95:657-674. Fligstein, Neil. 1990a. The Transformation of Corporate Control. Cambridge: Harvard University
Press. —. 1990b. "Organizational, Demographic, and Economic Determinants of the Growth Patterns of
Large Firms, 1919-1979." Comparative Social Research 12:45-76. —. 1991. "The Structural Transformation of American Industry: An Institutional Account of the
Causes of Diversification, 1919-1979." in The New Institutionalism in Organizational Analysis, edited by Walter W. Powell and Paul J. DiMaggio. Chicago: University of Chicago Press.

Structure, Scale, and Scope
Freeman, John, and Michael T. Hannan. 1983. "Niche Width and the Dynamics of Organizational Populations." American Journal of Sociology 88:1116-1145.
Gibrat, Robert. 1931. Les Inégalités Economiques. Paris: Sirey. Granovetter, Mark. 1985. "Economic Action and Social Structure: The Problem of
Embeddedness." American Journal of Sociology 91:481-510. Hagel, John, and Marc Singer. 2000. "Unbundling the Corporation." The McKinsey Quarterly
148. Haveman, H. A. 1992. "Between a Rock and a Hard Place: Organizational Change and
Performance Under Conditions of Fundamental Environmental Transformation." Administrative Science Quarterly, 37:48-75.
—. 1993. "Organizational Size and Change: Diversification in the Savings and Loan Industry
after Deregulation." Administrative Science Quarterly, 38: 20-50. Hannah, Leslie, and J.A. Kay. 1981. "The Contribution of Mergers to Concentration Growth."
The Journal of Industrial Economics 29:303-313. Hannan, Michael T., Glenn R. Carroll, Stanislav D. Dobrev, and Joon Han. 1998. "Organizational
Mortality in European and American Automobile Industries, Part I: Revisiting the Effects of Age and Size." European Sociological Review 14:279-302.
Hannan, Michael T., and John Freeman. 1977. "The Population Ecology of Organizations."
American Journal of Sociology 82:929-943. —. 1989. Organizational Ecology. Cambridge: Harvard University Press. Hannan, Michael T., and James Ranger-Moore. 1990. "The Ecology of Organizational Size
Distributions: A Microsimulation Approach." Journal of Mathematical Sociology 15. Hausman, J.A. 1978. "Specification Tests in Econometrics." Econometrica 46:1251-1271. Ingram, Paul and Peter W. Roberts. 2000. "Friendships among Competitors in the Sydney Hotel
Industry." American Journal of Sociology 106:387-423. International Data Corporation. 1998(1). Qualitative Report. Jovanovic, Boyan, and Rafael Rob. 1987. "Demand Driven Innovation and Spatial Competition
over Time." The Review of Economic Studies 54:63-72. Kanter, Rosabeth M. 1995. World Class: Thriving Locally in the Global Economy. New York:
Simon and Schuster. Kumar, M.S. 1985. "Growth, Acquisition Activity and Firm Size: Evidence from the United
Kingdom." The Journal of Industrial Economics 33:327-338.

Structure, Scale, and Scope
Lawrence, Paul, and Jay Lorsch. 1967. Organization and Environment. Cambridge: Harvard
University Press. Mansfield, Edwin. 1962. "Entry, Gibrat's Law, Innovation, and the Growth of Organizations."
American Economic Review 52:1023-51. Michels, Robert. 1966. Political Parties. New York: Free Press. Oster, Sharon H. 1982. "Intraindustry Structure and the Ease of Strategic Change." Review of
Economics and Statistics 64:376-383. Penrose, Edith. 1952. "Biological Analogies in the Theory of the Firm." American Economic
Review 42:804-819. —. 1959. The Theory of the Growth of the Firm. Oxford: Oxford University Press. Podolny, Joel M., Toby E. Stuart, and Michael T. Hannan. 1996. "Networks, Knowledge, and
Niches: Competition in the Worldwide Semiconductor Industry, 1984-1991." American Journal of Sociology 102:659-689.
Porac, Joseph, and Jose Antonio Rosa. 1996. "Rivalry, Industry Models, and the Cognitive
Embeddedness of the Comparable Firm." Advances in Strategic Management 13:363 - 388.
Porter, Michael. 1979. "The Structure Within Industries and Companies Performance." Review of
Economics and Statistics 61:214-228. Robinson, J. 1933. The Economics of Imperfect Competition. London: Macmillan. Scherer, F.M. 1970. Industrial Market Structure and Economic Performance. Chicago: Rand
McNally & Company. —.1996. Industry Structure, Strategy, and Public Policy. New York: Harper Collins. Selznick, Philip. 1949. TVA and the Grass Roots. Berkeley and Los Angeles: University of
California Press. —. 1957. Leadership in Administration: A Sociological Interpretation. Evanston: Row, Peterson
and Company. Slade, Margaret E. 1986. "Exogeneity Tests of Market Boundaries Applied to Petroleum
Products." Journal of Industrial Economics 34:291-303. Smelser, Neil J., and Richard Swedberg. 1994. "The Sociological Perspective on the Economy."
in The Handbook of Economic Sociology, edited by Neil J. Smelser and Richard Swedberg. Princeton: Princeton University Press

Structure, Scale, and Scope
Smith, Adam. 1791. An Inquiry into the Wealth of Nations. London: Strahan and Cadell. Smith, David A., and Douglas R. White. 1992. "Structure and Dynamics of the Global Economy:
Network Analysis of International Trade, 1965-1980." Social Forces 70:857-893. Strang, David and Nancy B. Tuma. 1993. "Spatial and Temporal Heterogeneity in Diffusion."
American Journal of Sociology 99:614-639. Stuart, Toby E. 1998. "Network Positions and Propensities to Collaborate: An Investment of
Strategic Alliance Formulation in a High-Technology Industry." Administrative Science Quarterly 43:668-698.
—. 2000. "Interorganizational Alliances and the Performance of Firms: A Study of Growth and
Innovation Rates in a High-Technology Industry." Strategic Management Journal 21:791-811.
Sutton, John. 1997. "Gibrat's Legacy." Journal of Economic Literature 35:40-59. Teece, David J. 1980. "Economies of Scope and the Scope of the Enterprise." Journal of
Economic Behavior and Organization 1:223-247. Uzzi, Brian. 1996. "The Sources and Consequences of Embeddedness for the Economic
Performance of Organizations: The Network Effect." American Sociological Review 61:674-698.
—. 1999. "Embeddedness in the Making of Financial Capital: How Social Relations and
Networks Benefit Firms Seeking Capital." American Sociological Review 64:481-505. Wansbeek, Tom, and Arie Kapteyn. 1989. "Estimation of the Error-Components Model with
Incomplete Panels." Journal of Econometrics 41:314-361. Weber, Max. 1924 [1968]. Economy and Society: An Outline of Interpretive Sociology. New
York: Bedmeister. Whetten, David A. 1987. "Organizational Growth and Decline Processes." Annual Review of
Sociology 13:335-58. White, Harrison C. 1981. "Where do Markets come from?" American Journal of Sociology
87:517-547. —. 1992. Identity and Control: A Structural Theory of Social Action. Princeton: Princeton
University Press. —. 2001. Markets and Networks: Lazarsfeld Center for the Social Sciences. Columbia University Willig, R. 1979. "Multiproduct Technology and Market Structure." American Economic Review
69:346-351.

Structure, Scale, and Scope
Zald, Mayer, and Patricia Denton. 1963. "From Evangelism to General Service: The Transformation of the YMCA." Administrative Science Quarterly 8:214-234.

Structure, Scale, and Scope
Table 1. Descriptive Statistics and Within-Firm Correlations for Variables in the Analysis
Variable Name Mean SD Min Max
Sales (S) 1.28E+08 1.67E+08 828 8.79E+09
Acquisitions (A) 0.0132 0.0799 0 1
Relative Size (R) 0.5689 1.0035 1.00E-06 40.3407
Scope (E) 1.9209 0.2285 1 5.2594
Profile Change (C) 0.2265 0.2807 0 2.0893
Market Size (M) 963697.7 519489.4 4831.001 1.08E+07 Predictors (1) (2) (3) (4) (5) (6) (7) (8) (9) (10) (1) ln(Sales) 1.00 (2) Acquisition 0.06 1.00 (3) ln(Relative Size) 0.77 0.04 1.00 (4) ln(Relative Size)2 -0.77 0.01 -0.92 1.00 (5) ln(Scope) 0.16 0.03 0.09 -0.08 1.00 (6) ln(Scope) 2 0.20 0.07 0.16 -0.10 0.89 1.00 (7) ln(Scope)ln(Relative Size) 0.24 0.06 0.39 -0.26 -0.75 -0.53 1.00 (8) ln(Scope)ln(Relative Size) 2 -0.35 0.02 -0.50 0.45 0.60 0.42 -0.89 1.00 (9) ln(Market Size) 0.36 0.08 0.17 -0.14 0.01 0.02 0.11 -0.16 1.00 (10) ln(Profile Change+1) 0.01 0.01 -0.02 0.01 -0.05 -0.04 0.03 -0.03 0.00 1.00

Structure, Scale, and Scope
41
Table 2: Within-Firm Regression Models Predicting ln(Sales) at t+1 Variables 1 2 3 4 5 6 7 8 9 ln(Sales) 0.5424*** 0.6559*** 0.5341*** 0.6507*** 0.6507*** 0.6312*** 0.6447*** 0.6446*** 0.6421*** (0.0152) (0.0257) (0.0154) (0.0276) (0.0276) (0.0297) (0.026) (0.0287) (0.0287) Acquisition 0.3005** 0.117 0.2946** 0.1793 0.1793 0.1888 0.1047 0.1824 0.1761 (0.1082) (0.1057) (0.1081) (0.1076) (0.1076) (0.113) (0.1057) (0.1113) (0.1076) ln(Relative Size) 0.3493*** 0.3497*** 0.2949*** 0.3456*** 0.3339*** 0.3557*** 0.3434*** (0.0291) (0.0443) (0.0315) (0.0473) (0.0299) (0.0461) (0.0447) ln(Relative Size)2 0.0413*** 0.0453*** 0.0323*** 0.0465*** 0.0398*** 0.0445*** 0.0446*** (0.0027) (0.004) (0.0034) (0.0043) (0.0028) (0.0042) (0.0041) ln(Scope) 0.2153** 0.2824 0.1388* 0.3803* -0.1189 0.2938 0.2984 (0.0665) (0.1592) (0.0656) (0.1697) (0.1447) (0.1646) (0.1599) ln(Scope) 2 0.2903* (0.1363) ln(Scope)ln(Relative Size) -0.0952* -0.0952* -0.092 -0.0961 -0.087 (0.0483) (0.0483) (0.0515) (0.0505) (0.049) ln(Scope)ln(Relative Size) 2 -0.0226*** -0.0226*** -0.0267*** -0.0231*** -0.0215*** (0.0049) (0.0049) (0.0053) (0.0052) (0.005) ln(Profile Change+1) 0.0852 (0.0485) ln(Market Size) -0.0979** 0.0358 (0.0328) (0.0339) Trend -0.0139*** (0.0027) Period Indicators 95Q3 0.0666 0.0688 0.0665 0.0693 0.0693 0.0685 0.0703 (0.0505) (0.049) (0.0505) (0.0488) (0.0488) (0.0489) (0.0488) 95Q4 0.3034*** 0.3067*** 0.3012*** 0.305*** 0.305*** 0.237*** 0.304*** 0.3047*** (0.0503) (0.0489) (0.0503) (0.0487) (0.0487) (0.049) (0.0488) (0.0487) 96Q1 0.0579 0.0309 0.059 0.0297 0.0297 -0.0472 0.03 0.0204 (0.0519) (0.0509) (0.0518) (0.0507) (0.0507) (0.0514) (0.0508) (0.0514) 96Q2 0.1182* 0.0973* 0.1183* 0.0969* 0.0969* 0.0303 0.0951 0.0945 (0.0508) (0.0494) (0.0507) (0.0492) (0.0492) (0.0503) (0.0494) (0.0493) 96Q3 0.1558** 0.127* 0.1591** 0.1304** 0.1304** 0.0553 0.127* 0.1292** (0.0509) (0.0498) (0.0509) (0.0496) (0.0496) (0.0508) (0.0498) (0.0496) 96Q4 0.3211*** 0.2875*** 0.3249*** 0.2895*** 0.2895*** 0.2164*** 0.2874*** 0.2881*** (0.0509) (0.05) (0.0508) (0.0499) (0.0499) (0.051) (0.05) (0.0499) 97Q1 -0.0365 -0.1015 -0.0311 -0.0947 -0.0947 -0.1715** -0.0996 -0.1055 (0.0539) (0.0539) (0.0538) (0.0538) (0.0538) (0.0549) (0.0539) (0.0548) 97Q2 0.0834 0.0439 0.0834 0.0544 0.0544 -0.0286 0.041 0.0482 (0.0511) (0.0506) (0.0511) (0.0505) (0.0505) (0.0524) (0.0506) (0.0508) 97Q3 0.0974 0.0686 0.0939 0.0712 0.0712 -0.0107 0.0626 0.0638 (0.0511) (0.0504) (0.0511) (0.0502) (0.0502) (0.052) (0.0504) (0.0507) 97Q4 0.2858*** 0.2494*** 0.2809*** 0.254*** 0.254*** 0.1952*** 0.2429*** 0.2452*** (0.0515) (0.0508) (0.0514) (0.0508) (0.0508) (0.052) (0.0508) (0.0514) 98Q1 -0.0969 -0.1472** -0.0978 -0.1449** -0.1449** -0.2144*** -0.1512** -0.162** (0.0519) (0.052) (0.0519) (0.052) (0.052) (0.0534) (0.052) (0.0544) 98Q2 -0.0014 -0.0508 -0.0041 -0.0437 -0.0437 -0.128* -0.0544 -0.0549 (0.0505) (0.0504) (0.0504) (0.0502) (0.0502) (0.052) (0.0503) (0.0513) 98Q3 -0.1078* -0.1492** -0.112* -0.1423** -0.1423** -0.2101*** -0.1554** -0.1544** (0.0504) (0.0501) (0.0503) (0.0499) (0.0499) (0.0513) (0.0501) (0.0512) 98Q4 0.0915 0.0427 0.091 0.0563 0.0563 -0.0303 0.0388 0.0428 (0.0507) (0.0505) (0.0506) (0.0505) (0.0505) (0.0518) (0.0505) (0.0521) 99Q1 -0.2412*** -0.3208*** -0.2423*** -0.3189*** -0.3189*** -0.3965*** -0.3245*** -0.3416*** (0.0514) (0.0524) (0.0514) (0.0524) (0.0524) (0.0537) (0.0524) (0.0566) R2 (Within) 0.3085 0.3506 0.3105 0.357 0.357 0.3438 0.3524 0.3095 0.3572 Firm-Quarters 4022 4022 4022 4022 4022 3574 4022 4022 4022 Standard errors are adjusted for panel attrition and accretion.
Structure, Scale, and Scope
42
-1.0 -0.5 0.0 0.5
-1.0
-0.5
0.0
0.5
Figure 1: Stratification by Strategy, Top 25 Firms in 1995Q4
Digital
AcerHP
AST
Compaq
IBM
NCR
ZDS
Packard Bell
Unisys
Gateway
OlivettiTexas Instruments
Toshiba
Seimens
Vobis
Micron
DellSamsung Escom
Trigem
EpsonNEC
Hitachi
Fujitsu

Structure, Scale, and Scope
43
ln(Relative Size)
Sco
pe E
ffect
-10 -5 0
-2.5
-2.0
-1.5
-1.0
-0.5
0.0
0.5
Figure 2: The Effect of Scope Varies by Relative Size
ContractContract
Expand
Olympia
Daewoo
Compaq
Top Related