


Languages
Pages
Legal

STRENGTH OF
ORGANISATIONAL WHISTLEBLOWING PROCESSES –
ANALYSIS FROM AUSTRALIA
Further Results: Whistling While They Work 2
Survey of Organisational Processes & Procedures 2016
A J Brown
Sandra A Lawrence
May 2017

Whistling While They Work 2: Improving managerial responses to whistleblowing
in the public and private sectors*
University researchers
1 Brown, A J Prof Project Leader, Centre for Governance & Public Policy,
Griffith University
2 Brough, Paula Prof School of Applied Psychology, Griffith University
3 Smith, Rodney Prof School of Government & International Relations, University of Sydney
4 Hall, Kath A/Prof ANU College of Law, Australian National University
5 Macaulay, Michael A/Prof Institute for Governance & Policy Studies, Victoria University of
Wellington
Partner researchers
6 Tsahuridu, Eva Dr Manager, Accounting Policy; Policy Advisor, Professional Standards &
Governance ,CPA Australia
7 Walsh, Rodney Mr Senior Assistant Ombudsman, Integrity & Public Interest Disclosure,
Commonwealth Ombudsman
8 Wheeler, Chris Mr Deputy NSW Ombudsman
9 Day, Warren Mr Regional Commissioner, Victoria; Senior Executive Leader,
Assessment & Intelligence, Australian Securities and Investments
Commission
10 Lloyd, Chris Ms Senior Advisor, Integrity, NZ State Services Commission
Partner Organisations
1 CPA Australia
2 Commonwealth Ombudsman
3 NSW Ombudsman
4 WA Public Sector Commission
5 WA Corruption & Crime Commission
6 WA Ombudsman
7 Victorian Independent Broad-based Anticorruption Commission
8 Victorian Ombudsman
9 Queensland Ombudsman
10 South Australian Ombudsman
11 ACT Government
12 NT Commissioner for Public Interest Disclosures
13 Australian Securities & Investments Commission
14 New Zealand State Services Commission
15 New Zealand Ombudsman
16 Australian Council of Superannuation Investors
17 Australian Institute of Company Directors
Supporters
18 Telecommunications Industry Ombudsman
19 South Australia Independent Commissioner Against Corruption
20 Tasmanian Ombudsman
21 Tasmanian Integrity Commission
22 Transparency International Australia
23 Governance Institute of Australia
* Incorporating Australian Research Council Linkage Project LP150100386
‘Protecting While They Prosper? Organisational responses to whistleblowing’
Contents
Acknowledgements
Summary i
1. Introduction 1
2. Measures of process strength 3
3. Results 6
4. Significance and limitations 12
5. Discussion & conclusions 13
6. Bibliography 19
Acknowledgements
This research was undertaken as part of the collaborative research project Whistling While They Work 2: Improving managerial responses to whistleblowing in public and private sector organisations, led by Griffith University, including funding from partner and supporter organisations and the Australian Research Council under ARC Linkage Project LP150100386. The authors thank the Australian Research Council, their colleagues on the Project Team and the partner organisations listed at www.whistlingwhiletheywork.edu.au, and for their assistance with this research.
Special thanks to Nerisa Dozo and Peter Roberts for their assistance with this survey.
The findings and views expressed are those of the authors and do not necessarily represent the views of the Australian Research Council or the partner organisations.
Project contacts:
Professor A J Brown, Project Leader <[email protected]>
Dr Nerisa Dozo, Survey & Business Manager <[email protected]>
Dr Sandra A. Lawrence, Senior Research Fellow <[email protected]>
www.whistlingwhiletheywork.edu.au
This report can be cited as: A J Brown and S A Lawrence (2017), Strength of Organisational Whistleblowing
Processes: Analysis from Australia. Further results of the Whistling While They Work 2 Project, Griffith
University: Brisbane, May 2017.
© Griffith University 2017
i
STRENGTH OF ORGANISATIONAL WHISTLEBLOWING PROCESSES –
ANALYSIS FROM AUSTRALIA
SUMMARY
Whistleblowing processes – or processes for encouraging and protecting staff to speak up about
wrongdoing concerns and integrity challenges – are vital to integrity and good governance systems
in organisations.
This report presents the first stage of a new measure of the strength of organisational processes
for responding to staff wrongdoing concerns, based on responses to the Survey of Organisational
Processes and Procedures conducted in 2016 by Whistling While They Work 2: Improving
managerial responses to whistleblowing in public and private sector organisations.
The analysis uses results from five questions to create a scale measure (expressed as a score out
of 10) of strength of processes reported for 699 organisations, across 19 sector/jurisdiction groups:
10 public sector jurisdictions (Australia and New Zealand)
5 private industry sector groups (Australia only), and
4 not-for-profit industry sector groups (Australia only).
This report includes Australian results (634 organisations) in 18 sector/jurisdiction groups. New
Zealand results will be released shortly.
The five sub-scales measure relative strength of processes for incident reporting and tracking;
whether there is an active support strategy for staff who raise concerns; whether there are risk
assessment processes for anticipating and preventing detrimental actions or reprisals; whether
there are dedicated supports or only generalised supports for staff who report; and strength of
processes for remediation of detrimental impacts or reprisals, if they occur.
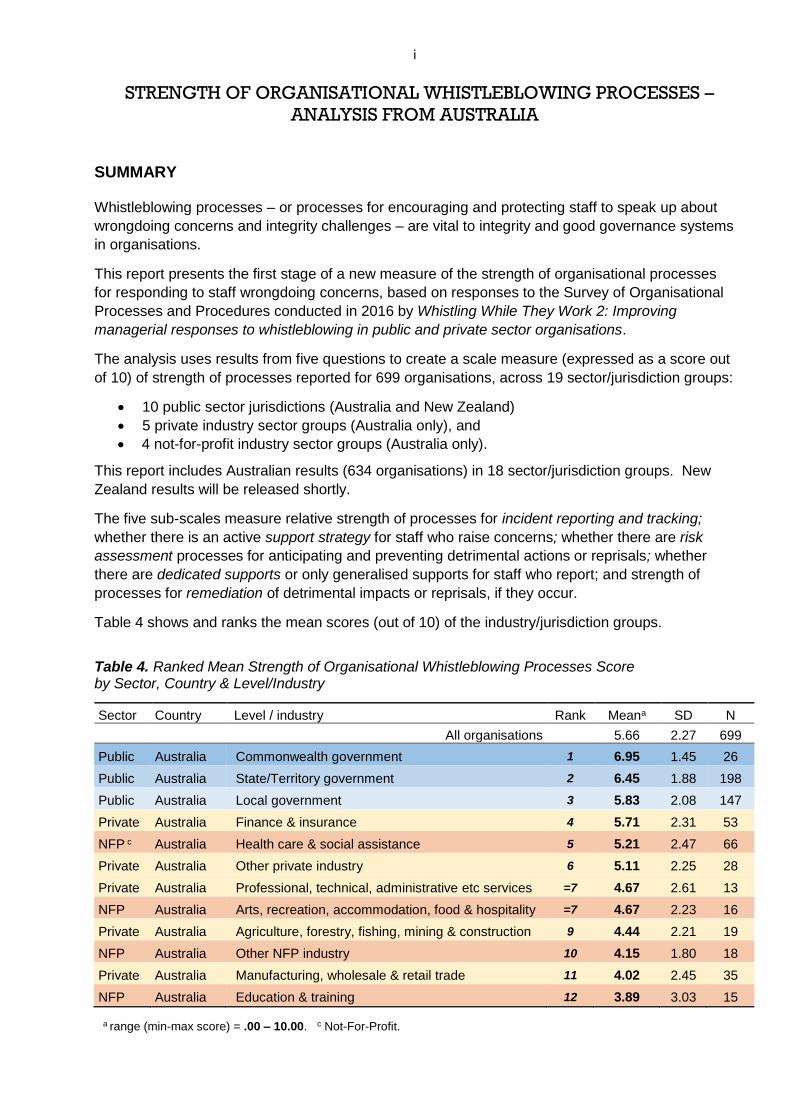
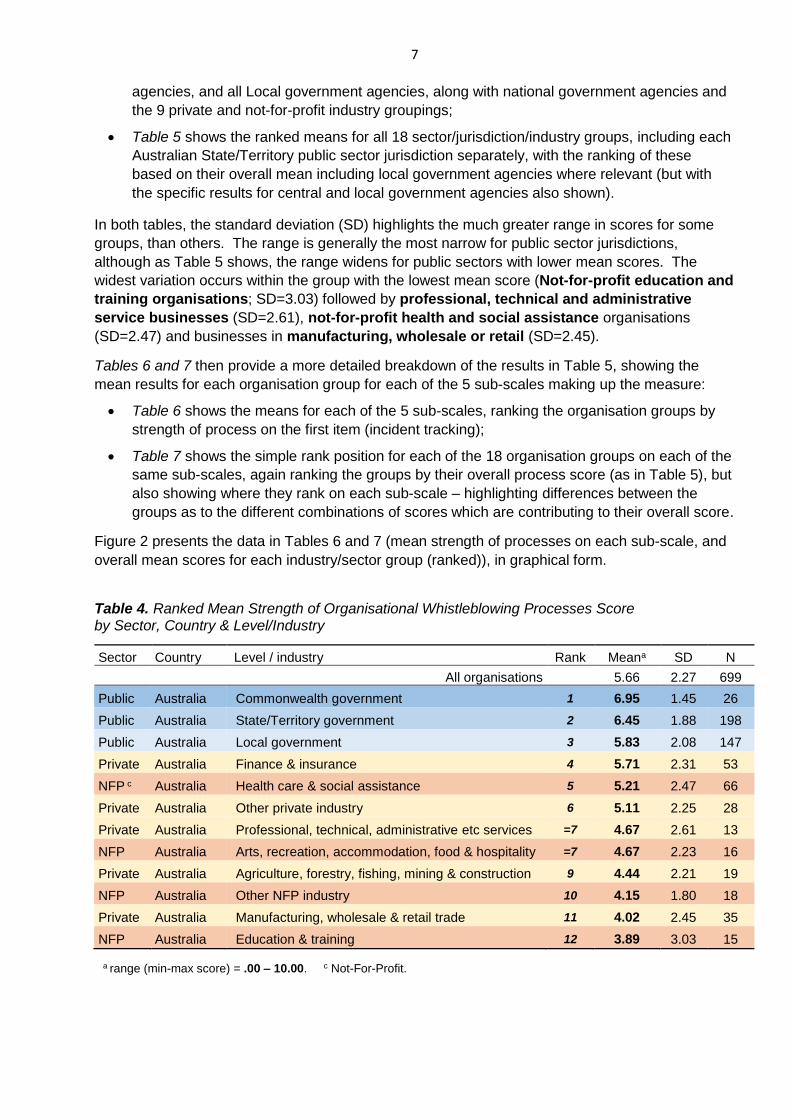
Table 4 shows and ranks the mean scores (out of 10) of the industry/jurisdiction groups.
Table 4. Ranked Mean Strength of Organisational Whistleblowing Processes Score by Sector, Country & Level/Industry
Sector Country Level / industry Rank Meana SD N
All organisations 5.66 2.27 699
Public Australia Commonwealth government 1 6.95 1.45 26
Public Australia State/Territory government 2 6.45 1.88 198
Public Australia Local government 3 5.83 2.08 147
Private Australia Finance & insurance 4 5.71 2.31 53
NFP c Australia Health care & social assistance 5 5.21 2.47 66
Private Australia Other private industry 6 5.11 2.25 28
Private Australia Professional, technical, administrative etc services =7 4.67 2.61 13
NFP Australia Arts, recreation, accommodation, food & hospitality =7 4.67 2.23 16
Private Australia Agriculture, forestry, fishing, mining & construction 9 4.44 2.21 19
NFP Australia Other NFP industry 10 4.15 1.80 18
Private Australia Manufacturing, wholesale & retail trade 11 4.02 2.45 35
NFP Australia Education & training 12 3.89 3.03 15
a range (min-max score) = .00 – 10.00. c Not-For-Profit.
ii
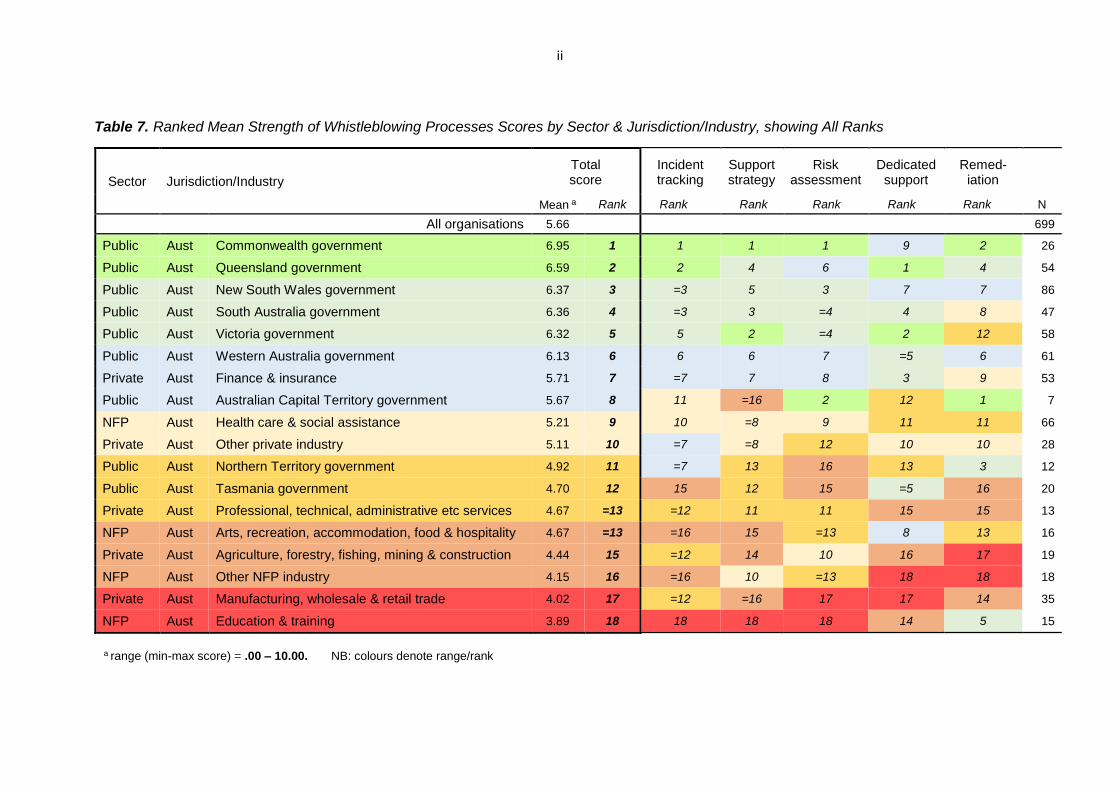
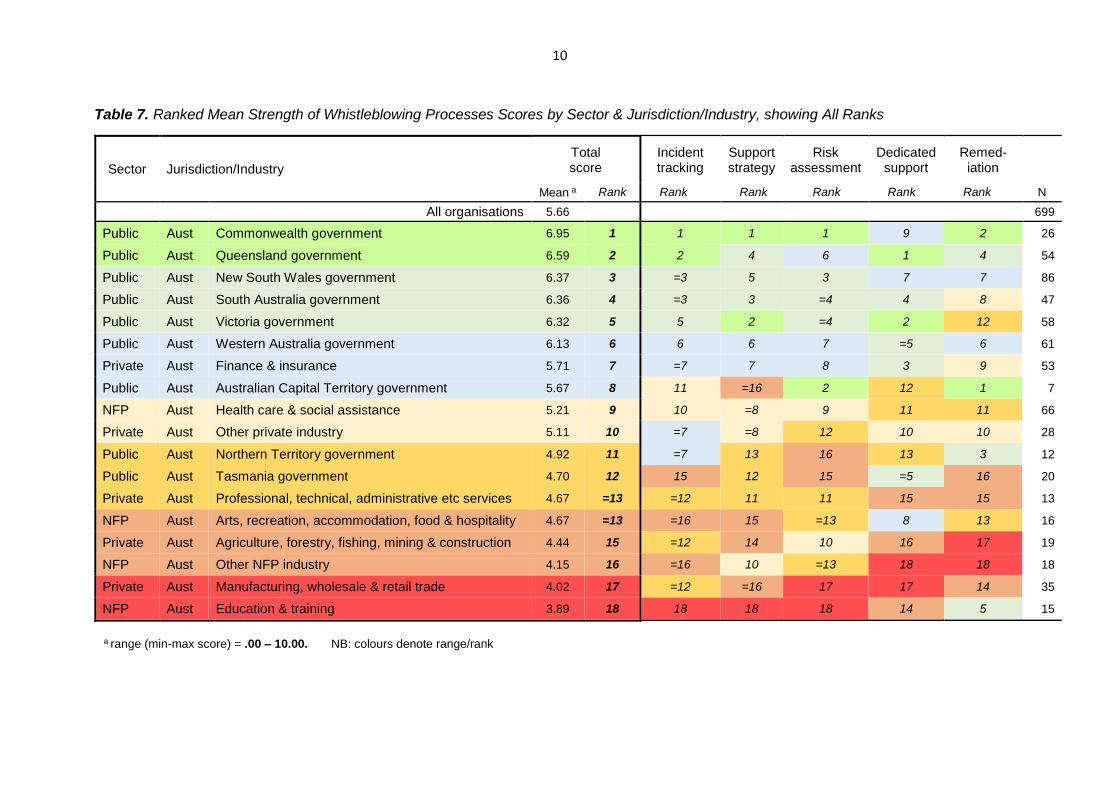
Table 7. Ranked Mean Strength of Whistleblowing Processes Scores by Sector & Jurisdiction/Industry, showing All Ranks
Sector Jurisdiction/Industry
Total score
Incident tracking
Support strategy
Risk assessment
Dedicated support
Remed-iation
Mean a Rank Rank Rank Rank Rank Rank N
All organisations 5.66 699
Public Aust Commonwealth government 6.95 1 1 1 1 9 2 26
Public Aust Queensland government 6.59 2 2 4 6 1 4 54
Public Aust New South Wales government 6.37 3 =3 5 3 7 7 86
Public Aust South Australia government 6.36 4 =3 3 =4 4 8 47
Public Aust Victoria government 6.32 5 5 2 =4 2 12 58
Public Aust Western Australia government 6.13 6 6 6 7 =5 6 61
Private Aust Finance & insurance 5.71 7 =7 7 8 3 9 53
Public Aust Australian Capital Territory government 5.67 8 11 =16 2 12 1 7
NFP Aust Health care & social assistance 5.21 9 10 =8 9 11 11 66
Private Aust Other private industry 5.11 10 =7 =8 12 10 10 28
Public Aust Northern Territory government 4.92 11 =7 13 16 13 3 12
Public Aust Tasmania government 4.70 12 15 12 15 =5 16 20
Private Aust Professional, technical, administrative etc services 4.67 =13 =12 11 11 15 15 13
NFP Aust Arts, recreation, accommodation, food & hospitality 4.67 =13 =16 15 =13 8 13 16
Private Aust Agriculture, forestry, fishing, mining & construction 4.44 15 =12 14 10 16 17 19
NFP Aust Other NFP industry 4.15 16 =16 10 =13 18 18 18
Private Aust Manufacturing, wholesale & retail trade 4.02 17 =12 =16 17 17 14 35
NFP Aust Education & training 3.89 18 18 18 18 14 5 15
a range (min-max score) = .00 – 10.00. NB: colours denote range/rank

iii
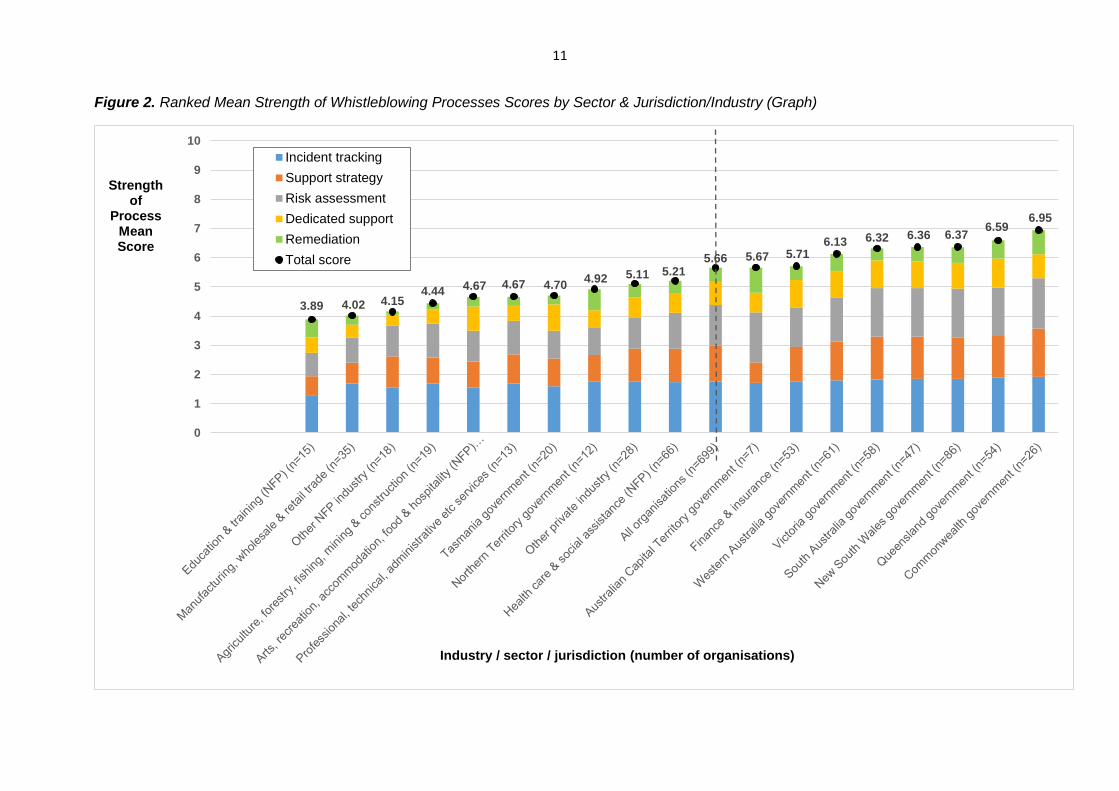
Figure 2. Ranked Mean Strength of Whistleblowing Processes Scores by Sector & Jurisdiction/Industry (Graph)
3.89 4.02 4.154.44 4.67 4.67 4.70
4.92 5.11 5.215.66 5.67 5.71
6.13 6.32 6.36 6.376.59
6.95
0
1
2
3
4
5
6
7
8
9
10
Incident tracking
Support strategy
Risk assessment
Dedicated support
Remediation
Total score
Strengthof
ProcessMean Score
Industry / sector / jurisdiction (number of organisations)
iv
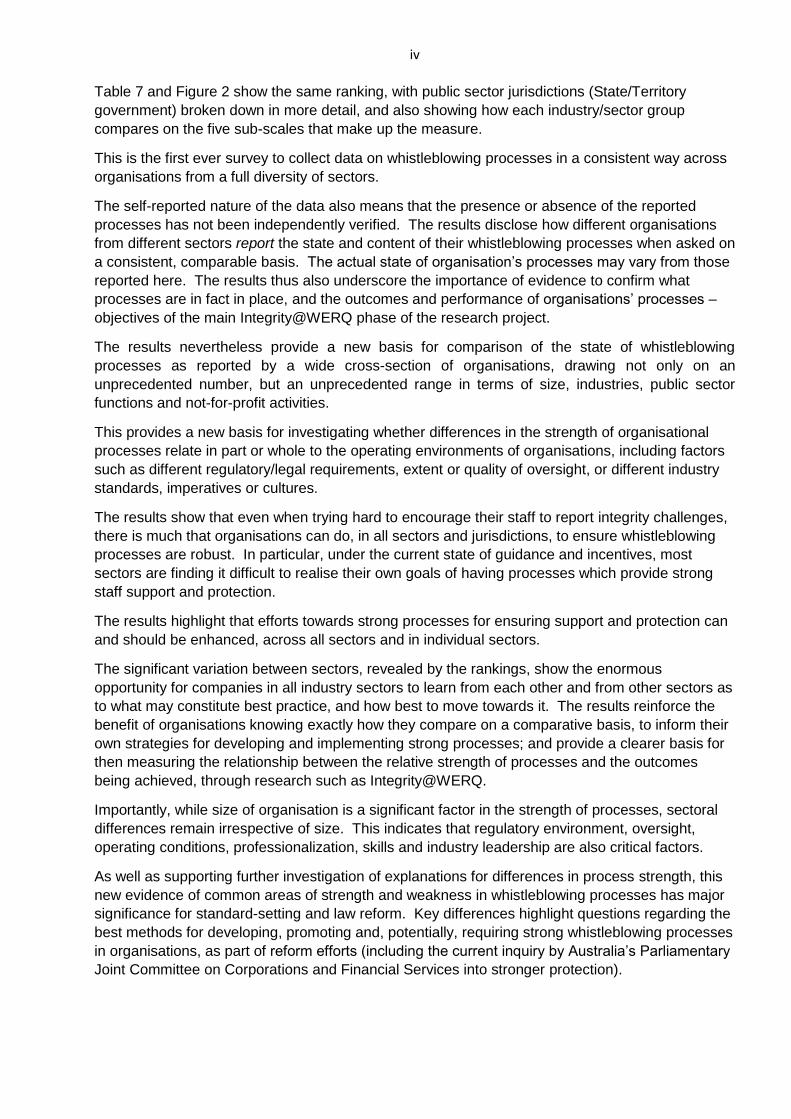
Table 7 and Figure 2 show the same ranking, with public sector jurisdictions (State/Territory
government) broken down in more detail, and also showing how each industry/sector group
compares on the five sub-scales that make up the measure.
This is the first ever survey to collect data on whistleblowing processes in a consistent way across
organisations from a full diversity of sectors.
The self-reported nature of the data also means that the presence or absence of the reported
processes has not been independently verified. The results disclose how different organisations
from different sectors report the state and content of their whistleblowing processes when asked on
a consistent, comparable basis. The actual state of organisation’s processes may vary from those
reported here. The results thus also underscore the importance of evidence to confirm what
processes are in fact in place, and the outcomes and performance of organisations’ processes –
objectives of the main Integrity@WERQ phase of the research project.
The results nevertheless provide a new basis for comparison of the state of whistleblowing
processes as reported by a wide cross-section of organisations, drawing not only on an
unprecedented number, but an unprecedented range in terms of size, industries, public sector
functions and not-for-profit activities.
This provides a new basis for investigating whether differences in the strength of organisational
processes relate in part or whole to the operating environments of organisations, including factors
such as different regulatory/legal requirements, extent or quality of oversight, or different industry
standards, imperatives or cultures.
The results show that even when trying hard to encourage their staff to report integrity challenges,
there is much that organisations can do, in all sectors and jurisdictions, to ensure whistleblowing
processes are robust. In particular, under the current state of guidance and incentives, most
sectors are finding it difficult to realise their own goals of having processes which provide strong
staff support and protection.
The results highlight that efforts towards strong processes for ensuring support and protection can
and should be enhanced, across all sectors and in individual sectors.
The significant variation between sectors, revealed by the rankings, show the enormous
opportunity for companies in all industry sectors to learn from each other and from other sectors as
to what may constitute best practice, and how best to move towards it. The results reinforce the
benefit of organisations knowing exactly how they compare on a comparative basis, to inform their
own strategies for developing and implementing strong processes; and provide a clearer basis for
then measuring the relationship between the relative strength of processes and the outcomes
being achieved, through research such as Integrity@WERQ.
Importantly, while size of organisation is a significant factor in the strength of processes, sectoral
differences remain irrespective of size. This indicates that regulatory environment, oversight,
operating conditions, professionalization, skills and industry leadership are also critical factors.
As well as supporting further investigation of explanations for differences in process strength, this
new evidence of common areas of strength and weakness in whistleblowing processes has major
significance for standard-setting and law reform. Key differences highlight questions regarding the
best methods for developing, promoting and, potentially, requiring strong whistleblowing processes
in organisations, as part of reform efforts (including the current inquiry by Australia’s Parliamentary
Joint Committee on Corporations and Financial Services into stronger protection).
1
STRENGTH OF ORGANISATIONAL WHISTLEBLOWING PROCESSES –
ANALYSIS FROM AUSTRALIA
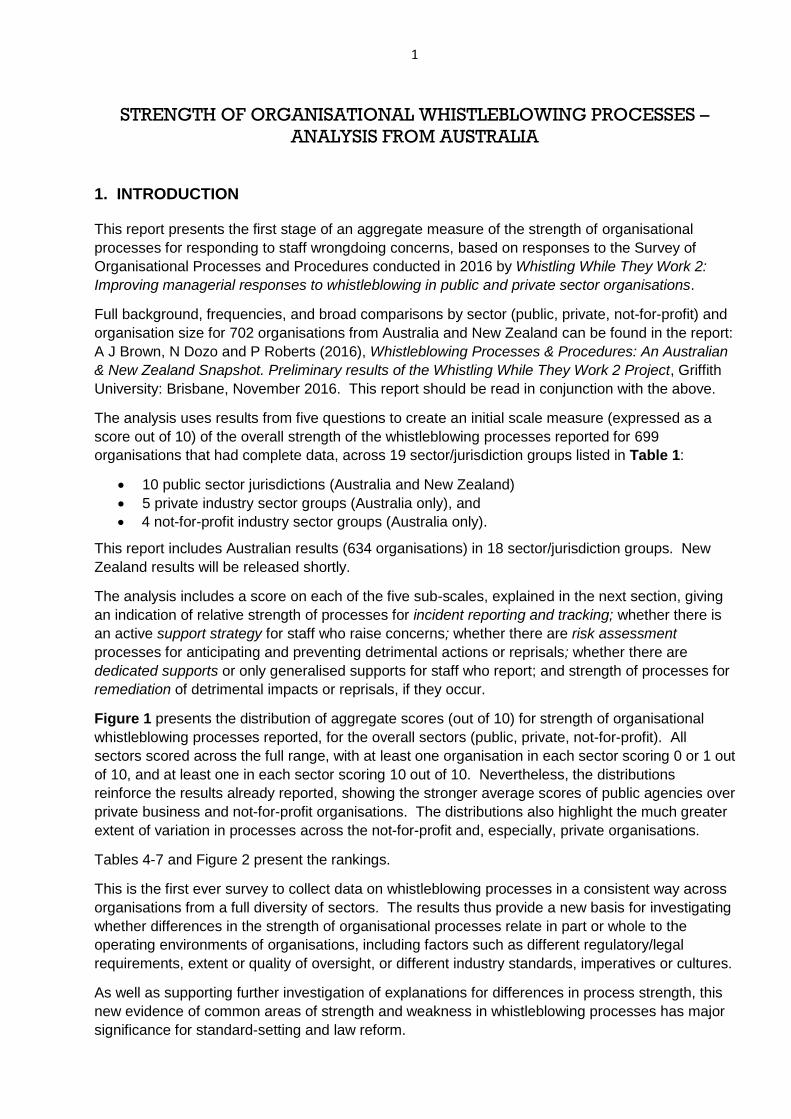
1. INTRODUCTION
This report presents the first stage of an aggregate measure of the strength of organisational
processes for responding to staff wrongdoing concerns, based on responses to the Survey of
Organisational Processes and Procedures conducted in 2016 by Whistling While They Work 2:
Improving managerial responses to whistleblowing in public and private sector organisations.
Full background, frequencies, and broad comparisons by sector (public, private, not-for-profit) and
organisation size for 702 organisations from Australia and New Zealand can be found in the report:
A J Brown, N Dozo and P Roberts (2016), Whistleblowing Processes & Procedures: An Australian
& New Zealand Snapshot. Preliminary results of the Whistling While They Work 2 Project, Griffith
University: Brisbane, November 2016. This report should be read in conjunction with the above.
The analysis uses results from five questions to create an initial scale measure (expressed as a
score out of 10) of the overall strength of the whistleblowing processes reported for 699
organisations that had complete data, across 19 sector/jurisdiction groups listed in Table 1:
10 public sector jurisdictions (Australia and New Zealand)
5 private industry sector groups (Australia only), and
4 not-for-profit industry sector groups (Australia only).
This report includes Australian results (634 organisations) in 18 sector/jurisdiction groups. New
Zealand results will be released shortly.
The analysis includes a score on each of the five sub-scales, explained in the next section, giving
an indication of relative strength of processes for incident reporting and tracking; whether there is
an active support strategy for staff who raise concerns; whether there are risk assessment
processes for anticipating and preventing detrimental actions or reprisals; whether there are
dedicated supports or only generalised supports for staff who report; and strength of processes for
remediation of detrimental impacts or reprisals, if they occur.
Figure 1 presents the distribution of aggregate scores (out of 10) for strength of organisational
whistleblowing processes reported, for the overall sectors (public, private, not-for-profit). All
sectors scored across the full range, with at least one organisation in each sector scoring 0 or 1 out
of 10, and at least one in each sector scoring 10 out of 10. Nevertheless, the distributions
reinforce the results already reported, showing the stronger average scores of public agencies over
private business and not-for-profit organisations. The distributions also highlight the much greater
extent of variation in processes across the not-for-profit and, especially, private organisations.
Tables 4-7 and Figure 2 present the rankings.
This is the first ever survey to collect data on whistleblowing processes in a consistent way across
organisations from a full diversity of sectors. The results thus provide a new basis for investigating
whether differences in the strength of organisational processes relate in part or whole to the
operating environments of organisations, including factors such as different regulatory/legal
requirements, extent or quality of oversight, or different industry standards, imperatives or cultures.
As well as supporting further investigation of explanations for differences in process strength, this
new evidence of common areas of strength and weakness in whistleblowing processes has major
significance for standard-setting and law reform.

2
Table 1. Organisations grouped by sector and jurisdiction/industry
Sector Jurisdiction/Industry
No. of organisations
Central govt
Local govt
Total
Public
(Australia & New Zealand)
1 Australian Commonwealth government 26 -- 26
2 Australian Capital Territory (ACT) government 7 -- 7
3 Northern Territory (NT) government 9 3 12
4 New South Wales (NSW) government 50 36 86
5 Queensland (QLD) government 33 21 54
6 South Australian (SA) government 13 34 47
7 Tasmanian (TAS) government 12 8 20
8 Victorian (VIC) government 33 25 58
9 Western Australian (WA) government 41 20 61
10 New Zealand (NZ) government 47 18 65
Private
(Australia) 11 Agriculture, forestry, fishing, mining & construction n/a n/a 19
12 Finance & insurance (inc banking) n/a n/a 53
13 Manufacturing, wholesale & retail trade n/a n/a 35
14 Professional, technical, administrative, real estate, information & media services
n/a n/a 13
15 Other private sector n/a n/a 28
Not-for-profit (NFP)
(Australia)
16 Arts, recreation, accommodation, food & hospitality n/a n/a 16
17 Education & training n/a n/a 15
18 Health care & social assistance n/a n/a 66
19 Other NFP sector n/a n/a 18
Total 699
Figure 1. Strength of Wrongdoing Reporting Processes (699 Organisations)
The range of scores out of 10 for the strength of whistleblowing processes, on our first stage analysis, among organisations responding to the 2016 Survey of Organisational Processes & Procedures.
0%
5%
10%
15%
20%
25%
0 1 2 3 4 5 6 7 8 9 10
Public agencies (n=436) Private companies (n=148)
Not-for-profit companies (n=115) All organisations (n=699)
Score - Strength of Whistleblowing Processes
Pro
po
rtio
n o
f o
rgs
wit
h e
ach
sco
re
% of orgs with stronger processes
% of orgs with weaker
processes
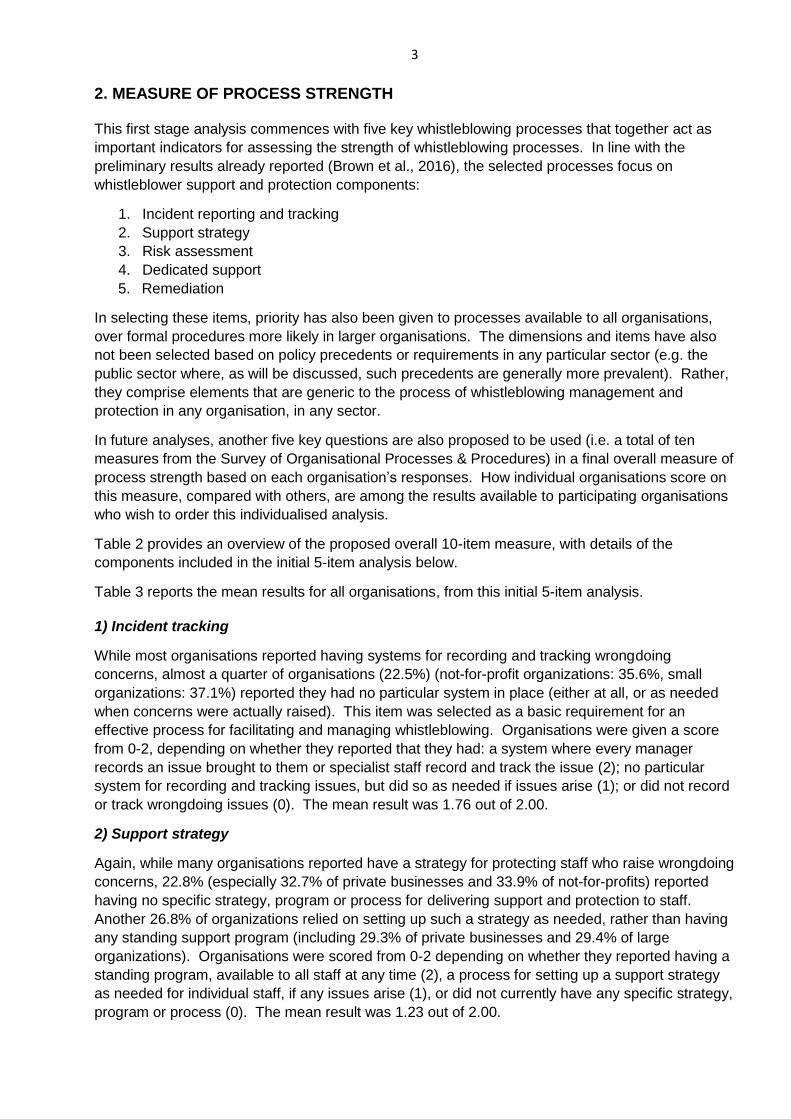
3
2. MEASURE OF PROCESS STRENGTH
This first stage analysis commences with five key whistleblowing processes that together act as
important indicators for assessing the strength of whistleblowing processes. In line with the
preliminary results already reported (Brown et al., 2016), the selected processes focus on
whistleblower support and protection components:
1. Incident reporting and tracking
2. Support strategy
3. Risk assessment
4. Dedicated support
5. Remediation
In selecting these items, priority has also been given to processes available to all organisations,
over formal procedures more likely in larger organisations. The dimensions and items have also
not been selected based on policy precedents or requirements in any particular sector (e.g. the
public sector where, as will be discussed, such precedents are generally more prevalent). Rather,
they comprise elements that are generic to the process of whistleblowing management and
protection in any organisation, in any sector.
In future analyses, another five key questions are also proposed to be used (i.e. a total of ten
measures from the Survey of Organisational Processes & Procedures) in a final overall measure of
process strength based on each organisation’s responses. How individual organisations score on
this measure, compared with others, are among the results available to participating organisations
who wish to order this individualised analysis.
Table 2 provides an overview of the proposed overall 10-item measure, with details of the
components included in the initial 5-item analysis below.
Table 3 reports the mean results for all organisations, from this initial 5-item analysis.
1) Incident tracking
While most organisations reported having systems for recording and tracking wrongdoing
concerns, almost a quarter of organisations (22.5%) (not-for-profit organizations: 35.6%, small
organizations: 37.1%) reported they had no particular system in place (either at all, or as needed
when concerns were actually raised). This item was selected as a basic requirement for an
effective process for facilitating and managing whistleblowing. Organisations were given a score
from 0-2, depending on whether they reported that they had: a system where every manager
records an issue brought to them or specialist staff record and track the issue (2); no particular
system for recording and tracking issues, but did so as needed if issues arise (1); or did not record
or track wrongdoing issues (0). The mean result was 1.76 out of 2.00.
2) Support strategy
Again, while many organisations reported have a strategy for protecting staff who raise wrongdoing
concerns, 22.8% (especially 32.7% of private businesses and 33.9% of not-for-profits) reported
having no specific strategy, program or process for delivering support and protection to staff.
Another 26.8% of organizations relied on setting up such a strategy as needed, rather than having
any standing support program (including 29.3% of private businesses and 29.4% of large
organizations). Organisations were scored from 0-2 depending on whether they reported having a
standing program, available to all staff at any time (2), a process for setting up a support strategy
as needed for individual staff, if any issues arise (1), or did not currently have any specific strategy,
program or process (0). The mean result was 1.23 out of 2.00.
4
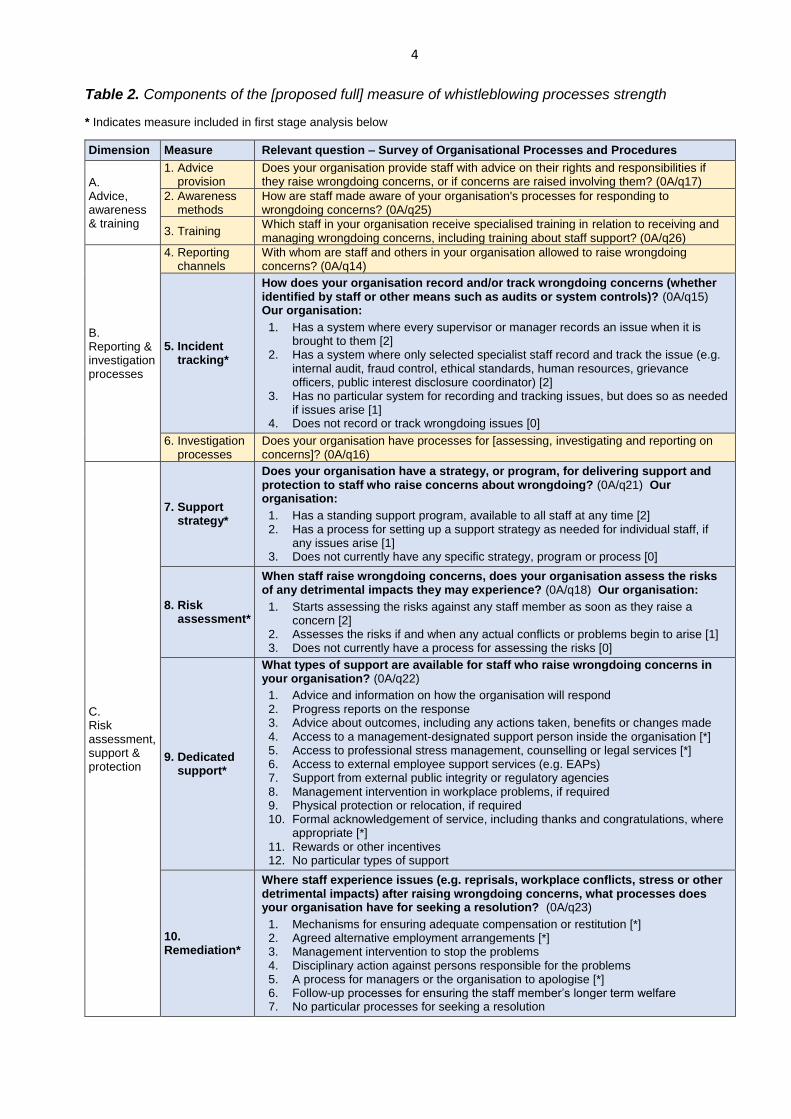
Table 2. Components of the [proposed full] measure of whistleblowing processes strength
* Indicates measure included in first stage analysis below
Dimension Measure Relevant question – Survey of Organisational Processes and Procedures
A. Advice, awareness & training
1. Advice provision
Does your organisation provide staff with advice on their rights and responsibilities if they raise wrongdoing concerns, or if concerns are raised involving them? (0A/q17)
2. Awareness methods
How are staff made aware of your organisation's processes for responding to wrongdoing concerns? (0A/q25)
3. Training Which staff in your organisation receive specialised training in relation to receiving and managing wrongdoing concerns, including training about staff support? (0A/q26)
B. Reporting & investigation processes
4. Reporting channels
With whom are staff and others in your organisation allowed to raise wrongdoing concerns? (0A/q14)
5. Incident tracking*
How does your organisation record and/or track wrongdoing concerns (whether identified by staff or other means such as audits or system controls)? (0A/q15) Our organisation:
1. Has a system where every supervisor or manager records an issue when it is brought to them [2]
2. Has a system where only selected specialist staff record and track the issue (e.g. internal audit, fraud control, ethical standards, human resources, grievance officers, public interest disclosure coordinator) [2]
3. Has no particular system for recording and tracking issues, but does so as needed if issues arise [1]
4. Does not record or track wrongdoing issues [0]
6. Investigation processes
Does your organisation have processes for [assessing, investigating and reporting on concerns]? (0A/q16)
C. Risk assessment, support & protection
7. Support strategy*
Does your organisation have a strategy, or program, for delivering support and protection to staff who raise concerns about wrongdoing? (0A/q21) Our organisation:
1. Has a standing support program, available to all staff at any time [2] 2. Has a process for setting up a support strategy as needed for individual staff, if
any issues arise [1] 3. Does not currently have any specific strategy, program or process [0]
8. Risk assessment*
When staff raise wrongdoing concerns, does your organisation assess the risks of any detrimental impacts they may experience? (0A/q18) Our organisation:
1. Starts assessing the risks against any staff member as soon as they raise a concern [2]
2. Assesses the risks if and when any actual conflicts or problems begin to arise [1] 3. Does not currently have a process for assessing the risks [0]
9. Dedicated support*
What types of support are available for staff who raise wrongdoing concerns in your organisation? (0A/q22)
1. Advice and information on how the organisation will respond 2. Progress reports on the response 3. Advice about outcomes, including any actions taken, benefits or changes made 4. Access to a management-designated support person inside the organisation [*] 5. Access to professional stress management, counselling or legal services [*] 6. Access to external employee support services (e.g. EAPs) 7. Support from external public integrity or regulatory agencies 8. Management intervention in workplace problems, if required 9. Physical protection or relocation, if required 10. Formal acknowledgement of service, including thanks and congratulations, where
appropriate [*] 11. Rewards or other incentives 12. No particular types of support
10. Remediation*
Where staff experience issues (e.g. reprisals, workplace conflicts, stress or other detrimental impacts) after raising wrongdoing concerns, what processes does your organisation have for seeking a resolution? (0A/q23)
1. Mechanisms for ensuring adequate compensation or restitution [*] 2. Agreed alternative employment arrangements [*] 3. Management intervention to stop the problems 4. Disciplinary action against persons responsible for the problems 5. A process for managers or the organisation to apologise [*] 6. Follow-up processes for ensuring the staff member’s longer term welfare 7. No particular processes for seeking a resolution
5
3) Risk assessment
Most organisations reported that when staff raise wrongdoing concerns, the organisation assesses
the risks of detrimental impacts they may experience (for example, stress, workplace conflict,
reprisals or other repercussions). However, over a third of organizations (37.7%), including
approximately half of businesses and not-for-profits (48.7% and 51.3% respectively), indicated they
did not assess the risks of detrimental impacts, either at all or until actual conflicts or problems
began to arise. Organisations were scored from 0-2 depending on whether they reported that they
started assessing the risks as soon as the staff member raised a concern (2), assessed the risks if
and when any actual conflicts or problems began to arise (1), or did not currently have a process
for assessing the risks (0). The mean was 1.39 out of 2.00.
4) Dedicated support
Almost all organisations (96.2%) reported availability of at least one of the nominated types of
support for staff who raise wrongdoing concerns. However, most support types either related to
the provision of information or advice, rather than more active or concrete support; or involved
access to general support services for any staff experiencing workplace problems. This is
notwithstanding the different (higher) level of conflicts, pressures and reprisal risks often present in
internal whistleblowing situations. Less than half of organisations (46.2%) reported that staff had
access to a management-designated support person inside the organisation (only 39.3% of private
business and 32.2% of not-for-profits); and less than a third (31.2%) reported that formal
acknowledgement of service such as thanks or congratulations, where appropriate, were available.
Each organisation was scored on how many of three, basic but tailored or ‘dedicated’ support
types were identified as available for staff who raise concerns: access to a management-
designated support person inside the organisation; access to professional stress management,
counselling or legal services (over and above other employee assistance programs); and formal
acknowledgement including thanks and congratulations, where appropriate. The score of 0-3 was
scaled back to a score of between 0-2 for easier comparison with the other results. The mean
result was 0.79 out of 2.00.
5) Remediation
A major objective of whistleblowing systems is to ensure that if those who report wrongdoing do
suffer reprisals or other detrimental impacts, these problems are addressed and damage is “made
good” where possible. Three-quarters of organisations reported they would respond to reprisals or
detrimental impacts through management intervention to stop the problem (77.2%) or disciplinary
action against persons responsible (74.4%). However, only 34.8% of organizations (including
26.0% of business and 21.7% of not-for-profits) reported having agreed alternative employment
arrangements; and 22.1% (including 14.0% of business and 23.5% of not-for-profits) had a process
for managers or the organization to apologise. Less than a fifth (16.4%) of organizations reported
having mechanisms for ensuring adequate compensation or restitution.
This element was assessed by scoring each organisation on how many of three basic processes
for seeking a resolution were nominated as available: mechanisms for ensuring adequate
compensation or restitution; agreed alternative employment arrangements; and a process for
managers or the organisation to apologise. The resulting score of 0-3 was then scaled back to a
score of between 0-2 for easier comparison with the other results. The mean was 0.49 out of 2.00.
Strength of Whistleblowing Processes
Finally, a composite of the strength of processes was created by adding the scores for each of the
above. As all the above five variables ranged from 0-2, the resulting score for overall strength of
whistleblowing processes score ranged from 0-10. The mean was 5.66 out of 10.
6
3. RESULTS
Figure 1 above showed the range and distribution of aggregate scores for strength of
whistleblowing processes by overall sector (public, private, not-for-profit). The distributions confirm
the higher relative strength of processes recorded for the public sector, while highlighting the much
greater extent of variation in process strength across the private and not-for-profit sectors.
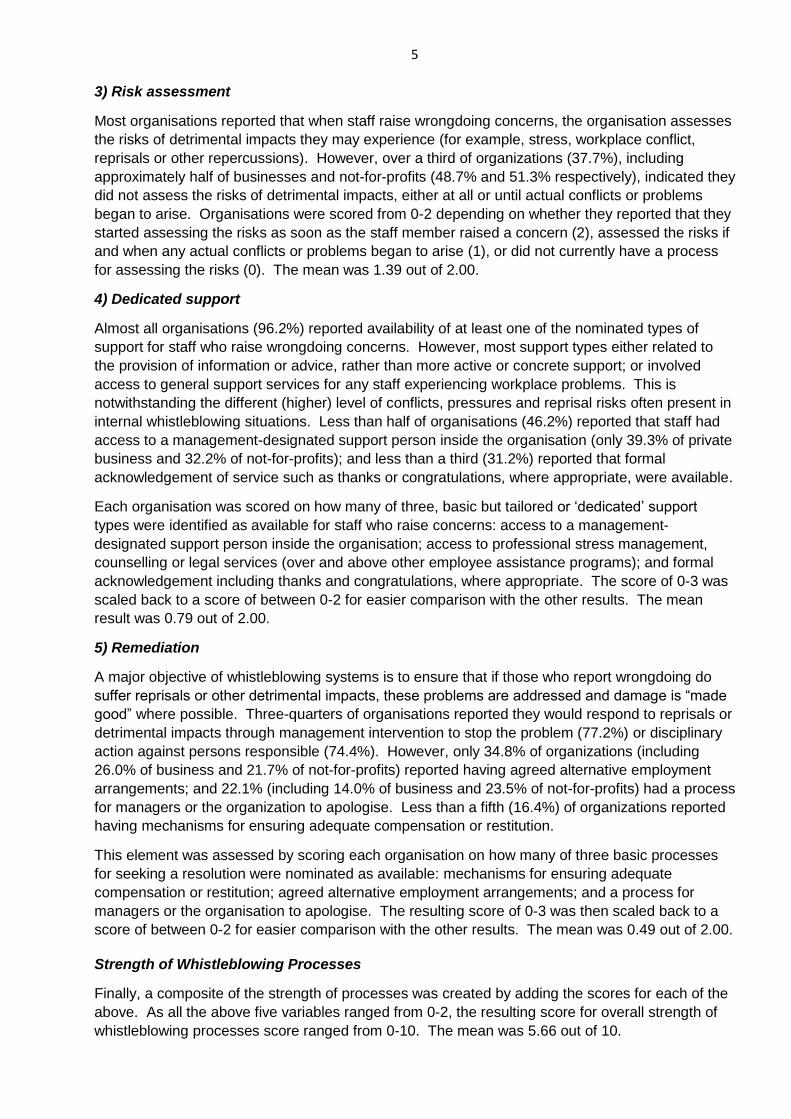
Table 3 reports the mean results for all 699 organisations, on each measure and the overall
strength of whistleblowing processes scale. Significant bivariate correlations confirm the extent to
which public agencies are associated with stronger whistleblowing process, and private and not-
for-profit companies associated with weaker whistleblowing processes. This is the case for the
overall measure, and also strongly the case for two of the constituent elements (support strategy
and risk assessment) with greater variation in this correlation for the other three elements.
Importantly, all the whistleblowing process measures correlate strongly with size, i.e. all scores
increased as the size of the organisation increased. However, as also shown, when the effect of
size was controlled for in a subsequent partial correlation analysis, there remained a significant
positive relationship between the strength of whistleblowing processes and public sector
organisations (r = .23, p < .001) and significant negative relationships between the strength of
whistleblowing processes and private and NFP sector organisations (r = -.17, p < .001 and r = -.11,
p < .01, respectively). These results confirm the differences between sectors are not produced by
the size of the organisations in these sectors, but rather by others factors (see Discussion).
Table 3. Descriptive Statistics and Bivariate Correlations between Strength of Whistleblowing Processes and Organizational Demographic Factors
Descriptives Bivariate Correlations
Variables Mean SD Range Public Sector
Private Sector
NFP a Sector
Org. Size b
Incident tracking 1.76 .44 0-2.00 .14*** -.04 -.13*** .24***
Support strategy 1.23 .82 0-2.00 .20*** -.14*** -.11*** .20***
Risk assessment 1.39 .78 0-2.00 .26*** -.17*** -.15*** .21***
Dedicated support .79 .72 0-2.00 .15*** -.08* -.10** .14***
Remediation .49 .65 0-2.00 .12** -.08* -.07 .21**
Strength of Whistleblowing Processes
5.66 2.27 0-10.00 .27*** -.16*** -.17*** .30***
Strength of Whistleblowing Processes (Partial correlation controlling for size)
.23*** -.17*** -.11** n/a
*** p < .001; ** p < .01; * p < .05. N = 699 a Not-For-Profit. b Size = small (100 or less employees), medium (101-1000), large (over 1000).
Tables 4 and 5 both report the score out of 10 for strength of whistleblowing processes for each of
the main jurisdictions/sectors (levels of government and industry/NFP sectors), ranked from the
mean showing the strongest average processes, to the weakest average processes. These tables
present the same results in two different ways:
Table 4 shows the ranked means at a broad level, collapsing all Australian State and
Territory public sector jurisdictions to show the results for all State/Territory government
7
agencies, and all Local government agencies, along with national government agencies and
the 9 private and not-for-profit industry groupings;
Table 5 shows the ranked means for all 18 sector/jurisdiction/industry groups, including each
Australian State/Territory public sector jurisdiction separately, with the ranking of these
based on their overall mean including local government agencies where relevant (but with
the specific results for central and local government agencies also shown).
In both tables, the standard deviation (SD) highlights the much greater range in scores for some
groups, than others. The range is generally the most narrow for public sector jurisdictions,
although as Table 5 shows, the range widens for public sectors with lower mean scores. The
widest variation occurs within the group with the lowest mean score (Not-for-profit education and
training organisations; SD=3.03) followed by professional, technical and administrative
service businesses (SD=2.61), not-for-profit health and social assistance organisations
(SD=2.47) and businesses in manufacturing, wholesale or retail (SD=2.45).
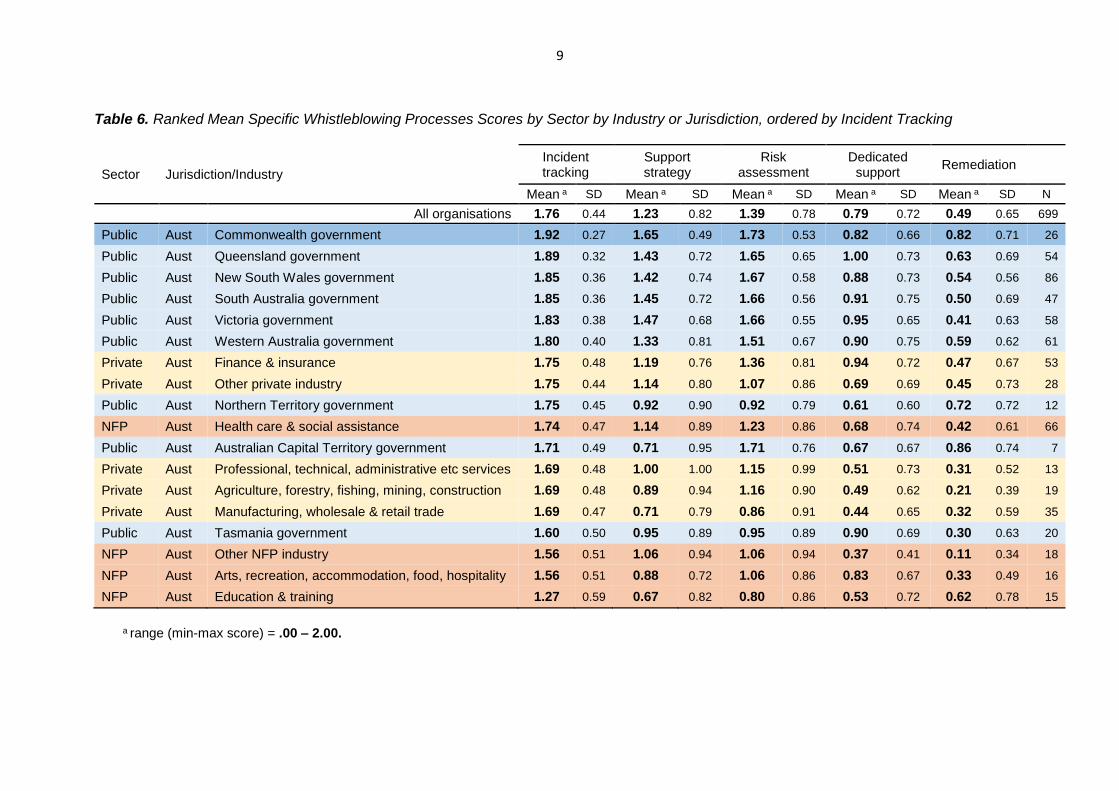
Tables 6 and 7 then provide a more detailed breakdown of the results in Table 5, showing the
mean results for each organisation group for each of the 5 sub-scales making up the measure:
Table 6 shows the means for each of the 5 sub-scales, ranking the organisation groups by
strength of process on the first item (incident tracking);
Table 7 shows the simple rank position for each of the 18 organisation groups on each of the
same sub-scales, again ranking the groups by their overall process score (as in Table 5), but
also showing where they rank on each sub-scale – highlighting differences between the
groups as to the different combinations of scores which are contributing to their overall score.
Figure 2 presents the data in Tables 6 and 7 (mean strength of processes on each sub-scale, and
overall mean scores for each industry/sector group (ranked)), in graphical form.
Table 4. Ranked Mean Strength of Organisational Whistleblowing Processes Score by Sector, Country & Level/Industry
Sector Country Level / industry Rank Meana SD N
All organisations 5.66 2.27 699
Public Australia Commonwealth government 1 6.95 1.45 26
Public Australia State/Territory government 2 6.45 1.88 198
Public Australia Local government 3 5.83 2.08 147
Private Australia Finance & insurance 4 5.71 2.31 53
NFP c Australia Health care & social assistance 5 5.21 2.47 66
Private Australia Other private industry 6 5.11 2.25 28
Private Australia Professional, technical, administrative etc services =7 4.67 2.61 13
NFP Australia Arts, recreation, accommodation, food & hospitality =7 4.67 2.23 16
Private Australia Agriculture, forestry, fishing, mining & construction 9 4.44 2.21 19
NFP Australia Other NFP industry 10 4.15 1.80 18
Private Australia Manufacturing, wholesale & retail trade 11 4.02 2.45 35
NFP Australia Education & training 12 3.89 3.03 15
a range (min-max score) = .00 – 10.00. c Not-For-Profit.

8
Table 5. Ranked Mean Strength of Organisational Whistleblowing Processes Score by Sector and Industry/Jurisdiction (Expanded)
Sector Country Jurisdiction/Industry Totala Central govt Local govt
Rank Meanb SD N Mean SD N Mean SD N
All organisations 5.66 2.27 699
Public Australia Commonwealth government 1 6.95 1.45 26 6.95 1.45 26 --- --- --
Public Australia Queensland government 2 6.59 1.93 54 7.05 1.75 33 5.87 2.03 21
Public Australia New South Wales government 3 6.37 1.86 86 6.70 1.73 50 5.91 1.97 36
Public Australia South Australia government 4 6.36 1.68 47 6.64 1.73 13 6.25 1.68 34
Public Australia Victoria government 5 6.32 1.75 58 6.10 1.67 33 6.50 1.82 25
Public Australia Western Australia government 6 6.13 2.12 61 6.44 1.93 41 5.48 2.40 20
Private Australia Finance & insurance 7 5.71 2.31 53 --- --- --- --- --- ---
Public Australia Australian Capital Territory government 8 5.67 2.09 7 5.67 2.09 7 --- --- ---
NFP Australia Health care & social assistance 9 5.21 2.47 66 --- --- --- --- --- ---
Private Australia Other private industry 10 5.11 2.25 28 --- --- --- --- --- ---
Public Australia Northern Territory government 11 4.92 2.38 12 5.22 2.57 9 4.00 1.73 3
Public Australia Tasmania government 12 4.70 2.52 20 6.00 2.29 12 2.75 1.31 8
Private Australia Professional, technical, administrative etc services =13 4.67 2.61 13 --- --- --- --- --- ---
NFP Australia Arts, recreation, accommodation, food & hospitality =13 4.67 2.23 16 --- --- --- --- --- ---
Private Australia Agriculture, forestry, fishing, mining & construction 15 4.44 2.21 19 --- --- --- --- --- ---
NFP Australia Other NFP industry 16 4.15 1.80 18 --- --- --- --- --- ---
Private Australia Manufacturing, wholesale & retail trade 17 4.02 2.45 35 --- --- --- --- --- ---
NFP Australia Education & training 18 3.89 3.03 15 --- --- --- --- --- ---
a Total means for public sector entities includes Central Govt and Local Govt scores, with the exception of Public Australian Commonwealth. b range (min-max score) = .00 – 10.00.
9
Table 6. Ranked Mean Specific Whistleblowing Processes Scores by Sector by Industry or Jurisdiction, ordered by Incident Tracking
Sector Jurisdiction/Industry
Incident tracking
Support strategy
Risk assessment
Dedicated support
Remediation
Mean a SD Mean a SD Mean a SD Mean a SD Mean a SD N
All organisations 1.76 0.44 1.23 0.82 1.39 0.78 0.79 0.72 0.49 0.65 699
Public Aust Commonwealth government 1.92 0.27 1.65 0.49 1.73 0.53 0.82 0.66 0.82 0.71 26
Public Aust Queensland government 1.89 0.32 1.43 0.72 1.65 0.65 1.00 0.73 0.63 0.69 54
Public Aust New South Wales government 1.85 0.36 1.42 0.74 1.67 0.58 0.88 0.73 0.54 0.56 86
Public Aust South Australia government 1.85 0.36 1.45 0.72 1.66 0.56 0.91 0.75 0.50 0.69 47
Public Aust Victoria government 1.83 0.38 1.47 0.68 1.66 0.55 0.95 0.65 0.41 0.63 58
Public Aust Western Australia government 1.80 0.40 1.33 0.81 1.51 0.67 0.90 0.75 0.59 0.62 61
Private Aust Finance & insurance 1.75 0.48 1.19 0.76 1.36 0.81 0.94 0.72 0.47 0.67 53
Private Aust Other private industry 1.75 0.44 1.14 0.80 1.07 0.86 0.69 0.69 0.45 0.73 28
Public Aust Northern Territory government 1.75 0.45 0.92 0.90 0.92 0.79 0.61 0.60 0.72 0.72 12
NFP Aust Health care & social assistance 1.74 0.47 1.14 0.89 1.23 0.86 0.68 0.74 0.42 0.61 66
Public Aust Australian Capital Territory government 1.71 0.49 0.71 0.95 1.71 0.76 0.67 0.67 0.86 0.74 7
Private Aust Professional, technical, administrative etc services 1.69 0.48 1.00 1.00 1.15 0.99 0.51 0.73 0.31 0.52 13
Private Aust Agriculture, forestry, fishing, mining, construction 1.69 0.48 0.89 0.94 1.16 0.90 0.49 0.62 0.21 0.39 19
Private Aust Manufacturing, wholesale & retail trade 1.69 0.47 0.71 0.79 0.86 0.91 0.44 0.65 0.32 0.59 35
Public Aust Tasmania government 1.60 0.50 0.95 0.89 0.95 0.89 0.90 0.69 0.30 0.63 20
NFP Aust Other NFP industry 1.56 0.51 1.06 0.94 1.06 0.94 0.37 0.41 0.11 0.34 18
NFP Aust Arts, recreation, accommodation, food, hospitality 1.56 0.51 0.88 0.72 1.06 0.86 0.83 0.67 0.33 0.49 16
NFP Aust Education & training 1.27 0.59 0.67 0.82 0.80 0.86 0.53 0.72 0.62 0.78 15
a range (min-max score) = .00 – 2.00.
10
Table 7. Ranked Mean Strength of Whistleblowing Processes Scores by Sector & Jurisdiction/Industry, showing All Ranks
Sector Jurisdiction/Industry
Total score
Incident tracking
Support strategy
Risk assessment
Dedicated support
Remed-iation
Mean a Rank Rank Rank Rank Rank Rank N
All organisations 5.66 699
Public Aust Commonwealth government 6.95 1 1 1 1 9 2 26
Public Aust Queensland government 6.59 2 2 4 6 1 4 54
Public Aust New South Wales government 6.37 3 =3 5 3 7 7 86
Public Aust South Australia government 6.36 4 =3 3 =4 4 8 47
Public Aust Victoria government 6.32 5 5 2 =4 2 12 58
Public Aust Western Australia government 6.13 6 6 6 7 =5 6 61
Private Aust Finance & insurance 5.71 7 =7 7 8 3 9 53
Public Aust Australian Capital Territory government 5.67 8 11 =16 2 12 1 7
NFP Aust Health care & social assistance 5.21 9 10 =8 9 11 11 66
Private Aust Other private industry 5.11 10 =7 =8 12 10 10 28
Public Aust Northern Territory government 4.92 11 =7 13 16 13 3 12
Public Aust Tasmania government 4.70 12 15 12 15 =5 16 20
Private Aust Professional, technical, administrative etc services 4.67 =13 =12 11 11 15 15 13
NFP Aust Arts, recreation, accommodation, food & hospitality 4.67 =13 =16 15 =13 8 13 16
Private Aust Agriculture, forestry, fishing, mining & construction 4.44 15 =12 14 10 16 17 19
NFP Aust Other NFP industry 4.15 16 =16 10 =13 18 18 18
Private Aust Manufacturing, wholesale & retail trade 4.02 17 =12 =16 17 17 14 35
NFP Aust Education & training 3.89 18 18 18 18 14 5 15
a range (min-max score) = .00 – 10.00. NB: colours denote range/rank
11
Figure 2. Ranked Mean Strength of Whistleblowing Processes Scores by Sector & Jurisdiction/Industry (Graph)
3.89 4.02 4.154.44 4.67 4.67 4.70
4.92 5.11 5.215.66 5.67 5.71
6.13 6.32 6.36 6.376.59
6.95
0
1
2
3
4
5
6
7
8
9
10
Incident tracking
Support strategy
Risk assessment
Dedicated support
Remediation
Total score
Strengthof
ProcessMean Score
Industry / sector / jurisdiction (number of organisations)
12
4. SIGNIFICANCE AND LIMITATIONS
The statistical significance of key results in Table 3 was reported above.
ANOVA tests comparing the organisation groups on the strength of their whistleblowing
processes scores, as presented in Tables 4 and 5, revealed differences between the groups
to be statistically significant.
For the results in Table 4, significant differences were revealed by an ANOVA test
comparing government levels and private/not-for-profit sector industry groups (F(13,685) =
7.303, p < .001). Gabriel post-hoc multiple comparisons tests revealed statistically significant
differences between:
the process scores of both the Australian Commonwealth and combined State/Territory government levels in this Table, and five of the private and not-for-profit (NFP) sector industry groups: Health care and social assistance (NFP) (p = .032 and p = .002 respectively), Agriculture, forestry, fishing, mining and construction (p = .010 and p = .001 respectively), Other not-for-profit (p = .002 and p = .000 respectively), Manufacturing, wholesale and retail trade (p = .000 and p = .000 respectively), and Education and training (NFP) (p = .001 and p = .000 respectively);
the process scores of the combined State/Territory government level and the Arts, recreation, accommodation, food and hospitality NFP group (p = .024);
the process scores registered by the combined Local government level and three industry groups: Manufacturing, wholesale and retail trade (p = .000), Education and training (NFP) (p = .017), and Other not-for-profit (p = .047).
Gabriel post-hoc tests also revealed a significant difference between the strength of
whistleblowing processes scores of the Finance and insurance industry group (the private
sector industry group with the strongest mean score) and the Manufacturing, wholesale and
retail trade group (the lowest scoring private industry group) (p = .027). Finally, whilst the
Australian healthcare and social assistance (NFP) group ranked higher than most private
sector industries and all the remaining not-for-profit groups, the differences between these
groups were not revealed as statistically significant by these tests.
For the results in Table 5, additional significant differences were revealed by an ANOVA test
comparing the public sector jurisdictions when further broken down (F(9,426) = 3.476, p =
.001). Gabriel post-hoc multiple comparisons tests revealed the score for the lowest ranked
public sector group (Tasmanian public agencies, including local government) to be
significantly different from three highest ranked groups: Australian Commonwealth agencies
(p = .007), Queensland public agencies including local government (p = .009), and New
South Wales public agencies including local government (p = .017).
When interpreting the results, it must be recognized that the sample of organisations was
self-selecting, rather than randomly selected. Thus the results cannot be concluded to be
necessarily representative of all sectors, particularly the private and not for profit sectors, but
also in some part of the public sector (for example, the result for Australian Commonwealth is
based on responses from only 26 agencies, as against up to 86 agencies in NSW).
Further, while the opportunity to participate was extensively advertised, the combination of
self-selection and self-reporting means results may be skewed – either positively, e.g.
because organisations were confident in their processes, or negatively, e.g. because
organisations elected to participate because they knew they lacked processes or had less
confidence in them; or both.

13
The self-reported nature of the data also means that the presence or absence of the reported
processes has not been independently verified. The actual state of organisation’s processes
may vary from those reported here. For example, the presence of self-reported risk
assessment processes, as presented above, varies if a requirement is applied for such
assessments to be documented at least sometimes (the subject of an additional question).
Overall, these results disclose how different organisations from different sectors report the
state and content of their whistleblowing processes when asked on a consistent, comparable
basis. They underscore the importance of evidence to confirm what processes are in fact in
place, and what the outcomes and performance of organisations’ processes may be, whether
as reported here or not. This is an objective of the Integrity@WERQ phase of the research.
The results nevertheless provide a new basis for comparison of the state of whistleblowing
processes as reported by a wide cross-section of organisations, drawing not only on an
unprecedented number, but an unprecedented range in terms of size, industries, public sector
functions and not-for-profit activities.
5. DISCUSSION AND CONCLUSIONS
As reported previously (Brown, Dozo & Reports 2016), the response to the WWTW2 Survey
of Organisational Processes and Procedures confirms the strong efforts that many public,
private and not-for-profit organisations are making towards whistleblower protection, and
affirms the central role that whistleblowing is intended to play in integrity and good
governance systems across the sectors.
A finding of previous public sector research was that the ‘administrative’ areas of
whistleblowing processes – e.g. advice on what can be reported, to whom and how it will be
investigated – were stronger than processes for delivering on commitments to employees
around these goals (Roberts 2008 p.259; Brown & Olsen 2008). Hence, survey design and
the first stage of overall analysis here have focused in more detail on support and protection.
The results nevertheless continue to show that even when trying hard to encourage their
staff to report integrity challenges, there is much that organisations can do, in all sectors and
jurisidictions, to ensure whistleblowing processes are robust. In particular, under the current
state of guidance and incentives, most sectors are finding it difficult to realise their own goals
of having processes which provide strong staff support and protection.
The results in Tables 3, 6 and 7, repeated in Figure 2, highlight that efforts towards strong
processes for ensuring support and protection can and should be enhanced, across all
sectors and in individual sectors.
The significant variation between sectors, revealed by the rankings in Tables 4 and 5 (and
again repeated in Figure 2, show the enormous opportunity for companies in all industry
sectors to learn a great deal from each other and from other sectors as to what may
constitute best practice, and how best to move towards it. Key differences between sectors
and jurisdictions also highlight questions regarding the best methods for developing,
promoting and, potentially, requiring strong whistleblowing processes in organisations, as
part of current reform efforts.
14
Public sectors
The results confirm that, as measured here, the processes reported by organisations were
stronger in public sector jurisdictions than in most of the private sector, and in the not-for-
profit sector. This is consistent with a longer history of statutory protections, procedures and
oversight with respect to public interest whistleblowing in all the public sector jurisdictions
involved, compared with the relative absence of such frameworks in the Australian private
and not-for-profit sectors. This also reflects, and is reflected in, an international history of
more comprehensive research into public sector whistleblowing processes over private
sector ones (e.g. de Graaf 2010; see Olsen 2014).
However, the results also show significant variation between public sector jurisdictions,
raising questions about differences in these frameworks and/or their implementation.
Previous research assessed the comprehensiveness of whistleblowing procedures from 175
agencies across four Australian jurisdictions (Roberts 2008: 249). At that time, the most
comprehensive procedures were found in NSW agencies, followed closely by
Commonwealth and Western Australian agencies, and by Queensland agencies.
Those results highlighted the different factors that may account for strong procedures (noting
that the present research compares reported processes, rather than content of published
procedures). For example, in 2008, the NSW results were attributed to the wide
dissemination of detailed guidelines by the NSW Ombudsman’s office, notwithstanding the
lack of any statutory requirement for organisational procedures under the Protected
Disclosures Act 1994 (NSW). Some Commonwealth agencies were at that time subject to
limited requirements under the Public Service Act 1999 (Cth) and others not at all, leading to
the widest ranges in procedural comprehensiveness and outcomes. By contrast, from 1994
until 2010, every Queensland agency had been under a statutory requirement to have
‘reasonable procedures to protect its officers from reprisals’,1 but with no guidance to inform
those procedures nor any oversight agency charged with ensuring they were made.
A decade on, the findings in Tables 4 and 5 yield a different pattern, but one consistent with
a changed regulatory landscape since 2008. The evidence that the strongest whistleblowing
processes were found among Commonwealth agencies (together with small standard
deviation) is consistent with reforms since introduction of the Public Interest Disclosure Act
2013 (Cth), including comprehensive new requirements for all entities to have ‘procedures for
facilitating and dealing with public interest disclosures’. These must meet standards set by
the Commonwealth Ombudsman,2 and were supported by a major ‘community of practice’
implementation. Further, at the same time, Commonwealth agency heads came under a
direct statutory responsibility to take ‘reasonable steps… to protect public officials who
belong to the agency from detriment, or threats of detriment’ relating to disclosures.3
Queensland agencies also came under a new regime, three years earlier, supported by the
Public Service Commission and more recently the Queensland Ombudsman.4 Table 5
shows that, in fact, Queensland Government State agencies now record the strongest
processes of any jurisdictional group on the present measure (mean of 7.05 out of 10), when
considered without the weaker average processes of local governments.
1 Whistleblowers Protection Act 1994 (Qld), s 44. 2 Public Interest Disclosure Act 2013 (Cth), ss 59(1) and 74. 3 Public Interest Disclosure Act 2013 (Cth), s 59(3)(a). 4 Public Interest Disclosure Act 2010 (Qld), ss 28, 49, 60.

15
NSW government agencies also continue to record comparatively strong processes, on
average, especially when considered without local government. The NSW regime was also
upgraded, requiring each public authority to have procedures for ‘receiving, assessing and
dealing with public interest disclosures’ and empowering the Ombudsman’s role in
disseminating guidelines for these.5 However, unlike in the Commonwealth and Queensland
regimes, NSW public authorities are not formally bound by the Ombudsman’s guidelines.6
Also consistently with present regimes, the two jurisdictions who scored most strongly for risk
assessment – the Commonwealth and ACT – are the only jurisdictions where, by statute,
agencies are required to have processes for ‘assessing risks that reprisals may be taken
against the persons who make those disclosures’.7 Since introduction of these precedents in
2012 and 2013, the other major jurisdiction to follow them is China, where requirements for
authorities to undertake ‘risk assessment…, implement a protection plan and prevent
reprisals on the whistle-blower’ were announced shortly before the Brisbane G20 Summit,
after an Australian-led review of G20 whistleblowing laws (BBC 2014).
These developments highlight the extent to which Australian public sector regimes have
pioneered an ‘institutional’ approach which seeks to normalise whistleblowing as an element
of governance, and prioritise preventive support and protection, rather than relying on legal
remedies after retaliation has already occurred (Brown 2013). However, the results here
suggest this goal remains some way off, in all public sectors, especially considering the
comparisons in Tables 3 and 6. These results should give impetus to continual improvement
in these regimes, such as recently recommended by statutory reviews conducted by the
Commonwealth (Moss 2016) and Queensland (Queensland Ombudsman 2017).
The public sector results also highlight the comparative weakness of local government
processes, relative to central government, in all jurisdictions other than Victoria.
This factor especially explains Tasmania’s ranking (4.70) as having the weakest processes,
on average, of all government sectors (Table 5). At least on paper, Tasmania’s requirements
are relatively strong, with public bodies required to establish procedures which meet the
Ombudsman’s model guidelines, including appointment of a welfare manager in
whistleblowing cases.8 This may explain why despite scoring less well on other components,
Tasmanian agencies scored equal fifth for ‘dedicated support’. More recently, these
procedures have been reinforced by the Tasmanian Integrity Commission’s ‘speak up’
campaign.9 However, these initiatives seem to have had seriously less traction among the
eight Tasmanian local governments who responded to the survey (an extremely poor mean
of 2.75) than in the 12 State agencies (who had a much stronger mean of 6.00).
5 Public Interest Disclosures Act 1994 (NSW) as amended in 2010: s.6D. For the NSW Ombudsman’s current detailed guidelines, see e.g. https://www.ombo.nsw.gov.au/news-and-publications/publications/guidelines/public-interest-disclosures/public-interest-disclosures-guideline-d1-internal-reporter-support-strategy. 6 Public Interest Disclosures Act 1994 (NSW) as amended in 2010: s.6D. 7 Public Interest Disclosure Act 2013 (Cth), s 59(1); following the precedent of the Public Interest Disclosure Act 2012 (ACT), s 33(2). 8 Public Interest Disclosures Act 2002 (Tas), ss 60 and 38; see Ombudsman Tasmania (2014), Public Interest Disclosures Act 2002, Model Procedures to be followed by Public Bodies: section 8.5 <www.ombudsman.tas.gov.au/publications_and_media/guidelines/pid_guidelines_and_standards>. 9 <www.integrity.tas.gov.au/education_and_resources/awareness_campaigns/speak_up_campaign>.
16
Private and not-for-profit sectors
This is the first research to collect data capable of allowing sizeable groups of private sector
and not-for-profit organisations to be compared either with each other, or with public sector
entities, in a systematic way with respect to the strength of whistleblowing processes.
Typically prior research on these issues has been confined to groups of businesses alone,
including based simply on their publicly available material, or limited to lessons from
individual industries or organisations (Hassink et al. 2007; Lee and Fargher 2013; Dixon
2016; Dewing and Russell 2016).
As Figure 1 demonstrated, the range of results across both the private and not-for-profit
sectors was wider than for the public sector, as well as generally ranking lower. While this
greater range is not unexpected given the diversity of industries, conditions and organisation
types present in these sectors, it also provides a rich basis for considering which industry
groups rate more strongly, and why these industry groups stand where they do relative to
others.
The most striking result is the clear leadership of the Finance and insurance industry with
respect to strength of their reported processes, relative to all other industry groups (defined
using ABS industry group codes). Indeed, notwithstanding the overall strength of processes
in most public sectors, this industry group ranked more strongly than three government
jurisdictions (ACT, Northern Territory and Tasmania).
Like all Australian companies, businesses in this industry are subject to the whistleblower
protection obligations reflected in Part 9.4AAA of the Corporations Act 2001 (Cth). These
provisions provide neither requirements nor direct incentives for companies to establish
quality internal processes. However, this industry is also subject to similar, duplicatory
requirements under the Banking Act 1959, Life Insurance Act 1995, Superannuation Industry
(Supervision) Act 1993 and Insurance Act 1973 (Cth). This legislation reinforces the potential
liability, at least in theory, if reporting of regulatory breaches is not handled responsibly.
Perhaps most importantly, the banking and finance industry has been the most responsive of
all Australian industry groups to the need to develop and implement strong processes,
including in response to public and political pressure. For example, the Australian Bankers
Association has developed its own, comparatively strong principles for such processes
across the banking and finance sector (ABA 2016). The results here are consistent with this
effort, while still confirming that even for this sector, there is much that remains to be done.
In the not-for-profit sector, organisations working in healthcare and social assistance also
bucked the overall trend with respect to the weakness of that sector – ranking higher than
some public sector jurisdictions, most private sector industry groups, and the other not-for-
profit sector industry groups.
Like public sector healthcare providers, not-for-profit providers are subject to a high degree
of clinical professionalization, as well as being subject to other formal reporting systems as
part of the health care quality chain (e.g. clinical incident reporting) (Vincenza et al 2017).
Further, organisations working in social assistance are frequently subject to statutory
mandatory requirements for their staff to report wrongdoing or client mistreatment – for
example, in child protection or disability services areas, or as a condition of public funding
and contracts. In this industry group, therefore, not only may the nature of the work mean
that lives may be readily jeopardised by wrongdoing, but staff are often under three different
types of duty to report concerns (professional, contractual and statutory).
17
These direct and indirect influences on stronger reporting processes in that industry group,
contrast with the weakest industry groups (manufacturing, wholesale and retail trade, and
not-for-profit education and training). Manufacturing, wholesale and retail not only tend to
experience a high degree of casualization of labour, lower professionalization and high staff
turnover, but some of the greatest competitiveness and performance pressures in the
economy. Some of these factors are also present in some areas of education and training,
which may also include institutions with a longer term history of challenges with respect to
responding to wrongdoing and recognising their duties of care towards clients and staff. In
these industries, weaker whistleblowing processes can be seen as relating to conditions
which impact on labour, governance and integrity standards much more generally.
In conclusion…
Together, these results show the enormous opportunity for companies in all industry sectors
to learn from each other and from other sectors as to what may constitute best practice, and
how best to move towards it. They reinforce the benefit of organisations knowing exactly
how they compare on a comparative basis, to inform their own strategies for developing and
implementing strong processes; and provide a clearer basis for then also being able to
measure the relationship between the relative strength of their processes and the outcomes
being achieved, through ongoing research such as the Integrity@WERQ phase of the
present project.
The findings also highlight the need for clearer guidance, and either statutory or industry
requirements, or incentives, across key areas of whistleblowing processes. While this is true
for most public sector jurisdictions, the results suggest that it is especially true for the
Australian private and not-for-profit sectors. Most public jurisdictions already possess a
framework for mandatory procedures which can be adapted and developed to address the
gaps in processes identified by these comparisons. The more critical questions relate to how
stronger processes will be achieved in the private and not-for-profit sectors.
Importantly, while size of organisation is a significant factor in the strength of whistleblowing
processes across all sectors, the finding that sectoral differences remain irrespective of size
– for example, that local government in many jurisdictions can achieve relatively strong
processes – shows that regulatory environment, oversight, operating conditions,
professionalization, skills and industry leadership are likely critical factors.
As the Australian Government has recognised, the protections available to corporate
whistleblowers are lagging behind, relative not only to most public sector whistleblowing
regimes but to other countries including the United Kingdom and United States
(Commonwealth of Australia 2016: 12-14). However, it should be noted that neither of those
jurisdictions have yet hit on the best way to set and ensure the standards for strong
organisational processes, on which such protection relies.
The results therefore suggest the answers will lie in new, rather than copied responses to
these challenges, as part of the movement towards new legislative protections, promised by
the Australian Government by June 2018. For example, recent reforms to Australian
legislation already provide new drivers for some organisations to have strong processes, by
extending civil liability to any manager who fails to fulfil ‘a duty to prevent, refrain from, or
take reasonable steps to ensure other persons [prevent or refrain] from, any act or omission
18
likely to result in detriment’ to a whistleblower.10 Given the Government’s objective of using
‘the substance and detail of those amendments to achieve an equal or better whistle-blower
protection and compensation regime in the corporate and public sectors’ generally
(Commonwealth of Australia 2016: 14), the need is clear for a robust framework to ensure
organisations know how to meet these standards.
The results should thus also assist the framing of new International and Australian Standards
for whistleblowing programs, under consideration by Standards Australia’s technical
committee QR-17 and the International Standards Organisation. As the first systematic
comparison between sectors of its kind, the results also help inform international policy
developments more generally – for example, the European Union’s current deliberations on a
possible Directive on whistleblowing – by highlighting practical reasons why all industry
sectors should be covered by expectations of strong processes, and why size of organisation
should not be a major basis for excluding organisations from such expectations.
These findings also confirm the need for improvement on the former Australian Standard on
Whistleblower Protection Programs (Standards Australia International 2003); the weakness
of which was identified relatively early by research (Roberts 2008). If the former Standard
had provided sufficient guidance, organisational whistleblowing processes today should be
stronger than revealed by these results. More recent overseas standards and guides (e.g.
British Standards Institute 2008; Canadian Standards Association 2016) will also be helpful.
A crucial issue for policy attention becomes how implementation and compliance with such
standards will be ensured. The question is no longer whether, but how organisations will
ensure they have strong whistleblowing processes that meet their public and regulatory
commitments. The first-stage measure, reported here, can assist organisations and
industries to assess where they stand, maintain their strengths, address their weaknesses
and pursue continual improvement in their processes and standards of governance.
10 Fair Work (Registered Organisations) Act 2009 (Cth), s 337BB(3) & (6), as inserted by the Fair Work (Registered Organisations) Amendment Act 2016 (Cth).
19
6. BIBLIOGRAPHY Australian Bankers’ Association (2016). Guiding principles – Improving protections for
whistleblowers, Sydney (December 2016).
BBC (2014). China 'to protect whistle-blowers' amid corruption fight. BBC World News Online, 28 October 2014 <http://www.bbc.com/news/world-asia-china-29797985>.
British Standards Institute (2008). Whistleblowing arrangements code of practice. London.
Brown, A J (2013). Towards ideal whistleblowing laws? Some lessons from recent Australian experience, E-Journal of International and Comparative Labour Studies, 2(3): 153-182.
Brown, A J, Dozo, N & Roberts, P (2016). Whistleblowing processes & procedures: An Australian & New Zealand snapshot. Preliminary results of the Whistling While They Work 2 Project, Griffith University: Brisbane (November 2016).
Canadian Standards Association (2016). Whistleblowing systems - A guide. Toronto.
Commonwealth of Australia (2016). Department of the Prime Minister and Cabinet, Australia’s Open Government National Action Plan, Canberra (December 2016).
De Graaf, G. (2010). A report on reporting: Why peers report integrity and law violations in public organizations. Public Administration Review, 70(5): 767-779.
Dixon, O. (2016). Honesty without fear? Whistleblower anti-retaliation protections in corporate codes of conduct. Melbourne University Law Review, 40(1): 168-206.
Dewing, I.P. & Russell, P.O. (2016). Whistleblowing, governance and regulation before the financial crisis: The case of HBOS. Journal of Business Ethics, 134(1): 155-169.
Hassink, H., de Vries, M., & Bollen, L. (2007). A content analysis of whistleblowing policies of leading European companies. Journal of Business Ethics, 75: 25-44.
Lee, G. & Fargher, N. (2013). Companies’ use of whistle-blowing to detect fraud: An examination of corporate whistle-blowing policies. Journal of Business Ethics, 114(3): 283-295.
Moss, P. (2016). Review of the Public Interest Disclosure Act 2013: An independent statutory review conducted by Mr Philip Moss AM, Canberra: Department of Prime Minister & Cabinet, 15 July 2016.
Olsen, J. (2014). Reporting versus inaction: How much is there, what explains the differences and what to measure (pp.???). IA. J. Brown, D. Lewis, R. Moberly & W. Vandekerckhove (2014). International handbook on whistleblowing research. Cheltenham, UK: Edward Elgar Publishing.
Queensland Ombudsman (2017). Review of the Public Interest Disclosure Act 2010: A review pursuant to s.62 of the Public Interest Disclosure Act 2010, Brisbane (January 2017).
Roberts, P. (2008). Evaluating agency responses: The comprehensiveness and impact of whistleblowing procedures (pp. 233-260). In A. J. Brown (Ed.), Whistleblowing in the Australian Public Sector: Enhancing the theory and practice of internal witness management in public sector organisations. Canberra, Australia: ANU E Press.
Standards Australia International (2003). Whistleblower protection programs for entities (AS 8004-2003).
Vincenza Ciasullo, M., Cosimato, S. & Palumbo, R. (2017). Improving health care quality: The implementation of whistleblowing, The TQM Journal, 29(1): 167–183.
________________________________
Top Related