


Languages
Pages
Legal


Strength and Opportunity 2014The landscape of the medical technology, medical biotechnology, pharmaceutical and industrial biotechnology sectors in the UK
Annual Update – 2014

Please note the that this report has been amended as follows:
Page 38 – Figure 23 has been replaced
Page 63 – The title for Figure IVc has been replaced and now reads Figure IVc – Impact on sector employment of companies added to the database in 2014
This is the sixth annual report that analyses the information contained in the Bioscience and Health Technology Database.
Office forLife Sciences
Office forLife Sciences

iii
Contents
Ministerial Foreword 1
Executive Summary 3
List of Figures 14
References 17
Chapter 1. Introduction 18
Chapter 2. Medical Technology Sector 20
2.1. Sector Definition 20
2.2. Sector Overview 20
2.3. Turnover and Employment 21
2.4. Trends – Turnover and Employment 26
2.5. UK Profile 29
2.6. Geographical Distribution of Medical Technology Companies 31
Chapter 3. Medical Biotechnology Sector 32
3.1. Sector Definition 32
3.2. Sector Overview 32
3.3. Turnover and Employment 33
3.4. Trends – Turnover and Employment 36
3.5. UK Profile 38
3.6. Geographical Distribution of Medical Biotechnology companies 40
Chapter 4. Industrial Biotechnology Sector 41
4.1. Sector Definition 41
4.2. Sector Overview 42
4.3. Turnover and Employment 42
4.4. Trends – Turnover and Employment 44
4.5. UK Profile 45
4.6. Geographical Distribution of Industrial Biotechnology companies 47

iv
Strength and Opportunity 2014The landscape of the medical technology, medical biotechnology, industrial biotechnology and pharmaceutical sectors in the UK
Chapter 5. Pharmaceutical Sector 48
5.1. Sector Definition 48
5.2. Sector Overview 48
5.3. Turnover and Employment 49
5.4. Trends – Turnover and Employment 51
5.5. UK Profile 53
5.6. Geographical Distribution of Pharmaceutical companies 55
Appendix I Data Partner Acknowledgements 56
Appendix II Database Construction – Methodology and Segmentation 57
Appendix III Segmentation Reference Chart – Life science sectors 60
Appendix IV Impact of methodology and update changes on dataset 62

1
Ministerial ForewordI am very pleased to present this report, the first published since I became the UK Minister for Life Sciences in July 2014.
The life sciences industry in the UK has a crucial role in contributing to growth and the delivery of better healthcare for patients throughout the UK. The information in this report contributes to our understanding of the composition of this diverse sector. It provides us with an estimate of the number, type and geographical distribution of companies across the medical technology, medical biotechnology, pharmaceutical and industrial biotechnology sectors.
Overall turnover in the UK life sciences industry remains high and the industry’s contribution to UK employment strong. This is despite the restructuring that has been taking place globally in the sector, over the last few years in particular.
The position of the life sciences industry in the UK economy is reflected in the Government’s ongoing commitment to the sector as articulated through our long-term strategy for UK Life Sciences. Since this was launched in December 2011 the UK:
●● has attracted more than £3.5 billion industry and private sector investment; and
●● is expected to create 11,000 jobs.
Latest data also suggests that almost £2.5 billion of public and private funds have been invested, up over 200% on 2013 – made up of over £450m of Venture Capital into early stage, private companies and almost £2bn in public market investment.
We are continuing to focus hard on how to accelerate the uptake and diffusion of 21st century medicines and medical technologies into and across the NHS. Central to this are the two key initiatives I have been focusing on in the nine months since being appointed as Minister for Life Sciences:
●● The Accelerated Access Review into Innovative Medicines and Medical Technology, for which I announced on the 11th March Sir Hugh Taylor as Chair and Sir John Bell as Chair of the external advisory group. The terms of reference were also published and work has begun on mapping the UK landscape and international benchmarking.
●● The creation of “test beds” for the assessment and adoption of 21st Century life science innovation in real time patient population as set out in the NHS’s five year forward view.
This, along with the already competitive business environment within the UK, will put us in a position to continue to attract life sciences companies to set up and expand here.

2
Strength and Opportunity 2014The landscape of the medical technology, medical biotechnology, industrial biotechnology and pharmaceutical sectors in the UK
I would like to thank everybody who has contributed to the annual update of the database, in particular BBSRC, the trade associations, Medilink and life sciences networks. Their input has been invaluable in producing such a comprehensive view of the sector.
George Freeman MP Parliamentary Under Secretary of State for Life Sciences

3
Executive SummaryThe Bioscience and Health Technologies Database collates information on the medical technology, medical biotechnology, industrial biotechnology and pharmaceutical companies in the UK. The database was established in 2009, and is updated annually to produce an estimate of the economic picture of the industry at a particular point in time. The pharmaceutical industry was added to the database in 2011.
Based on analysis of the annual update to the database this report shows that the UK life sciences industry:
●● Employs an estimated 183,000 people across the UK, with 72% employed in companies producing products for the health care market and 28% in the service and supply chain;
●● Generates a combined estimated turnover of £56bn;
●● Comprises an estimated 4,398 companies and their sites developing, manufacturing and marketing products and services to the UK and global markets.
Employment and Turnover
The estimated total turnover, employment and companies included in the database for the four sectors are shown in Figure 1.
In terms of employment the medical technology sector is the largest, employing an estimated 88,000.
The pharmaceutical sector generates the largest turnover – £32.4bn from 545 companies, compared with the medical technology sector that has a turnover of £18.1bn from over 3,000 companies. Medical biotechnology and industrial biotechnology are significant sectors each generating a turnover of £4.8bn and £0.9bn respectively.

4
Strength and Opportunity 2014The landscape of the medical technology, medical biotechnology, industrial biotechnology and pharmaceutical sectors in the UK
Figure 1. Comparison of employment, turnover and number of companies for the four life sciences industry sectors
PharmaceuticalMedicalBiotechnology
MedicalTechnology
IndustrialBiotechnology
88
233
70 112545
3,268
1,013
Employment(thousands)
Companies
4.8
0.9
32.4
18.1
Turnover (£bn)
All sectors, but particularly the pharmaceutical and medical biotechnology sectors, outsource a significant proportion of activity to large supply chain networks. The service and supply chain is therefore integral to the life sciences industry and together with the strength in the UK research and clinical base is one of the key attractors of the UK as a location for life sciences companies.
Across all the life sciences sectors in the database there are an estimated 1,800 companies that supply services and products into the industry. These companies provide services such as clinical trials management, assay development, regulatory advice, design expertise and products such as reagents and specialist equipment. Together these companies employ an estimated 50,800 people or 28% of the life sciences industry workforce and generate £17bn in turnover.
The largest supply chain segments are those providing contract manufacturing & research, clinical trials services, equipment and consumables – together these segments account for 70% of the employment in the service and supply chain.
Employment and Turnover Trends
The year-on-year trend in estimated employment and turnover for all sectors based on data from a subset of companies (those companies which have been included in the database for all years between 2009-14) is shown in Figures 2a and 2b. Actual figures for each year are not included because year on year analysis can be overly sensitive to changes for example, accounting adjustments by larger companies (especially those in the pharmaceutical and medical technology sectors) or in the case of industrial biotechnology the size of the sample used. As such the direction of change is shown between years – and this should be looked at together with the Consolidated Annual Growth Rates in Figure 3.

5
Executive Summary
Employment trends
Figure 2a. Year-on-year trends in estimated employment 2009 to 2014 (2011 to 2014 for pharmaceutical) for the four life sciences sectors
Trend in Employment between years
Segment 2009/2010 2010/2011 2011/2012 2012/2013 2013/2014
Medical Technology
Medical Biotechnology
Industrial Biotechnology
PharmaceuticalNot
availableNot
available
Turnover trends
Figure 2b – Year-on-year trends in estimated turnover 2009 to 2014 (2011 to 2014 for pharmaceutical) for the four life sciences sectors
Trend in Turnover between years
Segment 2009/2010 2010/2011 2011/2012 2012/2013 2013/2014
Medical Technology
Medical Biotechnology
Industrial Biotechnology
PharmaceuticalNot
availableNot
available
Annual Growth Rates in Employment and Turnover
The consolidated annual growth rates (CAGR) for estimated turnover and employment over 2009 to 2014 (2012-2014 for pharmaceutical sector turnover) in each of the four life sciences sectors are shown in Figure 3. CAGR is estimated from a trend set of data based on a sub-set of companies that have been included in the data set from when it was established.to provide a longer term view of the sector and helps counter any issues with fluctuations between years as described above.
Over 2011 to 2014, the pharmaceutical sector has seen a small positive growth rate in turnover and negative growth rate in employment, however Figure 2a shows there was a return to positive growth in employment over the last year. This is in contrast to the medical technology sector, where estimated employment and turnover have shown positive growth rates from 2009 to 2014. A similar level of robust growth was shown by the industrial biotechnology sector although from a low base. Turnover in the medical biotechnology sector shows a growth rate of just over 4% between 2009 and 2014 in contrast to the growth rate for employment which has remained flat.

6
Strength and Opportunity 2014The landscape of the medical technology, medical biotechnology, industrial biotechnology and pharmaceutical sectors in the UK
Figure 3. Estimated employment and turnover CAGR% from 2009 to 2014 (2012 to 2014 for pharmaceutical turnover)
CA
GR
200
9-20
13 (
2012
-201
4 fo
rp
har
mac
euti
cal t
run
ove
r)
Employment Turnover
-4%
-2%
0%
2%
4%
6%
8%
10%
MedicalTechnology
IndustrialBiotechnology
MedicalBiotechnology
Pharmaceutical
Distribution of economic activity
While the economic activity of all the sectors is located across the UK, 48% of the all life sciences employment is located in the Southeast of the UK incorporating the Southeast and East of England, including London. As shown in Figure 4 there are significant concentrations of activity in other areas of the UK, with the medical technology sector in particular having a more dispersed geography.

7
Executive Summary
Figure 4. Distribution of Medical Technology, Medical Biotechnology, Industrial Biotechnolgy and Pharmaceutical Employment across the UK
0
5,000
10,000
15,000
20,000
25,000
30,000
35,000
40,000
45,000
North
ern
Irelan
d
North
Eas
t
South
Wes
t
Wale
s
East M
idlan
ds
Scotla
nd
York
shire
and
The
Humbe
r
Wes
t Midl
ands
Lond
on
North
Wes
t
East o
f Eng
land
South
Eas
t
To
tal N
um
ber
of
Em
plo
yees
by
Sec
tor
Pharmaceutical Medical BiotechnologyMedical Technology Industrial Biotechnology
Annual update methodology
Each year information on existing companies and their sites in the database is reviewed and updated as well as identifying companies that need to be added to the database.
The annual update therefore takes account of the following prior to the snapshot being taken from which this report is generated.
Addition of companies created in the last 12 months
●● Addition of companies that have been in existence for more than 12 months, but have not been previously identified and included;
●● Removal of companies that have ceased trading or been dissolved in the last 12 months, and reflecting the impact of mergers and acquisitions;
●● Review the segmentation of companies to ensure the categorisation used in the previous year is still appropriate (this can change if the core business activity changes);
●● Improving matching of financial and employment data to companies and their sites.
All of the factors listed above will contribute to the changes in the figures used in each annual update, in addition to the changes driven by existing companies and their company activity in a given year. Appendix IV contains a more detailed explanation of the impact of these various changes on the data.

8
Strength and Opportunity 2014The landscape of the medical technology, medical biotechnology, industrial biotechnology and pharmaceutical sectors in the UK
Medical Technology
For the purpose of this report, companies in the medical technology sector are those whose major business activity involves the development, manufacture or distribution of medical devices as defined by European Union Medical Devices Directive (93/42/ECC) and companies that have significant activity in supplying products and services to the medical technology sector.
The medical technology sector in the database is divided into 22 segments based on the products or services the company develops or offers (see Appendix III). Companies can be classified as being active in more than one of these segments – but for this report the analysis is based on companies classified by the primary activity from which the majority of their turnover and employment is derived.
●● The medical technology sector contains an estimated 3,268 companies, generates an estimated turnover of £18.1bn and employs an estimated 88,000 people across the UK.
●● The three largest product segments are single use technology, in-vitro diagnostics, and orthopaedic devices accounting for an estimated 33% of all non-service and supply chain sector employment and turnover.
●● The 848 companies in the service and supply chain segment account for the largest proportion of sector employment and turnover. Companies supplying equipment, reagents and consumables to companies and the NHS comprise the largest sub-segment, followed by contract manufacturing and specialist consultants.
●● Over 2009 to 2014 the sector showed positive growth trends in both employment and turnover, with estimated CAGRs of 9.1% and 5.8% respectively.
●● Wound care and management is the fastest growing product segment for turnover (11% CAGR) and in-vitro diagnostic technology for employment (18% CAGR).
●● Year-on-year trends indicate a contraction in employment in 2009 to 2010 with growth returning each year from 2011 to 2014 across the sector.
●● The majority (97%) of companies are SMEs employing fewer than 250 staff and 83% have turnover <£5m. There are 144 companies with turnover >£50m per annum.
●● 82% of the companies in the sector are UK-owned – these account for 55% of employment.
●● The Southeast of England is the location for 16% of companies and 19% of employment. Significant concentrations of economic activity are also evident in the East of England, across the Midlands, the Northwest of England, and Yorkshire & the Humber.

9
Executive Summary
Medical Biotechnology
For the purpose of this report, medical biotechnology includes small to medium sized companies (typically with annual global revenues of below £640m) that focus on the discovery or development of new therapeutics that principally act in or on the human body by pharmacological, immunological or metabolic means. It also includes companies that derive the majority of their revenue from products and services that they supply to other companies in this sector – the medical biotechnology service and supply chain segment.
●● The medical biotechnology sector consists of an estimated 1,013 companies generating turnover of £4.8bn and employing 23,000 people.
●● A third of companies (322) are active in the discovery and development of new medicines based on biotechnology. Two thirds of companies supply products or provide services.
●● Outside the service and supply chain, the two largest segments by turnover and employment are companies using molecule or antibody techniques.
●● Using trend data analysis, over the period 2009-2014, the sector has seen 0.0% and 4.3% CAGR in employment and turnover respectively
●● The medical biotechnology service and supply chain shows a slightly lower growth rate in turnover of 3%.
●● Companies developing new medicines using therapeutic proteins and small molecules show the highest growth rates in estimated turnover of 9-15%.
●● Over the same period, employment in the overall sector has been flat but with a small increase for companies outside of the service and supply chain.
●● Year-on-year saw a trend of decreasing employment over 2010 to 2012 followed by increases over the last 2 years.
●● 85% of companies have a turnover of less than £5m.
●● 96% of the companies have fewer than 250 employees, with companies employing fewer than 10 staff making up an estimated 64% of these SMEs.
●● Together the Southeast and East of England including London contains 43% of the employment and 54% of the companies in the UK.
●● The north of England (the Northwest, Yorkshire and the Humber and the Northeast) accounts for 16.5% of sector employment, Scotland 11% and the Midlands (East and West) 14%.

10
Strength and Opportunity 2014The landscape of the medical technology, medical biotechnology, industrial biotechnology and pharmaceutical sectors in the UK
Combined service and supply chain – Medical Biotechnology and Pharmaceutical sector
The medical biotechnology service and supply chain serves both the medical biotechnology and pharmaceutical sectors and together employs an estimated 33,700 people generating an estimated turnover of £9.1bn. The 3 largest sub-segments in the service and supply chain provide contract manufacturing; research and clinical services; equipment and consumables. Together these sub-segments account for an estimated 75% of the medical biotechnology and pharmaceutical service and supply chain employment.
●● The services and supply chain segments for the Medical Biotechnology and Pharmaceutical sectors have been analysed together due to the overlap in the services and products they often provide to both these sectors.
●● This combined service and supply chain segment contains an estimated 935 companies, generates estimated turnover of £9.1bn and employs an estimated 33,700 people.
●● The contract research organisations and clinical research segments account for 53% of the service and supply chain segment employment.
●● Suppliers of laboratory equipment, reagents and consumables account for 21% of employment and 45% of turnover.
●● The combined service and supply chain analysis shows a concentration of companies in the Southeast.
●● Other regions of the UK show a concentration of particular types of service and supply chain activity. For example, Scotland has a significant contract manufacturing/research activity and the supply of equipment, reagents & consumables, as does the Midlands and the Northwest of England.

11
Executive Summary
Industrial Biotechnology
For the purpose of this report, the industrial biotechnology sector is defined as those companies whose main business activity and turnover is derived directly from the development, manufacture and selling of products and services that use or contain biological material as catalysts or feedstock to make industrial products. The database focuses on those companies that develop the key technologies that underpin the UK industrial bio-economy. These technologies include fermentation and biotransformation, as well as downstream processing (product purification and separation) and technologies based on biomass production.
This definition of industrial biotechnology companies for inclusion in the database will not capture all of the industrial output generated from the application of this growing technology area. Companies that apply industrial biotechnology in a multi-stage operation to produce products that make-up a minority of their total turnover are not included in this analysis. Hence the value of pharmaceutical end products such as antibiotics or therapeutic proteins is excluded, but the value associated with companies that produce catalysts or organisms used as a reagent for the production of such products is included.
●● The industrial biotechnology sector contains 112 companies that derive the majority of their turnover from technology (e.g. industrial enzymes used across the sector, end-products, such as bio-fuels, or services based on biotechnology.
●● The sector generates an estimated £860m in turnover and employs an estimated 2,600 people.
●● Together the agro-industry and biofuels segment account for 42% and 45% of the employment and turnover in the sector respectively.
●● The turnover for the sector is concentrated, with the top 10 companies accounting for 82% of the sector turnover.
●● Over 2009 to 2014 the sector showed positive trends in estimated employment and turnover of 6.4% and 7.6% CAGR respectively. Growth in turnover was strongest in the biofuels segments although employment declined overall in this segment. All other segments recorded positive employment trends.
●● 99% of the companies have fewer than 250 employees. Of the larger companies, two have turnovers greater than £100m.
●● 53% of employment, 76% of companies and 54% the sector turnover is located in areas outside of London, the East and Southeast of England. This is in contrast to the geographical distribution of companies in the other 3 sectors in this report.

12
Strength and Opportunity 2014The landscape of the medical technology, medical biotechnology, industrial biotechnology and pharmaceutical sectors in the UK
Pharmaceuticals
For the purpose of this report, the pharmaceutical companies included are those that have a global turnover greater than £640m, where their main activity is the research and development of therapeutic products, irrespective of the underlying technology involved. Pharmaceutical companies were first included in the database in 2011.
Pharmaceutical wholesaler companies are included, as well as large supply chain companies. The pharmaceutical and medical biotechnology service and supply chain segments are combined for detailed analysis – as set out in the section on Medical Biotechnology. The combined analysis is also replicated here for ease of reference.
●● The pharmaceutical sector consists of 545 companies – all of the top 20 global pharmaceutical companies have activity in the UK.
●● The sector generates an estimated turnover of £32.4bn and employs 70,000 people including 57,000 in companies discovering, developing and marketing medicines.
●● The small molecules segment contributes the 70% of the total estimated turnover for this sector and 87% of non-supply chain activity.
●● Companies that obtain the majority of their turnover from medicines based on small molecules employ the largest proportion of the workforce, and 78% of this group is employed by companies in the “global Top 20”.1
●● Over the period 2012-2014 the sector trend data shows -2.4% and 0.2% CAGR for estimated employment and turnover respectively. The majority of this reduction in employment was in the small molecule segment. In contrast, the service and supply chain segment shows an increase in estimated employment over this period.
●● The year-on-year trends show decreases in estimated employment up to 2013 with a positive trend returning in 2013-2014. Turnover showed a combination of increase and decreases over 2011-2014 resulting in an overall small positive increase.
●● As only those companies with over £640m global turnover are included, this sector has a higher proportion of large companies than the national average with 17% of companies employing 250 or more and 14 companies employing more than 1,000.
●● Across the UK 42 locations account for 80% of the total sector employment.
●● While all areas of the UK have activity in the sector, the four areas covering the Southeast, Northwest and East of England along with London account for 62-70% of all companies, employment and turnover in the sector.
●● 63% of sites with R&D activity are located in the Southeast of the UK, while the majority of manufacturing sites are located outside of this area.
1
1 Pharma 50 Insight, IMS Consulting, June 2014

13
Executive Summary
The trend set of data on pharmaceutical companies shows a small net increase in estimated turnover of 0.2% CAGR over 2012 – 2014. This overall increase incorporates negative growth in turnover experienced by the service and supply segment. The trends in estimated employment CAGR indicates that the decrease in employment, particularly seen over 2011 to 2013, is in large part due to re-structuring in the large pharmaceutical companies. In contrast, the supply chain segment saw an increase of 1.7% CAGR in estimated employment.
The pharmaceutical sector in the UK has significant concentrations of economic activity in the Southeast of the UK and in the Northwest of England. The Southeast, Northwest, East of England along with London account for 74-75% of all companies and employment in the sector, and 83% of turnover. While the Southeast of the UK has the majority of the R&D sites (63% of the total), the majority of the manufacturing sites are located outside of the Southeast.

14
Strength and Opportunity 2014The landscape of the medical technology, medical biotechnology, industrial biotechnology and pharmaceutical sectors in the UK
List of FiguresFigure 1. Comparison of employment, turnover and number of companies for the four life sciences industry sectors
Figure 2a. Year-on-year trends in estimated employment over 2009 to 2014 (2011 to 2014 for pharmaceutical) for the four life sciences sectors
Figure 2b. Year-on-year trends in estimated turnover over 2009 to 2014 (2011 to 2014 for pharmaceutical) for the four life sciences sectors
Figure 3. Estimated employment and turnover CAGR% from 2009 to 2014 (2012 to 2014 for pharmaceutical turnover)
Figure 4. Distribution of Medical Technology, Medical Biotechnology, Industrial Biotechnology and Pharmaceutical Employment across the UK
Medical Technology
Figure 5. Turnover for the major segments in Medical Technology (only segments with >£200m shown)
Figure 6. Employment, number of companies and turnover for the Medical Technology supply chain (only segments with >500 employees shown)
Figure 7. Number of employees for the major segments in Medical Technology (only segments with >1000 employees shown)
Figure 8. Distribution of Medical Technology companies by turnover
Figure 9. Distribution of medical technology companies by employee numbers
Figure 10. Number of companies in the major segments in Medical Technology (only segments with >50 companies shown)
Figure 11. CAGR in turnover from 2009 to 2013 for the top 6 medical technology segments (by turnover)
Figure 12. Movement in turnover between years over 2009-2014 for the top 6 medical technology segments (by turnover)
Figure 13. Employment growth rates (% CAGR 2009-2014) in the Medical Technology Sector showing top 6 segments (by employment)
Figure 14. Movement in employment between years over 2009-2014 for the top 6 medical technology segments (by employment)
Figure 15. Distribution of companies, turnover and employment across the UK for the Medical Technology sector
Figure 16. Distribution of companies, turnover and employment across the UK for the Medical Technology Supply Chain

15
Medical Biotechnology
Figure 17 –Employment, number of companies and turnover for the Medical Biotechnology sector (excluding the service and supply chain)
Figure 18. Employment, turnover and number of companies for the combined Pharmaceutical + Medical Biotechnology sector compared to the supply chain segment
Figure 19. Distribution of employment, turnover and companies across the combined service and supply chain for the Pharmaceutical and Medical Biotechnology sectors (only sectors with turnover >200 employees shown)
Figure 20. Distribution of Medical Biotechnology companies by turnover
Figure 21. Distribution of Medical Biotechnology companies by employee numbers
Figure 22. Turnover and employment growth rates 2009-2014 for the Medical Biotechnology sector
Figure 23. Movement in employment between years over 2009-2014 for Medical Biotechnology segments
Figure 24. Distribution of companies, turnover and employment across the UK for the Medical Biotechnology sector
Figure 25. Distribution of companies, turnover and employment across the UK for the Pharmaceutical and Medical Biotechnology sector supply chain
Industrial Biotechnology
Figure 26. Distribution of employment, companies and turnover across the UK for the Industrial Biotechnology sector
Figure 27. Distribution of Industrial Biotechnology companies by turnover
Figure 28. Distribution of Industrial Biotechnology companies by employee numbers
Figure 29. Turnover and Employment growth rates 2009-2014 for the Industrial Biotechnology sector
Figure 30. Distribution of employment, companies and turnover across the UK for the Industrial Biotechnology sector
Pharmaceutical Sector
Figure 31. Employment, number of companies and turnover for the Pharmaceutical sector by segment
Figure 32. Distribution of Pharmaceutical companies by turnover
Figure 33. Distribution of Pharmaceutical companies by employee numbers
Figure 34. Percentage change in turnover between 2011 and 2014 by major segments for the Pharmaceutical sector
List of Figures
16
Strength and Opportunity 2014The landscape of the medical technology, medical biotechnology, industrial biotechnology and pharmaceutical sectors in the UK
Figure 35. Movement in turnover between years over 2012-2014 for pharmaceutical segments
Figure 36. Movement in employment between years over 2011-2014 for pharmaceutical segments
Figure 37. Distribution of employment, companies and turnover across the UK for the Pharmaceutical sector
Figure 38. Distribution of manufacturing and R&D sites across the UK for the Pharmaceutical sector
Appendix IV
Figure IV a. Number of companies added to the database in 2014 compared with total in 2013 (only companies that are over 12 months old are shown as additions)
Figure IV b. Impact on sector turnover of companies added to data in 2014
Figure IV c. Impact on sector employment of companies added to data in 2014
Table IV e. Impact of changes to dataset implemented in 2014 on total industry employment and turnover compared 2013 totals (NIS – not in scope)
Figure IV d – Comparison of the turnover distribution for the major segments in Medical Technology (only segments with >£200m shown) using 2013 versus 2014 segmentation coding
Figure IV e. Comparison of the employment distribution for the major segments in Medical Technology (only segments with >1000 employees shown) using 2013 versus 2014 segmentation coding
Figure IV f. Comparison of the turnover distribution for the segments in Medical biotechnology using 2013 versus 2014 segmentation coding
Figure IV g. Comparison of the employment distribution for the segments in Medical biotechnology using 2013 versus 2014 segmentation coding
Figure IV h. Comparison of the turnover distribution for the segments in Industrial biotechnology using 2013 versus 2014 segmentation coding
Figure IV i. Comparison of the employment distribution for the segments in Industrial biotechnology using 2013 versus 2014 segmentation coding
Figure IV j. Comparison of the turnover distribution for the segments in the pharmaceutical sector using 2013 versus 2014 segmentation coding
Figure IV k. Comparison of the employment distribution for the segments in the pharmaceutical sector using 2013 versus 2014 segmentation coding

17
List of Figures
References1. Pharma 50 Insight, IMS Consulting, June 2014
2. World Preview 2014, Outlook to 2020, Evaluate MedTech, October 2014
3. Pharma 50 Insight, IMS Consulting, June 2014
4. World Preview 2014, Outlook to 2020, EvaluatePharma, June 2014

18
Chapter 1
IntroductionThis sixth Strength and Opportunity report presents analysis of the 2014 annual review of the UK life sciences industry. The source of data is the Bioscience and Health Technologies Database that was established in 2009 and is owned by the Office for Life Sciences (a joint unit of Department of Health and the Department for Business, Innovation & Skills). The creation and maintenance of a national company database is supported by the Devolved Administrations, national and regional industry bodies, the Medical Research Council and the Biotechnology and Biological Sciences Research Council. These organisations contribute information on companies in their sector or geographical area. Appendix I lists the data partners that have provided support and assistance over the last six years.
The database was established to provide a comprehensive set of information on those companies active in the UK life sciences industry – something that was not possible by using the Office for National Statistics Standard Industry Classification codes alone. When established in 2009, the database covered the medical technology, medical biotechnology, and industrial biotechnology sectors. The process to extend the database to include the pharmaceutical industry began in 2010, with data on pharmaceutical companies included from 2011.
Appendix II gives a summary of the methodology used to construct and maintain the database and Appendix III provides the segmentation coding used for classifying companies by product and service type.
The annual update is a snap shot of the UK life sciences industry at a particular point in time. Each year the dataset is affected by a number of changes, including the creation of new companies, the addition of companies not previously included (but have been in existence for over 12 months), and improved matching of companies to data from third party databases (Dun & Bradstreet and FAME).
As in previous years, this 2014 update is impacted by a number of changes in the quantity and quality of the data, as well as underlying changes in the activity of individual companies. A summary of the key impacts is listed below. Appendix IV shows a more detailed analysis of the impact of these changes compared with 2013.
The main changes are:
●● Deep dive review of all records in the database to check addresses, segmentation and trading activity – this resulted in an improved match rate of companies to financial and employment data.
●● As in previous years a scan is conducted of the sector to discover companies that have existed for over 12 months and have not been picked up in previous years. These additions do not represent real growth in the sector and the impact of these companies to the overall data is shown in Appendix IV.

19
Introduction
●● The implementation of a new segmentation methodology for companies previously identified as specialist suppliers within each sector – this has been developed to provide in-depth analysis of this significant part of the life sciences industry. This segment has been renamed the “Service and Supply Chain” and companies have been coded against the 18 sub-segments shown in Appendix III. This has allowed a clearer division between companies producing products and services for healthcare sector and those providing products and services to companies in the life sciences industry (i.e. business-to-business).
●● In the pharmaceutical segment a change has been made to simplify the analysis with removal of the analysis of the global top 10.

20
Chapter 2
Medical Technology Sector2.1. Sector Definition
For the purpose of this report, companies in the medical technology sector are those whose major business activity involves the development, manufacture or distribution of medical devices as defined by European Union Medical Devices Directive (93/42/ECC) and companies that have significant activity in supplying products and services to the medical technology sector.
The medical technology sector in the Biosciences and Health Technology database is divided into 22 segments based on the products or services the company develops or offers (see Appendix III). Companies can be classified as being active in more than one of these segments – but for this report the analysis is based on companies classified by the primary activity from which the majority of their turnover and employment is derived.
2.2. Sector Overview
●● The medical technology sector contains an estimated 3,268 companies, generates an estimated turnover of £18.1bn and employs an estimated 88,000 people across the UK.
●● The three largest product segments are single use technology, in-vitro diagnostics, and orthopaedic devices accounting for an estimated 33% of all non-service and supply chain sector employment and turnover.
●● The 848 companies in the service and supply chain segment account for the largest proportion of sector employment and turnover. Companies supplying equipment, reagents and consumables to companies and the NHS comprise the largest sub-segment, followed by contract manufacturing and specialist consultants.
●● Over 2009 to 2014 the sector showed positive growth trends in both employment and turnover, with estimated CAGRs of 9.1% and 5.8% respectively.
●● Wound care and management is the fastest growing product segment for turnover (11% CAGR) and in-vitro diagnostic technology for employment (18% CAGR).
●● Year-on-year trends indicate a contraction in employment in 2009 to 2010 with growth returning each year from 2011 to 2014 across the sector.
●● The majority (97%) of companies are SMEs employing fewer than 250 staff and 83% have turnover <£5m. There are 144 companies with turnover >£50m per annum.
●● 82% of the companies in the sector are UK-owned – these account for 55% of employment.

21
Introduction
●● The Southeast of England is the location for 16% of companies and 19% of employment. Significant concentrations of economic activity are also evident in the East of England, across the Midlands, the Northwest of England, and Yorkshire & the Humber.
2.3. Turnover and Employment
The estimated 3,268 companies in the medical technology sector generated a turnover of £18.1bn distributed across 22 product and service segments including the supply chain. As shown in Figure 5 the service and supply chain generates the largest turnover, and the top 5 segments (excluding the service and supply chain) account for 44% of the sectors turnover.
The top 5 core product segments are:
●● Single use technology (e.g. syringes, medical gloves, stoma pouches);
●● In-vitro diagnostic products (e.g. instruments and reagents for immunology, microbiology and genetic testing);
●● Orthopaedic devices (e.g. hip replacements, spinal implants);
●● Wound care and management (e.g. skin ulcer treatment, moist dressings);
●● Ophthalmic devices (e.g. cataract surgery devices, retinal implants).
Compared with 2014, four of the top 5 remain the same; ophthalmic devices segment replaces anaesthetic and respiratory technology in fifth place. The addition of new ophthalmic companies into the 2014 dataset combined with re-segmentation (as explained in Appendix IV) accounts for this change.

22
Strength and Opportunity 2014The landscape of the medical technology, medical biotechnology, industrial biotechnology and pharmaceutical sectors in the UK
Figure 5. Turnover for the major segments in Medical Technology (only segments with >£200m shown)
Tu
rno
ver
£m
0
500
1,000
1,500
2,000
2,500
3,000
3,500
Educa
tion
and
Traini
ng
Infe
ction
Con
trol
Impla
ntab
le de
vices
Cardio
vasc
ular a
nd va
scula
r dev
ices
Denta
l and
max
illofa
cial t
echn
ology
Anaes
thet
ic an
d re
spira
tory
tech
nolog
y
Hospit
al ha
rdw
are
includ
ing am
bulat
ory
Mob
ility A
cces
s
Radiot
hera
py e
quipm
ent
ICT+
E-h
ealth
Re-us
able
diagn
ostic
or a
nalyt
ic eq
uipm
ent n
.e.c.
Med
ical Im
aging
/Ultr
asou
nd E
quipm
ent a
nd M
ater
ials
Drug
Delive
ry
Surgic
al In
stru
men
ts (r
eusa
ble)
Assist
ive Te
chno
logy
Ophth
almic
Device
s/Equ
ipmen
t
Wou
nd C
are
and
Man
agem
ent
Orthop
aedic
Dev
ices
In vi
tro d
iagno
stic
tech
nolog
y
Single
use
tech
nolog
y
Servic
e & S
upply
Cha
in
The service and supply chain segment now accounts for 17% of the total turnover in the sector and has been boosted in 2014 compared to 2013 due to the addition of new companies and the re-classification of some companies from other segments.
Figure 6 shows the distribution of turnover across the Medical Technology service and supply chain segment. The largest segment is made up of 234 companies supplying equipment, reagents and other consumables to medical technology companies as well as directly to health service providers (primarily the NHS in the UK). A number of the larger companies in this segment develop, manufacture and sell a broad portfolio of products.
Also in this part of the supply chain are distributors of products that fall into other segments, for example distributors providing bandages, disposable swabs, trays and storage equipment to hospitals.

23
Introduction
Figure 6. Employment, number of companies and turnover for the Medical Technology service and supply chain (only segments with >500 employees shown)
Nu
mb
er o
f E
mp
loye
es
Nu
mb
er o
f C
om
pan
ies
or
Tu
rno
ver
0
1,000
2,000
3,000
4,000
5,000
Logis
tics a
nd P
acka
ging
Health
care
serv
ices
Analyt
ical S
ervic
es
Contra
ct d
esign
Paten
t and
Leg
al sp
ecial
ist
Mar
ket A
nalys
is/Spe
cialis
t con
sulta
nts
Clinica
l Res
earc
h Org
anisa
tion
Contra
ct M
anuf
actu
ring/
Resea
rch
Reage
nt E
quipm
ent a
nd
cons
umab
les su
pplie
r
0
200
400
600
800
1,000
1,200
Employment(LH scale)
Number of Companies(RH scale)
Turnover (£m)(RH scale)
234
103 11
227
24 65 28 26 21
An estimated total of 88,000 people are employed in the medical technology sector – making it the largest employer of the sectors covered in this report. The addition of companies that were not included in last year’s report has added an estimated 6,500 to the sector employment. This, combined with growth in employment for those companies previous included in the database, accounts for the majority of the observed increase in employment between 2013 and 2014.
The distribution of employment across the segments is shown in Figure 7. As in previous years, excluding the supply chain segment, single use technology, orthopaedic devices and in-vitro diagnostics retain the top 3 positions in terms of employment. These three segments account for 25% of the sector employment.
The supply chain and services sector consists of 848 identified companies with estimated employment of 16,600 people. The increase in employment in the service and supply chain segment compared to 2013 is mainly due to the addition on newly identified companies and re-classification from other medical technology segments. As shown in Figure 6 companies supplying equipment, reagents and other consumables make up the largest service and supply chain employers.

24
Strength and Opportunity 2014The landscape of the medical technology, medical biotechnology, industrial biotechnology and pharmaceutical sectors in the UK
The composition of the medical technology sector in terms of the size of companies is shown in Figures 8 and 9. This data shows that the sector is composed mainly of small and medium-sized enterprises that employ fewer than 250 people. In the data set, 67 companies (2% of the total) employ more than 250 people, 76 companies have an estimated turnover of over £50 million and within that 36 have an estimated turnover of over £100 million.
Figure 7. Number of employees for the major segments in Medical Technology (only segments with >1000 employees shown)
Nu
mb
er o
f E
mp
loye
es
0
2,000
4,000
6,000
8,000
10,000
12,000
14,000
16,000
18,000
Denta
l and
max
illofa
cial t
echn
ology
Cardio
vasc
ular a
nd va
scula
r dev
ices
Anaes
thet
ic an
d re
spira
tory
tech
nolog
y
Ophth
almic
Device
s/Equ
ipmen
t
Infe
ction
Con
trol
Med
ical Im
aging
/Ultr
asou
nd E
quipm
ent a
nd M
ater
ials
Mob
ility A
cces
s
Surgic
al In
stru
men
ts (r
eusa
ble)
Hospit
al ha
rdw
are
includ
ing am
bulat
ory
Drug
Delive
ry
ICT+
E-h
ealth
Re-us
able
diagn
ostic
or a
nalyt
ic eq
uipm
ent
Wou
nd C
are
and
Man
agem
ent
Assist
ive Te
chno
logy
In vi
tro d
iagno
stic
tech
nolog
y
Single
use
tech
nolog
y
Orthop
aedic
Dev
ices
Servic
e & S
upply
Cha
in

25
Introduction
Figure 8. Distribution of Medical Technology companies by turnover
£0-49,00015%
£50-99,0007%
£0.1-0.249m15%
£0.25-0.499m15%
£0.5-0.999m11%
£1-4.9m20%
£5m+17%
Figure 9. Distribution of Medical Technology companies by employee numbers
0-444%
50-997%
100-2494%
5-916%
10-1913%
20-4913%
250+3%
Figure 10 presents analysis of the number of companies per segment showing a large number of service and supply chain companies. Within the service and supply chain 67% of companies are in the reagent, equipment and consumables (ER&C), market analysis/specialist consultant and contract manufacturing/research sub-segments. Companies with turnovers greater than £50m are most frequent in the ER&C segment, with all other service and supply sub-segments having 1 – 6 companies with this scale of turnover.
Data on the ownership of the companies in the sector indicate that 82% of the companies in the sector are UK-owned and account for 55% of sector employment.

26
Strength and Opportunity 2014The landscape of the medical technology, medical biotechnology, industrial biotechnology and pharmaceutical sectors in the UK
Figure 10. Number of companies in the major segments in Medical Technology (only segments with >50 companies shown)
Nu
mb
er o
f C
om
pan
ies
0
100
200
300
400
500
600
700
800
900
Cardio
vasc
ular a
nd va
scula
r dev
ices
Anaes
thet
ic an
d re
spira
tory
tech
nolog
y
Ophth
almic
Device
s/Equ
ipmen
t
Med
ical Im
aging
/Ultr
asou
nd E
quipm
ent a
nd M
ater
ials
Surgic
al In
stru
men
ts (r
eusa
ble)
Wou
nd C
are
and
Man
agem
ent
Infe
ction
Con
trol
Denta
l and
max
illofa
cial t
echn
ology
Orthop
aedic
Dev
ices
Mob
ility A
cces
s
Hospit
al ha
rdw
are
includ
ing am
bulat
ory
ICT+
E-h
ealth
Re-us
able
diagn
ostic
or a
nalyt
ic eq
uipm
ent
In vi
tro d
iagno
stic
tech
nolog
y
Single
use
tech
nolog
y
Assist
ive Te
chno
logy
Servic
e & S
upply
Cha
in
2.4. Trends – Turnover and Employment
A subset of 1,472 medical technology companies across all segments is used as a trend set to analyse the estimated turnover and employment trends for the sector over 2009 to 2014. The trend set was selected based on companies for which data was available for this six-year period and for the majority of segments there are more than 30 companies included in each trend set. Overall the trend set accounts for 45% of all medical technology companies in the dataset, 50% of all employees and 31% of the sector turnover.
The analysis of this data shows that overall the UK medical technology sector has experienced a sustained growth period in the last 6 years with compound annual growth rates (CAGR) of 6% in estimated turnover which is similar to the 5% rate seen for the global industry2. The growth in estimated turnover has been seen over most individual years. Estimated employment fell over the period 2009 to 2010, before picking up strongly in the following years to achieve an overall CAGR of 9% over the 6 years.
2 World Preview 2014, Outlook to 2020, Evaluate MedTech, October 2014
27
Introduction
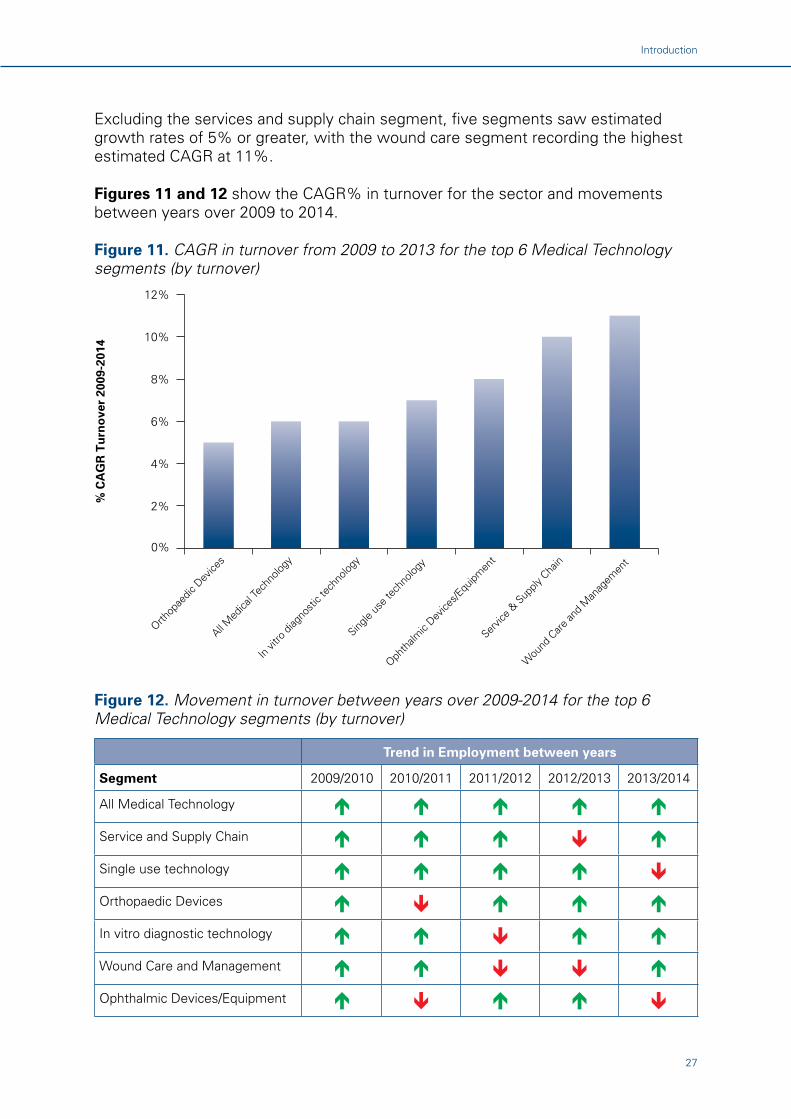
Excluding the services and supply chain segment, five segments saw estimated growth rates of 5% or greater, with the wound care segment recording the highest estimated CAGR at 11%.
Figures 11 and 12 show the CAGR% in turnover for the sector and movements between years over 2009 to 2014.
Figure 11. CAGR in turnover from 2009 to 2013 for the top 6 Medical Technology segments (by turnover)
% C
AG
R T
urn
ove
r 20
09-2
014
0%
2%
4%
6%
8%
10%
12%
Wou
nd C
are
and
Man
agem
ent
Servic
e & S
upply
Cha
in
Ophth
almic
Device
s/Equ
ipmen
t
Single
use
tech
nolog
y
In vi
tro d
iagno
stic
tech
nolog
y
All Med
ical T
echn
ology
Orthop
aedic
Dev
ices
Figure 12. Movement in turnover between years over 2009-2014 for the top 6 Medical Technology segments (by turnover)
Trend in Employment between years
Segment 2009/2010 2010/2011 2011/2012 2012/2013 2013/2014
All Medical Technology
Service and Supply Chain
Single use technology
Orthopaedic Devices
In vitro diagnostic technology
Wound Care and Management
Ophthalmic Devices/Equipment

28
Strength and Opportunity 2014The landscape of the medical technology, medical biotechnology, industrial biotechnology and pharmaceutical sectors in the UK
The five largest employment sectors (excluding the supply chain and services segment) all showed CAGRs in estimated employment of 7% or more over 2009 to 2014, with in-vitro diagnostics showing the highest rate at 18%.
Figures 13 and 14 show the CAGR% in employment for the sector and movements between years over 2009 to 2014.
Figure 13. Employment growth rates (% CAGR 2009-2014) in the Medical Technology Sector showing top 6 segments (by employment)
% C
AG
R E
mp
loym
ent
2009
-201
4
0%
2%
4%
6%
8%
10%
12%
14%
16%
18%
20%
In vi
tro d
iagno
stic
tech
nolog
y
Single
use
tech
nolog
y
All Med
ical T
echn
ology
Assist
ive Te
chno
logy
Orthop
aedic
Dev
ices
Ophth
almic
Device
s/Equ
ipmen
t
Servic
e & S
upply
Cha
in
Figure 14. Movement in employment between years over 2009-2014 for the top 6 Medical Technology segments (by employment)
Trend in Employment between years
Segment 2009/2010 2010/2011 2011/2012 2012/2013 2013/2014
All Medical Technology
Service and Supply Chain
Single use technology
Orthopaedic Devices
In vitro diagnostic technology
Assistive Technology
Ophthalmic Devices/Equipment

29
Introduction
2.5. UK Profile
The geographical distribution of companies, estimated employment and turnover for the medical technology sector is shown in Figure 15. The Southeast of England accounts for 16% of companies and 19% of the estimated employment in this sector. Significant concentrations of economic activity are also evident in the East of England, across the Midlands, the Northwest of England, Yorkshire and the Humber. Together, these top 5 regions account for 62% of all employment and companies in the UK.
Figure 15. Distribution of companies, turnover and employment across the UK for the Medical Technology sector
Nu
mb
er o
f E
mp
loye
es
Nu
mb
er o
f C
om
pan
ies
or
Tu
rno
ver
0
2,000
4,000
6,000
8,000
10,000
12,000
14,000
16,000
18,000
North
ern
Irelan
d
North
Eas
t
Lond
on
South
Wes
t
Scotla
nd
Wale
s
East M
idlan
ds
North
Wes
t
York
shire
and
the
Humbe
r
Wes
t Midl
ands
East o
f Eng
land
South
Eas
t
0
1000
2,000
3,000
4,000
5,000
6,000
Employment(LH scale)
Number of Companies(RH scale)
Turnover (£m)(RH scale)
Figure 16 shows the distribution of economic activity for the medical technology service and supply chain segment. The segment shows a distribution of employment that is more dispersed across the UK then for the sector as a whole.

30
Strength and Opportunity 2014The landscape of the medical technology, medical biotechnology, industrial biotechnology and pharmaceutical sectors in the UK
Figure 16. Distribution of companies, turnover and employment across the UK for the Medical Technology service and supply chain
Nu
mb
er o
f E
mp
loye
es
Nu
mb
er o
f C
om
pan
ies
or
Tu
rno
ver
0
500
1,000
1,500
2,000
2,500
3,000
3,500
North
ern
Irelan
d
North
Eas
t
York
shire
and
The
Humbe
r
South
Wes
t
Wale
s
Scotla
nd
Wes
t Midl
ands
South
Eas
t
North
Wes
t
East M
idlan
ds
Lond
on
East o
f Eng
land
0
100
200
300
400
500
600
700
Employment(LH scale)
Number of Companies(RH scale)
Turnover (£m)(RH scale)

31
Introduction
2.6. Geographical Distribution of Medical Technology Companies

32
Chapter 3
Medical Biotechnology Sector3.1. Sector Definition
The definition of medical biotechnology companies includes small to medium sized companies (typically with annual global revenues of below £640m) that focus on the discovery or development of new therapeutics that principally act in or on the human body by pharmacological, immunological or metabolic means. The sector definition also includes companies that derive the majority of their revenue from products and services that they supply to other companies in the sector – the service and supply chain segment.
3.2. Sector Overview
●● The medical biotechnology sector consists of an estimated 1,013 companies generating turnover of £4.8bn and employing 23,000 people.
●● A third of companies (322) are active in the discovery and development of new medicines based on biotechnology. Two thirds of companies supply products or provide services.
●● Outside the service and supply chain, the two largest segments by turnover and employment are companies using molecule or antibody techniques.
●● Using trend data analysis, over the period 2009-2014, the sector has seen 0.0% and 4.3% CAGR in employment and turnover respectively
●● The medical biotechnology service and supply chain shows a slightly lower growth rate in turnover of 3%.
●● Companies developing new medicines using therapeutic proteins and small molecules show the highest growth rates in estimated turnover of 9-15%.
●● Over the same period, employment in the overall sector has been flat but with a small increase for companies outside of the service and supply chain.
●● Year-on-year saw a trend of decreasing employment over 2010 to 2012 followed by increases over the last 2 years.
●● 85% of companies have a turnover of less than £5m.
●● 96% of the companies have fewer than 250 employees, with companies employing fewer than 10 staff making up an estimated 64% of these SMEs.
●● Together the Southeast and East of England including London contains 43% of the employment and 54% of the companies in the UK.
●● The north of England (the Northwest, Yorkshire and the Humber and the Northeast) accounts for 16.5% of sector employment, Scotland 11% and the Midlands (East and West) 14%.

33
Medical Biotechnology Sector
3.3. Turnover and Employment
Using information from the database, there are an estimated 1,013 medical biotechnology companies in the UK. Of those, approximately one third are involved in the discovery and development of new medicines based on biotechnology, the service and supply chain account for the remaining two thirds. The medical biotechnology sector generated an estimated turnover of £4.8bn in 2014 and employed an estimated 23,000 people.
As shown in Figure 17 outside the service and supply chain, the largest segment by estimated turnover and employment involved in developing new medicines, focused on small molecule chemistry as the technology platform. The antibody technology segment is the next largest employer and generates the second largest turnover. In terms of the number of companies, the emerging advanced therapy medicinal products segment contains the second largest number of companies after small molecules.
Figure 17. Employment, number of companies and turnover for the Medical Biotechnology sector (excluding the service and supply chain)
0
20
40
60
80
100
120
140
160
Number of Employees Turnover (£m) Number of Companies(RH Scale)
Nu
mb
er o
f E
mp
loye
es o
r T
urn
ove
r
Nu
mb
er o
f C
om
pan
ies
0
500
1,000
1,500
2,000
2,500
3,000
Blood &Tissue Products
VaccinesAdvanced TherapyMedicinal Products
TherapeuticProteins
AntibodiesSmall Molecules
152
35
4757
21
10
The medical biotechnology and pharmaceutical sectors outsource a number of key activities involved in the drug discovery, development and production value chain. This trend has developed a sophisticated and critical mass of service and supply chain companies providing clinical and contract research services, assays and equipment to support discovery and development, contract manufacturing and formulation expertise for companies in the UK and overseas.

34
Strength and Opportunity 2014The landscape of the medical technology, medical biotechnology, industrial biotechnology and pharmaceutical sectors in the UK
Figure 18 compares the economic activity of the combined pharmaceutical and medical biotechnology services and supply segment with the sectors it serves. This segment employs an estimated 33,700 people in 935 identified companies, generating an estimated turnover of £9.1bn. In turn it supports a combined pharmaceutical and medical biotechnology sector developing new medicines that employs a further 58,800 people and generates a turnover of £28bn.
Figure 18. Employment, turnover and number of companies for the combined Pharmaceutical and Medical Biotechnology sector compared to the service and supply chain segment
0
10,000
20,000
30,000
40,000
50,000
60,000
70,000
CompaniesTurnover £mEmployees
Nu
mer
of
Em
plo
yees
, n
um
ber
of
com
pan
ies
and
Tu
rno
ver
(£m
)
58,801
33,747
28,084
9,097
623 935
Combined Pharmaceutical and Medical Biotechnology companies (exc. service & supply chain)
Combined Pharmaceutical and MedicalBiotechnology service & supply chain companies
As shown in Figure 19 the contract manufacturing and contract research segment employs approximately 40% of the supply chain workforce while the ER&C segment generates 58% of the turnover. A number of companies in the supply chain are significant global companies particularly in the clinical research and ER&C segments.

35
Medical Biotechnology Sector
Figure 19. Distribution of employment, turnover and companies across the combined service and supply chain for the Pharmaceutical and Medical Biotechnology sectors (only sectors with turnover >200 employees shown)
Nu
mb
er o
f E
mp
loye
es
Nu
mb
er o
f C
om
pan
ies
or
Tu
rno
ver
0
2,000
4,000
6,000
8,000
10,000
12,000
14,000
Paten
t and
Leg
al sp
ecial
ist
Regula
tory
Exp
ertis
e
Form
ulatio
n/Dru
g de
liver
y spe
cialis
t
Health
care
serv
ice p
rovid
er
Mar
ket A
nalys
is/In
form
ation
Con
sulta
nts/
Comm
unica
tions
/Spe
cialis
t con
sulta
nts
Contra
ct F
orm
ulatio
n M
anuf
actu
ring
Info
rmat
ion sy
stem
s spe
cialis
ts
Recru
itmen
t
Logis
tics a
nd P
acka
ging
Analyt
ical S
ervic
es
Clinica
l Res
earc
h Org
anisa
tion
Reage
nt E
quipm
ent a
nd
cons
umab
les su
pplie
r
Contra
ct M
anuf
actu
ring/
Resea
rch
Organ
isatio
n
0
500
1,000
1,500
2,000
2,500
3,000
3,500
4,000
4,500
Employment(LH scale)
Number of Companies(RH scale)
Turnover (£m)(RH scale)
215 201 75 49 16 18 36 7 175 4 24 41 20
The turnover and employment profile of the medical biotechnology sector (including the service and supply segment) is shown in Figures 20 and 21. The profile shows 85% of companies have a turnover of less than £5m and 98% have fewer than 250 employees. A significant proportion of the companies developing new therapies are likely to be pre-revenue and investing in the discovery and development phases of drug development and this expenditure is not accounted by the turnover data.
An estimated 80% of the companies are UK-owned and employ nearly 52% of all employees in the sector.

36
Strength and Opportunity 2014The landscape of the medical technology, medical biotechnology, industrial biotechnology and pharmaceutical sectors in the UK
Figure 20. Distribution of Medical Biotechnology companies by turnover
£50-99,00013%
£1-4.9m14%
£5m+15%
£0.1-0.249m22%
£0.25-0.499m15%
£0.5-0.999m10%
£0-49,00011%
Figure 21. Distribution of Medical Biotechnology companies by employee numbers
50-992%
20-4913%
100-2496%
250+4%
5-99%
10-1911%
0-455%
3.4. Trends – Turnover and Employment
A sample of 251 medical biotechnology companies is used as a trend set to analyse estimated turnover and employment trends for the sector over 2009 to 2014. The trend set is smaller than that used in last year’s analysis due to companies being acquired or ceasing activities. It is mainly comprised of the companies from the service and supply chain, small molecule, advanced therapy medicinal products and antibody segments.
The trend set of medical biotechnology companies has experienced a 4% CAGR in estimated turnover over 2009-2014, with the services and supply chain segment (for medical biotechnology only) showing a slightly lower growth rate of 3%. Over the same period, estimated employment in the overall sector has been flat but with a small increase for companies outside of the services and supply chain segment.

37
Medical Biotechnology Sector
Figure 22 shows the estimated growth rates in turnover and employment of the sector and for segments where the trend set contains a sufficient number of companies. Companies in the small molecule, therapeutic protein and advanced therapy medicinal products segments experienced positive estimated turnover growth rates over 2009-2014. The small molecule and therapeutic protein segments had low or declining employment trends, while strong employment growth was seen in the regenerative medicine segment. The nature of the biotechnology sector means that single product approvals and launch can have a significant impact on turnover levels over short periods and will tend to generate large increases in turnover from a low or zero base.
Figure 22. Turnover and employment growth rates 2009-2014 for the Medical Biotechnology sector
% C
AG
R T
urn
ove
r o
r E
mp
loym
ent
CAGR Turnover CAGR Employment
-4%
-2%
0%
2%
4%
6%
8%
10%
12%
14%
16%
Ther
apeu
tic p
rote
ins
Small
Mole
cules
Med
ical B
iotec
hnolo
gy e
xclud
ing
serv
ice &
supp
ly ch
ain
Advan
ced
Ther
apy
Med
icina
l Pro
duct
s
Med
ical B
iotec
holog
y
Servic
e & su
pply
Chain
Over the period 2009-2014 there are marked differences between the year-on-year movements for turnover and employment across the sector. For companies outside the services and supply chain segment, the trend data shows a year-on-year increase in estimated turnover. However, as shown in Figure 23 the period between 2010 to 2012 saw an almost universal decrease in employment in the sector before recovering in 2013 to 2014.

38
Strength and Opportunity 2014The landscape of the medical technology, medical biotechnology, industrial biotechnology and pharmaceutical sectors in the UK
Figure 23. Movement in employment between years over 2009-2014 for Medical Biotechnology segments
Trend in Employment between years
Segment 2009/2010 2010/2011 2011/2012 2012/2013 2013/2014
Medical Biotechology
Service and supply Chain
Medical Biotechnology excluding supply chain
Small Molecules
Therapeutic proteins
Advanced Therapy Medicinal Products
3.5. UK Profile
The geographical distribution of economic activity of the medical biotechnology sector is shown in Figure 24. Together the Southeast, East of England including London contains 43% of the employment and 54% of the companies in the UK. This area accounts for 60% of the sector turnover – this is boosted by the high number of headquarters located in this area through which turnover is reported.
Figure 24. Distribution of companies, turnover and employment across the UK for the Medical Biotechnology sector
Nu
mb
er o
f E
mp
loye
es
Nu
mb
er o
f C
om
pan
ies
or
Tu
rno
ver
0
500
1,000
1,500
2,000
2,500
3,000
3,500
4,000
4,500
South
Wes
t
North
Eas
t
York
shire
and
the
Humbe
r
Wes
t Midl
ands
North
ern
Irelan
d
Lond
on
North
Wes
t
Wale
s
East M
idlan
ds
Scotla
nd
East o
f Eng
land
South
Eas
t
0
200
400
600
800
1,000
1,200
Number of employees(LH scale)
Number of Companies(RH scale)
Turnover (£m)(RH scale)
208 218
11256 54 73
122
8 46 58 3620

39
Medical Biotechnology Sector
The distribution of the combined pharmaceutical and medical biotechnology service and supply chain is shown in Figure 25. While the Southeast of England contains the highest number of estimated employees, similar to the medical biotechnology and pharmaceutical sectors overall, there are differences in the distribution of economic activity. For example Scotland has large numbers employed in the contract manufacturing/research and ER&C segments. The East Midlands and the Northwest of England also have concentrations in these segments. The significant levels of turnover attributed to the West Midlands are boosted by a number of companies in the ER&C segments being located in this area.
Figure 25. Distribution of companies, turnover and employment across the UK for the Pharmaceutical and Medical Biotechnology service and sector supply chains
Em
plo
yees
Nu
mb
er o
f C
om
pan
ies
or
Tu
rno
ver
0
1,000
2,000
3,000
4,000
5,000
6,000
7,000
8,000
9,000
South
Wes
t
Wale
s
North
ern
Irelan
d
North
Eas
t
York
shire
and
The
Humbe
r
Lond
on
North
Wes
t
Wes
t Midl
ands
East M
idlan
ds
East o
f Eng
land
Scotla
nd
South
Eas
t
0
500
1,000
1,500
2,000
2,500
3,000
3,500
Number of employees(LH scale)
Number of Companies(RH scale)
Turnover (£m)(RH scale)
232 100 183 54 46 68 90 51 37 10 40 20

40
Strength and Opportunity 2014The landscape of the medical technology, medical biotechnology, industrial biotechnology and pharmaceutical sectors in the UK
3.6. Geographical Distribution of Medical Biotechnology companies

41
Chapter 4
Industrial Biotechnology Sector4.1. Sector Definition
The definition of the industrial biotechnology sector used in this report refers to companies whose main business activity and turnover is derived directly from the development, manufacture and sale of products and services that use or contain biological material as catalysts or feedstock to make industrial products. As in the other sectors, where companies are using biotechnology to make products or services that contribute only a minor amount towards their turnover they are excluded from this analysis. The database focuses on those companies that develop the key technologies that underpin the UK industrial bio-economy. These technologies include fermentation and biotransformation, as well as downstream processing (product purification and separation) and technologies based on biomass production.
This definition of industrial biotechnology companies for inclusion in the database will not capture all of the industrial output generated from the application of this growing technology area. Companies that apply industrial biotechnology in a multi-stage operation to produce products that make-up a minority of their total turnover are not included in this analysis. Hence the value of pharmaceutical end products such as antibiotics or therapeutic proteins is excluded, but the value associated with companies that produce catalysts or organisms used as a reagent for the production of such products is included.

42
4.2. Sector Overview
●● The industrial biotechnology sector contains 112 companies that derive the majority of their turnover from technology (e.g. industrial enzymes used across the sector, end-products, such as bio-fuels, or services based on biotechnology.
●● The sector generates an estimated £860m in turnover and employs an estimated 2,600 people.
●● Together the agro-industry and biofuels segment account for 42% and 45% of the employment and turnover in the sector respectively.
●● The turnover for the sector is concentrated, with the top 10 companies accounting for 82% of the sector turnover.
●● Over 2009 to 2014 the sector showed positive trends in estimated employment and turnover of 6.4% and 7.6% CAGR respectively. Growth in turnover was strongest in the biofuels segments although employment declined overall in this segment. All other segments recorded positive employment trends.
●● 99% of the companies have fewer than 250 employees. Of the larger companies, two have turnovers greater than £100m.
●● 53% of employment, 76% of companies and 54% the sector turnover is located in areas outside of London, the East and Southeast of England. This is in contrast to the geographical distribution of companies in the other 3 sectors in this report.
4.3. Turnover and Employment
The industrial biotechnology sector in the UK as defined by this report consists of 112 companies that generate an estimated turnover of £860m and employ an estimated 2,600 people. As shown in Figure 26, the agro-industry (covering biotechnology applied to plants and animals) segment is the largest sector in terms of estimated employment and turnover in 2014. While not directly comparable to the 2013 dataset – there has been a change in the leading segment – this is due to the inclusion for the first time of activities of a number of leading agriculture biotechnology companies. The next largest segments are biofuels and personal care/cosmetics (the latter consists of companies making ingredients for this market). Of the non-supply chain and services segments, biofuels and agro-industry together account for 42% and 45% of the estimated employment and turnover respectively.

43
Industrial Biotechnology Sector
Figure 26. Distribution of employment, companies and turnover by segment for the Industrial Biotechnology sector
Nu
mb
er o
f E
mp
loye
es
Nu
mb
er o
f C
om
pan
ies
or
Tu
rno
ver
0
100
200
300
400
500
600
700
800
Pharm
aceu
tical
Inte
rmed
iaries
Enviro
nmen
tal
Food
and
Drink
Fine
and
Specia
lity C
hem
icals
Perso
nal C
are/
Cosm
etics
Biofue
ls
Servic
e & S
upply
Cha
in
Agro-
indus
try
0
50
100
150
200
250
Number of employees(LH scale)
Number of Companies(RH scale)
Turnover (£m)(RH scale)
425 28
4 6 12 13 5
The estimated turnover for the whole sector is concentrated in the top 10 companies (9% of all companies) accounting for 82% of the total estimated turnover. The companies in this top 10 come from a number of segments including agro-industry, biofuels, fine & specialty chemicals, food & drink and the services and supply chain.
Figures 27 and 28 show the distribution of companies by estimated turnover and employment bands. This highlights that in 2014 the sector is largely composed of companies employing fewer than 250 people. Of the companies with larger turnovers (greater than £10m), there are two companies (in agro-industry and industrial enzymes) with turnovers greater than £100m, four companies in the range £50-99m and ten in the range £10-49m.

44
Strength and Opportunity 2014The landscape of the medical technology, medical biotechnology, industrial biotechnology and pharmaceutical sectors in the UK
Figure 27. Distribution of Industrial Biotechnology companies by turnover
£50-99,00013%
£1-4.9m16%
£5m+18%
£0.1-0.249m16%
£0.25-0.499m16%
£0.5-0.999m12%
£0-49,00012%
Figure 28. Distribution of Industrial Biotechnology companies by employee numbers
50-9911%
20-4913%
100-2491%
5-914%
10-1912%
0-449%
4.4. Trends – Turnover and Employment
The 81 companies in the industrial biotechnology sector trend set achieved estimated growth rates of 8% in turnover and 6% in employment over 2009-2014. As shown in Figure 29 the growth in estimated turnover was strongest in the biofuels segment, however this segment also saw a decrease in estimated employment. From the analysis it appears that the growth in estimated employment in those segments other than biofuels has offset the reductions seen in biofuels.

45
Industrial Biotechnology Sector
Figure 29. Turnover and Employment growth rates 2009-2014 for the Industrial Biotechnology sector
% C
AG
R T
urn
ove
r an
d E
mp
loym
ent
(200
9-20
14)
CAGR Turnover CAGR Employment
-5%
0%
5%
10%
15%
20%
25%
Biofue
ls
Indu
stria
l Biot
echn
olgy m
inus
Servic
e & su
pply
Chain
Indu
stria
l Biot
echn
ology
Servic
e & su
pply
Chain
All seg
men
ts o
ther
than
Biof
uels
4.5. UK Profile
The industrial biotechnology sector has a different geography than for other sectors covered in this report. Although in this year’s analysis there has been a change in the relative distribution of employment the overall pattern shows a sector with less concentration in the Southeast of the UK. Figure 30 shows that the Southeast has the largest employment, a change from 2013 due to the inclusion for the first time of one large company. However, 53% of employment, 76% of companies and 54% of the turnover is located in areas outside of London, the East and Southeast of England.

46
Strength and Opportunity 2014The landscape of the medical technology, medical biotechnology, industrial biotechnology and pharmaceutical sectors in the UK
Figure 30. Distribution of employment, companies and turnover across the UK for the Industrial Biotechnology sector
Nu
mb
er o
f E
mp
loye
es
Nu
mb
er o
f C
om
pan
ies
or
Tu
rno
ver
0
200
400
600
800
1,000
1,200
1,400
South
Wes
t
North
ern
Irelan
d
Lond
on
East o
f Eng
land
North
Wes
t
Wes
t Midl
ands
East M
idlan
ds
North
Eas
t
Wale
s
Scotla
nd
York
shire
and
the
Humbe
r
South
Eas
t
0
50
100
150
200
250
300
350
400
Number of employees(LH scale)
Number of Companies(RH scale)
Turnover (£m)(RH scale)
217
19 17 11 12 6 6 4 6 2 1

47
Industrial Biotechnology Sector
4.6. Geographical Distribution of Industrial Biotechnology companies

48
Chapter 5
Pharmaceutical Sector5.1. Sector Definition
For the purpose of this report, the pharmaceutical companies included are those that have a global turnover greater than £640m, where their main activity is the research and development of therapeutic products, irrespective of the underlying technology involved. Pharmaceutical wholesaler companies are included, as well as large supply chain companies. The pharmaceutical and medical biotechnology service and supply chain segments are combined for detailed analysis – as set out in the section on Medical Biotechnology.
5.2. Sector Overview
●● The pharmaceutical sector consists of 545 companies – all of the top 20 global pharmaceutical companies have activity in the UK.
●● The sector generates an estimated turnover of £32.4bn and employs 70,000 people including 57,000 in companies discovering, developing and marketing medicines.
●● The small molecules segment contributes the 70% of the total estimated turnover for this sector and 87% of non-supply chain activity.
●● Companies that obtain the majority of their turnover from medicines based on small molecules employ the largest proportion of the workforce, and 78% of this group is employed by companies in the “global Top 20”.1
●● Over the period 2012-2014 the sector trend data shows -2.4% and 0.2% CAGR for estimated employment and turnover respectively. The majority of this reduction in employment was in the small molecule segment. In contrast, the service and supply chain segment shows an increase in estimated employment over this period.
●● The year-on-year trends show decreases in estimated employment up to 2013 with a positive trend returning in 2013-2014. Turnover showed a combination of increase and decreases over 2011-2014 resulting in an overall small positive increase.
●● As only those companies with over £640m global turnover are included, this sector has a higher proportion of large companies than the national average with 17% of companies employing 250 or more and 14 companies employing more than 1,000.
●● Across the UK 42 locations account for 80% of the total sector employment.
●● While all areas of the UK have activity in the sector, the four areas covering the Southeast, Northwest and East of England along with London account for 62-70% of all companies, employment and turnover in the sector.

49
Pharmaceutical Sector
●● 63% of sites with R&D activity are located in the Southeast of the UK, while the majority of manufacturing sites are located outside of this area.
5.3. Turnover and Employment
The pharmaceutical sector in the UK has an estimated turnover of £32bn generated by 545 companies. The largest estimated turnover is generated by companies in the small molecule segment and includes activity from the large global pharmaceutical companies including the top 20 (based on 2013 global sales3). Together, these companies account for 61% of the total pharmaceutical sector or 77% if the turnover from the supply chain and services segment is excluded. The top 20 companies in terms of estimated turnover in the UK including supply chain and services companies generate 64% of the total estimated sector turnover. This top 20 includes 16 pharmaceutical companies, along with major contract manufacturing and reagent/equipment distributors.
The pharmaceutical sector employs an estimated total of 70,000 people – 53,200 in companies involved in the discovery, development and marketing of medicines. Companies that obtain the majority of their estimated turnover from medicines based on small molecules employ the largest proportion of the workforce and of this group the global top 20 employ 82%. This concentration of the estimated employment in the sector is also reflected in the number of sites that employ the majority of the workforce; 91 locations or 15% of the total in the UK account for 80% of the total estimated sector employment.
As shown in Figure 31 in addition to the service and supply chain and small molecules segments, companies involved in therapeutic proteins and vaccines account for significant economic activity. It should be highlighted that where data are available, the activity of large pharmaceutical companies in individual segments is separated i.e. where data are available for turnover and employment for small molecules and therapeutic proteins this is included in the relevant segment. However, in most cases, large pharmaceutical companies are involved in multiple segments and it is not possible to easily assign turnover and employment to each segment – in this case these companies are coded under small molecules. This is an approximation and therefore could underestimate the amount of economic activity in biologic drugs, that now represent 20-22% of global prescription sales4.
3 Pharma 50 Insight, IMS Consulting, June 20144 World Preview 2014, Outlook to 2020, EvaluatePharma, June 2014

50
Strength and Opportunity 2014The landscape of the medical technology, medical biotechnology, industrial biotechnology and pharmaceutical sectors in the UK
Figure 31. Employment, number of companies and turnover for the Pharmaceutical sector by segment
Nu
mb
er o
f E
mp
loye
es
Nu
mb
er o
f C
om
pan
ies
or
Tu
rno
ver
0
5,000
10,000
15,000
20,000
25,000
30,000
35,000
40,000
45,000
50,000
Blood &Tissue Products
RegenerativeMedicine
AntibodiesVaccinesTherapeuticProteins
Service &Supply Chain
SmallMolecules
0
50
100
150
200
250
300
Number of employees(LH scale)
Number of Companies(RH scale)
Turnover (£bn)(RH scale)
270
244
18 64 2 1
Analysis of the supply chain and services segment has been discussed in Section 3.3 – the Medical Biotechnology sector. The assignment of service and supply chain companies between the pharmaceutical and medical biotechnology sectors has been carried out on the basis of the size of the company or where it is clear that the company’s major revenue is derived from large pharmaceutical companies. In practice, the service and supply chain segment serves both the pharmaceutical and the medical biotechnology sectors in the UK and overseas, so this should be treated as a broad estimate only. Contract manufacturing and research companies, clinical research organisations and suppliers of laboratory consumables and equipment, dominate the service and supply segment. The 491 companies in these three segments account for 89% and 80% of all estimated turnover and employment in the supply chain and services segment respectively.
Given that the pharmaceutical sector for the purpose of the database is defined as companies with a large global turnover, it is unsurprising that the distribution of companies by estimated turnover and employees has a high proportion with estimated turnovers greater than £5m and / or more than 250 employees. A more detailed analysis reveals there are 47 companies with estimated turnovers greater than £100m.
Figure 32 and 33 shows the distribution of companies by turnover and employment.

51
Pharmaceutical Sector
Figure 32. Distribution of Pharmaceutical companies by turnover
£50-99,0005%
£1-4.9m14%
£5m+40% £0.1-0.249m
8%
£0.25-0.499m9%
£0.5-0.999m8%
£0-49,00016%
Figure 33. Distribution of Pharmaceutical companies by employee numbers
£50-99,0009%
£1-4.9m10%
£5m+17%
£0.1-0.249m10%
£0.25-0.499m11%
£0.5-0.999m9%
£0-49,00034%
5.4. Trends – Turnover and Employment
The trend set for pharmaceutical companies reporting turnover and employment in the UK is based on data from 271 companies, with most of data coming from the larger companies in the sector.
Figure 34 shows the estimated CAGR for turnover and employment for this trend set of companies over 2011-2014 for employment and 2012-2014 for turnover. The overall estimated turnover in the sector shows some recovery following the reduction in estimated turnover between 2012 and 2013, resulting in a marginally positive net increase in estimated turnover of 0.2% for the period. This overall increase masks the negative growth service and supply segment that was compensated by a positive growth rate in non-top 20 pharmaceutical companies (date not shown for the latter). The estimated employment trends indicate that the decrease across the sector was driven in large part by re-structuring by the large

52
Strength and Opportunity 2014The landscape of the medical technology, medical biotechnology, industrial biotechnology and pharmaceutical sectors in the UK
pharmaceutical companies. In contrast, the services and supply chain segment data indicates that these companies have seen increases in estimated employment of 1.7%.
Figure 34. Percentage change in employment (2011 – 2014) and turnover (2012 – 2014) by major segments of the Pharmaceutical sector
% C
AG
R 2
011-
2014
CAGR Employment (2011-2014) CAGR Turnover (2012-2014)
-5%
-4%
-3%
-2%
-1%
0%
1%
2%
Service & supply ChainTop 20 Global Pharma companiesTotal Pharma
The data on the direction of change in estimated turnover and employment between years are shown in Figures 36 and 37. Over the year 2011 to 2012 it indicates that the sector saw a fall in estimated employment, followed by a decrease in estimated turnover the following year before recovering with increases in estimated turnover and employment over the year 2013 to 2014.
Figure 35. Movement in turnover between years over 2012-2014 for pharmaceutical segments
Trend in Employment between years
Segment 2012/2013 2013/2014
Total Pharma
Top 20 Global Pharma companies
Service and supply Chain

53
Pharmaceutical Sector
Figure 36. Movement in employment between years over 2011-2014 for pharmaceutical segments
Trend in Employment between years
Segment 2011/2012 2012/2013 2013/2(014
Total Pharma
Top 20 Global Pharma companies
Service and supply Chain
5.5. UK Profile
The pharmaceutical sector in the UK has significant concentrations of economic activity in the Southeast and the Northwest of the UK as shown in Figure 37. The Southeast, Northwest, East of England along with London account for 74-75% of all companies and employment in the sector, and 83% of all turnover.
Figure 37. Distribution of employment, companies and turnover across the UK for the Pharmaceutical sector
Nu
mb
er o
f E
mp
loye
es o
r T
urn
ove
r £m
Nu
mb
er o
f C
om
pan
ies
0
2,000
4,000
6,000
8,000
10,000
12,000
14,000
16,000
18,000
20,000
Wale
s
South
Wes
t
North
ern
Irelan
d
East M
idlan
ds
North
Eas
t
Yorks
hire
and
the
Humbe
r
Wes
t Midl
ands
Scotla
nd
North
Wes
t
Lond
on
East o
f Eng
land
South
Eas
t0
50
100
150
200
250
Number of employees(LH scale)
Number of Companies(RH scale)
Turnover (£m)(LH scale)
204
81 87
3823 17 21
1227
9 16 9

54
Strength and Opportunity 2014The landscape of the medical technology, medical biotechnology, industrial biotechnology and pharmaceutical sectors in the UK
The data on the type of activity at the individual sites of companies are shown in Figure 38 showing that while overall the South East of the UK has the majority of the R&D sites at 63% of the total, the majority of the manufacturing sites are located outside of the South East.
Figure 38. Distribution of manufacturing and R&D sites across the UK for the Pharmaceutical sector
0
5
10
15
20
25
30
35
40
45
50
Wale
s
South
Wes
t
North
ern
Irelan
d
Wes
t Midl
ands
North
Eas
t
York
shire
and
the
Humbe
r
East M
idlan
ds
Scotla
nd
North
Wes
t
Lond
on
East o
f Eng
land
South
Eas
t
Nu
mb
er o
f S
ites
Manufacturing R&D

55
Pharmaceutical Sector
5.6. Geographical Distribution of Pharmaceutical companies

56
Appendix I
Data Partner AcknowledgementsThe Department for Business, Innovation and Skills, UK Trade & Investment and the Biotechnology and Biological Sciences Research Council gratefully acknowledge the contribution of the following regional and national organisations in the compilation of the 2014 Bioscience and Health Technology Database.
Data Partners
One Nucleus
Medilink East Midlands
Bionow
Invest Northern Ireland
Scottish Enterprise
South East Health Technologies Alliance
MediWales
Welsh Assembly Government
Medilink West Midlands
Association of British Healthcare Industries (ABHI)
Association of the British Pharmaceutical Industry (ABPI)
British Healthcare Trade Association (BHTA)
BioIndustry Association (BIA)
Biosciences Knowledge Transfer Network (KTN)
Knowledge Transfer Network (KTN)
British In Vitro Diagnostics Association (BIVDA)
OBN
The content of the database has been derived from a variety of proprietary data sources which have been provided under license. The Department for Business, Innovation and Skills, the Biotechnology and Biological Sciences Research Council and UK Trade & Investment would like to acknowledge the assistance given by the owners of these data sources.
Business information was accessed under license by Dun & Bradstreet Limited and the FAME database from Bureau van Dijk Electronic Publishing.
The database construction, data integration, data analysis and commentary preparation was completed by a consortium led by Cels Business Services (CBSL) Ltd. The consortium included ClickSquared (database construction), Kepier Ltd and Lindum Ltd (data integration and analysis).

57
Appendix II
Database Construction – Methodology and SegmentationScope
The database covers the geographical area of England and the Devolved Administrations of Northern Ireland, Scotland and Wales. Only companies that are a legal entity, conducting economic activity and have employees in the UK are included. Companies that are wholly or partially owned by non-UK entities are included. In the case of companies that also carry out economic activity in sectors or segments that lie outside of the definitions of the sectors (medical technology, medical biotechnology, pharmaceutical and industrial biotechnology), only that activity that is estimated to be within scope is included.
Methodology used to construct and update database
An overview of the database construction methodology is shown in the figure below.
Database Population – Methodology Overview
For the 2014 Bioscience and Health Technologies Database, the identification of companies and segmentation information has been gathered from the data partners listed in Appendix I as well as independent searches carried out by CBSL. These individual data sets are cleansed, sorted and rationalised into a single list of

58
Strength and Opportunity 2014The landscape of the medical technology, medical biotechnology, industrial biotechnology and pharmaceutical sectors in the UK
companies. Once this clean list of companies had been produced, the information is assessed and moderated to ensure consistency across the merged data set.
In order to add financial, employment and ownership data to the clean list, each company is matched with the datasets held by Dun & Bradstreet (D&B) and Bureau van Djke’s FAME (FAME) databases. Once matched, information is drawn under license from these commercial sources and added to the database.
A series of validation checks are undertaken to quality assure the data set. Large movements from one year to the next are analysed to determine whether or not these are anomalies and where necessary, adjustments made. For large companies that have a wide range of activity and therefore can have a significant impact on the dataset, the individual company annual reports are reviewed to refine the allocation of economic data to sites and to source employment data.
When the database was first constructed over 7,000 individual records were gathered from the data partners, resulting in over 4,000 unique records for companies falling within the defined scope for inclusion (this scope was agreed following consultation with stakeholders). The original dataset was expanded over the years 2009-2014 by addition the pharmaceutical sector from 2010 as well as by newly identified companies across all sectors.
For each annual update, a process is begun in March each year to gather information from the data partners and from online data sources to identify changes to the existing set of company records and to find new companies that should be included in the database. This long list of annual additions and changes is reviewed by CBSL to create the final list of companies for which data is sourced from D&B and FAME.
Segmentation
Prior to collecting data on the companies in the four sectors, a comprehensive classification / segmentation methodology was designed in collaboration with data partners and industry experts. This agreed methodology enables the activities of any company to be categorised or segmented and to describe the primary and other activities that fall within the scope of the scheme. The segmentation scheme has three distinct elements:
Segmentation of Technology or Service
This is a four level classification scheme with each level providing greater detail or definition. The top level (Level 0) analyses the Technology or Service into the four primary sectors, namely medical technology, medical biotechnology, industrial biotechnology and pharmaceutical. Subsequent levels (Levels 1 and 2) provide further analysis for each sector. See the Segmentation Reference Chart that is included in Appendix III.
To date, the segmentation analysis for every company to Level 1 has been completed, with a significant number of companies analysed to Level 2.

59
Database Construction – Methodology and Segmentation
Segmentation of Business Activity
This classification identifies which elements of Business Activity a company primarily provides and includes: Research and Development (R&D, including Design, Manufacturing, Supply Chain and Services; and Sales/Distribution/Service/Repair.
Segmentation of Supply Chain companies
In this 2014 update a new segmentation scheme was introduced to enable a more detailed analysis of the life sciences service and supply chain (previously labelled as specialist suppliers or consultants). The new service and supply chain segments descriptions have been included in Appendix III.
Examples where a supply chain company supplies products and services to more than one sector are most common for the pharmaceutical and medical biotechnology sectors. In these cases a judgement is made on where they majority of the turnover is derived and the company classified under that sector. Recognising that this is an approximation the detailed analysis for the supply chain and services for these sectors is carried out on the combined data. The overlap between the medical technology and industrial biotechnology supply chain and services segments, and the other sectors is much lower so these have been analysed separately.
The introduction of the service and supply chain codes has resulted in the movement of companies previously classified as core product and service companies into the service and supply chain segment. For example in the wound care and management segment of the medical technology a number of companies previously identified as distributors of items such as bandages or first-aid kits have been moved into the service and supply chain segment. This is to distinguish them from companies designing and producing wound care products. Appendix IV provides a comparison of the data coded using 2014 segmentation and the data coded using 2013 codes.

60
Appendix III
Segmentation Reference Chart – Life science sectorsMedical Technology
Code Description
MTA Wound care and Management
MTB In vitro diagnostic technology
MTC Radiotherapy equipment
MTD Medical Imaging/Ultrasound/and Materials
MTE Anaesthetic and respiratory technology
MTF Orthopaedic Devices
MTG Cardiovascular and vascular devices
MTH Neurology
MTI Ophthalmic Devices/Equipment
MTJ Dental and maxillofacial technology
MTK Drug Delivery
MTL Infection Control
MTM Surgical Instruments (reusable)
MTN Single use technology nec
MTO Re-usable diagnostic or analytic equipment
MTP Implantable devices nec
MTQ Assistive Technology
MTR Mobility Access
MTS Hospital hardware including ambulatory
MTT ICT+ E-health
MTV Education and Training
MTX Supply Chain
Pharmaceutical
Code Description
PHA Antibodies
PHB Therapeutic Proteins
PHC Advanced Therapy Medicinal Products (ATMPs)
PHD Vaccines
PHE Small Molecules
PHF Blood and Tissue Products
PHX Supply Chain
Medical Biotechnology
Code Description
MBA Antibodies
MBB Therapeutic proteins
MBC Advanced Therapy Medicinal Products (ATMPs)
MBD Vaccines
MBE Small molecules
MBF Blood and tissue products
MBX Supply Chain
Industrial Biotechnology
Code Description
IBA Biofuels
IBB Environmental
IBC Food and drink
IBD Commodity chemicals
IBE Fine and speciality chemicals
IBF Pharmaceutical intermediaries
IBG Personal care/cosmetics
IBI Agro-industry
IBX Supply Chain

61
Segmentation Reference Chart – Life science sectors
Segmentation Reference Chart – Supply Chain
Supply Chain
Code Description
SC1 Clinical Research Organisation
SC2 Contract Manufacturing/Research Organisation
SC3 Contract Formulation Manufacturing
SC4 Assay developer
SC5 Analytical Services
SC6 Formulation/Drug delivery specialist
SC7 Reagent, Equipment and consumables supplier
SC8 Regulatory Expertise
SC9 Patent and Legal specialist
SC10 Logistics and Packaging
SC11 Information systems specialists
SC12 Tissue and Biomass
SC13 Market Analysis/Information Consultants/Communications/Specialist consultants
SC14 Contract design
SC15 Training
SC16 Recruitment
SC17 Investment Companies
SC18 Healthcare services

62
Appendix IV
Impact of methodology and update changes on datasetThis appendix contains details of the impacts of methodology changes implemented in the 2014 update. These details are provided to aid readers’ interpretation of this report in comparison with previous year’s reports.
Every year companies are discovered that fall within the scope of the life sciences sectors and that have existed for more the 12 months since the last update. These are classified as “new/old” companies and are typically uncovered by the core team involved in updating the database from public sources or from submissions from the data-partners – rather than newly formed companies. These companies are included in each annual update to ensure that a comprehensive picture is prepared of the UK life sciences industry for the given year. Figures IV a, b and c show the impact of these “new/old” companies in 2014 report on the total number of companies, turnover and employment for each sector compared with the 2013 data. In 2014, these additions added 5.4% and 6.0% to the total life sciences estimated turnover and employment respectively. This compares to 3.5% and 4.0% for estimated turnover and employment respectively between the 2012 and 2013 datasets.
Because of these additions, comparison of information from each annual update should be limited to the trends data set rather than the total numbers for the year.
Figure IVa. Number of companies added to the database in 2014 compared with total in 2013 (only companies that are over 12 months old are shown as additions)
0
500
1,000
1,500
2,000
2,500
3,000
3,500
4,000
IndustrialBiotechnology
PharmaceuticalsMedicalBiotechnology
Medicaltechnology
Nu
mb
er o
f C
om
pan
ies
Orginal 2013
194
3,264
114
1,01166
545 8112
Added 2014

63
Impact of methodology and update changes on dataset
Figure IVb. Impact on sector turnover of companies added to the database in 2014
0
5,000,000
10,000,000
15,000,000
20,000,000
25,000,000
30,000,000
35,000,000
IndustrialBiotechnology
MedicalBiotechnology
Medicaltechnology
Pharmaceuticals
Tu
rno
ver
£’00
0s
Orginal 2013
813,634
29,247,6411,288,192
17,629,588681,918
4,189,113 12,311605,599
Added 2014
0
10,000
20,000
30,000
40,000
50,000
60,000
70,000
80,000
90,000
IndustrialBiotechnology
MedicalBiotechnology
PharmaceuticalsMedicaltechnology
Tu
rno
ver
£’00
0s
Orginal 2013
6,572
76,723
2,893
70,310
1,074
26,941 591,787
Added 2014
In addition to impacts from new/old companies the dataset is affected by a number of other changes every year such as the creation of new companies, changes in the employment and turnover data of existing companies and improvements to the level of data available for individual companies.
Table IV summarises the total impact of these changes and improvements on the total industry employment turnover.
Figure IVc. Impact on sector employment of companies added to the database in 2014

64
Strength and Opportunity 2014The landscape of the medical technology, medical biotechnology, industrial biotechnology and pharmaceutical sectors in the UK
Table IV. Impact of changes to dataset implemented in 2014 on total industry employment and turnover compared 2013 totals
Change category Employment Turnover £m
Companies dissolved/liquidated -1,430 -412
Companies added over 12 months old and births 10,566 2,797
Adjustments to in-scope and data review (net) -7985 -
Total 1,151 2,385
The first change category arises from companies that on review are found to have been dissolved or been liquated. In cases where a company has been dissolved for example following a merger or acquisition; analysis of the merged company or acquirer is carried out to determine if the appropriate economic data is still reflected in the database.
The change category resulting from companies that have been found that were formed 12 months before the last update (new/old) has been discussed above, and in Table IV has been combined with births. The latter change has a minor impact on the dataset every year.
The change category comprising companies that have been identified as part of this year’s update but were formed at least 12 months previously (new/old) has a large impact on the dataset. This category has been discussed above, and in Table IV has been combined with births. The latter change has a minor impact on the dataset every year.
In 2013 it was estimated from companies in the database that the life sciences industry had a turnover of £51.7bn and employed 175,761 people. In 2014 these estimates are £56bn and 183,000 people respectively. The changes shown in Table IV account for some of these changes and remainder is made up of primarily growth in existing companies in the database plus minor adjustments.
Reviewing of all company records for each year also results in further cleansing of the dataset, identifying records that are no longer in scope of the life sciences industry as defined for this database. These not-in-scope (NIS) records are retained in the dataset but not included in the analysis for the update.
In previous years, the size of the specialist supplier or consultant segments across medical technology, pharmaceutical and medical biotechnology had grown to represent a significant proportion of the total estimated employment and turnover. Therefore, as mentioned above, it was considered important to understand these companies at a more granular level, resulting in the use of new supply chain and services segment codes.

65
Impact of methodology and update changes on dataset
Analyses of the impact of re-segmentation and the introduction of supply chain codes on the distribution of estimated turnover and employment for the four sectors are shown in Figures IV d-k below. In these graphs the 2014 data is compared with what the data would have looked like if companies retained their 2013 coding (companies added in 2014 will not be in this analysis).
Figure IVd. Comparison of the turnover distribution for the major segments in Medical Technology (only segments with >£450m shown) using 2013 versus 2014 segmentation coding
0
500
1,000
1,500
2,000
2,500
Radiot
hera
py e
quipm
ent
Denta
l and
max
illofa
cial t
echn
ology
Impla
ntab
le de
vices
n.e
.c.
Mob
ility A
cces
s
Cardio
vasc
ular a
nd va
scula
r dev
ices
ICT+
E-h
ealth
Infe
ction
Con
trol
Drug
Delive
ry
Hospit
al ha
rdw
are
includ
ing am
bulat
ory
Ophth
almic
Device
s/Equ
ipmen
t
Surgic
al In
stru
men
ts (r
eusa
ble) n
.e.c.
Assist
ive Te
chno
logy
Med
ical Im
aging
/Ultr
asou
nd E
quipm
ent a
nd M
ater
ials
Re-us
able
diagn
ostic
or a
nalyt
ic eq
uipm
ent n
.e.c.
Anaes
thet
ic an
d re
spira
tory
tech
nolog
y
Orthop
aedic
Dev
ices
Wou
nd C
are
and
Man
agem
ent
In vi
tro d
iagno
stic
tech
nolog
y
Servic
e & su
pply
Chain
Single
use
tech
nolog
y n.e
.c.
Nu
mb
er o
f S
ites
Turnover (£m) 2013 codes Turnover (£m) 2014 codes
Because some companies were removed as not in scope from the 2014 dataset some of the observed decreases per segment are due to this removal. Other changes are due to movement of companies into the service and supply segment. For example, in the case of the medical imaging/ultrasound segment a number of companies that were distributors of imaging agents where moved into the reagents, equipment and consumables sub-segment. This adjustment makes a clear distinction between companies that develop and/or produce their own products that are sold to healthcare providers and those that distribute.
The movement of a number of distributors of antibodies and other small chemical reagents into the service and supply chain segment explains the differences in distribution of estimated turnover and employment seen for the medical biotechnology sector in Figures IV f and g.

66
Strength and Opportunity 2014The landscape of the medical technology, medical biotechnology, industrial biotechnology and pharmaceutical sectors in the UK
The relatively small number of companies involved in the industrial biotechnology sector has resulted in minimal change to the 2014 data versus the 2013 data.
In the pharmaceutical sector analysis a number of companies that were previously classified under the small molecule segment have been transferred into the supply chain and services segment on the basis that they are distributors of third party drugs (wholesale distributors but not producers of generics). There has also been re-segmentation between the medical biotechnology and pharmaceutical supply chain and services segment, although the detailed analysis in this report combines this segment from these sectors.
Figure IVe. Comparison of the employment distribution for the major segments in Medical Technology (only segments with >1000 employees shown) using 2013 versus 2014 segmentation coding
0
2,000
4,000
6,000
8,000
10,000
12,000
14,000
Impla
ntab
le de
vices
n.e
.c.
Denta
l and
max
illofa
cial t
echn
ology
Cardio
vasc
ular a
nd va
scula
r dev
ices
Ophth
almic
Device
s/Equ
ipmen
t
Infe
ction
Con
trol
Mob
ility A
cces
s
Surgic
al In
stru
men
ts (r
eusa
ble) n
.e.c.
Drug
Delive
ry
Anaes
thet
ic an
d re
spira
tory
tech
nolog
y
Hospit
al ha
rdw
are
includ
ing am
bulat
ory
Med
ical Im
aging
/Ultr
asou
nd E
quipm
ent a
nd M
ater
ials
ICT+
E-h
ealth
Assist
ive Te
chno
logy
Re-us
able
diagn
ostic
or a
nalyt
ic eq
uipm
ent n
.e.c.
Orthop
aedic
Dev
ices
In vi
tro d
iagno
stic
tech
nolog
y
Wou
nd C
are
and
Man
agem
ent
Single
use
tech
nolog
y
Servic
e & su
pply
Chain
Nu
mb
er o
f E
mp
loye
es
Turnover (£m) 2013 codes Turnover (£m) 2014 codes

67
Impact of methodology and update changes on dataset
Figure IVf. Comparison of the turnover distribution for the segments in Medical Biotechnology using 2013 versus 2014 segmentation coding
0
500
1,000
1,500
2,000
2,500
3,000
Advan
ced
Ther
apy
Med
icina
l Pro
duct
s (AT
MPs)
Vacc
ines
Ther
apeu
tic P
rote
ins
Blood
& Tiss
ue P
rodu
cts
Antibo
dies
Small
Mole
cules
Servic
e & S
upply
Cha
in
Tu
rno
ver
£m
Turnover £m 2013 codes Turnover £m 2014 codes
Figure IVg. Comparison of the employment distribution for the segments in Medical Biotechnology using 2013 versus 2014 segmentation coding
0
3,000
6,000
9,000
12,000
15,000
18,000
Blood
& Tiss
ue P
rodu
cts
Vacc
ines
Advan
ced
Ther
apy M
edici
nal
Produ
cts (
ATM
Ps)
Ther
apeu
tic P
rote
ins
Antibo
dies
Small
Mole
cules
Servic
e & S
upply
Cha
in
Nu
mer
of
emp
loye
es
Number of Employees 2013 Number of Employees 2014 codes

68
Strength and Opportunity 2014The landscape of the medical technology, medical biotechnology, industrial biotechnology and pharmaceutical sectors in the UK
Figure IVh. Comparison of the turnover distribution for the segments in Industrial Biotechnology using 2013 versus 2014 segmentation coding
0
50
100
150
200
250
300
Pharm
aceu
tical
Inte
rmed
iaries
Enviro
nmen
tal
Food
/Drin
k
Fine
& Spe
ciality
Che
mica
ls
Perso
nal C
are/
Cosm
etics
Bio fu
els
Servic
e & S
upply
chain
Agro-
Indu
stry
Tru
no
ver
£m
Turnover £m 2013 codes Turnover £m 2014 codes
Figure IVi. Comparison of the employment distribution for the segments in Industrial Biotechnology using 2013 versus 2014 segmentation coding
0
100
200
300
400
500
600
700
800
900
Pharm
aceu
tical
Inte
rmed
iaries
Enviro
nmen
tal
Food
/Drin
k
Fine
& Spe
ciality
Che
mica
ls
Perso
nal C
are/
Cosm
etics
Bio fu
els
Servic
e & su
pply
Chain
Agro-
Indu
stry
Nu
mb
er o
f em
plo
yees
Turnover £m 2013 codes Turnover £m 2014 codes

69
Impact of methodology and update changes on dataset
Figure IVj. Comparison of the turnover distribution for the segments in the Pharmaceutical sector using 2013 versus 2014 segmentation coding
0
5,000
10,000
15,000
20,000
25,000
30,000
Advan
ced
Ther
apy M
edici
nal
Produ
cts (
ATM
Ps)
Blood
& Tiss
ue P
rodu
cts
Antibo
dies
Ther
apeu
tic P
rote
ins
Vacc
ines
Servic
e & S
upply
Cha
in
Small
Mole
cules
Tu
rno
ver
£m
Turnover £m 2013 codes Turnover £m 2014 codes
Figure IVk. Comparison of the employment distribution for the segments in the Pharmaceutical sector using 2013 versus 2014 segmentation coding
0
10,000
20,000
30,000
40,000
50,000
60,000
Blood
& Tiss
ue P
rodu
cts
Advan
ced
Ther
apy M
edici
nal
Produ
cts (
ATM
Ps)
Antibo
dies
Vacc
ines
Ther
apeu
tic P
rote
ins
Servic
e & su
pply
chain
Small
Mole
cules
Nu
mb
er o
f em
plo
yees
Number of Employees 2013 coding Number of Employees 2014 coding

Crown copyright 2015
You may re-use this information (not including logos) free of charge in any format or medium, under the terms of the Open Government License. To view this license, visit http://www.nationalarchives.gov.uk/doc/open-government-licence/ or write to the Information Policy Team, The National Archives, Kew, London TW9 4DU, or e-mail: [email protected]
This publication is also available on our website at http://www.bis.gov.uk
Any enquiries regarding this publication should be sent to:
Department for Business, Innovation and Skills 1 Victoria Street London SW1H 0ET Tel: 020 7215 5000
If you require this publication in an alternative format, email: [email protected], or call 020 7215 5000.
URN BIS/15/224
Cover photo is from the UKTI Life Sciences Marketing toolkit.
Contact BIS Email: [email protected] Phone: 020 7215 5000 Web: www.bis.gov.uk
Top Related