


Languages
Pages
Legal

1
Stereoscopic Rendering in a Head Mounted Display Elicits Higher Functional
Connectivity During Virtual Reality
Caroline Garcia Forlim1, Lukas Bittner1, Fariba Mostajeran2, Frank Steinicke2, Jürgen
Gallinat1, Simone Kühn1,3
1 University Medical Center Hamburg-Eppendorf (UKE),
Department of Psychiatry and Psychotherapy,
Martinistrasse 52, 20246 Hamburg, Germany
2 University Hamburg
Department of Human-Computer-Interaction
Vogt-Kölln-Str. 30, 22527 Hamburg, Germany
3 Max Planck Institute for Human Development,
Lise-Meitner Group for Environmental Neuroscience,
Lentzeallee 94, 14195 Berlin, Germany
Corresponding author: Simone Kühn
e-mail: [email protected]
Running title: Higher FC in VR Stereoscopic Rendering
All rights reserved. No reuse allowed without permission. (which was not peer-reviewed) is the author/funder, who has granted bioRxiv a license to display the preprint in perpetuity.
The copyright holder for this preprint. http://dx.doi.org/10.1101/675710doi: bioRxiv preprint first posted online Jun. 20, 2019;
2
Abstract
Virtual reality (VR) simulates real world scenarios by creating a presence in users. Such immersive
scenarios lead to more similar behaviour to that displayed in real world settings, which may
facilitate the transfer of knowledge and skills acquired in VR to real world situations. VR has
already been used in education, psychotherapy, rehabilitation and it is an appealing choice for
training intervention. The aim was to investigate to what extend VR technology can be used in a
magnetic resonance imaging scanner(MRI), addressing the question of whether brain connectivity
differs between VR and screen via mirror projection presentations. Moreover, we investigate
whether stereoscopic goggle stimulation, where eyes receive different input, would elicit more
brain connectivity than stimulation where both eyes receive the same input (monoscopic). To our
knowledge, there is no previous research addressing this question. Multiple analyses were
performed to cover different aspects of brain connectivity: fractional low frequency fluctuation,
independent component analysis, seed-based functional connectivity and graph analysis. In
goggles (mono and stereoscopic) vs. screen, we found connectivity differences in cerebellum and
postcentral gyrus and in visual and frontal inferior cortex in visual/default-mode networks.
Considering specific areas, we found higher connectivity between superior frontal cortex and
temporal lobe, as well as inferior parietal cortex with calcarine and lingual. Furthermore, superior
frontal cortex and insula/putamen were more strongly connected in stereoscopic, in line with our
hypothesis. We assume that conditions eliciting most connectivity should be suited for long-term
interventions as extended training under these conditions could permanently improve
functional/structural connectivity.
Keywords: virtual reality, stereoscopic and monoscopic googles, fMRI, seed-based functional
connectivity, fractional amplitude of low-frequency fluctuations, resting-state networks
All rights reserved. No reuse allowed without permission. (which was not peer-reviewed) is the author/funder, who has granted bioRxiv a license to display the preprint in perpetuity.
The copyright holder for this preprint. http://dx.doi.org/10.1101/675710doi: bioRxiv preprint first posted online Jun. 20, 2019;
3
1 Introduction
Virtual reality (VR) is used in various contexts such as entertainment, education, psychotherapy,
rehabilitation and other conditions. In these computer-generated environments the user can
perceive, feel and interact in a manner that is similar to a physical place, which is usually achieved
by a combination of multiple sensory channels, such as sight, sound and touch. An essential feature
of VR is that it creates a sense of presence in its users, which in turn leads to behaviour that is more
similar to the behaviour displayed in real world settings. Importantly this feeling of presence may
facilitate transfer of knowledge and skills acquired in VR to similar real world situations, which
would make VR an ideal choice for training intervention purposes. In preparation for such training
studies and to test to what extend VR technology can be used in a magnetic resonance imaging
scanner (MRI) we conducted the present study. We set out to investigate whether VR visual
stimulation using MRI compatible goggles with 3D stereoscopic stimulation (in which the image
is rendered separately for each eye creating the illusion of depth and 3D effect) differs in terms of
brain connectivity from more commonly applied presentation forms using goggles with 2D
monoscopic presentation (in which both eyes receive the same visual input) and a conventional
screen back-projection via a mirror. To our knowledge, there is no previous research using
functional MRI to address this question. The previous studies either used different stimulus
material to investigate different degrees of spatial presence (Baumgartner et al., 2008; Baumgartner
et al., 2006; Dores et al., 2013; Havranek et al., 2012; Lee et al., 2005) and/or used
electroencephalography (EEG) (Baumgartner et al., 2006; Dan and Reiner, 2017; Havranek et al.,
2012; Kober et al., 2012; Slobounov et al., 2015).
Most interesting for the present endeavour and the question whether VR elicits higher brain
connectivity, is an EEG study that compared brain signals during navigation either on a desktop
PC (2D) or on a large wall projection in 3D (Kober et al., 2012). The 3D condition was
accompanied by higher cortical parietal activation in the alpha band, whereas the 2D condition was
accompanied by stronger functional connectivity between frontal and parietal brain regions,
indicating enhanced communication. In two additional EEG studies, in which different modes of
presentation have been compared, but in which brain activity instead of connectivity was the focus
of investigation, contradictory evidence has been gathered. Likewise in a navigation task
comparing a condition in which participants wore 3D glasses and watched a screen vs. a 2D screen
condition, higher theta power in frontal midline structures was observed in the 3D VR condition
All rights reserved. No reuse allowed without permission. (which was not peer-reviewed) is the author/funder, who has granted bioRxiv a license to display the preprint in perpetuity.
The copyright holder for this preprint. http://dx.doi.org/10.1101/675710doi: bioRxiv preprint first posted online Jun. 20, 2019;
4
(Slobounov et al., 2015). In contrast a study investigating paper folding (origami) learning with 3D
glasses vs. with a 2D film showed that the 2D condition displays a higher so-called cognitive load
index computed as the ratio of the average power of frontal theta and parietal alpha. A last study
focussed on intra-hippocampal EEG recordings comparing real world navigation vs. VR navigation
and demonstrated that oscillations typically occurs at a lower frequency in virtual as compared to
real world navigation (Bohbot et al., 2017).
Brain regions that have repeatedly received attention in the endeavour to explain differences
between VR-related presence experiences in comparison to 2D or less immersive environments are
the prefrontal cortex, the parietal cortex as well as the hippocampus (Baumgartner et al., 2008;
Baumgartner et al., 2006; Beeli et al., 2008; Bohbot et al., 2017; Dan and Reiner, 2017; Kober et
al., 2012). For this reason, we used whole brain connectivity analysis approaches as well as ROI-
based approaches focussing on the effects of the type of the display (conventional 2D screen, MRI
goggles with monoscopic view effect, MRI googles with stereoscopic view effect) which capture
two different degrees of immersion.
2 Methods
2.1 Participants
The local psychological ethics committee of the University Medical Center Hamburg-Eppendorf,
Germany, approved of the study. Twenty-six healthy participants were recruited from a local
participant pool. After complete description of the study, the participants’ informed written consent
was obtained. Exclusion criteria for all participants were abnormalities in MRI, relevant general
medical disorders and neurological diseases. Additional exclusion criteria were movement above
the threshold of 0.5 (Power et al., 2012) during the scanning section and completion of all 3
conditions. After the exclusion criteria were applied, the number of subjects dropped to twenty
three (mean age = 26.5, SD = 4.8 years, female:male = 11:12).
2.2 Task Procedure
While situated in the scanner participants were exposed to a game (FlowVR) that was inspired by
the game Flower by Thatgamecompany (http://thatgamecompany.com/flower/) and programmed
in Unity (Bittner et al., submitted). The player flies through a nature scene with the goal of making
All rights reserved. No reuse allowed without permission. (which was not peer-reviewed) is the author/funder, who has granted bioRxiv a license to display the preprint in perpetuity.
The copyright holder for this preprint. http://dx.doi.org/10.1101/675710doi: bioRxiv preprint first posted online Jun. 20, 2019;
5
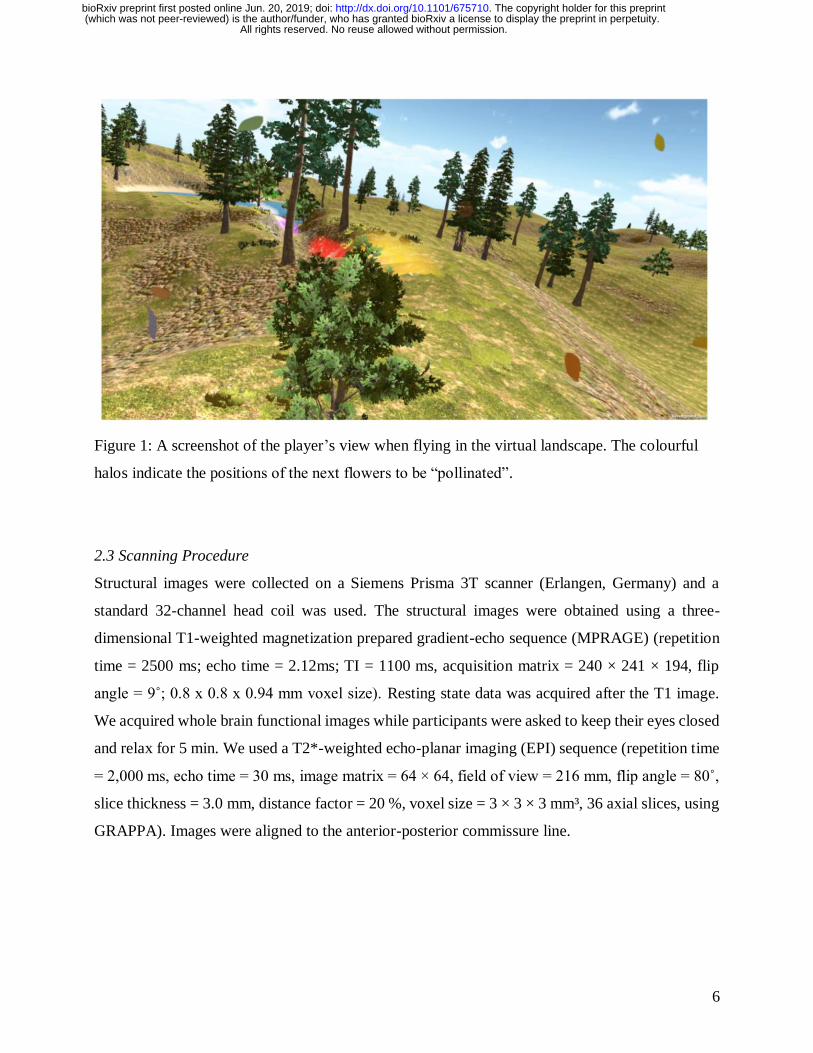
the landscape blossom (Fig. 1). This can be achieved by the player flying close to flowers, which
are surrounded by a coloured halo, to virtually pollinate them so that more flowers grow in the
surrounding area. Visual and auditory elements associated with positive affect have been
implemented. The task has been designed with the goal to reduce negative affect and initiate the
experience of flow (Csikszentmihalyi, 2014).
Before entering the scanner, the participants were given information about the gameplay. They
were asked to imagine to be a bee, whose goal is to make the landscape flourish by flying above it
and touching flowers or trees which are surrounded by a bright halo. That would lead to pollen
popping out of the flowers and new flowers, bushes or trees growing all around. They were told to
follow the path of the flowers and collect as many flowers as possible, however, they were likewise
instructed to not mind when missing out on a flower. Participants used an MR compatible button
box with four buttons in a row from Nordic Neuro Lab to navigate in the game. The user had to
hold the controller with both hands and use the two left buttons for flying upwards and downwards
and the other two for flying to the left and right. The speed of the flight was kept constant. Each
run lasted about 5 min.
Participants underwent three conditions, one in which the game was projected from a screen via
mirror projection, one in which MRI compatible goggles were used either with a 3D stereoscopic
stimulation (in which the image is rendered separately for each eye creating the illusion of depth
and 3D effect) and a 2D monoscopic presentation (in which both eyes received the same visual
input). MRI compatible googles used were the VisuaStim digital
(http://www.mrivideo.com/visuastimdigital.php), with a resolution of 800x600 (SVGA) and filed
of view (FoV) of 30 degrees horizontal and 24 degrees vertical. The order of the conditions was
randomly assigned to the participants.
All rights reserved. No reuse allowed without permission. (which was not peer-reviewed) is the author/funder, who has granted bioRxiv a license to display the preprint in perpetuity.
The copyright holder for this preprint. http://dx.doi.org/10.1101/675710doi: bioRxiv preprint first posted online Jun. 20, 2019;
6
Figure 1: A screenshot of the player’s view when flying in the virtual landscape. The colourful
halos indicate the positions of the next flowers to be “pollinated”.
2.3 Scanning Procedure
Structural images were collected on a Siemens Prisma 3T scanner (Erlangen, Germany) and a
standard 32-channel head coil was used. The structural images were obtained using a three-
dimensional T1-weighted magnetization prepared gradient-echo sequence (MPRAGE) (repetition
time = 2500 ms; echo time = 2.12ms; TI = 1100 ms, acquisition matrix = 240 × 241 × 194, flip
angle = 9˚; 0.8 x 0.8 x 0.94 mm voxel size). Resting state data was acquired after the T1 image.
We acquired whole brain functional images while participants were asked to keep their eyes closed
and relax for 5 min. We used a T2*-weighted echo-planar imaging (EPI) sequence (repetition time
= 2,000 ms, echo time = 30 ms, image matrix = 64 × 64, field of view = 216 mm, flip angle = 80˚,
slice thickness = 3.0 mm, distance factor = 20 %, voxel size = 3 × 3 × 3 mm³, 36 axial slices, using
GRAPPA). Images were aligned to the anterior-posterior commissure line.
All rights reserved. No reuse allowed without permission. (which was not peer-reviewed) is the author/funder, who has granted bioRxiv a license to display the preprint in perpetuity.
The copyright holder for this preprint. http://dx.doi.org/10.1101/675710doi: bioRxiv preprint first posted online Jun. 20, 2019;
7
2.4 Functional MRI Data Analysis
2.4.1 Preprocessing
To ensure for steady-state longitudinal magnetization, the first 10 images were discarded. Slice
timing and realignment were performed in the remaining images. The individual anatomical images
T1 were coregistered to functional images and segmented into white matter, gray matter, and
cerebrospinal fluid. Data was then spatially normalized to Montreal Neurological Institute (MNI)
space and spatially smoothed with an 8-mm FWHM to improve signal-to-noise ratio. Signal from
white matter, cerebrospinal fluid and movement were regressed. To reduce physiological high-
frequency respiratory and cardiac noise and low-frequency drift data was filtered (0.01 – 0.08 Hz)
and, finally, detrended. All steps of data preprocessing were done using SPM12 (Wellcome
Department of Cognitive Neurology) except filtering that was applied using REST toolbox (Song
et al., 2011). In addition, to control for motion, the voxel-specific mean framewise displacement
(FD) was calculated according to Power and colleagues (Power et al., 2012). We excluded from
the analyses participants who had an FD above the recommended threshold of 0.5.
2.4.2 Fractional Amplitude of Low-Frequency Fluctuation (fALFF)
To investigate voxel-wise changes in the amplitude of low frequency spontaneous fluctuations in
the blood-oxygen-level dependent imaging (BOLD) signal in the whole brain, we calculated the
fALFF using REST toolbox. Subject-specific fALFF maps were taken to the second level analysis
in SPM12.
2.4.3 Independent component analysis (ICA)
We examined the resting-state networks given by the spatial grouping of voxels with temporally
coherent activity calculated in a data-driven fashion using ICA. ICA was performed in GIFT
software (http://icatb.sourceforge.net/; 24) using Infomax algorithm. The number of spatially
independent resting-state networks (N) was estimated by the GIFT software (N=26). The
identification of the networks was done automatically using predefined GIFT templates and later
the resting-state networks of interested, the default mode network (DMN) and visual networks,
were chosen by two specialists (CGF and SK). For every resting-network of interest, subject-
specific spatial connectivity maps were taken to the second level analysis in SPM12.
All rights reserved. No reuse allowed without permission. (which was not peer-reviewed) is the author/funder, who has granted bioRxiv a license to display the preprint in perpetuity.
The copyright holder for this preprint. http://dx.doi.org/10.1101/675710doi: bioRxiv preprint first posted online Jun. 20, 2019;
8
2.4.4 Seed-based Functional Connectivity (SeedFC)
Functional connectivity (FC) is one of the most popular methods to infer connectivity in
neuroimaging. When FC is calculated by means of the temporal correlations (Pearson’s correlation)
between a region of interest to the other voxels in the whole brain, it is known as seed-based
functional connectivity (SeedFC). We investigated the seed-based connectivity maps, using as seed
the brain regions of interest in VR, namely, bilateral superior and middle frontal cortex, bilateral
hippocampus, bilateral superior and inferior parietal cortex defined in the anatomical automatic
labelling (AAL) atlas. Fischer transformation were applied to the individual FC maps obtaining Z
scores to improve normality. The Z score maps were taken to the second level in SPM 12.
2.4.5 Graph analysis
To examine differences in the topology of the brain networks we performed graph analysis
(Bullmore and Sporns, 2009). The first step was to construct the functional connectivity matrices,
where nodes and links should be defined. Nodes were brain regions created based on the AAL116
atlas (Tzourio-Mazoyer et al., 2002) and the links were the connectivity strength between nodes
calculated using Pearson’s correlation coefficient. The node-averaged time series used to infer the
connectivity strength were extracted for each subject using the REST toolbox (Song et al., 2011).
To avoid false positive links, connectivity values that were not statistically significant (p-value >
= 0.05) were excluded. Once the functional matrices are built, graph analysis can be applied in
order to characterize their topology. At this stage, thresholding was applied, namely density
threshold ranging from 0.1 to 0.9 in steps of 0.1. Thresholding means that only links with the
highest connectivity strengths are kept until the desired density is reached, e.g. a threshold of 0.1
means 10% of the links with the highest connectivity were kept and the remaining ones were set to
0. Graph analysis were then applied to these thresholded matrices using the Brain Connectivity
toolbox (brain-connectivity-toolbox.net). The main graph measures were chosen: betweenness
centrality that measures the fraction of all shortest paths that pass through an individual node;
characteristic path length which accounts for the average shortest path between all pairs of nodes;
efficiency which is the average inverse shortest paths and transitivity that measures the relative
number of triangles in the graph, compared to total number of connected triples of nodes. For a
complete description of the graph measures please refer to (Bullmore and Sporns, 2009; Rubinov
and Sporns, 2010).
All rights reserved. No reuse allowed without permission. (which was not peer-reviewed) is the author/funder, who has granted bioRxiv a license to display the preprint in perpetuity.
The copyright holder for this preprint. http://dx.doi.org/10.1101/675710doi: bioRxiv preprint first posted online Jun. 20, 2019;
9
2.4.6 Statistics
We were interested in two particular contrasts: (1) VR visual stimulation using MRI compatible
goggles with 3D stereoscopic stimulation and 2D monoscopic presentation vs screen via mirror
projection, to investigate for brain differences during googles and screen, (2) 3D stereoscopic
stimulation, in which the image is rendered separately for each eye creating the illusion of depth
and 3D effect vs 2D monoscopic presentation, most commonly applied presentation in which both
eyes receive the same visual input, so that we could investigate the effect of stereoscopic view in
the brain.
The resulting maps per subject of each analysis the second level analysis in SPM12 (Statistical
Parametric Mapping package; Wellcome Department for Imaging Neuroscience, London, United
Kingdom; http://www.fil.ion.ucl.ac.uk/spm) with mean FD as covariate. Using a family wise error
(FWE) threshold on the cluster level of p < 0.05 we ran the two contrasts in both the positive and
the negative direction.
3 Results
Since we were mostly interested in the direction of potential brain connectivity differences between
conditions, we employed multiple different analysis pipelines. We employed four methods that
focus in different aspects of the brain signal, the intrinsic frequency fluctuation and the connectivity
given by the spatial grouping of voxels with temporally coherent activity and by the temporal
correlations between areas, respectively, fALFF that measures the amplitude of the low frequency
fluctuation of the BOLD signal, ICA that uncover the resting-state brain networks, the seed-based
FC that calculate the brain network related to specific regions of interest and graph analysis that
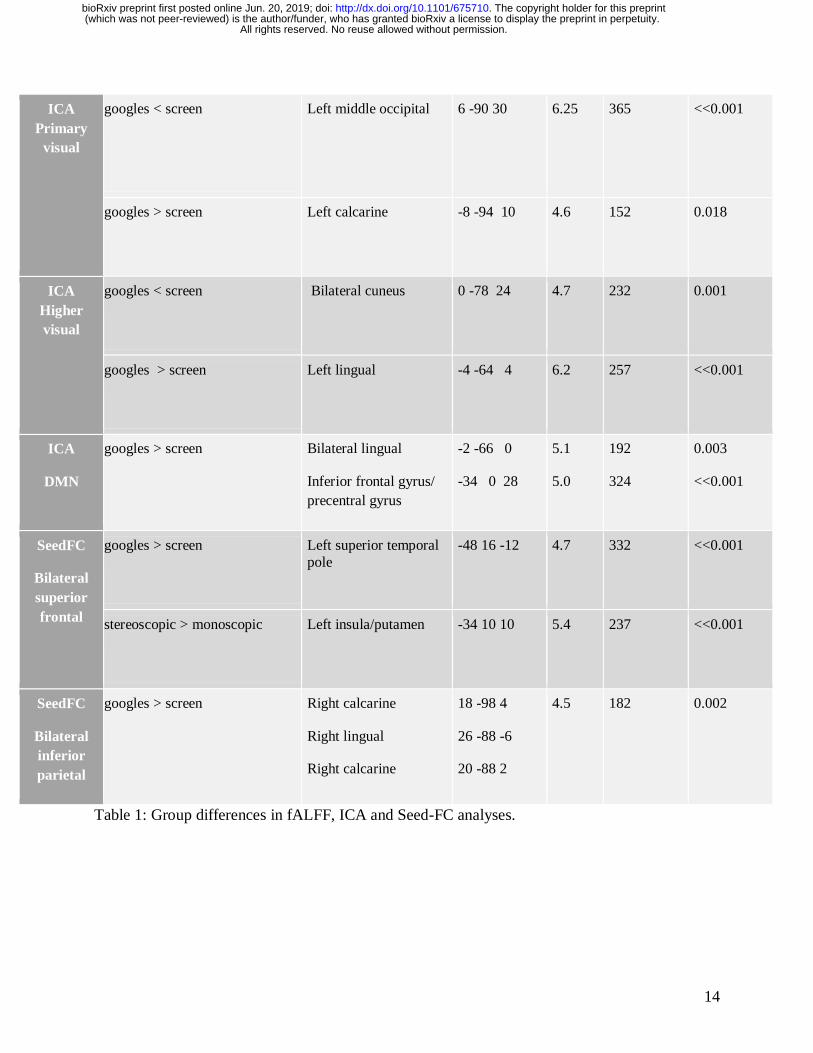
characterizes the topology of the brain networks. Results are summarized in Table 1.
3.1 fALFF
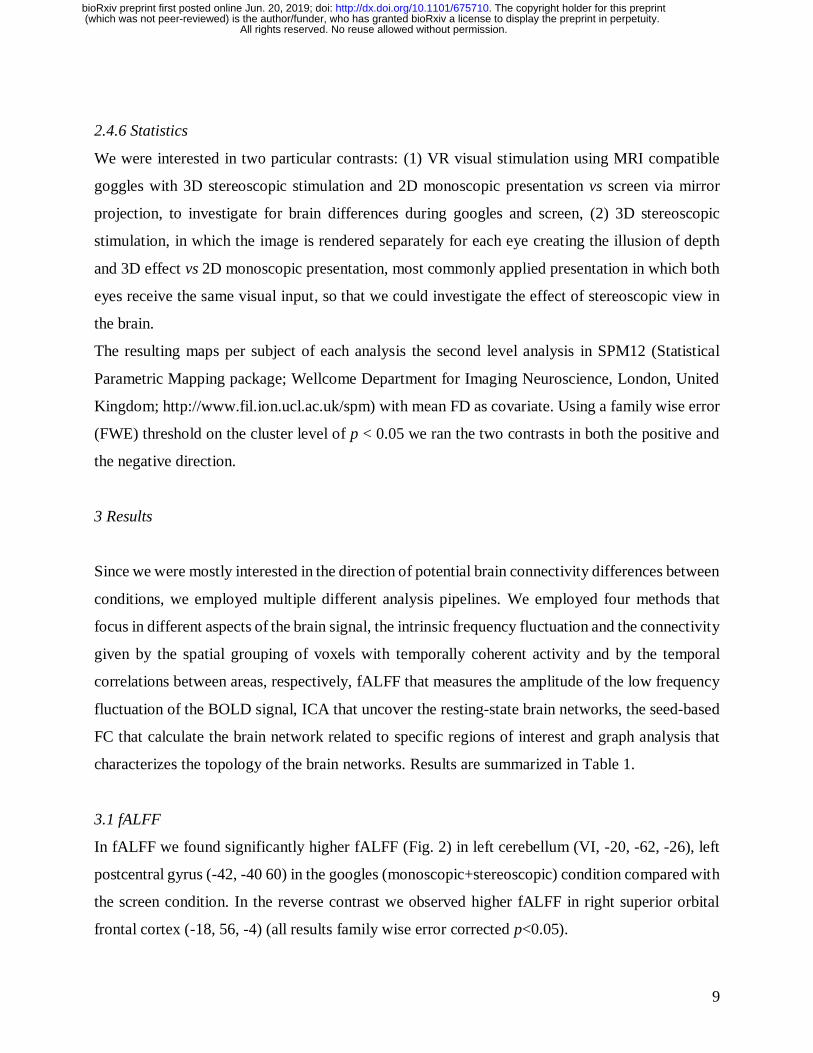
In fALFF we found significantly higher fALFF (Fig. 2) in left cerebellum (VI, -20, -62, -26), left
postcentral gyrus (-42, -40 60) in the googles (monoscopic+stereoscopic) condition compared with
the screen condition. In the reverse contrast we observed higher fALFF in right superior orbital
frontal cortex (-18, 56, -4) (all results family wise error corrected p<0.05).
All rights reserved. No reuse allowed without permission. (which was not peer-reviewed) is the author/funder, who has granted bioRxiv a license to display the preprint in perpetuity.
The copyright holder for this preprint. http://dx.doi.org/10.1101/675710doi: bioRxiv preprint first posted online Jun. 20, 2019;
10
Figure 2: Group differences in fALFF. Higher fALFF (in red) in left cerebellum and left
postcentral gyrus in the googles (monoscopic+stereoscopic) condition compared with the screen
condition. In the reverse contrast (in blue) there was higher fALFF in right superior orbital frontal
cortex.
3.2 ICA
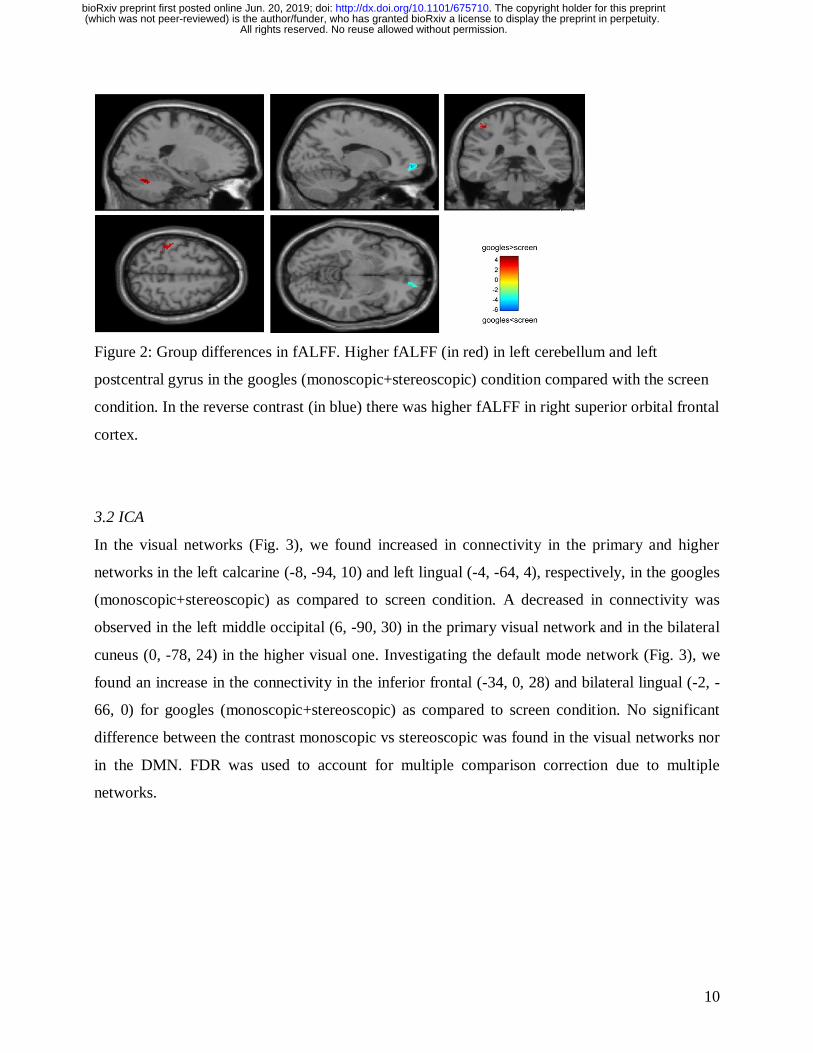
In the visual networks (Fig. 3), we found increased in connectivity in the primary and higher
networks in the left calcarine (-8, -94, 10) and left lingual (-4, -64, 4), respectively, in the googles
(monoscopic+stereoscopic) as compared to screen condition. A decreased in connectivity was
observed in the left middle occipital (6, -90, 30) in the primary visual network and in the bilateral
cuneus (0, -78, 24) in the higher visual one. Investigating the default mode network (Fig. 3), we
found an increase in the connectivity in the inferior frontal (-34, 0, 28) and bilateral lingual (-2, -
66, 0) for googles (monoscopic+stereoscopic) as compared to screen condition. No significant
difference between the contrast monoscopic vs stereoscopic was found in the visual networks nor
in the DMN. FDR was used to account for multiple comparison correction due to multiple
networks.
All rights reserved. No reuse allowed without permission. (which was not peer-reviewed) is the author/funder, who has granted bioRxiv a license to display the preprint in perpetuity.
The copyright holder for this preprint. http://dx.doi.org/10.1101/675710doi: bioRxiv preprint first posted online Jun. 20, 2019;
11
Figure 3: Group differences in the resting state networks: DMN and Visual. In the primary visual
network there was an increase in connectivity (in red) in the left calcarine and in the higher visual
network in the left lingual in the googles (monoscopic+stereoscopic) condition as compared to the
screen condition. A decreased in connectivity (in blue) was seen in the left middle occipital in the
primary visual network and in the bilateral cuneus in the higher visual network. In the DMN, we
found an increase (in yellow) in the connectivity in the inferior frontal and bilateral lingual for
googles (monoscopic+stereoscopic) as compared to screen condition.
3.3 SeedFC
In a ROI-based seed analysis we used the following ROIs: bilateral superior frontal cortex, middle
frontal cortex, hippocampus, superior parietal cortex, inferior parietal cortex. We found significant
All rights reserved. No reuse allowed without permission. (which was not peer-reviewed) is the author/funder, who has granted bioRxiv a license to display the preprint in perpetuity.
The copyright holder for this preprint. http://dx.doi.org/10.1101/675710doi: bioRxiv preprint first posted online Jun. 20, 2019;
12
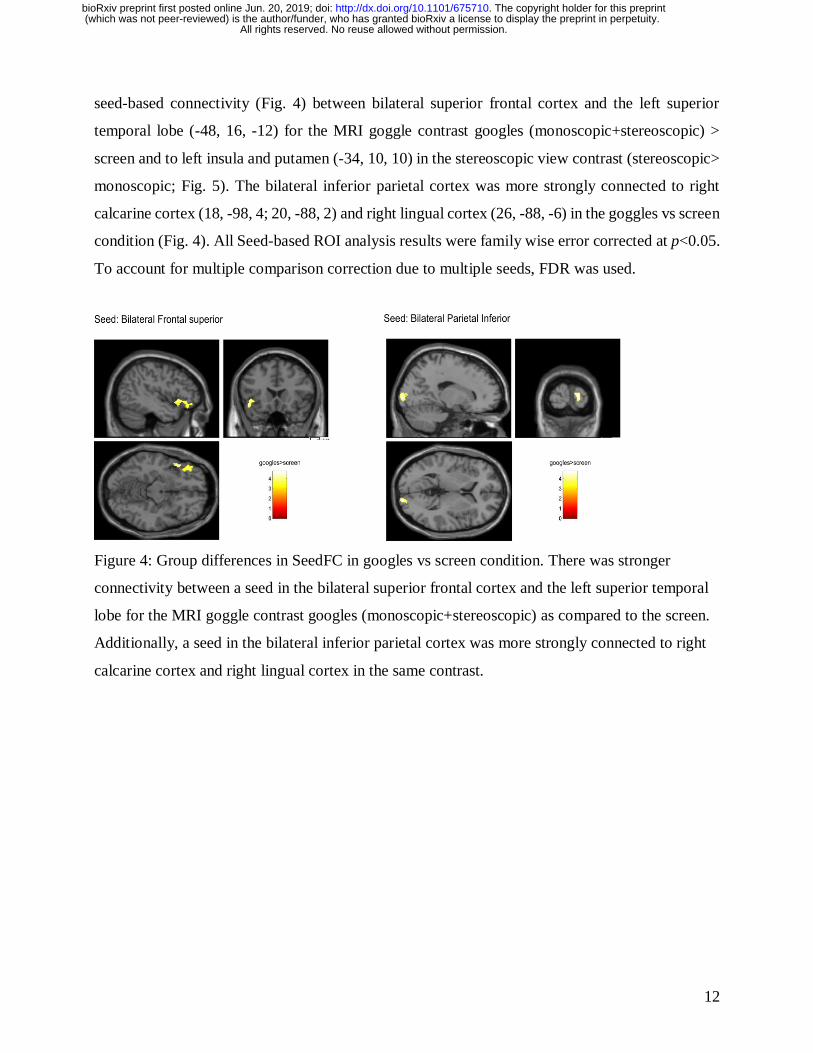
seed-based connectivity (Fig. 4) between bilateral superior frontal cortex and the left superior
temporal lobe (-48, 16, -12) for the MRI goggle contrast googles (monoscopic+stereoscopic) >
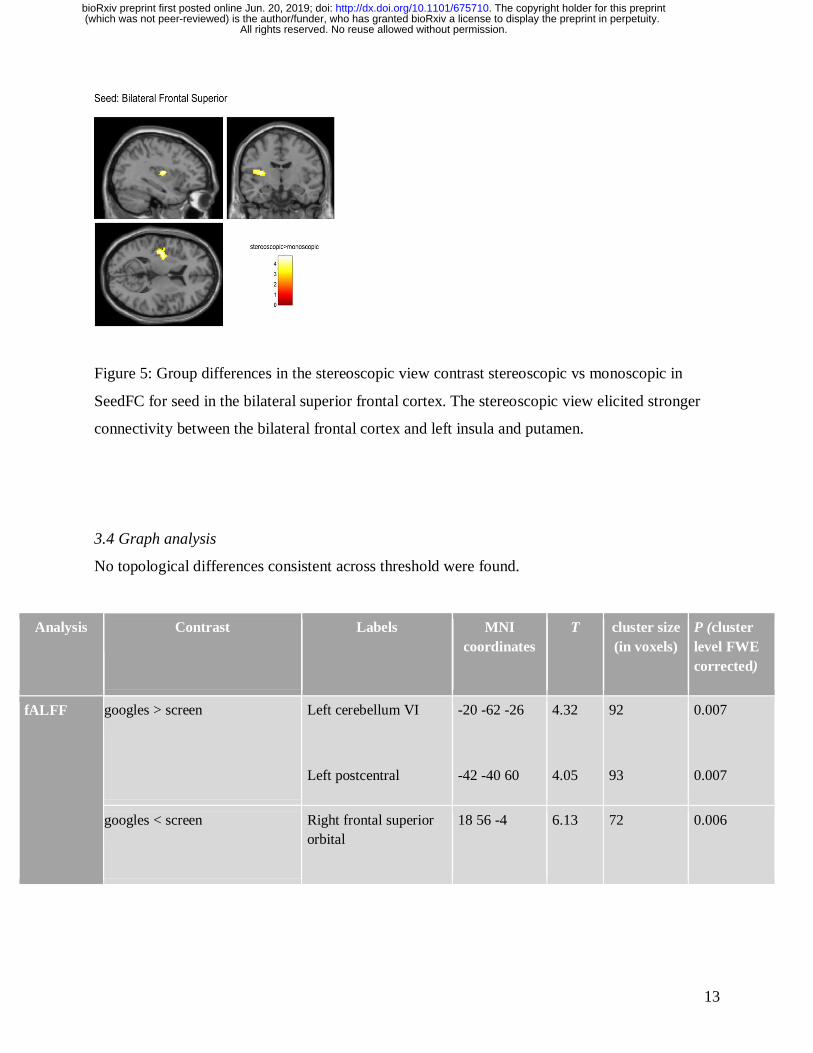
screen and to left insula and putamen (-34, 10, 10) in the stereoscopic view contrast (stereoscopic>
monoscopic; Fig. 5). The bilateral inferior parietal cortex was more strongly connected to right
calcarine cortex (18, -98, 4; 20, -88, 2) and right lingual cortex (26, -88, -6) in the goggles vs screen
condition (Fig. 4). All Seed-based ROI analysis results were family wise error corrected at p<0.05.
To account for multiple comparison correction due to multiple seeds, FDR was used.
Figure 4: Group differences in SeedFC in googles vs screen condition. There was stronger
connectivity between a seed in the bilateral superior frontal cortex and the left superior temporal
lobe for the MRI goggle contrast googles (monoscopic+stereoscopic) as compared to the screen.
Additionally, a seed in the bilateral inferior parietal cortex was more strongly connected to right
calcarine cortex and right lingual cortex in the same contrast.
All rights reserved. No reuse allowed without permission. (which was not peer-reviewed) is the author/funder, who has granted bioRxiv a license to display the preprint in perpetuity.
The copyright holder for this preprint. http://dx.doi.org/10.1101/675710doi: bioRxiv preprint first posted online Jun. 20, 2019;
13
Figure 5: Group differences in the stereoscopic view contrast stereoscopic vs monoscopic in
SeedFC for seed in the bilateral superior frontal cortex. The stereoscopic view elicited stronger
connectivity between the bilateral frontal cortex and left insula and putamen.
3.4 Graph analysis
No topological differences consistent across threshold were found.
Analysis Contrast Labels MNI
coordinates
T cluster size
(in voxels)
P (cluster
level FWE
corrected)
fALFF googles > screen Left cerebellum VI
Left postcentral
-20 -62 -26
-42 -40 60
4.32
4.05
92
93
0.007
0.007
googles < screen Right frontal superior
orbital
18 56 -4 6.13 72 0.006
All rights reserved. No reuse allowed without permission. (which was not peer-reviewed) is the author/funder, who has granted bioRxiv a license to display the preprint in perpetuity.
The copyright holder for this preprint. http://dx.doi.org/10.1101/675710doi: bioRxiv preprint first posted online Jun. 20, 2019;
14
ICA
Primary
visual
googles < screen Left middle occipital
6 -90 30
6.25 365 <<0.001
googles > screen Left calcarine -8 -94 10 4.6 152 0.018
ICA
Higher
visual
googles < screen Bilateral cuneus 0 -78 24 4.7 232 0.001
googles > screen Left lingual -4 -64 4 6.2 257 <<0.001
ICA
DMN
googles > screen Bilateral lingual
Inferior frontal gyrus/
precentral gyrus
-2 -66 0
-34 0 28
5.1
5.0
192
324
0.003
<<0.001
SeedFC
Bilateral
superior
frontal
googles > screen Left superior temporal
pole
-48 16 -12
4.7 332 <<0.001
stereoscopic > monoscopic Left insula/putamen -34 10 10 5.4 237 <<0.001
SeedFC
Bilateral
inferior
parietal
googles > screen Right calcarine
Right lingual
Right calcarine
18 -98 4
26 -88 -6
20 -88 2
4.5 182 0.002
Table 1: Group differences in fALFF, ICA and Seed-FC analyses.
All rights reserved. No reuse allowed without permission. (which was not peer-reviewed) is the author/funder, who has granted bioRxiv a license to display the preprint in perpetuity.
The copyright holder for this preprint. http://dx.doi.org/10.1101/675710doi: bioRxiv preprint first posted online Jun. 20, 2019;
15
4 Discussion
Within the scope of the present study we set out to unravel the effects of VR stimulation on
functional brain connectivity. In order to do so we used a virtual game in which the player had the
task to fly through a natural scene with the goal to make the landscape blossom, which was
designed with the goal to decrease negative affect and induce the experience of flow in its players.
To disentangle the effects of presenting the visual stimuli via MRI-compatible goggles, we
compared the goggle stereoscopic and monoscopic condition with the screen condition. We believe
that the goggles, which are mounted on the user’s head and have the ability to display stereoscopic
images, are more immersive than a back-projection of a Screen via a mirror system. As in the latter
the participant receives only 2D images and can still see the scanner bore and oftentimes even the
staff operating the scanner next to the presented stimuli. In order to investigate differences in
functional brain connectivity induced by the stereoscopic view, namely the fact that the image is
rendered separately for each eye creating the illusion of depth and 3D effect, we contrasted the
stereoscopic and monoscopic condition directly. With the goal to obtain a comprehensive picture
of brain connectivity we chose four common approaches to analyse resting state fMRI data, namely
the assessment of the amplitude of low frequency fluctuation (fALFF, (Zou et al., 2008)),
independent component analysis (Calhoun et al., 2001), seed-based functional connectivity
analysis and graph analysis (Bullmore and Sporns, 2009).
In line with our hypothesis, the goggles and the stereoscopic contrast revealed stronger brain
connectivity for the respective condition with more immersion, that is googles (stereoscopic and
monoscopic) compared to screen and stereoscopic compared to monoscopic generally elicited
higher brain connectivity. We found higher fALFF in left cerebellum and postcentral gyrus for
goggles compared to the screen. In the visual networks, we found an increase in connectivity in the
left calcarine and left lingual for the same contrast and in the DMN there was increased connectivity
in the inferior frontal cortex and bilateral lingual gyrus. Additionally, in the seed-based analysis
we found higher connectivity between bilateral superior frontal cortex and the temporal lobe, as
well as bilateral inferior parietal cortex with right calcarine and right lingual cortex for the two
goggle vs screen conditions. Furthermore, we found superior frontal cortex and insula/putamen to
be more strongly connected in stereoscopic vs monoscopic view. Only from prefrontal cortex we
found higher brain activity, that is higher fALFF values in right superior orbital frontal cortex.
All rights reserved. No reuse allowed without permission. (which was not peer-reviewed) is the author/funder, who has granted bioRxiv a license to display the preprint in perpetuity.
The copyright holder for this preprint. http://dx.doi.org/10.1101/675710doi: bioRxiv preprint first posted online Jun. 20, 2019;
16
These results can be viewed as in line with the hypothesis proposed by Jäncke and colleagues
(Jäncke et al., 2009) stating that prefrontal cortex is involved in the experience of presence. In
particular bilateral dorsolateral prefrontal cortex (DLPFC) activity was shown to be negatively
correlated with the subjective report of the experience of presence (Baumgartner et al., 2008) in
adults. Moreover, the authors report the results of an effective connectivity analysis from which
they conclude that the right DLPFC is involved in down-regulating the activation in the dorsal
visual processing stream. Furthermore the authors interpret the observed increase of activity in the
dorsal visual stream during presence experience as a sign of higher action preparation in the virtual
reality because the brain responds to it similarly as in real-life situations (Jäncke et al., 2009).
However, on the same dataset the left DLPFC was shown to be positively connected to brain
regions that are part of the default-mode network (such as medial prefrontal cortex, anterior
cingulate cortex, thalamus, brain stem, nucleus caudatus and parahippocampus). Due to the
involvement of the latter brain regions in self-referential processing the interpretation is that higher
left DLPFC activation when participants experience less presence leads to an up-regulation of self-
referential processing which reflects the detachment from the VR experience.
In contrast to this previous study, in which the focus was on the subjective feeling of presence, we
set out to investigate differences in brain connectivity between objectively different conditions of
stimulation. A major disadvantage of the previous design was that the stimulation used to elicit
different degrees of presence was not the same and participants were only passively watching the
displays. For this reason, we confronted participants with the same interactive VR game in all three
conditions with the difference being the hardware presentation procedures used to display the
respective environment.
Our results can be viewed as being in line with the findings and interpretations shown in association
to perceived experience of presence (Baumgartner et al., 2008; Jäncke et al., 2009), since we also
find more fALFF in right superior orbital frontal cortex in the 2D screen condition compared to the
two goggle conditions. Next to these previous fMRI results our results can also be perceived as in
line with results from an EEG study in which the same spatial navigation task in a virtual maze
was compared between a projection onto a large wall which was supposedly more immersive than
a display on a small Desktop PC screen (Kober et al., 2012). The authors report stronger functional
connectivity between frontal and parietal brain regions in the Desktop display condition.
However, the rational for the present study was slightly different from the studies presented before.
We set out to test whether overall the stereoscopic VR presentation elicits higher degrees of
All rights reserved. No reuse allowed without permission. (which was not peer-reviewed) is the author/funder, who has granted bioRxiv a license to display the preprint in perpetuity.
The copyright holder for this preprint. http://dx.doi.org/10.1101/675710doi: bioRxiv preprint first posted online Jun. 20, 2019;
17
functional brain connectivity than monoscopic and a screen display. Our hypothesis was that the
condition that elicits the most brain connectivity should be most suited for long-term brain training
interventions, assuming that extended training under these conditions could permanently improve
brain connectivity on a functional as well as a structural level. Our results show that the majority
of contrasts and functional connectivity indicators resulting from different analysis pipelines reveal
higher brain connectivity between brain regions in the goggle condition and the stereoscopic
condition in particular, which we interpret as a hint that training in VR environments in contrast to
environments displayed on a screen may be superior in eliciting and therewith facilitating brain
connectivity in intervention studies.
At present, a major drawback of the implementation of VR in an MRI environment is the fact that
the VR experience is limited to the stereoscopic input to the eyes without the experience of
movement in space. Usually the stereoscopic view in VR is accompanied by the fact that
individuals can freely turn their head and move in space while the visual input is adapted to the
individual’s movements. However, since the head cannot be freely moved in the MRI scanner, due
to its resulting movement artefacts in the images, the actual differences in brain connectivity
between a VR and a screen presentation of an environment might be underestimated. Future
research may attempt to use motion tracking systems to enable this movement related visual
feedback, while at the same time correct for the occurring motion artefacts in the acquired MRI
images (Stucht et al., 2015). The limited field of view and resolution of the MRI compatible goggles
introduces yet another limitation to such studies. As it can affect the level of immersion for both
monoscopic and stereoscopic conditions. Specifically, to the design of the present study, the
question still remains of whether and how frequently the participants noticed the 3D effect when,
for example, the bee was not flying close enough to the virtual objects.
5 Conflict of interest
The authors have no conflict of interest.
6 Acknowledgement
The study has been funded by a grant of the German Science Foundation (SFB 936/C7).
All rights reserved. No reuse allowed without permission. (which was not peer-reviewed) is the author/funder, who has granted bioRxiv a license to display the preprint in perpetuity.
The copyright holder for this preprint. http://dx.doi.org/10.1101/675710doi: bioRxiv preprint first posted online Jun. 20, 2019;
18
SK has been additionally the German Science Foundation (DFG KU 3322/1-1), the European
Union (ERC-2016-StG-Self-Control-677804) and a Fellowship from the Jacobs Foundation (JRF
2016-2018).
We thank Karolin Ney for helping in the data acquisition.
7 References
Baumgartner, T., Speck, D., Wettstein, D., Masnari, O., Beeli, G., Jancke, L., (2008). Feeling
present in arousing virtual reality worlds: prefrontal brain regions differentially orchestrate
presence experience in adults and children. Front Hum Neurosci 2, 8.
Baumgartner, T., Valko, L., Esslen, M., Jancke, L., (2006). Neural correlate of spatial presence in
an arousing and noninteractive virtual reality: an EEG and psychophysiology study.
Cyberpsychol Behav 9, 30-45.
Beeli, G., Casutt, G., Baumgartner, T., Jancke, L., (2008). Modulating presence and
impulsiveness by external stimulation of the brain. Behav Brain Funct 4, 33.
Bohbot, V.D., Copara, M.S., Gotman, J., Ekstrom, A.D., (2017). Low-frequency theta
oscillations in the human hippocampus during real-world and virtual navigation. Nat Commun 8,
14415.
Bullmore, E., Sporns, O., (2009). Complex brain networks: graph theoretical analysis of
structural and functional systems. Nat Rev Neurosci 10, 186-198.
All rights reserved. No reuse allowed without permission. (which was not peer-reviewed) is the author/funder, who has granted bioRxiv a license to display the preprint in perpetuity.
The copyright holder for this preprint. http://dx.doi.org/10.1101/675710doi: bioRxiv preprint first posted online Jun. 20, 2019;
19
Calhoun, V.D., Adali, T., Pearlson, G.D., Pekar, J.J., 2001. A method for making group
inferences from functional MRI data using independent component analysis. Hum Brain Mapp
14, 140-151.
Csikszentmihalyi, M., (2014). Flow and the foundations of positive psychology. Springer.
Dan, A., Reiner, M., (2017). EEG-based cognitive load of processing events in 3D virtual worlds
is lower than processing events in 2D displays. Int J Psychophysiol 122, 75-84.
Dores, A.R., Almeida, I., Barbosa, F., Castelo-Branco, M., Monteiro, L., Reis, M., de Sousa, L.,
Caldas, A.C., (2013). Effects of emotional valence and three-dimensionality of visual stimuli on
brain activation: an fMRI study. NeuroRehabilitation 33, 505-512.
Havranek, M., Langer, N., Cheetham, M., Jancke, L., (2012). Perspective and agency during
video gaming influences spatial presence experience and brain activation patterns. Behav Brain
Funct 8, 34.
Jäncke, L., Cheetham, M., Baumgartner, T., (2009). Virtual reality and the role of the prefrontal
cortex in adults and children. Front Neurosci 3, 52-59.
Kober, S.E., Kurzmann, J., Neuper, C., (2012). Cortical correlate of spatial presence in 2D and
3D interactive virtual reality: an EEG study. Int J Psychophysiol 83, 365-374.
All rights reserved. No reuse allowed without permission. (which was not peer-reviewed) is the author/funder, who has granted bioRxiv a license to display the preprint in perpetuity.
The copyright holder for this preprint. http://dx.doi.org/10.1101/675710doi: bioRxiv preprint first posted online Jun. 20, 2019;
20
Lee, J.H., Lim, Y., Wiederhold, B.K., Graham, S.J., 2005. A functional magnetic resonance
imaging (FMRI) study of cue-induced smoking craving in virtual environments. Appl
Psychophysiol Biofeedback 30, 195-204.
Power, J.D., Barnes, K.A., Snyder, A.Z., Schlaggar, B.L., Petersen, S.E., (2012). Spurious but
systematic correlations in functional connectivity MRI networks arise from subject motion.
Neuroimage 59, 2142-2154.
Rubinov, M., Sporns, O., (2010). Complex network measures of brain connectivity: uses and
interpretations. Neuroimage 52, 1059-1069.
Slobounov, S.M., Ray, W., Johnson, B., Slobounov, E., Newell, K.M., (2015). Modulation of
cortical activity in 2D versus 3D virtual reality environments: an EEG study. Int J Psychophysiol
95, 254-260.
Song, X.W., Dong, Z.Y., Long, X.Y., Li, S.F., Zuo, X.N., Zhu, C.Z., He, Y., Yan, C.G., Zang,
Y.F., (2011). REST: a toolkit for resting-state functional magnetic resonance imaging data
processing. PLoS One 6, e25031.
Stucht, D., Danishad, K.A., Schulze, P., Godenschweger, F., Zaitsev, M., Speck, O., (2015).
Highest Resolution In Vivo Human Brain MRI Using Prospective Motion Correction. PLoS One
10, e0133921.
All rights reserved. No reuse allowed without permission. (which was not peer-reviewed) is the author/funder, who has granted bioRxiv a license to display the preprint in perpetuity.
The copyright holder for this preprint. http://dx.doi.org/10.1101/675710doi: bioRxiv preprint first posted online Jun. 20, 2019;
21
Tzourio-Mazoyer, N., Landeau, B., Papathanassiou, D., Crivello, F., Etard, O., Delcroix, N.,
Mazoyer, B., Joliot, M., (2002). Automated anatomical labeling of activations in SPM using a
macroscopic anatomical parcellation of the MNI MRI single-subject brain. Neuroimage 15, 273-
289.
Zou, Q.H., Zhu, C.Z., Yang, Y., Zuo, X.N., Long, X.Y., Cao, Q.J., Wang, Y.F., Zang, Y.F.,
(2008). An improved approach to detection of amplitude of low-frequency fluctuation (ALFF) for
resting-state fMRI: fractional ALFF. J Neurosci Methods 172, 137-141.
All rights reserved. No reuse allowed without permission. (which was not peer-reviewed) is the author/funder, who has granted bioRxiv a license to display the preprint in perpetuity.
The copyright holder for this preprint. http://dx.doi.org/10.1101/675710doi: bioRxiv preprint first posted online Jun. 20, 2019;
Top Related