


Languages
Pages
Legal

. . . . . . . . . . . . . . . . . . . . . . . . . . . . . . . . . . . . . . . . . . . . . . . . . . . . . . . . . . . . . . . . . . . . . . . . . . . . . . . . . . . . . . . . . . . . . . . . . . . . . . . . . . . . . . . . . . . . . . . . . . . . . . . . . . . . . . . . . . . . . . . . . . . . . . . . . . . . . . . . . . . . . . . . . . . . . . . . . . . . .
. . . . . . . . . . . . . . . . . . . . . . . . . . . . . . . . . . . . . . . . . . . . . . . . . . . . . . . . . . . . . . . . . . . . . . . . . . . . . . . . . . . . . . . . . . . . . . . . . . . . . . . . . . . . . . . . . . . . . . . . . . . . . . . . . . . . . . . . . . . . . . . . . . . . . . . . . . . . . . . . . . . . . . . . . . . . . . . . . . . . .
. . . . . . . . . . . . . . . . . . . . . . . . . . . . . . . . . . . . . . . . . . . . . . . . . . . . . . . . . . . . . . . . . . . . . . . . . . . . . . . . . . . . . . . . . . . . . . . . . . . . . . . . . . . . . . . . . . . . . . . . . . . . . . . . . . . . . . . . . . . . . . . . . . . . . . . . . . . . . . . . . . . . . . . . . . . . . . . . . . . . .
ORIGINAL ARTICLE
Statistics on the use of cardiac electronic devicesand electrophysiological procedures in theEuropean Society of Cardiology countries: 2014report from the European Heart RhythmAssociationM.J. Pekka Raatikainen1*, David O. Arnar2, Katja Zeppenfeld3, Jose Luis Merino4,Francisco Levya5, Gerhardt Hindriks6, and Karl-Heinz Kuck7
1Department of Medicine Division of Cardiology, Central Finland Health Care District, Jyvaskyla and University of Eastern Finland, Building 1 D/9, FI-40620 Jyvaskyla, Finland; 2The HeartCentre, Department of Medicine, Landspitali – The National University Hospital, Reykjavik, Iceland; 3Department of Cardiology, Leiden University Medical Centre, Leiden, Netherlands;4Unidad Electrofisiologia Cardiaca Robotizada-Hospital Universitario La Paz, Madrid, Spain; 5Centre for Cardiovascular Sciences, Queen Elizabeth Hospital, University of Birmingham,Birmingham, UK; 6Department of Electrophysiology, Heart Centre, University of Leipzig, Leipzig, Germany; and 7Deparment of Cardiology, Ak St. Georg, Hamburg, Germany
Received 30 September 2014; accepted after revision 2 October 2014
Aims There has been large variations in the use of invasive electrophysiological therapies in the member countries of the Euro-pean Society of Cardiology (ESC). The aim of this analysis was to provide comprehensive information on cardiac implan-table electronic device (CIED) and catheter ablation therapy trends in the ESC countries over the last five years.
Methods The European Heart Rhythm Association (EHRA) has collected data on CIED and catheter ablation therapy since 2008.Last year 49 of the 56 ESC member countries provided data for the EHRA White Book. This analysis is based onthe current and previous editions of the EHRA White Book. Data on procedure rates together with information oneconomic aspects, local reimbursement systems and training activities are presented for each ESC country and thefive geographical ESC regions.
Results In 2013, the electrophysiological procedure rates per million population were highest in Western Europe followed bythe Southern and Northern European countries. The CIED implantation and catheter ablation rate was lowest in theEastern European and in the non-European ESC countries, respectively. However, in some Eastern European countrieswith relative low gross domestic product procedure rates exceeded those of some wealthier Western countries,suggesting that economic resources are not the only driver for utilization of arrhythmia therapies.
Conclusion These statistics indicate that despite significant improvements, there still is considerable heterogeneity in the availabilityof arrhythmia therapies across the ESC area. Hopefully, these data will help identify areas for improvement and guidefuture activities in cardiac arrhythmia management.
- - - - - - - - - - - - - - - - - - - - - - - - - - - - - - - - - - - - - - - - - - - - - - - - - - - - - - - - - - - - - - - - - - - - - - - - - - - - - - - - - - - - - - - - - - - - - - - - - - - - - - - - - - - - - - - - - - - - - - - - - - - - - - - - - - - - - - - - - - - - - - - - - - - - - - - - - - -Keywords Pacemaker † Implantable cardioverter defibrillator (ICD) † Cardiac resynchronization pacemaker (CRT-P) †
Cardiac resynchronization therapy defibrillator (CRT-D) † Catheter ablation † Atrial fibrillation ablation
IntroductionThis is the third year that the EHRA White Book data on the status ofcardiac implantable electronic device (CIED) therapy and catheterablation are published as a full EP Europace supplement. As in past edi-tions, the objective is to provide comprehensive information on the
trends in the use of invasive treatment for cardiac rhythm disordersin the member countriesof the European Societyof Cardiology (ESC).
In addition to statistics on the various invasive electrophysiologicalprocedures, we have provided information on the social, financial,and economic aspects in the constituent ESC countries. We hopethat, together with information on local reimbursement systems, these
* Corresponding author. Tel: +358 14 2691811; Fax: +358 14 2692719, E-mail address: [email protected]
Published on behalf of the European Society of Cardiology. All rights reserved. & The Author 2015. For permissions please email: [email protected].
Europace (2015) 17, i1–i75doi:10.1093/europace/euu300
by guest on January 28, 2015D
ownloaded from
data will contribute to the understanding of the economic aspects ofelectrophysiological procedures in countries affiliated to the EuropeanHeart Rhythm Association (EHRA). We also report on electrophysi-ology (EP) training requirements and new training initiatives.
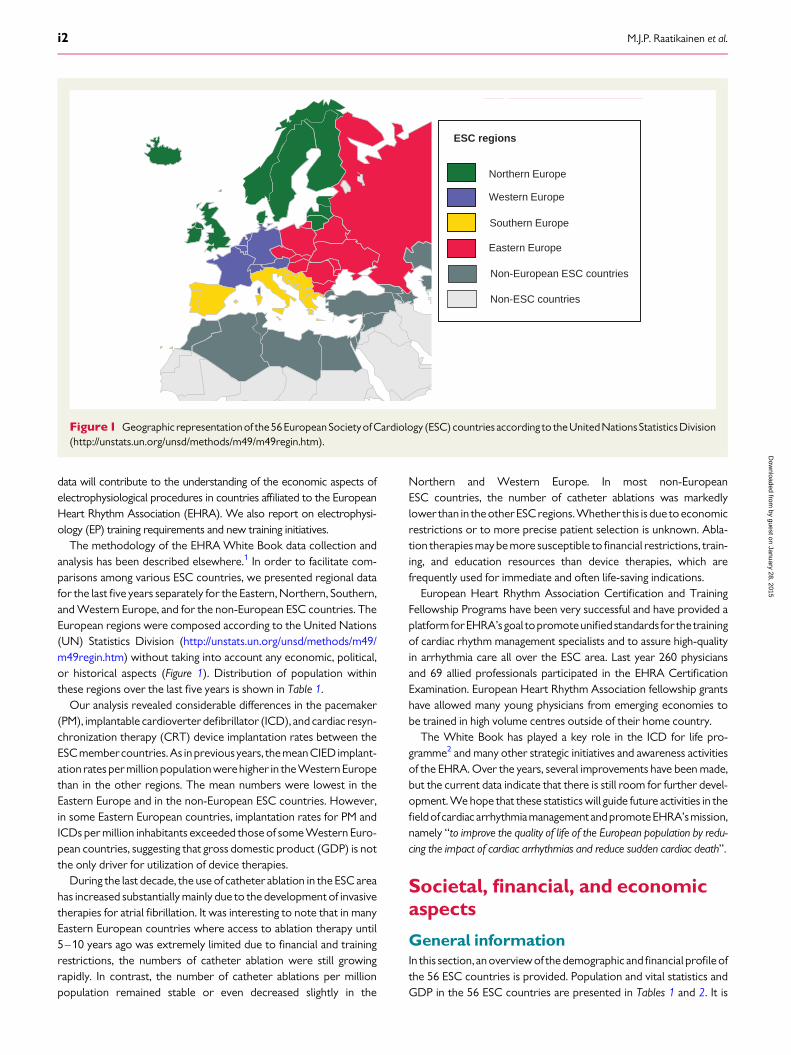
The methodology of the EHRA White Book data collection andanalysis has been described elsewhere.1 In order to facilitate com-parisons among various ESC countries, we presented regional datafor the last five years separately for the Eastern, Northern, Southern,and Western Europe, and for the non-European ESC countries. TheEuropean regions were composed according to the United Nations(UN) Statistics Division (http://unstats.un.org/unsd/methods/m49/m49regin.htm) without taking into account any economic, political,or historical aspects (Figure 1). Distribution of population withinthese regions over the last five years is shown in Table 1.
Our analysis revealed considerable differences in the pacemaker(PM), implantable cardioverter defibrillator (ICD), and cardiac resyn-chronization therapy (CRT) device implantation rates between theESC membercountries.As inpreviousyears, themeanCIED implant-ation rates per million population werehigher in the WesternEuropethan in the other regions. The mean numbers were lowest in theEastern Europe and in the non-European ESC countries. However,in some Eastern European countries, implantation rates for PM andICDs per million inhabitants exceeded those of some Western Euro-pean countries, suggesting that gross domestic product (GDP) is notthe only driver for utilization of device therapies.
During the last decade, the use of catheter ablation in the ESC areahas increased substantially mainly due to the development of invasivetherapies for atrial fibrillation. It was interesting to note that in manyEastern European countries where access to ablation therapy until5–10 years ago was extremely limited due to financial and trainingrestrictions, the numbers of catheter ablation were still growingrapidly. In contrast, the number of catheter ablations per millionpopulation remained stable or even decreased slightly in the
Northern and Western Europe. In most non-EuropeanESC countries, the number of catheter ablations was markedlylower than in the otherESCregions. Whether this is due toeconomicrestrictions or to more precise patient selection is unknown. Abla-tion therapies may be more susceptible to financial restrictions, train-ing, and education resources than device therapies, which arefrequently used for immediate and often life-saving indications.
European Heart Rhythm Association Certification and TrainingFellowship Programs have been very successful and have provided aplatform forEHRA’s goal topromoteunifiedstandards for thetrainingof cardiac rhythm management specialists and to assure high-qualityin arrhythmia care all over the ESC area. Last year 260 physiciansand 69 allied professionals participated in the EHRA CertificationExamination. European Heart Rhythm Association fellowship grantshave allowed many young physicians from emerging economies tobe trained in high volume centres outside of their home country.
The White Book has played a key role in the ICD for life pro-gramme2 and many other strategic initiatives and awareness activitiesof the EHRA. Over the years, several improvements have been made,but the current data indicate that there is still room for further devel-opment. We hope that these statistics will guide future activities in thefieldofcardiac arrhythmiamanagementandpromoteEHRA’smission,namely “to improve the quality of life of the European population by redu-cing the impact of cardiac arrhythmias and reduce sudden cardiac death”.
Societal, financial, and economicaspects
General informationIn this section, an overview of the demographic and financial profile ofthe 56 ESC countries is provided. Population and vital statistics andGDP in the 56 ESC countries are presented in Tables 1 and 2. It is
ESC regions
Eastern Europe
Southern Europe
Western Europe
Northern Europe
Non-European ESC countries
Non-ESC countries
Figure1 Geographic representationof the56European SocietyofCardiology (ESC) countries according to the UnitedNationsStatisticsDivision(http://unstats.un.org/unsd/methods/m49/m49regin.htm).
M.J.P. Raatikainen et al.i2
by guest on January 28, 2015D
ownloaded from
. . . . . . . . . . . . . . . . . . . . . . . . . . . . . . . . . . . . . . . . . . . . . . . . . . . . . . . . . . . . . . . . . . . . . . . . . . . . . . . . . . . . . . . . . . . . . . . . . . . . . . . . . . . . . . . . . . . . . . . . . . . . . . . . . . . . . . . . . . . . . . . . . . . . . . . . . . . . . . .
. . . . . . . . . . . . . . . . . . . . . . . . . . . . . . . . . . . . . . . . . . . . . . . . . . . . . . . . . . . . . . . . . . . . . . . . . . . . . . . . . . . . . . . . . . . . . . . . . . . . . . . . . . . . . . . . . . . . . . . . . . . . . . . . . . . . . . . . . . . . . . . . . . . . . . . . . . . . . . . . . . . . . . . . . . . . . . . . . . . . . . . . . . . . . . . . . . . . . . . . . . . . . . . . . . . . . . . . . . . . . . . . . . . . . . . . . . . . .
Table 1 Populations in the five geographical European Society of Cardiology regions in 2009–2013
ISO code Population
2009 2010 2011 2012 2013
Northern Europe
Denmark DK 5 519 441 5 550 000 5 529 888 5 543 453 5 556 452
Estonia EE 1 340 271 1 341 000 1 282 963 1 274 709 1 266 375
Finland FI 5 338 871 5 365 000 5 259 250 5 262 930 5 266 114
Iceland IS 319 246 320 000 311 058 313 183 315 281
Ireland IE 4 459 305 4 470 000 4 670 976 4 722 028 4 775 982
Latvia LV 2 254 834 2 252 000 2 204 708 2 191 580 2 178 443
Lithuania LT 3 339 455 3 324 000 3 535 547 3 525 761 3 515 858
Norway NO 4 828 726 4 883 000 4 691 849 5 000 000 5 085 582
Sweden SE 9 298 515 9 380 000 9 088 728 9 103 788 9 647 386
United Kingdom GB 61 791 956 62 036 000 62 698 362 63 047 162 63 395 574
Total 98 490 619 98 921 000 99 273 329 99 984 594 101 003 047
Western Europe
Austria AT 8 363 040 8 394 000 8 217 280 8 219 743 8 221 646
Belgium BE 10 646 804 10 712 000 10 431 477 11 082 744 10 444 268
France FR 62 342 668 62 787 000 65 102 719 65 630 692 65 951 611
Germany DE 81 874 768 82 302 000 81 471 834 81 305 856 81 147 265
Luxembourg LU 486 181 507 000 503 302 509 074 514 862
Netherlands NL 16 445 593 16 613 000 16 653 734 16 730 632 16 805 037
Switzerland CH 7 567 659 7 664 000 7 639 961 7 925 517 7 996 026
Total 187 726 713 188 979 000 190 020 307 191 404 258 191 080 715
Eastern Europe
Belarus BY 9 665 120 9 595 000 9 577 552 9 643 566 9 625 888
Bulgaria BG 7 585 131 7 494 000 7 093 635 7 037 935 6 981 642
Czech Republic CZ 10 491 492 10 493 000 10 190 213 10 177 300 10 609 762
Hungary HU 10 022 650 9 984 000 9 976 062 9 958 453 9 939 470
Moldova MD 3 770 698 3 731 799 3 694 121 3 656 843 3 619 925
Poland PL 38 153 388 38 277 000 38 441 588 38 415 284 38 383 809
Romania RO 21 469 960 21 431 298 21 904 551 21 848 504 21 790 479
Russian Federation RU 141 909 248 142 958 000 138 739 892 142 517 670 142 500 482
Slovakia SK 5 418 374 5 462 000 5 477 038 5 483 088 5 488 339
Ukraine UA 45 872 976 45 448 000 45 134 707 45 416 589 44 573 205
Total 294 359 037 294 874 097 290 229 359 294 155 232 293 513 001
Southern Europe
Albania* AL 3 194 417 3 204 000 2 994 667 3 002 859 3 011 405
Bosnia and Herzegovina BA 3 838 161 3 760 000 4 622 163 3 879 296 3 875 723
Continued
Com
parativeanalysis
ofEHR
AW
hiteBook
data2009
–2013
i3
by guest on January 28, 2015 Downloaded from
. . . . . . . . . . . . . . . . . . . . . . . . . . . . . . . . . . . . . . . . . . . . . . . . . . . . . . . . . . . . . . . . . . . . . . . . . . . . . . . . . . . . . . . . . . . . . . . . . . . . . . . . . . . . . . . . . . . . . . . . . . . . . . . . . . . . . . . . . . . . . . . . . . . . . . . . . . . . . . .
. . . . . . . . . . . . . . . . . . . . . . . . . . . . . . . . . . . . . . . . . . . . . . . . . . . . . . . . . . . . . . . . . . . . . . . . . . . . . . . . . . . . . . . . . . . . . . . . . . . . . . . . . . . . . . . . . . . . . . . . . . . . . . . . . . . . . . . . . . . . . . . . . . . . . . . . . . . . . . . . . . . . . . . . . . . . . . . . . . . . . . . . . . . . . . . . . . . . . . . . . . . . . . . . . . . . . . . . . . . . . . . . . . . . . . . . . . . . .
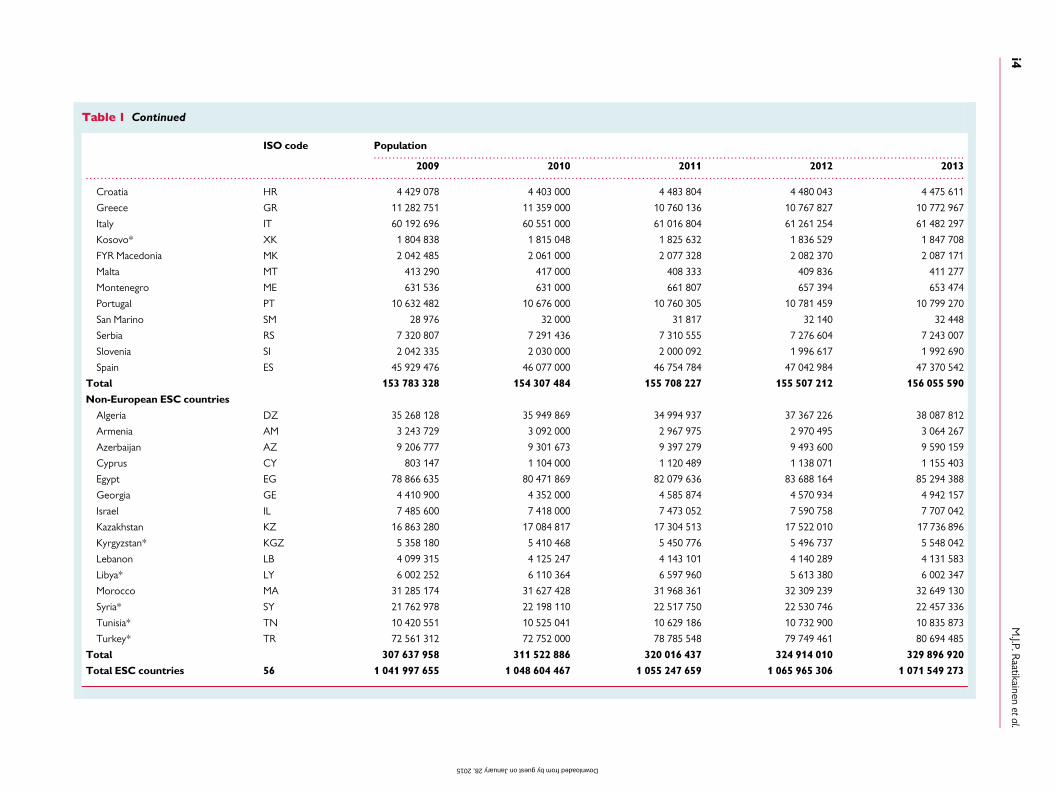
Table 1 Continued
ISO code Population
2009 2010 2011 2012 2013
Croatia HR 4 429 078 4 403 000 4 483 804 4 480 043 4 475 611
Greece GR 11 282 751 11 359 000 10 760 136 10 767 827 10 772 967
Italy IT 60 192 696 60 551 000 61 016 804 61 261 254 61 482 297
Kosovo* XK 1 804 838 1 815 048 1 825 632 1 836 529 1 847 708
FYR Macedonia MK 2 042 485 2 061 000 2 077 328 2 082 370 2 087 171
Malta MT 413 290 417 000 408 333 409 836 411 277
Montenegro ME 631 536 631 000 661 807 657 394 653 474
Portugal PT 10 632 482 10 676 000 10 760 305 10 781 459 10 799 270
San Marino SM 28 976 32 000 31 817 32 140 32 448
Serbia RS 7 320 807 7 291 436 7 310 555 7 276 604 7 243 007
Slovenia SI 2 042 335 2 030 000 2 000 092 1 996 617 1 992 690
Spain ES 45 929 476 46 077 000 46 754 784 47 042 984 47 370 542
Total 153 783 328 154 307 484 155 708 227 155 507 212 156 055 590
Non-European ESC countries
Algeria DZ 35 268 128 35 949 869 34 994 937 37 367 226 38 087 812
Armenia AM 3 243 729 3 092 000 2 967 975 2 970 495 3 064 267
Azerbaijan AZ 9 206 777 9 301 673 9 397 279 9 493 600 9 590 159
Cyprus CY 803 147 1 104 000 1 120 489 1 138 071 1 155 403
Egypt EG 78 866 635 80 471 869 82 079 636 83 688 164 85 294 388
Georgia GE 4 410 900 4 352 000 4 585 874 4 570 934 4 942 157
Israel IL 7 485 600 7 418 000 7 473 052 7 590 758 7 707 042
Kazakhstan KZ 16 863 280 17 084 817 17 304 513 17 522 010 17 736 896
Kyrgyzstan* KGZ 5 358 180 5 410 468 5 450 776 5 496 737 5 548 042
Lebanon LB 4 099 315 4 125 247 4 143 101 4 140 289 4 131 583
Libya* LY 6 002 252 6 110 364 6 597 960 5 613 380 6 002 347
Morocco MA 31 285 174 31 627 428 31 968 361 32 309 239 32 649 130
Syria* SY 21 762 978 22 198 110 22 517 750 22 530 746 22 457 336
Tunisia* TN 10 420 551 10 525 041 10 629 186 10 732 900 10 835 873
Turkey* TR 72 561 312 72 752 000 78 785 548 79 749 461 80 694 485
Total 307 637 958 311 522 886 320 016 437 324 914 010 329 896 920
Total ESC countries 56 1 041 997 655 1 048 604 467 1 055 247 659 1 065 965 306 1 071 549 273
M.J.P.R
aatikainenetal.
i4
by guest on January 28, 2015 Downloaded from
. . . . . . . . . . . . . . . . . . . . . . . . . . . . . . . . . . . . . . . . . . . . . . . . . . . . . . . . . . . . . . . . . . . . . . . . . . . . . . . . . . . . . . . . . . . . . . . . . . . . . . . . . . . . . . . . . . . . . . . . . . . . . . . . . . . . . . . . . . . . . . . . . . . . . . . . . . . . . . . . . . . . . . . . . . . . . . . . . . . . . . . . . . . . . . . . . . . . . . . . . . . . . . . . . . . . . . . . . . . . . . . . . . . . . . . . . . . . .
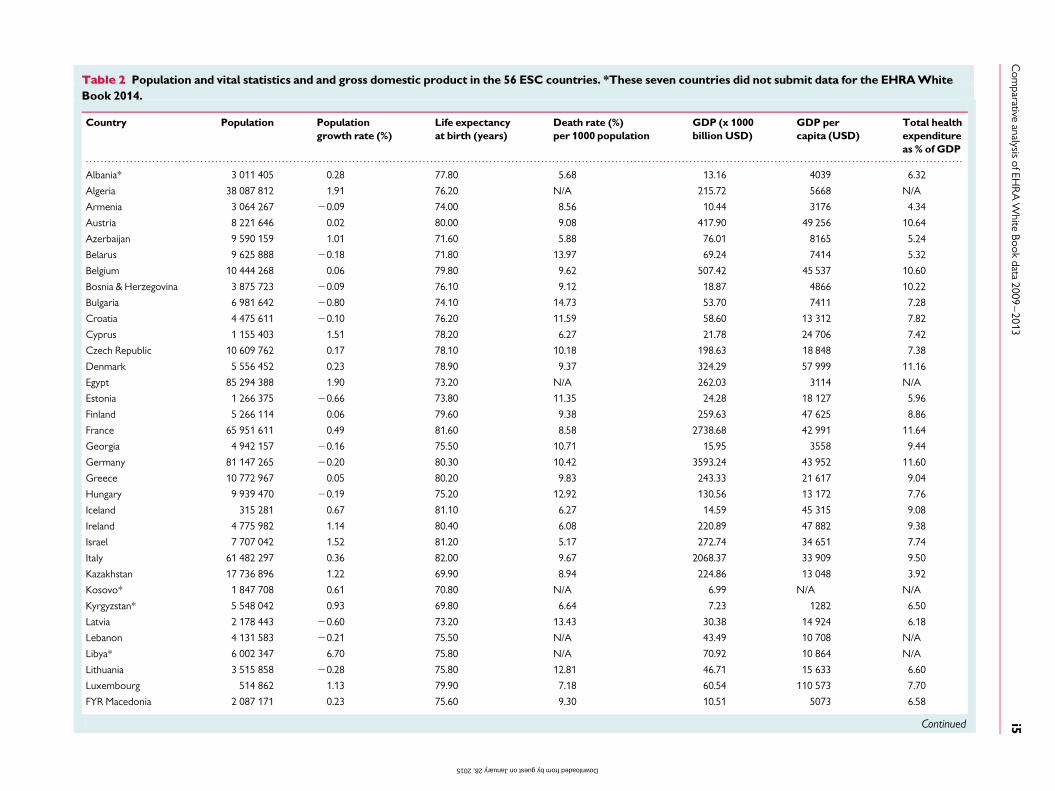
Table 2 Population and vital statistics and and gross domestic product in the 56 ESC countries. *These seven countries did not submit data for the EHRAWhiteBook 2014.
Country Population Populationgrowth rate (%)
Life expectancyat birth (years)
Death rate (%)per 1000 population
GDP (x 1000billion USD)
GDP percapita (USD)
Total healthexpenditureas % of GDP
Albania* 3 011 405 0.28 77.80 5.68 13.16 4039 6.32
Algeria 38 087 812 1.91 76.20 N/A 215.72 5668 N/A
Armenia 3 064 267 20.09 74.00 8.56 10.44 3176 4.34
Austria 8 221 646 0.02 80.00 9.08 417.90 49 256 10.64
Azerbaijan 9 590 159 1.01 71.60 5.88 76.01 8165 5.24
Belarus 9 625 888 20.18 71.80 13.97 69.24 7414 5.32
Belgium 10 444 268 0.06 79.80 9.62 507.42 45 537 10.60
Bosnia & Herzegovina 3 875 723 20.09 76.10 9.12 18.87 4866 10.22
Bulgaria 6 981 642 20.80 74.10 14.73 53.70 7411 7.28
Croatia 4 475 611 20.10 76.20 11.59 58.60 13 312 7.82
Cyprus 1 155 403 1.51 78.20 6.27 21.78 24 706 7.42
Czech Republic 10 609 762 0.17 78.10 10.18 198.63 18 848 7.38
Denmark 5 556 452 0.23 78.90 9.37 324.29 57 999 11.16
Egypt 85 294 388 1.90 73.20 N/A 262.03 3114 N/A
Estonia 1 266 375 20.66 73.80 11.35 24.28 18 127 5.96
Finland 5 266 114 0.06 79.60 9.38 259.63 47 625 8.86
France 65 951 611 0.49 81.60 8.58 2738.68 42 991 11.64
Georgia 4 942 157 20.16 75.50 10.71 15.95 3558 9.44
Germany 81 147 265 20.20 80.30 10.42 3593.24 43 952 11.60
Greece 10 772 967 0.05 80.20 9.83 243.33 21 617 9.04
Hungary 9 939 470 20.19 75.20 12.92 130.56 13 172 7.76
Iceland 315 281 0.67 81.10 6.27 14.59 45 315 9.08
Ireland 4 775 982 1.14 80.40 6.08 220.89 47 882 9.38
Israel 7 707 042 1.52 81.20 5.17 272.74 34 651 7.74
Italy 61 482 297 0.36 82.00 9.67 2068.37 33 909 9.50
Kazakhstan 17 736 896 1.22 69.90 8.94 224.86 13 048 3.92
Kosovo* 1 847 708 0.61 70.80 N/A 6.99 N/A N/A
Kyrgyzstan* 5 548 042 0.93 69.80 6.64 7.23 1282 6.50
Latvia 2 178 443 20.60 73.20 13.43 30.38 14 924 6.18
Lebanon 4 131 583 20.21 75.50 N/A 43.49 10 708 N/A
Libya* 6 002 347 6.70 75.80 N/A 70.92 10 864 N/A
Lithuania 3 515 858 20.28 75.80 12.81 46.71 15 633 6.60
Luxembourg 514 862 1.13 79.90 7.18 60.54 110 573 7.70
FYR Macedonia 2 087 171 0.23 75.60 9.30 10.51 5073 6.58
Continued
Com
parativeanalysis
ofEHR
AW
hiteBook
data2009
–2013
i5
by guest on January 28, 2015 Downloaded from
. . . . . . . . . . . . . . . . . . . . . . . . . . . . . . . . . . . . . . . . . . . . . . . . . . . . . . . . . . . . . . . . . . . . . . . . . . . . . . . . . . . . . . . . . . . . . . . . . . . . . . . . . . . . . . . . . . . . . . . . . . . . . . . . . . . . . . . . . . . . . . . . . . . . . . . . . . . . . . . . . . . . . . . . . . . . . . . . . . . . . . . . . . . . . . . . . . . . . . . . . . . . . . . . . . . . . . . . . . . . . . . . . . . . . . . . . . . . .
Table 2 Continued
Country Population Populationgrowth rate (%)
Life expectancyat birth (years)
Death rate (%)per 1000 population
GDP (x 1000billion USD)
GDP percapita (USD)
Total healthexpenditureas % of GDP
Malta 411 277 0.35 80.00 7.86 9.32 22 323 8.74
Moldova 3 619 925 21.01 69.80 11.11 7.88 2214 11.38
Montenegro 653 474 20.60 78.10 9.29 4.52 7252 9.32
Morocco 32 649 130 1.05 76.30 N/A 104.80 3190 N/A
Netherlands 16 805 037 0.44 81.00 8.13 800.54 47 651 11.96
Norway 5 085 582 1.28 81.50 8.34 515.83 101 271 9.08
Poland 38 383 809 20.08 76.50 9.75 513.93 13 334 6.74
Portugal 10 799 270 0.17 78.90 9.78 219.29 20 663 10.36
Romania 21 790 479 20.27 74.50 12.12 183.79 8630 5.84
Russian Federation 142 500 482 20.01 69.90 14.20 2117.83 14 973 6.20
San Marino 32 448 0.95 83.10 7.34 1.87 N/A 7.18
Serbia 7 243 007 20.46 74.80 14.18 43.68 6017 10.44
Slovakia 5 488 339 0.10 76.20 9.84 96.96 17 929 8.70
Slovenia 1 992 690 20.20 77.70 9.08 46.82 22 719 9.06
Spain 47 370 542 0.69 81.40 8.41 1355.66 29 409 9.44
Sweden 9 647 386 0.77 81.80 9.65 552.04 57 297 9.36
Switzerland 7 996 026 0.89 82.30 8.01 646.20 80 276 10.86
Syria* 22 457 336 20.33 75.10 N/A N/A N/A N/A
Tunisia* 10 835 873 0.95 75.50 N/A 48.38 4431 N/A
Turkey* 80 694 485 1.18 73.00 5.10 821.80 10 745 6.66
Ukraine 44 573 205 20.63 68.90 14.60 175.53 3862 7.26
United Kingdom 63 395 574 0.55 80.30 9.02 2489.67 39 049 9.32
EHRA White Book 2014, http://www.census.gov/ipc/www/idb/informationGateway.php, http://data.euro.who.int/hfadb/, http://www.imf.org/external/ns/cs.aspx?id=28 (2013¼IMF est.), World Health Organization National Health Accountdatabase.*These seven countries did not submit data for the EHRA White Book 2014. M
.J.P.Raatikainen
etal.i6
by guest on January 28, 2015 Downloaded from
. . . . . . . . . . . . . . . . . . . . . . . . . . . . . . . . . . . . . . . . . . . . . . . . . . . . . . . . . . . . . . . . . . . . . . . . . . . . . . . . . . . . . . . . . . . . . . . . . . . . . . . . . . . . . . . .
. . . . . . . . . . . . . . . . . . . . . . . . . . . . . . . . . . . . . . . . . . . . . . . . . . . . . . . . . . . . . . . . . . . . . . . . . . . . . . . . . . . . . . . . . . . . . . . . . . . . . . . . . . . . . . . . . . . . . . . . . . . . . . . . . . . . . . . . . . . . . . . . . . . . . . . . . . . . . . . . . . . . . . . . . . . . . . . . . . . . . . . . . . . . . . . . . . . . . . . . . . . . . . . . . . . . . . . . . . . . . . . . . . . . . . . . . . . . .
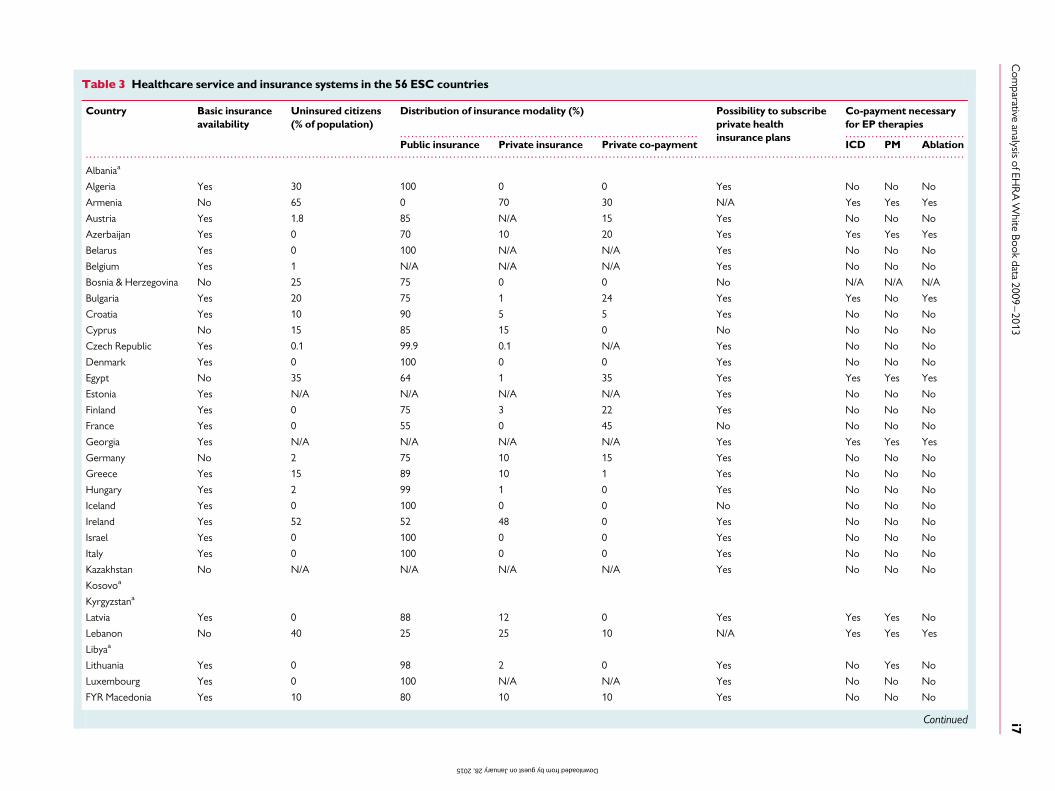
Table 3 Healthcare service and insurance systems in the 56 ESC countries
Country Basic insuranceavailability
Uninsured citizens(% of population)
Distribution of insurance modality (%) Possibility to subscribeprivate healthinsurance plans
Co-payment necessaryfor EP therapies
Public insurance Private insurance Private co-payment ICD PM Ablation
Albaniaa
Algeria Yes 30 100 0 0 Yes No No No
Armenia No 65 0 70 30 N/A Yes Yes Yes
Austria Yes 1.8 85 N/A 15 Yes No No No
Azerbaijan Yes 0 70 10 20 Yes Yes Yes Yes
Belarus Yes 0 100 N/A N/A Yes No No No
Belgium Yes 1 N/A N/A N/A Yes No No No
Bosnia & Herzegovina No 25 75 0 0 No N/A N/A N/A
Bulgaria Yes 20 75 1 24 Yes Yes No Yes
Croatia Yes 10 90 5 5 Yes No No No
Cyprus No 15 85 15 0 No No No No
Czech Republic Yes 0.1 99.9 0.1 N/A Yes No No No
Denmark Yes 0 100 0 0 Yes No No No
Egypt No 35 64 1 35 Yes Yes Yes Yes
Estonia Yes N/A N/A N/A N/A Yes No No No
Finland Yes 0 75 3 22 Yes No No No
France Yes 0 55 0 45 No No No No
Georgia Yes N/A N/A N/A N/A Yes Yes Yes Yes
Germany No 2 75 10 15 Yes No No No
Greece Yes 15 89 10 1 Yes No No No
Hungary Yes 2 99 1 0 Yes No No No
Iceland Yes 0 100 0 0 No No No No
Ireland Yes 52 52 48 0 Yes No No No
Israel Yes 0 100 0 0 Yes No No No
Italy Yes 0 100 0 0 Yes No No No
Kazakhstan No N/A N/A N/A N/A Yes No No No
Kosovoa
Kyrgyzstana
Latvia Yes 0 88 12 0 Yes Yes Yes No
Lebanon No 40 25 25 10 N/A Yes Yes Yes
Libyaa
Lithuania Yes 0 98 2 0 Yes No Yes No
Luxembourg Yes 0 100 N/A N/A Yes No No No
FYR Macedonia Yes 10 80 10 10 Yes No No No
Continued
Com
parativeanalysis
ofEHR
AW
hiteBook
data2009
–2013
i7
by guest on January 28, 2015 Downloaded from
. . . . . . . . . . . . . . . . . . . . . . . . . . . . . . . . . . . . . . . . . . . . . . . . . . . . . . . . . . . . . . . . . . . . . . . . . . . . . . . . . . . . . . . . . . . . . . . . . . . . . . . . . . . . . . . .
. . . . . . . . . . . . . . . . . . . . . . . . . . . . . . . . . . . . . . . . . . . . . . . . . . . . . . . . . . . . . . . . . . . . . . . . . . . . . . . . . . . . . . . . . . . . . . . . . . . . . . . . . . . . . . . . . . . . . . . . . . . . . . . . . . . . . . . . . . . . . . . . . . . . . . . . . . . . . . . . . . . . . . . . . . . . . . . . . . . . . . . . . . . . . . . . . . . . . . . . . . . . . . . . . . . . . . . . . . . . . . . . . . . . . . . . . . . . .
Table 3 Continued
Country Basic insuranceavailability
Uninsured citizens(% of population)
Distribution of insurance modality (%) Possibility to subscribeprivate healthinsurance plans
Co-payment necessaryfor EP therapies
Public insurance Private insurance Private co-payment ICD PM Ablation
Malta Yes 0 100 0 0 Yes No No No
Moldova Yes 20 100 0 0 Yes N/A No N/A
Montenegro Yes N/A 100 0 0 No No No No
Morocco No 35 70 25 5 Yes Yes Yes Yes
Netherlands Yes 0 0 100 0 No No No No
Norway Yes 0 97 N/A 3 Yes No No No
Poland Yes 5 90 5 5 Yes No No No
Portugal N/A 0 100 0 0 Yes No No No
Romania Yes N/A 98 0 2 Yes Yes No Yes
Russian Federation Yes N/A 85 10 5 Yes No Yes No
San Marino No 0 100 N/A 0 Yes No No No
Serbia Yes 5 90 5 5 Yes No No No
Slovakia Yes 0 72 28 0 Yes No No No
Slovenia No 1 4 0 96 N/A No No No
Spain No 5 75 10 15 Yes No No No
Sweden Yes 0 N/A N/A N/A Yes No No No
Switzerland Yes 0 70 0 30 Yes No No No
Syriaa
Tunisiaa
Turkeya
Ukraine No N/A N/A N/A N/A Yes No No No
United Kingdom No 90 90 10 0 Yes No No No
aThese 7 countries did not submit data for the EHRA White Book 2014. M.J.P.R
aatikainenetal.
i8
by guest on January 28, 2015 Downloaded from
3.94.3
5.25.3
5.86.0
6.26.2
6.66.6
6.77.27.37.3
7.47.4
7.77.77.87.8
8.78.7
8.99.09.19.19.1
9.39.39.49.49.49.49.5
10.210.410.4
10.610.6
10.911.2
11.411.611.6
12.0
Italy Bosnia & Herzegovina
Portugal Serbia
Belgium Austria
Switzerland
Kazakhstan Armenia
Azerbaijan Belarus
San Marino Ukraine Bulgaria
Czech Republic Cyprus
Luxembourg
United Kingdom Montenegro
Sweden Ireland Spain
Georgia
Slovakia Malta
Finland Greece
Slovenia Norway Iceland
Romania Estonia
Latvia Russian Federation
FYR Macedonia Lithuania
Poland
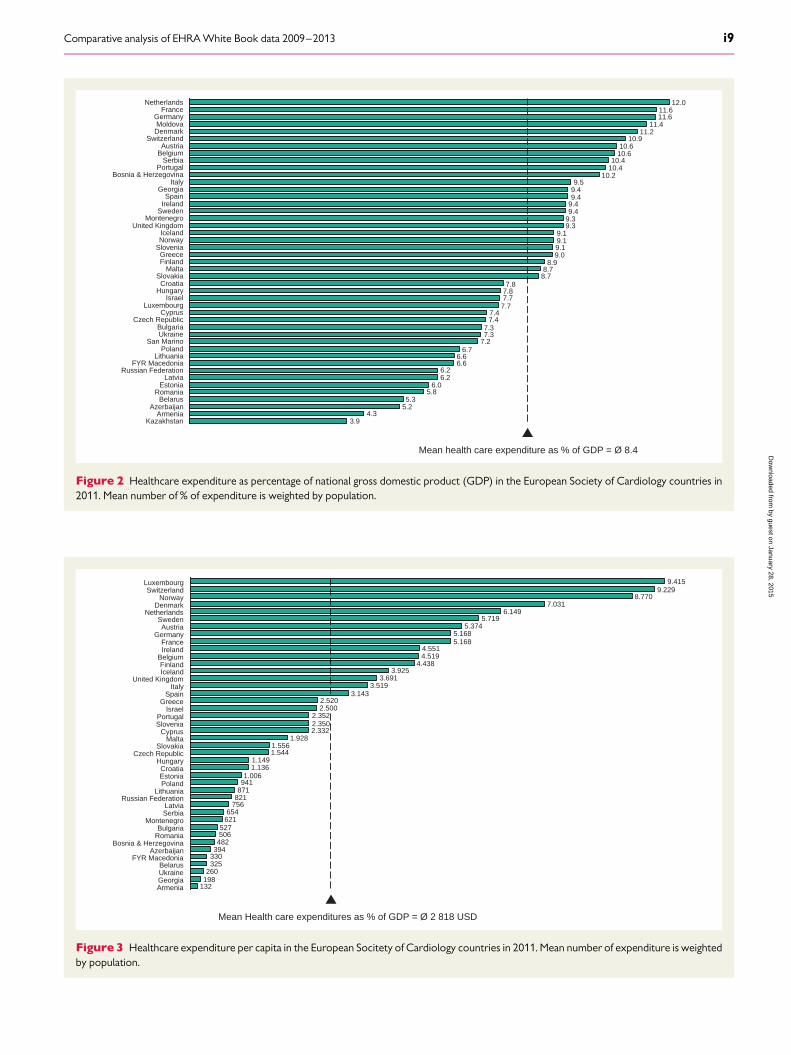
Mean health care expenditure as % of GDP = Ø 8.4
Israel Hungary
Croatia
Denmark Moldova
Germany France
Netherlands
Figure 2 Healthcare expenditure as percentage of national gross domestic product (GDP) in the European Society of Cardiology countries in2011. Mean number of % of expenditure is weighted by population.
132198260
325330394482506527
621654
7568218719411.006
1.1361.149
1.5441.556
1.9282.3322.3502.352
2.5002.520
3.1433.519
3.6913.925
4.4384.5194.551
5.1685.168
5.3745.719
6.1497.031
8.7709.229
9.415
AzerbaijanFYR Macedonia
BelarusUkraineGeorgiaArmenia
Mean Health care expenditures as % of GDP = Ø 2 818 USD
RomaniaBulgaria
MontenegroSerbiaLatvia
Russian FederationLithuania
PolandEstoniaCroatia
HungaryCzech Republic
SlovakiaMalta
CyprusSloveniaPortugal
IsraelGreece
SpainItaly
United KingdomIcelandFinland
BelgiumIrelandFrance
Germany
Bosnia & Herzegovina
AustriaSweden
NetherlandsDenmark
NorwaySwitzerland
Luxembourg
Figure 3 Healthcare expenditure per capita in the European Socitety of Cardiology countries in 2011. Mean number of expenditure is weightedby population.
Comparative analysis of EHRA White Book data 2009–2013 i9
by guest on January 28, 2015D
ownloaded from
271295309320
332335338
343
394397
450463466
468479485501
531537
552579
588598611
623638645650
655684
700717719765
822
899
966
1.125
0
100
200
300
400
500
600
700
800
900
1.000
1.100
1.200
0
1
2
3
4
5
6
7
8
9
10
11
12
13
14
15
16
Georgia
264
Sw
eden
Ireland
Spain
Iceland
Norw
ay
Israel
Portugal
Italy
Bosnia and H
erzegovina
345
Cyprus
347S
an Marino
383A
rmenia
Montenegro
FY
R M
acedonia
Slovenia
Netherlands
Azerbaijan
Malta
Greece
Sw
itzerland
Estonia
Luxembourg
Finland
Croatia
Latvia
Slovakia
Rom
ania
Moldova
France
Bulgaria
Belgium
Poland
Czech R
epublic
Lithuania
Kazakhstan
Hungary
Austria
Germ
any
Ukraine
Russian F
ederation
Belarus
Beds
Hospitals
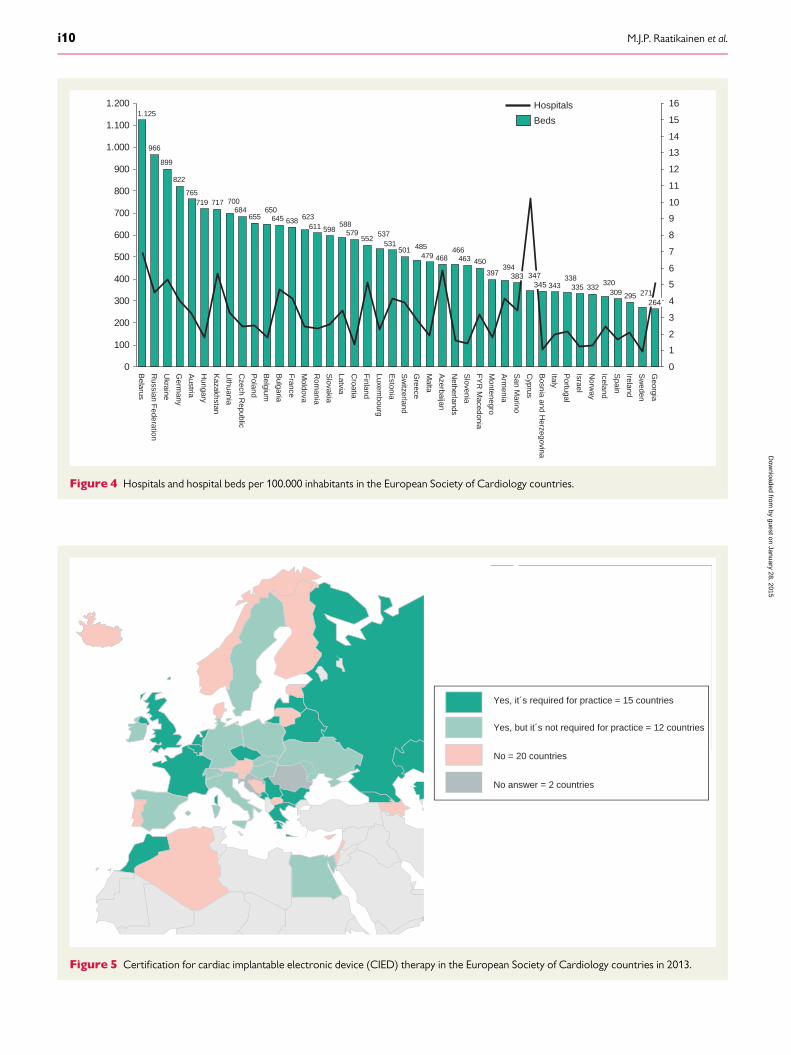
Figure 4 Hospitals and hospital beds per 100.000 inhabitants in the European Society of Cardiology countries.
No answer = 2 countries
No = 20 countries
Yes, but it´s not required for practice = 12 countries
Yes, it´s required for practice = 15 countries
Figure 5 Certification for cardiac implantable electronic device (CIED) therapy in the European Society of Cardiology countries in 2013.
M.J.P. Raatikainen et al.i10
by guest on January 28, 2015D
ownloaded from
No answer = 2 countries
No = 23 countries
Yes, but it´s not required for practice = 11 countries
Yes, it´s required for practice = 13 countries
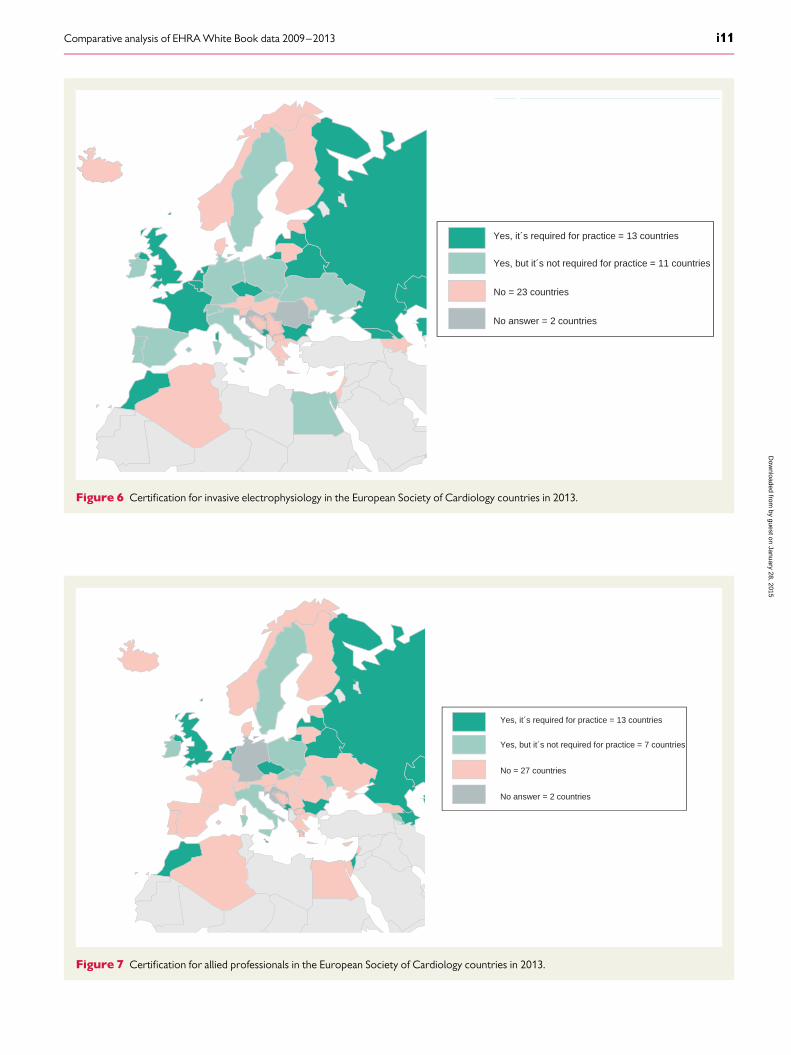
Figure 6 Certification for invasive electrophysiology in the European Society of Cardiology countries in 2013.
No answer = 2 countries
No = 27 countries
Yes, but it´s not required for practice = 7 countries
Yes, it´s required for practice = 13 countries
Figure 7 Certification for allied professionals in the European Society of Cardiology countries in 2013.
Comparative analysis of EHRA White Book data 2009–2013 i11
by guest on January 28, 2015D
ownloaded from
hoped that these data will help clarify whether financial restrictionsinfluence the delivery of arrhythmia care. European Society of Cardi-ology countries are a heterogeneous group of nations with varyingpolitical, financial, and demographic characteristics. In addition,there are large variations in the organizational aspects of healthcareacross the ESC member countries. Some countries provide nationalhealthcare services with full coverage to the whole population whilein others healthcare services are primarily delivered by commercialhealth insurance companies and coverage depends on privateco-payments (Table 3).
In 2013 the economic situation in the ESC area was characterizedby ongoing financial difficulties following the recent economic crisisand substantial budget cuts for healthcare.3,4 At the same time thenumber of elderly people, who require vast medical and social assist-ance, is growing rapidly. In this context, socioeconomic disparitiespose major threats to healthcare systems. These aspects have an im-portant negative impact on the use of expensive innovative technol-ogy such as CIED therapy for primary prevention of sudden cardiacdeath and catheter ablation therapies.5– 8
Medium-to-high-qualitydataoncauseofdeathare available inmostESC countries, although they are lacking in many other parts of theworld.9 Demographic and GDP data reveal some important differ-ences between the ESC countries. As an example, the life expectancyvaried from 68.9 years (Ukraine) to 83.1 years (San Marino). It is note-worthy that in most countries with life expectancy over 80 years, theGDPpercapita is alsorelativelyhigh (Table2). TotalGDPranged from2 (San Marino) to 3.593 (Germany) trillion US dollars (USD). TheGDP per capita was almost 100 times higher in Luxembourg(110.573 USD) than in Kyrgyzstan (1.282 USD). Given these huge
financial disparities, it was not surprising at all that there were largevariations in device implantation rates and use of catheter ablationtherapies across the ESC regions and between countries.
Healthcare resourcesHealthexpenditurepercountry is shownaspercentageof the nation-al GDP in Figure 2 and as expenditure per capita in Figure 3. In the ESCcountries, the mean healthcare expenditure was 8.4% of the GDP. Itwas highest in the Netherlands (12.0%) and lowest in Kazakhstan(3.9%). Given the trend towards a progressive ageing of populations,it is likely that the healthcare expenditure will continue to increase.The mean heath expenditure per capita in the ESC area was 2818USD, ranging from132 USD in Armenia to 9.415 USD in Luxem-bourg. Hence, there was more than 70-fold difference between thelowest and the highest health expenditure per capita.
The number of hospitals and hospital beds available for healthcareare shown in Figure 4. The number of hospitals and beds were not dir-ectly related to the financial profile of the countries or to healthcareexpenditure. Rather, these data indicate that some countries havedirected more resources towards hospital care than ambulatoryand home care. For example, the number of beds per 100 000 inha-bitants was 822 in Germany and only 271 in Sweden, despite the rela-tively high GDP and healthcare expenditure in both countries.
In most ESC countries, patients provide minimum-to-noco-payment for invasive EP procedures (Table 3). In countries inwhich a co-payment exists, it may be one of the factors limitingaccess to CIED and catheter ablation therapies. However, as boththe financial profile and the organization of healthcare in the ESC
No answer = 3 countries
No = 32 countries
Yes, but it´s not required for practice = 6 countries
Yes, it´s required for practice = 8 countries
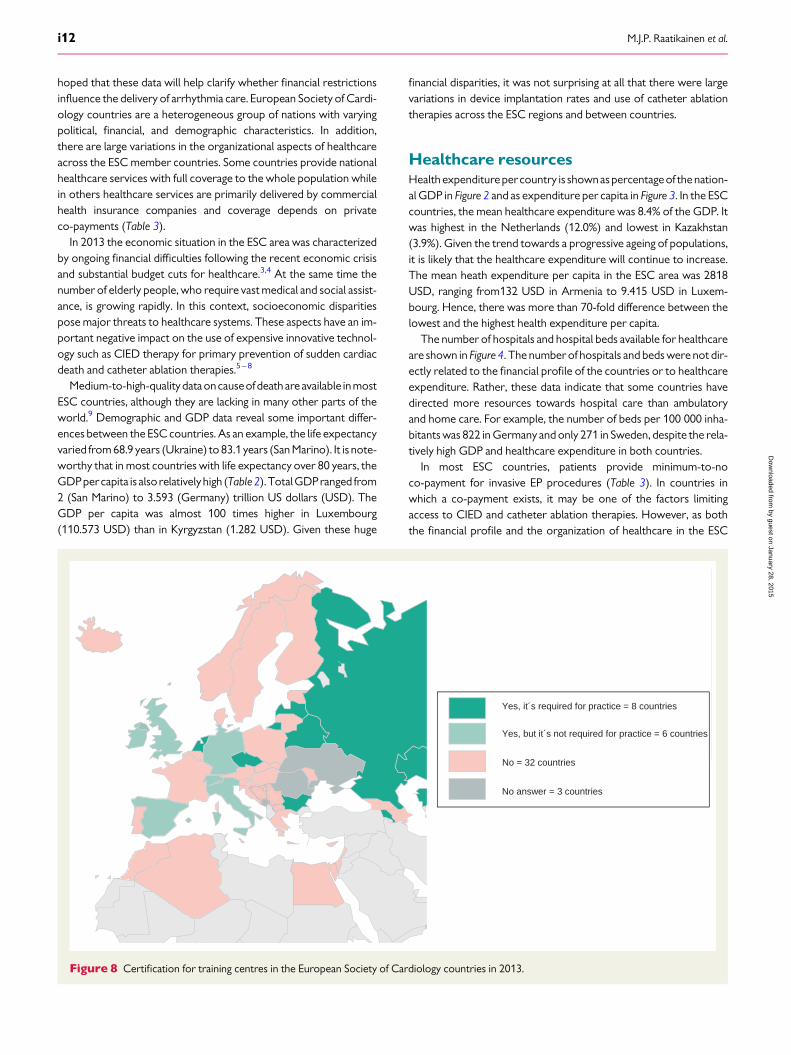
Figure 8 Certification for training centres in the European Society of Cardiology countries in 2013.
M.J.P. Raatikainen et al.i12
by guest on January 28, 2015D
ownloaded from
countries are heterogeneous, the impact of co-payment to imple-mentation of interventional electrophysiological procedures in clin-ical practice is difficult to estimate.
Certification of professionalexcellence
General informationIn 2013, 47 countries (85% of the ESC member countries) provideddata on certification of physicians and allied professionals in device
therapy and invasive EP for the EHRAWhite Book 2014.10 A nationalcertification programme for device therapy for physicians was in usein 27 countries and certification was mandatory in 15 countries(Figure 5). A national certification programme for invasive EP wasavailable in 24 countries, and certification was an obligatory practicerequirement in 13 countries (Figure 6). As shown in Figure 7 a nationalcertification for allied professionals was available in 20 countries andwas required for practice in 9 countries. Training centres were accre-dited in only 14 (25%) countries, and certification of training centreswas mandatory in order to train fellows in eight countries (Figure 8).Many centres in various regions have been available as trainingcentres for the EHRA fellows and allowed many young physiciansfrom emerging economies to be trained in high volume centresabroad.
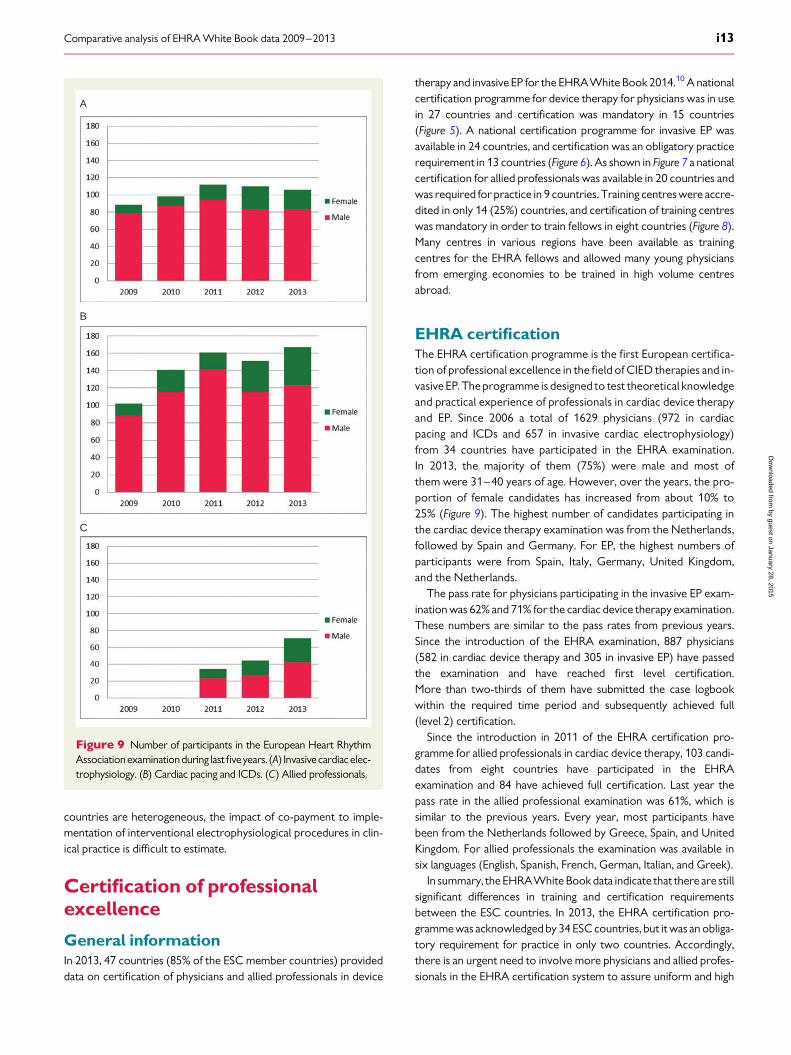
EHRA certificationThe EHRA certification programme is the first European certifica-tion of professional excellence in the field of CIED therapies and in-vasive EP. The programme is designed to test theoretical knowledgeand practical experience of professionals in cardiac device therapyand EP. Since 2006 a total of 1629 physicians (972 in cardiacpacing and ICDs and 657 in invasive cardiac electrophysiology)from 34 countries have participated in the EHRA examination.In 2013, the majority of them (75%) were male and most ofthem were 31–40 years of age. However, over the years, the pro-portion of female candidates has increased from about 10% to25% (Figure 9). The highest number of candidates participating inthe cardiac device therapy examination was from the Netherlands,followed by Spain and Germany. For EP, the highest numbers ofparticipants were from Spain, Italy, Germany, United Kingdom,and the Netherlands.
The pass rate for physicians participating in the invasive EP exam-ination was 62% and 71% for the cardiac device therapy examination.These numbers are similar to the pass rates from previous years.Since the introduction of the EHRA examination, 887 physicians(582 in cardiac device therapy and 305 in invasive EP) have passedthe examination and have reached first level certification.More than two-thirds of them have submitted the case logbookwithin the required time period and subsequently achieved full(level 2) certification.
Since the introduction in 2011 of the EHRA certification pro-gramme for allied professionals in cardiac device therapy, 103 candi-dates from eight countries have participated in the EHRAexamination and 84 have achieved full certification. Last year thepass rate in the allied professional examination was 61%, which issimilar to the previous years. Every year, most participants havebeen from the Netherlands followed by Greece, Spain, and UnitedKingdom. For allied professionals the examination was available insix languages (English, Spanish, French, German, Italian, and Greek).
In summary, the EHRAWhite Book data indicate that there are stillsignificant differences in training and certification requirementsbetween the ESC countries. In 2013, the EHRA certification pro-grammewas acknowledged by 34 ESC countries, but it was an obliga-tory requirement for practice in only two countries. Accordingly,there is an urgent need to involve more physicians and allied profes-sionals in the EHRA certification system to assure uniform and high
A
B
C
Figure 9 Number of participants in the European Heart RhythmAssociationexaminationduring lastfiveyears. (A) Invasivecardiacelec-trophysiology. (B) Cardiac pacing and ICDs. (C) Allied professionals.
Comparative analysis of EHRA White Book data 2009–2013 i13
by guest on January 28, 2015D
ownloaded from
. . . . . . . . . . . . . . . . . . . . . . . . . . . . . . . . . . . . . . . . . . . . . . . . . . . . . . . . . . . . . . . . . . . . . . . . . . . . . . . . . . . . . . . . . . . . . . . . . . . . . . . . . . . . . . . . . . . . . . . . . . . . . . . . . . . . . . . . . . . . . . . . . . . . . . . . . . . . . . . . . . . . . .
. . . . . . . . . . . . . . . . . . . . . . . . . . . . . . . . . . . . . . . . . . . . . . . . . . . . . . . . . . . . . . . . . . . . . . . . . . . . . . . . . . . . . . . . . . . . . . . . . . . . . . . . . . . . . . . . . . . . . . . . . . . . . . . . . . . . . . . . . . . . . . . . . . . . . . . . . . . . . . . . . . . . . . . . . . . . . . . . . . . . . . . . . . . . . . . . . . . . . . . . . . . . . . . . . . . . . . . . . . . . . . . . . . . . . . . . . . . . .
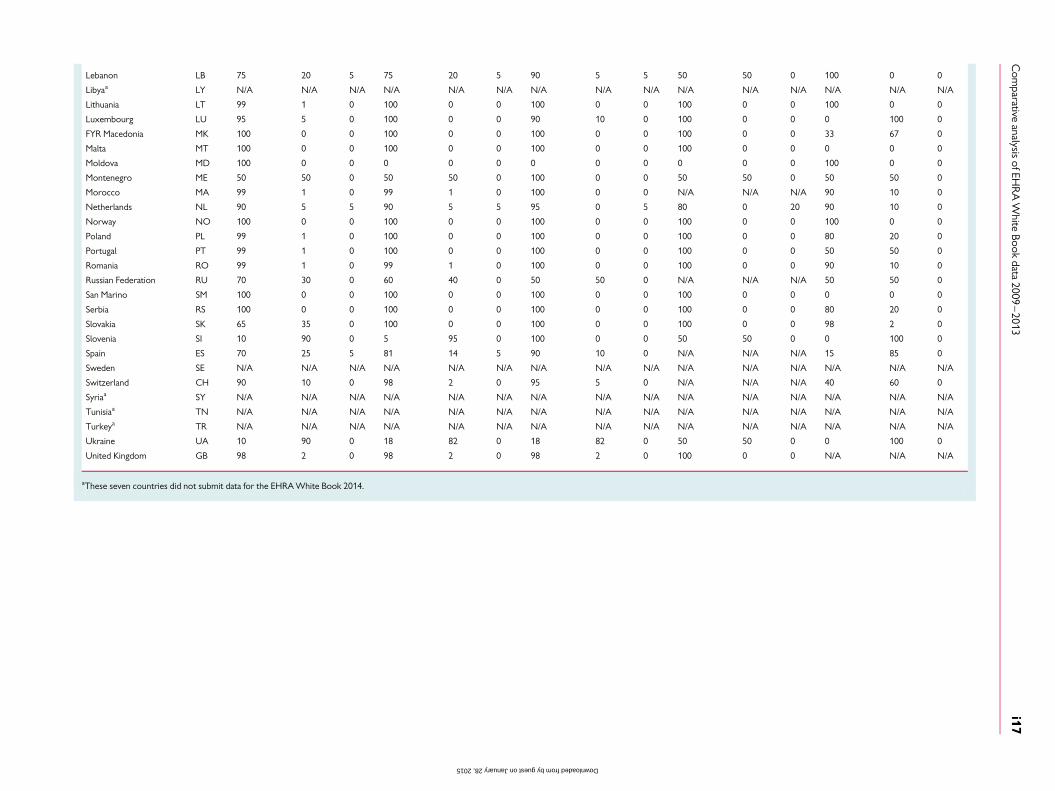
Table 4 Pacemaker implantation facilities and implantation rates in the ESC countries in 2013 and comparison to four previous years
Country ISOcode
NationalRegistry forPM implants
Number of PM implantingcentres 2013
PM implantations 2013 Development potential—targetnumber of PM implantations . . .
PM implantations per milinhabitants
Absolutenumber
Per milinhabitants
Absolutenumber
Per milinhabitants
To attain meanESC area level
To attainmeanEU-28 level
2009 2010 2011 2012 2013
Albaniaa AL N/A N/A N/A N/A N/A N/A N/A N/A N/A N/A N/A N/A
Algeria DZ No 19 0.50 2480 65 20 251 31 875 N/A N/A N/A N/A 65
Armenia AM No 2 0.65 94 31 1629 2564 65 124 133 74 31
Austria AT Yes 57 6.93 7950 967 – – 948 919 950 957 967
Azerbaijan AZ No 6 0.63 131 14 5099 8026 N/A N/A 15 N/A 14
Belarus BY Yes 10 1.04 2813 292 5118 8056 196 238 258 275 292
Belgium BE Yes 105 10.05 12 725 1218 – – 869 838 N/A 1156 1218
Bosnia & Herzegovina BA No 6 1.55 868 224 2061 3244 N/A 205 138 234 224
Bulgaria BG Yes 17 2.43 3511 503 3712 5843 360 329 385 448 503
Croatia HR N/A 18 4.02 2418 540 – 3746 513 531 565 561 540
Cyprus CY No 5 4.33 250 216 614 967 249 208 223 211 216
Czech Republic CZ Yes 37 3.49 9416 887 – – 859 849 881 899 887
Denmark DK Yes 11 1.98 4725 850 – – 713 744 795 841 850
Egypt EG No 28 0.33 2850 33 45 351 71 382 29 19 N/A 30 33
Estonia EE No 5 3.95 1155 912 – – 770 745 766 748 912
Finland FI No 20 3.80 5369 1020 – – 796 917 923 990 1020
France FR No 500 7.58 60 000 910 – – 1029 1022 969 958 910
Georgia GE No 9 1.82 620 125 2628 4136 60 71 84 102 125
Germany DE No 1010 12.45 93 520 1152 – – 1248 1257 1313 1311 1152
Greece GR No 56 5.20 7800 724 – 9016 611 713 701 691 724
Hungary HU Yes 17 1.71 6143 618 – 8318 532 539 584 607 618
Iceland IS No 2 6.34 314 996 – – 836 828 1006 967 996
Ireland IE Yes 17 3.56 2288 479 2539 3997 457 418 507 451 479
Israel IL No 20 2.60 3966 515 4098 6450 567 N/A 500 558 515
Italy IT Yes 420 6.83 62 198 1012 – – 1047 1047 1034 1001 1012
Kazakhstan KZ No 27 1.52 1489 84 9431 14 844 N/A N/A N/A 70 84
Kosovoa XK N/A N/A N/A N/A N/A N/A N/A N/A N/A N/A N/A N/A
Kyrgyzstana KGZ N/A N/A N/A N/A N/A N/A N/A N/A N/A N/A N/A N/A
M.J.P.R
aatikainenetal.
i14
by guest on January 28, 2015 Downloaded from
Latvia LV Yes 3 1.38 1288 591 – 1823 450 490 550 548 591
Lebanon LB No 15 3.63 900 218 2197 3458 N/A N/A N/A N/A 218
Libyaa LY N/A N/A N/A N/A N/A N/A N/A N/A N/A N/A N/A N/A
Lithuania LT No 4 1.14 2716 772 – 2942 662 716 714 756 772
Luxembourg LU No 5 9.71 188 365 274 431 200 179 336 621 365
FYR Macedonia MK Yes 2 0.96 322 154 1110 1747 119 150 174 166 154
Malta MT Yes 2 4.86 227 552 – 344 675 686 740 644 552
Moldova MD No 1 0.28 287 79 1925 3029 N/A N/A N/A N/A 79
Montenegro ME No 1 1.53 204 312 347 547 253 257 264 218 312
Morocco MA Yes 11 0.34 1109 34 17 360 27 324 N/A 35 39 38 34
Netherlands NL Yes 90 5.36 10 174 605 – 14 064 N/A 600 585 560 605
Norway NO Yes 23 4.52 3459 680 – 4256 630 678 675 691 680
Poland PL No 145 3.78 27 500 716 – 32 123 713 719 710 716 716
Portugal PT Yes 40 3.70 8790 814 – 9038 686 764 595 825 814
Romania RO Yes 22 1.01 2400 110 11 586 18 236 140 117 139 144 110
Russian Federation RU Yes 140 0.98 34 758 244 75 768 119 257 186 188 216 212 244
San Marino SM Yes 1 30.82 14 431 17 27 380 688 503 809 431
Serbia RS Yes 18 2.49 3958 546 – 6062 446 437 448 431 546
Slovakia SK Yes 14 2.55 3456 630 – 4593 513 548 617 567 630
Slovenia SI Yes 8 4.01 1287 646 – 1668 458 568 647 668 646
Spain ES Yes 230 4.86 35 500 749 – 39 644 747 762 734 738 749
Sweden SE Yes 42 4.35 9602 995 – – 983 973 N/A 1041 995
Switzerland CH Yes 76 9.50 6097 763 – 6692 713 741 791 753 763
Syriaa SY N/A N/A N/A N/A N/A N/A N/A N/A N/A N/A N/A N/A
Tunisiaa TN N/A N/A N/A N/A N/A N/A N/A 146 143 155 233 N/A
Turkeya TR N/A N/A N/A N/A N/A N/A N/A N/A N/A N/A N/A N/A
Ukraine UA No 36 0.81 6579 148 23 700 37 303 85 103 112 121 148
United Kingdom GB Yes 227 3.58 44 503 702 – 53 055 645 600 610 615 702
Total ESC countries 56 3580 500 411
aThese seven countries did not submit data on PM implantation for the EHRA White Book 2014.
Com
parativeanalysis
ofEHR
AW
hiteBook
data2009
–2013
i15
by guest on January 28, 2015 Downloaded from
. . . . . . . . . . . . . . . . . . . . . . . . . . . . . . . . . . . . . . . . . . . . . . . . . . . . . . . . . . . . . . . . . . . . . . . . . . . . . . . . . . . . . . . . . . . . . . . . . . . . . . . . . . . . . . . . . . . . . . . . . . . . . . . . . . . . . . . . . . . . . . . . . . . . . . . . . . . . . . . . . . . . . . . . . . . . . . . . . . . . . . . . .
. . . . . . . . . . . . . . . . . . . . . . . . . . . . . . . . . . . . . . . . . . . . . . . . . . . . . . . . . . . . . . . . . . . . . . . . . . . . . . . . . . . . . . . . . . . . . . . . . . . . . . . . . . . . . . . . . . . . . . . . . . . . . . . . . . . . . . . . . . . . . . . . . . . . . . . . . . . . . . . . . . . . . . . . . . . . . . . . . . . . . . . . . . . . . . . . . . . . . . . . . . . . . . . . . . . . . . . . . . . . . . . . . . . . . . . . . . . . .
Table 5 Specialty of the physicians performing device implantations and lead extractions in the 56 ESC countries
Country ISOcode
Specialist performing PMimplantations (%)
Specialist performing ICDimplantations (%)
Specialist performing CRTimplantations (%)
Specialist performing looprecorder implantations (%)
Specialist performing leadextractions (%)
Cardiologists Surgeons Other Cardiologists Surgeons Other Cardiologists Surgeons Other Cardiologists Surgeons Other Cardiologists Surgeons Other
Albaniaa AL N/A N/A N/A N/A N/A N/A N/A N/A N/A N/A N/A N/A N/A N/A N/A
Algeria DZ 99 1 0 100 0 0 100 0 0 100 0 0 N/A N/A N/A
Armenia AM 100 0 0 100 0 0 100 0 0 100 0 0 100 0 0
Austria AT 50 50 0 10 90 0 50 50 0 80 20 0 10 90 0
Azerbaijan AZ 52 48 0 100 0 0 100 0 0 100 0 0 90 10 0
Belarus BY 0 100 0 0 100 0 0 100 0 0 100 0 0 100 0
Belgium BE N/A N/A N/A N/A N/A N/A N/A N/A N/A N/A N/A N/A N/A N/A N/A
Bosnia & Herzegovina BA 50 35 15 95 5 0 100 0 0 100 0 0 0 0 0
Bulgaria BG 99.0 1.0 0 100 0 0 100 0 0 100 0 0 100 0 0
Croatia HR 88 12 0 65 35 0 100 0 0 100 0 0 N/A N/A N/A
Cyprus CY 100 0 0 100 0 0 100 0 0 100 0 0 100 0 0
Czech Republic CZ 90 10 0 95 5 0 95 5 0 100 0 0 80 20 0
Denmark DK 100 0 0 100 0 0 100 0 0 100 0 0 85 15 0
Egypt EG 60 10 30 65 0 35 65 0 35 90 0 10 80 0 20
Estonia EE 100 0 0 100 0 0 100 0 0 100 0 0 N/A N/A N/A
Finland FI 95 5 0 100 0 0 100 0 0 100 0 0 N/A N/A N/A
France FR 95 5 0 100 0 0 95 5 0 100 0 0 80 20 0
Georgia GE 90 10 0 100 0 0 100 0 0 100 0 0 N/A N/A N/A
Germany DE 70 20 10 70 20 10 100 0 0 80 20 0 50 50 0
Greece GR 97 3 0 98 2 0 98 2 0 100 0 0 90 10 0
Hungary HU 90 5 5 90 5 5 95 2 3 100 0 0 100 0 0
Iceland IS 100 0 0 100 0 0 100 0 0 100 0 0 0 0 0
Ireland IE 100 0 0 100 0 0 100 0 0 100 0 0 50 50 0
Israel IL 98 2 0 100 0 0 98 2 0 100 0 0 80 20 0
Italy IT 100 0 0 100 0 0 100 0 0 100 0 0 100 0 0
Kazakhstan KZ 53 47 0 55 45 0 53 47 0 47 53 0 43 57 0
Kosovoa XK N/A N/A N/A N/A N/A N/A N/A N/A N/A N/A N/A N/A N/A N/A N/A
Kyrgyzstana KGZ N/A N/A N/A N/A N/A N/A N/A N/A N/A N/A N/A N/A N/A N/A N/A
Latvia LV 70 30 0 70 30 0 70 30 0 70 30 0 20 80 0
M.J.P.R
aatikainenetal.
i16
by guest on January 28, 2015 Downloaded from
Lebanon LB 75 20 5 75 20 5 90 5 5 50 50 0 100 0 0
Libyaa LY N/A N/A N/A N/A N/A N/A N/A N/A N/A N/A N/A N/A N/A N/A N/A
Lithuania LT 99 1 0 100 0 0 100 0 0 100 0 0 100 0 0
Luxembourg LU 95 5 0 100 0 0 90 10 0 100 0 0 0 100 0
FYR Macedonia MK 100 0 0 100 0 0 100 0 0 100 0 0 33 67 0
Malta MT 100 0 0 100 0 0 100 0 0 100 0 0 0 0 0
Moldova MD 100 0 0 0 0 0 0 0 0 0 0 0 100 0 0
Montenegro ME 50 50 0 50 50 0 100 0 0 50 50 0 50 50 0
Morocco MA 99 1 0 99 1 0 100 0 0 N/A N/A N/A 90 10 0
Netherlands NL 90 5 5 90 5 5 95 0 5 80 0 20 90 10 0
Norway NO 100 0 0 100 0 0 100 0 0 100 0 0 100 0 0
Poland PL 99 1 0 100 0 0 100 0 0 100 0 0 80 20 0
Portugal PT 99 1 0 100 0 0 100 0 0 100 0 0 50 50 0
Romania RO 99 1 0 99 1 0 100 0 0 100 0 0 90 10 0
Russian Federation RU 70 30 0 60 40 0 50 50 0 N/A N/A N/A 50 50 0
San Marino SM 100 0 0 100 0 0 100 0 0 100 0 0 0 0 0
Serbia RS 100 0 0 100 0 0 100 0 0 100 0 0 80 20 0
Slovakia SK 65 35 0 100 0 0 100 0 0 100 0 0 98 2 0
Slovenia SI 10 90 0 5 95 0 100 0 0 50 50 0 0 100 0
Spain ES 70 25 5 81 14 5 90 10 0 N/A N/A N/A 15 85 0
Sweden SE N/A N/A N/A N/A N/A N/A N/A N/A N/A N/A N/A N/A N/A N/A N/A
Switzerland CH 90 10 0 98 2 0 95 5 0 N/A N/A N/A 40 60 0
Syriaa SY N/A N/A N/A N/A N/A N/A N/A N/A N/A N/A N/A N/A N/A N/A N/A
Tunisiaa TN N/A N/A N/A N/A N/A N/A N/A N/A N/A N/A N/A N/A N/A N/A N/A
Turkeya TR N/A N/A N/A N/A N/A N/A N/A N/A N/A N/A N/A N/A N/A N/A N/A
Ukraine UA 10 90 0 18 82 0 18 82 0 50 50 0 0 100 0
United Kingdom GB 98 2 0 98 2 0 98 2 0 100 0 0 N/A N/A N/A
aThese seven countries did not submit data for the EHRA White Book 2014.
Com
parativeanalysis
ofEHR
AW
hiteBook
data2009
–2013
i17
by guest on January 28, 2015 Downloaded from

0.30.30.3
0.50.60.7
0.81.01.01.01.01.1
1.41.51.51.5
1.71.8
2.02.42.52.62.6
3.53.63.63.63.73.83.8
3.94.04.0
4.34.4
4.54.94.9
5.25.4
6.36.8
6.97.6
9.59.7
LebanonPortugal
PolandFinlandEstonia
SloveniaCroatiaCyprus
SwedenNorway
SpainMalta
GreeceNetherlands
IcelandItaly
AustriaFrance
SwitzerlandLuxembourg
Belgium 10.1Germany 12.4
San Marino 30.8
Mean PM implanting centres = Ø 3.80
MoldovaEgypt
MoroccoAlgeria
AzerbaijanArmeniaUkraine
FYR MacedoniaRussian Federation
RomaniaBelarus
LithuaniaLatvia
KazakhstanMontenegro
Bosnia & HerzegovinaHungaryGeorgia
DenmarkBulgaria
SerbiaSlovakia
IsraelCzech Republic
IrelandUnited Kingdom
Figure 10 Number of pacemaker (PM) implanting centres per mil inhabitants in the European Society of Cardiology countries in 2013. Meannumber of implantation centres is weighted by population.
14313334
657984
110125
148154
216218224
244292
312365
431479
503515
540546552
591605
618630
646680
702716724
749763772
814850
887910912
967995996
1.0121.020
1.1521.218
GermanyBelgium
MoroccoEgypt
ArmeniaAzerbaijan
Finland
Slovenia
United KingdomNorway
Poland
FranceEstoniaAustria
SwedenIceland
Italy
Belarus
Median PM implantations = 552
Mean number of PM implantations = Ø 532
Russian Federation
Algeria
Bosnia & Herzegovina
Moldova
Lebanon
Kazakhstan
Cyprus
Romania
FYR Macedonia
GeorgiaUkraine
GreeceSpain
SwitzerlandLithuaniaPortugal
DenmarkCzech Republic
MontenegroLuxembourgSan Marino
IrelandBulgaria
IsraelCroatiaSerbiaMaltaLatvia
NetherlandsHungarySlovakia
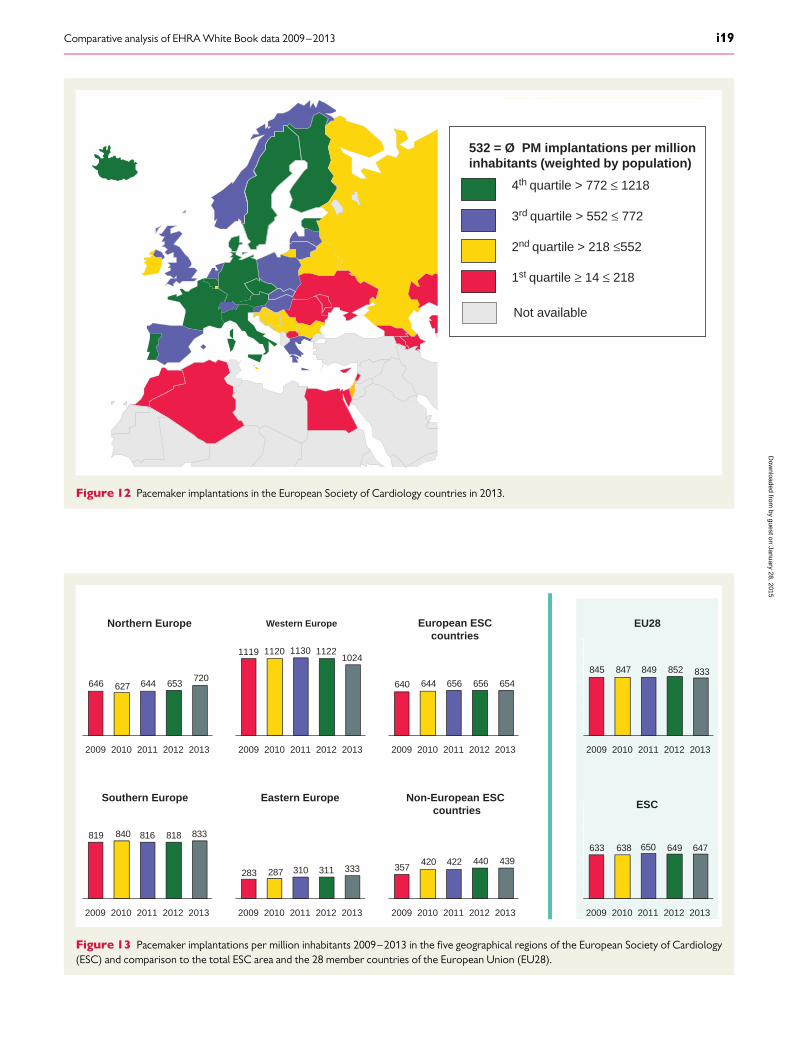
532 = Ø PM implantations per millioninhabitants (weighted by population)
1st quartile ≥ 14 ≤ 218
2nd quartile > 218 ≤552
3rd quartile > 552 ≤ 772
4th quartile > 772 ≤ 1218
Figure 11 Pacemaker (PM) implantations per million inhabitants 2013.
M.J.P. Raatikainen et al.i18
by guest on January 28, 2015D
ownloaded from
532 = Ø PM implantations per million inhabitants (weighted by population)
1st quartile ≥ 14 ≤ 218
2nd quartile > 218 ≤552
3rd quartile > 552 ≤ 772
4th quartile > 772 ≤ 1218
Not available
Figure 12 Pacemaker implantations in the European Society of Cardiology countries in 2013.
833818816840819
2013201220112009 2010
333311310287283
20132012201120102009
2013201220112009 2010
102411221120 1130
ESC
647649650638633
2012201120102009 2013
EU28
833852849847845
2010 20112009 2012 2013
Northern Europe Western Europe
Southern Europe Eastern Europe
720653644627646
20122011 201320102009
654656656644640
20102009 2011 2012 2013
European ESCcountries
439440422420357
201320112010 20122009
Non-European ESC countries
1119
Figure 13 Pacemaker implantations per million inhabitants 2009–2013 in the five geographical regions of the European Society of Cardiology(ESC) and comparison to the total ESC area and the 28 member countries of the European Union (EU28).
Comparative analysis of EHRA White Book data 2009–2013 i19
by guest on January 28, 2015D
ownloaded from
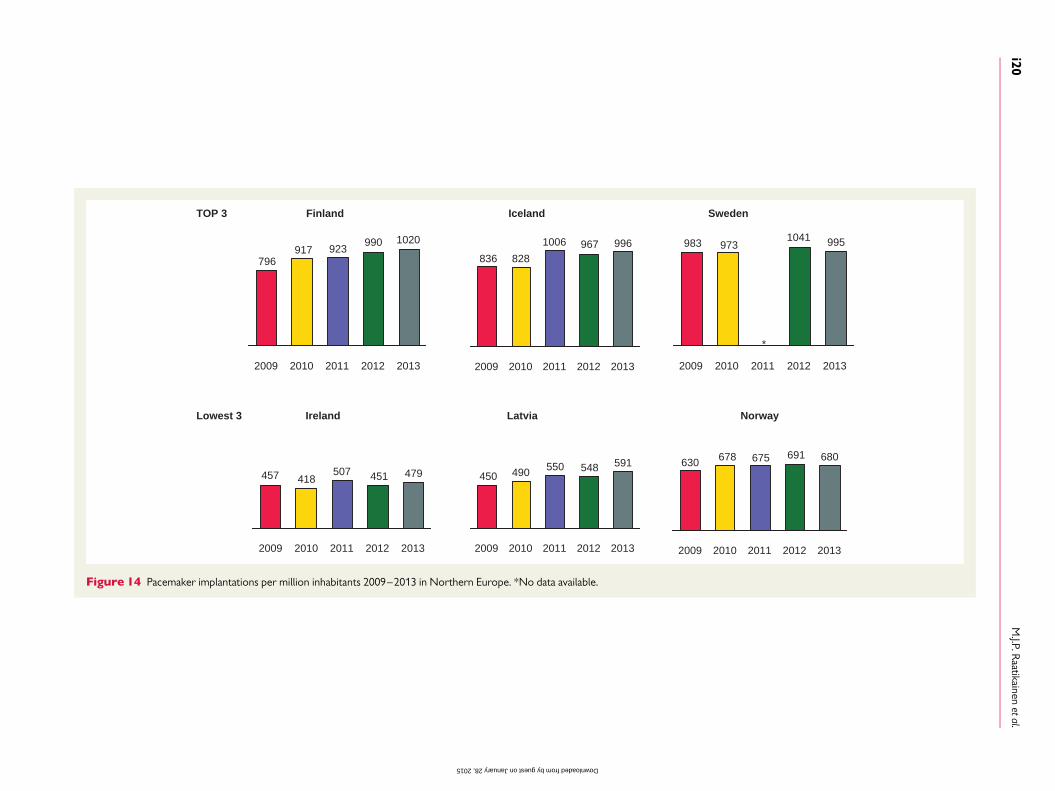
Finland
990923917
796
1020
20102009 20132011 2012
TOP 3
Lowest 3 Ireland
479451507418457
20132009 20122010 2011
Iceland
996967828836
1006
2009 2013201220112010
Latvia
591548550490450
201220102009 20132011
Sweden
995973983
20102009 2013
1041
2012
Norway
680691675678630
2011 20122010 20132009
2011
*
Figure 14 Pacemaker implantations per million inhabitants 2009–2013 in Northern Europe. *No data available.
M.J.P.R
aatikainenetal.
i20
by guest on January 28, 2015 Downloaded from

Belgium
967957950919948
20132009 2011* 20122010
TOP 3
Lowest 3 Luxembourg
365
621
336179200
20132012201120102009
Germany
2013
1152
2012
1311
2011
1313
2010
1257
2009
1248
Netherlands
605560585600
20132010 2011 20122009
Austria
838869
2013
1218
2012
1156
201120102009
Switzerland
763753791741713
20132012201120102009
*
*
Figure 15 Pacemaker implantations per million inhabitants 2009–2013 in Western Europe. *No data available.
Czech Republic
887899881849859
2010 2011 2012 20132009
TOP 3
Lowest 3 Romania
110144139117140
2013201220112009 2010
Poland
716716710719713
2010 20132011 20122009
Ukraine
14812111210385
2009 2011 20122010 2013
Slovakia
630567
617548513
2009 2012 201320112010
Russian Federation
244212216188186
2013201120102009 2012
Figure 16 Pacemaker implantations per million inhabitants 2009–2013 in Eastern Europe.
Comparative analysis of EHRA White Book data 2009–2013 i21
by guest on January 28, 2015D
ownloaded from
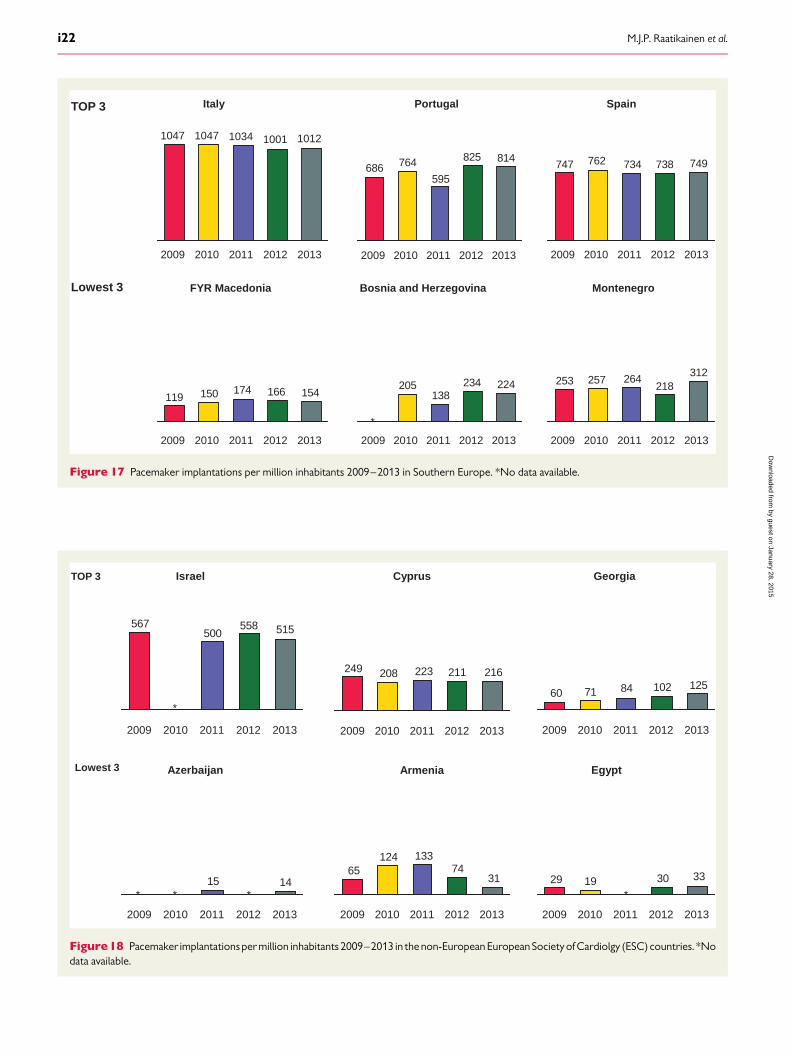
Italy
1012
2012
1001
2011
1034
2010
1047
2009
1047
2013
TOP 3
Lowest 3
Portugal
814825
595
764686
20132009 201220112010
FYR Macedonia
154166174150119
201320122009 2010 2011
Spain
749738734762747
201120102009 2012 2013
Bosnia and Herzegovina
224234138
205
2011 201320122009 2010
Montenegro
312218
264257253
20112010 20132009 2012
*
Figure 17 Pacemaker implantations per million inhabitants 2009–2013 in Southern Europe. *No data available.
Israel
515558500
567
2009 2010 20132011 2012
TOP 3
Lowest 3
Cyprus
216211223208249
20112010 201320122009
Azerbaijan
1415
20102009 2011 20132012
Georgia
125102847160
20132012201120102009
Armenia
3174
13312465
20132012201120102009
Egypt
33301929
20102009 20122011 2013
*
* ** *
Figure18 Pacemaker implantationsper million inhabitants 2009–2013 in the non-European EuropeanSocietyofCardiolgy (ESC) countries. *Nodata available.
M.J.P. Raatikainen et al.i22
by guest on January 28, 2015D
ownloaded from
. . . . . . . . . . . . . . . . . . . . . . . . . . . . . . . . . . . . . . . . . . . . . . . . . . . . . . . . . . . . . . . . . . . . . . . . . . . . . . . . . . . . . . . . . . . . . . . . . . . . . . . .
. . . . . . . . . . . . . . . . . . . . . . . . . . . . . . . . . . . . . . . . . . . . . . . . . . . . . . . . . . . . . . . . . . . . . . . . . . . . . . . . . . . . . . . . . . . . . . . . . . . . . . . . . . . . . . . . . . . . . . . . . . . . . . . . . . . . . . . . . . . . . . . . . . . . . . . . . . . . . . . . . . . . . . . . . . . . . . .
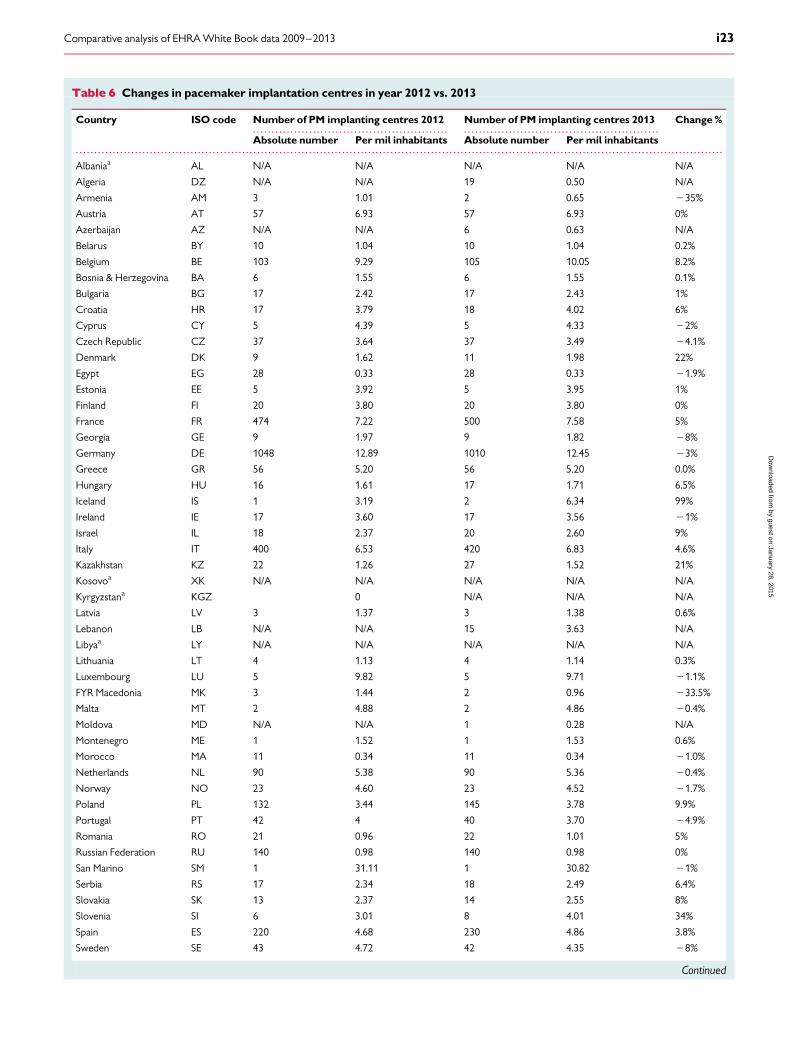
Table 6 Changes in pacemaker implantation centres in year 2012 vs. 2013
Country ISO code Number of PM implanting centres 2012 Number of PM implanting centres 2013 Change %
Absolute number Per mil inhabitants Absolute number Per mil inhabitants
Albaniaa AL N/A N/A N/A N/A N/A
Algeria DZ N/A N/A 19 0.50 N/A
Armenia AM 3 1.01 2 0.65 235%
Austria AT 57 6.93 57 6.93 0%
Azerbaijan AZ N/A N/A 6 0.63 N/A
Belarus BY 10 1.04 10 1.04 0.2%
Belgium BE 103 9.29 105 10.05 8.2%
Bosnia & Herzegovina BA 6 1.55 6 1.55 0.1%
Bulgaria BG 17 2.42 17 2.43 1%
Croatia HR 17 3.79 18 4.02 6%
Cyprus CY 5 4.39 5 4.33 22%
Czech Republic CZ 37 3.64 37 3.49 24.1%
Denmark DK 9 1.62 11 1.98 22%
Egypt EG 28 0.33 28 0.33 21.9%
Estonia EE 5 3.92 5 3.95 1%
Finland FI 20 3.80 20 3.80 0%
France FR 474 7.22 500 7.58 5%
Georgia GE 9 1.97 9 1.82 28%
Germany DE 1048 12.89 1010 12.45 23%
Greece GR 56 5.20 56 5.20 0.0%
Hungary HU 16 1.61 17 1.71 6.5%
Iceland IS 1 3.19 2 6.34 99%
Ireland IE 17 3.60 17 3.56 21%
Israel IL 18 2.37 20 2.60 9%
Italy IT 400 6.53 420 6.83 4.6%
Kazakhstan KZ 22 1.26 27 1.52 21%
Kosovoa XK N/A N/A N/A N/A N/A
Kyrgyzstana KGZ 0 N/A N/A N/A
Latvia LV 3 1.37 3 1.38 0.6%
Lebanon LB N/A N/A 15 3.63 N/A
Libyaa LY N/A N/A N/A N/A N/A
Lithuania LT 4 1.13 4 1.14 0.3%
Luxembourg LU 5 9.82 5 9.71 21.1%
FYR Macedonia MK 3 1.44 2 0.96 233.5%
Malta MT 2 4.88 2 4.86 20.4%
Moldova MD N/A N/A 1 0.28 N/A
Montenegro ME 1 1.52 1 1.53 0.6%
Morocco MA 11 0.34 11 0.34 21.0%
Netherlands NL 90 5.38 90 5.36 20.4%
Norway NO 23 4.60 23 4.52 21.7%
Poland PL 132 3.44 145 3.78 9.9%
Portugal PT 42 4 40 3.70 24.9%
Romania RO 21 0.96 22 1.01 5%
Russian Federation RU 140 0.98 140 0.98 0%
San Marino SM 1 31.11 1 30.82 21%
Serbia RS 17 2.34 18 2.49 6.4%
Slovakia SK 13 2.37 14 2.55 8%
Slovenia SI 6 3.01 8 4.01 34%
Spain ES 220 4.68 230 4.86 3.8%
Sweden SE 43 4.72 42 4.35 28%
Continued
Comparative analysis of EHRA White Book data 2009–2013 i23
by guest on January 28, 2015D
ownloaded from
standards for theoretical and practical training for all healthcare pro-fessionals, regardless of their country of origin.
Pacemakers
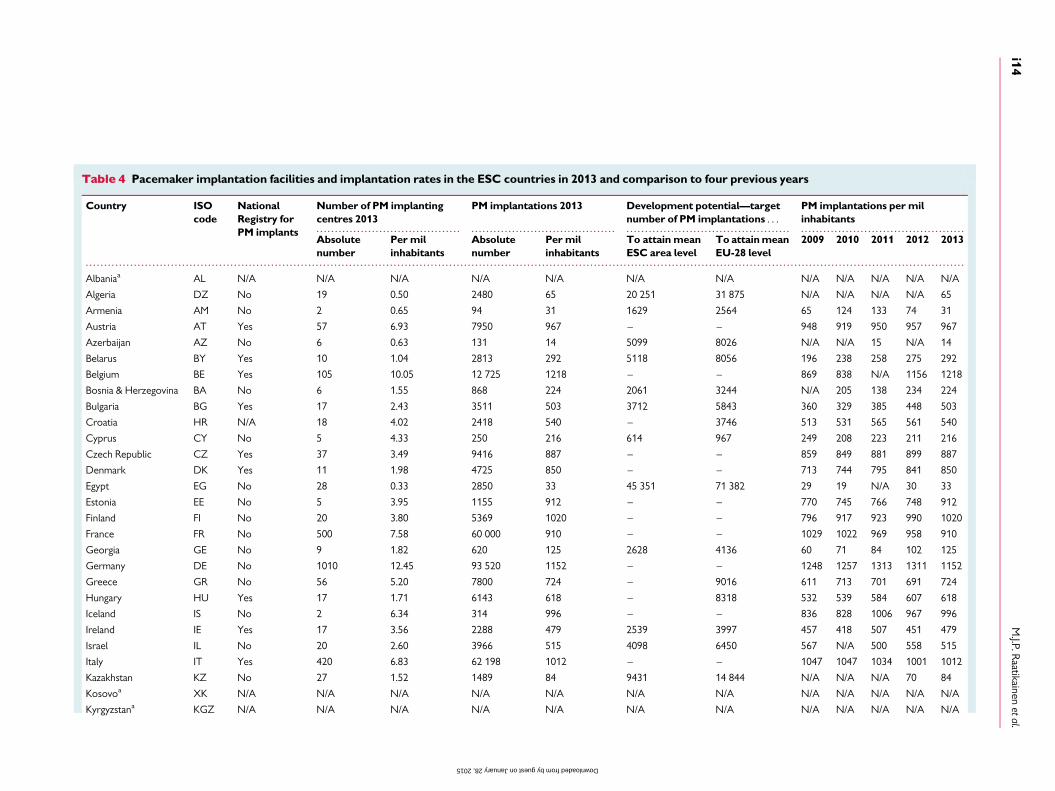
General informationThe 49 countries (88% of all ESC member countries) that submittedthe requested data on PM implantation for the EHRA White Book
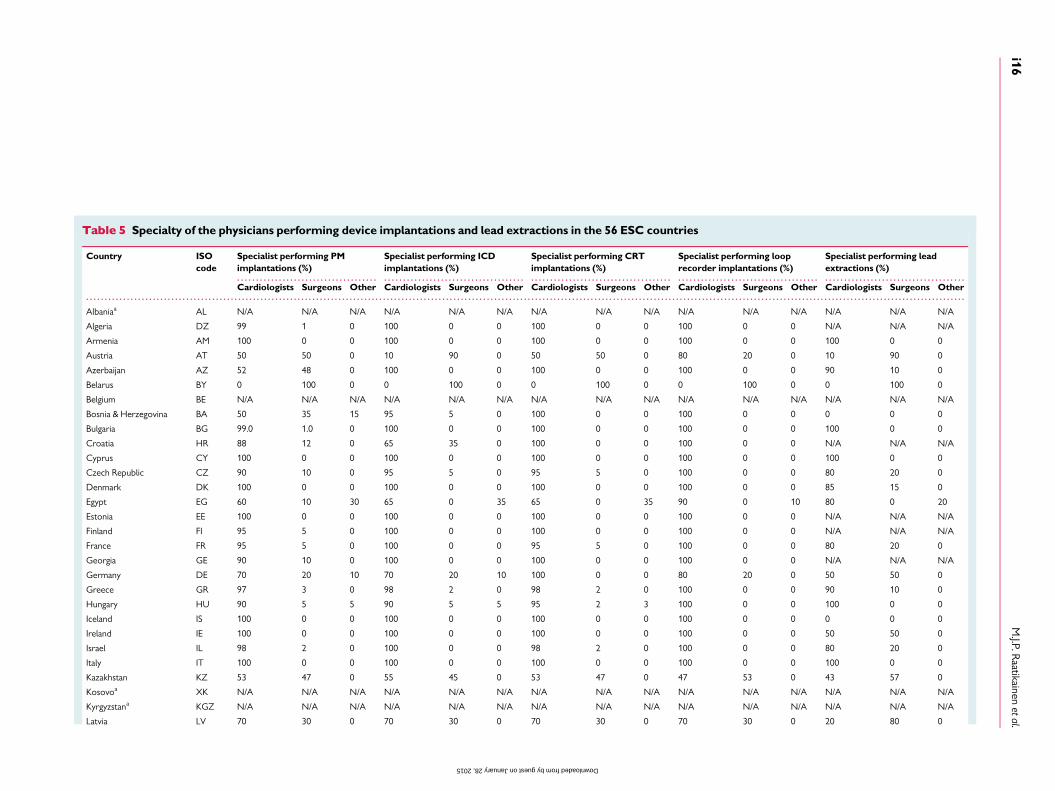
are listed in Table 4. According to the EHRA White Book,808 667 710 people lived in these countries. A national registryfor PM implantations existed in 26 countries (Table 4). The vast major-ity of implants were performed by cardiologists (82%), and the remain-ing implantations were performed by physicians with various trainingbackgrounds, including surgeons, anaesthesiologists, paediatricians,and internists. In some countries (Austria, Belarus, Bosnia and Herze-govina, Montenegro, Russian Federation, Slovenia, and Ukraine), theproportion of implanting cardiologists was 50% or less (Table 5).
. . . . . . . . . . . . . . . . . . . . . . . . . . . . . . . . . . . . . . . . . . . . . . . . . . . . . . . . . . . . . . . . . . . . . . . . . . . . . . . . . . . . . . . . . . . . . . . . . . . . . . . .
. . . . . . . . . . . . . . . . . . . . . . . . . . . . . . . . . . . . . . . . . . . . . . . . . . . . . . . . . . . . . . . . . . . . . . . . . . . . . . . . . . . . . . . . . . . . . . . . . . . . . . . . . . . . . . . . . . . . . . . . . . . . . . . . . . . . . . . . . . . . . . . . . . . . . . . . . . . . . . . . . . . . . . . . . . . . . . .
Table 6 Continued
Country ISO code Number of PM implanting centres 2012 Number of PM implanting centres 2013 Change %
Absolute number Per mil inhabitants Absolute number Permil inhabitants
Switzerland CH 74 9.34 76 9.50 2%
Syriaa SY N/A N/A N/A N/A N/A
Tunisiaa TN 10 1 N/A N/A N/A
Turkeya TR N/A N/A N/A N/A N/A
Ukraine UA 36 0.79 36 0.81 2%
United Kingdom GB 205 3.25 227 3.58 10%
Total ESC countries 56
aThese seven countries did not submit data for the EHRA White Book 2014.
1.01.4
4.72.0
3.93.6
12.90.3
4.64.4
3.69.8
0.3
5.44.9
3.85.2
6.91.0
1.51.01.11.51.4
3.92.4
9.30.8
4.76.5
7.21.0
3.82.3
1.62.4
9.32.4
3.43.3
1.31.6
3.03.2
DenmarkSlovenia
Iceland
Kazakhstan
2012
ArmeniaFYR Macedonia
SwedenGeorgiaPortugal
Czech RepublicGermany
EgyptNorwayCyprusIreland
LuxembourgMorocco
San Marino 31.1Netherlands
MaltaFinlandGreeceAustria
Russian FederationBosnia & Herzegovina
BelarusLithuania
MontenegroLatvia
EstoniaBulgaria
SwitzerlandUkraine
SpainItaly
FranceRomania
CroatiaSerbia
HungarySlovakiaBelgium
IsraelPoland
United Kingdom
–35.4–33.5
–7.8–7.5–4.9–4.1–3.4–1.9–1.7–1.5–1.1–1.1–1.0–0.9–0.4–0.4–0.10.00.0
0.00.10.20.30.60.60.70.81.81.93.84.65.05.06.06.46.57.68.29.49.910.1
21.221.9
33.698.7
2013 vs. 2012 in %
0.71.0
4.41.8
3.73.5
12.40.3
4.54.3
3.69.7
0.3
5.44.9
3.85.2
6.91.0
1.51.01.11.51.4
3.92.4
9.50.8
4.96.8
7.61.0
4.02.5
1.72.6
10.12.6
3.83.6
1.52.0
4.06.3
30.8
2013
Figure 19 Change in the number of pacemaker implanting centres per million inhabitants 2012 to 2013.
M.J.P. Raatikainen et al.i24
by guest on January 28, 2015D
ownloaded from
. . . . . . . . . . . . . . . . . . . . . . . . . . . . . . . . . . . . . . . . . . . . . . . . . . . . . . . . . . . . . . . . . . . . . . . . . . . . . . . . . . . . . . . . . . . . . . . . . . . . . . . . . . . .
. . . . . . . . . . . . . . . . . . . . . . . . . . . . . . . . . . . . . . . . . . . . . . . . . . . . . . . . . . . . . . . . . . . . . . . . . . . . . . . . . . . . . . . . . . . . . . . . . . . . . . . . . . . . . . . . . . . . . . . . . . . . . . . . . . . . . . . . . . . . . . . . . . . . . . . . . . . . . . . . . . . . . . . . . . . . . . .
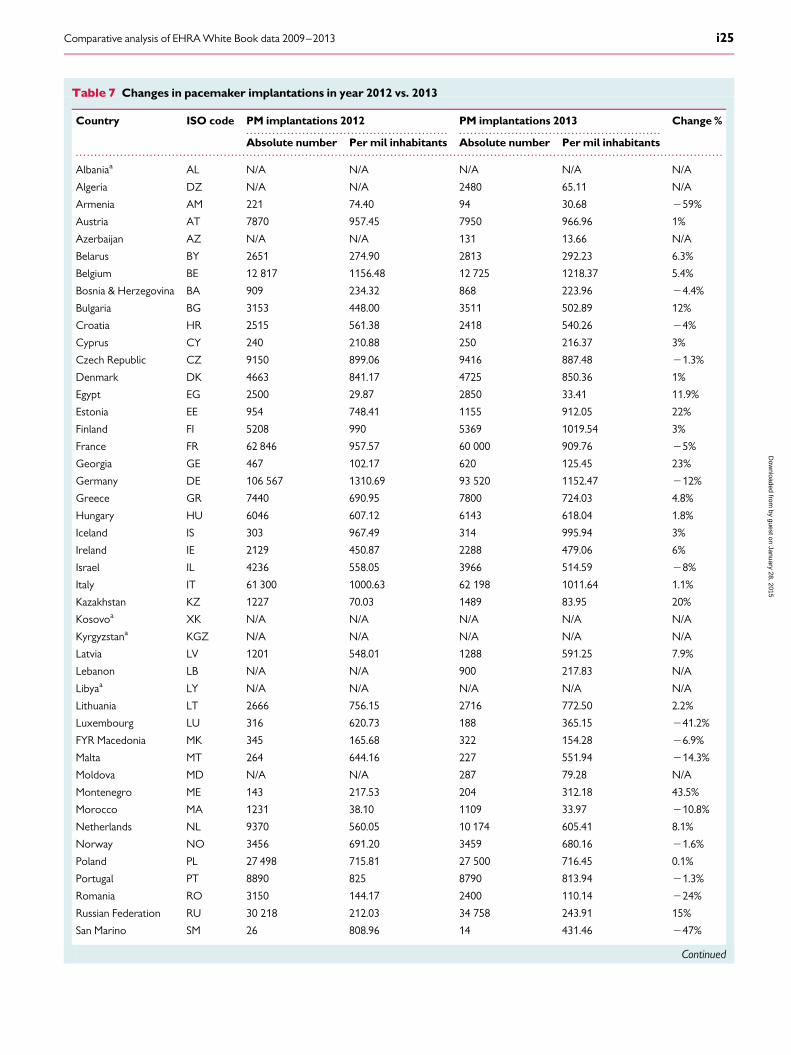
Table 7 Changes in pacemaker implantations in year 2012 vs. 2013
Country ISO code PM implantations 2012 PM implantations 2013 Change %
Absolute number Per mil inhabitants Absolute number Per mil inhabitants
Albaniaa AL N/A N/A N/A N/A N/A
Algeria DZ N/A N/A 2480 65.11 N/A
Armenia AM 221 74.40 94 30.68 259%
Austria AT 7870 957.45 7950 966.96 1%
Azerbaijan AZ N/A N/A 131 13.66 N/A
Belarus BY 2651 274.90 2813 292.23 6.3%
Belgium BE 12 817 1156.48 12 725 1218.37 5.4%
Bosnia & Herzegovina BA 909 234.32 868 223.96 24.4%
Bulgaria BG 3153 448.00 3511 502.89 12%
Croatia HR 2515 561.38 2418 540.26 24%
Cyprus CY 240 210.88 250 216.37 3%
Czech Republic CZ 9150 899.06 9416 887.48 21.3%
Denmark DK 4663 841.17 4725 850.36 1%
Egypt EG 2500 29.87 2850 33.41 11.9%
Estonia EE 954 748.41 1155 912.05 22%
Finland FI 5208 990 5369 1019.54 3%
France FR 62 846 957.57 60 000 909.76 25%
Georgia GE 467 102.17 620 125.45 23%
Germany DE 106 567 1310.69 93 520 1152.47 212%
Greece GR 7440 690.95 7800 724.03 4.8%
Hungary HU 6046 607.12 6143 618.04 1.8%
Iceland IS 303 967.49 314 995.94 3%
Ireland IE 2129 450.87 2288 479.06 6%
Israel IL 4236 558.05 3966 514.59 28%
Italy IT 61 300 1000.63 62 198 1011.64 1.1%
Kazakhstan KZ 1227 70.03 1489 83.95 20%
Kosovoa XK N/A N/A N/A N/A N/A
Kyrgyzstana KGZ N/A N/A N/A N/A N/A
Latvia LV 1201 548.01 1288 591.25 7.9%
Lebanon LB N/A N/A 900 217.83 N/A
Libyaa LY N/A N/A N/A N/A N/A
Lithuania LT 2666 756.15 2716 772.50 2.2%
Luxembourg LU 316 620.73 188 365.15 241.2%
FYR Macedonia MK 345 165.68 322 154.28 26.9%
Malta MT 264 644.16 227 551.94 214.3%
Moldova MD N/A N/A 287 79.28 N/A
Montenegro ME 143 217.53 204 312.18 43.5%
Morocco MA 1231 38.10 1109 33.97 210.8%
Netherlands NL 9370 560.05 10 174 605.41 8.1%
Norway NO 3456 691.20 3459 680.16 21.6%
Poland PL 27 498 715.81 27 500 716.45 0.1%
Portugal PT 8890 825 8790 813.94 21.3%
Romania RO 3150 144.17 2400 110.14 224%
Russian Federation RU 30 218 212.03 34 758 243.91 15%
San Marino SM 26 808.96 14 431.46 247%
Continued
Comparative analysis of EHRA White Book data 2009–2013 i25
by guest on January 28, 2015D
ownloaded from
. . . . . . . . . . . . . . . . . . . . . . . . . . . . . . . . . . . . . . . . . . . . . . . . . . . . . . . . . . . . . . . . . . . . . . . . . . . . . . . . . . . . . . . . . . . . . . . . . . . . . . . . . . . .
. . . . . . . . . . . . . . . . . . . . . . . . . . . . . . . . . . . . . . . . . . . . . . . . . . . . . . . . . . . . . . . . . . . . . . . . . . . . . . . . . . . . . . . . . . . . . . . . . . . . . . . . . . . . . . . . . . . . . . . . . . . . . . . . . . . . . . . . . . . . . . . . . . . . . . . . . . . . . . . . . . . . . . . . . . . . . . .
Table 7 Continued
Country ISO code PM implantations 2012 PM implantations 2013 Change %
Absolute number Per mil inhabitants Absolute number Per mil inhabitants
Serbia RS 3139 431.38 3958 546.46 26.7%
Slovakia SK 3111 567.38 3456 629.70 11%
Slovenia SI 1333 667.63 1287 645.86 23%
Spain ES 34 710 737.84 35 500 749.41 1.6%
Sweden SE 9476 1040.89 9602 995.30 24%
Switzerland CH 5965 752.63 6097 762.50 1%
Syriaa SY N/A N/A N/A N/A N/A
Tunisiaa TN 2500 233 N/A N/A N/A
Turkeya TR N/A N/A N/A N/A N/A
Ukraine UA 5491 120.90 6579 147.60 22%
United Kingdom GB 38 770 614.94 44 503 701.99 14%
aThese seven countries did not submit data on PM implantations for the EHRA White Book 2014.
74.4
38.1
29.9
70.0
558.0FYR Macedonia 165.7
France 957.6Bosnia & Herzegovina 234.3
Sweden 1.040.9Croatia 561.4
Slovenia 667.6Norway 691.2
Portugal 824.6Czech Republic 899.1
Poland 715.8Austria 957.5
Denmark 841.2Italy 1.000.6
Switzerland 752.6Spain 737.8
Hungary 607.1Lithuania 756.1
Cyprus 210.9Iceland 967.5Finland 989.6Greece 690.9
Belgium 1.156.5Ireland 450.9
Belarus 274.9Latvia 548.0
Netherlands 560.1Slovakia
809.0620.7
2012
Romania 144.2Malta 644.2
Germany 1.310.7Morocco
Israel
567.4Egypt
Bulgaria 448.0United Kingdom 614.9
Russian Federation 212.0Kazakhstan
Estonia 748.4Ukraine 120.9Georgia 102.2
Serbia 431.4Montenegro 217.5
LuxembourgSan Marino
Armenia –58.8–46.7
–41.2–23.6
–14.3–12.1–10.8
–7.8–6.9–5.0–4.4–4.4–3.8–3.3–1.6–1.3–1.3
0.11.01.11.11.31.61.82.22.62.93.04.85.46.36.37.98.111.011.912.314.215.0
19.921.922.122.826.7
43.5
2013 vs. 2012 in %
30.7
34.0
33.4
83.9
431.5365.1
749.4618.0
772.5216.4
995.91.019.5
2013
110.1551.9
1.152.5
514.6154.3
909.8224.0
995.3540.3
645.9680.2
813.9887.5
716.4967.0
850.41.011.6
762.5
724.01.218.4
479.1292.2
591.2605.4629.7
502.9702.0
243.9
912.1147.6125.5
546.5312.2
Figure 20 Change in the number of pacemaker implantations per million inhabitants 2012 to 2013.
M.J.P. Raatikainen et al.i26
by guest on January 28, 2015D
ownloaded from
2012
Armenia 64.6San Marino 466.7
Luxembourg 428.2Romania 141.9
Malta 517.3Italy 729.7
FYR Macedonia 132.5Morocco 37.1
Bosnia & Herzegovina 234.3Croatia 489.1Norway 535.6Sweden 734.5France 766.1
Czech Republic 629.8Hungary 476.2
Poland 572.1Denmark 634.3
United Kingdom 509.5Austria 694.5
Lithuania 636.7Switzerland 557.3
Greece 511.2Belarus 241.5
Portugal 630.0Netherlands 420.2
Finland 751.7Latvia 432.1
Slovenia 515.9Belgium 797.6Slovakia 470.4
Russian Federation 179.1Kazakhstan 67.0
Estonia 670.0Ukraine 101.9Bulgaria 348.3
Serbia 402.1Iceland 514.1
Montenegro 181.0
–9.0–5.2–4.2–3.3–1.0–1.0
0.00.20.50.81.82.83.54.44.54.75.75.75.85.97.49.913.317.518.021.523.8
2013 vs. 2012
–70.2–47.2–43.3
–35.3–32.8
–22.4–13.2–11.8
25.859.864.0
2013
19.3246.5242.8
91.8347.7
566.5115.0
32.7213.1
463.6513.2
710.5758.1
623.5476.2
573.2637.6
513.7707.2
654.7577.0
533.7252.4
659.7444.1
794.5457.2
546.5856.5
516.9203.0
78.7790.4
123.9431.3
505.9821.5
296.9
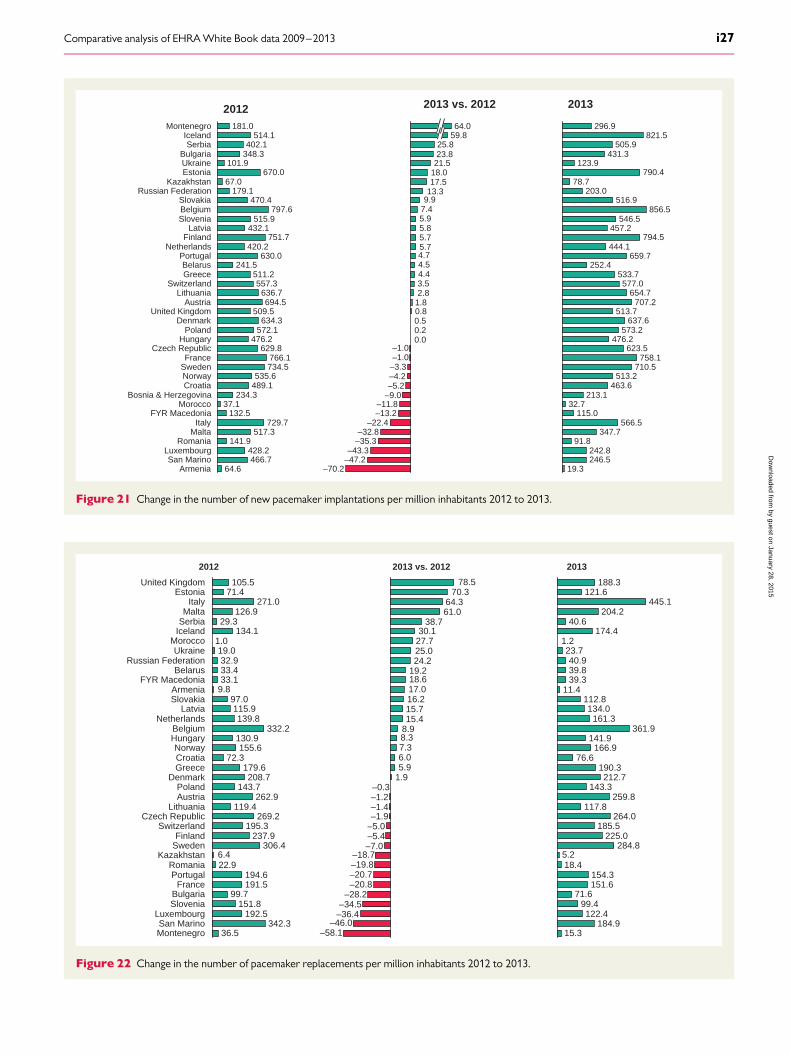
Figure 21 Change in the number of new pacemaker implantations per million inhabitants 2012 to 2013.
6.4
9.8
1.0
Malta 126.9Italy 271.0
Estonia
32.9Ukraine
33.4Belarus33.1
Netherlands
97.0Slovakia115.9
FYR MacedoniaArmenia
19.0
71.4United Kingdom 105.5
29.3
Hungary155.6Norway
332.2Belgium130.9
Latvia139.8
Russian Federation
Morocco
Serbia134.1Iceland
Montenegro 36.5San Marino 342.3
Luxembourg 192.5Slovenia 151.8Bulgaria 99.7France 191.5
Portugal 194.6Romania 22.9
2012
KazakhstanSweden 306.4Finland 237.9
Switzerland 195.3Czech Republic 269.2
Lithuania 119.4Austria 262.9Poland 143.7
Denmark 208.7Greece 179.6Croatia 72.3
–58.1–46.0
–36.4–34.5
–28.2–20.8–20.7–19.8–18.7
–7.0–5.4–5.0–1.9–1.4–1.2–0.3
1.95.96.07.38.38.915.415.716.217.018.619.224.225.027.730.1
38.761.064.3
70.378.5
2013 vs. 2012
5.2
1.2
161.3361.9
141.9166.9
76.6
2013
15.3184.9
122.499.4
71.6151.6154.3
18.4
284.8225.0
185.5
134.0
117.8264.0
190.3212.7
143.3
121.6
23.7
445.1
112.811.4
204.2
188.3
39.8
174.4
40.9
40.6
39.3
259.8
Figure 22 Change in the number of pacemaker replacements per million inhabitants 2012 to 2013.
Comparative analysis of EHRA White Book data 2009–2013 i27
by guest on January 28, 2015D
ownloaded from
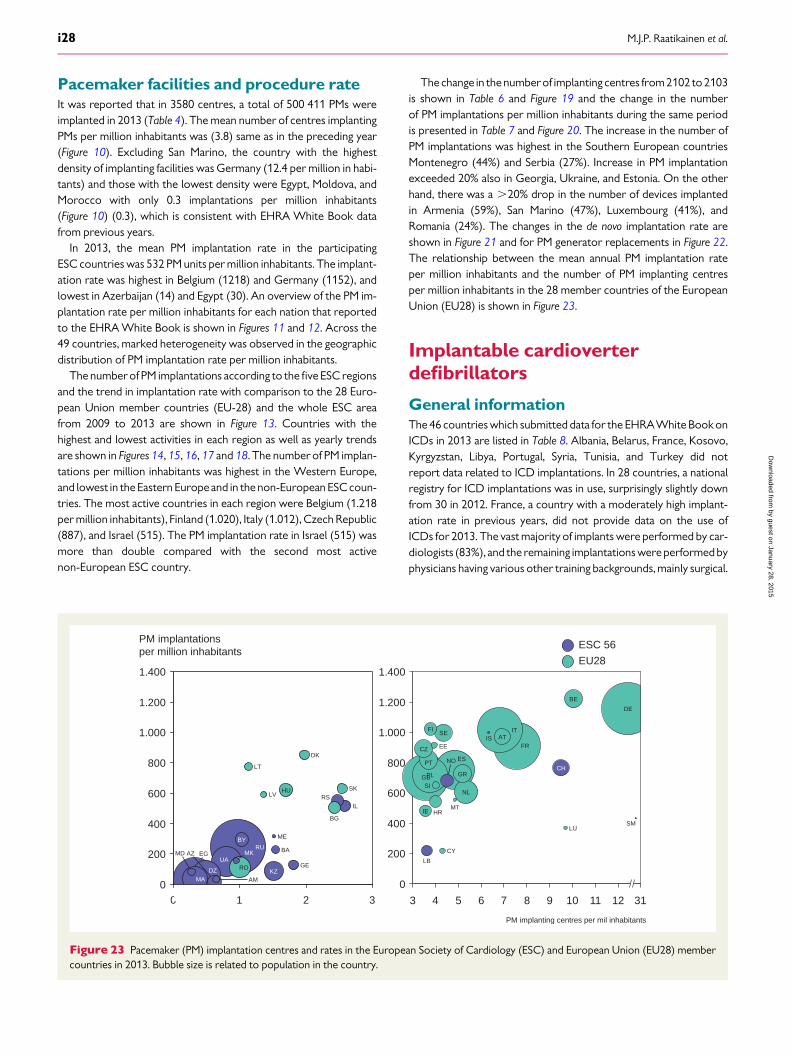
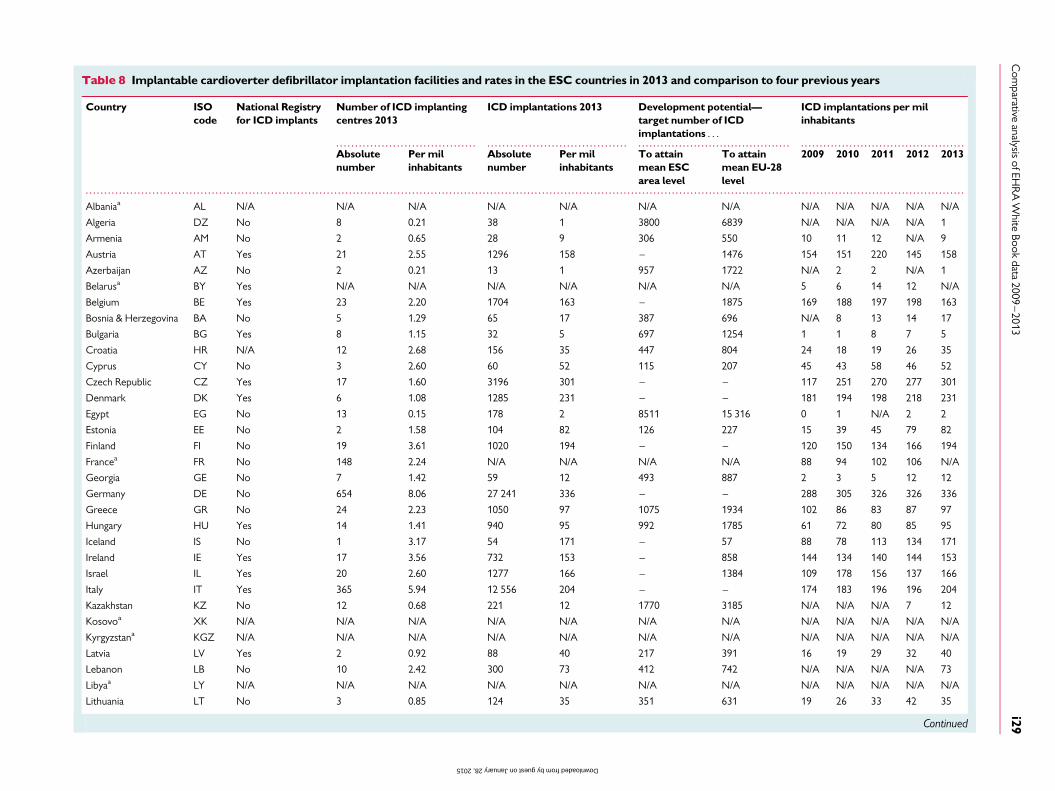
Pacemaker facilities and procedure rateIt was reported that in 3580 centres, a total of 500 411 PMs wereimplanted in 2013 (Table 4). The mean number of centres implantingPMs per million inhabitants was (3.8) same as in the preceding year(Figure 10). Excluding San Marino, the country with the highestdensity of implanting facilities was Germany (12.4 per million in habi-tants) and those with the lowest density were Egypt, Moldova, andMorocco with only 0.3 implantations per million inhabitants(Figure 10) (0.3), which is consistent with EHRA White Book datafrom previous years.
In 2013, the mean PM implantation rate in the participatingESC countries was 532 PM units per million inhabitants. The implant-ation rate was highest in Belgium (1218) and Germany (1152), andlowest in Azerbaijan (14) and Egypt (30). An overview of the PM im-plantation rate per million inhabitants for each nation that reportedto the EHRA White Book is shown in Figures 11 and 12. Across the49 countries, marked heterogeneity was observed in the geographicdistribution of PM implantation rate per million inhabitants.
The number of PM implantations according to the five ESC regionsand the trend in implantation rate with comparison to the 28 Euro-pean Union member countries (EU-28) and the whole ESC areafrom 2009 to 2013 are shown in Figure 13. Countries with thehighest and lowest activities in each region as well as yearly trendsare shown in Figures 14, 15, 16, 17 and 18. The number of PM implan-tations per million inhabitants was highest in the Western Europe,and lowest in the Eastern Europeand in the non-European ESC coun-tries. The most active countries in each region were Belgium (1.218per million inhabitants), Finland (1.020), Italy (1.012), Czech Republic(887), and Israel (515). The PM implantation rate in Israel (515) wasmore than double compared with the second most activenon-European ESC country.
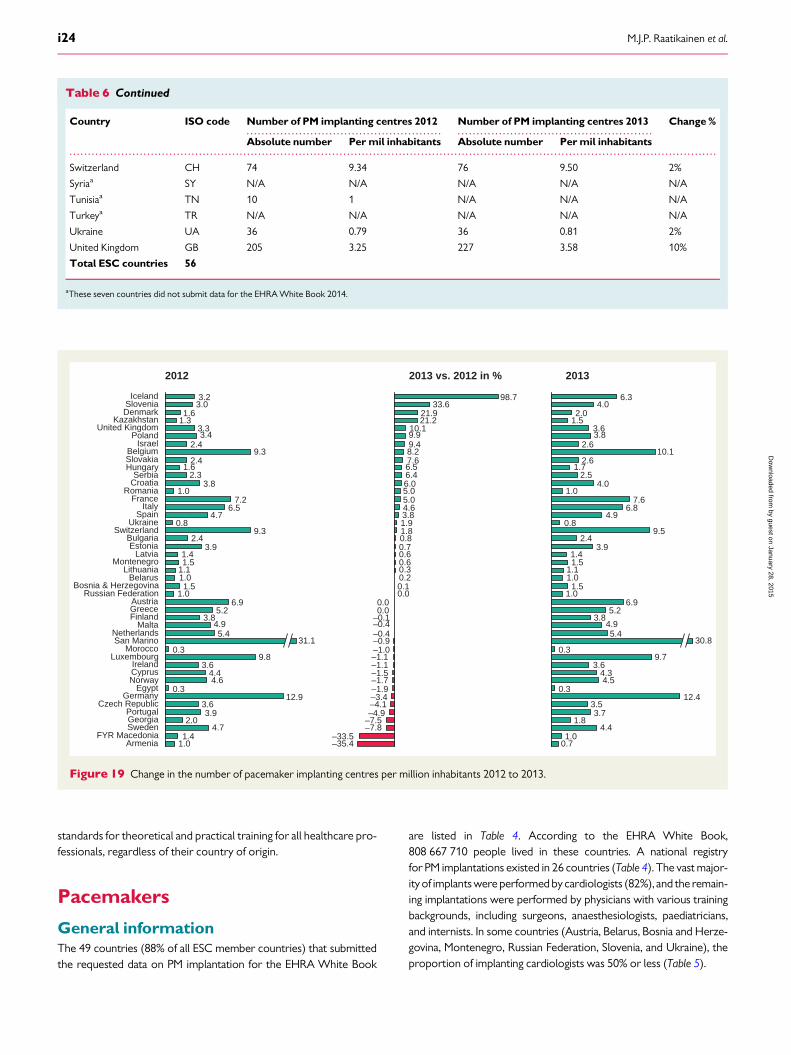
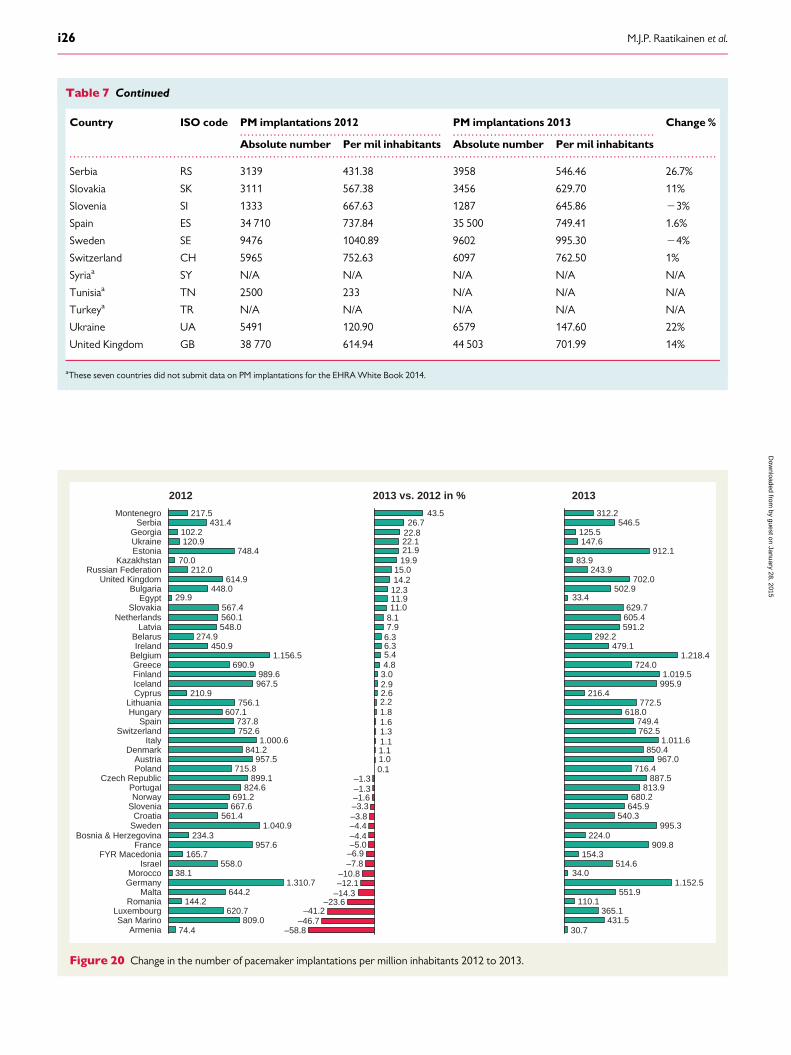
The change in the numberof implanting centres from2102 to 2103is shown in Table 6 and Figure 19 and the change in the numberof PM implantations per million inhabitants during the same periodis presented in Table 7 and Figure 20. The increase in the number ofPM implantations was highest in the Southern European countriesMontenegro (44%) and Serbia (27%). Increase in PM implantationexceeded 20% also in Georgia, Ukraine, and Estonia. On the otherhand, there was a .20% drop in the number of devices implantedin Armenia (59%), San Marino (47%), Luxembourg (41%), andRomania (24%). The changes in the de novo implantation rate areshown in Figure 21 and for PM generator replacements in Figure 22.The relationship between the mean annual PM implantation rateper million inhabitants and the number of PM implanting centresper million inhabitants in the 28 member countries of the EuropeanUnion (EU28) is shown in Figure 23.
Implantable cardioverterdefibrillators
General informationThe 46 countries which submitted data for the EHRAWhite Book onICDs in 2013 are listed in Table 8. Albania, Belarus, France, Kosovo,Kyrgyzstan, Libya, Portugal, Syria, Tunisia, and Turkey did notreport data related to ICD implantations. In 28 countries, a nationalregistry for ICD implantations was in use, surprisingly slightly downfrom 30 in 2012. France, a country with a moderately high implant-ation rate in previous years, did not provide data on the use ofICDs for 2013. The vast majority of implants were performed by car-diologists (83%), and the remaining implantations wereperformed byphysicians having various other training backgrounds, mainly surgical.
0
200
400
600
800
1.000
1.200
1.400
4 10 11 123 95 6 7 8 31
PM implanting centres per mil inhabitants
ES
MT
GR
EE
FI
PL
PT
LB
ISIT
ATFR
CH
SE
BE
DE
SM
CY
HR
NO
SIGB
IE
CZ
NL
LU
0
200
400
600
800
1.000
1.200
1.400
0 1 2 3
MD EG
MADZ
AZ
RSSK
IL
BG
DK
UAMK
RU
RO
BY
LT
LV
KZ
ME
BA
HU
GE
AM
PM implantationsper million inhabitants
EU28
ESC 56
Figure 23 Pacemaker (PM) implantation centres and rates in the European Society of Cardiology (ESC) and European Union (EU28) membercountries in 2013. Bubble size is related to population in the country.
M.J.P. Raatikainen et al.i28
by guest on January 28, 2015D
ownloaded from
. . . . . . . . . . . . . . . . . . . . . . . . . . . . . . . . . . . . . . . . . . . . . . . . . . . . . . . . . . . . . . . . . . . . . . . . . . . . . . . . . . . . . . . . . . . . . . . . . . . . . . . . . . . . . . . . . . . . . . . . . . . . . . . . . . . . . . . . . . . . . . . . . . . . . . . . . . . . . . .
. . . . . . . . . . . . . . . . . . . . . . . . . . . . . . . . . . . . . . . . . . . . . . . . . . . . . . . . . . . . . . . . . . . . . . . . . . . . . . . . . . . . . . . . . . . . . . . . . . . . . . . . . . . . . . . . . . . . . . . . . . . . . . . . . . . . . . . . . . . . . . . . . . . . . . . . . . . . . . . . . . . . . . . . . . . . . . . . . . . . . . . . . . . . . . . . . . . . . . . . . . . . . . . . . . . . . . . . . . . . . . . . . . . . . . . . . . . . .
Table 8 Implantable cardioverter defibrillator implantation facilities and rates in the ESC countries in 2013 and comparison to four previous years
Country ISOcode
National Registryfor ICD implants
Number of ICD implantingcentres 2013
ICD implantations 2013 Development potential—target number of ICDimplantations . . .
ICD implantations per milinhabitants
Absolutenumber
Per milinhabitants
Absolutenumber
Per milinhabitants
To attainmean ESCarea level
To attainmean EU-28level
2009 2010 2011 2012 2013
Albaniaa AL N/A N/A N/A N/A N/A N/A N/A N/A N/A N/A N/A N/A
Algeria DZ No 8 0.21 38 1 3800 6839 N/A N/A N/A N/A 1
Armenia AM No 2 0.65 28 9 306 550 10 11 12 N/A 9
Austria AT Yes 21 2.55 1296 158 – 1476 154 151 220 145 158
Azerbaijan AZ No 2 0.21 13 1 957 1722 N/A 2 2 N/A 1
Belarusa BY Yes N/A N/A N/A N/A N/A N/A 5 6 14 12 N/A
Belgium BE Yes 23 2.20 1704 163 – 1875 169 188 197 198 163
Bosnia & Herzegovina BA No 5 1.29 65 17 387 696 N/A 8 13 14 17
Bulgaria BG Yes 8 1.15 32 5 697 1254 1 1 8 7 5
Croatia HR N/A 12 2.68 156 35 447 804 24 18 19 26 35
Cyprus CY No 3 2.60 60 52 115 207 45 43 58 46 52
Czech Republic CZ Yes 17 1.60 3196 301 – – 117 251 270 277 301
Denmark DK Yes 6 1.08 1285 231 – – 181 194 198 218 231
Egypt EG No 13 0.15 178 2 8511 15 316 0 1 N/A 2 2
Estonia EE No 2 1.58 104 82 126 227 15 39 45 79 82
Finland FI No 19 3.61 1020 194 – – 120 150 134 166 194
Francea FR No 148 2.24 N/A N/A N/A N/A 88 94 102 106 N/A
Georgia GE No 7 1.42 59 12 493 887 2 3 5 12 12
Germany DE No 654 8.06 27 241 336 – – 288 305 326 326 336
Greece GR No 24 2.23 1050 97 1075 1934 102 86 83 87 97
Hungary HU Yes 14 1.41 940 95 992 1785 61 72 80 85 95
Iceland IS No 1 3.17 54 171 – 57 88 78 113 134 171
Ireland IE Yes 17 3.56 732 153 – 858 144 134 140 144 153
Israel IL Yes 20 2.60 1277 166 – 1384 109 178 156 137 166
Italy IT Yes 365 5.94 12 556 204 – – 174 183 196 196 204
Kazakhstan KZ No 12 0.68 221 12 1770 3185 N/A N/A N/A 7 12
Kosovoa XK N/A N/A N/A N/A N/A N/A N/A N/A N/A N/A N/A N/A
Kyrgyzstana KGZ N/A N/A N/A N/A N/A N/A N/A N/A N/A N/A N/A N/A
Latvia LV Yes 2 0.92 88 40 217 391 16 19 29 32 40
Lebanon LB No 10 2.42 300 73 412 742 N/A N/A N/A N/A 73
Libyaa LY N/A N/A N/A N/A N/A N/A N/A N/A N/A N/A N/A N/A
Lithuania LT No 3 0.85 124 35 351 631 19 26 33 42 35
Continued
Com
parativeanalysis
ofEHR
AW
hiteBook
data2009
–2013
i29
by guest on January 28, 2015 Downloaded from
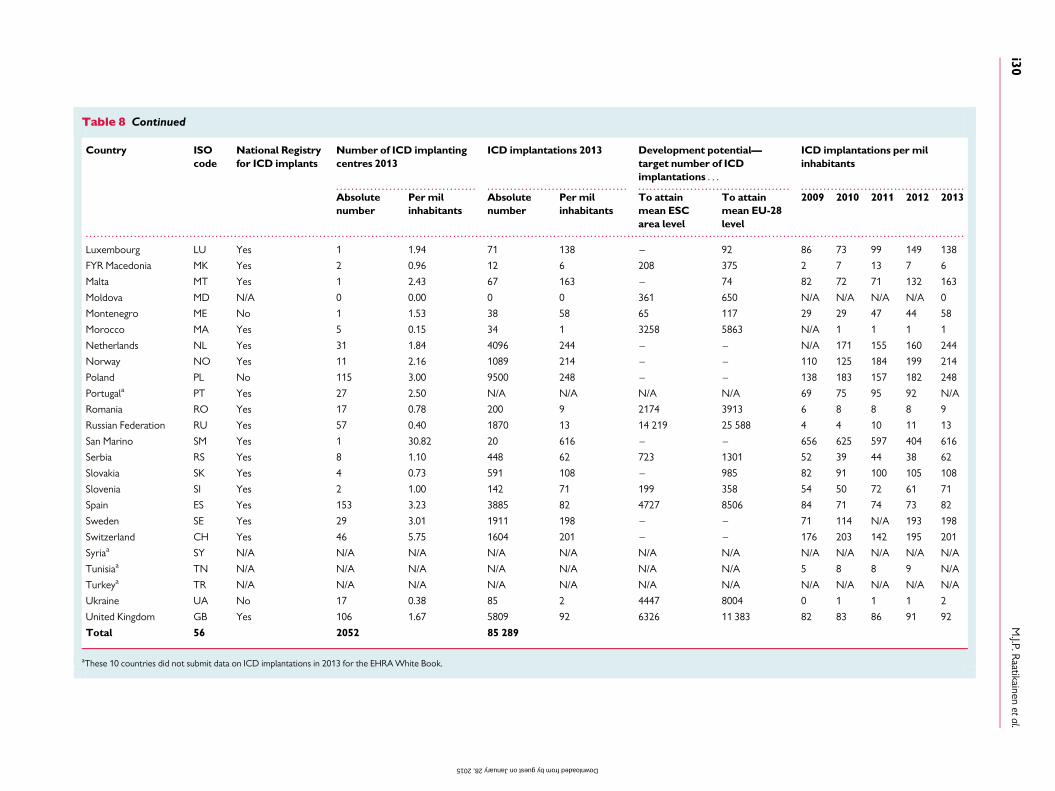
. . . . . . . . . . . . . . . . . . . . . . . . . . . . . . . . . . . . . . . . . . . . . . . . . . . . . . . . . . . . . . . . . . . . . . . . . . . . . . . . . . . . . . . . . . . . . . . . . . . . . . . . . . . . . . . . . . . . . . . . . . . . . . . . . . . . . . . . . . . . . . . . . . . . . . . . . . . . . . .
. . . . . . . . . . . . . . . . . . . . . . . . . . . . . . . . . . . . . . . . . . . . . . . . . . . . . . . . . . . . . . . . . . . . . . . . . . . . . . . . . . . . . . . . . . . . . . . . . . . . . . . . . . . . . . . . . . . . . . . . . . . . . . . . . . . . . . . . . . . . . . . . . . . . . . . . . . . . . . . . . . . . . . . . . . . . . . . . . . . . . . . . . . . . . . . . . . . . . . . . . . . . . . . . . . . . . . . . . . . . . . . . . . . . . . . . . . . . .
Table 8 Continued
Country ISOcode
National Registryfor ICD implants
Number of ICD implantingcentres 2013
ICD implantations 2013 Development potential—target number of ICDimplantations . . .
ICD implantations per milinhabitants
Absolutenumber
Per milinhabitants
Absolutenumber
Per milinhabitants
To attainmean ESCarea level
To attainmean EU-28level
2009 2010 2011 2012 2013
Luxembourg LU Yes 1 1.94 71 138 – 92 86 73 99 149 138
FYR Macedonia MK Yes 2 0.96 12 6 208 375 2 7 13 7 6
Malta MT Yes 1 2.43 67 163 – 74 82 72 71 132 163
Moldova MD N/A 0 0.00 0 0 361 650 N/A N/A N/A N/A 0
Montenegro ME No 1 1.53 38 58 65 117 29 29 47 44 58
Morocco MA Yes 5 0.15 34 1 3258 5863 N/A 1 1 1 1
Netherlands NL Yes 31 1.84 4096 244 – – N/A 171 155 160 244
Norway NO Yes 11 2.16 1089 214 – – 110 125 184 199 214
Poland PL No 115 3.00 9500 248 – – 138 183 157 182 248
Portugala PT Yes 27 2.50 N/A N/A N/A N/A 69 75 95 92 N/A
Romania RO Yes 17 0.78 200 9 2174 3913 6 8 8 8 9
Russian Federation RU Yes 57 0.40 1870 13 14 219 25 588 4 4 10 11 13
San Marino SM Yes 1 30.82 20 616 – – 656 625 597 404 616
Serbia RS Yes 8 1.10 448 62 723 1301 52 39 44 38 62
Slovakia SK Yes 4 0.73 591 108 – 985 82 91 100 105 108
Slovenia SI Yes 2 1.00 142 71 199 358 54 50 72 61 71
Spain ES Yes 153 3.23 3885 82 4727 8506 84 71 74 73 82
Sweden SE Yes 29 3.01 1911 198 – – 71 114 N/A 193 198
Switzerland CH Yes 46 5.75 1604 201 – – 176 203 142 195 201
Syriaa SY N/A N/A N/A N/A N/A N/A N/A N/A N/A N/A N/A N/A
Tunisiaa TN N/A N/A N/A N/A N/A N/A N/A 5 8 8 9 N/A
Turkeya TR N/A N/A N/A N/A N/A N/A N/A N/A N/A N/A N/A N/A
Ukraine UA No 17 0.38 85 2 4447 8004 0 1 1 1 2
United Kingdom GB Yes 106 1.67 5809 92 6326 11 383 82 83 86 91 92
Total 56 2052 85 289
aThese 10 countries did not submit data on ICD implantations in 2013 for the EHRA White Book.
M.J.P.R
aatikainenetal.
i30
by guest on January 28, 2015 Downloaded from
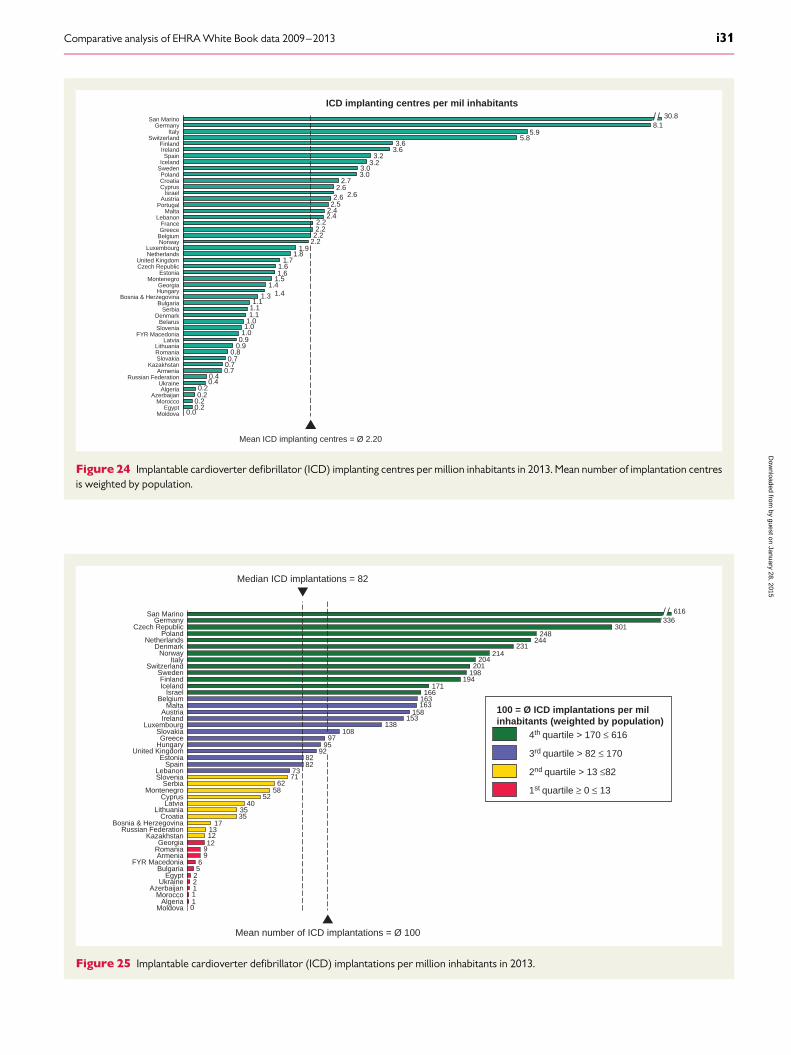
0.00.20.20.20.2
0.40.4
0.70.70.70.8
0.90.91.01.01.01.11.11.1
1.3 1.41.4
1.51.61.6
1.71.8
1.92.22.22.22.2
2.42.42.52.6 2.62.6
2.73.03.0
3.23.2
3.63.6
5.85.9
FYR MacedoniaSlovenia
LatviaLithuaniaRomaniaSlovakia
KazakhstanArmenia
Russian FederationUkraineAlgeria
AzerbaijanMorocco
EgyptMoldova
ICD implanting centres per mil inhabitants
Mean ICD implanting centres = Ø 2.20
BelarusDenmark
SerbiaBulgaria
Bosnia & HerzegovinaHungaryGeorgia
MontenegroEstonia
Czech RepublicUnited Kingdom
NetherlandsLuxembourg
NorwayBelgiumGreeceFrance
LebanonMalta
PortugalAustria
IsraelCyprusCroatiaPoland
SwedenIceland
SpainIrelandFinland
SwitzerlandItaly
Germany 8.1San Marino 30.8
Figure 24 Implantable cardioverter defibrillator (ICD) implanting centres per million inhabitants in 2013. Mean number of implantation centresis weighted by population.
01112256
99121213
173535
4052
5862
7173
8282
9295
97108
138153
158163163166
171194
198201
204214
231244
248301
Mean number of ICD implantations = Ø 100
Median ICD implantations = 82
MoldovaAlgeria
MoroccoAzerbaijan
UkraineEgypt
BulgariaFYR Macedonia
ArmeniaRomaniaGeorgia
KazakhstanRussian Federation
Bosnia & HerzegovinaCroatia
LithuaniaLatvia
CyprusMontenegro
SerbiaSloveniaLebanon
SpainEstonia
United KingdomHungaryGreece
SlovakiaLuxembourg
IrelandAustria
MaltaBelgium
IsraelIcelandFinland
SwedenSwitzerland
ItalyNorway
DenmarkNetherlands
PolandCzech Republic
Germany 336San Marino 616
100 = Ø ICD implantations per milinhabitants (weighted by population)
1st quartile ≥ 0 ≤ 13
2nd quartile > 13 ≤82
3rd quartile > 82 ≤ 170
4th quartile > 170 ≤ 616
Figure 25 Implantable cardioverter defibrillator (ICD) implantations per million inhabitants in 2013.
Comparative analysis of EHRA White Book data 2009–2013 i31
by guest on January 28, 2015D
ownloaded from

100 = Ø ICD implantations per millioninhabitants (weighted by population)
1st quartile ≥ 0 ≤ 13
2nd quartile > 13 ≤ 82
3rd quartile > 82 ≤ 170
4th quartile > 170 ≤ 616
Not available
Figure 26 Implantable cardioverter defibrillator (ICD) implantations in the European Society of Cardiology countries in 2013.
135125125118121
20132012201120102009
5947424129
20132012201120102009
295289292273257
20132012201120102009
ESC
12411511310798
20132012201120102009
EU28
176165162155143
20132012201120102009
Northern Europe Western Europe
Southern Europe Eastern Europe
1131091009590
20132012201120102009
12511611310799
20132012201120102009
European ESC countries
101869510868
2011 2013201220102009
Non-European ESC countries
Figure 27 Implantable cardioverter defibrillator (ICD) implantations per million inhabitants 2009–2013 in the five geographical regions of theEuropean Society of Cardiology (ESC) and comparison to the total ESC area and the 28 member countries of the European Union (EU28).
M.J.P. Raatikainen et al.i32
by guest on January 28, 2015D
ownloaded from
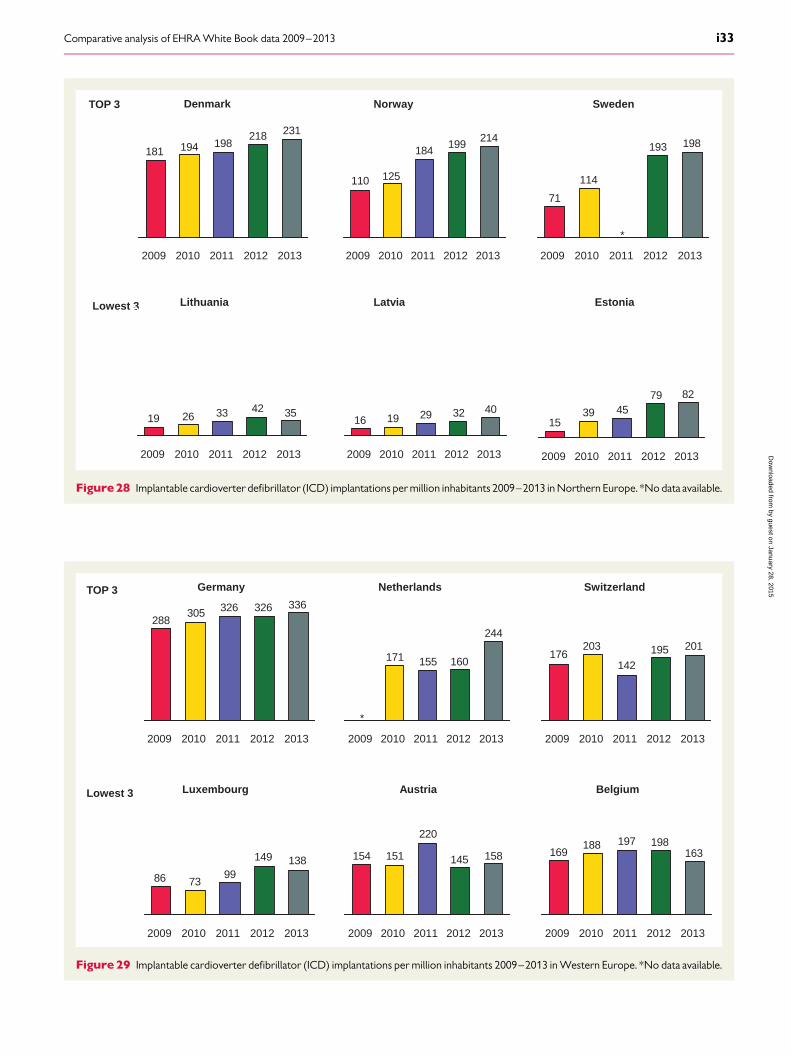
Denmark
231218198194181
20132010 2011 20122009
TOP 3
Lowest 3 Lithuania
3542332619
20132012201120102009
Norway
214199
184
125110
20132012201120102009
Latvia
4032291916
20132012201120102009
Sweden
198193
114
71
2013201220102009
Estonia
82794539
15
2009 2013201220112010
2011
*
Figure28 Implantable cardioverter defibrillator (ICD) implantations per million inhabitants 2009–2013 in Northern Europe. *No data available.
Germany
336326326305288
20132012201120102009
TOP 3
Lowest 3 Luxembourg
138149
997386
20132012201120102009
Netherlands
244
160155171
20132010 2011 20122009
Austria
158145
220
151154
20132012201120102009
Switzerland
201195142
203176
20132012201120102009
Belgium
163198197188
169
20132012201120102009
*
Figure 29 Implantable cardioverter defibrillator (ICD) implantations per million inhabitants 2009–2013 in Western Europe. *No data available.
Comparative analysis of EHRA White Book data 2009–2013 i33
by guest on January 28, 2015D
ownloaded from
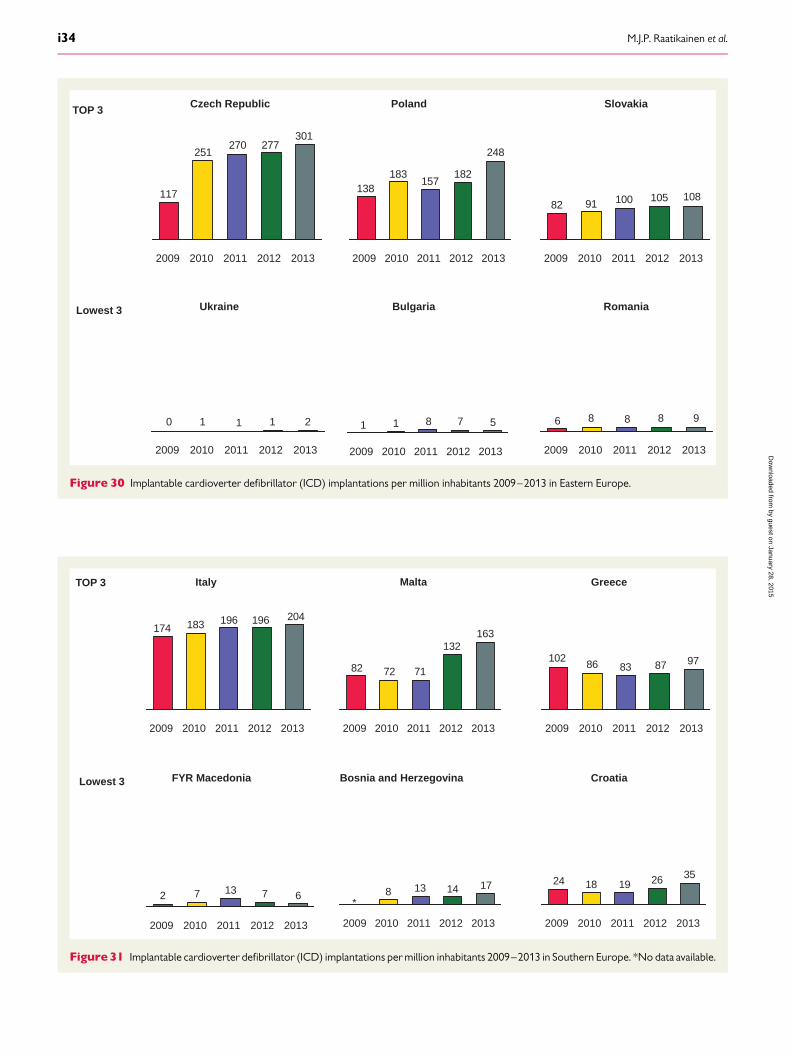
Slovakia
1081051009182
20132012201120102009
TOP 3
Lowest 3 Ukraine
21110
20102009 2011 2012 2013
Poland
248
182157
183138
20132012201120102009
Bulgaria
57811
20132012201120102009
Czech Republic
301277270
251
117
20132012201120102009
Romania
98886
20132012201120102009
Figure 30 Implantable cardioverter defibrillator (ICD) implantations per million inhabitants 2009–2013 in Eastern Europe.
Greece
97878386102
20122011 201320102009
TOP 3
Lowest 3
Malta
163132
717282
201120102009 20132012
FYR Macedonia
671372
20132012201120102009
Italy
204196196183174
20132012201120102009
Bosnia and Herzegovina
1714138
2009 201320112010 2012
Croatia
3526191824
2011 201220102009 2013
*
Figure31 Implantable cardioverter defibrillator (ICD) implantations per million inhabitants 2009–2013 in Southern Europe. *No data available.
M.J.P. Raatikainen et al.i34
by guest on January 28, 2015D
ownloaded from
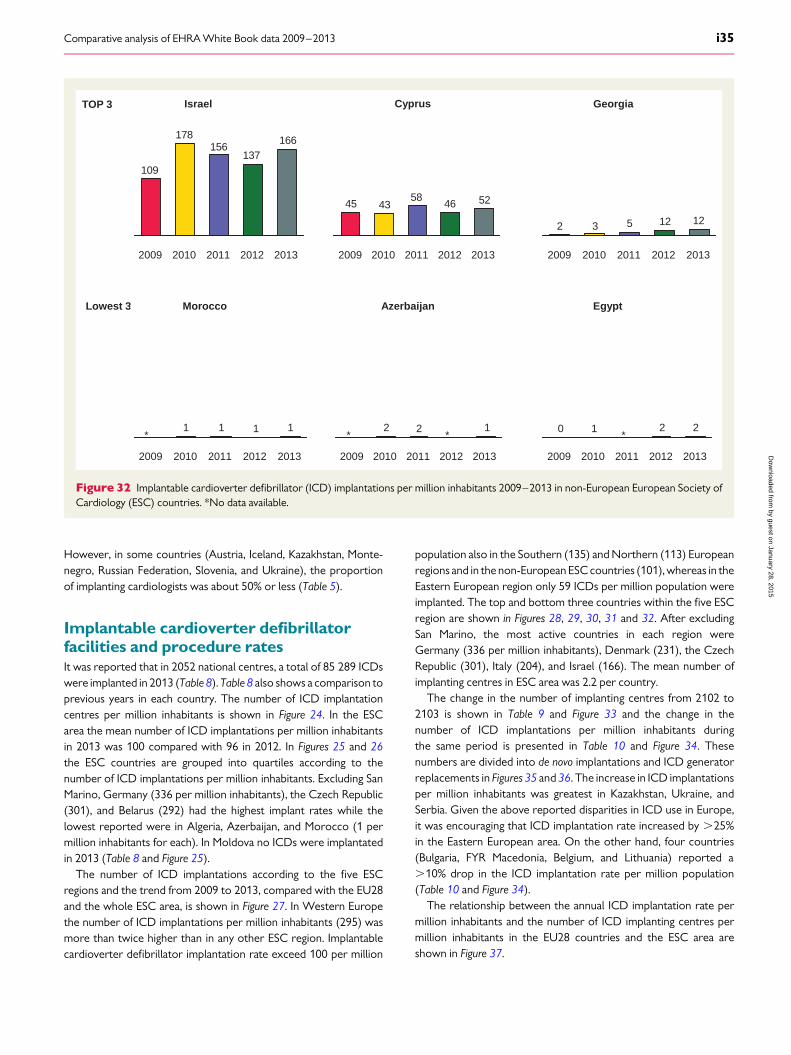
However, in some countries (Austria, Iceland, Kazakhstan, Monte-negro, Russian Federation, Slovenia, and Ukraine), the proportionof implanting cardiologists was about 50% or less (Table 5).
Implantable cardioverter defibrillatorfacilities and procedure ratesIt was reported that in 2052 national centres, a total of 85 289 ICDswere implanted in 2013 (Table 8). Table 8 also shows a comparison toprevious years in each country. The number of ICD implantationcentres per million inhabitants is shown in Figure 24. In the ESCarea the mean number of ICD implantations per million inhabitantsin 2013 was 100 compared with 96 in 2012. In Figures 25 and 26the ESC countries are grouped into quartiles according to thenumber of ICD implantations per million inhabitants. Excluding SanMarino, Germany (336 per million inhabitants), the Czech Republic(301), and Belarus (292) had the highest implant rates while thelowest reported were in Algeria, Azerbaijan, and Morocco (1 permillion inhabitants for each). In Moldova no ICDs were implantatedin 2013 (Table 8 and Figure 25).
The number of ICD implantations according to the five ESCregions and the trend from 2009 to 2013, compared with the EU28and the whole ESC area, is shown in Figure 27. In Western Europethe number of ICD implantations per million inhabitants (295) wasmore than twice higher than in any other ESC region. Implantablecardioverter defibrillator implantation rate exceed 100 per million
population also in the Southern (135) and Northern (113) Europeanregions and in the non-European ESC countries (101), whereas in theEastern European region only 59 ICDs per million population wereimplanted. The top and bottom three countries within the five ESCregion are shown in Figures 28, 29, 30, 31 and 32. After excludingSan Marino, the most active countries in each region wereGermany (336 per million inhabitants), Denmark (231), the CzechRepublic (301), Italy (204), and Israel (166). The mean number ofimplanting centres in ESC area was 2.2 per country.
The change in the number of implanting centres from 2102 to2103 is shown in Table 9 and Figure 33 and the change in thenumber of ICD implantations per million inhabitants duringthe same period is presented in Table 10 and Figure 34. Thesenumbers are divided into de novo implantations and ICD generatorreplacements in Figures 35 and36. The increase in ICD implantationsper million inhabitants was greatest in Kazakhstan, Ukraine, andSerbia. Given the above reported disparities in ICD use in Europe,it was encouraging that ICD implantation rate increased by .25%in the Eastern European area. On the other hand, four countries(Bulgaria, FYR Macedonia, Belgium, and Lithuania) reported a.10% drop in the ICD implantation rate per million population(Table 10 and Figure 34).
The relationship between the annual ICD implantation rate permillion inhabitants and the number of ICD implanting centres permillion inhabitants in the EU28 countries and the ESC area areshown in Figure 37.
Georgia
1212532
2009 2013201220112010
TOP 3
Lowest 3
Cyprus
524658
4345
20122009 2010 20132011
Morocco
1111
2011 201320102009 2012
Israel
166137
156178
109
20132012201120102009
Azerbaijan
12 2
2011 2012 20132009 2010
Egypt
2210
2011 20132010 20122009
** * *
Figure 32 Implantable cardioverter defibrillator (ICD) implantations per million inhabitants 2009–2013 in non-European European Society ofCardiology (ESC) countries. *No data available.
Comparative analysis of EHRA White Book data 2009–2013 i35
by guest on January 28, 2015D
ownloaded from
. . . . . . . . . . . . . . . . . . . . . . . . . . . . . . . . . . . . . . . . . . . . . . . . . . . . . . . . . . . . . . . . . . . . . . . . . . . . . . . . . . . . . . . . . . . . . . . . . . . . . . . . . .
. . . . . . . . . . . . . . . . . . . . . . . . . . . . . . . . . . . . . . . . . . . . . . . . . . . . . . . . . . . . . . . . . . . . . . . . . . . . . . . . . . . . . . . . . . . . . . . . . . . . . . . . . . . . . . . . . . . . . . . . . . . . . . . . . . . . . . . . . . . . . . . . . . . . . . . . . . . . . . . . . . . . . . . . . . . . . . .
Table 9 Change in the number of ICD implantation centres in year 2012 vs. 2013
Country ISO code Number of ICD implanting centres 2012 Number of ICD implanting centres 2013 Change %
Absolute number Per mil inhabitants Absolute number Per mil inhabitants
Albaniaa AL N/A N/A N/A N/A N/A
Algeria DZ N/A N/A 8 0.21 N/A
Armenia AM 3 1.01 2 0.65 235%
Austria AT 21 2.55 21 2.55 0%
Azerbaijan AZ N/A N/A 2 0.21 N/A
Belarus BY 7 0.73 N/A N/A N/A
Belgium BE 23 2.08 23 2.20 6.1%
Bosnia & Herzegovina BA 4 1.03 5 1.29 25.1%
Bulgaria BG 4 0.57 8 1.15 102%
Croatia HR 12 2.68 12 2.68 0%
Cyprus CY 3 2.64 3 2.60 22%
Czech Republic CZ 17 1.67 17 1.60 24.1%
Denmark DK 6 1.08 6 1.08 0%
Egypt EG 11 0.13 13 0.15 16.0%
Estonia EE 2 1.57 2 1.58 1%
Finland FI 19 3.61 19 3.61 0%
France FR 148 2.26 148 2.24 0%
Georgia GE 7 1.53 7 1.42 28%
Germany DE 670 8.24 654 8.06 22%
Greece GR 24 2.23 24 2.23 0.0%
Hungary HU 13 1.31 14 1.41 7.9%
Iceland IS 1 3.19 1 3.17 21%
Ireland IE 17 3.60 17 3.56 21%
Israel IL 21 2.77 20 2.60 26%
Italy IT 360 5.88 365 5.94 1.0%
Kazakhstan KZ 5 0.29 12 0.68 137%
Kosovoa XK N/A N/A N/A N/A N/A
Kyrgyzstana KGZ 0 N/A N/A N/A
Latvia LV 2 0.91 2 0.92 0.6%
Lebanon LB N/A N/A 10 2.42 N/A
Libyaa LY N/A N/A N/A N/A N/A
Lithuania LT 3 0.85 3 0.85 0.3%
Luxembourg LU 1 1.96 1 1.94 21.1%
FYR Macedonia MK 2 0.96 2 0.96 20.2%
Malta MT 1 2.44 1 2.43 20.4%
Moldova MD N/A N/A 0 0.00 N/A
Montenegro ME 1 1.52 1 1.53 0.6%
Morocco MA 7 0.22 5 0.15 229.3%
Netherlands NL 28 1.67 31 1.84 10.2%
Norway NO 11 2.20 11 2.16 21.7%
Poland PL 111 2.89 115 3.00 3.7%
Portugal PT 24 2 27 2.50 12.3%
Romania RO 17 0.78 17 0.78 0%
Russian Federation RU 57 0.40 57 0.40 0%
San Marino SM 1 31.11 1 30.82 21%
Serbia RS 10 1.37 8 1.10 219.6%
Slovakia SK 4 0.73 4 0.73 0%
Slovenia SI 3 1.50 2 1.00 233%
Spain ES 161 3.42 153 3.23 25.6%
Sweden SE 35 3.84 29 3.01 222%
Continued
M.J.P. Raatikainen et al.i36
by guest on January 28, 2015D
ownloaded from
Cardiac resynchronization therapydevices
General informationThe 46 countries that submitted data on CRT for the EHRA WhiteBook 2014 are listed in Table 11. Albania, Belarus, Cyprus, France,Kosovo, Kyrgyzstan, Libya, Syria, Tunisia, and Turkey did not reportdata related to CRT therapy. France has previously reported a highrate of CRT implantations and its absence therefore significantlyaffects the combined data. Germany and Portugal reported thedata for CRT defibrillators (CRT-D) only. The vast majority of
implants were performed by cardiologists (Table 5), and the remain-ing implantations were performed by physicians having various othertraining backgrounds, mainly surgeons. However, in some countries(Austria, Belarus, Germany, Iceland, Kazakhstan, Russian Federation,and Ukraine), the proportion of implanting cardiologists was about50% or less (Table 5).
Cardiac resynchronization therapyfacilities and procedure ratesIt was reported that in 2013, a total of 51 274 CRT devices wereimplanted in 1701 national centres. There was a decrease in both
. . . . . . . . . . . . . . . . . . . . . . . . . . . . . . . . . . . . . . . . . . . . . . . . . . . . . . . . . . . . . . . . . . . . . . . . . . . . . . . . . . . . . . . . . . . . . . . . . . . . . . . . . .
. . . . . . . . . . . . . . . . . . . . . . . . . . . . . . . . . . . . . . . . . . . . . . . . . . . . . . . . . . . . . . . . . . . . . . . . . . . . . . . . . . . . . . . . . . . . . . . . . . . . . . . . . . . . . . . . . . . . . . . . . . . . . . . . . . . . . . . . . . . . . . . . . . . . . . . . . . . . . . . . . . . . . . . . . . . . . . .
Table 9 Continued
Country ISO code Number of ICD implanting centres 2012 Number of ICD implanting centres 2013 Change %
Absolute number Per mil inhabitants Absolute number Per mil inhabitants
Switzerland CH 41 5.17 46 5.75 11%
Syriaa SY N/A N/A N/A N/A N/A
Tunisiaa TN N/A N/A N/A N/A N/A
Turkeya TR N/A N/A N/A N/A N/A
Ukraine UA 9 0.20 17 0.38 92%
United Kingdom GB 114 1.81 106 1.67 28%
aThese seven countries did not submit on ICD implantation centres in 2013 for the EHRA White Book.
1.01.5
0.23.8
1.41.8
1.52.8
3.41.7
8.22.2
2.63.6
2.0
3.22.32.4
1.11.0
0.73.6
2.22.6
0.42.7
0.80.9
1.50.9
1.65.9
2.92.1
1.31.7
5.22.2
0.11.0
0.20.6
0.3
2012
ArmeniaSloveniaMoroccoSweden
SerbiaUnited Kingdom
GeorgiaIsraelSpain
Czech RepublicGermany
NorwayCyprusIreland
LuxembourgSan Marino 31.1
IcelandFrance
MaltaDenmark
FYR MacedoniaSlovakiaFinlandGreeceAustria
Russian FederationCroatia
RomaniaLithuania
MontenegroLatvia
EstoniaItaly
PolandBelgiumHungary
NetherlandsSwitzerland
PortugalEgypt
Bosnia & HerzegovinaUkraineBulgaria
Kazakhstan
–35.4–33.2–29.3
–21.8–19.6
–7.5–7.5–6.2–5.6–4.1–2.2–1.7–1.5–1.1–1.1–0.9–0.7–0.5–0.4–0.2–0.2–0.1–0.10.00.0
0.00.10.30.30.60.60.71.03.76.17.910.211.212.316.0
25.192.5
101.6137.1
2013 vs. 2012 in %
0.71.0
0.23.0
1.11.7
1.42.6
3.21.6
8.12.2
2.63.6
1.9
3.22.22.4
1.11.0
0.73.6
2.22.6
0.42.7
0.80.9
1.50.9
1.65.9
3.02.2
1.41.8
5.82.5
0.21.3
0.41.1
0.7
2013
30.8
Figure 33 Change in the number of implantable cardioverter defibrillator implanting centres per million inhabitants from 2012 to 2013.
Comparative analysis of EHRA White Book data 2009–2013 i37
by guest on January 28, 2015D
ownloaded from
. . . . . . . . . . . . . . . . . . . . . . . . . . . . . . . . . . . . . . . . . . . . . . . . . . . . . . . . . . . . . . . . . . . . . . . . . . . . . . . . . . . . . . . . . . . . . . . . . . . . . . . . . . . .
. . . . . . . . . . . . . . . . . . . . . . . . . . . . . . . . . . . . . . . . . . . . . . . . . . . . . . . . . . . . . . . . . . . . . . . . . . . . . . . . . . . . . . . . . . . . . . . . . . . . . . . . . . . . . . . . . . . . . . . . . . . . . . . . . . . . . . . . . . . . . . . . . . . . . . . . . . . . . . . . . . . . . . . . . . . . . . .
Table 10 Change in the number of ICD implantations in year 2013 vs. 2012
Country ISO code ICD implantations 2012 ICD implantations 2013 Change %
Absolute number Per mil inhabitants Absolute number Per mil inhabitants
Albaniaa AL N/A N/A N/A N/A N/A
Algeria DZ N/A N/A 38 1.00 N/A
Armenia AM N/A N/A 28 9.14 N/A
Austria AT 1195 145.38 1296 157.63 8%
Azerbaijan AZ N/A N/A 13 1.36 N/A
Belarusa BY 114 11.82 N/A N/A N/A
Belgium BE 2197 198.24 1704 163.15 217.7%
Bosnia & Herzegovina BA 53 13.66 65 16.77 22.8%
Bulgaria BG 47 6.68 32 4.58 231%
Croatia HR 118 26.34 156 34.86 32%
Cyprus CY 52 45.69 60 51.93 14%
Czech Republic CZ 2824 277.48 3196 301.23 8.6%
Denmark DK 1207 217.73 1285 231.26 6%
Egypt EG 151 1.80 178 2.09 15.7%
Estonia EE 101 79.23 104 82.12 4%
Finland FI 874 166 1020 193.69 17%
Francea FR 6986 106.44 N/A N/A N/A
Georgia GE 53 11.60 59 11.94 3%
Germany DE 26 536 326.37 27 241 335.70 3%
Greece GR 938 87.11 1050 97.47 11.9%
Hungary HU 844 84.75 940 94.57 11.6%
Iceland IS 42 134.11 54 171.28 28%
Ireland IE 682 144.43 732 153.27 6%
Israel IL 1038 136.75 1277 165.69 21%
Italy IT 12 000 195.88 12 556 204.22 4.3%
Kazakhstan KZ 116 6.62 221 12.46 88%
Kosovoa XK N/A N/A N/A N/A N/A
Kyrgyzstana KGZ N/A N/A N/A N/A N/A
Latvia LV 70 31.94 88 40.40 26.5%
Lebanon LB N/A N/A 300 72.61 N/A
Libyaa LY N/A N/A N/A N/A N/A
Lithuania LT 149 42.26 124 35.27 216.5%
Luxembourg LU 76 149.29 71 137.90 27.6%
FYR Macedonia MK 15 7.20 12 5.75 220.2%
Malta MT 54 131.76 67 162.91 23.6%
Moldova MD N/A N/A 0 0.00 N/A
Montenegro ME 29 44.11 38 58.15 31.8%
Morocco MA 21 0.65 34 1.04 60.2%
Netherlands NL 2669 159.53 4096 243.74 52.8%
Norway NO 994 198.80 1089 214.13 7.7%
Poland PL 7006 182.38 9500 247.50 35.7%
Portugala PT 990 92 N/A N/A N/A
Romania RO 178 8.15 200 9.18 13%
Russian Federation RU 1580 11.09 1870 13.12 18%
San Marino SM 13 404.48 20 616.37 52%
Serbia RS 277 38.07 448 61.85 62.5%
Slovakia SK 577 105.23 591 107.68 2%
Continued
M.J.P. Raatikainen et al.i38
by guest on January 28, 2015D
ownloaded from
absolute numbers of implants and the rate of implants per millioninhabitants compared with 2012, whereas a steady growth hadbeen witnessed from 2009 (Table 11). The absence of French datain 2013 is an important factor in this respect. The number of CRTimplanting centres per million inhabitants in the ESC countries isshown in Figure 38. The mean number of implanting facilities was183 per country, which is similar to that for 2012 (19). Italy and
Germany, both approaching six implanting facilities per million inha-bitants, had the highest density of centres implanting CRT devices.
Implantation rates with the countries divided into quartiles areshown as a bar graph in Figure 39 and as a geographical map inFigure 40. Figures 41 and 42 show the corresponding numbers forCRT pacemakers (CRT-P) and defibrillators (CRT-D). The ratio ofCRT-D/CRT-P implants was 2.6 with a mean of 44 CRT-Ds and 17
. . . . . . . . . . . . . . . . . . . . . . . . . . . . . . . . . . . . . . . . . . . . . . . . . . . . . . . . . . . . . . . . . . . . . . . . . . . . . . . . . . . . . . . . . . . . . . . . . . . . . . . . . . . .
. . . . . . . . . . . . . . . . . . . . . . . . . . . . . . . . . . . . . . . . . . . . . . . . . . . . . . . . . . . . . . . . . . . . . . . . . . . . . . . . . . . . . . . . . . . . . . . . . . . . . . . . . . . . . . . . . . . . . . . . . . . . . . . . . . . . . . . . . . . . . . . . . . . . . . . . . . . . . . . . . . . . . . . . . . . . . . .
Table 10 Continued
Country ISO code ICD implantations 2012 ICD implantations 2013 Change %
Absolute number Per mil inhabitants Absolute number Per mil inhabitants
Slovenia SI 122 61.10 142 71.26 17%
Spain ES 3434 73.00 3885 82.01 12.4%
Sweden SE 1758 193.11 1911 198.08 3%
Switzerland CH 1549 195.44 1604 200.60 3%
Syriaa SY N/A N/A N/A N/A N/A
Tunisiaa TN 100 9 N/A N/A N/A
Turkeya TR N/A N/A N/A N/A N/A
Ukraine UA 52 1.14 85 1.91 67%
United Kingdom GB 5762 91.39 5809 91.63 0%
Total ESC countries 56
aThese 10 countries did not submit data on ICD implantations for the EHRA White Book 2014.
6.77.2
198.242.3
149.391.4
105.2193.1195.4
326.411.6
79.2195.9
144.4217.7
198.8145.4
277.584.887.1
73.08.1
45.71.8
61.1166.1
11.1136.7
13.7131.8
31.9134.1
44.126.3
182.4
159.50.6
38.11.16.6
2012
BulgariaFYR Macedonia
BelgiumLithuania
LuxembourgUnited Kingdom
SlovakiaSweden
SwitzerlandGermany
GeorgiaEstonia
ItalyIreland
DenmarkNorwayAustria
Czech RepublicHungaryGreece
SpainRomania
CyprusEgypt
SloveniaFinland
Russian FederationIsrael
Bosnia & HerzegovinaMaltaLatvia
IcelandMontenegro
CroatiaPoland
San Marino 404.5Netherlands
MoroccoSerbia
UkraineKazakhstan
–31.4–20.2–17.7–16.5
–7.60.32.32.62.62.93.03.64.36.16.27.78.48.611.611.912.412.713.715.716.616.618.421.222.823.626.527.731.832.335.7
52.452.8
60.262.5
66.688.2
2013 vs. 2012 in %
4.65.7
163.235.3
137.991.6
107.7198.1200.6
335.711.9
82.1204.2
153.3231.3
214.1157.6
301.294.697.5
82.09.2
51.92.1
71.3193.7
13.1165.7
16.8162.9
40.4171.3
58.234.9
247.5
243.71.0
61.91.912.5
2013
616.4
Figure 34 Change in the number of implantable cardioverter defibrillator implantations per million inhabitants from 2012 to 2013.
Comparative analysis of EHRA White Book data 2009–2013 i39
by guest on January 28, 2015D
ownloaded from
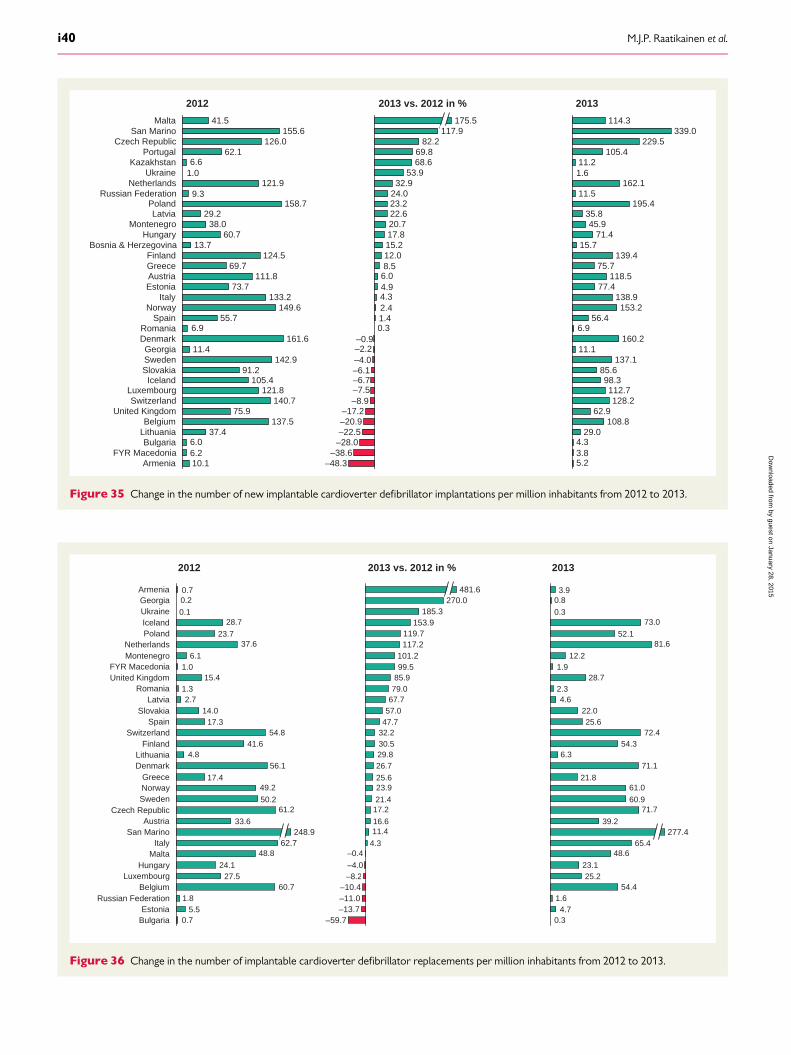
6.26.0
6.9
9.3
1.06.6
10.1
2012
Lithuania 37.4Belgium 137.5
United Kingdom 75.9Switzerland 140.7
Luxembourg 121.8Iceland 105.4
Slovakia 91.2Sweden 142.9Georgia 11.4
Denmark 161.6Romania
Spain 55.7Norway 149.6
Italy 133.2Estonia 73.7Austria 111.8Greece 69.7Finland 124.5
Bosnia & Herzegovina 13.7Hungary 60.7
Montenegro 38.0Latvia 29.2
Poland 158.7Russian Federation
Netherlands 121.9Ukraine
KazakhstanPortugal 62.1
Czech Republic 126.0San Marino 155.6
Malta 41.5
BulgariaFYR Macedonia
Armenia
–8.9–7.5–6.7–6.1–4.0–2.2–0.9
0.31.42.44.34.96.08.5
–28.0–38.6
–48.3
2013 vs. 2012 in %
–22.5–20.9–17.2
12.015.217.820.722.623.224.032.9
53.968.669.8
82.2117.9
175.5
5.23.84.3
6.9
1.6
29.0
2013
108.862.9
128.2112.7
98.385.6
137.111.1
160.2
56.4153.2
138.977.4
118.575.7
139.415.7
71.445.9
35.8195.4
11.5162.1
11.2105.4
229.5339.0
114.3
Figure 35 Change in the number of new implantable cardioverter defibrillator implantations per million inhabitants from 2012 to 2013.
0.75.5
1.860.7
27.524.1
48.8
33.6
61.250.2
49.217.4
56.14.8
41.654.8
17.314.0
2.71.3
15.41.0
6.1
37.623.7
28.70.1
0.20.7
2012
Russian FederationBelgium
LuxembourgHungary
MaltaItaly 62.7
San Marino 248.9Austria
Czech RepublicSwedenNorwayGreece
Denmark
FinlandSwitzerland
SpainSlovakia
LatviaRomania
United KingdomFYR Macedonia
MontenegroNetherlands
PolandIcelandUkraineGeorgiaArmenia
EstoniaBulgaria
Lithuania
–8.2–4.0
–0.44.3
11.416.6
17.221.4
23.925.6
26.729.830.532.247.757.067.779.085.999.5
2013 vs. 2012 in %
–11.0–10.4
101.2117.2119.7
153.9185.3
270.0481.6
–59.7–13.7
0.34.7
1.654.4
25.223.1
48.665.4
39.2
71.760.9
61.021.8
71.16.3
54.372.4
25.622.0
4.62.3
28.71.9
12.2
81.652.1
73.00.3
0.83.9
277.4
2013
Figure 36 Change in the number of implantable cardioverter defibrillator replacements per million inhabitants from 2012 to 2013.
M.J.P. Raatikainen et al.i40
by guest on January 28, 2015D
ownloaded from
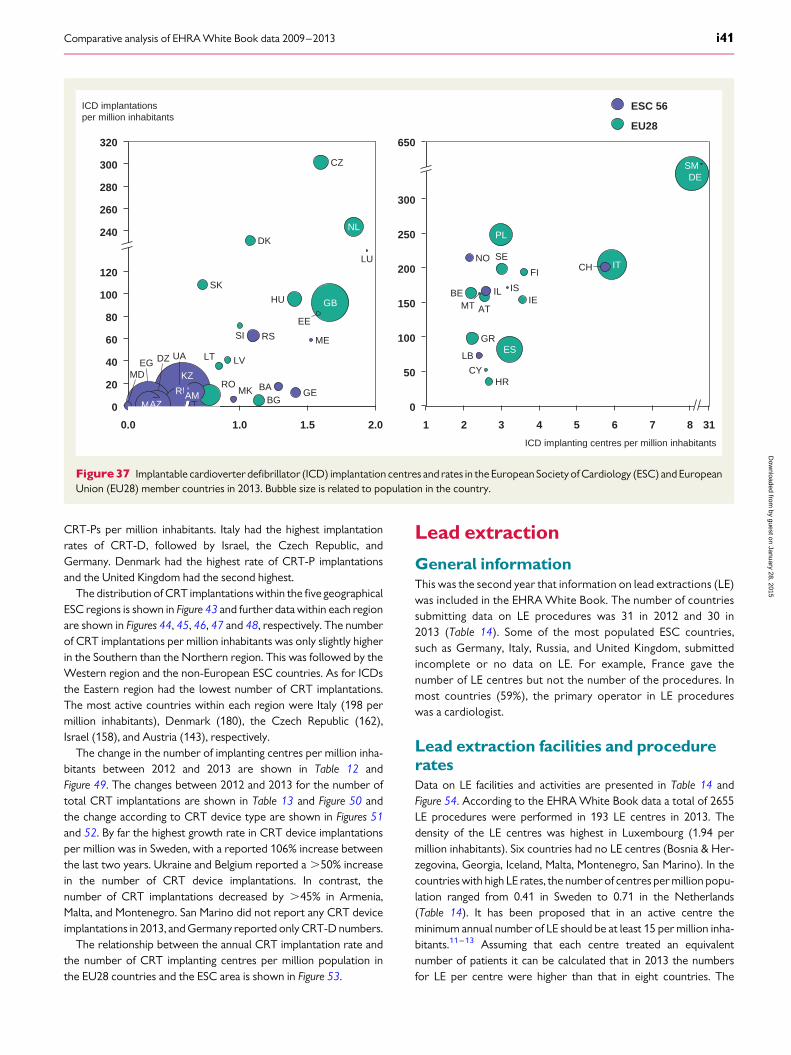
CRT-Ps per million inhabitants. Italy had the highest implantationrates of CRT-D, followed by Israel, the Czech Republic, andGermany. Denmark had the highest rate of CRT-P implantationsand the United Kingdom had the second highest.
The distribution of CRT implantations within the five geographicalESC regions is shown in Figure 43 and further data within each regionare shown in Figures 44, 45, 46, 47 and 48, respectively. The numberof CRT implantations per million inhabitants was only slightly higherin the Southern than the Northern region. This was followed by theWestern region and the non-European ESC countries. As for ICDsthe Eastern region had the lowest number of CRT implantations.The most active countries within each region were Italy (198 permillion inhabitants), Denmark (180), the Czech Republic (162),Israel (158), and Austria (143), respectively.
The change in the number of implanting centres per million inha-bitants between 2012 and 2013 are shown in Table 12 andFigure 49. The changes between 2012 and 2013 for the number oftotal CRT implantations are shown in Table 13 and Figure 50 andthe change according to CRT device type are shown in Figures 51and 52. By far the highest growth rate in CRT device implantationsper million was in Sweden, with a reported 106% increase betweenthe last two years. Ukraine and Belgium reported a .50% increasein the number of CRT device implantations. In contrast, thenumber of CRT implantations decreased by .45% in Armenia,Malta, and Montenegro. San Marino did not report any CRT deviceimplantations in 2013, and Germany reported only CRT-D numbers.
The relationship between the annual CRT implantation rate andthe number of CRT implanting centres per million population inthe EU28 countries and the ESC area is shown in Figure 53.
Lead extraction
General informationThis was the second year that information on lead extractions (LE)was included in the EHRA White Book. The number of countriessubmitting data on LE procedures was 31 in 2012 and 30 in2013 (Table 14). Some of the most populated ESC countries,such as Germany, Italy, Russia, and United Kingdom, submittedincomplete or no data on LE. For example, France gave thenumber of LE centres but not the number of the procedures. Inmost countries (59%), the primary operator in LE procedureswas a cardiologist.
Lead extraction facilities and procedureratesData on LE facilities and activities are presented in Table 14 andFigure 54. According to the EHRA White Book data a total of 2655LE procedures were performed in 193 LE centres in 2013. Thedensity of the LE centres was highest in Luxembourg (1.94 permillion inhabitants). Six countries had no LE centres (Bosnia & Her-zegovina, Georgia, Iceland, Malta, Montenegro, San Marino). In thecountries with high LE rates, the number of centres per million popu-lation ranged from 0.41 in Sweden to 0.71 in the Netherlands(Table 14). It has been proposed that in an active centre theminimum annual number of LE should be at least 15 per million inha-bitants.11–13 Assuming that each centre treated an equivalentnumber of patients it can be calculated that in 2013 the numbersfor LE per centre were higher than that in eight countries. The
650
300
250
200
150
100
50
0
318721 543 6
IE
FI CH IT
DESM
ATMT
LB
CY
GR
BE
NO
ICD implanting centres per million inhabitants
HR
PL
SE
IL IS
ES
280
1.5 2.0
320
300
240
260
0
20
40
60
80
100
120
1.0
ICD implantationsper million inhabitants
MDEG
MAAZ
DZ UA
RUAM
KZ
SK
RO
LT LV
MK
SI
DK
RS
BGBA
HU
GE
ME
EE
CZ
GB
NL
LU
ESC 56
EU28
0.0
Figure37 Implantable cardioverter defibrillator (ICD) implantation centres and rates in the European Society of Cardiology (ESC) and EuropeanUnion (EU28) member countries in 2013. Bubble size is related to population in the country.
Comparative analysis of EHRA White Book data 2009–2013 i41
by guest on January 28, 2015D
ownloaded from
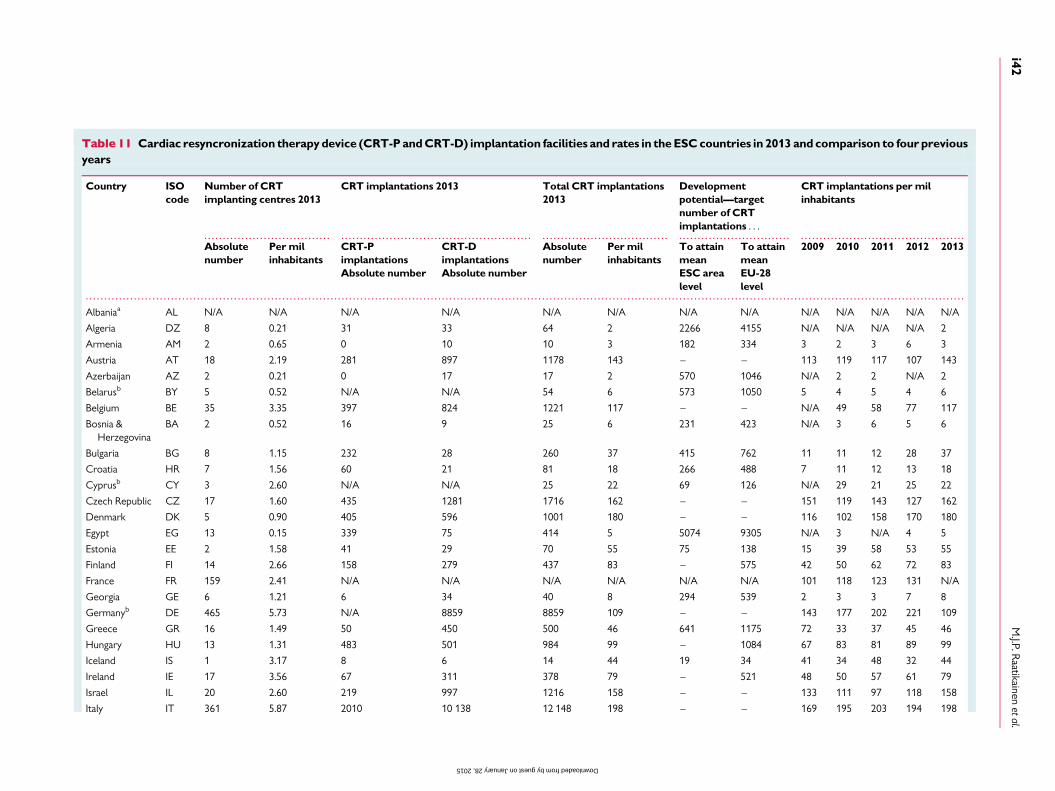
. . . . . . . . . . . . . . . . . . . . . . . . . . . . . . . . . . . . . . . . . . . . . . . . . . . . . . . . . . . . . . . . . . . . . . . . . . . . . . . . . . . . . . . . . . . . . . . . . . . . . . . . . . . . . . . . . . . . . . . . . . . . . . . . . . . . . . . . . . . . . . . . . . . . . . . . . . . . . . . . . . . . . . . . . . . . . . . . . . . . . . . . . . . . . . . . .
. . . . . . . . . . . . . . . . . . . . . . . . . . . . . . . . . . . . . . . . . . . . . . . . . . . . . . . . . . . . . . . . . . . . . . . . . . . . . . . . . . . . . . . . . . . . . . . . . . . . . . . . . . . . . . . . . . . . . . . . . . . . . . . . . . . . . . . . . . . . . . . . . . . . . . . . . . . . . . . . . . . . . . . . . . . . . . . . . . . . . . . . . . . . . . . . . . . . . . . . . . . . . . . . . . . . . . . . . . . . . . . . . . . . . . . . . . . . .
Table 11 Cardiac resyncronization therapy device (CRT-P andCRT-D) implantation facilities and rates in the ESCcountries in 2013 and comparison to four previousyears
Country ISOcode
Number of CRTimplanting centres 2013
CRT implantations 2013 Total CRT implantations2013
Developmentpotential—targetnumber of CRTimplantations . . .
CRT implantations per milinhabitants
Absolutenumber
Per milinhabitants
CRT-PimplantationsAbsolute number
CRT-DimplantationsAbsolute number
Absolutenumber
Per milinhabitants
To attainmeanESC arealevel
To attainmeanEU-28level
2009 2010 2011 2012 2013
Albaniaa AL N/A N/A N/A N/A N/A N/A N/A N/A N/A N/A N/A N/A N/A
Algeria DZ 8 0.21 31 33 64 2 2266 4155 N/A N/A N/A N/A 2
Armenia AM 2 0.65 0 10 10 3 182 334 3 2 3 6 3
Austria AT 18 2.19 281 897 1178 143 – – 113 119 117 107 143
Azerbaijan AZ 2 0.21 0 17 17 2 570 1046 N/A 2 2 N/A 2
Belarusb BY 5 0.52 N/A N/A 54 6 573 1050 5 4 5 4 6
Belgium BE 35 3.35 397 824 1221 117 – – N/A 49 58 77 117
Bosnia &Herzegovina
BA 2 0.52 16 9 25 6 231 423 N/A 3 6 5 6
Bulgaria BG 8 1.15 232 28 260 37 415 762 11 11 12 28 37
Croatia HR 7 1.56 60 21 81 18 266 488 7 11 12 13 18
Cyprusb CY 3 2.60 N/A N/A 25 22 69 126 N/A 29 21 25 22
Czech Republic CZ 17 1.60 435 1281 1716 162 – – 151 119 143 127 162
Denmark DK 5 0.90 405 596 1001 180 – – 116 102 158 170 180
Egypt EG 13 0.15 339 75 414 5 5074 9305 N/A 3 N/A 4 5
Estonia EE 2 1.58 41 29 70 55 75 138 15 39 58 53 55
Finland FI 14 2.66 158 279 437 83 – 575 42 50 62 72 83
France FR 159 2.41 N/A N/A N/A N/A N/A N/A 101 118 123 131 N/A
Georgia GE 6 1.21 6 34 40 8 294 539 2 3 3 7 8
Germanyb DE 465 5.73 N/A 8859 8859 109 – – 143 177 202 221 109
Greece GR 16 1.49 50 450 500 46 641 1175 72 33 37 45 46
Hungary HU 13 1.31 483 501 984 99 – 1084 67 83 81 89 99
Iceland IS 1 3.17 8 6 14 44 19 34 41 34 48 32 44
Ireland IE 17 3.56 67 311 378 79 – 521 48 50 57 61 79
Israel IL 20 2.60 219 997 1216 158 – – 133 111 97 118 158
Italy IT 361 5.87 2010 10 138 12 148 198 – – 169 195 203 194 198
M.J.P.R
aatikainenetal.
i42
by guest on January 28, 2015 Downloaded from
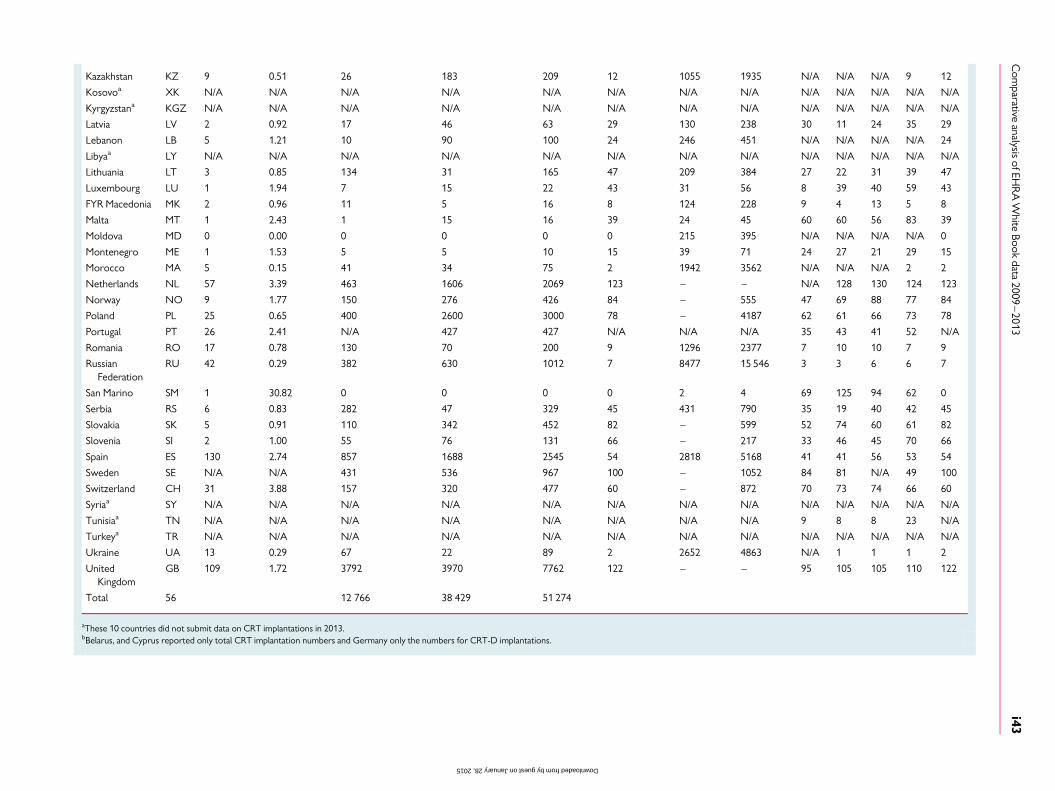
Kazakhstan KZ 9 0.51 26 183 209 12 1055 1935 N/A N/A N/A 9 12
Kosovoa XK N/A N/A N/A N/A N/A N/A N/A N/A N/A N/A N/A N/A N/A
Kyrgyzstana KGZ N/A N/A N/A N/A N/A N/A N/A N/A N/A N/A N/A N/A N/A
Latvia LV 2 0.92 17 46 63 29 130 238 30 11 24 35 29
Lebanon LB 5 1.21 10 90 100 24 246 451 N/A N/A N/A N/A 24
Libyaa LY N/A N/A N/A N/A N/A N/A N/A N/A N/A N/A N/A N/A N/A
Lithuania LT 3 0.85 134 31 165 47 209 384 27 22 31 39 47
Luxembourg LU 1 1.94 7 15 22 43 31 56 8 39 40 59 43
FYR Macedonia MK 2 0.96 11 5 16 8 124 228 9 4 13 5 8
Malta MT 1 2.43 1 15 16 39 24 45 60 60 56 83 39
Moldova MD 0 0.00 0 0 0 0 215 395 N/A N/A N/A N/A 0
Montenegro ME 1 1.53 5 5 10 15 39 71 24 27 21 29 15
Morocco MA 5 0.15 41 34 75 2 1942 3562 N/A N/A N/A 2 2
Netherlands NL 57 3.39 463 1606 2069 123 – – N/A 128 130 124 123
Norway NO 9 1.77 150 276 426 84 – 555 47 69 88 77 84
Poland PL 25 0.65 400 2600 3000 78 – 4187 62 61 66 73 78
Portugal PT 26 2.41 N/A 427 427 N/A N/A N/A 35 43 41 52 N/A
Romania RO 17 0.78 130 70 200 9 1296 2377 7 10 10 7 9
RussianFederation
RU 42 0.29 382 630 1012 7 8477 15 546 3 3 6 6 7
San Marino SM 1 30.82 0 0 0 0 2 4 69 125 94 62 0
Serbia RS 6 0.83 282 47 329 45 431 790 35 19 40 42 45
Slovakia SK 5 0.91 110 342 452 82 – 599 52 74 60 61 82
Slovenia SI 2 1.00 55 76 131 66 – 217 33 46 45 70 66
Spain ES 130 2.74 857 1688 2545 54 2818 5168 41 41 56 53 54
Sweden SE N/A N/A 431 536 967 100 – 1052 84 81 N/A 49 100
Switzerland CH 31 3.88 157 320 477 60 – 872 70 73 74 66 60
Syriaa SY N/A N/A N/A N/A N/A N/A N/A N/A N/A N/A N/A N/A N/A
Tunisiaa TN N/A N/A N/A N/A N/A N/A N/A N/A 9 8 8 23 N/A
Turkeya TR N/A N/A N/A N/A N/A N/A N/A N/A N/A N/A N/A N/A N/A
Ukraine UA 13 0.29 67 22 89 2 2652 4863 N/A 1 1 1 2
UnitedKingdom
GB 109 1.72 3792 3970 7762 122 – – 95 105 105 110 122
Total 56 12 766 38 429 51 274
aThese 10 countries did not submit data on CRT implantations in 2013.bBelarus, and Cyprus reported only total CRT implantation numbers and Germany only the numbers for CRT-D implantations.
Com
parativeanalysis
ofEHR
AW
hiteBook
data2009
–2013
i43
by guest on January 28, 2015 Downloaded from
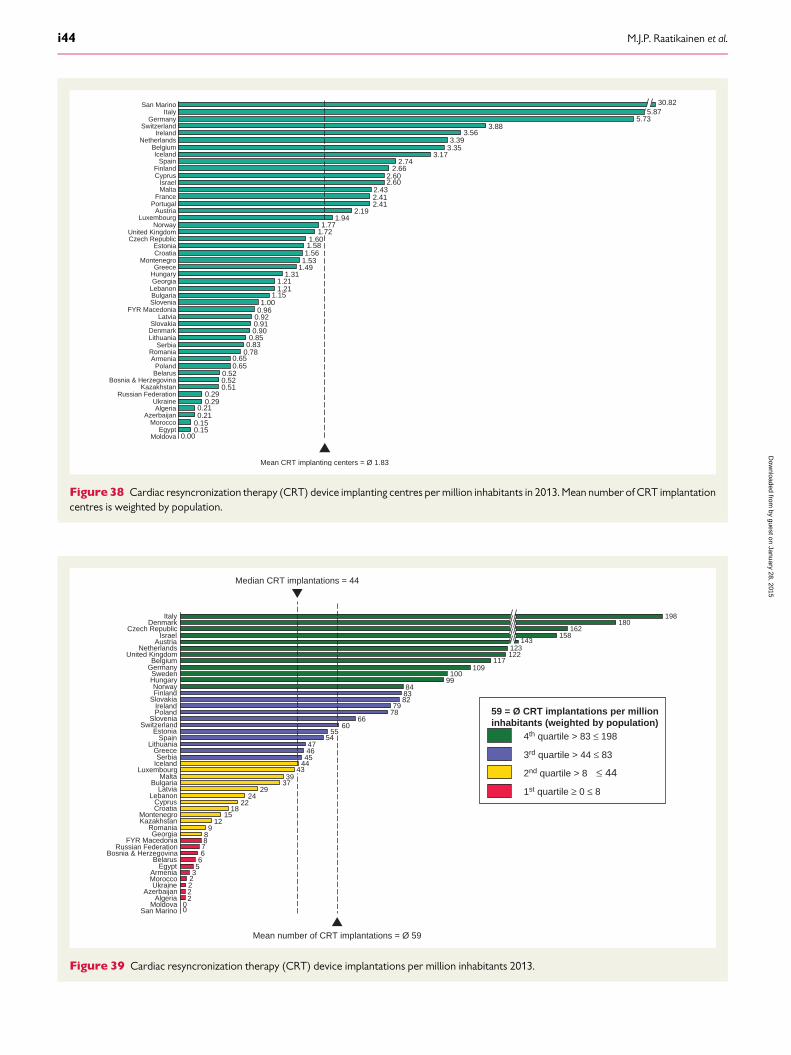
0.000.150.150.210.21
0.290.29
0.510.520.52
0.650.65
0.780.830.850.900.910.920.961.00
1.151.211.21
1.311.491.531.561.581.60
1.721.77
1.942.19
2.412.412.43
2.602.60
2.662.74
3.173.353.39
3.563.88
5.73
Mean CRT implanting centers = Ø 1.83
MoldovaEgypt
MoroccoAzerbaijan
AlgeriaUkraine
Russian FederationKazakhstan
Bosnia & HerzegovinaBelarusPoland
ArmeniaRomania
SerbiaLithuaniaDenmarkSlovakia
LatviaFYR Macedonia
SloveniaBulgariaLebanonGeorgiaHungaryGreece
MontenegroCroatiaEstonia
Czech RepublicUnited Kingdom
NorwayLuxembourg
AustriaPortugal
FranceMaltaIsrael
CyprusFinland
SpainIceland
BelgiumNetherlands
IrelandSwitzerland
GermanyItaly 5.87
San Marino 30.82
Figure38 Cardiac resyncronization therapy (CRT) device implanting centres per million inhabitants in 2013. Mean number of CRT implantationcentres is weighted by population.
00
222235667889
1215
1822
2429
3739
4344454647
5455
6066
7879
828384
99100
109117
122
Belarus Egypt
Armenia Morocco Ukraine
Azerbaijan Algeria
Moldova San Marino
Mean number of CRT implantations = Ø 59
Median CRT implantations = 44
Russian Federation FYR Macedonia
Georgia Romania
Kazakhstan Montenegro
Croatia Cyprus
Lebanon Latvia
Bulgaria Malta
Luxembourg Iceland Serbia
Greece Lithuania
Spain Estonia
Switzerland Slovenia
Poland Ireland
Slovakia Finland
Bosnia & Herzegovina
Hungary Sweden
Germany Belgium
United Kingdom Netherlands 123
Austria
Norway
Israel 158 Czech Republic 162
Denmark 180 Italy 198
143
59 = Ø CRT implantations per million inhabitants (weighted by population)
1st quartile ≥ 0 ≤ 8
2nd quartile > 8 ≤ 44
3rd quartile > 44 ≤ 83
4th quartile > 83 ≤ 198
Figure 39 Cardiac resyncronization therapy (CRT) device implantations per million inhabitants 2013.
M.J.P. Raatikainen et al.i44
by guest on January 28, 2015D
ownloaded from
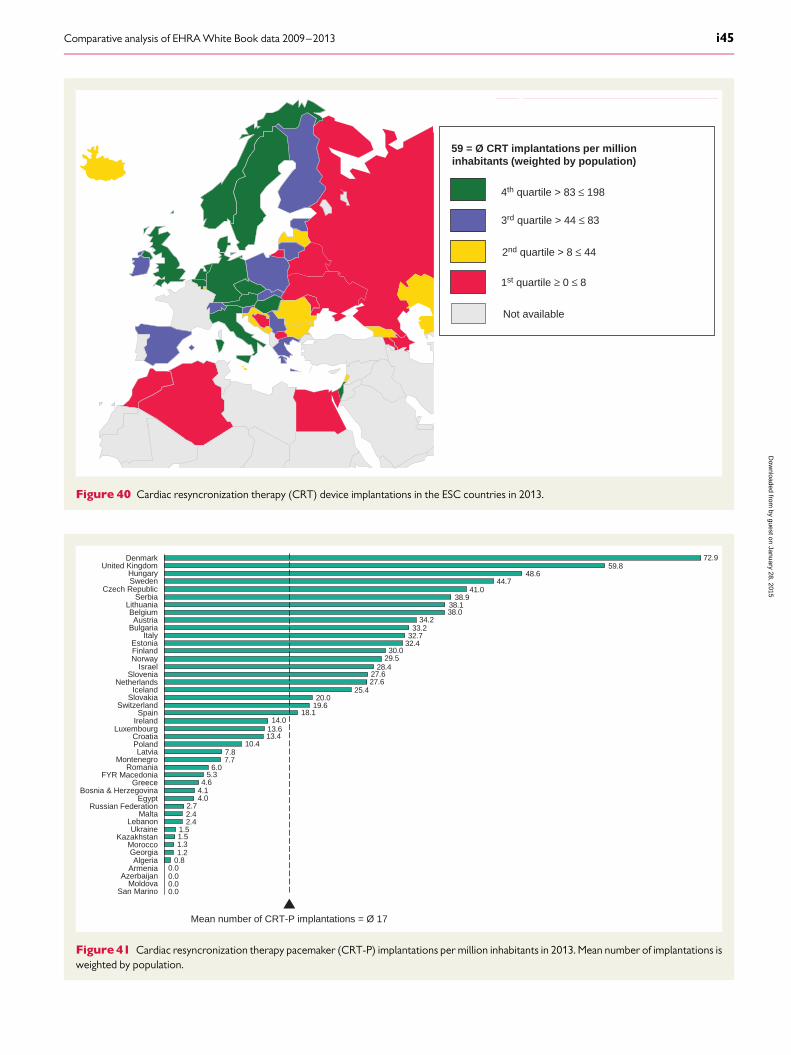
59 = Ø CRT implantations per millioninhabitants (weighted by population)
1st quartile ≥ 0 ≤ 8
2nd quartile > 8 ≤ 44
3rd quartile > 44 ≤ 83
4th quartile > 83 ≤ 198
Not available
Figure 40 Cardiac resyncronization therapy (CRT) device implantations in the ESC countries in 2013.
0.00.00.00.0
0.81.21.31.51.5
2.42.42.7
4.04.14.6
5.36.0
7.77.8
10.413.413.614.0
18.119.620.0
25.427.627.6
28.429.530.0
32.432.733.2
34.238.038.1
38.941.0
44.748.6
59.872.9
Mean number of CRT-P implantations = Ø 17
Moldova Azerbaijan
Armenia Algeria
Georgia Morocco
Kazakhstan Ukraine
Lebanon Malta
Russian Federation Egypt
Bosnia & Herzegovina Greece
FYR Macedonia Romania
Montenegro Latvia
Czech Republic Sweden Hungary
United Kingdom Denmark
Iceland Netherlands
Slovenia Israel
Norway Finland
Poland Croatia
Luxembourg Ireland Spain
Switzerland Slovakia
Estonia Italy
Bulgaria Austria
Belgium Lithuania
Serbia
San Marino
Figure 41 Cardiac resyncronization therapy pacemaker (CRT-P) implantations per million inhabitants in 2013. Mean number of implantations isweighted by population.
Comparative analysis of EHRA White Book data 2009–2013 i45
by guest on January 28, 2015D
ownloaded from
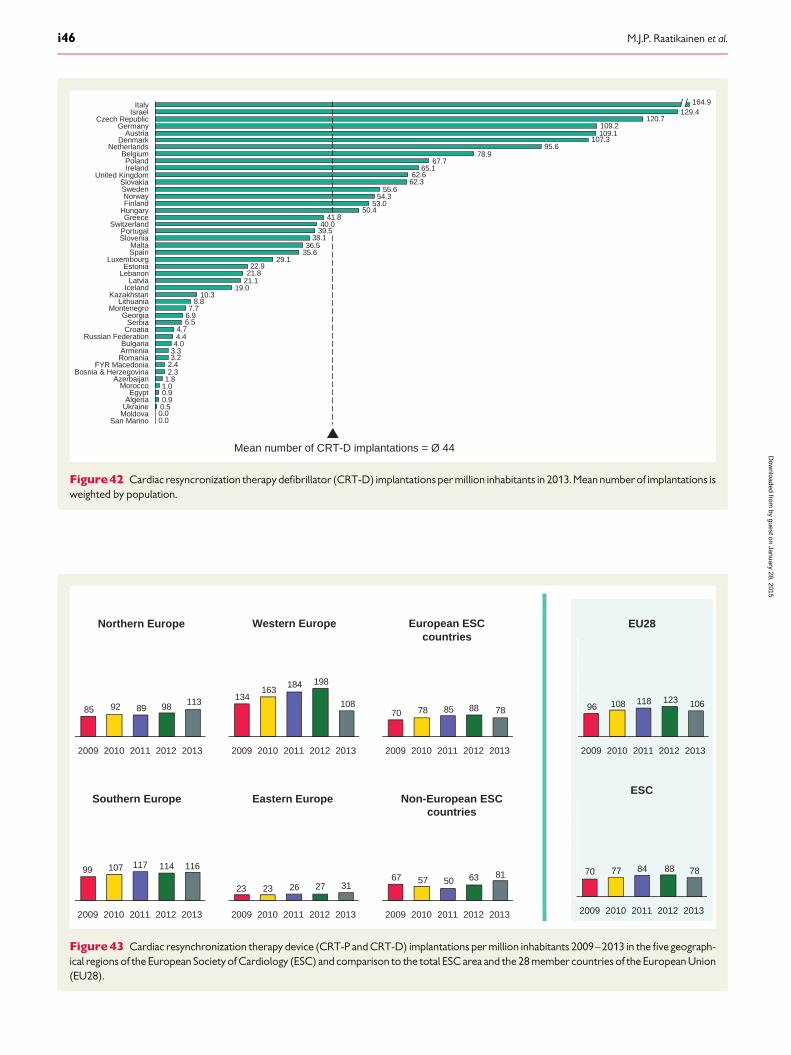
0.00.00.50.90.91.01.82.32.43.23.34.04.44.7
6.56.97.7
8.810.3
19.021.121.822.9
29.135.636.5
38.139.540.0
41.850.4
53.054.3
55.662.362.6
65.167.7
78.995.6
107.3109.1109.2
120.7
San MarinoMoldovaUkraineAlgeriaEgypt
MoroccoAzerbaijan
Bosnia & HerzegovinaFYR Macedonia
RomaniaArmeniaBulgaria
Russian FederationCroatiaSerbia
GeorgiaMontenegro
LithuaniaKazakhstan
IcelandLatvia
LebanonEstonia
LuxembourgSpainMalta
SloveniaPortugal
SwitzerlandGreece
HungaryFinlandNorwaySweden
Mean number of CRT-D implantations = Ø 44
United KingdomIrelandPoland
BelgiumNetherlands
Denmark
Slovakia
GermanyCzech Republic
Israel 129.4Italy 164.9
Austria
Figure42 Cardiac resyncronization therapy defibrillator (CRT-D) implantations per million inhabitants in 2013. Mean number of implantations isweighted by population.
11611411710799
20132012201120102009
3127262323
20132012201120102009
108
198184163
134
20132012201120102009
ESC
7888847770
20132012201120102009
EU28
10612311810896
20132012201120102009
Northern Europe Western Europe
Southern Europe Eastern Europe
11398899285
20132012201120102009
7888857870
20132012201120102009
European ESC countries
8163505767
2012 2013201120102009
Non-European ESCcountries
Figure43 Cardiac resynchronization therapy device (CRT-P and CRT-D) implantations per million inhabitants 2009–2013 in the five geograph-ical regions of the European Society of Cardiology (ESC) and comparison to the total ESC area and the 28 member countries of the European Union(EU28).
M.J.P. Raatikainen et al.i46
by guest on January 28, 2015D
ownloaded from
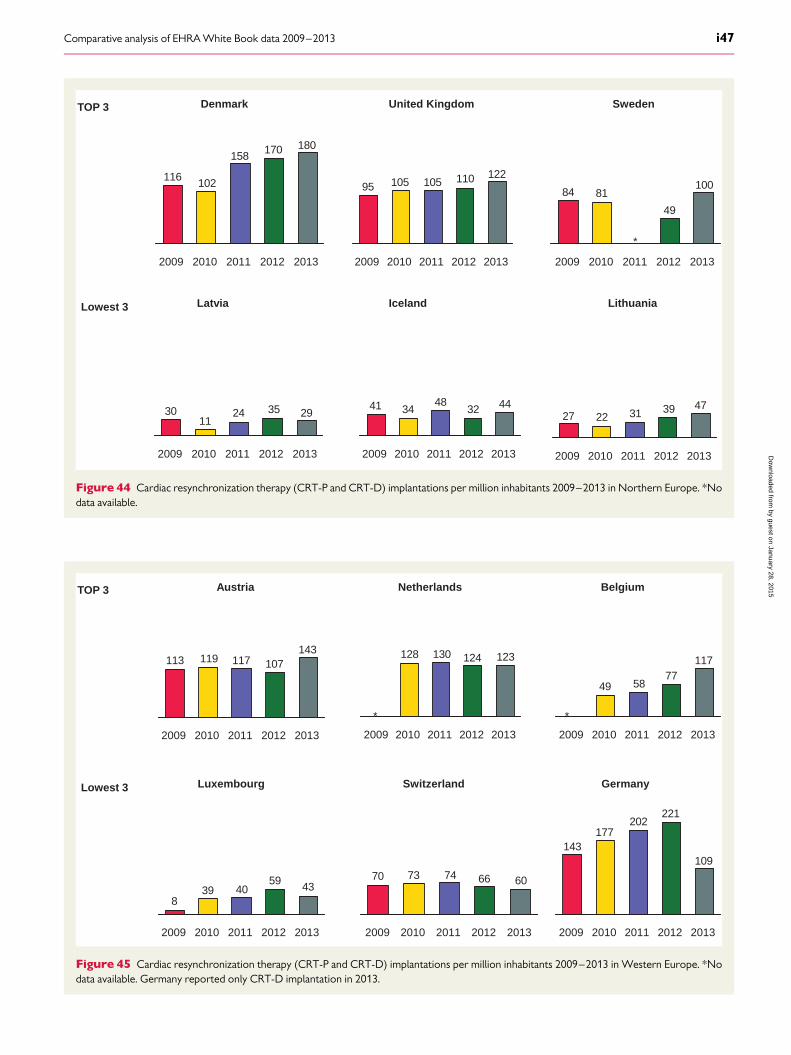
Denmark
180170158
102116
20132012201120102009
TOP 3
Lowest 3 Latvia
29352411
30
20132012201120102009
United Kingdom
12211010510595
20132010 2011 20122009
Iceland
443248
3441
20132012201120102009
Sweden
100
49
8184
20132012201120102009
Lithuania
4739312227
20132012201120102009
*
Figure 44 Cardiac resynchronization therapy (CRT-P and CRT-D) implantations per million inhabitants 2009–2013 in Northern Europe. *Nodata available.
Austria
143107117119113
20132012201120102009
TOP 3
Lowest 3 Luxembourg
43594039
8
20132012201120102009
Netherlands
123124130128
20132010 2011 20122009
Switzerland
6066747370
20132012201120102009
Belgium
11777
5849
20132012201120102009
Germany
109
221202
177143
20132012201120102009
* *
Figure 45 Cardiac resynchronization therapy (CRT-P and CRT-D) implantations per million inhabitants 2009–2013 in Western Europe. *Nodata available. Germany reported only CRT-D implantation in 2013.
Comparative analysis of EHRA White Book data 2009–2013 i47
by guest on January 28, 2015D
ownloaded from
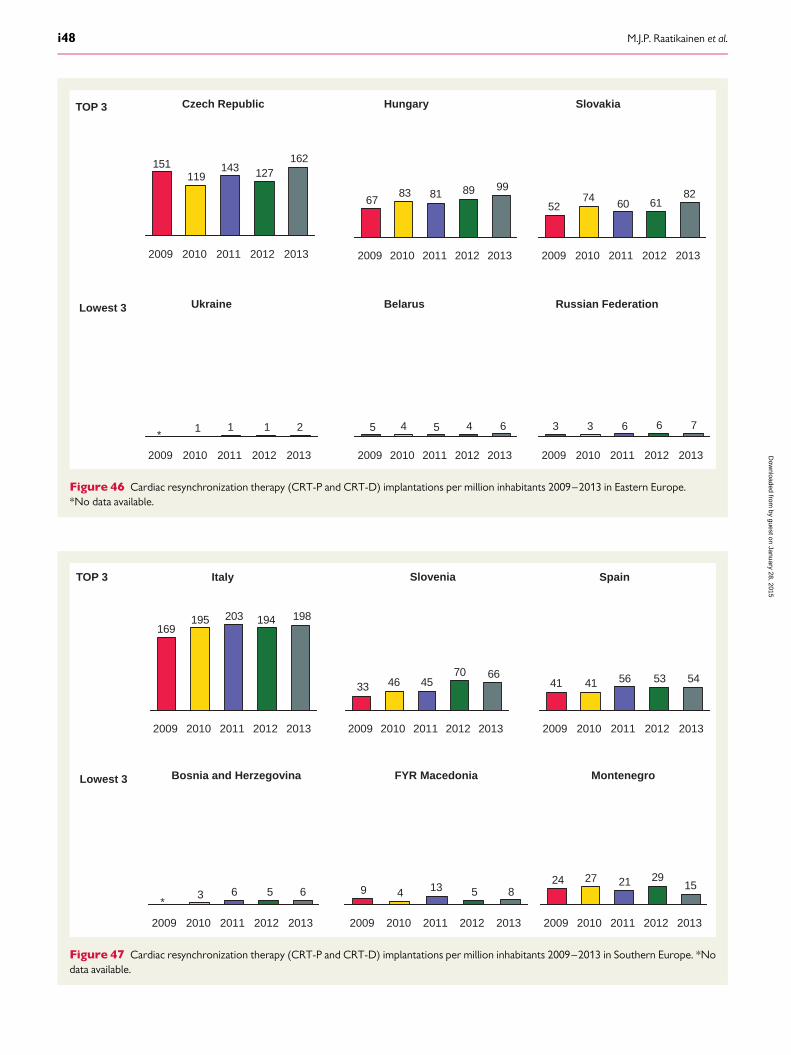
Slovakia
82616074
52
2011 2013201220102009
TOP 3
Lowest 3 Ukraine
211 1
20102009 20122011 2013
Hungary
9989818367
20132012201120102009
Belarus
64545
2009 2011 2012 20132010
Czech Republic
162127143
119151
20132012201120102009
Russian Federation
76633
20132012201120102009
*
Figure 46 Cardiac resynchronization therapy (CRT-P and CRT-D) implantations per million inhabitants 2009–2013 in Eastern Europe.*No data available.
Spain
5453564141
20132012201120102009
TOP 3
Lowest 3
Slovenia
6670454633
20132012201120102009
Bosnia and Herzegovina
6563
20132012201120102009
Italy
198194203195169
20132012201120102009
FYR Macedonia
851349
20132012201120102009
Montenegro
1529212724
20132012201120102009
*
Figure 47 Cardiac resynchronization therapy (CRT-P and CRT-D) implantations per million inhabitants 2009–2013 in Southern Europe. *Nodata available.
M.J.P. Raatikainen et al.i48
by guest on January 28, 2015D
ownloaded from
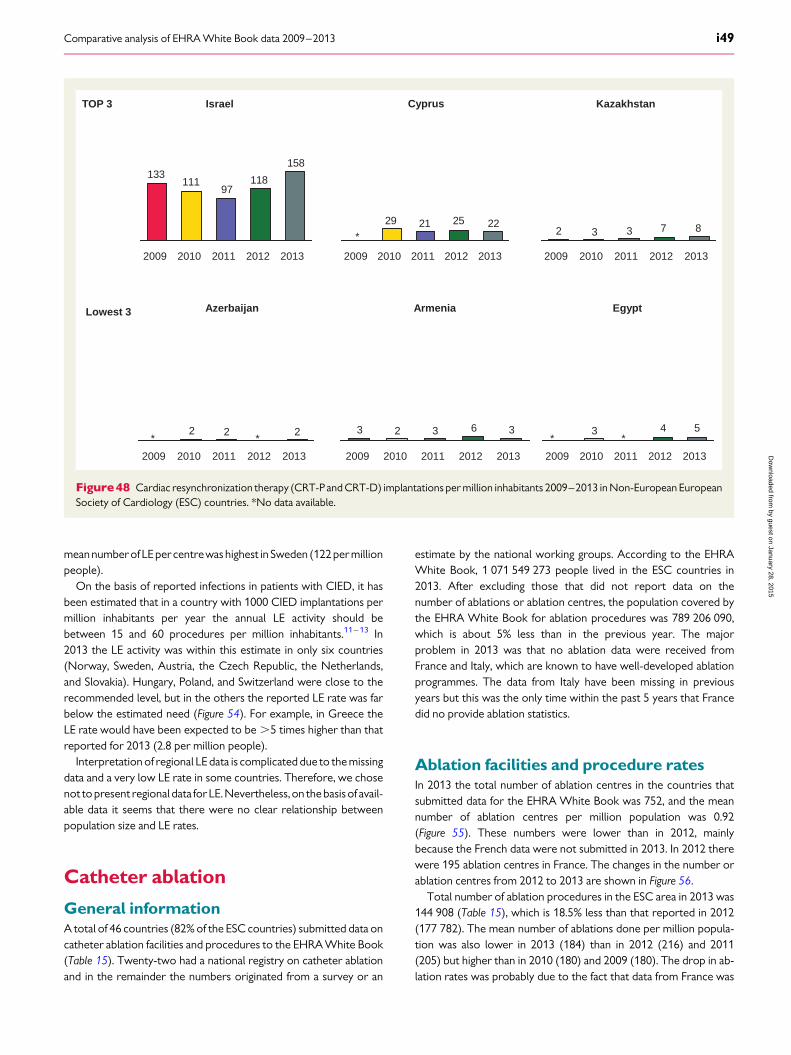
meannumberof LE percentrewas highest in Sweden (122per millionpeople).
On the basis of reported infections in patients with CIED, it hasbeen estimated that in a country with 1000 CIED implantations permillion inhabitants per year the annual LE activity should bebetween 15 and 60 procedures per million inhabitants.11– 13 In2013 the LE activity was within this estimate in only six countries(Norway, Sweden, Austria, the Czech Republic, the Netherlands,and Slovakia). Hungary, Poland, and Switzerland were close to therecommended level, but in the others the reported LE rate was farbelow the estimated need (Figure 54). For example, in Greece theLE rate would have been expected to be .5 times higher than thatreported for 2013 (2.8 per million people).
Interpretation of regional LE data is complicated due to the missingdata and a very low LE rate in some countries. Therefore, we chosenot to present regional data forLE. Nevertheless, on the basisof avail-able data it seems that there were no clear relationship betweenpopulation size and LE rates.
Catheter ablation
General informationA total of 46 countries (82% of the ESC countries) submitted data oncatheter ablation facilities and procedures to the EHRA White Book(Table 15). Twenty-two had a national registry on catheter ablationand in the remainder the numbers originated from a survey or an
estimate by the national working groups. According to the EHRAWhite Book, 1 071 549 273 people lived in the ESC countries in2013. After excluding those that did not report data on thenumber of ablations or ablation centres, the population covered bythe EHRA White Book for ablation procedures was 789 206 090,which is about 5% less than in the previous year. The majorproblem in 2013 was that no ablation data were received fromFrance and Italy, which are known to have well-developed ablationprogrammes. The data from Italy have been missing in previousyears but this was the only time within the past 5 years that Francedid no provide ablation statistics.
Ablation facilities and procedure ratesIn 2013 the total number of ablation centres in the countries thatsubmitted data for the EHRA White Book was 752, and the meannumber of ablation centres per million population was 0.92(Figure 55). These numbers were lower than in 2012, mainlybecause the French data were not submitted in 2013. In 2012 therewere 195 ablation centres in France. The changes in the number orablation centres from 2012 to 2013 are shown in Figure 56.
Total number of ablation procedures in the ESC area in 2013 was144 908 (Table 15), which is 18.5% less than that reported in 2012(177 782). The mean number of ablations done per million popula-tion was also lower in 2013 (184) than in 2012 (216) and 2011(205) but higher than in 2010 (180) and 2009 (180). The drop in ab-lation rates was probably due to the fact that data from France was
Kazakhstan
87332
20132012201120102009
TOP 3
Lowest 3
Cyprus
22252129
20132010 2011 20122009
Azerbaijan
222
2011 201320102009 2012
Israel
158
11897
111133
201320102009 20122011
Armenia
36323
2010 2013201220112009
Egypt
543
2011 2013201220102009
* * * *
*
Figure48 Cardiac resynchronization therapy (CRT-P and CRT-D) implantations per million inhabitants 2009–2013 in Non-European EuropeanSociety of Cardiology (ESC) countries. *No data available.
Comparative analysis of EHRA White Book data 2009–2013 i49
by guest on January 28, 2015D
ownloaded from
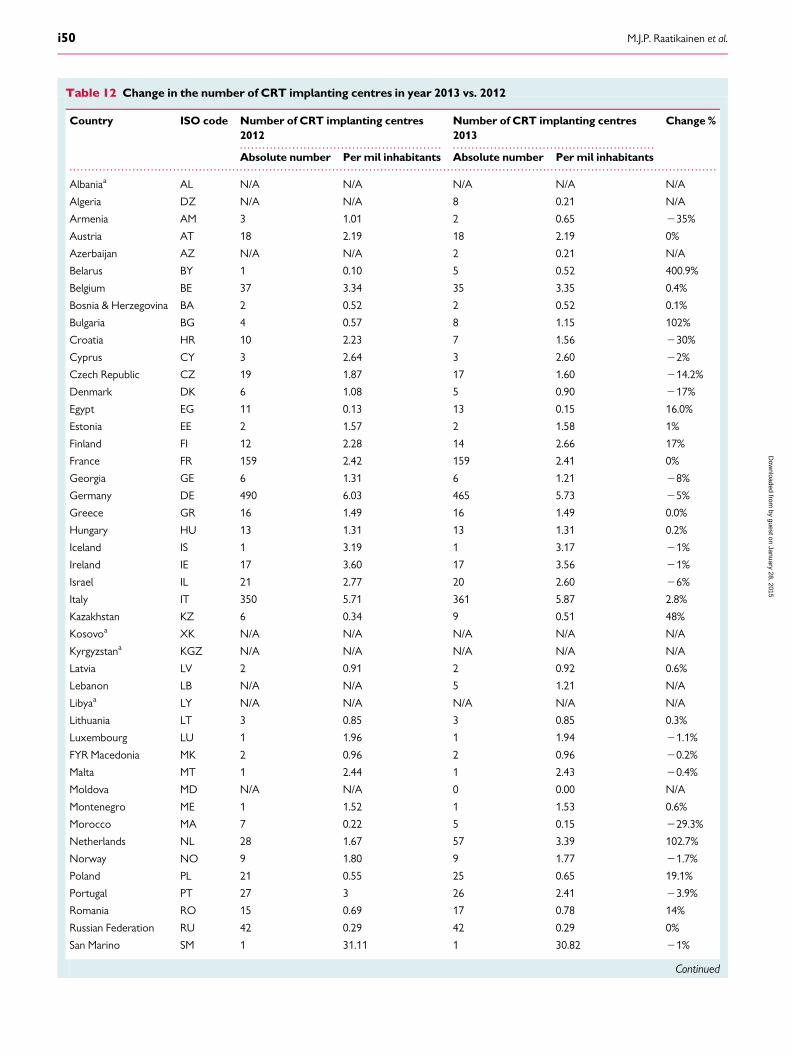
. . . . . . . . . . . . . . . . . . . . . . . . . . . . . . . . . . . . . . . . . . . . . . . . . . . . . . . . . . . . . . . . . . . . . . . . . . . . . . . . . . . . . . . . . . . . . . . . . . . . . . . . . . . .
. . . . . . . . . . . . . . . . . . . . . . . . . . . . . . . . . . . . . . . . . . . . . . . . . . . . . . . . . . . . . . . . . . . . . . . . . . . . . . . . . . . . . . . . . . . . . . . . . . . . . . . . . . . . . . . . . . . . . . . . . . . . . . . . . . . . . . . . . . . . . . . . . . . . . . . . . . . . . . . . . . . . . . . . . . . . . . .
Table 12 Change in the number of CRT implanting centres in year 2013 vs. 2012
Country ISO code Number of CRT implanting centres2012
Number of CRT implanting centres2013
Change %
Absolute number Per mil inhabitants Absolute number Per mil inhabitants
Albaniaa AL N/A N/A N/A N/A N/A
Algeria DZ N/A N/A 8 0.21 N/A
Armenia AM 3 1.01 2 0.65 235%
Austria AT 18 2.19 18 2.19 0%
Azerbaijan AZ N/A N/A 2 0.21 N/A
Belarus BY 1 0.10 5 0.52 400.9%
Belgium BE 37 3.34 35 3.35 0.4%
Bosnia & Herzegovina BA 2 0.52 2 0.52 0.1%
Bulgaria BG 4 0.57 8 1.15 102%
Croatia HR 10 2.23 7 1.56 230%
Cyprus CY 3 2.64 3 2.60 22%
Czech Republic CZ 19 1.87 17 1.60 214.2%
Denmark DK 6 1.08 5 0.90 217%
Egypt EG 11 0.13 13 0.15 16.0%
Estonia EE 2 1.57 2 1.58 1%
Finland FI 12 2.28 14 2.66 17%
France FR 159 2.42 159 2.41 0%
Georgia GE 6 1.31 6 1.21 28%
Germany DE 490 6.03 465 5.73 25%
Greece GR 16 1.49 16 1.49 0.0%
Hungary HU 13 1.31 13 1.31 0.2%
Iceland IS 1 3.19 1 3.17 21%
Ireland IE 17 3.60 17 3.56 21%
Israel IL 21 2.77 20 2.60 26%
Italy IT 350 5.71 361 5.87 2.8%
Kazakhstan KZ 6 0.34 9 0.51 48%
Kosovoa XK N/A N/A N/A N/A N/A
Kyrgyzstana KGZ N/A N/A N/A N/A N/A
Latvia LV 2 0.91 2 0.92 0.6%
Lebanon LB N/A N/A 5 1.21 N/A
Libyaa LY N/A N/A N/A N/A N/A
Lithuania LT 3 0.85 3 0.85 0.3%
Luxembourg LU 1 1.96 1 1.94 21.1%
FYR Macedonia MK 2 0.96 2 0.96 20.2%
Malta MT 1 2.44 1 2.43 20.4%
Moldova MD N/A N/A 0 0.00 N/A
Montenegro ME 1 1.52 1 1.53 0.6%
Morocco MA 7 0.22 5 0.15 229.3%
Netherlands NL 28 1.67 57 3.39 102.7%
Norway NO 9 1.80 9 1.77 21.7%
Poland PL 21 0.55 25 0.65 19.1%
Portugal PT 27 3 26 2.41 23.9%
Romania RO 15 0.69 17 0.78 14%
Russian Federation RU 42 0.29 42 0.29 0%
San Marino SM 1 31.11 1 30.82 21%
Continued
M.J.P. Raatikainen et al.i50
by guest on January 28, 2015D
ownloaded from
not available and that there was a decrease in the number of ablations(from 38 000 in 2012 to 33 000 in 2013) reported by Germany.
The number of catheter ablations per million inhabitants is shownin Figures 57 and 58. In these figures the ESC countries are grouped in
quartiles according to their ablation activities. As in previous years,most countries in the top quartile were from Northern andWestern Europe. European Society of Cardiology countriesoutside Europe had low ablation activity and they are mostly found
. . . . . . . . . . . . . . . . . . . . . . . . . . . . . . . . . . . . . . . . . . . . . . . . . . . . . . . . . . . . . . . . . . . . . . . . . . . . . . . . . . . . . . . . . . . . . . . . . . . . . . . . . . . .
. . . . . . . . . . . . . . . . . . . . . . . . . . . . . . . . . . . . . . . . . . . . . . . . . . . . . . . . . . . . . . . . . . . . . . . . . . . . . . . . . . . . . . . . . . . . . . . . . . . . . . . . . . . . . . . . . . . . . . . . . . . . . . . . . . . . . . . . . . . . . . . . . . . . . . . . . . . . . . . . . . . . . . . . . . . . . . .
Table 12 Continued
Country ISO code Number of CRT implanting centres2012
Number of CRT implanting centres2013
Change %
Absolute number Per mil inhabitants Absolute number Per mil inhabitants
Serbia RS 6 0.82 6 0.83 0.5%
Slovakia SK 4 0.73 5 0.91 25%
Slovenia SI 2 1.00 2 1.00 0%
Spain ES 125 2.66 130 2.74 3.3%
Swedena SE 33 3.62 N/A N/A N/A
Switzerland CH 34 4.29 31 3.88 210%
Syriaa SY N/A N/A N/A N/A N/A
Tunisiaa TN 5 0 N/A N/A N/A
Turkeya TR N/A N/A N/A N/A N/A
Ukraine UA 11 0.24 13 0.29 20%
United Kingdom GB 114 1.81 109 1.72 25%
aThese eight countries did not submit data on CRT implantation centres for the EHRA White Book 2014.
1.02.2
0.21.1
1.94.3
1.32.8
6.01.8
2.51.8
2.63.6
2.0
3.22.42.4
1.01.5
2.20.30.5
1.31.0
0.93.3
0.81.5
0.91.6
5.72.7
0.70.1
2.30.5
0.2
0.30.6
1.70.1
0.7
ArmeniaCroatia
MoroccoDenmark
Czech RepublicSwitzerland
GeorgiaIsrael
GermanyUnited Kingdom
PortugalNorwayCyprusIreland
LuxembourgSan Marino 31.1
IcelandFrance
MaltaFYR Macedonia
GreeceAustria
Russian FederationBosnia & Herzegovina
HungarySloveniaLithuaniaBelgium
SerbiaMontenegro
LatviaEstonia
2012
SpainRomania
EgyptFinlandPoland
Italy
SlovakiaKazakhstan
BulgariaNetherlands
Belarus
Ukraine
–35.4–29.9–29.3–16.9–14.2
–9.6–7.5–6.2–4.9–4.9–3.9–1.7–1.5–1.1–1.1–0.9–0.7–0.5–0.4–0.20.00.0
0.00.10.20.20.30.40.50.60.60.72.83.313.616.016.619.120.424.9
48.2101.6102.7
400.9
2013 vs. 2012 in %
0.71.6
0.20.9
1.63.9
1.22.6
5.71.7
2.41.8
2.63.6
1.9
3.22.42.4
1.01.5
2.20.3
0.51.3
1.00.9
3.40.8
1.50.9
1.65.9
2.70.8
0.22.7
0.70.3
0.90.5
1.13.4
0.5
2013
30.8
Figure 49 Change in the number of cardiac resyncronization therapy device implanting centres per million inhabitants from 2012 to 2013.
Comparative analysis of EHRA White Book data 2009–2013 i51
by guest on January 28, 2015D
ownloaded from
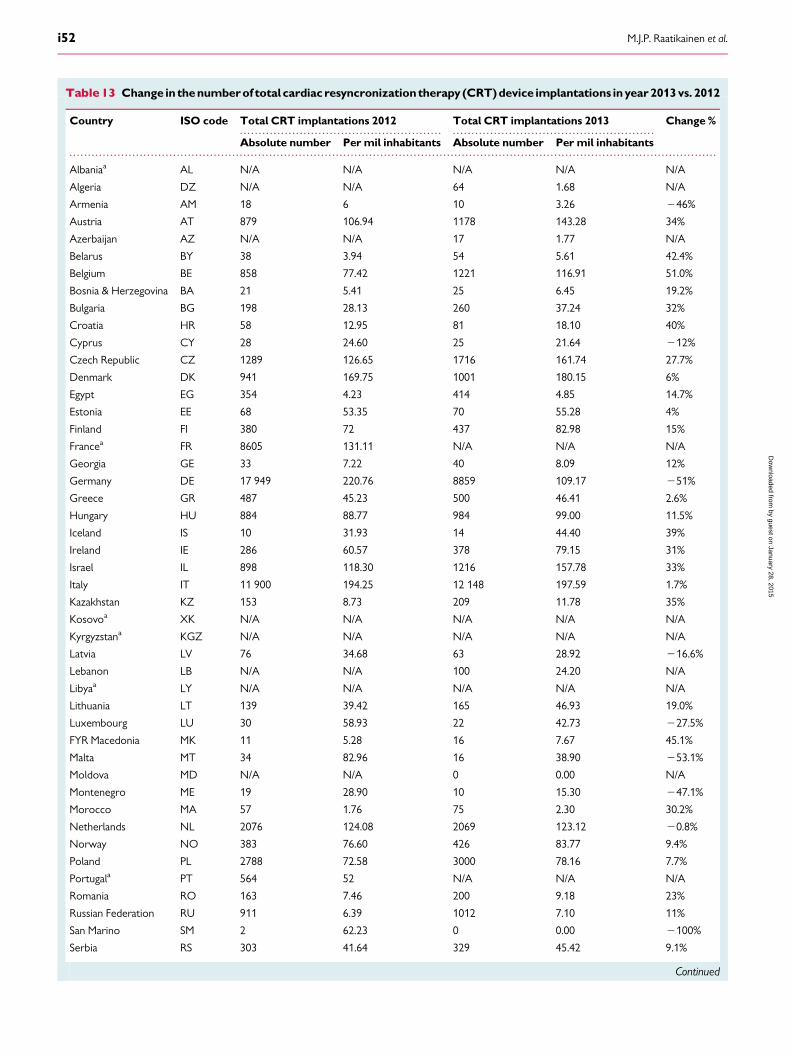
. . . . . . . . . . . . . . . . . . . . . . . . . . . . . . . . . . . . . . . . . . . . . . . . . . . . . . . . . . . . . . . . . . . . . . . . . . . . . . . . . . . . . . . . . . . . . . . . . . . . . . . . . . . .
. . . . . . . . . . . . . . . . . . . . . . . . . . . . . . . . . . . . . . . . . . . . . . . . . . . . . . . . . . . . . . . . . . . . . . . . . . . . . . . . . . . . . . . . . . . . . . . . . . . . . . . . . . . . . . . . . . . . . . . . . . . . . . . . . . . . . . . . . . . . . . . . . . . . . . . . . . . . . . . . . . . . . . . . . . . . . . .
Table13 Change in thenumberof total cardiac resyncronization therapy (CRT)device implantations in year2013vs. 2012
Country ISO code Total CRT implantations 2012 Total CRT implantations 2013 Change %
Absolute number Per mil inhabitants Absolute number Per mil inhabitants
Albaniaa AL N/A N/A N/A N/A N/A
Algeria DZ N/A N/A 64 1.68 N/A
Armenia AM 18 6 10 3.26 246%
Austria AT 879 106.94 1178 143.28 34%
Azerbaijan AZ N/A N/A 17 1.77 N/A
Belarus BY 38 3.94 54 5.61 42.4%
Belgium BE 858 77.42 1221 116.91 51.0%
Bosnia & Herzegovina BA 21 5.41 25 6.45 19.2%
Bulgaria BG 198 28.13 260 37.24 32%
Croatia HR 58 12.95 81 18.10 40%
Cyprus CY 28 24.60 25 21.64 212%
Czech Republic CZ 1289 126.65 1716 161.74 27.7%
Denmark DK 941 169.75 1001 180.15 6%
Egypt EG 354 4.23 414 4.85 14.7%
Estonia EE 68 53.35 70 55.28 4%
Finland FI 380 72 437 82.98 15%
Francea FR 8605 131.11 N/A N/A N/A
Georgia GE 33 7.22 40 8.09 12%
Germany DE 17 949 220.76 8859 109.17 251%
Greece GR 487 45.23 500 46.41 2.6%
Hungary HU 884 88.77 984 99.00 11.5%
Iceland IS 10 31.93 14 44.40 39%
Ireland IE 286 60.57 378 79.15 31%
Israel IL 898 118.30 1216 157.78 33%
Italy IT 11 900 194.25 12 148 197.59 1.7%
Kazakhstan KZ 153 8.73 209 11.78 35%
Kosovoa XK N/A N/A N/A N/A N/A
Kyrgyzstana KGZ N/A N/A N/A N/A N/A
Latvia LV 76 34.68 63 28.92 216.6%
Lebanon LB N/A N/A 100 24.20 N/A
Libyaa LY N/A N/A N/A N/A N/A
Lithuania LT 139 39.42 165 46.93 19.0%
Luxembourg LU 30 58.93 22 42.73 227.5%
FYR Macedonia MK 11 5.28 16 7.67 45.1%
Malta MT 34 82.96 16 38.90 253.1%
Moldova MD N/A N/A 0 0.00 N/A
Montenegro ME 19 28.90 10 15.30 247.1%
Morocco MA 57 1.76 75 2.30 30.2%
Netherlands NL 2076 124.08 2069 123.12 20.8%
Norway NO 383 76.60 426 83.77 9.4%
Poland PL 2788 72.58 3000 78.16 7.7%
Portugala PT 564 52 N/A N/A N/A
Romania RO 163 7.46 200 9.18 23%
Russian Federation RU 911 6.39 1012 7.10 11%
San Marino SM 2 62.23 0 0.00 2100%
Serbia RS 303 41.64 329 45.42 9.1%
Continued
M.J.P. Raatikainen et al.i52
by guest on January 28, 2015D
ownloaded from
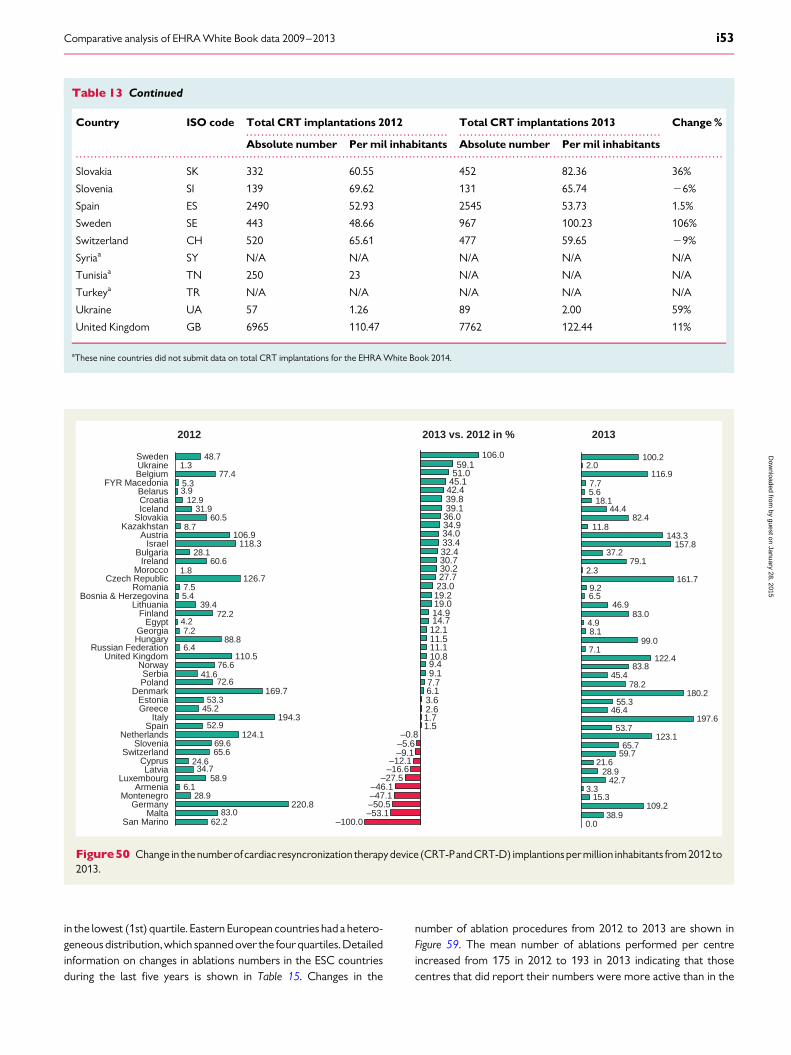
in the lowest (1st) quartile. Eastern European countries had a hetero-geneousdistribution, which spanned over the four quartiles. Detailedinformation on changes in ablations numbers in the ESC countriesduring the last five years is shown in Table 15. Changes in the
number of ablation procedures from 2012 to 2013 are shown inFigure 59. The mean number of ablations performed per centreincreased from 175 in 2012 to 193 in 2013 indicating that thosecentres that did report their numbers were more active than in the
. . . . . . . . . . . . . . . . . . . . . . . . . . . . . . . . . . . . . . . . . . . . . . . . . . . . . . . . . . . . . . . . . . . . . . . . . . . . . . . . . . . . . . . . . . . . . . . . . . . . . . . . . . . .
. . . . . . . . . . . . . . . . . . . . . . . . . . . . . . . . . . . . . . . . . . . . . . . . . . . . . . . . . . . . . . . . . . . . . . . . . . . . . . . . . . . . . . . . . . . . . . . . . . . . . . . . . . . . . . . . . . . . . . . . . . . . . . . . . . . . . . . . . . . . . . . . . . . . . . . . . . . . . . . . . . . . . . . . . . . . . . .
Table 13 Continued
Country ISO code Total CRT implantations 2012 Total CRT implantations 2013 Change %
Absolute number Per mil inhabitants Absolute number Per mil inhabitants
Slovakia SK 332 60.55 452 82.36 36%
Slovenia SI 139 69.62 131 65.74 26%
Spain ES 2490 52.93 2545 53.73 1.5%
Sweden SE 443 48.66 967 100.23 106%
Switzerland CH 520 65.61 477 59.65 29%
Syriaa SY N/A N/A N/A N/A N/A
Tunisiaa TN 250 23 N/A N/A N/A
Turkeya TR N/A N/A N/A N/A N/A
Ukraine UA 57 1.26 89 2.00 59%
United Kingdom GB 6965 110.47 7762 122.44 11%
aThese nine countries did not submit data on total CRT implantations for the EHRA White Book 2014.
62.283.0
28.96.1
58.934.7
24.665.669.6
52.9
45.253.3
72.641.6
76.6
6.488.8
7.24.2
72.239.4
5.47.5
1.860.6
28.1
8.760.5
31.912.9
3.95.3
77.41.3
48.7
San MarinoMalta
Germany 220.8Montenegro
ArmeniaLuxembourg
LatviaCyprus
SwitzerlandSlovenia
Netherlands 124.1Spain
Italy 194.3GreeceEstonia
Denmark 169.7PolandSerbia
NorwayUnited Kingdom 110.5
Russian Federation
2012
HungaryGeorgia
EgyptFinland
LithuaniaBosnia & Herzegovina
RomaniaCzech Republic 126.7
MoroccoIreland
BulgariaIsrael 118.3
Austria 106.9Kazakhstan
SlovakiaIcelandCroatiaBelarus
FYR MacedoniaBelgiumUkraineSweden
–9.1–5.6–0.8
1.51.72.63.66.17.79.19.410.811.111.512.114.714.919.019.223.027.730.230.732.433.434.034.936.039.139.842.445.151.059.1
2013 vs. 2012 in %
–100.0–53.1–50.5–47.1–46.1
–27.5–16.6–12.1
106.0
0.038.9
109.215.3
3.342.7
28.921.6
59.765.7
123.153.7
197.646.4
55.3180.2
78.245.4
83.8122.4
7.199.0
8.14.9
83.046.9
6.59.2
161.72.3
79.137.2
157.8143.3
11.882.4
44.418.1
5.67.7
116.92.0
100.2
2013
Figure50 Change in thenumberof cardiac resyncronization therapy device (CRT-PandCRT-D) implantionsper million inhabitants from2012 to2013.
Comparative analysis of EHRA White Book data 2009–2013 i53
by guest on January 28, 2015D
ownloaded from
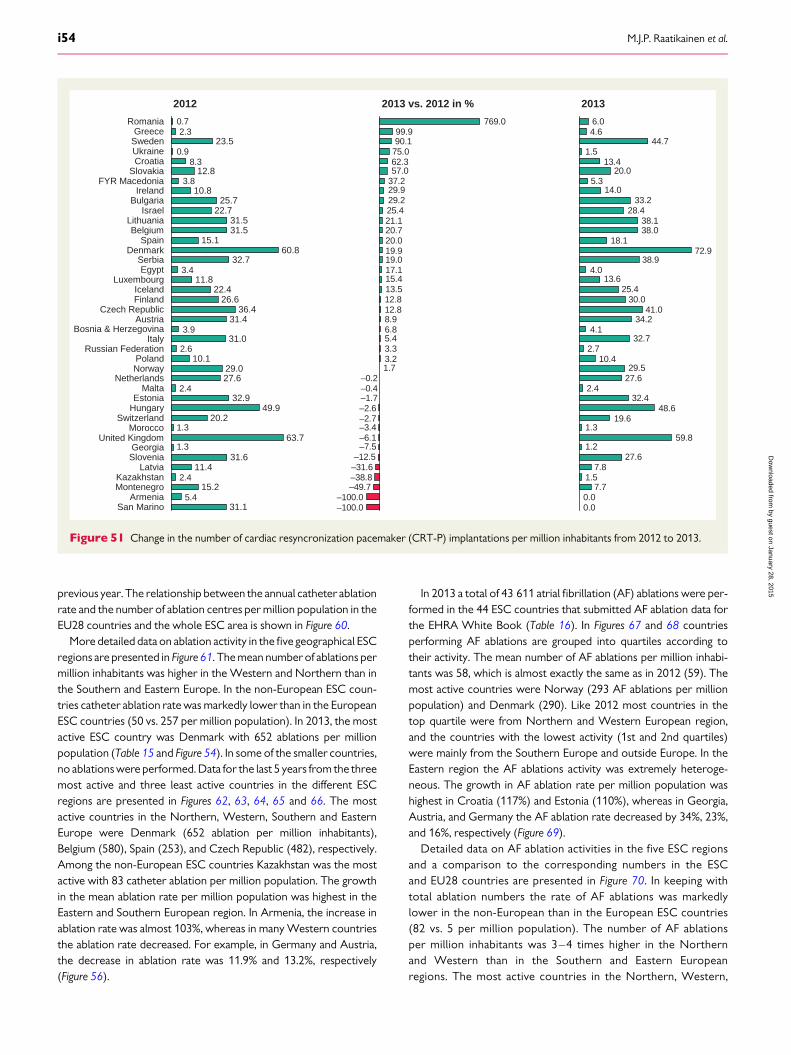
previous year. The relationship between the annual catheter ablationrate and the number of ablation centres per million population in theEU28 countries and the whole ESC area is shown in Figure 60.
More detailed data on ablation activity in the five geographical ESCregions are presented in Figure 61. The mean number of ablations permillion inhabitants was higher in the Western and Northern than inthe Southern and Eastern Europe. In the non-European ESC coun-tries catheter ablation rate was markedly lower than in the EuropeanESC countries (50 vs. 257 per million population). In 2013, the mostactive ESC country was Denmark with 652 ablations per millionpopulation (Table 15 and Figure 54). In some of the smaller countries,no ablations were performed. Data for the last 5 years from the threemost active and three least active countries in the different ESCregions are presented in Figures 62, 63, 64, 65 and 66. The mostactive countries in the Northern, Western, Southern and EasternEurope were Denmark (652 ablation per million inhabitants),Belgium (580), Spain (253), and Czech Republic (482), respectively.Among the non-European ESC countries Kazakhstan was the mostactive with 83 catheter ablation per million population. The growthin the mean ablation rate per million population was highest in theEastern and Southern European region. In Armenia, the increase inablation rate was almost 103%, whereas in many Western countriesthe ablation rate decreased. For example, in Germany and Austria,the decrease in ablation rate was 11.9% and 13.2%, respectively(Figure 56).
In 2013 a total of 43 611 atrial fibrillation (AF) ablations were per-formed in the 44 ESC countries that submitted AF ablation data forthe EHRA White Book (Table 16). In Figures 67 and 68 countriesperforming AF ablations are grouped into quartiles according totheir activity. The mean number of AF ablations per million inhabi-tants was 58, which is almost exactly the same as in 2012 (59). Themost active countries were Norway (293 AF ablations per millionpopulation) and Denmark (290). Like 2012 most countries in thetop quartile were from Northern and Western European region,and the countries with the lowest activity (1st and 2nd quartiles)were mainly from the Southern Europe and outside Europe. In theEastern region the AF ablations activity was extremely heteroge-neous. The growth in AF ablation rate per million population washighest in Croatia (117%) and Estonia (110%), whereas in Georgia,Austria, and Germany the AF ablation rate decreased by 34%, 23%,and 16%, respectively (Figure 69).
Detailed data on AF ablation activities in the five ESC regionsand a comparison to the corresponding numbers in the ESCand EU28 countries are presented in Figure 70. In keeping withtotal ablation numbers the rate of AF ablations was markedlylower in the non-European than in the European ESC countries(82 vs. 5 per million population). The number of AF ablationsper million inhabitants was 3–4 times higher in the Northernand Western than in the Southern and Eastern Europeanregions. The most active countries in the Northern, Western,
5.4
2.4
1.3
1.3
2.4
2.6
3.9
3.4
3.8
8.30.9
2.30.7
2012
Montenegro 15.2Kazakhstan
Latvia 11.4Slovenia 31.6Georgia
United Kingdom 63.7Morocco
Switzerland 20.2Hungary 49.9Estonia 32.9
MaltaNetherlands 27.6
Norway 29.0Poland 10.1
Russian FederationItaly 31.0
Bosnia & HerzegovinaAustria 31.4
Czech Republic 36.4Finland 26.6Iceland 22.4
Luxembourg 11.8Egypt
Serbia 32.7Denmark 60.8
Spain 15.1Belgium 31.5
Lithuania 31.5Israel 22.7
Bulgaria 25.7Ireland 10.8
FYR MacedoniaSlovakia 12.8
CroatiaUkraineSweden 23.5Greece
Romania
31.1Armenia
San Marino –100.0–100.0
–49.7–38.8–31.6–12.5
–7.5–6.1–3.4–2.7–2.6–1.7–0.4–0.2
1.73.23.35.46.88.912.812.813.515.417.119.019.920.020.721.125.429.229.937.257.062.375.090.199.9
769.0
2013 vs. 2012 in %
0.00.0
7.71.5
7.827.6
1.259.8
1.319.6
48.632.4
2.427.629.5
10.42.7
32.74.1
34.241.0
30.025.4
13.64.0
38.972.9
18.138.038.1
28.433.2
14.05.3
20.013.4
1.544.7
4.66.0
2013
Figure 51 Change in the number of cardiac resyncronization pacemaker (CRT-P) implantations per million inhabitants from 2012 to 2013.
M.J.P. Raatikainen et al.i54
by guest on January 28, 2015D
ownloaded from
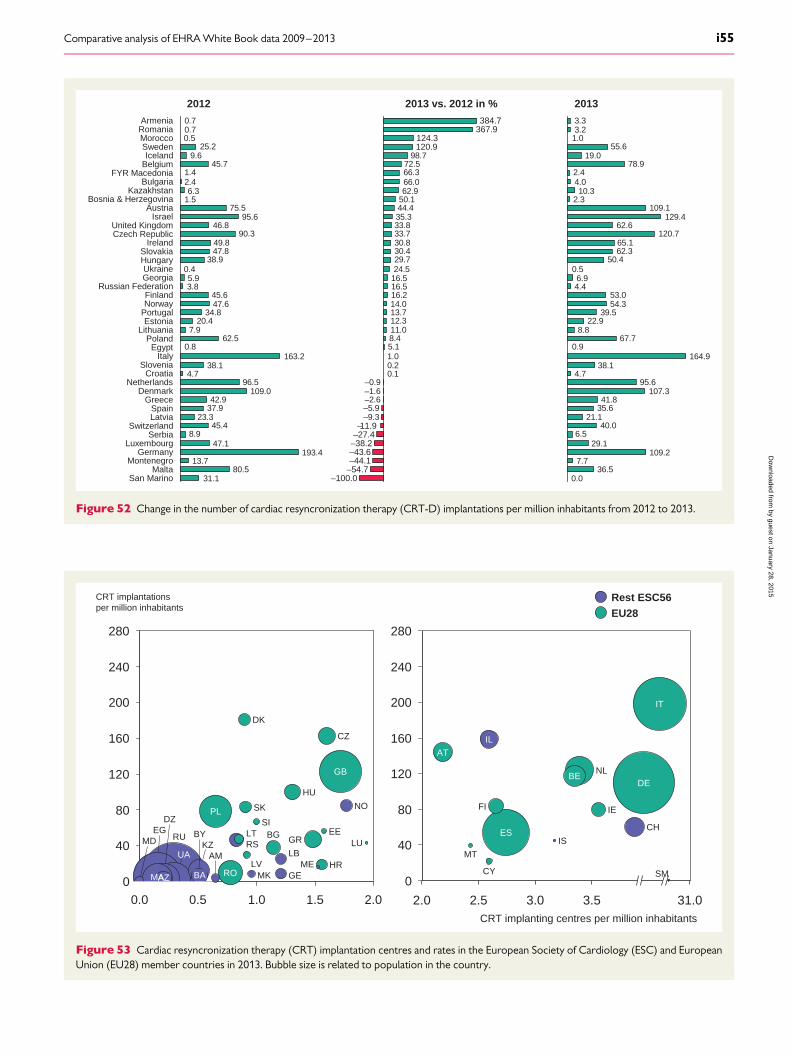
31.180.5
13.7193.4
47.18.9
45.423.3
37.942.9
109.096.5
4.738.1
163.20.8
62.57.9
20.434.8
47.645.6
3.85.9
0.438.9
47.849.8
90.346.8
95.675.5
1.56.3
2.41.4
45.79.6
25.20.50.70.7
2012
MontenegroGermany
LuxembourgSerbia
SwitzerlandLatviaSpain
GreeceDenmark
NetherlandsCroatia
SloveniaItaly
EgyptPoland
LithuaniaEstonia
PortugalNorwayFinland
Russian FederationGeorgiaUkraine
HungarySlovakia
IrelandCzech RepublicUnited Kingdom
IsraelAustria
Bosnia & HerzegovinaKazakhstan
BulgariaFYR Macedonia
BelgiumIceland
SwedenMoroccoRomaniaArmenia
MaltaSan Marino
–9.3–5.9–2.6–1.6–0.9
0.10.21.05.18.411.012.313.714.016.216.516.524.529.730.430.833.733.835.344.450.162.966.066.372.5
98.7
2013 vs. 2012 in %
–44.1–43.6–38.2–27.4–11.9
120.9124.3
367.9384.7
–54.7–100.0 0.0
36.57.7
109.229.1
6.540.0
21.135.641.8
107.395.6
4.738.1
164.90.9
67.78.8
22.939.5
54.353.0
4.46.9
0.550.4
62.365.1
120.762.6
129.4109.1
2.310.3
4.02.4
78.919.0
55.61.03.23.3
2013
Figure 52 Change in the number of cardiac resyncronization therapy (CRT-D) implantations per million inhabitants from 2012 to 2013.
0
40
80
120
160
200
240
280
31.03.53.02.52.0CRT implanting centres per million inhabitants
AT
MT
IL
CY
FI
ESIS
BENL
IE
CH
DE
IT
SM0
40
80
120
160
200
240
280
0.0 0.5 1.0 1.5 2.0
CRT implantationsper million inhabitants
MDEG
MAAZ
DZ
UA
RUKZ
BA
BY
PL
AM
RO
RSLT
DK
SK
LV ME HR
EE
CZ
GB
NO
LU
SIBG
LB
GE
HU
GR
MK
Rest ESC56EU28
Figure 53 Cardiac resyncronization therapy (CRT) implantation centres and rates in the European Society of Cardiology (ESC) and EuropeanUnion (EU28) member countries in 2013. Bubble size is related to population in the country.
Comparative analysis of EHRA White Book data 2009–2013 i55
by guest on January 28, 2015D
ownloaded from
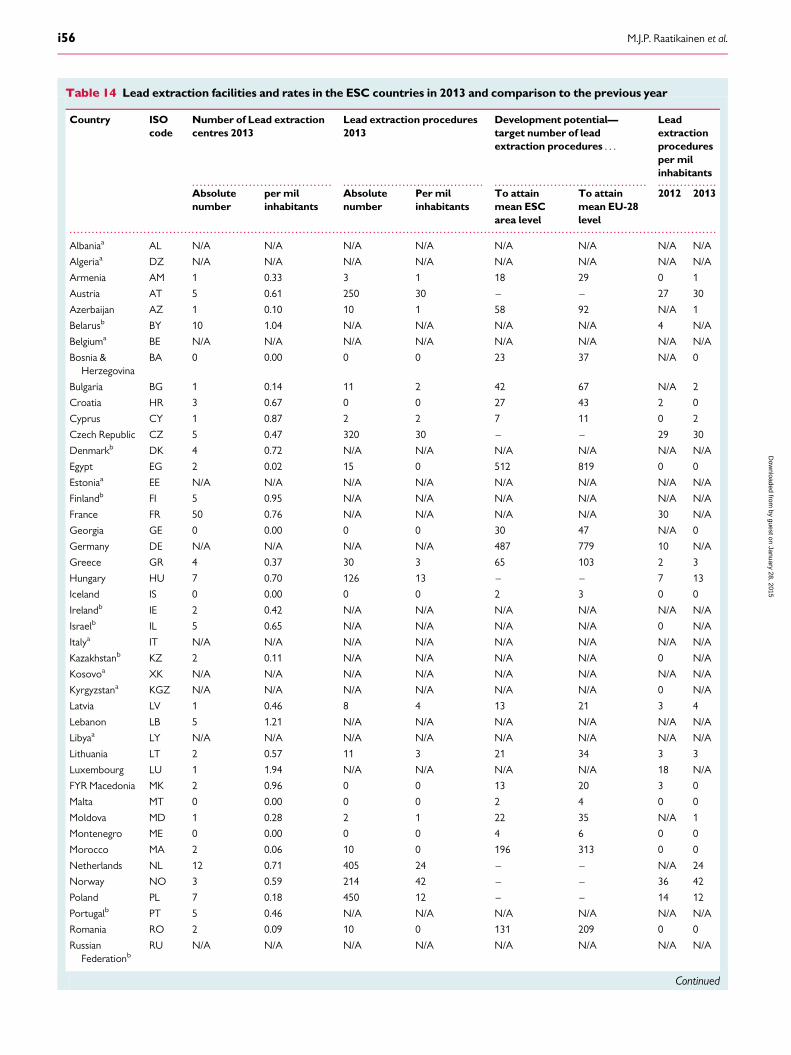
. . . . . . . . . . . . . . . . . . . . . . . . . . . . . . . . . . . . . . . . . . . . . . . . . . . . . . . . . . . . . . . . . . . . . . . . . . . . . . . . . . . . . . . . . . . . . . . . . . . . . . . . . . . . . . . . . . . . . . . . . . . . . . . . . . . .
. . . . . . . . . . . . . . . . . . . . . . . . . . . . . . . . . . . . . . . . . . . . . . . . . . . . . . . . . . . . . . . . . . . . . . . . . . . . . . . . . . . . . . . . . . . . . . . . . . . . . . . . . . . . . . . . . . . . . . . . . . . . . . . . . . . . . . . . . . . . . . . . . . . . . . . . . . . . . . . . . . . . . . . . . . . . . . .
Table 14 Lead extraction facilities and rates in the ESC countries in 2013 and comparison to the previous year
Country ISOcode
Number of Lead extractioncentres 2013
Lead extraction procedures2013
Development potential—target number of leadextraction procedures . . .
Leadextractionproceduresper milinhabitants
Absolutenumber
per milinhabitants
Absolutenumber
Per milinhabitants
To attainmean ESCarea level
To attainmean EU-28level
2012 2013
Albaniaa AL N/A N/A N/A N/A N/A N/A N/A N/A
Algeriaa DZ N/A N/A N/A N/A N/A N/A N/A N/A
Armenia AM 1 0.33 3 1 18 29 0 1
Austria AT 5 0.61 250 30 – – 27 30
Azerbaijan AZ 1 0.10 10 1 58 92 N/A 1
Belarusb BY 10 1.04 N/A N/A N/A N/A 4 N/A
Belgiuma BE N/A N/A N/A N/A N/A N/A N/A N/A
Bosnia &Herzegovina
BA 0 0.00 0 0 23 37 N/A 0
Bulgaria BG 1 0.14 11 2 42 67 N/A 2
Croatia HR 3 0.67 0 0 27 43 2 0
Cyprus CY 1 0.87 2 2 7 11 0 2
Czech Republic CZ 5 0.47 320 30 – – 29 30
Denmarkb DK 4 0.72 N/A N/A N/A N/A N/A N/A
Egypt EG 2 0.02 15 0 512 819 0 0
Estoniaa EE N/A N/A N/A N/A N/A N/A N/A N/A
Finlandb FI 5 0.95 N/A N/A N/A N/A N/A N/A
France FR 50 0.76 N/A N/A N/A N/A 30 N/A
Georgia GE 0 0.00 0 0 30 47 N/A 0
Germany DE N/A N/A N/A N/A 487 779 10 N/A
Greece GR 4 0.37 30 3 65 103 2 3
Hungary HU 7 0.70 126 13 – – 7 13
Iceland IS 0 0.00 0 0 2 3 0 0
Irelandb IE 2 0.42 N/A N/A N/A N/A N/A N/A
Israelb IL 5 0.65 N/A N/A N/A N/A 0 N/A
Italya IT N/A N/A N/A N/A N/A N/A N/A N/A
Kazakhstanb KZ 2 0.11 N/A N/A N/A N/A 0 N/A
Kosovoa XK N/A N/A N/A N/A N/A N/A N/A N/A
Kyrgyzstana KGZ N/A N/A N/A N/A N/A N/A 0 N/A
Latvia LV 1 0.46 8 4 13 21 3 4
Lebanon LB 5 1.21 N/A N/A N/A N/A N/A N/A
Libyaa LY N/A N/A N/A N/A N/A N/A N/A N/A
Lithuania LT 2 0.57 11 3 21 34 3 3
Luxembourg LU 1 1.94 N/A N/A N/A N/A 18 N/A
FYR Macedonia MK 2 0.96 0 0 13 20 3 0
Malta MT 0 0.00 0 0 2 4 0 0
Moldova MD 1 0.28 2 1 22 35 N/A 1
Montenegro ME 0 0.00 0 0 4 6 0 0
Morocco MA 2 0.06 10 0 196 313 0 0
Netherlands NL 12 0.71 405 24 – – N/A 24
Norway NO 3 0.59 214 42 – – 36 42
Poland PL 7 0.18 450 12 – – 14 12
Portugalb PT 5 0.46 N/A N/A N/A N/A N/A N/A
Romania RO 2 0.09 10 0 131 209 0 0
RussianFederationb
RU N/A N/A N/A N/A N/A N/A N/A N/A
Continued
M.J.P. Raatikainen et al.i56
by guest on January 28, 2015D
ownloaded from
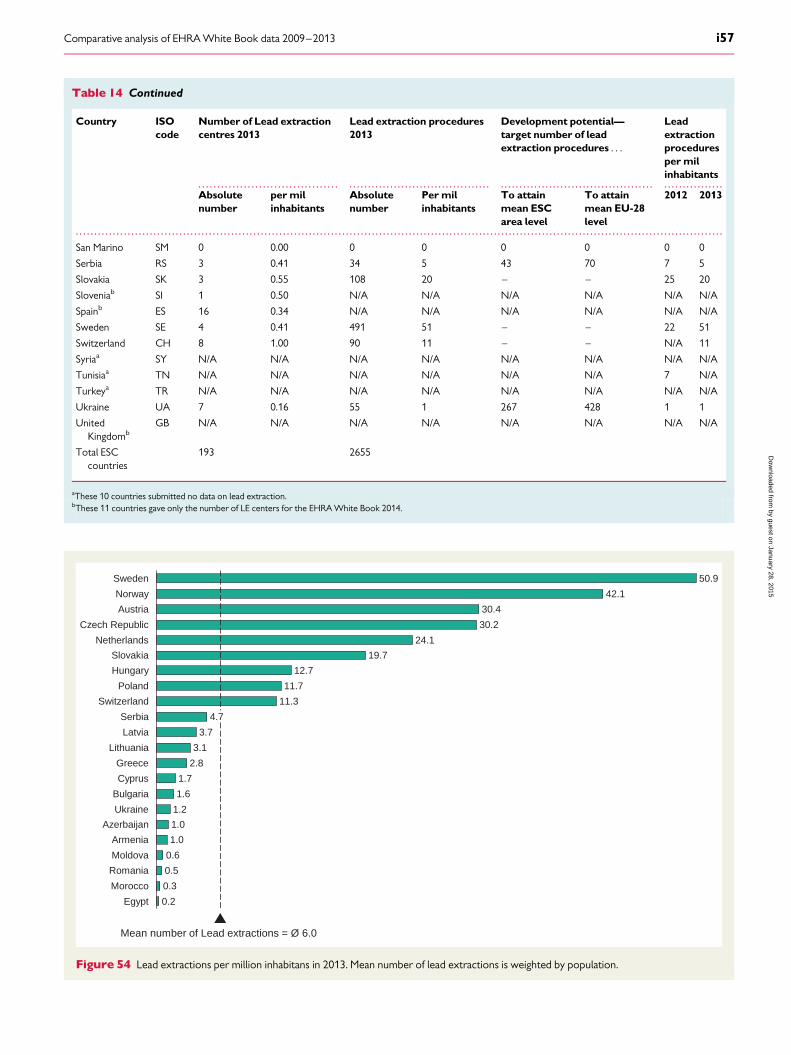
. . . . . . . . . . . . . . . . . . . . . . . . . . . . . . . . . . . . . . . . . . . . . . . . . . . . . . . . . . . . . . . . . . . . . . . . . . . . . . . . . . . . . . . . . . . . . . . . . . . . . . . . . . . . . . . . . . . . . . . . . . . . . . . . . . . .
. . . . . . . . . . . . . . . . . . . . . . . . . . . . . . . . . . . . . . . . . . . . . . . . . . . . . . . . . . . . . . . . . . . . . . . . . . . . . . . . . . . . . . . . . . . . . . . . . . . . . . . . . . . . . . . . . . . . . . . . . . . . . . . . . . . . . . . . . . . . . . . . . . . . . . . . . . . . . . . . . . . . . . . . . . . . . . .
Table 14 Continued
Country ISOcode
Number of Lead extractioncentres 2013
Lead extraction procedures2013
Development potential—target number of leadextraction procedures . . .
Leadextractionproceduresper milinhabitants
Absolutenumber
per milinhabitants
Absolutenumber
Per milinhabitants
To attainmean ESCarea level
To attainmean EU-28level
2012 2013
San Marino SM 0 0.00 0 0 0 0 0 0
Serbia RS 3 0.41 34 5 43 70 7 5
Slovakia SK 3 0.55 108 20 – – 25 20
Sloveniab SI 1 0.50 N/A N/A N/A N/A N/A N/A
Spainb ES 16 0.34 N/A N/A N/A N/A N/A N/A
Sweden SE 4 0.41 491 51 – – 22 51
Switzerland CH 8 1.00 90 11 – – N/A 11
Syriaa SY N/A N/A N/A N/A N/A N/A N/A N/A
Tunisiaa TN N/A N/A N/A N/A N/A N/A 7 N/A
Turkeya TR N/A N/A N/A N/A N/A N/A N/A N/A
Ukraine UA 7 0.16 55 1 267 428 1 1
UnitedKingdomb
GB N/A N/A N/A N/A N/A N/A N/A N/A
Total ESCcountries
193 2655
aThese 10 countries submitted no data on lead extraction.bThese 11 countries gave only the number of LE centers for the EHRA White Book 2014.
0.3
Romania 0.5
Moldova 0.6
Armenia 1.0
Azerbaijan 1.0
Ukraine 1.2
Bulgaria 1.6
Cyprus 1.7
Greece 2.8
Lithuania 3.1
Latvia 3.7
Serbia
Egypt 0.2
Morocco
4.7
Switzerland 11.3
Poland 11.7
Hungary 12.7
Slovakia 19.7
Netherlands 24.1
Czech Republic 30.2
Austria 30.4
Norway 42.1
Sweden 50.9
Mean number of Lead extractions = Ø 6.0
Figure 54 Lead extractions per million inhabitans in 2013. Mean number of lead extractions is weighted by population.
Comparative analysis of EHRA White Book data 2009–2013 i57
by guest on January 28, 2015D
ownloaded from
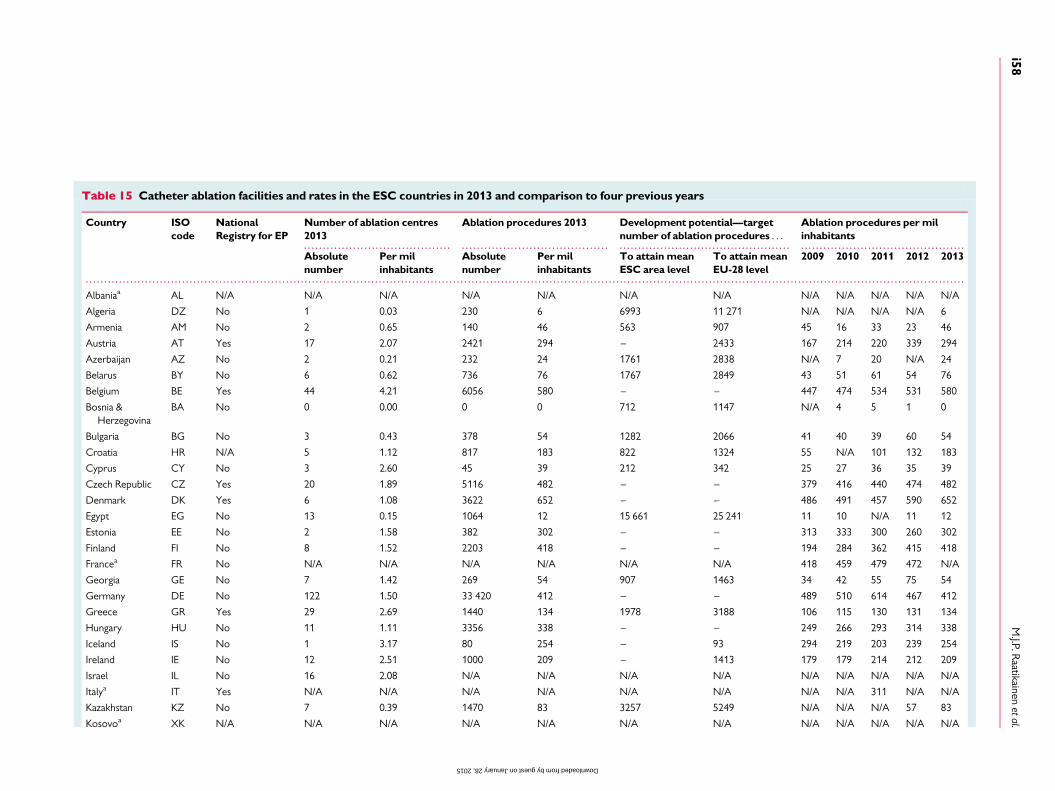
. . . . . . . . . . . . . . . . . . . . . . . . . . . . . . . . . . . . . . . . . . . . . . . . . . . . . . . . . . . . . . . . . . . . . . . . . . . . . . . . . . . . . . . . . . . . . . . . . . . . . . . . . . . . . . . . . . . . . . . . . . . . . . . . . . . . . . . . . . . . . . . . . . . . . . . . . . . . . . . . . . . . . . . .
. . . . . . . . . . . . . . . . . . . . . . . . . . . . . . . . . . . . . . . . . . . . . . . . . . . . . . . . . . . . . . . . . . . . . . . . . . . . . . . . . . . . . . . . . . . . . . . . . . . . . . . . . . . . . . . . . . . . . . . . . . . . . . . . . . . . . . . . . . . . . . . . . . . . . . . . . . . . . . . . . . . . . . . . . . . . . . . . . . . . . . . . . . . . . . . . . . . . . . . . . . . . . . . . . . . . . . . . . . . . . . . . . . . . . . . . . . . . .
Table 15 Catheter ablation facilities and rates in the ESC countries in 2013 and comparison to four previous years
Country ISOcode
NationalRegistry for EP
Number of ablation centres2013
Ablation procedures 2013 Development potential—targetnumber of ablation procedures . . .
Ablation procedures per milinhabitants
Absolutenumber
Per milinhabitants
Absolutenumber
Per milinhabitants
To attain meanESC area level
To attain meanEU-28 level
2009 2010 2011 2012 2013
Albaniaa AL N/A N/A N/A N/A N/A N/A N/A N/A N/A N/A N/A N/A
Algeria DZ No 1 0.03 230 6 6993 11 271 N/A N/A N/A N/A 6
Armenia AM No 2 0.65 140 46 563 907 45 16 33 23 46
Austria AT Yes 17 2.07 2421 294 – 2433 167 214 220 339 294
Azerbaijan AZ No 2 0.21 232 24 1761 2838 N/A 7 20 N/A 24
Belarus BY No 6 0.62 736 76 1767 2849 43 51 61 54 76
Belgium BE Yes 44 4.21 6056 580 – – 447 474 534 531 580
Bosnia &Herzegovina
BA No 0 0.00 0 0 712 1147 N/A 4 5 1 0
Bulgaria BG No 3 0.43 378 54 1282 2066 41 40 39 60 54
Croatia HR N/A 5 1.12 817 183 822 1324 55 N/A 101 132 183
Cyprus CY No 3 2.60 45 39 212 342 25 27 36 35 39
Czech Republic CZ Yes 20 1.89 5116 482 – – 379 416 440 474 482
Denmark DK Yes 6 1.08 3622 652 – – 486 491 457 590 652
Egypt EG No 13 0.15 1064 12 15 661 25 241 11 10 N/A 11 12
Estonia EE No 2 1.58 382 302 – – 313 333 300 260 302
Finland FI No 8 1.52 2203 418 – – 194 284 362 415 418
Francea FR No N/A N/A N/A N/A N/A N/A 418 459 479 472 N/A
Georgia GE No 7 1.42 269 54 907 1463 34 42 55 75 54
Germany DE No 122 1.50 33 420 412 – – 489 510 614 467 412
Greece GR Yes 29 2.69 1440 134 1978 3188 106 115 130 131 134
Hungary HU No 11 1.11 3356 338 – – 249 266 293 314 338
Iceland IS No 1 3.17 80 254 – 93 294 219 203 239 254
Ireland IE No 12 2.51 1000 209 – 1413 179 179 214 212 209
Israel IL No 16 2.08 N/A N/A N/A N/A N/A N/A N/A N/A N/A
Italya IT Yes N/A N/A N/A N/A N/A N/A N/A N/A 311 N/A N/A
Kazakhstan KZ No 7 0.39 1470 83 3257 5249 N/A N/A N/A 57 83
Kosovoa XK N/A N/A N/A N/A N/A N/A N/A N/A N/A N/A N/A N/A
M.J.P.R
aatikainenetal.
i58
by guest on January 28, 2015 Downloaded from

Kyrgyzstana KGZ N/A N/A N/A N/A N/A N/A N/A N/A N/A N/A N/A N/A
Latvia LV Yes 2 0.92 518 238 – 645 140 175 247 269 238
Lebanon LB No 5 1.21 100 24 759 1223 N/A N/A N/A N/A 24
Libyaa LY N/A N/A N/A N/A N/A N/A N/A N/A N/A N/A N/A N/A
Lithuania LT No 3 0.85 840 239 – 1040 235 242 227 243 239
Luxembourg LU Yes 1 1.94 129 251 – 152 220 183 252 301 251
FYR Macedonia MK Yes 3 1.44 80 38 383 618 34 15 26 30 38
Malta MT Yes 1 2.43 12 29 76 122 36 31 20 24 29
Moldova MD No 0 0.00 0 0 665 1071 N/A N/A N/A N/A 0
Montenegro ME No 1 1.53 45 69 120 193 0 0 11 149 69
Morocco MA Yes 4 0.12 150 5 5995 9662 N/A 2 3 7 5
Netherlands NL Yes 16 0.95 N/A N/A N/A N/A N/A 344 N/A 382 N/A
Norway NO No 5 0.98 2578 507 – – 242 262 487 530 507
Poland PL No 75 1.95 9500 248 – 11 359 167 200 214 229 248
Portugal PT Yes 16 1.48 2062 191 – 3196 157 152 187 186 191
Romania RO Yes 14 0.64 1300 60 4001 6448 42 47 50 50 60
RussianFederation
RU Yes 81 0.57 21 185 149 26 165 42 170 94 98 118 120 149
San Marino SM Yes 0 0.00 0 0 6 10 0 0 0 0 0
Serbia RS No 3 0.41 1010 139 1330 2143 115 112 125 133 139
Slovakia SK Yes 4 0.73 1071 195 – 1624 164 176 177 168 195
Slovenia SI Yes 2 1.00 279 140 366 590 120 129 162 136 140
Spain ES Yes 80 1.69 11 987 253 – 14 018 170 190 188 205 253
Sweden SE Yes 10 1.04 4483 465 – – 313 378 450 478 465
Switzerland CH Yes 22 2.75 4527 566 – – 506 511 612 598 566
Syriaa SY N/A N/A N/A N/A N/A N/A N/A N/A N/A N/A N/A N/A
Tunisiaa TN N/A N/A N/A N/A N/A N/A N/A 49 48 56 47 N/A
Turkeya TR N/A N/A N/A N/A N/A N/A N/A N/A N/A N/A N/A N/A
Ukraine UA No 13 0.29 2672 60 8184 13 190 N/A 41 47 55 60
United Kingdom GB Yes 54 0.85 15 903 251 – 18 761 227 229 240 254 251
Total ESCcountries
752 144 908
aThese nine countries did not submit data on catheter ablations for the EHRA White Book 2014.
Com
parativeanalysis
ofEHR
AW
hiteBook
data2009
–2013
i59
by guest on January 28, 2015 Downloaded from
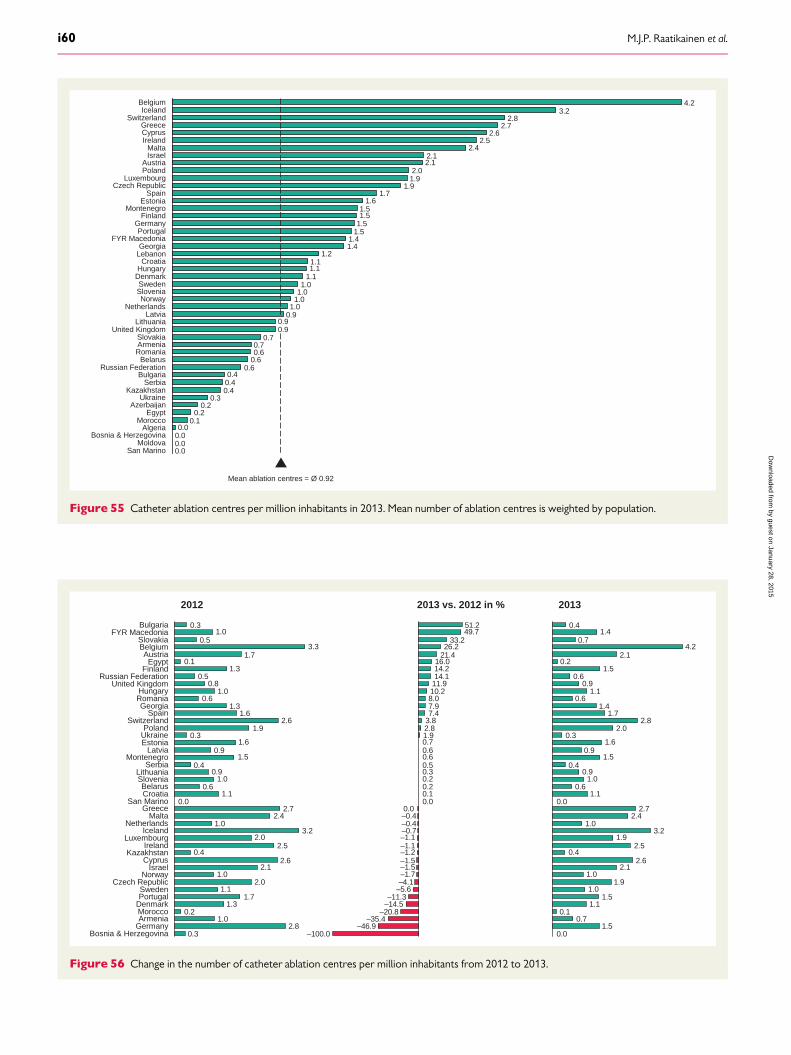
0.00.00.00.0
0.10.2
0.20.3
0.40.40.4
0.60.60.60.7
0.70.90.9
0.91.0
1.01.01.0
1.11.11.1
1.21.41.4
1.51.51.51.5
1.61.7
1.91.92.0
2.12.1
2.42.5
2.62.7
2.83.2
4.2
MoldovaSan Marino
Mean ablation centres = Ø 0.92
Bosnia & HerzegovinaAlgeria
MoroccoEgypt
AzerbaijanUkraine
KazakhstanSerbia
BulgariaRussian Federation
BelarusRomaniaArmeniaSlovakia
United KingdomLithuania
LatviaNetherlands
NorwaySloveniaSweden
DenmarkHungaryCroatia
LebanonGeorgia
FYR MacedoniaPortugal
GermanyFinland
MontenegroEstonia
SpainCzech Republic
LuxembourgPolandAustria
IsraelMalta
IrelandCyprusGreece
SwitzerlandIceland
Belgium
Figure 55 Catheter ablation centres per million inhabitants in 2013. Mean number of ablation centres is weighted by population.
0.32.8
1.00.2
1.31.7
1.12.0
1.02.1
2.60.4
2.52.0
3.21.0
2.42.7
0.01.1
0.61.0
0.90.4
1.50.9
1.60.3
1.92.6
1.61.3
0.61.0
0.80.5
1.30.1
1.73.3
0.51.0
0.3
Bosnia & HerzegovinaGermany
2012
ArmeniaMoroccoDenmarkPortugalSweden
Czech RepublicNorway
IsraelCyprus
KazakhstanIreland
LuxembourgIceland
NetherlandsMalta
GreeceSan Marino
CroatiaBelarus
SloveniaLithuania
SerbiaMontenegro
LatviaEstoniaUkrainePoland
SwitzerlandSpain
GeorgiaRomaniaHungary
United KingdomRussian Federation
FinlandEgypt
AustriaBelgiumSlovakia
FYR MacedoniaBulgaria
–100.0–46.9
–35.4–20.8
–14.5–11.3
–5.6–4.1–1.7–1.5–1.5–1.2–1.1–1.1–0.7–0.4–0.40.0
0.00.10.20.20.30.50.60.60.71.92.83.87.47.98.010.211.914.114.216.0
21.426.2
33.249.751.2
2013 vs. 2012 in %
0.01.5
0.70.1
1.11.5
1.01.9
1.02.1
2.60.4
2.51.9
3.21.0
2.42.7
0.01.1
0.61.0
0.90.4
1.50.9
1.60.3
2.02.8
1.71.4
0.61.1
0.90.6
1.50.2
2.14.2
0.71.4
0.4
2013
Figure 56 Change in the number of catheter ablation centres per million inhabitants from 2012 to 2013.
M.J.P. Raatikainen et al.i60
by guest on January 28, 2015D
ownloaded from
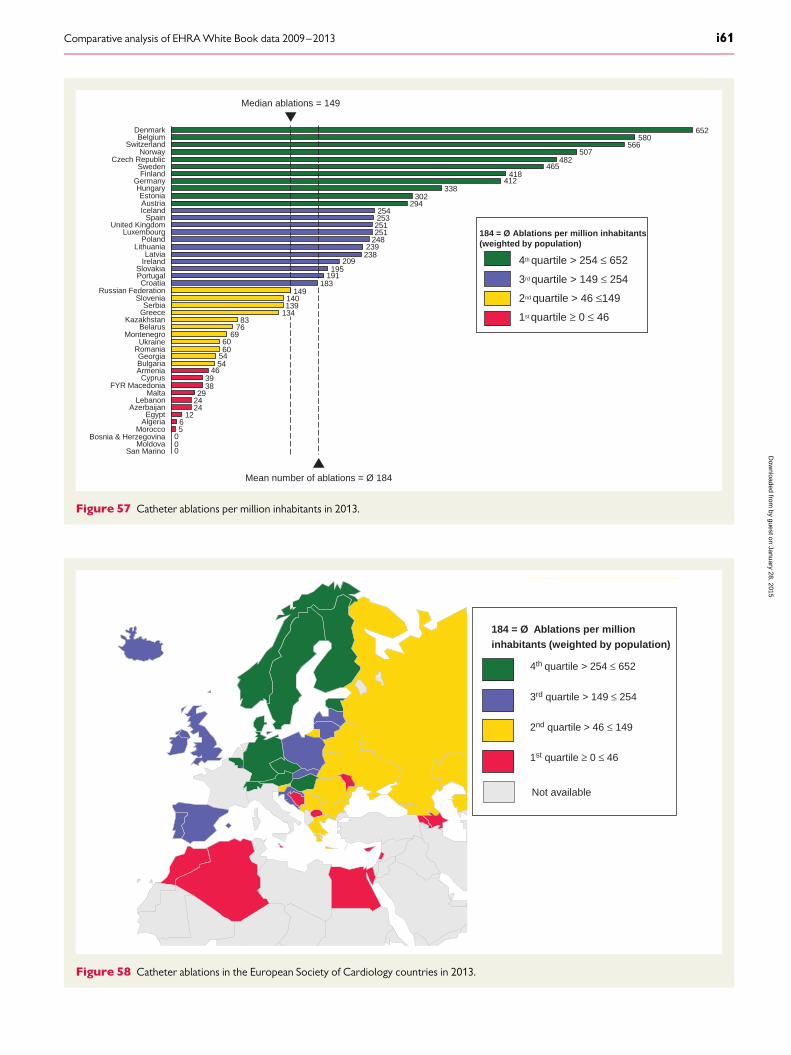
00056
12242429
3839
4654546060
697683
134139140
149183
191195
209238239
248251251253254
294302
338412
418465
482507
566580
652
Median ablations = 149
Mean number of ablations = Ø 184
San MarinoMoldova
Bosnia & HerzegovinaMorocco
AlgeriaEgypt
AzerbaijanLebanon
MaltaFYR Macedonia
CyprusArmeniaBulgariaGeorgia
RomaniaUkraine
MontenegroBelarus
KazakhstanGreeceSerbia
SloveniaRussian Federation
CroatiaPortugalSlovakia
IrelandLatvia
LithuaniaPoland
Luxembourg
SpainIcelandAustriaEstonia
HungaryGermany
United Kingdom
SwedenCzech Republic
NorwaySwitzerland
BelgiumDenmark
Finland
184 = Ø Ablations per million inhabitants (weighted by population)
1st quartile ≥ 0 ≤ 46
2nd quartile > 46 ≤149
3rd quartile > 149 ≤ 254
4th quartile > 254 ≤ 652
Figure 57 Catheter ablations per million inhabitants in 2013.
184 = Ø Ablations per million inhabitants (weighted by population)
1st quartile ≥ 0 ≤ 46
2nd quartile > 46 ≤ 149
3rd quartile > 149 ≤ 254
4th quartile > 254 ≤ 652
Not available
Figure 58 Catheter ablations in the European Society of Cardiology countries in 2013.
Comparative analysis of EHRA White Book data 2009–2013 i61
by guest on January 28, 2015D
ownloaded from
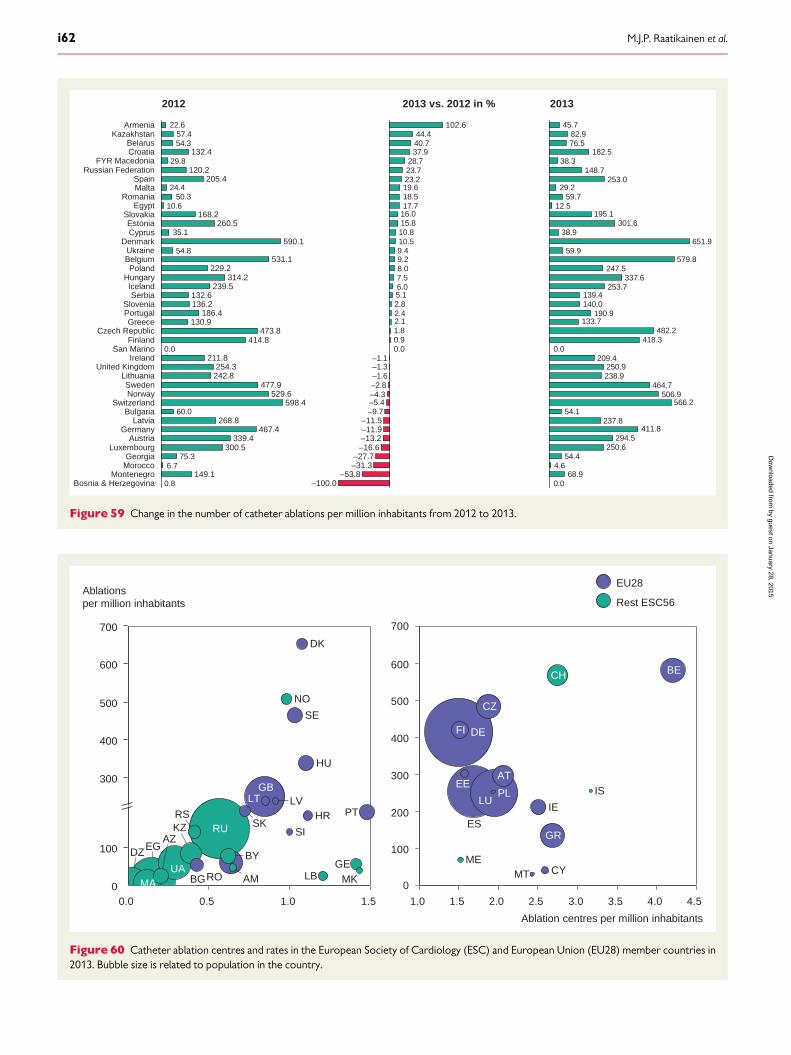
6.7
60.0
54.8
35.1
10.650.3
54.3
0.8
75.3
0.0
24.4
29.8
57.422.6
2012
Bosnia & HerzegovinaMontenegro 149.1
MoroccoGeorgia
Luxembourg 300.5Austria 339.4
Germany 467.4Latvia 268.8
BulgariaSwitzerland 598.4
Norway 529.6Sweden 477.9
Lithuania 242.8United Kingdom 254.3
Ireland 211.8San Marino
Finland 414.8Czech Republic 473.8
Greece 130.9Portugal 186.4Slovenia 136.2
Serbia 132.6Iceland 239.5
Hungary 314.2Poland 229.2
Belgium 531.1Ukraine
Denmark 590.1CyprusEstonia 260.5
Slovakia 168.2Egypt
RomaniaMaltaSpain 205.4
Russian Federation 120.2FYR Macedonia
Croatia 132.4Belarus
KazakhstanArmenia
–9.7–5.4–4.3–2.8–1.6–1.3–1.1
0.00.91.82.12.42.85.16.07.58.09.29.410.510.815.816.017.718.519.623.223.728.7
37.940.744.4
2013 vs. 2012 in %
–100.0–53.8
–31.3–27.7
–16.6–13.2–11.9–11.5
102.6
0.068.9
4.654.4
250.6294.5
411.8237.8
54.1566.2
506.9464.7
238.9250.9
209.40.0
418.3482.2
133.7190.9
140.0139.4
253.7337.6
247.5579.8
59.9651.9
38.9301.6
195.112.5
59.729.2
253.0148.7
38.3182.5
76.582.9
45.7
2013
Figure 59 Change in the number of catheter ablations per million inhabitants from 2012 to 2013.
0
100
200
300
400
500
600
700
1.0 1.5 2.0 2.5 3.0 3.5 4.0 4.5
Ablation centres per million inhabitants
DEFI
ME
EE
ES
CZ
LUPL
AT
MT
IE
CY
GR
CH
IS
BE
0.0 0.5 1.0 1.5
700
0
600
500
400
300
100
HU
HR
LBGE
MK
PT
DK
DZ
MA
EGAZ
UA
KZRS
Ablationsper million inhabitants
RU
BY
RO AM
SK
BG
LT LV
NO
SI
SE
GB
Rest ESC56
EU28
Figure 60 Catheter ablation centres and rates in the European Society of Cardiology (ESC) and European Union (EU28) member countries in2013. Bubble size is related to population in the country.
M.J.P. Raatikainen et al.i62
by guest on January 28, 2015D
ownloaded from
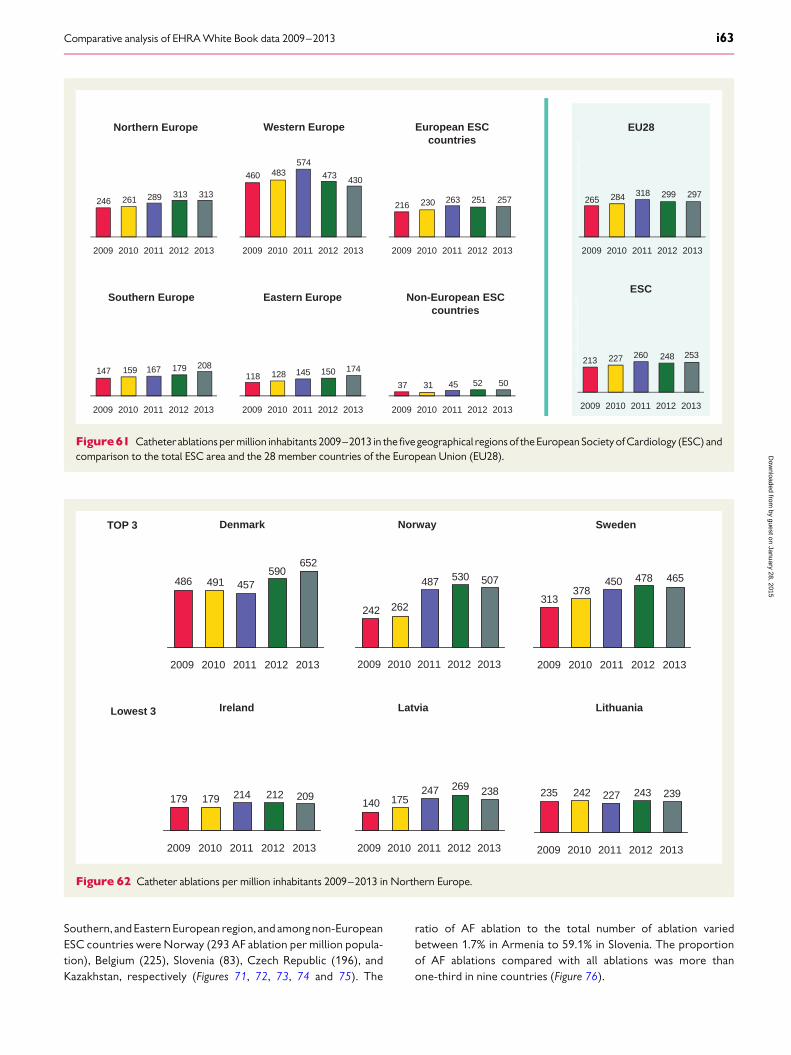
Southern, and Eastern European region, and among non-EuropeanESC countries were Norway (293 AF ablation per million popula-tion), Belgium (225), Slovenia (83), Czech Republic (196), andKazakhstan, respectively (Figures 71, 72, 73, 74 and 75). The
ratio of AF ablation to the total number of ablation variedbetween 1.7% in Armenia to 59.1% in Slovenia. The proportionof AF ablations compared with all ablations was more thanone-third in nine countries (Figure 76).
208179167159147
20132012201120102009
174150145128118
20132012201120102009
430473
574483460
20132012201120102009
ESC
253248260227213
20132012201120102009
EU28
297299318284265
20132012201120102009
Northern Europe Western Europe
Southern Europe Eastern Europe
313313289261246
20132012201120102009
257251263230216
20132012201120102009
European ESC countries
5052453137
20132012201120102009
Non-European ESC countries
Figure61 Catheter ablations per million inhabitants 2009–2013 in the five geographical regions of the European Society of Cardiology (ESC) andcomparison to the total ESC area and the 28 member countries of the European Union (EU28).
Denmark
652590
457491486
20102009 20132011 2012
TOP 3
Lowest 3 Ireland
209212214179179
20132009 20122010 2011
Norway
507530487
262242
2009 2013201220112010
Latvia
238269247175140
201220102009 20132011
Sweden
465478450378
313
201120102009 20132012
Lithuania
239243227242235
2011 20122010 20132009
Figure 62 Catheter ablations per million inhabitants 2009–2013 in Northern Europe.
Comparative analysis of EHRA White Book data 2009–2013 i63
by guest on January 28, 2015D
ownloaded from
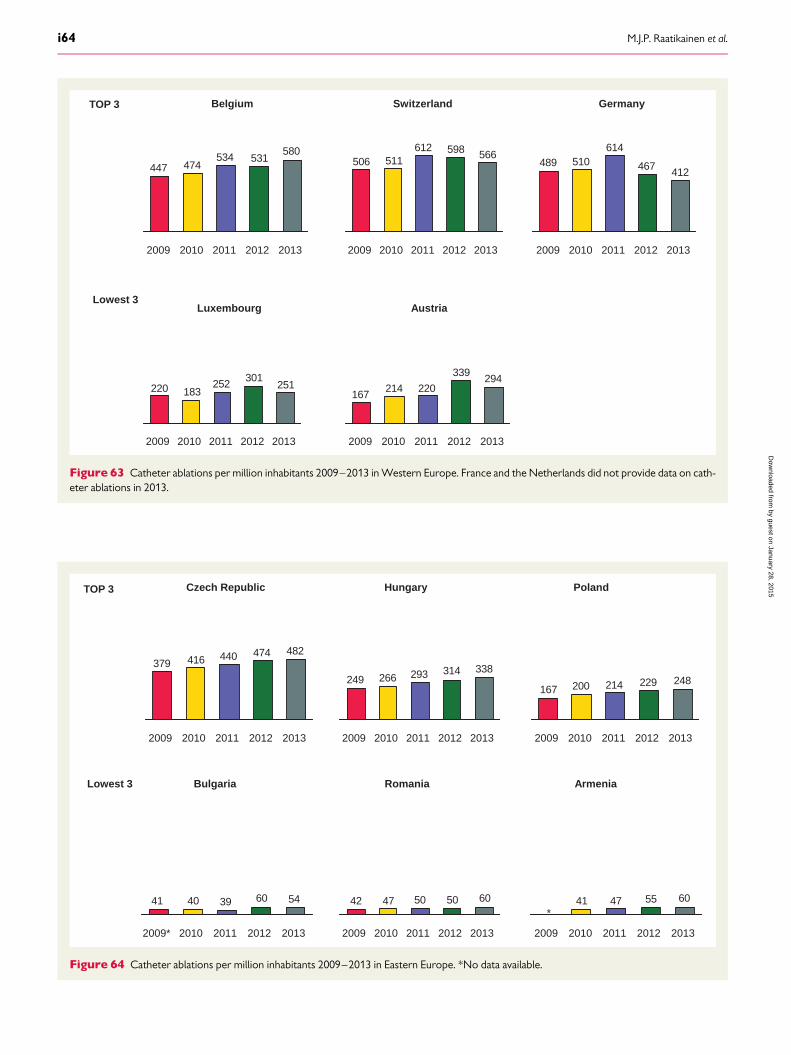
Belgium
580531534
474447
20132012201120102009
TOP 3
Lowest 3 Austria
294339
220214167
20132012201120102009
Switzerland
566598612511506
20132012201120102009
Luxembourg
251301
252183220
2012201120102009 2013
Germany
412467
614510489
20112009 2010 2012 2013
Figure 63 Catheter ablations per million inhabitants 2009–2013 in Western Europe. France and the Netherlands did not provide data on cath-eter ablations in 2013.
Czech Republic
482474440416379
2010 2011 2012 20132009
TOP 3
Lowest 3 Bulgaria
5460394041
2013201220112009* 2010
Hungary
338314293266249
2010 20132011 20122009
Romania
6050504742
2009 2011 20122010 2013
Poland
248229214200167
2009 2012 201320112010
Armenia
60554741
2013201120102009 2012
*
Figure 64 Catheter ablations per million inhabitants 2009–2013 in Eastern Europe. *No data available.
M.J.P. Raatikainen et al.i64
by guest on January 28, 2015D
ownloaded from
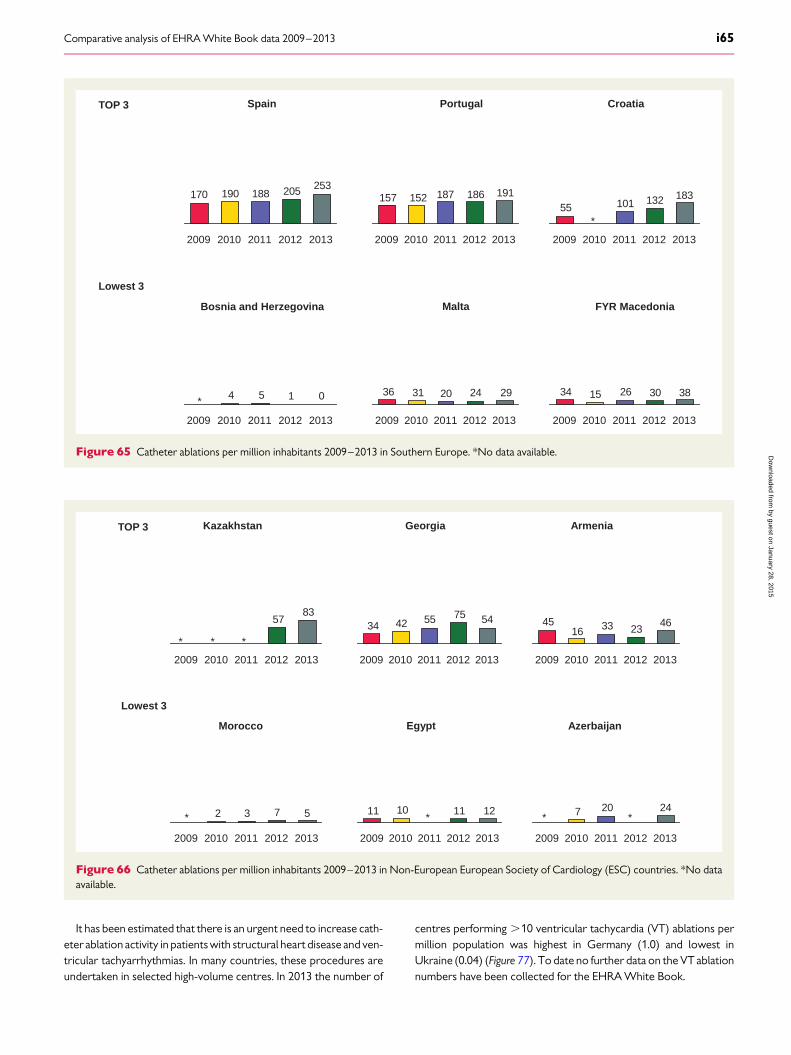
It has been estimated that there is an urgent need to increase cath-eter ablation activity in patients with structural heart disease and ven-tricular tachyarrhythmias. In many countries, these procedures areundertaken in selected high-volume centres. In 2013 the number of
centres performing .10 ventricular tachycardia (VT) ablations permillion population was highest in Germany (1.0) and lowest inUkraine (0.04) (Figure 77). To date no further data on the VT ablationnumbers have been collected for the EHRA White Book.
Spain
253205188190170
2009 2013201220112010
TOP 3
Lowest 3
Portugal
191186187152157
20132012201120102009
Bosnia and Herzegovina
0154
2013201220112009 2010
Croatia
18313210155
20102009 201320122011
Malta
2924203136
2013201120102009 2012
FYR Macedonia
3830261534
20132012201120102009
*
*
Figure 65 Catheter ablations per million inhabitants 2009–2013 in Southern Europe. *No data available.
Kazakhstan
8357
20132012201120102009
TOP 3
Lowest 3
Georgia
5475554234
20132012201120102009
Morocco
5732
20132012201120102009
Armenia
46233316
45
20132012201120102009
Egypt
12111011
20132012201120102009
Azerbaijan
24207
20132012201120102009
* *
* * *
* *
Figure 66 Catheter ablations per million inhabitants 2009–2013 in Non-European European Society of Cardiology (ESC) countries. *No dataavailable.
Comparative analysis of EHRA White Book data 2009–2013 i65
by guest on January 28, 2015D
ownloaded from
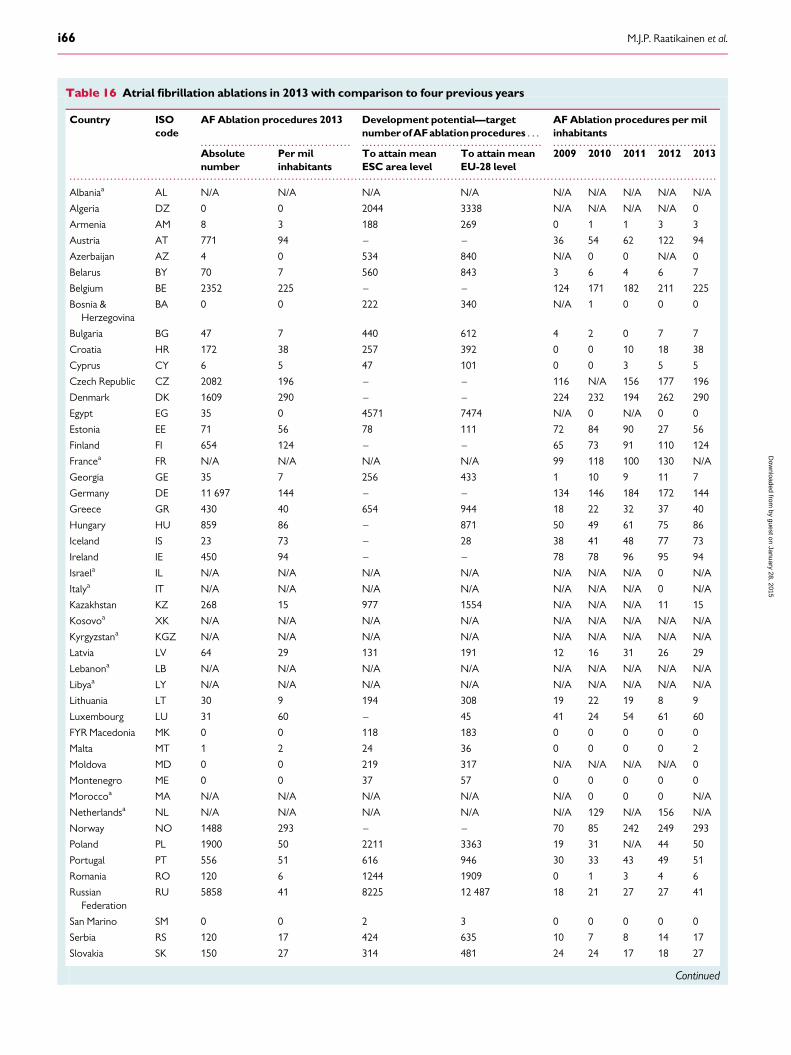
. . . . . . . . . . . . . . . . . . . . . . . . . . . . . . . . . . . . . . . . . . . . . . . . . . . . . . . . . . . . . . . . . . . . . . . . . . . . . . . . . . . . . . . . . . . . . . . . . . . . . . . . . . . . . . . . . . . . . . . . . . . . . . . . . . . .
. . . . . . . . . . . . . . . . . . . . . . . . . . . . . . . . . . . . . . . . . . . . . . . . . . . . . . . . . . . . . . . . . . . . . . . . . . . . . . . . . . . . . . . . . . . . . . . . . . . . . . . . . . . . . . . . . . . . . . . . . . . . . . . . . . . . . . . . . . . . . . . . . . . . . . . . . . . . . . . . . . . . . . . . . . . . . . .
Table 16 Atrial fibrillation ablations in 2013 with comparison to four previous years
Country ISOcode
AF Ablation procedures 2013 Development potential—targetnumberofAFablationprocedures . . .
AFAblation procedures per milinhabitants
Absolutenumber
Per milinhabitants
To attain meanESC area level
To attain meanEU-28 level
2009 2010 2011 2012 2013
Albaniaa AL N/A N/A N/A N/A N/A N/A N/A N/A N/A
Algeria DZ 0 0 2044 3338 N/A N/A N/A N/A 0
Armenia AM 8 3 188 269 0 1 1 3 3
Austria AT 771 94 – – 36 54 62 122 94
Azerbaijan AZ 4 0 534 840 N/A 0 0 N/A 0
Belarus BY 70 7 560 843 3 6 4 6 7
Belgium BE 2352 225 – – 124 171 182 211 225
Bosnia &Herzegovina
BA 0 0 222 340 N/A 1 0 0 0
Bulgaria BG 47 7 440 612 4 2 0 7 7
Croatia HR 172 38 257 392 0 0 10 18 38
Cyprus CY 6 5 47 101 0 0 3 5 5
Czech Republic CZ 2082 196 – – 116 N/A 156 177 196
Denmark DK 1609 290 – – 224 232 194 262 290
Egypt EG 35 0 4571 7474 N/A 0 N/A 0 0
Estonia EE 71 56 78 111 72 84 90 27 56
Finland FI 654 124 – – 65 73 91 110 124
Francea FR N/A N/A N/A N/A 99 118 100 130 N/A
Georgia GE 35 7 256 433 1 10 9 11 7
Germany DE 11 697 144 – – 134 146 184 172 144
Greece GR 430 40 654 944 18 22 32 37 40
Hungary HU 859 86 – 871 50 49 61 75 86
Iceland IS 23 73 – 28 38 41 48 77 73
Ireland IE 450 94 – – 78 78 96 95 94
Israela IL N/A N/A N/A N/A N/A N/A N/A 0 N/A
Italya IT N/A N/A N/A N/A N/A N/A N/A 0 N/A
Kazakhstan KZ 268 15 977 1554 N/A N/A N/A 11 15
Kosovoa XK N/A N/A N/A N/A N/A N/A N/A N/A N/A
Kyrgyzstana KGZ N/A N/A N/A N/A N/A N/A N/A N/A N/A
Latvia LV 64 29 131 191 12 16 31 26 29
Lebanona LB N/A N/A N/A N/A N/A N/A N/A N/A N/A
Libyaa LY N/A N/A N/A N/A N/A N/A N/A N/A N/A
Lithuania LT 30 9 194 308 19 22 19 8 9
Luxembourg LU 31 60 – 45 41 24 54 61 60
FYR Macedonia MK 0 0 118 183 0 0 0 0 0
Malta MT 1 2 24 36 0 0 0 0 2
Moldova MD 0 0 219 317 N/A N/A N/A N/A 0
Montenegro ME 0 0 37 57 0 0 0 0 0
Moroccoa MA N/A N/A N/A N/A N/A 0 0 0 N/A
Netherlandsa NL N/A N/A N/A N/A N/A 129 N/A 156 N/A
Norway NO 1488 293 – – 70 85 242 249 293
Poland PL 1900 50 2211 3363 19 31 N/A 44 50
Portugal PT 556 51 616 946 30 33 43 49 51
Romania RO 120 6 1244 1909 0 1 3 4 6
RussianFederation
RU 5858 41 8225 12 487 18 21 27 27 41
San Marino SM 0 0 2 3 0 0 0 0 0
Serbia RS 120 17 424 635 10 7 8 14 17
Slovakia SK 150 27 314 481 24 24 17 18 27
Continued
M.J.P. Raatikainen et al.i66
by guest on January 28, 2015D
ownloaded from
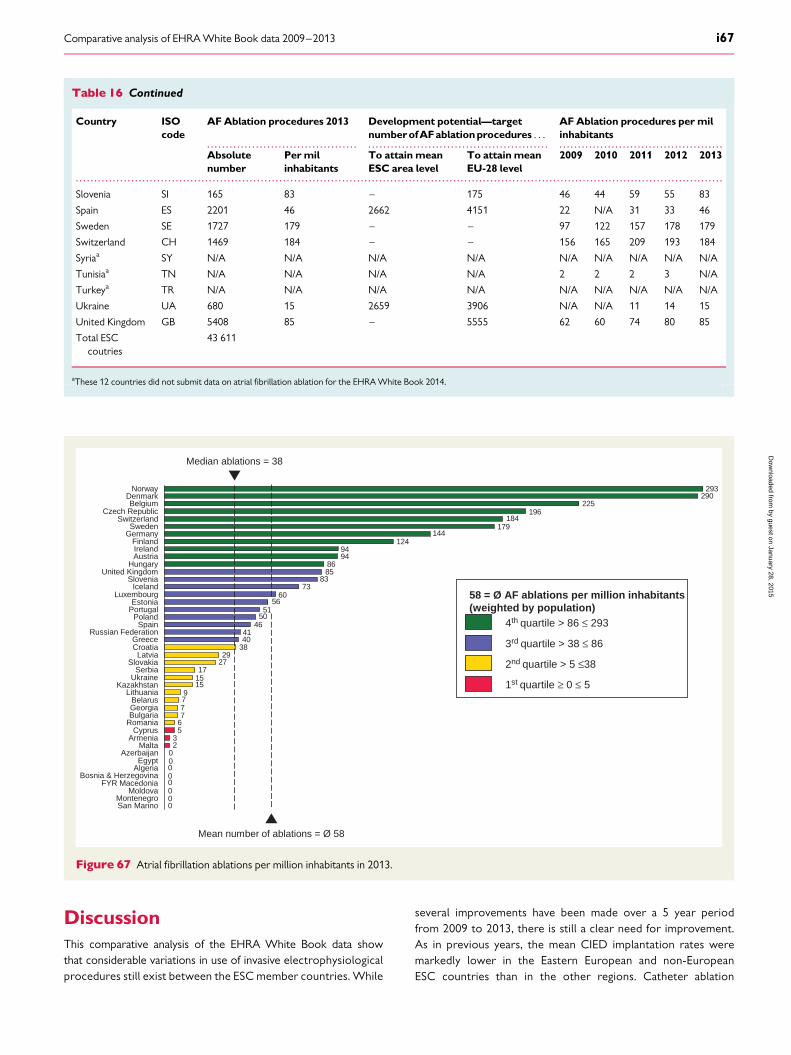
DiscussionThis comparative analysis of the EHRA White Book data showthat considerable variations in use of invasive electrophysiologicalprocedures still exist between the ESC member countries. While
several improvements have been made over a 5 year periodfrom 2009 to 2013, there is still a clear need for improvement.As in previous years, the mean CIED implantation rates weremarkedly lower in the Eastern European and non-EuropeanESC countries than in the other regions. Catheter ablation
. . . . . . . . . . . . . . . . . . . . . . . . . . . . . . . . . . . . . . . . . . . . . . . . . . . . . . . . . . . . . . . . . . . . . . . . . . . . . . . . . . . . . . . . . . . . . . . . . . . . . . . . . . . . . . . . . . . . . . . . . . . . . . . . . . . .
. . . . . . . . . . . . . . . . . . . . . . . . . . . . . . . . . . . . . . . . . . . . . . . . . . . . . . . . . . . . . . . . . . . . . . . . . . . . . . . . . . . . . . . . . . . . . . . . . . . . . . . . . . . . . . . . . . . . . . . . . . . . . . . . . . . . . . . . . . . . . . . . . . . . . . . . . . . . . . . . . . . . . . . . . . . . . . .
Table 16 Continued
Country ISOcode
AF Ablation procedures 2013 Development potential—targetnumberofAFablationprocedures . . .
AFAblation procedures per milinhabitants
Absolutenumber
Permilinhabitants
To attain meanESC area level
To attain meanEU-28 level
2009 2010 2011 2012 2013
Slovenia SI 165 83 – 175 46 44 59 55 83
Spain ES 2201 46 2662 4151 22 N/A 31 33 46
Sweden SE 1727 179 – – 97 122 157 178 179
Switzerland CH 1469 184 – – 156 165 209 193 184
Syriaa SY N/A N/A N/A N/A N/A N/A N/A N/A N/A
Tunisiaa TN N/A N/A N/A N/A 2 2 2 3 N/A
Turkeya TR N/A N/A N/A N/A N/A N/A N/A N/A N/A
Ukraine UA 680 15 2659 3906 N/A N/A 11 14 15
United Kingdom GB 5408 85 – 5555 62 60 74 80 85
Total ESCcoutries
43 611
aThese 12 countries did not submit data on atrial fibrillation ablation for the EHRA White Book 2014.
0000000023
567779
151517
2729
384041
465051
5660
7383
8586
9494
124144
179184
196225
290293
Median ablations = 38
Mean number of ablations = Ø 58
San MarinoMontenegro
MoldovaFYR Macedonia
Bosnia & HerzegovinaAlgeriaEgypt
AzerbaijanMalta
ArmeniaCyprus
RomaniaBulgariaGeorgiaBelarus
LithuaniaKazakhstan
UkraineSerbia
SlovakiaLatvia
CroatiaGreece
Russian FederationSpain
PolandPortugalEstonia
LuxembourgIceland
SloveniaUnited Kingdom
HungaryAustriaIrelandFinland
GermanySweden
SwitzerlandCzech Republic
BelgiumDenmark
Norway
58 = Ø AF ablations per million inhabitants (weighted by population)
1st quartile ≥ 0 ≤ 5
2nd quartile > 5 ≤38
3rd quartile > 38 ≤ 86
4th quartile > 86 ≤ 293
Figure 67 Atrial fibrillation ablations per million inhabitants in 2013.
Comparative analysis of EHRA White Book data 2009–2013 i67
by guest on January 28, 2015D
ownloaded from
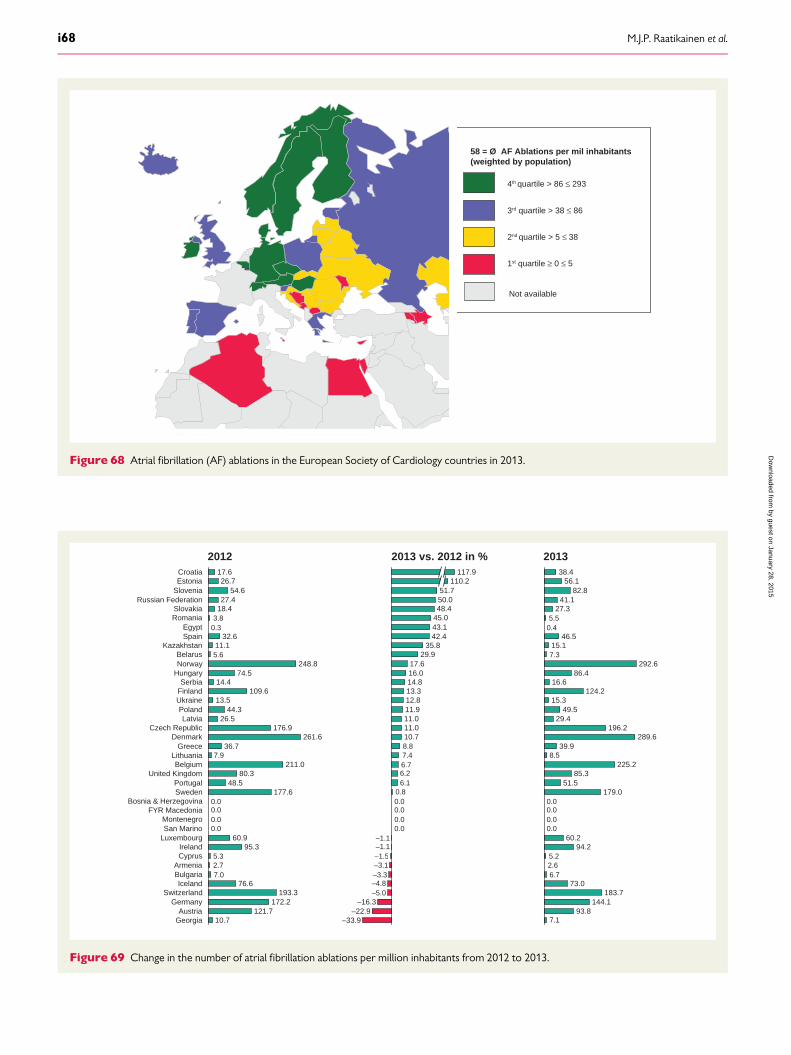
58 = Ø AF Ablations per mil inhabitants(weighted by population)
1st quartile ≥ 0 ≤ 5
2nd quartile > 5 ≤ 38
3rd quartile > 38 ≤ 86
4th quartile > 86 ≤ 293
Not available
Figure 68 Atrial fibrillation (AF) ablations in the European Society of Cardiology countries in 2013.
7.02.75.3
0.00.00.00.0
7.9
5.6
0.33.8
2012
Georgia 10.7Austria 121.7
Germany 172.2Switzerland 193.3
Iceland 76.6BulgariaArmenia
CyprusIreland 95.3
Luxembourg 60.9San MarinoMontenegro
FYR MacedoniaBosnia & Herzegovina
Sweden 177.6Portugal 48.5
United Kingdom 80.3Belgium 211.0
LithuaniaGreece 36.7
Denmark 261.6Czech Republic 176.9
Latvia 26.5Poland 44.3
Ukraine 13.5Finland 109.6Serbia 14.4
Hungary 74.5Norway 248.8Belarus
Kazakhstan 11.1Spain 32.6Egypt
RomaniaSlovakia 18.4
Russian Federation 27.4Slovenia 54.6Estonia 26.7Croatia 17.6
–5.0–4.8–3.3–3.1–1.5–1.1–1.1
0.00.00.00.00.8
6.16.26.77.48.8
2013 vs. 2012 in %
–33.9–22.9
–16.3
10.711.011.011.912.813.314.816.017.6
29.935.8
42.443.145.048.450.051.7
110.2117.9
7.1
6.72.65.2
0.00.00.00.0
8.5
7.3
0.45.5
2013
93.8144.1
183.773.0
94.260.2
179.051.5
85.3225.2
39.9289.6
196.229.4
49.515.3
124.216.6
86.4292.6
15.146.5
27.341.1
82.856.1
38.4
Figure 69 Change in the number of atrial fibrillation ablations per million inhabitants from 2012 to 2013.
M.J.P. Raatikainen et al.i68
by guest on January 28, 2015D
ownloaded from
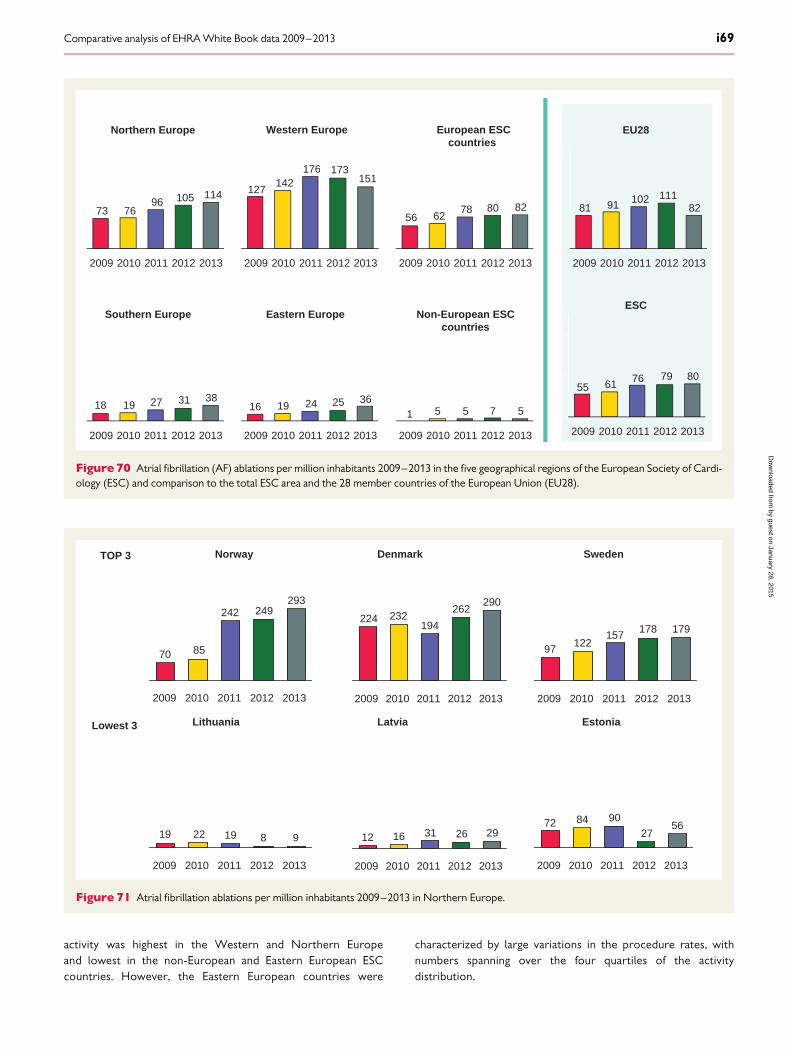
activity was highest in the Western and Northern Europeand lowest in the non-European and Eastern European ESCcountries. However, the Eastern European countries were
characterized by large variations in the procedure rates, withnumbers spanning over the four quartiles of the activitydistribution.
Norway
293249242
8570
20102009 20132011 2012
TOP 3
Lowest 3 Lithuania
98192219
20132009 20122010 2011
Denmark
290262
194232224
2009 2013201220112010
Latvia
2926311612
201220102009 20132011
Sweden
17917815712297
201120102009 20132012
Estonia
5627
908472
2011 20122010 20132009
Figure 71 Atrial fibrillation ablations per million inhabitants 2009–2013 in Northern Europe.
3831271918
20132012201120102009
3625241916
20132012201120102009
151173176
142127
20132012201120102009
ESC
8079766155
20132012201120102009
EU28
821111029181
20132012201120102009
Northern Europe Western Europe
Southern Europe Eastern Europe
114105967673
20132012201120102009
8280786256
20132012201120102009
European ESCcountries
57551
20132012201120102009
Non-European ESCcountries
Figure 70 Atrial fibrillation (AF) ablations per million inhabitants 2009–2013 in the five geographical regions of the European Society of Cardi-ology (ESC) and comparison to the total ESC area and the 28 member countries of the European Union (EU28).
Comparative analysis of EHRA White Book data 2009–2013 i69
by guest on January 28, 2015D
ownloaded from
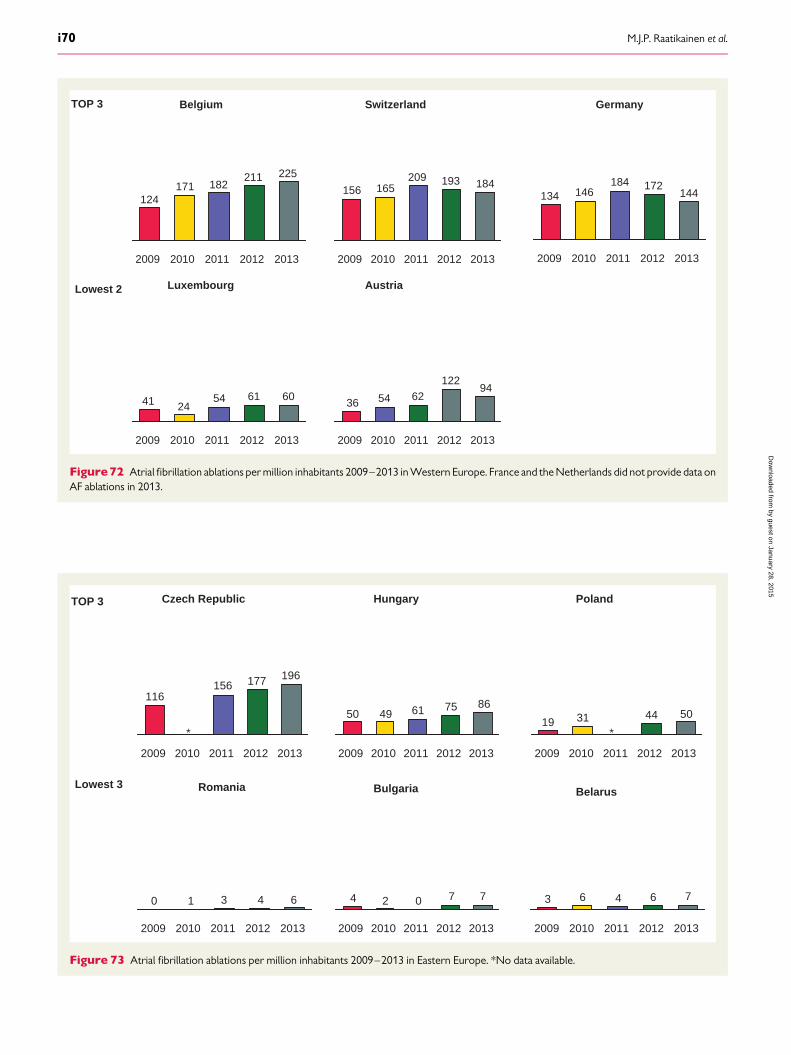
Belgium
225211182171
124
2009 2010 2012 20132011
TOP 3
Lowest 2 Luxembourg
6061542441
20122009 201320112010
Switzerland
184193209165156
20132012201120102009
Austria
94122
625436
20132009 2010 20122011
Germany
144172184
146134
2009 20132010 20122011
Figure72 Atrial fibrillation ablations per million inhabitants 2009–2013 in Western Europe. France and the Netherlands did not provide data onAF ablations in 2013.
Czech Republic
196177156116
20132012201120102009
TOP 3
Lowest 3 Romania
64310
20132012201120102009
Hungary
8675614950
20132012201120102009
Bulgaria
77024
20132012201120102009
Poland
50443119
20132012201120102009
Belarus
76463
2012 2013201120102009
* *
Figure 73 Atrial fibrillation ablations per million inhabitants 2009–2013 in Eastern Europe. *No data available.
M.J.P. Raatikainen et al.i70
by guest on January 28, 2015D
ownloaded from
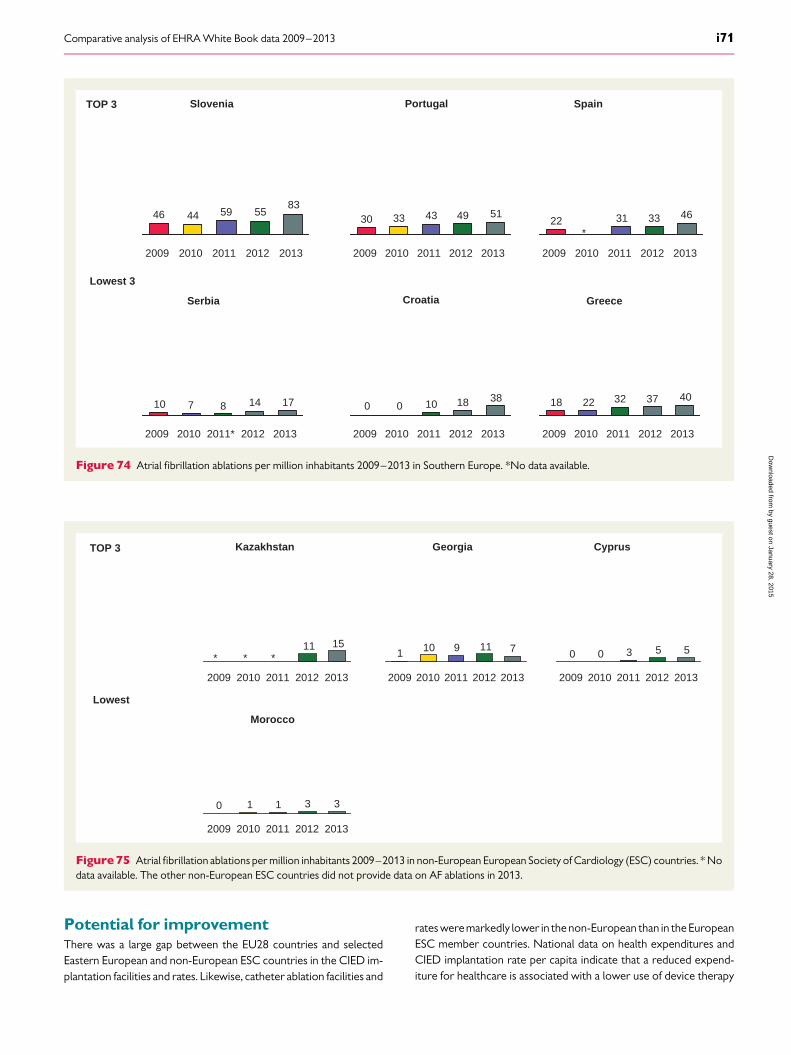
Potential for improvementThere was a large gap between the EU28 countries and selectedEastern European and non-European ESC countries in the CIED im-plantation facilities and rates. Likewise, catheter ablation facilities and
rates weremarkedly lower in the non-European than in the EuropeanESC member countries. National data on health expenditures andCIED implantation rate per capita indicate that a reduced expend-iture for healthcare is associated with a lower use of device therapy
Slovenia
8355594446
20132012201120102009
TOP 3 Portugal
5149433330
20132012201120102009
Spain
46333122
20132012201120102009
Lowest 3
Serbia Croatia
38181000
20122009 20132010 2011
17148710
20122009 20132010 2011*
4037322218
20122009 20132010 2011
Greece
*
Figure 74 Atrial fibrillation ablations per million inhabitants 2009–2013 in Southern Europe. *No data available.
Kazakhstan
1511
20132012201120102009
TOP 3
Lowest
Georgia
7119101
20132012201120102009
Morocco
33110
20132012201120102009
Cyprus
55300
20132012201120102009
***
Figure75 Atrial fibrillation ablations per million inhabitants 2009–2013 in non-European European Society of Cardiology (ESC) countries. * Nodata available. The other non-European ESC countries did not provide data on AF ablations in 2013.
Comparative analysis of EHRA White Book data 2009–2013 i71
by guest on January 28, 2015D
ownloaded from
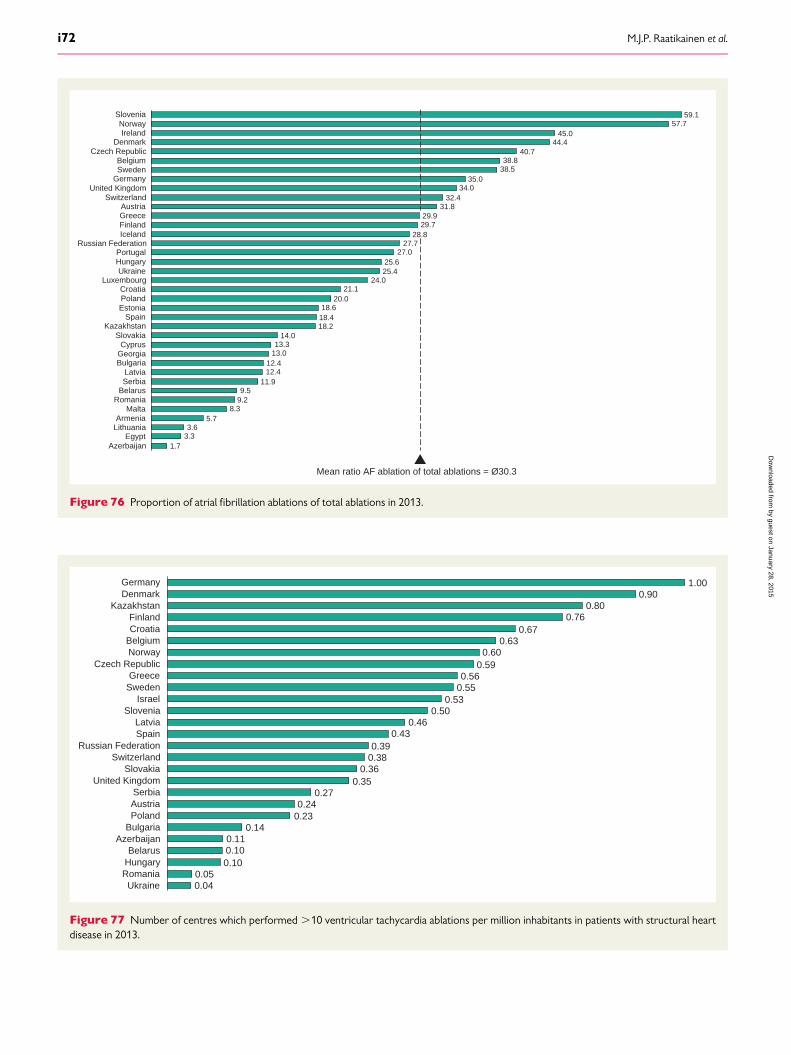
1.73.33.6
5.78.3
9.29.5
11.912.412.4
13.013.3
14.018.218.418.6
20.021.1
24.025.425.6
27.027.7
28.829.729.9
31.832.4
34.035.0
38.538.8
40.744.4
45.057.7
59.1
AzerbaijanEgypt
LithuaniaArmenia
MaltaRomania
BelarusSerbiaLatvia
BulgariaGeorgiaCyprus
SlovakiaKazakhstan
SpainEstoniaPolandCroatia
LuxembourgUkraine
HungaryPortugal
Russian FederationIcelandFinlandGreeceAustria
Switzerland
GermanySwedenBelgium
Czech Republic
United Kingdom
IrelandNorway
Slovenia
Mean ratio AF ablation of total ablations = Ø30.3
Denmark
Figure 76 Proportion of atrial fibrillation ablations of total ablations in 2013.
0.040.05
0.100.100.11
0.140.230.24
0.270.35
0.360.380.39
0.430.46
0.500.53
0.550.56
0.590.60
0.630.67
0.760.80
0.901.00
UkraineRomaniaHungaryBelarus
AzerbaijanBulgariaPolandAustriaSerbia
United KingdomSlovakia
SwitzerlandRussian Federation
SpainLatvia
SloveniaIsrael
SwedenGreece
Czech RepublicNorwayBelgiumCroatiaFinland
KazakhstanDenmarkGermany
Figure 77 Number of centres which performed .10 ventricular tachycardia ablations per million inhabitants in patients with structural heartdisease in 2013.
M.J.P. Raatikainen et al.i72
by guest on January 28, 2015D
ownloaded from
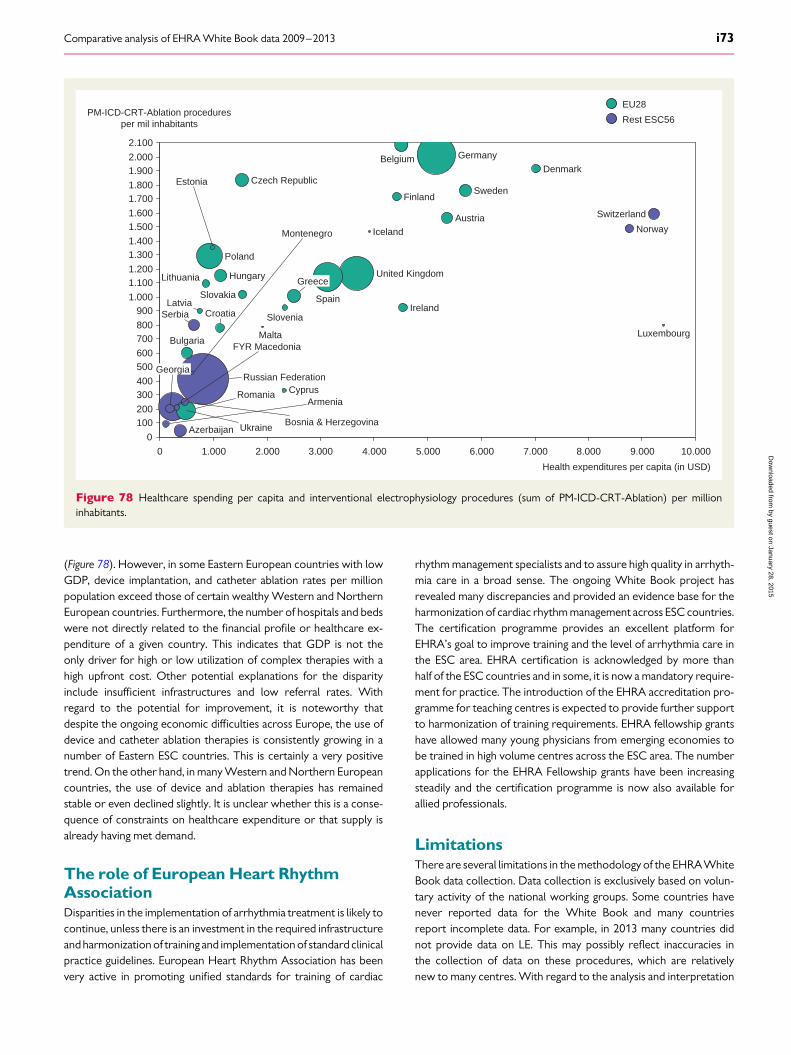
(Figure 78). However, in some Eastern European countries with lowGDP, device implantation, and catheter ablation rates per millionpopulation exceed those of certain wealthy Western and NorthernEuropean countries. Furthermore, the number of hospitals and bedswere not directly related to the financial profile or healthcare ex-penditure of a given country. This indicates that GDP is not theonly driver for high or low utilization of complex therapies with ahigh upfront cost. Other potential explanations for the disparityinclude insufficient infrastructures and low referral rates. Withregard to the potential for improvement, it is noteworthy thatdespite the ongoing economic difficulties across Europe, the use ofdevice and catheter ablation therapies is consistently growing in anumber of Eastern ESC countries. This is certainly a very positivetrend. On the other hand, in many Western and Northern Europeancountries, the use of device and ablation therapies has remainedstable or even declined slightly. It is unclear whether this is a conse-quence of constraints on healthcare expenditure or that supply isalready having met demand.
The role of European Heart RhythmAssociationDisparities in the implementation of arrhythmia treatment is likely tocontinue, unless there is an investment in the required infrastructureand harmonization of training and implementation of standard clinicalpractice guidelines. European Heart Rhythm Association has beenvery active in promoting unified standards for training of cardiac
rhythm management specialists and to assure high quality in arrhyth-mia care in a broad sense. The ongoing White Book project hasrevealed many discrepancies and provided an evidence base for theharmonization of cardiac rhythm management across ESC countries.The certification programme provides an excellent platform forEHRA’s goal to improve training and the level of arrhythmia care inthe ESC area. EHRA certification is acknowledged by more thanhalf of the ESC countries and in some, it is now a mandatory require-ment for practice. The introduction of the EHRA accreditation pro-gramme for teaching centres is expected to provide further supportto harmonization of training requirements. EHRA fellowship grantshave allowed many young physicians from emerging economies tobe trained in high volume centres across the ESC area. The numberapplications for the EHRA Fellowship grants have been increasingsteadily and the certification programme is now also available forallied professionals.
LimitationsThere are several limitations in the methodology of the EHRAWhiteBook data collection. Data collection is exclusively based on volun-tary activity of the national working groups. Some countries havenever reported data for the White Book and many countriesreport incomplete data. For example, in 2013 many countries didnot provide data on LE. This may possibly reflect inaccuracies inthe collection of data on these procedures, which are relativelynew to many centres. With regard to the analysis and interpretation
0
100200
300400
500600
700800
9001.000
1.1001.200
1.3001.400
1.5001.600
1.7001.800
1.9002.000
2.100
0 1.000 2.000 3.000 4.000 5.000 6.000 7.000 8.000 9.000 10.000
PM-ICD-CRT-Ablation proceduresper mil inhabitants
Romania
Bulgaria
Montenegro
SerbiaLatvia
Russian Federation
Lithuania
Poland
Estonia
Croatia
Hungary
Czech Republic
Slovakia
Malta
Cyprus
Slovenia
Greece
Spain
United Kingdom
Iceland
Finland
Belgium
Ireland
Germany
Austria
Sweden
Denmark
Norway
Switzerland
Luxembourg
Health expenditures per capita (in USD)
Armenia
Georgia
Ukraine
FYR Macedonia
AzerbaijanBosnia & Herzegovina
Rest ESC56
EU28
Figure 78 Healthcare spending per capita and interventional electrophysiology procedures (sum of PM-ICD-CRT-Ablation) per millioninhabitants.
Comparative analysis of EHRA White Book data 2009–2013 i73
by guest on January 28, 2015D
ownloaded from
of summary data, it was a major drawback that France, one the mostpopulated countries in ESC area, submitted an incomplete response.In addition, there were large variations in national data collection.About 50% of the data came from national registries (22 countries)and 50% were based on surveys and other estimates conducted bythe national working groups. This is relevant since the coverage ofthe registries in some of the ESC countries is relatively poor andmany procedures are not included in the registry data. In contrast,surveys and other estimates conducted by the national workinggroups may overestimate the procedure numbers. This is illustratedby the fact that in 2012 the average number of procedures under-taken per million population was 9% higher in countries withoutthan in those with a national registry on catheter ablation (223 vs.210 ablation per million population).14
This year the data were presented separately for five geographicalregions within the ESC area. In order to avoid any economic, political,or historical bias the European regions were based on the UnitedNations Statistics Division and all other ESC countries were includedin the non-European ESC region. This classification is not free of lim-itations. Forexample,Cyprusbelongs to the Western Asia although itis a member of the European Union. Nevertheless, we feel that asa well-defined and widely accepted geographical classification theUN grouping provides a neutral platform for regional comparisonswithin the ESC area.
Future directionsThe longterm goal is to continuously improve the reliability and use-fulness of the EHRA White Book data by increasing the quality andscope of the collected data. In this regard, it is our hope that the de-velopmentofnational registries and their coveragewill improve in thefuture. The long-term goal is to set up an electronic database whichwould allow free comparisons both the ESC countries and withincountries. Such a database would also provide an unique platformfor online multinational registry-based clinical trials in arrhythmiatherapy.15
Currently the main indications for catheter ablation are supra-ventricular tachycardias and atrial fibrillation. Recently, the use ofcatheter ablation for treatment of VT in patients with prior myocar-dial infarction and various cardiomyopathies has been increasingrapidly mainly due to expanding use of ICDs for both secondaryand primary prevention of sudden cardiac death.16 In order tobetter understand the needs for VT ablations, we plan to collectmore detailed data on VT ablations in the next EHRA WhiteBook Survey.
ConclusionsThe White Book data has developed into a substantial asset,not only for the cardiac EP community, but also for healthcareadministrators and politicians in the ESC area. The availability ofhigh-quality information is critical to those facing the challenge ofbalancing healthcare budgets and allocating limited resources.The statistics presented herein show that, despite significantimprovements in many areas of arrhythmia care, there still is con-siderable heterogeneity in the availability of invasive arrhythmiatherapies across the ESC area. Reducing this gap is one of themain objectives of EHRA.
AcknowledgementsEHRA White Book 2014 and this supplement was possible thanksto the efforts of several key contributors including chairmen andco-chairs of national Working Groups of the 56 ESC countries,and EHRA staff at the Heart House. We are grateful for their invalu-able contribution and hope that even more countries will bereporting data for the White Book next year. In addition, wewant to thank the project sponsor, BIOTRONIK SE & Co. KG,and in particular to Robert Wuestenberg and Anja Thuemen fortheir dedication and passion in the conduction of the project.Finally, Dr Fernando Arribas deserves special mention as the co-ordinator of the two previous editions of the EHRA White Booksupplement.
Conflictof interest:M.J.P.R. received speakers/consultant fee fromBayer, Biosense Webster, BMS/Pfizer, Boehringer-Ingelheim, MedaPharma and research support from St Jude Medical, BioesenseWebster. D.O.A. received speakers fee from Pfizer, Bayer andgrant support from Bayer, Pfizer, Boehringer Ingelheim, Medtronic,Bioesense Webster.
FundingTheEHRAWhiteBook2014and this analysis was supportedbyBiotronikSE & CO.
References1. Arribas F, Auricchio A, Boriani B, Camm J, Merino JL, Merkely B et al. The
EHRA White Book. Statistics on the Use of Cardiac Electronic Devices andElectrophysiological Procedures in 54 ESC countries: 2012 Report from theEuropean Heart Rhythm Association (EHRA). Europace 2012;14(Suppl 3):1–55.
2. Merkely B, Kautzner J, Milasinovic G, Hatala R, Taborsky M, Lubinski A et al.EHRA Summit 2010. Summary statement: EHRA summit 2010 with the partici-pation of Central-Eastern European countries: ‘ICD for Life’ Initiative—fightingagainst sudden cardiac death in emerging economies. Europace 2011;13:1209–10.
3. Karanikolos M, Mladovsky P, Cylus J, Thomson S, Basu S, Stuckler D et al. Financialcrisis, austerity, and health in Europe. Lancet 2013;381:1323–31.
4. Brand H, Rosenkotter N, Clemens T, Michelsen K. Austerity policies in Europe - badfor health. BMJ 2013;346:f3716.
5. Boriani G, Maniadakis N, Auricchio A, Vardas P. Health economics and outcomesresearch: a new challenge and field of action for the European Heart Rhythm Asso-ciation. Europace 2010;12:601–3.
6. VardasP, Boriani G. Health economics and the EuropeanHeart Rhythm Association.Europace 2011;13(Suppl 2):ii1–2.
7. Wolpert C, Lubinski A, Bissinger A, Merkely B, Priori S, Brugada J. Barriers to imple-mentation of evidence-based electrical therapies and the need for outcome re-search: role of European registries. Europace 2011;13:(Suppl 2):ii18–20.
8. Boriani G, Maniadakis N, Auricchio A, Muller-Riemenschneider F, Fattore G, Leyva Fet al. Health technology assessment in interventional electrophysiology and devicetherapy: a position paper of the European Heart Rhythm Association. Eur Heart J2013;34:1869–74.
9. World health statistics 2014. World Health Organisation 2014; URL: http://www.who.int/gho/publications/worldhealth_statistics/2014/en/).
10. EHRA White Book 2014. http://www.escardio.org/communities/EHRA/publications/Documents/ehra-white-book-2014.pdf
11. Deharo JC, Bongiorni MG, Rozkovec A, Bracke F, Defaye P, Fernandez-Lozano I et al.Pathways for training and accreditation for transvenous lead extraction: a EuropeanHeart Rhythm Association position paper. Europace 2012;14:124–34.
12. Van Erven L, Morgan JM, Scientific Initiatives Committee (SIC). Attitude towards re-dundant leads and the practice of lead extractions: a European survey. Europace2010;12:275–6.
13. Bongiorni MG, Blomstrom-Lundqvist C, Kennergren C, Dagres N, Pison L,Svendsen JH et al. Current practice in transvenous lead extraction: a
M.J.P. Raatikainen et al.i74
by guest on January 28, 2015D
ownloaded from

European Heart Rhythm Association EP Network Survey. Europace 2012;14:783–864.
14. Arribas F, Auricchio A, Boriani G, Brugada J, Deharo JC, Hindriks G et al. Statistics onthe use of cardiac electronic devices and electrophysiological procedures in 55 ESCcountries: 2013 report from the European Heart Rhythm Association (EHRA). Euro-pace 2014;16(Suppl 1):i1–78.
15. Lauer MS, D’Agostino RB. The randomized registry trial – the next distruptive tech-nology in clinical research. N Engl J Med 2013;369:157–81.
16. Braunschweig F, Boriani G, Bauer A, Hatala R, Herrmann-Lingen C, Kautzner J et al.Management of patients receiving implantable cardiac defibrillator shocks: recom-mendations for acute and long-term patient management. Europace 2010;12:1673–90.
Comparative analysis of EHRA White Book data 2009–2013 i75
by guest on January 28, 2015D
ownloaded from
Top Related