


Languages
Pages
Legal


Statistical modeling of rubberized concrete beams confined by FRPusing RSM technique
RANA FAISAL TUFAIL1,* , XIONG FENG2, MUHAMMAD ZAHID3, NODIR UTASHEV4,
TAHIR MEHMOOD1, ADNAN NAWAZ1, AHSEN MAQSOOM1 and HAMMAD SALAHUDDIN1
1Department of Civil Engineering, COMSATS University Islamabad, Wah Campus, Islamabad, Pakistan2Department of Civil Engineering, College of Architecture and Environment, Sichuan University,
Chengdu 610064, China3Department of Civil Engineering, Universiti Teknologi PETRONAS, Seri Iskandar, Malaysia4College of Architecture and Environment, Sichuan University, Chengdu 610064, China
e-mail: [email protected]
MS received 4 June 2019; revised 4 February 2020; accepted 19 February 2020
Abstract. The use of rubber in concrete has been practiced in the engineering community for several years.
However, the poor mechanical properties of rubberized concrete are a serious hurdle. This innovative research
provides a closer look at improving the flexural strength of rubberized concrete beams with high rubber content
using confinement technique. FRP jackets with different confinement thickness were used to recover the strength
loss of rubberized concrete beams. In this paper, 66 rubberized concrete (RuC) beams having 0–50% rubber
content were tested under four-point loading. RuC beams suffered up to 167% reduction in flexural strength.
However, the FRP jackets were highly effective to improve the flexural strength of RuC beams. The statistical
models were developed to predict the flexural strength of FRP confined rubberized concrete beams using
response surface methodology (RSM). In this regard, the effect of two principle variables; unconfined strength
and number of FRP layers on the flexural strength of FRP confined rubberized concrete beams was investigated.
The models were found significant because the predicted and adjusted R2 was less than 0.2 (a limit proposed by
Design Expert software). The predicted and experimental results for FRP confined rubberized concrete beams
were found in good agreement. The developed statistical models provide insights into the sensitivity of
parameters affecting the flexural strength. The proposed models can improve the reliability of the experiments
and reduces the design and analysis time.
Keywords. FRP; concrete; beams; response surface methodology; rubberized concrete.
1. Introduction
Themanagement of scrap tires is a serious problem due to the
higher production of tires. It can cause severe public health
issues. It is a well-known fact that scrap tires are very difficult
to recycle because of high vulcanized rubber content.
Moreover, the scrap tires can trap methane and other gases
resulting in a large increase in volume and catch fire easily.
The rubber particles can be used in concrete as a partial
replacement of aggregates that is one of the best recycling
approaches. Previous studies reported advantages of rubber
such as good strength and ductility. However, themechanical
properties can be seriously affected by the addition of rubber
in concrete. The use of rubber in concrete is advantageous as
it is environmentally friendly. Moreover, it can improve
ductility and deformation capacity of concrete because of its
elastic nature. The serious drawback includes a reduction in
compressive and flexural strength of rubberized concrete as
compared to the conventional concrete [1–5]. This reduction
in mechanical properties created a hurdle for using rubber-
ized concrete in structural engineering applications [1].
Previous studies focused on the replacement of aggregates by
rubber content [1–10]. However, reduction in flexural and
compressive strength was observed by the replacement of
rubber content in concrete [11, 12]. There are different fac-
tors involved in this reduction such as the replacement type
and properties of rubber content [13]. The addition of rubber
in concrete can also yield inconsistent results as reported in
the literature [11]. Poor bonding between rubber and cement
paste is responsible for the reduction in compressive and
flexural strength of rubberized concrete [14]. High air content
is also responsible for the reduction in strength and poor
mechanical properties of rubberized concrete (RuC) [15, 16].
Extensive research has been published on FRP confinement*For correspondence
Sådhanå (2020) 45:113 � Indian Academy of Sciences
https://doi.org/10.1007/s12046-020-01349-7Sadhana(0123456789().,-volV)FT3](0123456789().,-volV)

of concrete in recent years [17–22]. FRP confinement can
increase the compressive and flexural strength of concrete
due to the high strength and stiffness of FRP. The combina-
tion of FRP and rubberized concrete beams can improve the
flexural strength and other mechanical properties of rubber-
ized concrete.
Several types of research have been performed on FRP
confinement of conventional concrete beams [23–26]. FRP
jacketing can significantly improve the shear and flexural
strength of conventional concrete beams. However,
according to the author’s knowledge, no previous research
has focused on the FRP confinement of rubberized concrete.
Moreover, it is important to use a powerful tool for statis-
tical modeling that can enhance the understanding of the
parameters affecting the strength of rubberized concrete
beams. Statistical models can be constructed using a very
useful RSM technique to develop a relationship between the
input and output variables [27]. This technique can reduce
the time to analyze and design the experiments without
using significant effort. RSM technique can be performed
with a limited number of resources and a strength model can
be developed using input parameters affecting the product.
The sensitivity of the input parameters can be determined
which can provide useful insight into the behavior of the
system [28]. Furthermore, the best possible solution can be
derived using a limited number of experiments and resour-
ces. The usefulness of RSM method can be described as
(a) development of output using limited resources, (b) the
time required to complete the analysis and design of the
experiment is very less, (c) regression models can be
developed with high accuracy, and (d) the predicted and
experimental values can easily be statistically validated.
This technique is commonly used to design or analyze the
experiments and common in the engineering community.
However, its use in FRP confinement of concrete is still
novel. RSM technique has been successfully used by
researchers to successfully optimize and analyze the
experiments [27, 29].
This research for the first time uses the RSM technique to
analyze the FRP confinement of rubberized concrete
beams. The experimental test results form this research will
contribute to the use of FRP confined rubberized concrete
as a structural material with more confidence. This paper
aims to investigate the FRP confinement on rubberized
concrete beams for the first time. The statistical models for
FRP confined RuC beams will be developed using RSM
and regression analysis. The unconfined strength, aggregate
effect and confinement thickness are the main parameters
of the study.
2. Experimental program
This research study is comprised of 66 rubberized concrete
beams. The program was divided into three groups:
(a) 0–50% fine aggregate replaced by rubber content,
(b) 0–50% coarse aggregate replaced by rubber content,
and (c) 50% fine and coarse aggregate replaced by rubber
content coarse. The flexural strength of rubberized concrete
beams was investigated and parameters were unconfined
strength, aggregate effect and confinement thickness.
2.1 Materials
Ordinary Portland cement according to ASTM C1157 was
used having 42 MPa strength, 30% fly ash and 70% pure
cement by mass. Locally available fine aggregates (2.65
specific gravity) were procured from Chengdu, Sichuan
province. The admixtures i.e., silica fume and fly ash were
used. Water absorption, Oven dry density, specific gravity
bulk density, and flakiness index were measured. Table 1
shows the physical properties of mineral aggregate and
rubber content as reported in previously tested experiments
by the author [30]. Figure 1 shows the particle size distri-
bution of rubber content and mineral aggregates used in this
research.
2.2 Statistical modeling using RSM technique
This paper uses commercial software (Design Expert) to
analyze the experiments for FRP confined rubberized con-
crete. The relationship between input parametric variables
and output factors can be established. This RSM design tool
includes procedure as (a) input the parametric factors to
design the experiments, (b) response is achieved after the
experiments, (c) development of statistical models using
input and output factors, and (d) optimization of models
using the robust tool [31]. Different models can be used
such as linear or quadratic according to the output
requirements. These models are responsible for predicting
the response such as flexural strength or other mechanical
properties of the product. The flow chart for easy under-
standing of the response surface method is shown in fig-
ure 2. For this particular research, the quadratic model was
used to develop statistical models.
2.3 Specimen preparation
The concrete mix was prepared as (a) the aggregate and
rubber content were mixed for 30 s, (b) the water was
added and mixed, (c) the additional water was poured
after mixing with admixtures (Silica Fume and Fly Ash),
and (d) the concrete mixture was mixed for around 3 min.
In the casting procedure, the specimens were cast using
two layers in a vibration table for proper compaction. The
rubberized concrete beam specimens were
100 9 100 9 400 mm. The specimens were covered with
sheets and were cured in a curing tank for 24 h after
demoulding. Figure 3 shows the casting of rubberized
concrete beams.
113 Page 2 of 12 Sådhanå (2020) 45:113

2.3a FRP fabrication and properties: The unidirectional
FRP sheets were used to confine rubberized concrete
beams. The properties of FRP with epoxy are shown in
table 2. The properties of FRP and epoxy were provided by
the manufacturer. The tensile strength of cured laminate
(FRP and epoxy) was 894 MPa. The tensile elastic modulus
and percentage elongation were 65402 and 1.7%
respectively.
2.3b Specimen confinement and test setup: Carbon fiber
reinforced polymer (CFRP) jackets with 1, 2 and 3 layers
were used to confine rubberized concrete cylinders in
groups 1, 2 and 3. The CFRP was wrapped on rubberized
concrete beams with 50% rubber replacement levels. The
experimental program consisted of 66 standard-sized rub-
berized concrete beams (10091009400 mm). A total of 27
beams were wrapped with CFRP to investigate the behavior
and effectiveness of FRP confinement on rubberized con-
crete. One, two, and three layers of FRP were used to
determine the effectiveness of FRP sheets for rubberized
concrete for compressive strength and deformability. Wet
layup technique was used to wrap FRP sheets on rubberized
concrete beams. FRP fabrication for rubberized concrete
beams is shown in figure 4. The dust particles were
removed from the surface of the beams before the appli-
cation of FRP and epoxy. The epoxy had two components
A and B, they were mixed according to the data sheet
Table 1. Physical properties of mineral aggregate and rubber [30].
Material (size in
mm)
Apparent density (g/
cm3)
Oven dry density (g/
cm3)
Water absorption
(%)
Specific
gravity
Bulk density (g/
cm3)
Flakiness
Index
Rubber (0–5) 0.78 – – – 0.42 –
Rubber (5–10) 1.08–1.24 1.0–1.10 4.90–7.90 1.08 0.46 6.3–7.9
Rubber (10–20) 2.60 2.54 0.78–1.26 1.08 0.48 9.8–15.5
Sand (0–5) 2.60 2.54 0.5 1.08 1.74 –
Gravel (5–10) 2.67 2.56 1.22 2.60 1.48 6.80
Gravel (10–20) 2.67 2.56 1.22 2.60 1.54 9.70
0 10
0
20
40
60
80
100
10IIII
10.1
Per
cent
Pas
sing
(%)
Particle size (mm)
Sand (0-5) Rubber (0-5) Gravel (5-10) Rubber (5-10) Gravel (10-20) Rubber (10-20)
Figure 1. Particle size distribution of mineral aggregates and
rubber.
Figure 2. Response surface method approach.
Figure 3. Casting of rubberized concrete beams.
Sådhanå (2020) 45:113 Page 3 of 12 113

provided by the manufacturer. The adhesive hardened after
5 h. The specimens were tested under a four-point loading
test using a 300 kN capacity universal testing machine. An
overlap of 100 mm for FRP jacketing was provided to avoid
de-bonding and premature failure of beams. The cylinders
were loading up to failure using a loading rate of 0.25 MPa/
s. Figure 5 shows the general view of the test setup. Each
loading segment in the test setup had round edges to
accurately transfer the load from the testing machine to the
concrete beams.
3. Results and discussion
3.1 Failure modes
The plain and less rubberized concrete beams containing
0–30% rubber content in all groups showed a typical failure
pattern of under-reinforced concrete beams. The brittle
failure was observed with vertical flexural cracks in the
pure bending region. However, the cracking pattern was
observed to be different in group 3 (fine and coarse rubber
replacement) with high rubber content (50%), showed
higher deformation and delayed cracking. Cracks initiated
from mid of the beams and spread towards the supports in a
gentle manner. Crack widths increased considerably after
the load increased. The crack waves propagated towards the
top of the beams. The failure modes of unconfined RuC
beams are shown in figure 6.
The failure modes of CFRP-confined rubberized concrete
were more ductile in nature as compared to the unconfined
RuC cylinder. The group 3 showed delayed cracking and
more ductility as compared to group 1 (fine rubber
replacement) and 2 (coarse rubber replacement) with the
same reinforcement ratio of FRP. A detachment of FRP in
group 1 was observed as shown in figure 7. The detachment
of FRP could be due to rough surface of rubber particles
that decreases the effectiveness of adhesive. However, no
considerable difference in failure pattern was observed with
increasing layers of FRP. Overall, FRP successfully
Table 2. Properties of FRP jackets (fabric and laminate).
Property FRP fabric Laminate
Orientation of fibers O0 –
Tensile strength (MPa) 4100 894
Tensile elastic modulus (MPa) 231000 65402
Elongation (%) 1.7 1.33
Primary fiber direction Unidirectional –
Figure 4. Fabrication of FRP jackets.
Figure 5. General view of the test setup.
Figure 6. Failure modes of unconfined RuC beams with (a) 0%
rubber, (b) 50% fine rubber, (c) 10% coarse rubber, and (d) 40%
fine and coarse rubber content.
113 Page 4 of 12 Sådhanå (2020) 45:113

delayed the onset of cracking and reduced the brittle nature
of concrete beams.
3.2 Aggregate effect on flexural strength
of rubberized concrete beams
Table 3 shows the flexural strength of unconfined RuC
beams. Equation 1 was used to calculate the flexural
strength of concrete beams.
r ¼ FL
bd2ð1Þ
Where , = Flexural stress (MPa), L = length of the span
in (mm)
F = load (N)
b = width of the beam (mm)
d = depth of the beam (mm)
The rubberized concrete mixes BF-10, BF-30 and BF-50
achieved 5.1, 4.44 and 2.43 MPa flexural strength. Strength
reduction of 8.2, 24.3 and 127.2% was observed for 10, 30
and 50% replacement levels of rubber content in the con-
crete mix. The mix BF-50 showed the highest reduction in
flexural strength with 50% rubber content. The flexural
strength of rubberized concrete beams was compared with
the existing literature [10, 32]. The comparison between the
predicted and experimental flexural strength shows varia-
tion in results with the same rubber content in concrete. The
reason is attributed to different sources and nature of rubber
content. The specimen BC-10, BC-30 and BC-50 achieved
4.86, 3.93 and 2.4 MPa flexural strength. Strength reduction
of 8.2, 24.3 and 127.2% was observed for 10, 30, and 50%
replacement levels of rubber content in the concrete mix.
The predicted results by Moh et al were close to the
experimental test values in this group. The mix BC-50
Figure 7. The typical failure mode of CFRP-confined RuC
beams (a) 50% fine and coarse rubber, (b) detachment of FRP
from RuC beam (50% fine rubber).
Table 3. Flexural Strength of rubberized concrete beams.
ID
Ultimate failure load
Pu (kN)
Unconfined flexural strength
Exp (MPa)
Predicted Batayneh
et al (MPa)
Predicted Moh et al
(MPa)
Flexural strength
reduction (%)
C 21 5.52 5.52 5.52 –
BF-
10
18.7 5.1 4.59 4.896 8.2
BF-
30
14.80 4.44 2.886 3.33 24.3
BF-
50
10 2.43 1.215 1.3365 127.2
BC-
10
16 4.86 4.374 4.6656 8.2
BC-
30
13.1 3.93 2.5545 2.9475 24.3
BC-
50
10.5 2.4 1.2 1.32 127.2
BCF-
50
6.8 2.07 1.5111 1.656 167
-0.2 0.0 0.2 0.4 0.6 0.8 1.0 1.2 1.4 1.6 1.8 2.0
0
5
10
15
20
25
Load
(kN
)
Displacement (mm)
BC BF-10 BF-30 BF-50
Figure 8. Load displacement curves of CFRP-confined rubber-
ized concrete beams (Group-1).
Sådhanå (2020) 45:113 Page 5 of 12 113
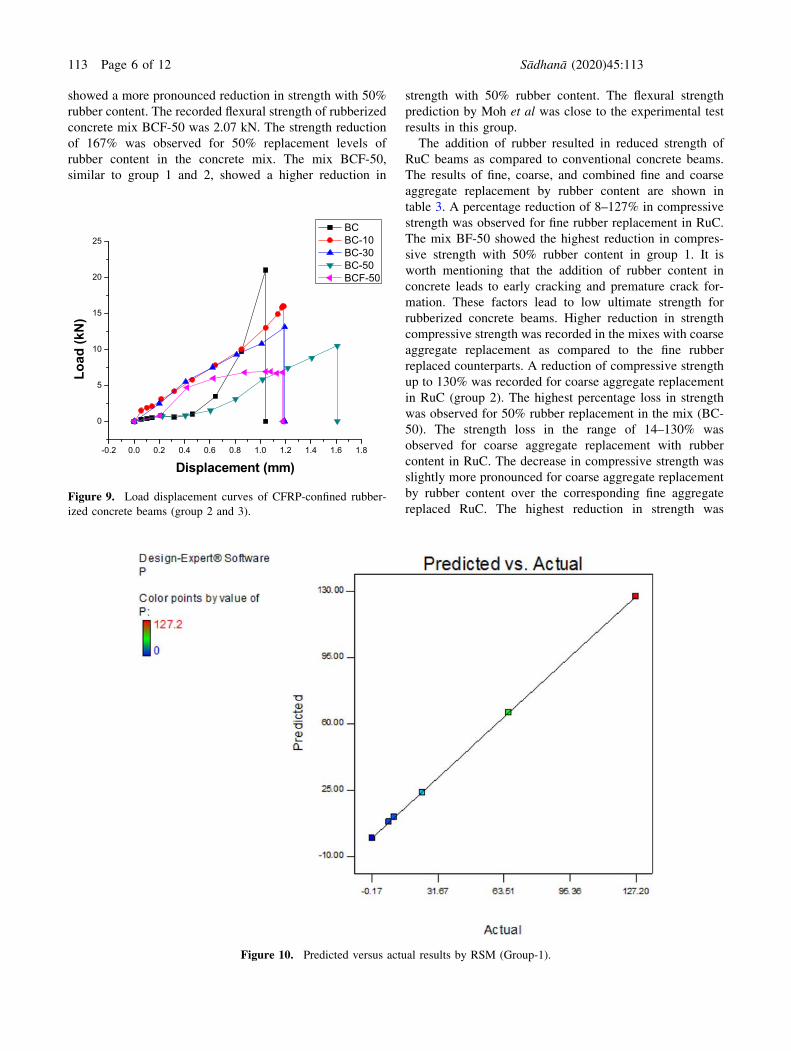
showed a more pronounced reduction in strength with 50%
rubber content. The recorded flexural strength of rubberized
concrete mix BCF-50 was 2.07 kN. The strength reduction
of 167% was observed for 50% replacement levels of
rubber content in the concrete mix. The mix BCF-50,
similar to group 1 and 2, showed a higher reduction in
strength with 50% rubber content. The flexural strength
prediction by Moh et al was close to the experimental test
results in this group.
The addition of rubber resulted in reduced strength of
RuC beams as compared to conventional concrete beams.
The results of fine, coarse, and combined fine and coarse
aggregate replacement by rubber content are shown in
table 3. A percentage reduction of 8–127% in compressive
strength was observed for fine rubber replacement in RuC.
The mix BF-50 showed the highest reduction in compres-
sive strength with 50% rubber content in group 1. It is
worth mentioning that the addition of rubber content in
concrete leads to early cracking and premature crack for-
mation. These factors lead to low ultimate strength for
rubberized concrete beams. Higher reduction in strength
compressive strength was recorded in the mixes with coarse
aggregate replacement as compared to the fine rubber
replaced counterparts. A reduction of compressive strength
up to 130% was recorded for coarse aggregate replacement
in RuC (group 2). The highest percentage loss in strength
was observed for 50% rubber replacement in the mix (BC-
50). The strength loss in the range of 14–130% was
observed for coarse aggregate replacement with rubber
content in RuC. The decrease in compressive strength was
slightly more pronounced for coarse aggregate replacement
by rubber content over the corresponding fine aggregate
replaced RuC. The highest reduction in strength was
-0.2 0.0 0.2 0.4 0.6 0.8 1.0 1.2 1.4 1.6 1.8
0
5
10
15
20
25
Load
(kN
)
Displacement (mm)
BC BC-10 BC-30 BC-50 BCF-50
Figure 9. Load displacement curves of CFRP-confined rubber-
ized concrete beams (group 2 and 3).
Figure 10. Predicted versus actual results by RSM (Group-1).
113 Page 6 of 12 Sådhanå (2020) 45:113

observed for combined fine and coarse rubber replacement
in RuC (group 3). The reduction in strength up to 167% was
recorded in this group i.e., higher than the group 1 and 2.
The highest reduction in strength was observed for the mix
(BCF-50), where the mineral aggregate in concrete was
replaced with a combined 50% fine and coarse rubber
content. Rubberized concrete shows higher lateral dilation
than conventional concrete. The rubber particles also show
higher lateral dilation when subjected to loading [33, 34].
Design-Expert® SoftwareP
Color points by value ofP:
130
0
Internally Studentized Residuals
Nor
mal
% P
roba
bilit
y
Normal Plot of Residuals
-1.34 -0.65 0.04 0.72 1.41
1
5
10
2030
50
7080
90
95
99
Figure 11. Predicted versus actual results by RSM (Group-2).
Table 4. Analysis of variance table (ANOVA) for response surface quadratic model (G-1).
Source Sum of Squares df Mean Square F value
Model 11977.24 3 3992.41 24270.80
x-Unconfined Strength (kN) 3094.63 1 3094.63 18812.99
x^2 120.65 1 120.65 733.45
x^3 23.32 1 23.32 141.77
Table 5. Analysis of variance table (ANOVA) for response
surface quadratic model (G-2).
Source Sum of squares df Mean square F value
Model 10830.00 3 3610.00 32006.86
A-fc’ (kN) 4401.85 1 4401.85 39027.54
A^2 111.20 1 111.20 985.96
A^3 19.49 1 19.49 172.80
1 2 30.0
0.5
1.0
1.5
2.0
2.5
Flex
ural
stre
ngth
(MP
a)
Number of FRP layers
Unconfined Confined
Figure 12. Load carrying capacity of CFRP-confined rubberized
concrete beams (Group-1).
Sådhanå (2020) 45:113 Page 7 of 12 113

This phenomenon produces higher tensile stresses near
rubber content in concrete. The load displacement curves
for unconfined RuC are shown in figures 8 and 9. Fig-
ures 10 and 11 show the predicted versus recorded test
results for unconfined RuC for groups 1 and 2. The para-
metric variable factor for this statistical model was the
percentage of rubber content. Tables 4 and 5 show the
theoretical versus experimental results for groups 1 and 2.
The output response parameter for this model was the
percentage axial compressive strength loss in RuC. The
predicted and recorded test values were in good agreement
because the value of R2 was less than 1. The regression
equations 1 and 2 were developed to predict the reduction
in strength of rubberized concrete beams in groups 1 and 2.
The statistical graph for RuC with both fine and coarse
rubber replacement was not plotted. The reason was less
number of parametric values for percentage rubber
replacement in that group. Equations 2 and 3 were devel-
oped for groups 1 and 2.
P ¼ 84:89� 170:24f 0c þ 131:43f 02c � 50:02f 03c ð2Þ
P ¼ 85:32� 169:77f 0c þ 129:44f 02c � 48:82f 03c ð3ÞWhere P and fc’ are percentage reduction in strength and
unconfined strength respectively.
3.3 Effect of confinement thickness and unconfined
strength on FRP-confined rubberized concrete
beams
The test results of CFRP confined rubberized concrete
beams are indicated in figures 12, 13 and 14. The confined
1 2 30.0
0.5
1.0
1.5
2.0
2.5
3.0
Flex
ural
stre
ngth
(MP
a)
Number of FRP layers
Unconfined Confined
Figure 13. Load carrying capacity of CFRP-confined rubberized
concrete beams (Group-2).
1 2 30.0
0.2
0.4
0.6
0.8
1.0
1.2
1.4
1.6
1.8
2.0
2.2
2.4
Flex
ural
stre
ngth
(MP
a)
Number of FRP layers
Unconfined Confined
Figure 14. Load carrying capacity of CFRP-confined rubberized
concrete beams (Group-3).
Table 6. CFRP-confined RuC (flexural strength).
ID
Unconfined
flexural
strength
(MPa)
Confined
flexural
strength
(MPa)
Confinement
ratio
BF-50FRP1L 2.50 2.53 1.01
BF-50FRP2L 2.50 2.56 1.02
BF-50FRP3L 2.50 2.67 1.06
BC-50FRP1L 2.62 2.64 1.00
BC-50FRP2L 2.62 2.67 1.01
BC-50FRP3L 2.62 2.78 1.06
BCF-50FRP1L 1.70 1.75 1.02
BCF-50FRP2L 1.70 2.07 1.21
BCF-50FRP3L 1.70 2.30 1.35
0 1 2 3 4
0
2
4
6
8
10
12
Load
(kN
)
Displacement (mm)
BF-50 BF-FRP(3L) BC-50 BC-FRP(3L) BCF-50 BCF-FRP(3L)
Figure 15. Load displacement curves of unconfined and CFRP-
confined rubberized concrete beams.
113 Page 8 of 12 Sådhanå (2020) 45:113

Design-Expert® Software
fcc' (kN)Design Points11.1
8.25
X1 = A: FRP layersX2 = B: fc' (kN)
1.00 1.50 2.00 2.50 3.00
8.00
8.02
8.05
8.07
8.10fcc' (kN)
Number of FRP layers
B: fc
' (kN
)
8.48947 8.69956 8.90965 9.11974 9.32982
Figure 16. Contour plot of FRP confined rubberized concrete beams (RSM technique).
Design-Expert® Software
fcc' (kN)
Design Points
B- 8.000B+ 19.000
X1 = A: FRP layersX2 = B: fc' (kN)
B: fc' (kN)
1.00 1.50 2.00 2.50 3.00
Interaction
Number of FRP layers
fcc'
(kN
)
-10
-4.5
1
6.5
12
2222
Figure 17. Interaction diagram of FRP confined rubberized concrete beams (RSM).
Sådhanå (2020) 45:113 Page 9 of 12 113
flexural strength of 2.53, 2.56 and 2.67 MPa was reported
for mixes BF-50FRP1L, BF-50FRP2L, and BF-50FRP3L
respectively. The confinement ratios were 1.01, 1.02 and
1.07 for 1, 2 and 3 layers of CFRP confinement. Strength
increment of 2, 3 and 7% were recorded for 1, 2 and 3
layers of CFRP-confined rubberized concrete over the
unconfined RuC. The confined compressive strength of
2.64, 2.67 and 2.78MPa was reported for mixes BC-
50FRP1L, BC-50FRP2L, and BC-50FRP3L respectively.
The confinement ratios were 1.00, 1.02 and 1.06 for 1, 2
and 3 layers of CFRP confinement. Strength increment of
0.64, 1.8 and 5.71% was recorded for 1, 2 and 3 layers of
CFRP-confined rubberized concrete over the unconfined
RuC. The test results of CFRP confined rubberized concrete
beams are summarized in table 6. The confined compres-
sive strength of 1.75, 2.075 and 2.30 MPa was recorded for
mixes BCF-50FRP1L, BCF-50FRP2L, and BCF-50FRP3L
respectively. The confinement ratios were 1.02, 1.22 and
1.35 for 1, 2 and 3 layers of CFRP confinement. Strength
increment of 2.9, 22.05 and 35.29% was recorded for 1, 2
and 3 layers of CFRP-confined rubberized concrete over the
unconfined RuC. It is worth highlighting that Group 3 was
superior to group 1 and 2 in terms of gain in strength by
using CFRP confinement on rubberized concrete beams.
Figure 15 shows the load displacement curves for CFRP
confined rubberized concrete beams and its comparison
with unconfined beams.
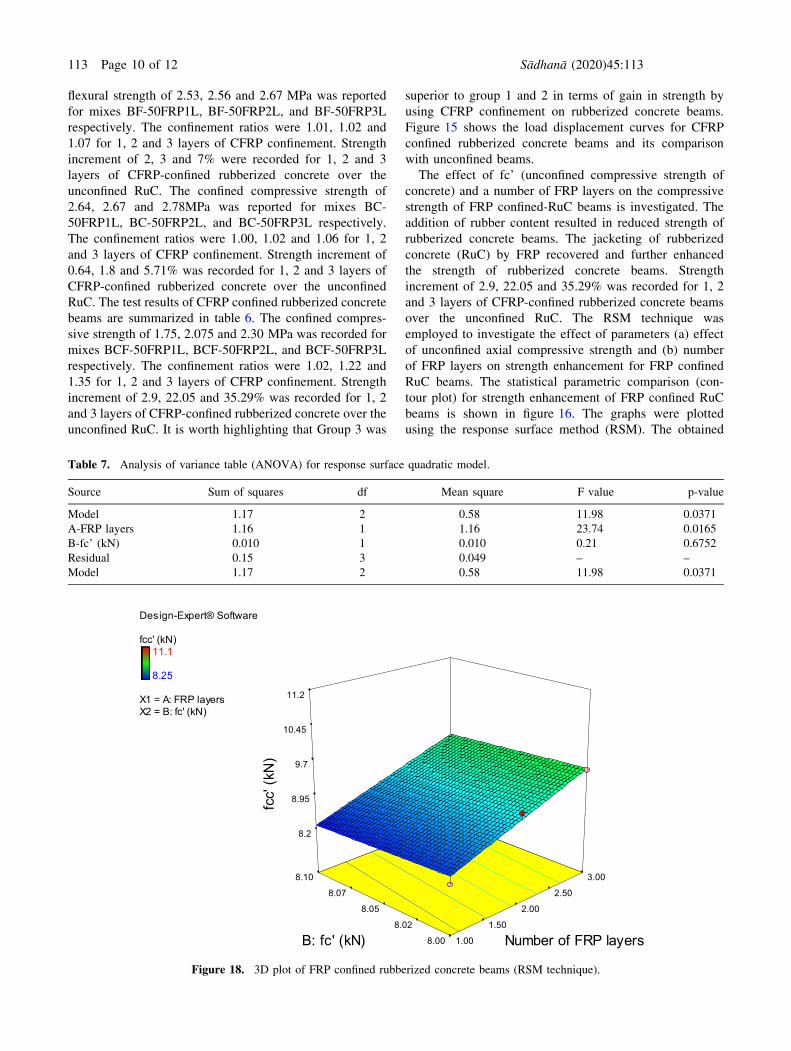
The effect of fc’ (unconfined compressive strength of
concrete) and a number of FRP layers on the compressive
strength of FRP confined-RuC beams is investigated. The
addition of rubber content resulted in reduced strength of
rubberized concrete beams. The jacketing of rubberized
concrete (RuC) by FRP recovered and further enhanced
the strength of rubberized concrete beams. Strength
increment of 2.9, 22.05 and 35.29% was recorded for 1, 2
and 3 layers of CFRP-confined rubberized concrete beams
over the unconfined RuC. The RSM technique was
employed to investigate the effect of parameters (a) effect
of unconfined axial compressive strength and (b) number
of FRP layers on strength enhancement for FRP confined
RuC beams. The statistical parametric comparison (con-
tour plot) for strength enhancement of FRP confined RuC
beams is shown in figure 16. The graphs were plotted
using the response surface method (RSM). The obtained
Table 7. Analysis of variance table (ANOVA) for response surface quadratic model.
Source Sum of squares df Mean square F value p-value
Model 1.17 2 0.58 11.98 0.0371
A-FRP layers 1.16 1 1.16 23.74 0.0165
B-fc’ (kN) 0.010 1 0.010 0.21 0.6752
Residual 0.15 3 0.049 – –
Model 1.17 2 0.58 11.98 0.0371
Design-Expert® Software
fcc' (kN)11.1
8.25
X1 = A: FRP layersX2 = B: fc' (kN)
1.00
1.50
2.00
2.50
3.00
8.00
8.02
8.05
8.07
8.10
8.2
8.95
9.7
10.45
11.2
fcc
' (kN
)
Number of FRP layers B: fc' (kN)
Figure 18. 3D plot of FRP confined rubberized concrete beams (RSM technique).
113 Page 10 of 12 Sådhanå (2020) 45:113

models show a reliable correlation between the response
and parametric factors. The interaction plot shown in
figure 17 depicts how the factors collaborate for the
output response. These statistical models reveal that the
unconfined strength (fc’) highly affects the CFRP-con-
fined strength of rubberized concrete beams and is a
highly sensitive factor. Analysis of variance
table (ANOVA) for the response factor is shown in
table 7. The regression equation ‘‘fcc’ = 4.37 ? 0.54
n-4.58fc’’’ from the statistical model was developed.
Confined strength is designated by the response factor
fcc’. The parametric factors fc’ and n show the uncon-
fined concrete compressive strength and number of FRP
layers respectively. The 3D diagram of two parametric
factors and a response factor involved in the statistical
model are depicted in figure 18.
4. Conclusions
This research for the first time investigates the FRP con-
finement of rubberized concrete beams. RSM technique was
utilized to develop statistical models and analyze the
experiments. The principle variables utilized in this research
were confinement thickness and unconfined strength. The
following conclusions were drawn from this research.
• FRP successfully delayed the onset of cracking and
reduced the brittle nature of concrete beams. The
failure modes of CFRP-confined rubberized concrete
were more ductile in nature as compared to the
unconfined RuC cylinder.
• The RuC beams suffered flexural strength reduction up
to 167% with 50% rubber content.
• The highest reduction in flexure strength was observed
for combined fine and corase aggregate replacement
with rubber content in RuC beams. The inclusion of
rubber content in concrete resulted in premature micro-
cracking.
• CFRP jacketing enhanced the flexural strength up to
35% of unconfined rubberized concrete beams. Batay-
neh’s model was close to the experimental results for
predicting the flexural strength of RuC beams.
• The statistical models revealed that the unconfined
strength (fc’) highly affects the CFRP-confined
strength of rubberized concrete beams and is a highly
sensitive factor.
5. Recommendations
Further research should be directed towards the durability of
rubberized concrete for practical engineering applications.
Moreover, the usage of rubberized concrete in extreme
weather conditions in long term should also be evaluated.
Nomenclature/notationsb Width of the beam (mm)
d depth of the beam (mm)
F load (N)
fc’ unconfined compressive strength of concrete
fcc’ FRP-confined compressive strength of concrete
, flexural stress (MPa)
L length of the span in (mm)
n number of FRP layers
References
[1] Raffoul S, Garcia R, Escolano-Margarit D, Guadagnini M,
Hajirasouliha I and Pilakoutas K 2017 Behaviour of
unconfined and FRP-confined rubberised concrete in axial
compression. Constr. Build. Mater. 147: 388–397.
[2] Thomas B S and Gupta R C 2016 A comprehensive review
on the applications of waste tire rubber in cement concrete.
Renew. Sustain. Energy Rev. 54: 1323–1333.
[3] Sengul O 2016 Mechanical behavior of concretes containing
waste steel fibers recovered from scrap tires. Constr. Build.
Mater. 122: 649–658.
[4] Huang S-S, Angelakopoulos H, Pilakoutas K and Burgess I
2016 Reused tyre polymer fibre for fire-spalling mitigation.
Appl. Struct. Fire Eng.
[5] Goulias D G and Ali A-H 1998 Evaluation of rubber-filled
concrete and correlation between destructive and nonde-
structive testing results. Cem. Concr. Aggreg. 201:
140–144.
[6] Son K S, Hajirasouliha I and Pilakoutas K 2011 Strength and
deformability of waste tyre rubber-filled reinforced concrete
columns. Constr. Build. Mater. 25: 218–226.
[7] Liu F, Zheng W, Li L, Feng W and Ning G 2013 Mechanical
and fatigue performance of rubber concrete. Constr. Build.
Mater. 47: 711–719.
[8] Xue J and M Shinozuka 2013 Rubberized concrete: A green
structural material with enhanced energy-dissipation capa-
bility. Constr. Build. Mater. 42: 196–204.
[9] Najim K B and Hall M R 2012 Mechanical and dynamic
properties of self-compacting crumb rubber modified con-
crete. Constr. Build. Mater. 27: 521–530.
[10] Batayneh M K, Marie I and Asi I 2008 Promoting the use of
crumb rubber concrete in developing countries. Waste
Manag. 28: 2171–2176.
[11] Youssf O, Hassanli R and Mills J E 2017 Mechanical
performance of FRP-confined and unconfined crumb rubber
concrete containing high rubber content. J. Build. Eng. 11:
115–126.
[12] Youssf O, ElGawady M A and Mills J E 2015 Experimental
investigation of crumb rubber concrete columns under
seismic loading. In: Structures. Elsevier.
[13] Youssf O, Mills J E and Hassanli R 2016 Assessment of the
mechanical performance of crumb rubber concrete. Constr.
Build. Mater. 125: 175–183.
[14] Hernandez-Olivares F, Barluenga G, Bollati M and Witoszek
B 2002 Static and dynamic behaviour of recycled tyre
rubber-filled concrete. Cem. Concr. Res. 3210: 1587–1596.
Sådhanå (2020) 45:113 Page 11 of 12 113
[15] Richardson A E, Coventry K A and Ward G 2012 Freeze/
thaw protection of concrete with optimum rubber crumb
content. J. Clean. Prod. 23: 96–103.
[16] Sukontasukkul P 2009 Use of crumb rubber to improve
thermal and sound properties of pre-cast concrete panel.
Constr. Build. Mater. 23: 1084–1092.
[17] Ozbakkaloglu T and Idris Y 2014 Seismic behavior of FRP-
high-strength concrete–steel double-skin tubular columns. J.
Struct. Eng. 140: 04014019.
[18] Youssf O, ElGawady M A and Mills J E 2015 Displacement
and plastic hinge length of FRP-confined circular reinforced
concrete columns. Eng. Struct. 101: 465–476.
[19] Youssf O, ElGawady M A and Mills J E 2016 Static cyclic
behaviour of FRP-confined crumb rubber concrete columns.
Eng. Struct. 113: 371–387.
[20] Youssf O, ElGawady M A, Mills J E and Ma X 2014 Finite
element modelling and dilation of FRP-confined concrete
columns. Eng. Struct. 79: 70–85.
[21] Liu J and Sheikh S A 2013 Fiber-reinforced polymer-
confined circular columns under simulated seismic loads.
ACI Struct. J. 110.
[22] Hassanli R, Youssf O, and Mills J E 2017 Seismic
performance of precast posttensioned segmental FRP-con-
fined and unconfined crumb rubber concrete columns. J.
Compos. Constr. 21: 04017006.
[23] Naaman A and Jeong S 2004 Structural ductility of concrete
beams prestressed with FRP tendons. In: Non-Metallic (FRP)
Reinforcement for Concrete Structures: Proceedings of the
Second International RILEM Symposium. CRC Press.
[24] Triantafillou T C 1998 Shear strengthening of reinforced
concrete beams using epoxy-bonded FRP composites. ACI
Struct. J. 95: 107–115.
[25] Theriault M and Benmokrane B 1998 Effects of FRP
reinforcement ratio and concrete strength on flexural behav-
ior of concrete beams. J. Compos. Constr. 2: 7–16.
[26] Toutanji H A and Gomez W 1997 Durability characteristics
of concrete beams externally bonded with FRP composite
sheets. Cem. Concr. Compos. 19: 351–358.
[27] Zahid M, Shafiq N, Isa M H and Gil L 2018 Statistical
modeling and mix design optimization of fly ash based
engineered geopolymer composite using response surface
methodology. J. Clean. Prod. 194: 483–498.
[28] Anderson M and Whitcomb P 2002 Find the Optimal
Formulation for Mixtures. Stat-Ease Inc, Minneapolis.
[29] Zahid M, Shafiq N and Jalal A 2018 Investigating the effects
of solarcure curing method on the compressive strength,
microstructure and polymeric reaction of fly ash based
geopolymer. Constr. Build. Mater. 181: 227–237.
[30] Feng X, Tufail R F and Zahid M 2019 Experimental
investigation and statistical modeling of FRP confined RuC
using response surface methodology. Civ. Eng. J. 5:
268–283.
[31] Son D, Lee J, Qiao S, Ghaffari R, Kim J and Lee J E 2014
Multifunctional wearable devices for diagnosis and therapy
of movement disorders. Nat. Nanotechnol. 9: 397.
[32] Mohammed B S, Hossain K M A, Swee J T E, Wong G and
Abdullahi M 2012 Properties of crumb rubber hollow
concrete block. J. Clean. Prod. 23: 57–67.
[33] Gholampour A, Ozbakkaloglu T and Hassanli R 2017
Behavior of rubberized concrete under active confinement.
Constr. Build. Mater. 138: 372–382.
[34] Youssf O, ElGawady M A, Mills J E and Ma X 2013
Experimental and finite element investigation of rubberized
concrete confined by FRP. Arinex.
113 Page 12 of 12 Sådhanå (2020) 45:113
Top Related