

Languages
Pages
Legal


Statistical Genetics
Matt McQueenAssistant Professor
Institute for Behavioral GeneticsUniversity of Colorado at Boulder

Why am I here?
Statistical Genetics - Biodemography

Perspectives…

Perspectives…
Epidemiology

Perspectives…
Biostatistics

Perspectives…
Health Policy

Perspectives…
Environmental Health
Perspectives…
Society, Human Development and Health

The View from Here…
GENES Outcome
Environment

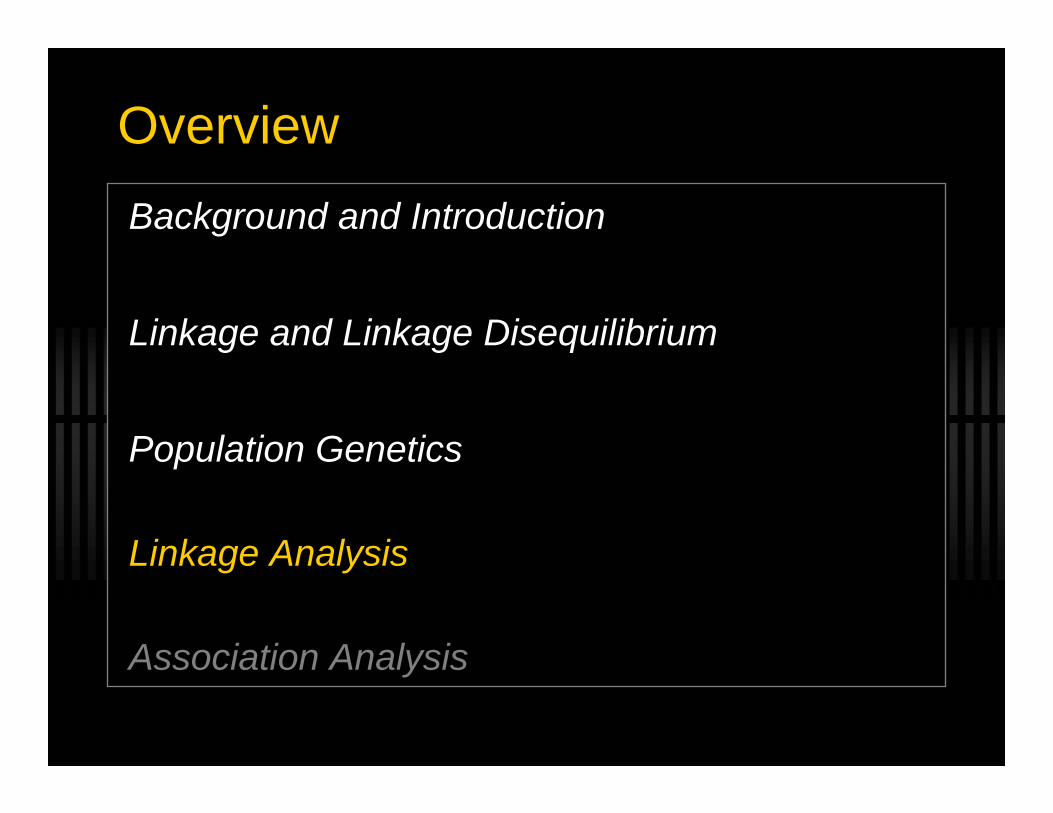
OverviewBackground and Introduction
Linkage and Linkage Disequilibrium
Population Genetics
Linkage Analysis
Association Analysis

OverviewBackground and Introduction
Linkage and Linkage Disequilibrium
Population Genetics
Linkage Analysis
Association Analysis

Statistical GeneticsOtherwise known as:
- Genetic Epidemiology- Genetic Statistics
By definition, “integrative”- Combines epidemiological, statistical, clinical,
genetic and molecular approaches

Genetic Discovery
Evidence for genetic effects? Familial aggregation
Mode of inheritance? Segregation Analysis
Where in the region? Fine Mapping
What chromosome / region? Linkage Analysis
What gene? Association Analysis
What is the effect of the gene? Characterization
Why Hunt for Genes?

Why Hunt for Genes?Disease etiology
Why Hunt for Genes?Disease etiology
Refined diagnosis and/or prognosis

Why Hunt for Genes?Disease etiology
Refined diagnosis and/or prognosis
Drug development

Why Hunt for Genes?Disease etiology
Refined diagnosis and/or prognosis
Drug development
Disease prediction

Challenges

ChallengesField is young and changes rapidly
- Technology drives the science- We test because we can

ChallengesLiterature can be difficult
- Statisticians writing genetic papers- Geneticists writing statistical papers

ChallengesSoftware typically not well-tested or supported
- The cost of being “free”- Use at your own risk!

ChallengesMethods are often oversold
- Consequence of high-pressure field - Rapid development creates sense of urgency
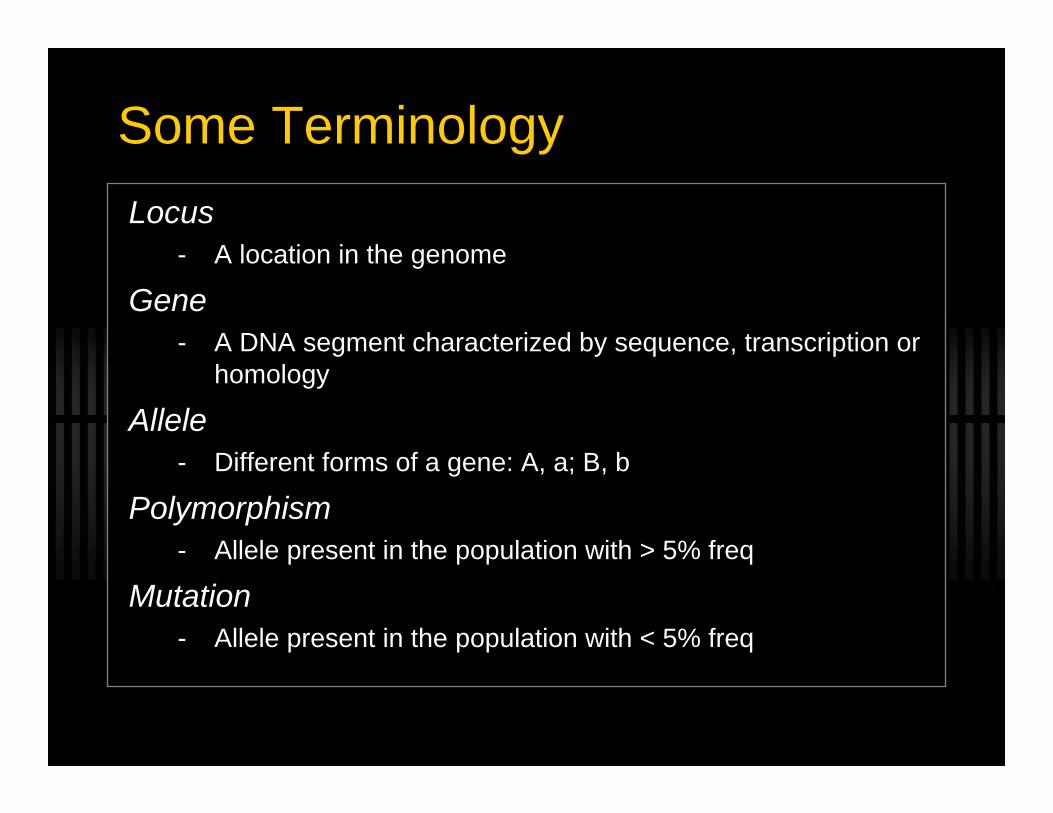
Some TerminologyLocus
- A location in the genome
Gene- A DNA segment characterized by sequence, transcription or
homology
Allele- Different forms of a gene: A, a; B, b
Polymorphism- Allele present in the population with > 5% freq
Mutation- Allele present in the population with < 5% freq

Some TerminologyPhenotype
- Any measurable outcomeQuantitative Trait Locus (QTL)
- A region (gene) that contributes to a phenotypePenetrance (binary, disease phenotypes)
- Prob(Phenotype | Genotype)Heritability (quantitative traits)
- Variance explained by genetic factorsMendelian Disorder
- Diseases influenced by a single geneComplex Trait
- Disease influenced by multiple genes and environment

Pedigree Notation
Male
Female
Founders

Pedigree Notation
Male
Female
Affected

Pedigree Notation
Male
Female
Affected
Deceased

Mendel’s Laws

Mendel’s LawsMendel’s First Law
- Independent Segregation
ggGgg
GgGGGDad
gG
Mom
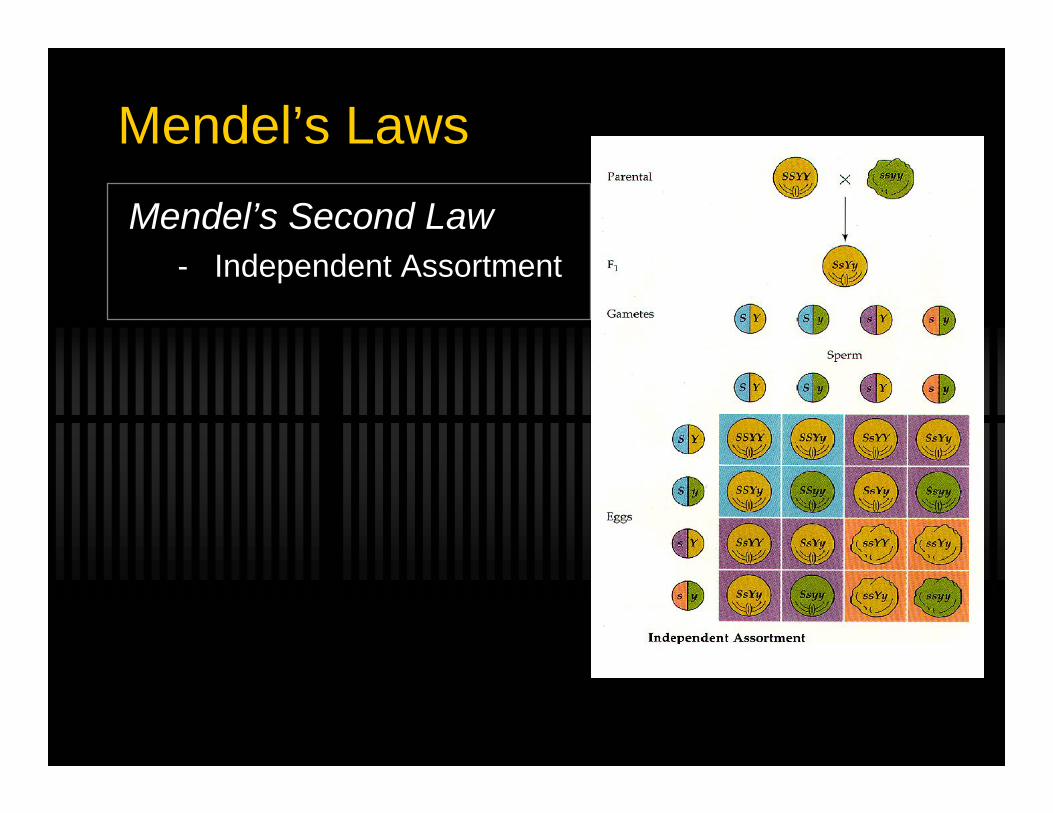
Mendel’s LawsMendel’s Second Law
- Independent Assortment
Mendel’s LawsWhat do peas have to do with people?
- Underlying principles of statistical genetics!

OverviewA Brief Introduction
Linkage and Linkage Disequilibrium
Population Genetics
Linkage Analysis
Association Analysis

Linkage

LinkageGeneral Idea:
- Describes the relationship between two loci- If two loci are close in proximity
- “linked”
- If two loci are far apart (different chromosomes):- “not linked”
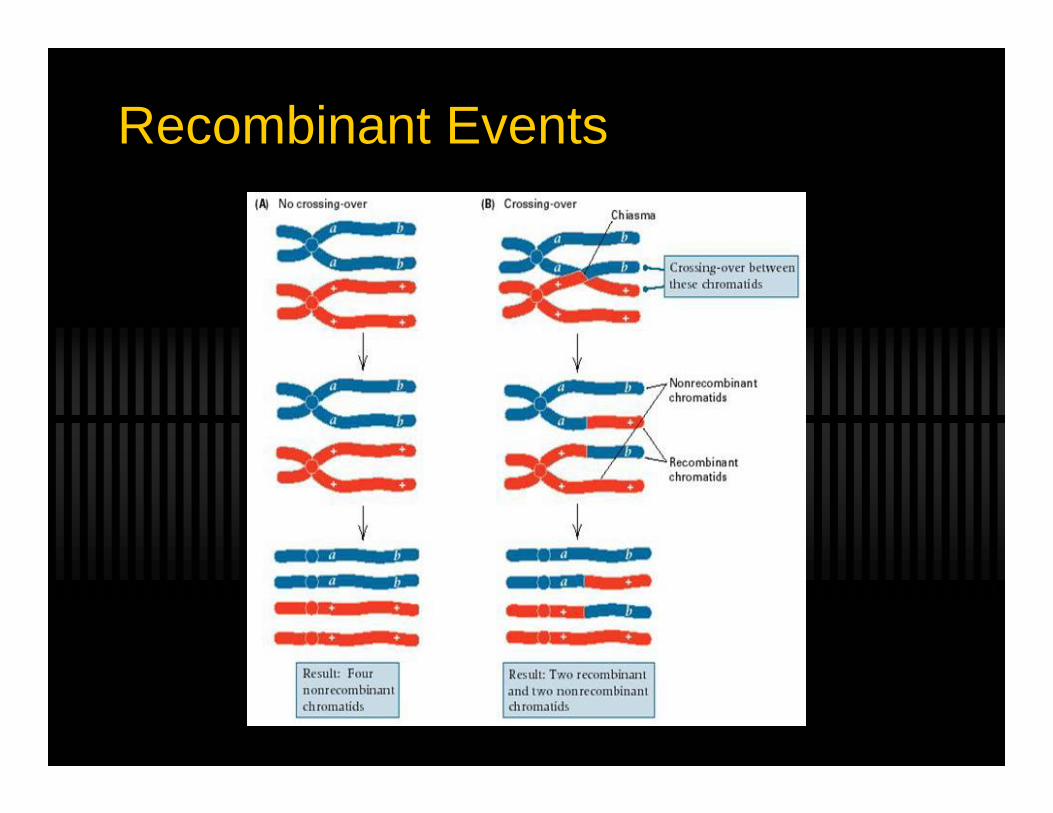
Recombinant Events
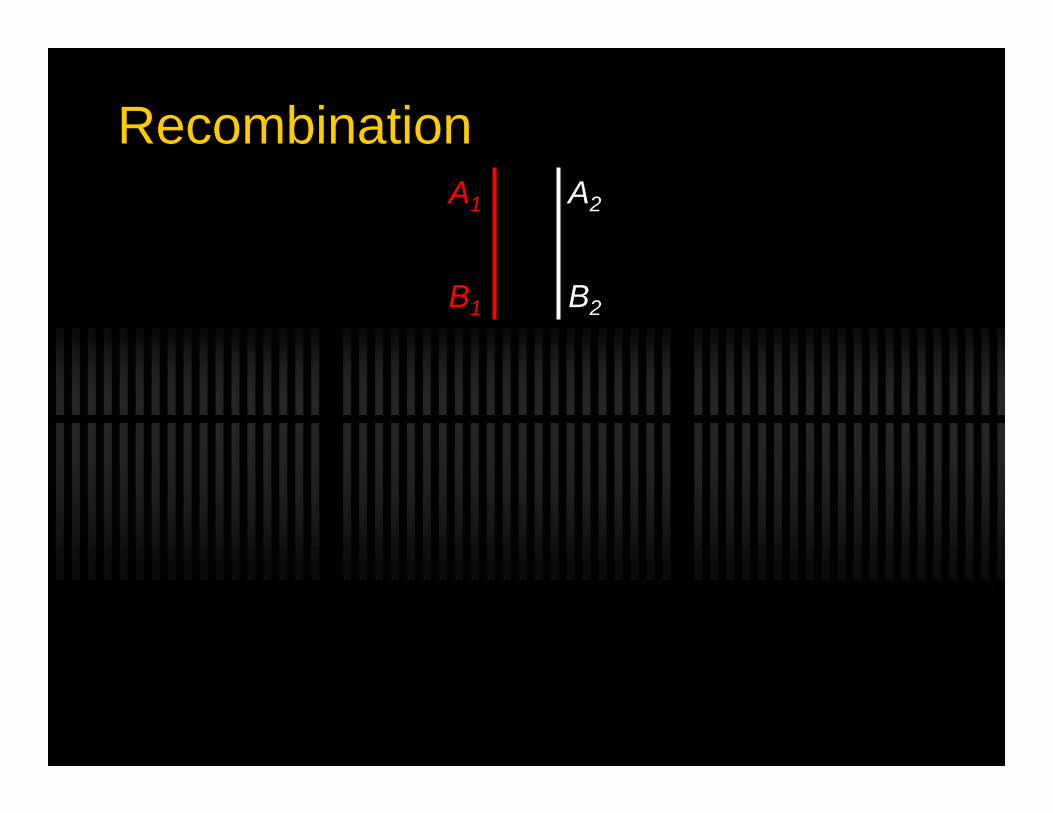
RecombinationA1
B1
A2
B2
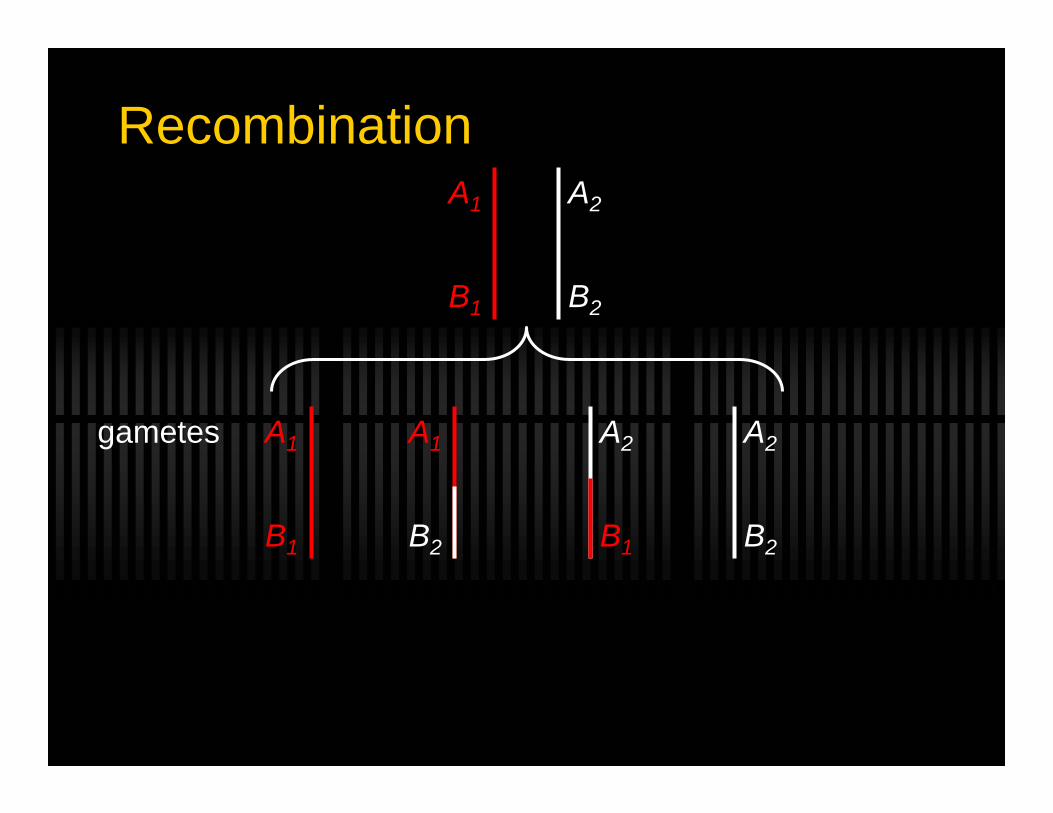
RecombinationA1
B1
A2
B2
gametes A1
B1
A2
B2
A2
B1
A1
B2

RecombinationA1
B1
A2
B2
gametes A1
B1
A2
B2
A2
B1
A1
B2
θ = Recombination Rate
1−θ2
1−θ2
θ2
θ2probability

No LinkageA1
B1
A2
B2
gametes A1
B1
A2
B2
A2
B1
A1
B2
14
14
14
14probability
θ ~ 0.5

Where have we seen this before?Mendel’s Second Law
- Independent Assortment

LinkageA1
B1
A2
B2
gametes A1
B1
A2
B2
θ ~ 0
12
12

Recombination EventsWhat predicts a recombination event?
What drives the recombination fraction?
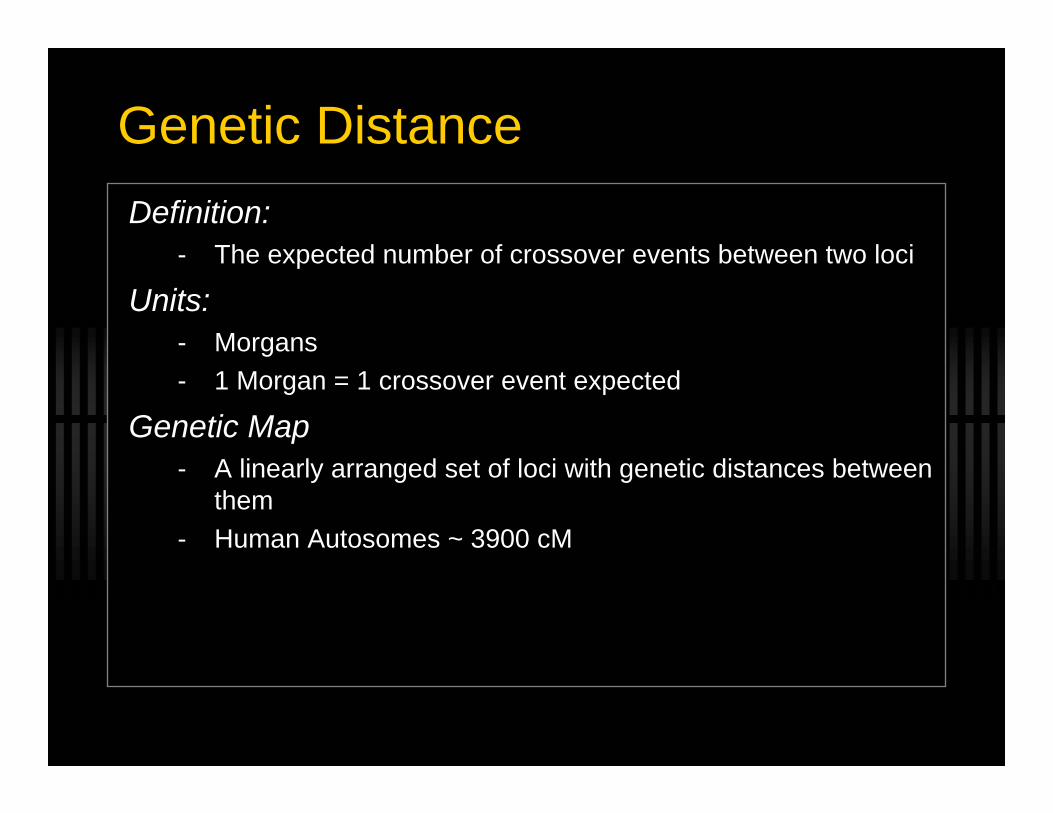
Genetic DistanceDefinition:
- The expected number of crossover events between two loci
Units:- Morgans- 1 Morgan = 1 crossover event expected
Genetic Map- A linearly arranged set of loci with genetic distances between
them- Human Autosomes ~ 3900 cM

Linkage Disequilibrium

Linkage DisequilibriumGeneral Idea:
- Describes the relationship between alleles at two loci
- If the alleles at each loci are close in proximity:- “in linkage disequilibrium”

Linkage Disequilibrium
x4x3x2x1Frequency
A2B2A2B1A1B2A1B1Gametes

Linkage Disequilibrium
x4x3x2x1Frequency
A2B2A2B1A1B2A1B1Gametes
pB2=x2+x4pB1=x1+x3pA2=x3+x4pA1=x1+x2Frequency
B2B1A2A1Allele

Linkage Disequilibrium
x4x3x2x1Frequency
A2B2A2B1A1B2A1B1Gametes
pB2=x2+x4pB1=x1+x3pA2=x3+x4pA1=x1+x2Frequency
B2B1A2A1Allele
D = Observed - Expected
D = x1 − pA1pB1
D = x1 − (x1 + x2)(x1 + x3)D = x1x4 − x2x3

Another Common LD Metric
r2 =D2
pA1pA 2 pB1pB 2

Reasons for LDMutation
Population Subdivision
Genetic Drift
Lack of Recombination
Selection
Non-Random Mating

How does linkage relate to linkage disequilibrium?

Linkage and LD
Dt = (1−θ)t D0
After t generations of random mating…
LD is a function of recombination and time (generations)

Linkage and LD
Key Concepts…- Linkage : Location- LD : Alleles- There can be Linkage without LD- There can be LD without Linkage

OverviewBackground and Introduction
Linkage and Linkage Disequilibrium
Population Genetics
Linkage Analysis
Association Analysis

DNA VariationDNA
- Adenine (A)- Guanine (G)- Cytosine (C)- Thymine (T)
DNA double helix- A pairs with T and G pairs with C
Codons- Triplets of bases- 64 possible codons
- 20 amino acids

MutationsPoint
- Substitute one base for another
Deletions- Base removed entirely
Insertions- Base inserted
Duplications- Base and/or sequence duplicated

MutationsPoint
- Substitute one base for another
Deletions- Base removed entirely
Insertions- Base inserted
Duplications- Base and/or sequence duplicated

More on Point MutationsPoint Mutations
- Synonymous- No change in amino acid
- Nonsynonymous- Amino acid change
- Creates a new polymorphic site- “Single Nucleotide Polymorphism” (SNP)

Mutation Becomes PolymorphismInfinite Sites Model
- Each mutation creates a unique polymorphic site- Mutation rate ~ 10-6

Life After MutationMutation is neutral
- Random Genetic Drift- Eventually, the allele will “drift” out
Mutation is harmful- Selective Pressure
- Allele may quickly disappear
Mutation is beneficial- Selective Pressure
- Allele frequency may increase rapidly
Human Genetic History

Human Genetic History
National Geographic: The Genographic Project

Human Genetic History
National Geographic: The Genographic Project

Human Genetic History
National Geographic: The Genographic Project

Human Genetic History
National Geographic: The Genographic Project
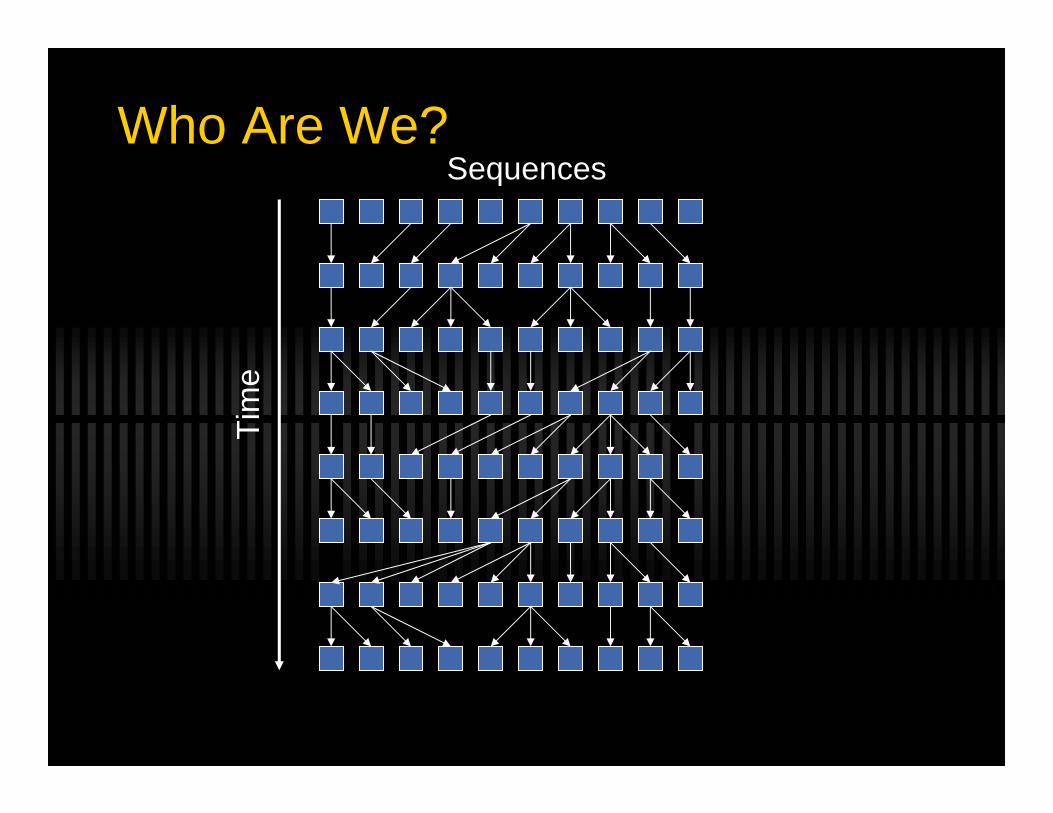
Who Are We?
Tim
e
Sequences

Who Are We?
Tim
e
Sequences

Who Are We?
Tim
e
MRCA
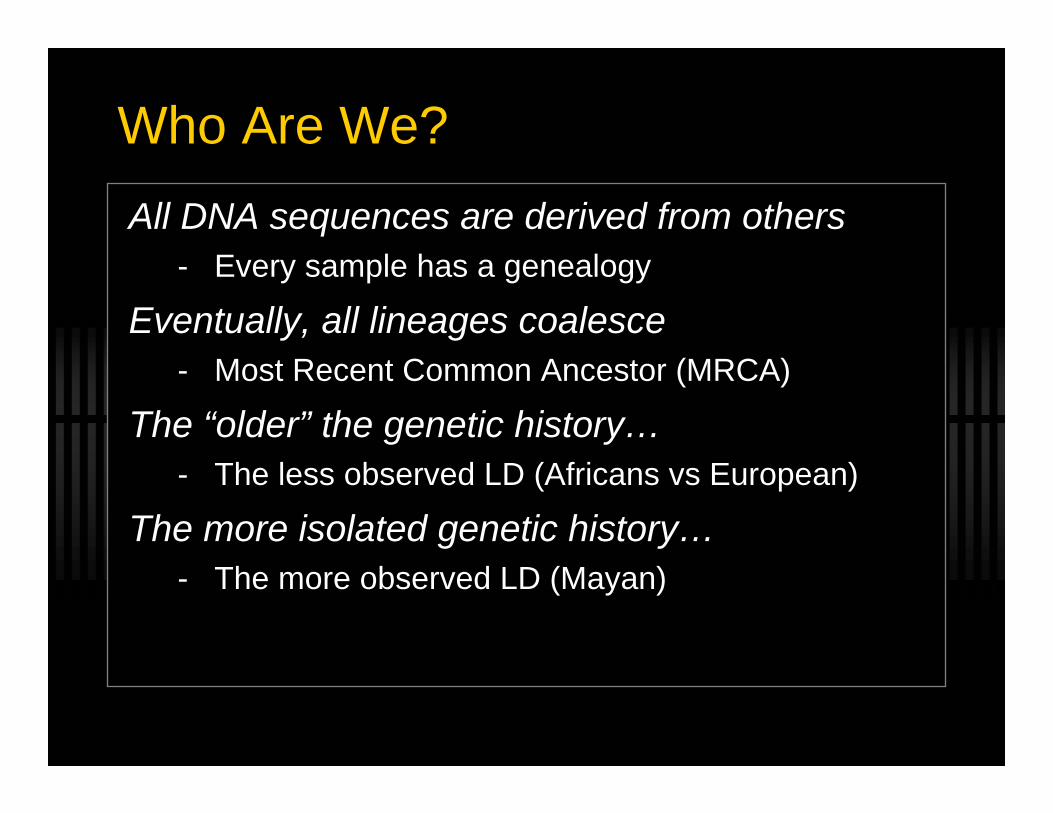
Who Are We?All DNA sequences are derived from others
- Every sample has a genealogy
Eventually, all lineages coalesce- Most Recent Common Ancestor (MRCA)
The “older” the genetic history…- The less observed LD (Africans vs European)
The more isolated genetic history…- The more observed LD (Mayan)

Who Are We?What does this have to do with gene-mapping?
Balding (2006) Nat Rev Genet.
OverviewBackground and Introduction
Linkage and Linkage Disequilibrium
Population Genetics
Linkage Analysis
Association Analysis

Linkage AnalysisGene-Mapping
- Manipulate the Properties of Linkage- Using an observed locus (marker) to draw inferences about
an unobserved locus (disease gene)
Family-Based Design- Extended (grandparents, parents and kids)- Nuclear (parents and kids)
- Sibling Pair (no parents and kids)
Goal: Find genomic region “linked” to disease

Linkage Analysis
0 2010 30 40 50 60 70
cM
M1 M2 M3 M4 M5 M6 M7 M8
Disease Gene (unobserved)
Genetic Markers
Genetic Distance

Linkage Analysis
0 2010 30 40 50 60 70
cM
M1 M2 M3 M4 M5 M6 M7 M8
Disease Gene
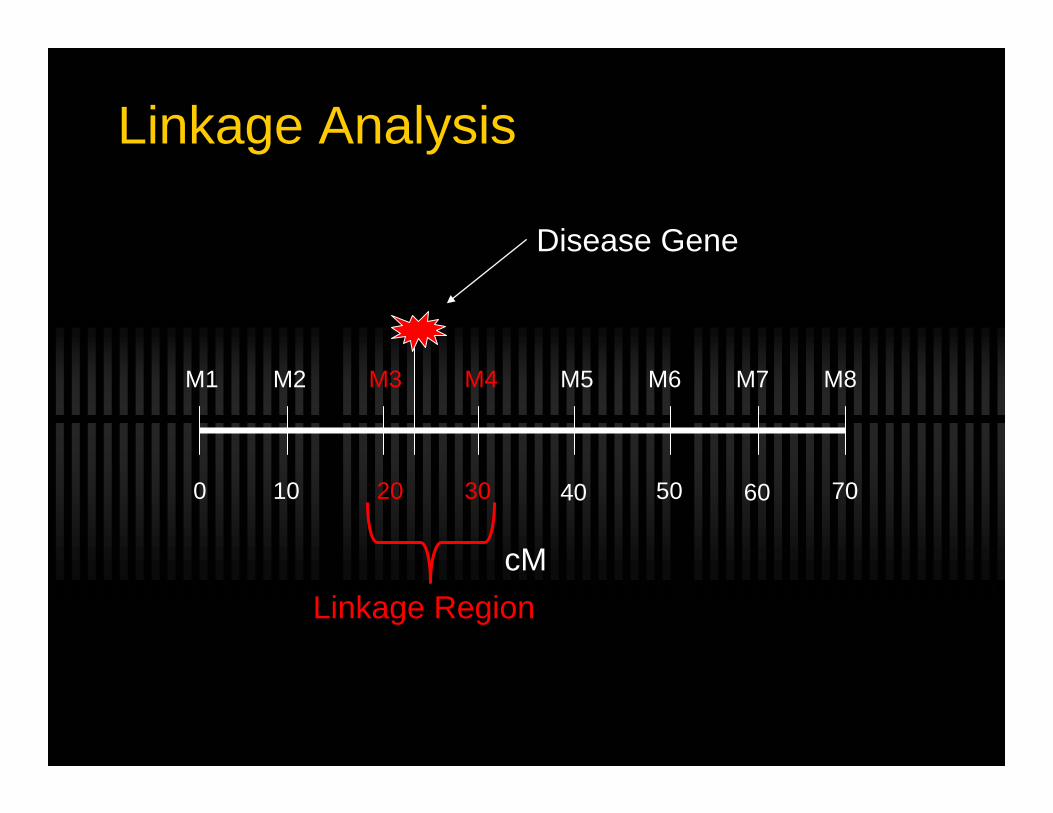
Linkage Analysis
0 2010 30 40 50 60 70
cM
M1 M2 M3 M4 M5 M6 M7 M8
Disease Gene
Linkage Region

Linkage AnalysisParametric
- Affected / Unaffected- Observed recombination events
Non-Parametric- Affected / Unaffected- Identity-by-Descent (IBD)
“Semi-Parametric”- Quantitative- IBD
MCMC- Any phenotype- IBD

Linkage AnalysisParametric
- Affected / Unaffected- Observed recombination events
Non-Parametric- Affected / Unaffected- Identity-by-Descent (IBD)
“Semi-Parametric”- Quantitative- IBD
MCMC- Any phenotype- IBD

Linkage AnalysisKey Concepts
- Allele Sharing (IBS and IBD)- Linkage Statistics (LOD Score, etc.)
Allele Sharing

Identity by State (IBS)
ac bd
IBS = 0
How many alleles are in common?

Identity by State (IBS)
ac ad
IBS = 1
How many alleles are in common?

Identity by State (IBS)
ac ac
IBS = 2
How many alleles are in common?

Identity by Descent (IBD)
ab cd
ac bd
IBD = 0
How many alleles are common by descent?
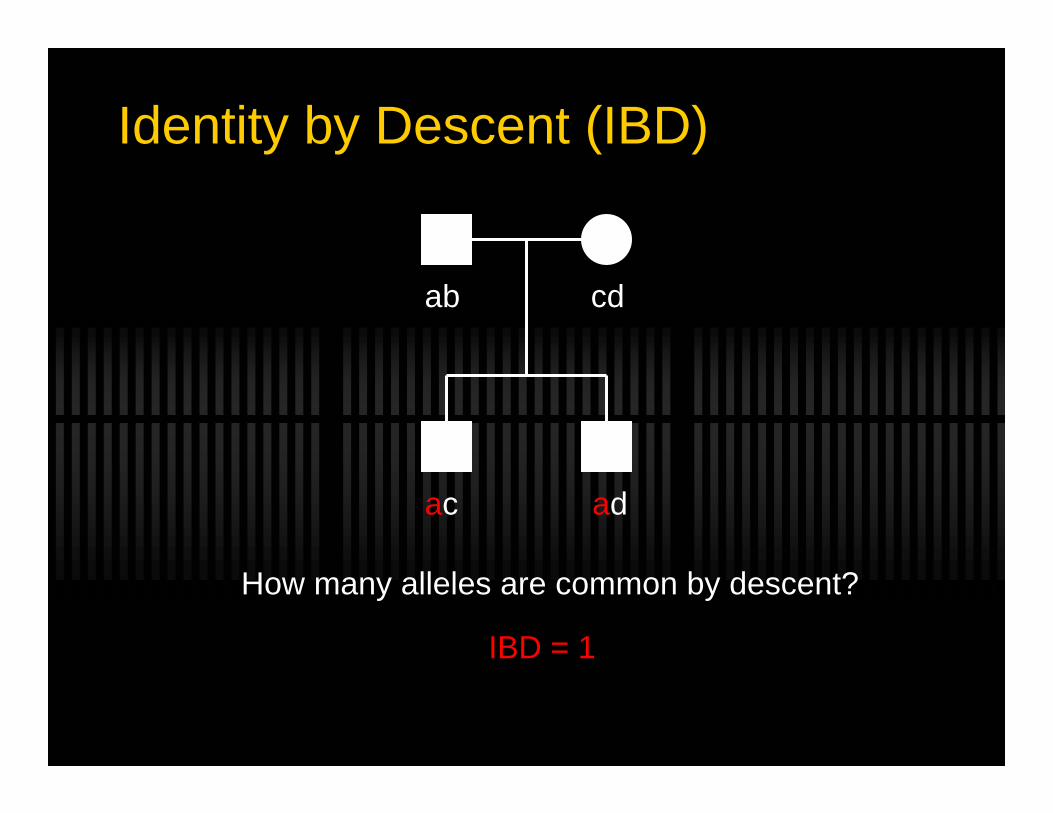
Identity by Descent (IBD)
ab cd
ac ad
IBD = 1
How many alleles are common by descent?
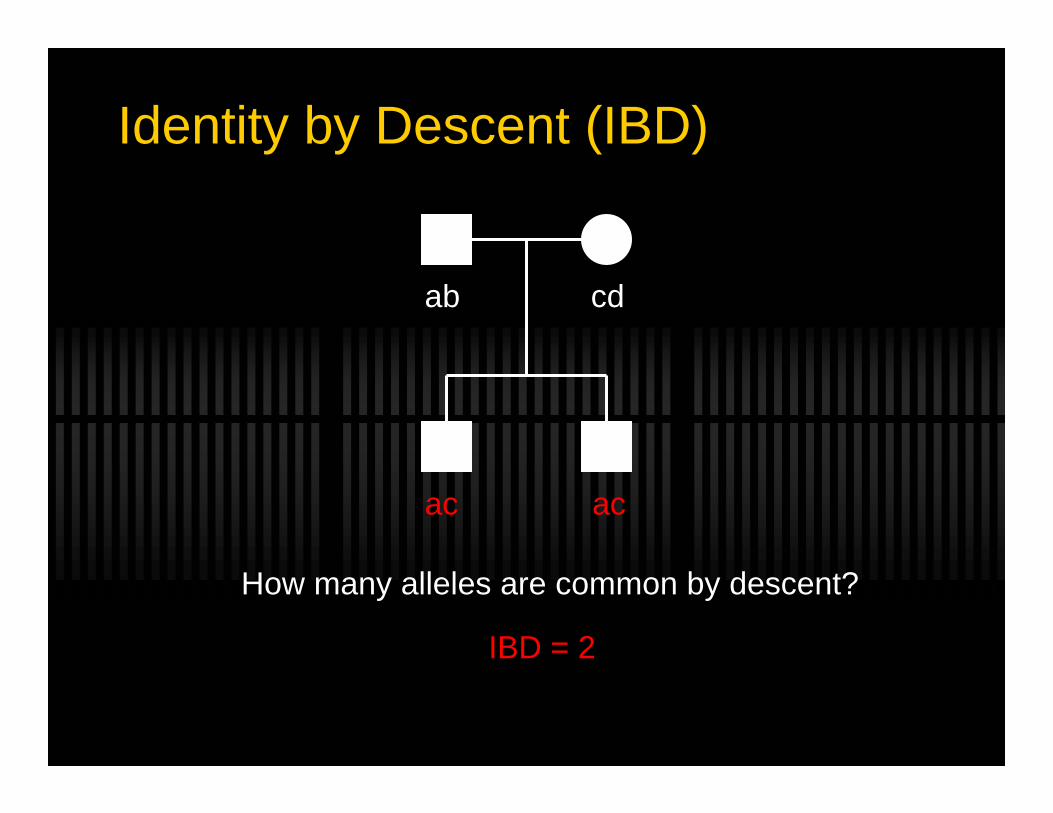
Identity by Descent (IBD)
ab cd
ac ac
IBD = 2
How many alleles are common by descent?

IBS and IBD
ab cd
ac bd
IBS = 0IBD = 0
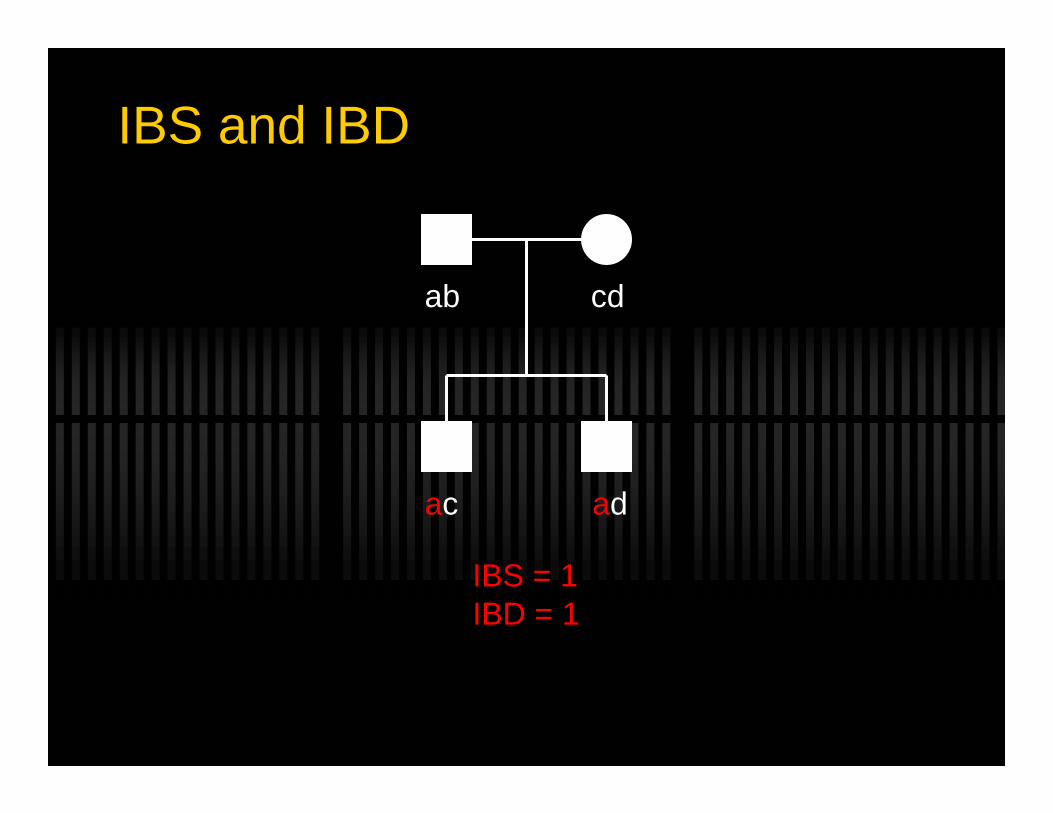
IBS and IBD
ab cd
ac ad
IBS = 1IBD = 1

IBS and IBD
ab cd
ac ac
IBS = 2IBD = 2

Ambiguous IBD
ab cb
bc ab
IBS = 1IBD = 0

IBD Probabilities
00.500.50Avuncular
00.500.50Half-Sibs
00.500.50Grandparent-Grandchild
00.250.75First Cousin
010Parent-Offspring
0.250.500.25Full Sibs
100MZ Twins
π2π1π0Relative PairProbability of Sharing IBD Alleles

IBD and Sibling Pairs
00.500.50Avuncular
00.500.50Half-Sibs
00.500.50Grandparent-Grandchild
00.250.75First Cousin
010Parent-Offspring
0.250.500.25Full Sibs
100MZ Twins
π2π1π0Relative PairProbability of Sharing IBD Alleles

IBD and Sibling PairsUse of Sibling Pairs in linkage analysis
- Affected Sibling Pair (ASP) Design- Binary Trait
- Unascertained Sibling Pair Design- Quantitative Traits
- Ascertained Sibling Pair Design- Quantitative Traits
We look for regions that show deviation of IBD from what is expected under the null

Linkage Analysis of Sibling PairsBasic Idea
- Sibling pairs sharing more alleles IBD than expected at a trait-influencing locus should have more similar phenotypes

Affected Sibling Pairs
ASP DSP USP
If there is a shared genetic component…
P(IBD=0, IBD=1, IBD=2) = 0.25, 0.50, 0.25
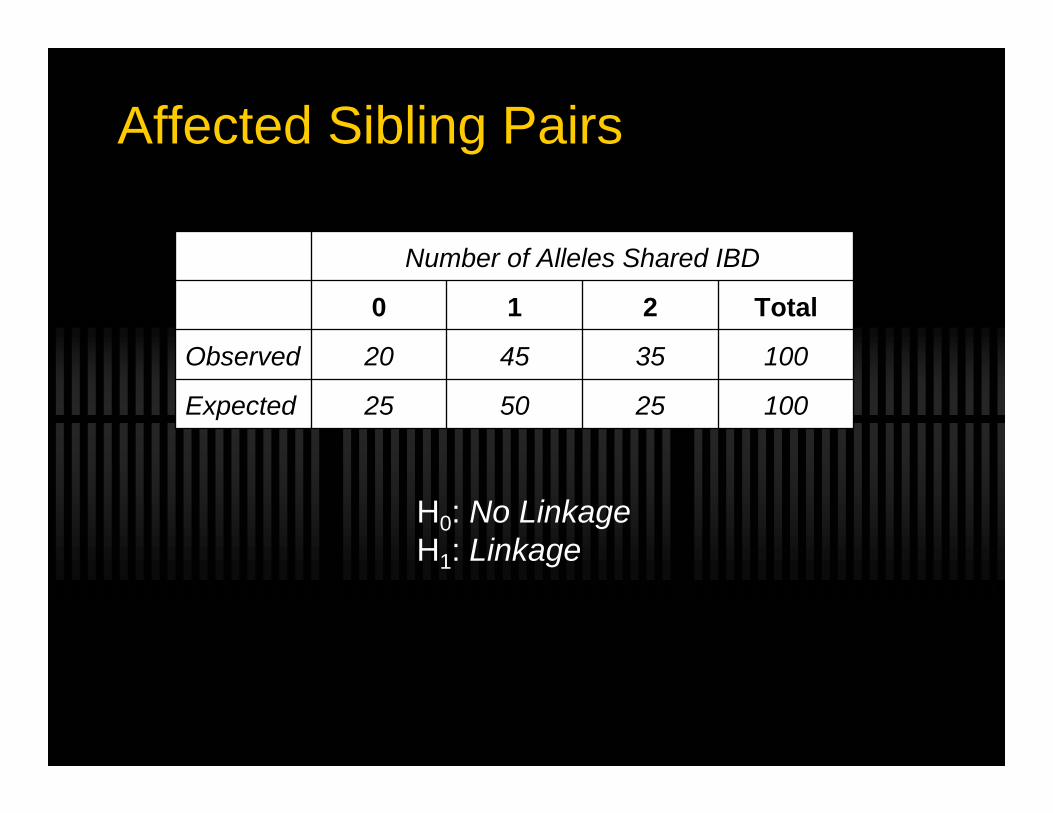
Affected Sibling Pairs
100255025Expected
100354520Observed
Total210
Number of Alleles Shared IBD
H0: No LinkageH1: Linkage

Sibling Pairs (Quantitative Traits)
If there is a shared genetic component…
P(IBD=0, IBD=1, IBD=2) = 0.25, 0.50, 0.25
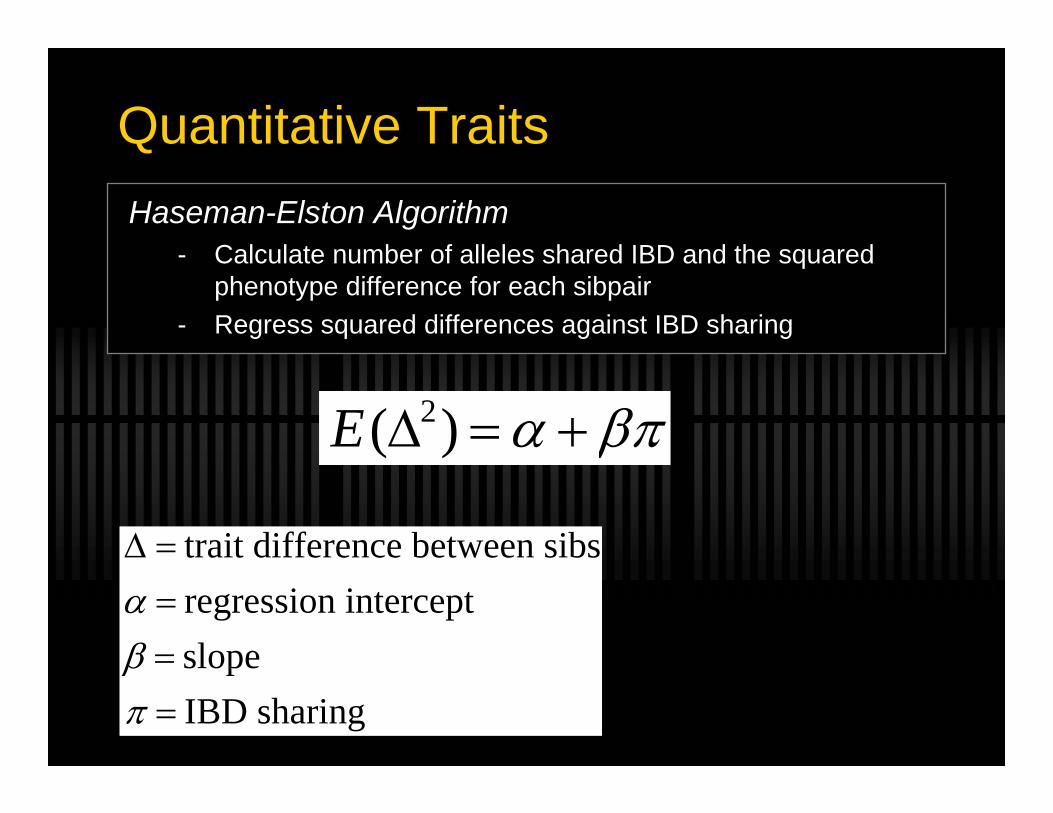
Quantitative TraitsHaseman-Elston Algorithm
- Calculate number of alleles shared IBD and the squared phenotype difference for each sibpair
- Regress squared differences against IBD sharing
E(∆2) =α + βπ
∆ = trait difference between sibsα = regression interceptβ = slopeπ = IBD sharing

0
1
2
3
4
5
6
7
8
9
-0.1 0.4 0.9 1.4 1.9
IBD
Quantitative Traits
β=0
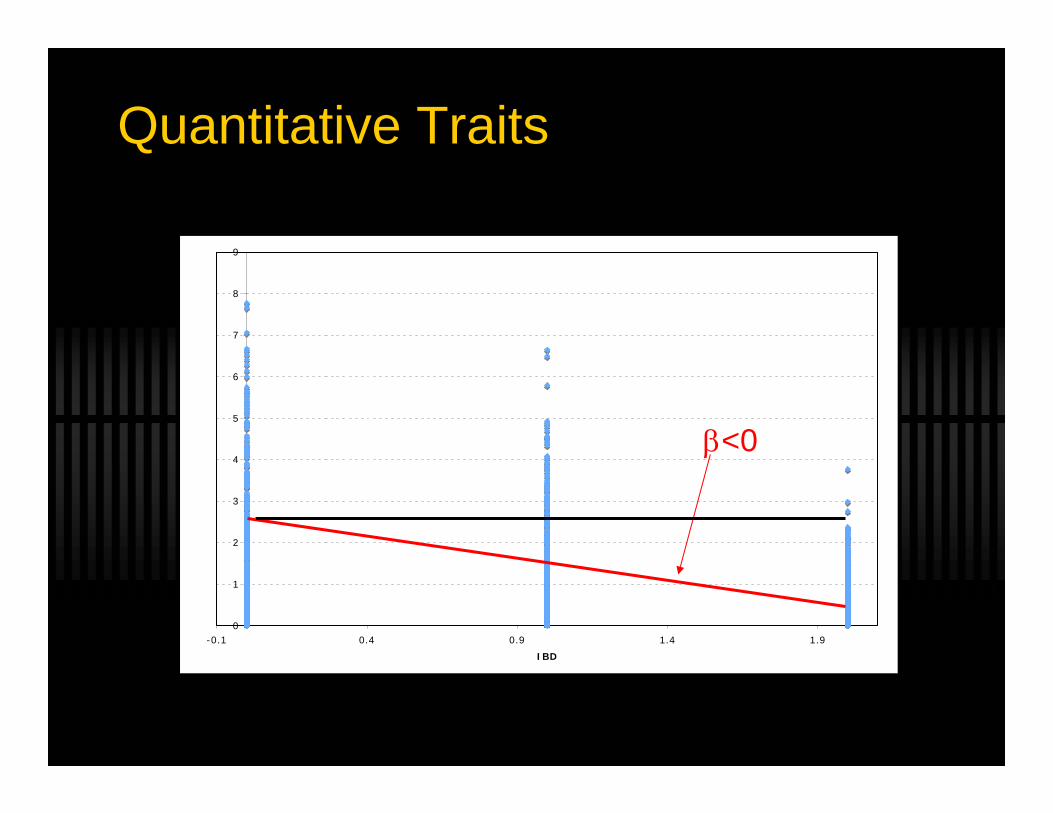
Quantitative Traits
0
1
2
3
4
5
6
7
8
9
-0.1 0.4 0.9 1.4 1.9
IBD
β<0

Linkage Analysis Statistics
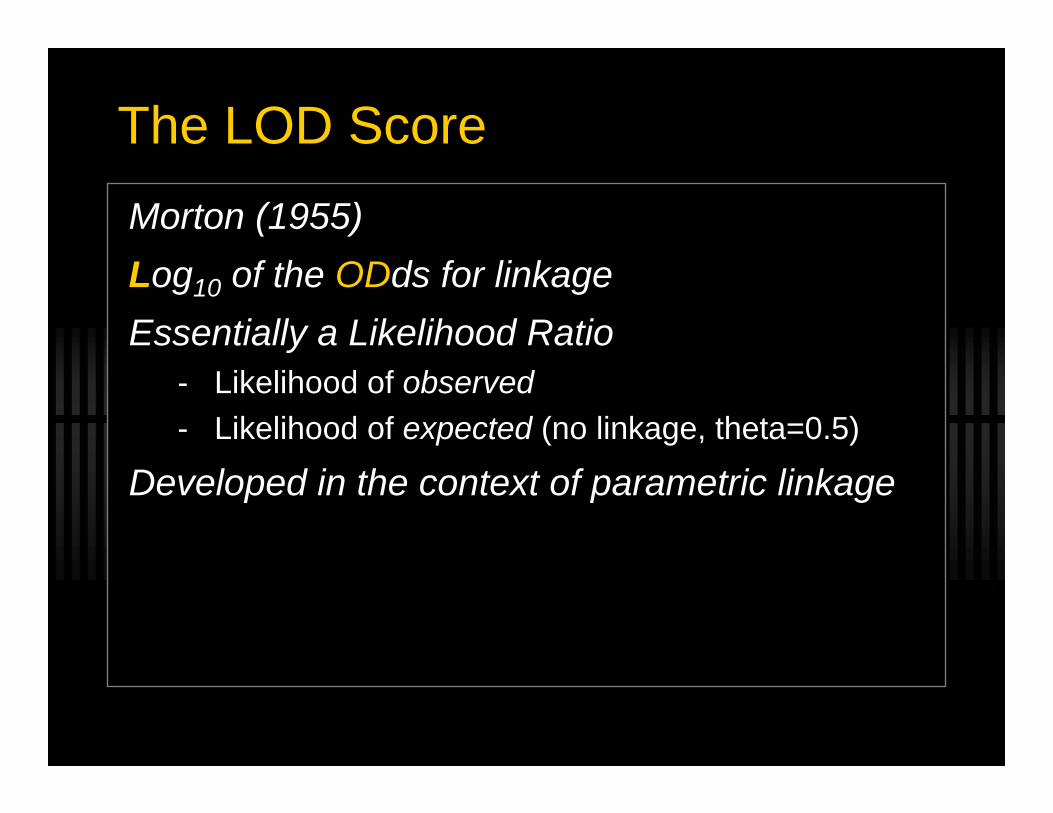
The LOD ScoreMorton (1955)Log10 of the ODds for linkageEssentially a Likelihood Ratio
- Likelihood of observed- Likelihood of expected (no linkage, theta=0.5)
Developed in the context of parametric linkage

Common Nonparametric StatisticsMaximum LOD Score
- “MLS” (or MLOD)- ASP design only- GENEHUNTER, ASPEX
Nonparametric Linkage Score- “NPL Score”- Any family design- GENEHUNTER
Kong and Cox LOD Score- “K&C LOD Score”- Derived from the NPL- MERLIN, ALLEGRO

Interpreting Linkage StatisticsTraditional View…
- LOD > 3.0 for genome-wide significance
More Contemporary View…- Simulate for empirically derived significance

Examples from the LiteratureLinkage Analysis

Alcoholism
Reich et al (1998) Am J Med Genet (Neuropsychiatric Genetics)

Antisocial Drug Dependence
Stallings et al (2005) Archives of Gen Psychiatry

Bipolar Disorder
McQueen et al (2005) Am J Hum Genet

OverviewBackground and Introduction
Linkage and Linkage Disequilibrium
Population Genetics
Linkage Analysis
Association Analysis
Association Analysis

Association AnalysisGene-Mapping
- Manipulate the Properties of Linkage Disequilibrium- Using an observed locus (marker) to draw inferences about
an unobserved locus (disease gene)
Fine-Mapping- Refine a linkage region
Candidate-Gene- Evaluate the genetic variation as it relates to an outcome
Goal: Find genomic region and/or genes “associated”with disease

Association AnalysisFamily-Based
- Parent/Offspring Trios- Sibling Pairs- Nuclear Families- Extended Pedigrees
Population-Based- Case-Control- Cohort

Association AnalysisKey Concepts
- Genotype Coding- Population Stratification- Transmission Disequilibrium Test (TDT)- Whole Genome Association

Coding GenotypesAssume a biallelic marker (SNP)There are three possible genotypes
- AA- Aa- aa

Coding Genotypes
Genotype
100Recessive
(A)
110Dominant
(A)
1,0,00,1,00,0,1Genotype
(A)
210Additive
(A)
AAaAaa
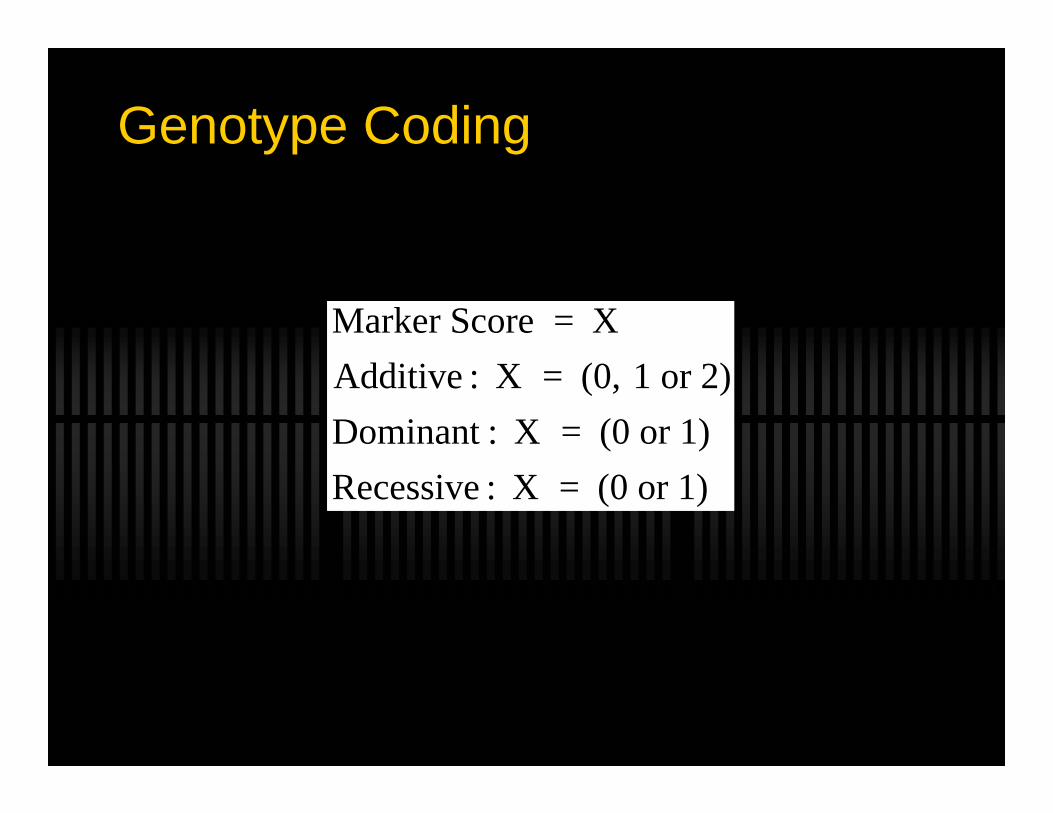
Genotype Coding
Marker Score = XAdditive : X = (0, 1 or 2)Dominant : X = (0 or 1)Recessive : X = (0 or 1)
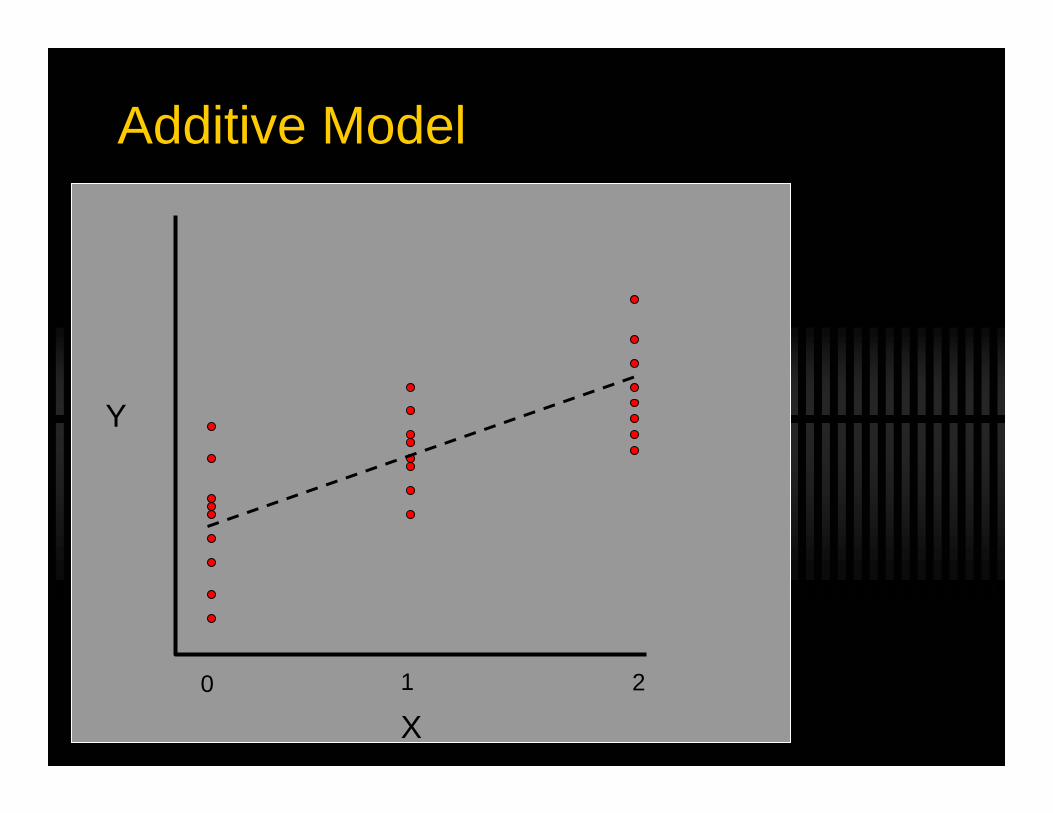
Additive Model
X0 1 2
Y
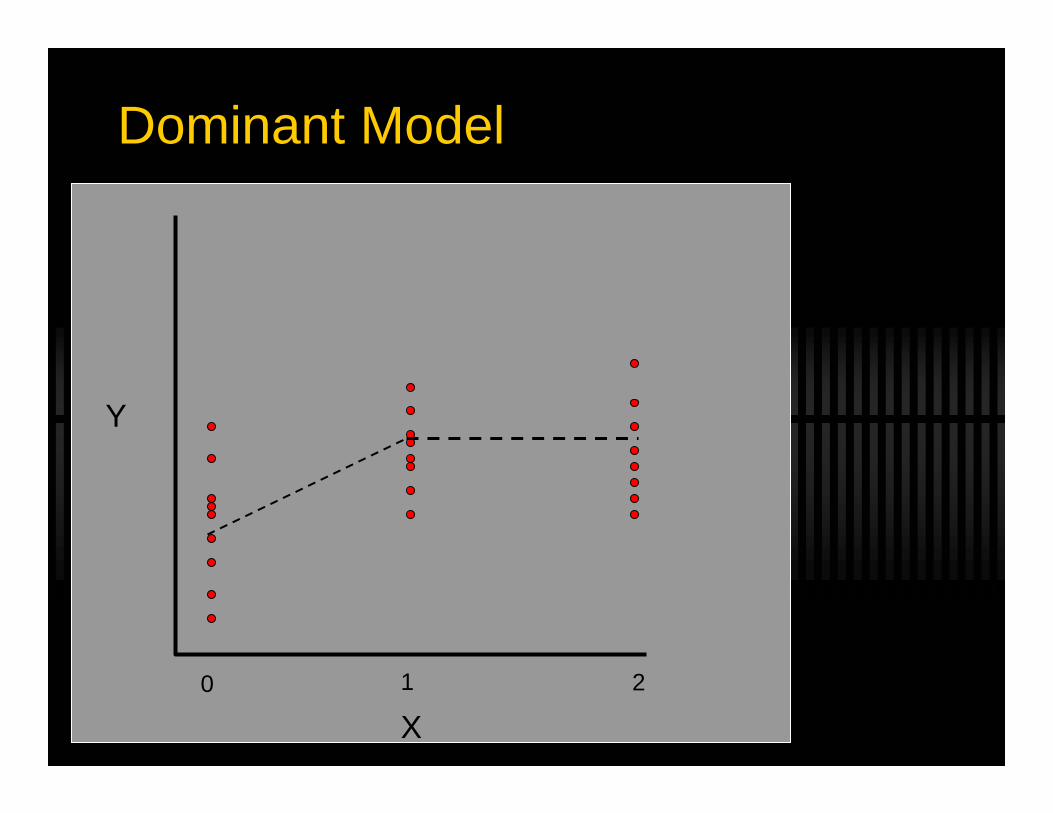
Dominant Model
X0 1 2
Y
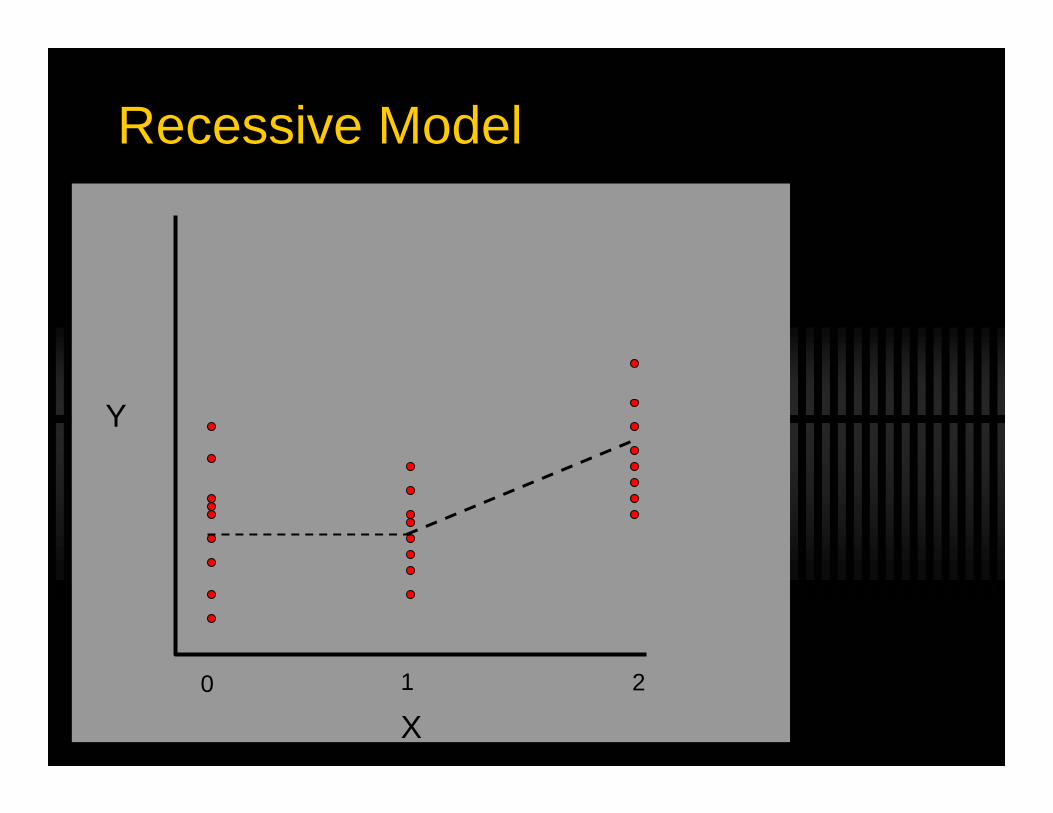
Recessive Model
X0 1 2
Y

Population Stratification

Genetic AssociationsTruth
- Causal locus (direct)- In LD with causal locus (indirect)
Chance- If you test 100 times, you’ll see ~ 5 tests < 0.05- No causal underpinning
Bias- Association is not causal- e.g. Population stratification

StratificationEssentially a confounder!
How does it happen?

Common Cause
G P
A
Ancestry (A) predicts Genotype (G)
Ancestry (A) predicts Phenotype (P)
a.k.a.… Population Stratification

Poor Epidemiologic DesignSource Population?
Two Necessary Components:- Different prevalence (mean) of disease- Different allele frequency

Famous Example
Knowler et al (1988) Am J Hum Genet.

DRD2

Stratification HappensStrategies to deal with it
- Self-Reported Ancestry- Match (design) or Adjust (analysis)
- Use other genetic markers (ancestry informative)- Genomic Control (Devlin – U of Pittsburgh)- STRUCTURE (Pritchard – U of Chicago)- Eigenstrat (Reich – Broad Institute/Harvard)
- Use a family-based design

The TDT

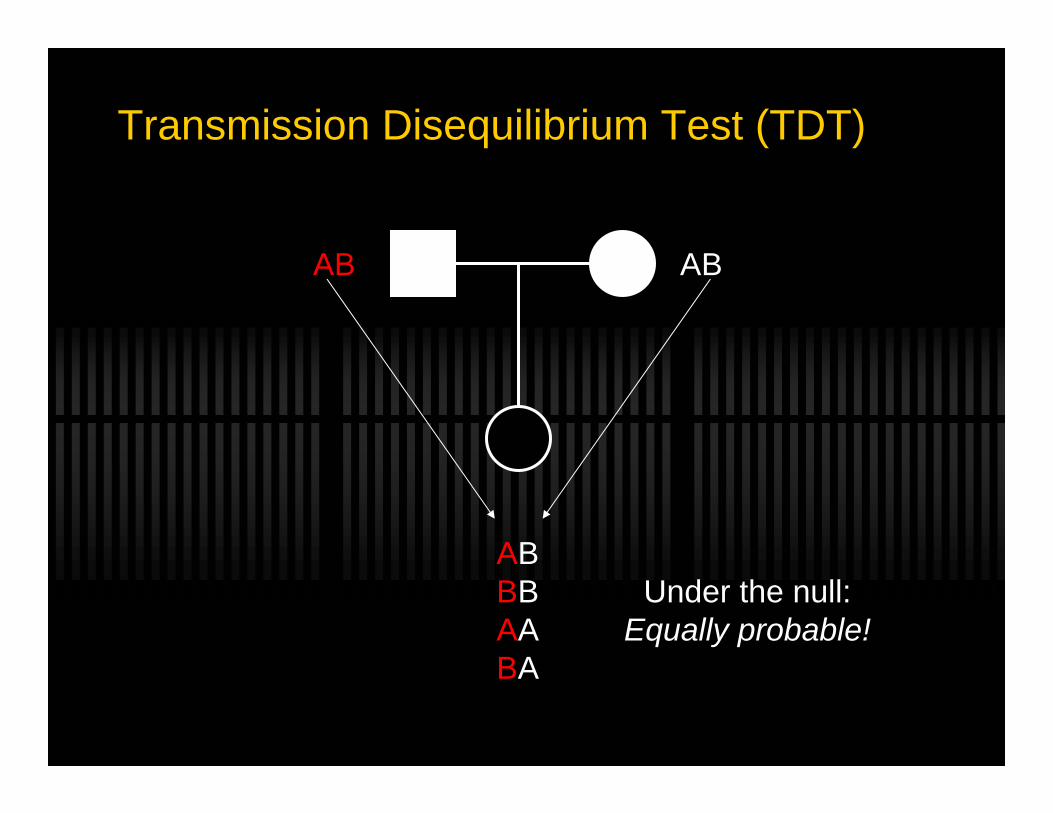
Transmission Disequilibrium Test (TDT)

Transmission Disequilibrium Test (TDT)
AB AB
ABBBAABA
Transmission Disequilibrium Test (TDT)
AB AB
ABBBAABA
Under the null:Equally probable!

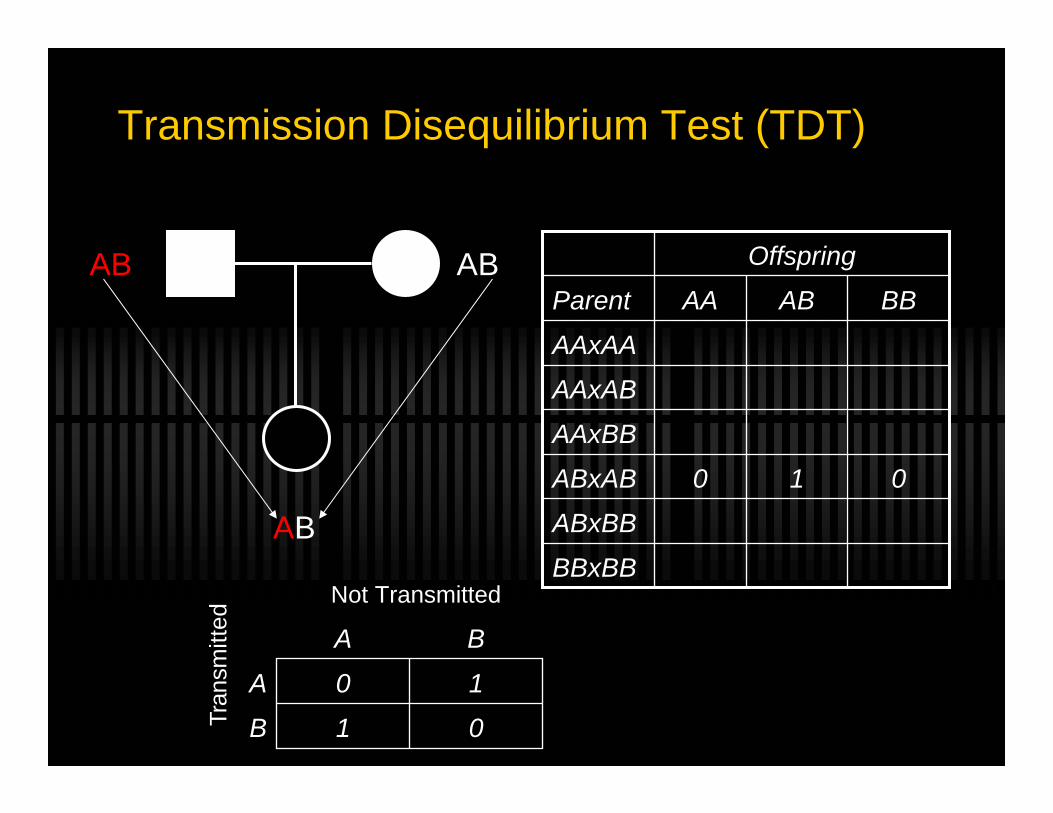
Transmission Disequilibrium Test (TDT)
AB AB
AB
Father - “A” was transmitted and “B” wasn’tMother - “B” was transmitted and “A” wasn’t

Transmission Disequilibrium Test (TDT)
AB AB
AB
Offspring
BBxBB
ABxBB
010ABxAB
AAxBB
AAxAB
AAxAA
BBABAAParent

Transmission Disequilibrium Test (TDT)
AB AB
AB
Offspring
BBxBB
ABxBB
010ABxAB
AAxBB
AAxAB
AAxAA
BBABAAParent
nBA
nAA
A
nBBB
nABA
B
Not Transmitted
�Tra
nsm
itted
Transmission Disequilibrium Test (TDT)
AB AB
AB
Offspring
BBxBB
ABxBB
010ABxAB
AAxBB
AAxAB
AAxAA
BBABAAParent
1
0
A
0B
1A
B
Not Transmitted
�Tra
nsm
itted
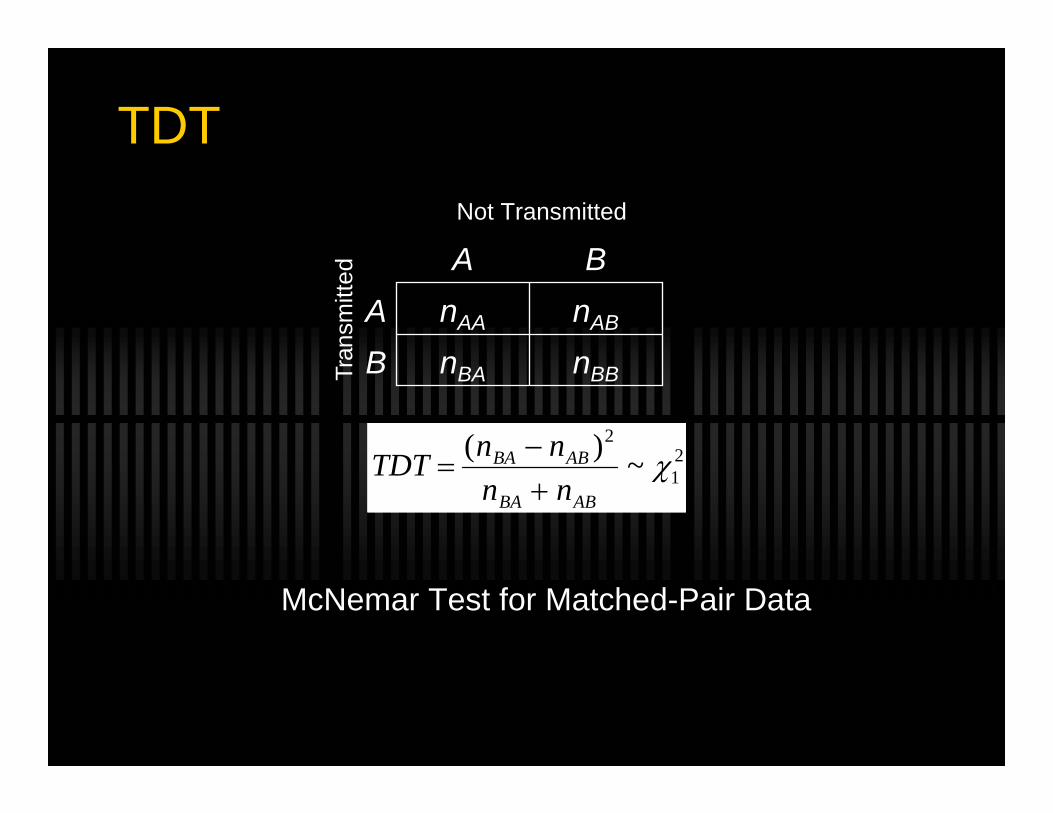
TDT
nBA
nAA
A
nBBBnABAB
Not Transmitted
�Tra
nsm
itted
TDT =(nBA − nAB )2
nBA + nAB
~ χ12
McNemar Test for Matched-Pair Data

Generalized ExtensionsMultiple OffspringMissing ParentsNon-Binary Phenotypes
- Quantitative, time-to-onset, ordinal…
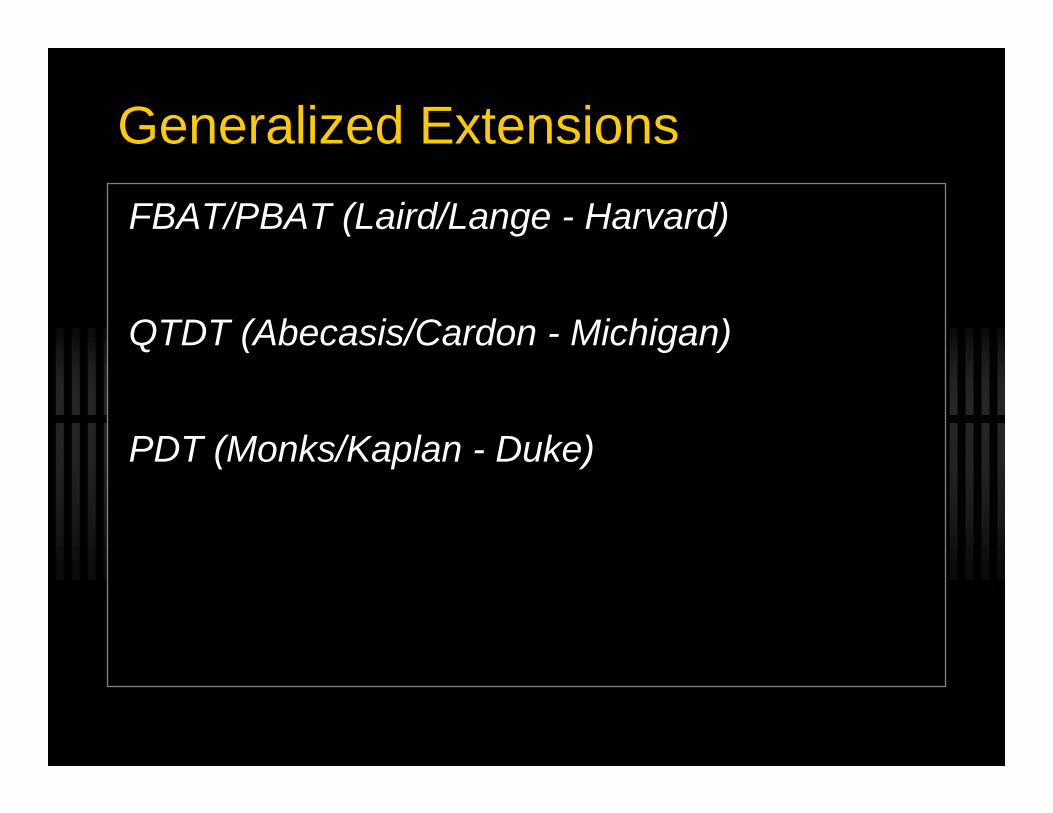
Generalized ExtensionsFBAT/PBAT (Laird/Lange - Harvard)
QTDT (Abecasis/Cardon - Michigan)
PDT (Monks/Kaplan - Duke)

Population StratificationWhy are Family-Based Designs etc. robust to
population stratification?

Family-Based Data
G P
A
GP1 GP2

Family-Based Data
G P
A
GP1 GP2
Condition on parental genotypes

Family-Based Data
G P
A
GP1 GP2
Condition on parental genotypes
P(G|GP1,GP2,A) = P(G| GP1,GP2)
Paradigm ShiftFrom Linkage to Association

Gene-MappingMonogenic ‘Mendelian’ Diseases
- Rare disease- Rare variants
- Highly penetrant
Complex Disease- Rare/Common disease- Rare/Common variants
- Variable penetrance

Gene-MappingMonogenic ‘Mendelian’ Diseases
- Rare disease- Rare variants
- Highly penetrant
Complex Disease- Rare/Common disease- Rare/Common variants
- Variable penetrance
Linkage!

Gene-MappingMonogenic ‘Mendelian’ Diseases
- Rare disease- Rare variants
- Highly penetrant
Complex Disease- Rare/Common disease- Rare/Common variants
- Variable penetrance Association

Genetic Discovery
Evidence for genetic effects? Familial aggregation
Mode of inheritance? Segregation Analysis
Where in the region? Fine Mapping
What chromosome / region? Linkage Analysis
What gene? Association Analysis
What is the effect of the gene? Characterization

Genetic Discovery
Evidence for genetic effects? Familial aggregation
Mode of inheritance? Segregation Analysis
Where in the region? Fine Mapping
What chromosome / region? Linkage Analysis
What gene? Association Analysis
What is the effect of the gene? Characterization

Gene-MappingWhere in the genome (1980s - 2005)?
- Linkage
Where in the genome (2006 - )?- Association

Foreshadowing the Paradigm Shiftc. 1996


Linkage and Complex Disease

Linkage of Complex TraitsDismal and controversial picture
The Power of Linkage vs Association

Relative Power*
70022,3850.200.20
6598,0670.010.20
2,448207,6350.200.05
2,27867,2190.010.05
ASSOCIATION(NA)
LINKAGE(NL)PrevalenceMAF
MAF = Minor allele frequencyNL = Number of affected sibling pairsNA = Number of case-control pairsOdds Ratio = 1.5
*Adapted from Roeder et al, Am J Hum Genet (2006)

Rare Disease - Rare Variant
70022,3850.200.20
6598,0670.010.20
2,448207,6350.200.05
2,27867,2190.010.05
ASSOCIATION(NA)
LINKAGE(NL)PrevalenceMAF
MAF = Minor allele frequencyNL = Number of affected sibling pairsNA = Number of case-control pairsOdds Ratio = 1.5
*Adapted from Roeder et al, Am J Hum Genet (2006)

Common Disease - Rare Variant
70022,3850.200.20
6598,0670.010.20
2,448207,6350.200.05
2,27867,2190.010.05
ASSOCIATION(NA)
LINKAGE(NL)PrevalenceMAF
MAF = Minor allele frequencyNL = Number of affected sibling pairsNA = Number of case-control pairsOdds Ratio = 1.5
*Adapted from Roeder et al, Am J Hum Genet (2006)
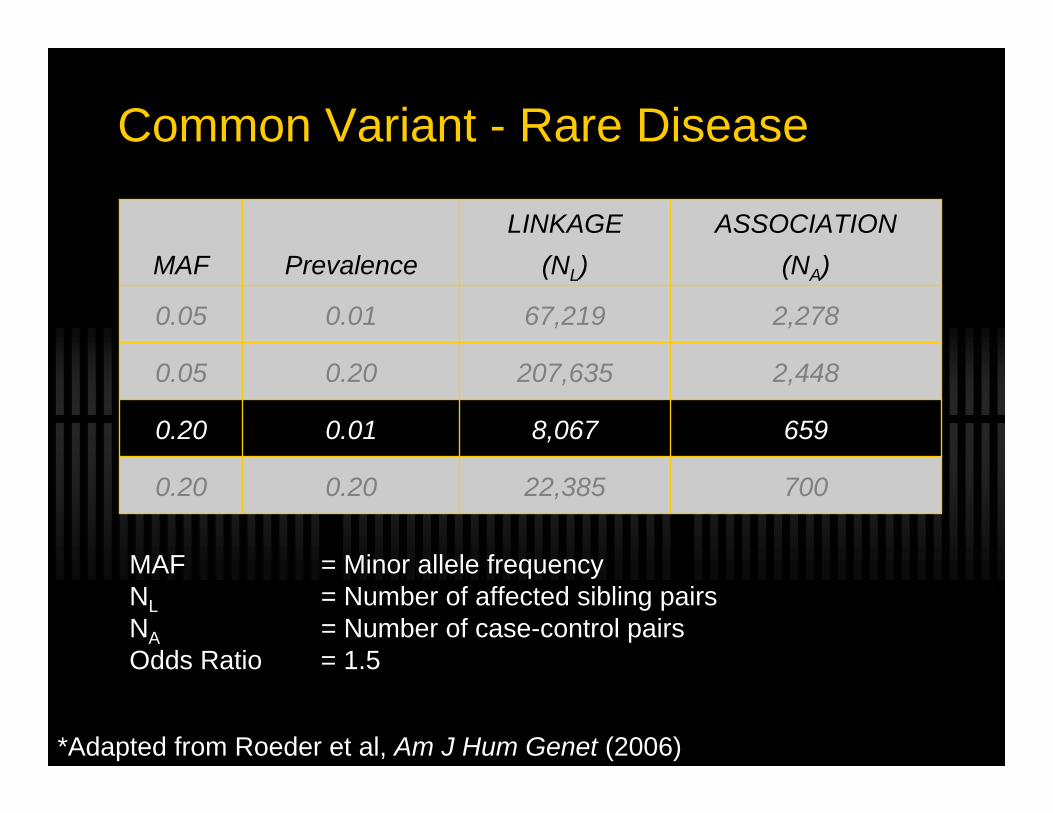
Common Variant - Rare Disease
70022,3850.200.20
6598,0670.010.20
2,448207,6350.200.05
2,27867,2190.010.05
ASSOCIATION(NA)
LINKAGE(NL)PrevalenceMAF
MAF = Minor allele frequencyNL = Number of affected sibling pairsNA = Number of case-control pairsOdds Ratio = 1.5
*Adapted from Roeder et al, Am J Hum Genet (2006)

Common Disease - Common Variant
70022,3850.200.20
6598,0670.010.20
2,448207,6350.200.05
2,27867,2190.010.05
ASSOCIATION(NA)
LINKAGE(NL)PrevalenceMAF
MAF = Minor allele frequencyNL = Number of affected sibling pairsNA = Number of case-control pairsOdds Ratio = 1.5
*Adapted from Roeder et al, Am J Hum Genet (2006)

Why Now?

The “-omics” Agec. 1996
-Pre-genomic era-100’s of Markers
- STRs
c. 2007-Post-genomic era-100,000’s of markers
- SNPs

c. 2007

Available TechnologyPlatforms available (or coming soon)
- 1 SNP- Hundreds of SNPs- Thousands of SNPs- Hundreds of thousands of SNPs- Millions of SNPs
Flexibility for Association- Single Marker- Candidate Gene- Whole-Genome

Examples from the LiteratureWhole Genome Association

What if we discover that genes have nothing to do with complex phenotypes?

What if we discover that genes have nothing to do with complex phenotypes?
Good News: We may not have to cross that bridge

Replicated AssociationsType II DiabetesBMI / ObesityCrohn’s DiseaseAge-Related Macular Degeneration (AMD)Prostate CancerBreast CancerHeart Disease


Framingham Heart Study and BMI

Framingham Heart Study and BMI
The SNP is close (in LD) with INSIG2- A plausible candidate for obesity- Responds to insulin- Involved in trigylceride synthesis
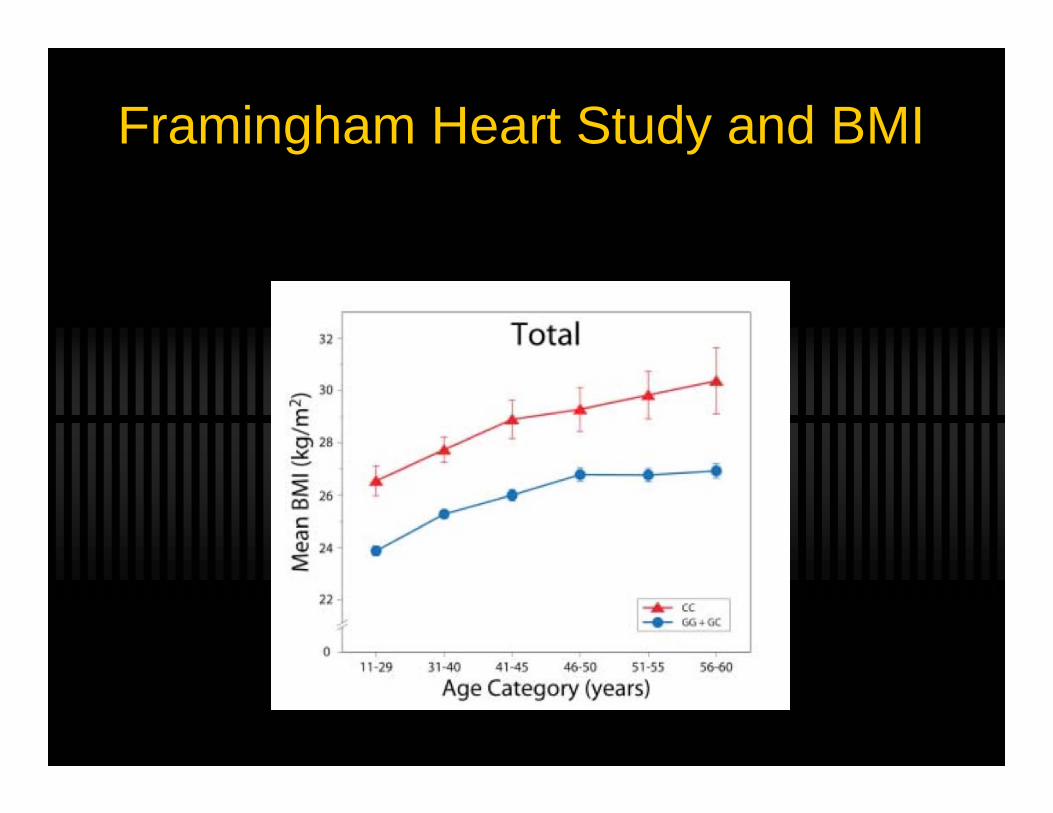
Framingham Heart Study and BMI

Framingham Heart Study and BMIReplicated in 4 out 5 studies
- Childhood sample- African American Sample- Europe and North America
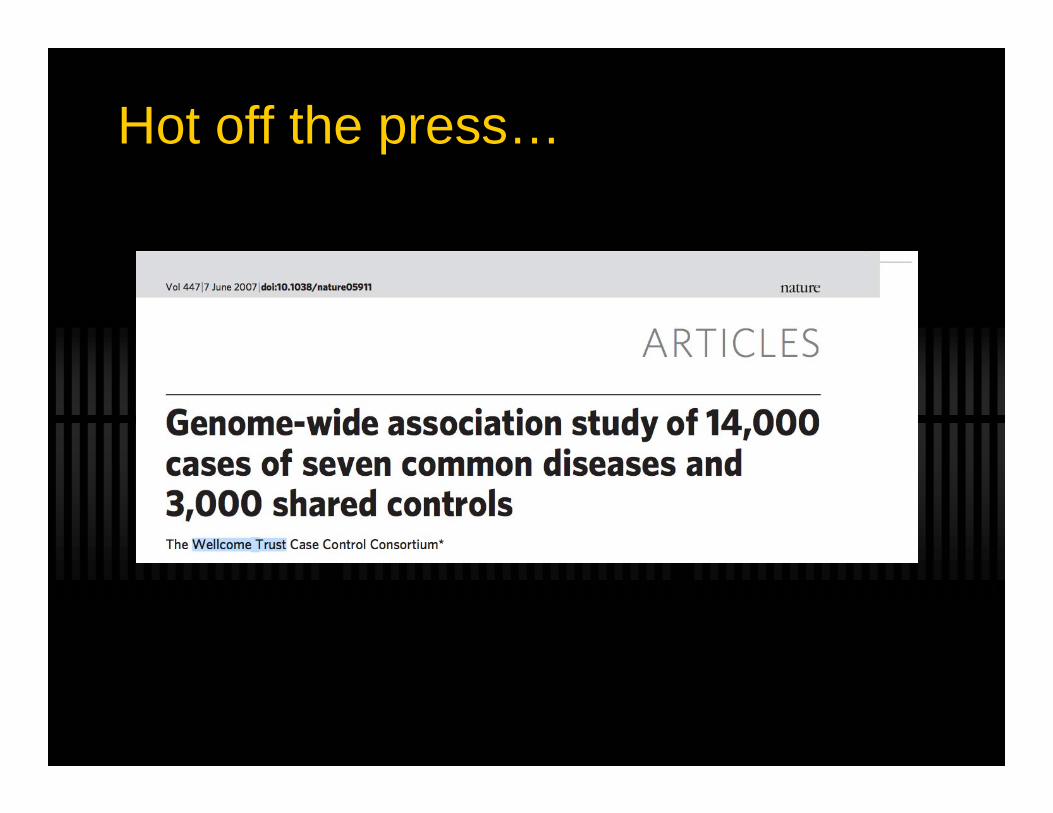
Hot off the press…
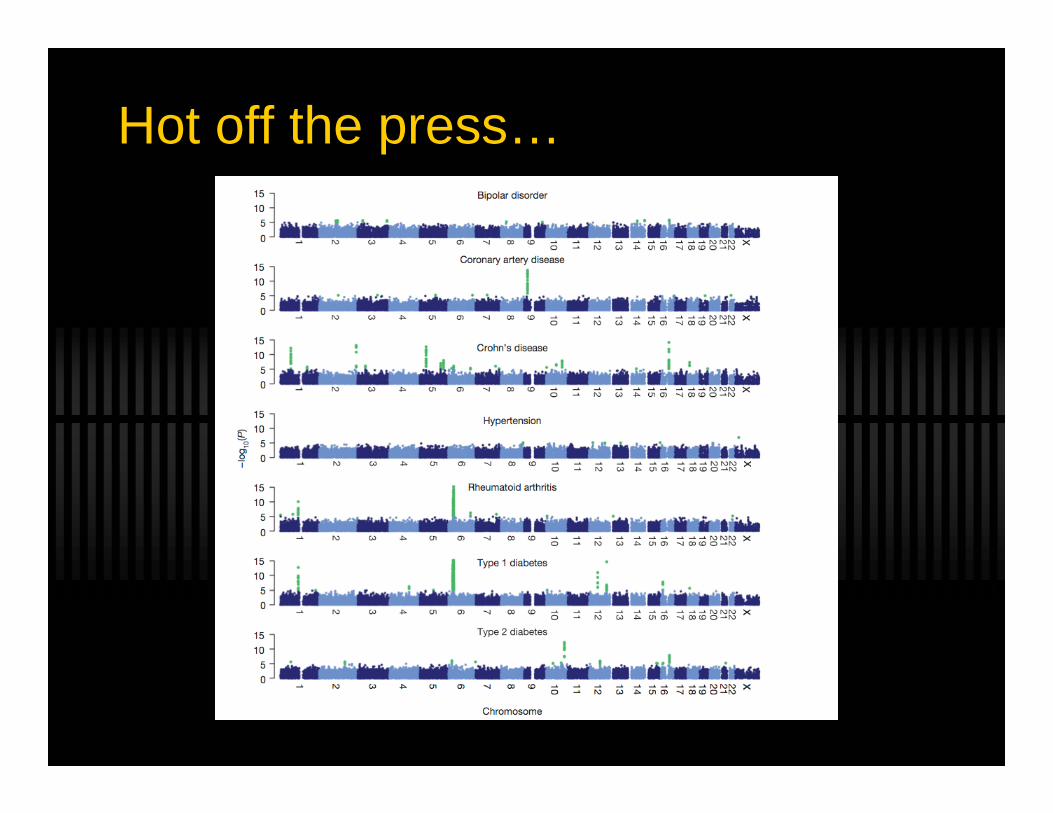
Hot off the press…

In Summary…WGA is starting off successful
- More replicated associations in one year…
Statistical GeneticsThe Challenges We Face

Analytic Challenges

Wealth of InformationWhole Genome Association using SNPs
- Potentially use all of the data- Covariates, interactions, effect size, etc.- Statistical issues abound…

Multiple Comparisons

Multiple Comparisons
The 500K People Chip

Multiple ComparisonsWhich SNPs are “real”?
- 500K Chip- 25,000 SNPs with p < 0.05
Multiple Phenotypes- 10 Phenotypes, 500K chip
- 5,000,000 comparisons!!!!

The P-Value Epidemic

“My name is Matt McQueen and I have a P-value problem”
The smallest p-values- Most addictive- We’ve been trained to focus on them- What do they mean?
- Truth- Chance- Bias


Replicated Associations…
Scott et al (2007) Science

The Phenotype Question

What is a phenotype?Depends on who you ask…

What is a phenotype?If we asked a gene…
GENE
Trait 1
Trait 2
Trait 3
Trait 4
Trait 5
Trait 6
5%
55%
4%
20%
1%
15%

What is a phenotype?If we asked an environmental factor…
Trait 1
Trait 2
Trait 3
Trait 4
Trait 5
Trait 6
10%
10%
30%
5%
5%
40%
ENV

What is a phenotype?
GENE
Trait 1
Trait 2
Trait 3
Trait 4
Trait 5
Trait 6
5%
55%
4%
20%
1%
15%
10%
10%
30%
5%
5%
40%
ENV

The Genotype Question

What is a Genotype?
We test SNPs for association because we can
What about epigenetic factors?- Methylation- Copy Number Variation

The Not-So Distant Future

The $1000 GenomeNHGRIRFA Number
- RFA-HG-06-020Title
- “The $1000 Genome”Goal
- Develop technology to enable investigators to sequence an entire human genome for $1000 within 10 years

June 2017Biodemography Short Course
Complete Genome Sequence Analysis
Top Related