


Languages
Pages
Legal


1 State of Public (School) Education in Delhi
WHITE PAPER
State of Public (School) Education
In Delhi
December 2017

2 State of Public (School) Education in Delhi
Table of Contents
I. Foreword ................................................................................................................................................. 4
II. Acknowledgement .................................................................................................................................. 6
III. Summary of RTI Data ............................................................................................................................. 7
A. Outcome Indicators ................................................................................................................................ 7
B. Annual Budget for Education ................................................................................................................ 17
IV. Monitoring and Evaluation .................................................................................................................. 20
V. Continuous Comprehensive Evaluation ................................................................................................ 22
VI. Deliberation by Municipal Councillors and MLAs ................................................................................ 24
VII. Data from Household Survey .............................................................................................................. 30
Chart 1: Reasons for not being happy ....................................................................................................... 32
Annexure 1 - Note on Forecasting Methodology ...................................................................................... 33
Annexure 2 - Zone / District Wise Data – Enrolment & Dropout .............................................................. 34
Annexure 3 – Teacher Inspection ............................................................................................................. 42
Annexure 4 – Survey Methodology ........................................................................................................... 47
Annexure 5 – Socio Economic Classification (SEC) Note ........................................................................... 48
Annexure 6 – Zone-wise Issues Raised by Councillors .............................................................................. 49
Annexure 7 – Category wise number of issues raised by MLAs ................................................................ 50
Annexure 8 – Party-wise Data ................................................................................................................... 51
Annexure 9 – RTI reply from Directorate of Education for 10th & 12th result of Delhi Government
schools ...................................................................................................................................................... 52
Table 1: Total schools and students in Delhi in 2016-17 ............................................................................. 7
Table 2: Total Student Enrolments in Delhi Schools from 2013-14 to 2016-17........................................... 8
Table 3: Total Dropouts in MCD & State Government Schools from 2014- 15 to 2016-17 ......................... 9
Table 4: Transition Rate of Students from Class 7 to Class 8 in 2015-16 & 2016-17 ................................. 10
Table 5: Retention Rate - Class 1 to Class 6............................................................................................... 10
Table 6: Change in Class I Enrolments from 2010-11 to 2016-17.............................................................. 11
Table 7: Total enrolments in State Government, Central Government & Other Schools - Class 7 to Class
12 .............................................................................................................................................................. 12
Table 8: Comparison between State Government and Private Schools: X Results.................................... 13
Table 9: Comparison between State Government and Private Schools: XII Results.................................. 14
3 State of Public (School) Education in Delhi
Table 10: Comparison between State Government, MCD, Central Goverment and Other Schools on RTE
Indicators .................................................................................................................................................. 15
Table 11: Schools with School Management Committee from 2014-15 to 2016-17 ................................. 16
Table 12: Non Plan Budget for MCD 2015-16 to 2017-18 (in Lakh) .......................................................... 17
Table 13: Plan Budget 2016-17 to 2017-18 (in Lakh) ............................................................................... 18
Table 14: State Education Budget (in Crore) ............................................................................................ 18
Table 15: Per-Child Allocation and Expenditure (in Crore) ........................................................................ 19
Table 16 : Teacher Self-Evaluation by Percentage of schools for the year 2016-17 .................................. 21
Table 17 : CCE grades by Percentage of students in State Government, MCD & Private Schools for
Standards V, VIII, IX and X in 2016-17 ....................................................................................................... 23
Table 18: Number of issues raised on education and Number of meetings by Councillors in Education &
Ward Committees ..................................................................................................................................... 24
Table 19: Category wise number of issues raised by Councillors on Education ........................................ 25
Table 20: Type of issues raised by Councillors in the year April’15 to March’17 ...................................... 26
Table 21: Issues raised by MLAs on Education during 2015 & 2016 ......................................................... 27
Table 22: Category wise number of issues raised by MLAs on Education ................................................. 29
Table 23: Type of issues raised by MLAs ................................................................................................... 29
Table 24 : Current Medium of Education (%) ............................................................................................ 30
Table 25 : Respondents from Table 24 whose current medium of education is other than English and
would want to change to English medium (%) .......................................................................................... 31
Table 26: Respondents taking private tuitions/coaching classes (%) ........................................................ 31
Table 27: Details on source of Tuitions (%) ............................................................................................... 31
Table 28: Percentage of Respondents happy with the School .................................................................. 32
Table 29 : Zone-wise enrolment retention rate in MCD Schools - Class 1 to Class 5 ................................. 34
Table 30: District-wise enrolment retention rate in State Government Schools - Class 1 to Class 6......... 35
Table 31: Zone-wise estimated dropouts in MCD Schools - Class 1 to Class 5 for the year 2015-16......... 36
Table 32: Zone-wise estimated dropouts in MCD Schools - Class 1 to Class 5 for the year 2016-17......... 37
Table 33: Zone-wise Change in Class I Enrolments in MCD Schools .......................................................... 38
Table 34: District-wise Change in Class I Enrolments in State Government Schools ................................. 39
Table 35: Zone-wise total number of students and estimated dropout of MCD Schools.......................... 40
Table 36: District-wise total number of students and estimated dropout of State Government Schools. 41
Table 37: Zone wise issues raised by Councillors on Education in the year April’15 to March’17 ............ 49
Table 38: Category wise number of issues raised by MLAs on Education during 2015 & 2016 ................ 50
Table 39: Category wise number of issues raised by Councillors on Education in the year April’15 to
March’17................................................................................................................................................... 51

4 State of Public (School) Education in Delhi
I. Foreword
This is Praja Foundation’s second annual education report on the status of public school education in Delhi. The data presented in the publication has been collected through the Right to Information, 2005.
It is evident through data that there is more to what is presented as a wholesome picture of the education in Delhi. A crucial aspect of this is the fluctuation especially in terms of transition rate of students in state government schools from Class 9 to 10 at 56.95%, whereas it is 98.55% from Class 7 to 8 for the academic year 2015-16 to 2016-17. This indicates that almost half of the students did not move to secondary education level through examination, while in primary and middle school, they were promoted irrespective of learning levels.
As per the Right to Education's (RTE) no-detention policy, it is the responsibility of the teachers to improve the learning outcomes of the students and enable them to continue studying further. However, it is important to note that transition rate of students especially from the 9th standard to the 10th standard as mentioned above stands to the fact that students were promoted irrespective of the learning levels in the earlier years and the teachers either were 'callous' in their approach or the monitoring of RTE norms was not stringent.
While, in terms of quality of teaching 63% of state government and 55% of Municipal Corporation Delhi (MCD) schools show an average level of teacher quality according to Shaala Siddhi data. MCD schools and State government schools (ratios) have a student teacher ratio greater than prescribed norms, and more than that of private schools.
Shaala Siddhi is an initiative by the Union government’s Ministry of Human Resource Development(MHRD) designed by the National University of Educational Planning and Administration (NUEPA) in 2015 to evaluate accountability and transparency of a school’s performance through a variety of parameters as a part of school self-evaluation. We have used the Shaala Siddhi data for the Teacher Evaluation and Continuous and Comprehensive Evaluation indicators.
What is concerning is that even though budget is not a constraint, the state government has budgeted 49,740 rupees for every student for the year 2016-17 contrastingly for the same period 50,765 students (estimated) dropped out of Delhi Government schools.
The data further represents a bedraggled picture of Class 1 enrolments over the years in Delhi government and MCD schools with 1,92,820 enrolments in 2010-11 to 1,35,491 in 2016-17 - a drop of 30%.
There is an evident dichotomy between resources available and the lack of faith in learning outcomes of students. This is further reflected in Praja Foundation's commissioned household survey to Hansa Research which was conducted in Delhi. In the findings of the survey, an alarmingly high percentage of (85%) household’s students taking private tuitions are from Municipal schools and 74% from State Government Schools. This could be in correlation with the percentage of parents (29%) not being happy with their children’s school as the primary factor.

5 State of Public (School) Education in Delhi
It seems that the Government is only showing data which makes it look good, but when you dig deeper, you can analyse that there are major issues in the education department.
Unless the Government acknowledges these major issues, it will be difficult to bring about any change or improvements required in the education department. These issues need to be addressed and acted upon soon, otherwise the future of the children in Delhi is at stake.
NITAI MEHTA
Managing Trustee, Praja Foundation

6 State of Public (School) Education in Delhi
II. Acknowledgement
Praja has obtained the data used in compiling this report card through Right to Information Act, 2005.
Hence it is very important to acknowledge the RTI Act and everyone involved, especially from the officials
who have provided us this information diligently.
We are also most grateful to – our Elected Representatives, the Civil Society Organisations (CSOs) and
journalists who utilise and publicise our data and, by doing so, ensure that awareness regarding various
issues we discuss is distributed to a wide ranging population. We would also like to extend our gratitude
to all government officials for their cooperation and support.
This White Paper has been made possible by the support provided to us by our supporters and we would
like to take this opportunity to express our sincere gratitude to them. First and foremost, we would like
to thank the Initiatives of Change (IC) Centre for Governance, a prominent organisation working on
improving governance structures and United Residents Joint Action (URJA), a well-known organisation
which addresses the gap in last mile governance by connecting citizens and RWA. Our work in Delhi has
been conducted in partnership with them and we have been able to conduct data driven research on vital
issues affecting the governance of Delhi on aspects such as performance of Elected Representatives (ER),
Health, Education, Crime and policing and Civic issues.
Praja Foundation appreciates the support given by our supporters and donors, namely European Union
Fund, Friedrich Naumann Foundation, Ford Foundation, Dasra, Narotam Sekhsaria Foundation and Madhu
Mehta Foundation and numerous other individual supporters. Their support has made it possible for us
to conduct our study & publish this white paper.
We would also like to thank our group of Advisors & Trustees and lastly but not the least, we would like
to acknowledge the contributions of all members of Praja’s team, who worked to make this white paper
a reality.
The content of the report is the sole responsibility of Praja Foundation.

7 State of Public (School) Education in Delhi
III. Summary of RTI Data
A. Outcome Indicators
Table 1: Total schools and students in Delhi in 2016-17
Type of School Total No. of Schools Total No. of Students
North Delhi Municipal Corporation (NDMC) 719 3,09,724
South Delhi Municipal Corporation (SDMC) 580 2,63,019
East Delhi Municipal Corporation (EDMC) 365 2,03,353
State Government 1,017 15,09,514
Central Goverment 46 1,10,546
Other Schools1 3,004 18,25,081
Grand Total 5,731 42,21,237
Inference:
State government has the maximum number of schools (1017) and also the maximum number of students (15,09,514) enrolled. State government schools provide education from class 1 to class 12 while MCD provides education from class 1 to class 5.
1 Other schools include: Delhi Cantonment Board (DCB), DOE Aided, DOE Unaided, Department of Social Welfare
(DSW), Jamia Millia Islamia, Municipal Corporation of Delhi (MCD) Aided, Municipal Corporation of Delhi (MCD)
Unaided, New Delhi Municipal Council (NDMC), New Delhi Municipal Council (NDMC) Aided and New Delhi Municipal
Council (NDMC) Unaided
8 State of Public (School) Education in Delhi
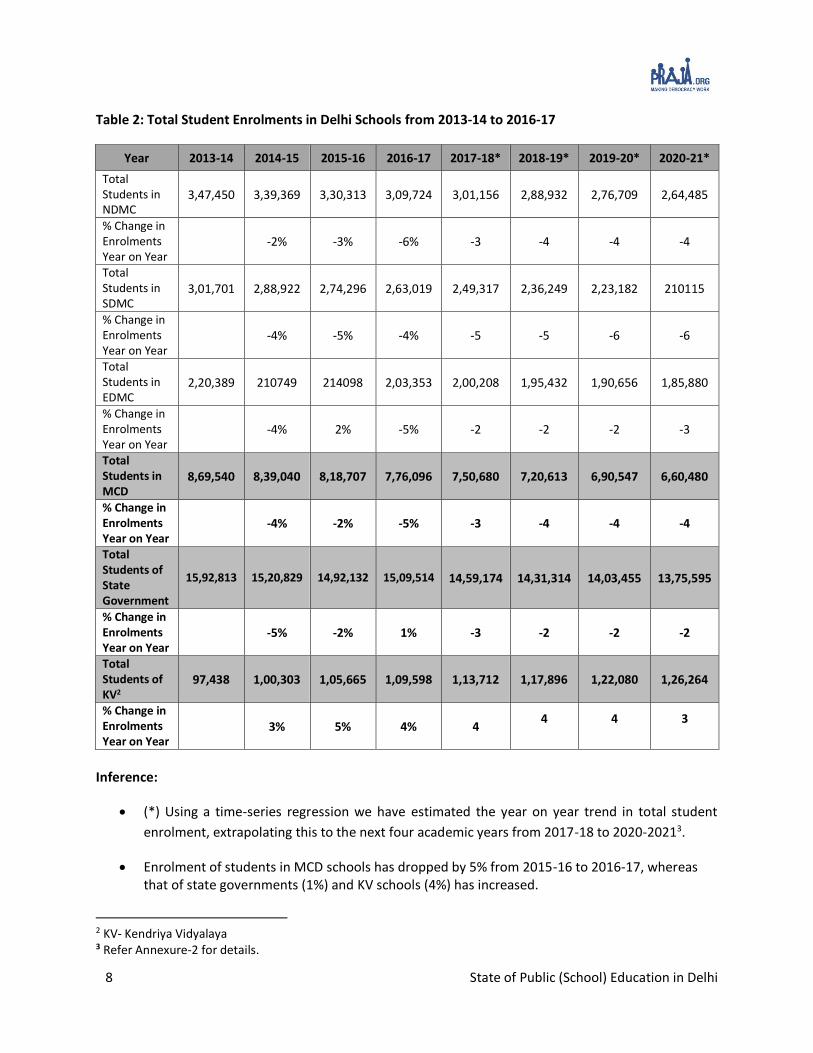
Table 2: Total Student Enrolments in Delhi Schools from 2013-14 to 2016-17
Year 2013-14 2014-15 2015-16 2016-17 2017-18* 2018-19* 2019-20* 2020-21*
Total Students in NDMC
3,47,450 3,39,369 3,30,313 3,09,724 3,01,156 2,88,932 2,76,709 2,64,485
% Change in Enrolments Year on Year
-2% -3% -6% -3 -4 -4 -4
Total Students in SDMC
3,01,701 2,88,922 2,74,296 2,63,019 2,49,317 2,36,249 2,23,182 210115
% Change in Enrolments Year on Year
-4% -5% -4% -5 -5 -6 -6
Total Students in EDMC
2,20,389 210749 214098 2,03,353 2,00,208 1,95,432 1,90,656 1,85,880
% Change in Enrolments Year on Year
-4% 2% -5% -2 -2 -2 -3
Total Students in MCD
8,69,540 8,39,040 8,18,707 7,76,096 7,50,680 7,20,613 6,90,547 6,60,480
% Change in Enrolments Year on Year
-4% -2% -5% -3 -4 -4 -4
Total Students of State Government
15,92,813 15,20,829 14,92,132 15,09,514 14,59,174 14,31,314 14,03,455 13,75,595
% Change in Enrolments Year on Year
-5% -2% 1% -3 -2 -2 -2
Total Students of KV2
97,438 1,00,303 1,05,665 1,09,598 1,13,712 1,17,896 1,22,080 1,26,264
% Change in Enrolments Year on Year
3% 5% 4% 4 4 4 3
Inference:
(*) Using a time-series regression we have estimated the year on year trend in total student
enrolment, extrapolating this to the next four academic years from 2017-18 to 2020-20213.
Enrolment of students in MCD schools has dropped by 5% from 2015-16 to 2016-17, whereas that of state governments (1%) and KV schools (4%) has increased.
2 KV- Kendriya Vidyalaya 3 Refer Annexure-2 for details.

9 State of Public (School) Education in Delhi
Table 3: Total Dropouts in MCD & State Government Schools from 2014- 15 to 2016-17
Year No. of
Schools
Total No. of
Students
Dropout Data Received Estimated Drop out
in Numbers*
No. of School
No of Students
Drop Out
Drop out %
MCD
NDMC
2014-15 764 3,39,369 236 80,821 6,256 7.7% 26,269
2015-16 734 3,30,313 182 59,936 7,016 11.7% 38,666
2016-17 719 3,09,724 400 1,59,611 9,719 6.1% 18,860
SDMC
2014-15 587 2,88,922 92 43,769 3,520 8% 23,236
2015-16 588 2,74,296 93 42,813 3,561 8.3% 22,815
2016-174 580 2,63,019 240 95,963 5,760 6% 15,787
EDMC
2014-15 387 2,10,749 55 21,936 3,569 16.3% 34,289
2015-16 387 2,14,098 54 21,526 3,805 17.7% 37,845
2016-175 365 2,03,353
State Government
2014-15 999 15,20,829 371 5,28,394 15,459 2.9% 44,494
2015-16 1,009 14,92,132 396 5,60,264 17,210 3.1% 45,835
2016-17 1,017 15,09,514 749 11,33,813 38,130 3.4% 50,765
Inference:
On an average, from the three Municipal Corporations, in the last three years (2014- 15 to 2016-
17), East Delhi Municipal Corporation (EDMC) has witnessed the maximum dropout followed by
North Delhi Municipal Corporation. EDMC has not given any data on dropout for this year (2016-
17).
Number of drop outs from state government schools has been increasing in the past 3 years
(2014-15 to 2016-17).
For detailed MCD school drop outs (zone wise) and state government school drop outs (district wise) refer
to Annexure 2.
(*): The dropout number is an estimate because the Government under RTI has not revealed drop out
information of all its schools. While, this data is maintained at each school in the ‘Prayas’/ result register,
in reply to our RTIs we received only 640 schools of MCD and 749 schools of state government to compute
an estimated number. The estimation has been done separately for the three MCDs and State
Governments. For this purpose, after collecting data from the above mentioned schools an average was
calculated and then this average was applied for calculating average for the entire MCD/ state schools.
4 Najafgarh zone of SDMC did not provide any data for dropouts for this year (2016-17). 5 Shahdara South and Shahdara North zone of EDMC did not provide any data for dropouts for this year (2016-17).

10 State of Public (School) Education in Delhi
Table 4: Transition Rate of Students from Class 7 to Class 8 in 2015-16 & 2016-17
Admin Standard Academic
Year Total Enrolment Transition Rate
State Government 7 2015-16 2,09,637
98.55% 8 2016-17 2,06,602
Inference:
The transition rate of students studying in class 7th in 2015-16 to class 8th in 2016-17 is 98.55%. Table 5: Retention Rate - Class 1 to Class 6
Standard Academic
Year MCD
Retention Rate (%) Year
on Year State Government
Retention Rate (%) Year on
Year
1 2011-12 1,65,959 - 22,973 -
2 2012-13 1,81,113 109.1% 23,714 103.2%
3 2013-14 1,86,692 112.5% 23,865 103.9%
4 2014-15 1,87,739 113.1% 23,644 102.9%
5 2015-16 2,00,117 120.6% 23,958 104.3%
6 2016-17 2,19,453*
Inference: Retention rate is the percentage of school’s first time enrolled students who continue at that school the next year. The retention rate of students at the primary level is higher for MCD schools than the state schools. From 2012-13 to 2016-17, retention rate increased by 11.5% for MCD schools while state government schools witnessed a meagre rise of 1.1%. Note: (*) Students from the Municipal Schools in Delhi, move to State Government schools as the Municipal Schools are only till Class 5. Therefore, while calculating the retention rate in Class 6 for State Government Schools, the total numbers of students in 2015-16 in MCD are added to the total number of students in State Government School in 2015-16, to reflect the actual number in 2016-17.

11 State of Public (School) Education in Delhi
Table 6: Change in Class I Enrolments from 2010-11 to 2016-17
Year
MCD State Government
No. of students enrolled in Class I
% Change Year on Year
No. of students enrolled in Class I
% Change Year on Year
2010-11 1,69,215 - 23,605 -
2011-12 1,65,959 -1.9% 22,973 -2.7%
2012-13 1,43,809 -13.3% 22,628 -1.5%
2013-14 1,33,862 -6.9% 23,360 3.2%
2014-15 1,28,416 -4.1% 23,522 0.7%
2015-16 1,23,325 -4% 22,579 -4%
2016-17 1,12,187 -9% 23,304 3.2%
2017-18* 1,00,718 -10.2% 23,025 -1.2%
2018-19* 91,013 -9.6% 22,996 -0.1%
2019-20* 81,308 -10.7% 22,968 -0.1%
2020-21* 71,603 -11.9% 22,939 -0.1%
Inference:
(*) Using a time-series regression we have estimated the year on year trend in total student
enrolment, extrapolating this to the next four academic years from 2017-18 to 2020-20216.
Class 1 enrolments have been steadily decreasing for MCD schools from 2010- 11 to 2016- 17. Total number of enrolments in class 1 has declined by 9% for MCD schools from 2015-16 to 2016- 17, while there has been an overall decline of 33.7% in enrolments in class 1 from 2010-11 to 2016-17.
Enrolments for class 1 in state schools has been fluctuating from 2010-11 to 2016-17 but there has been an overall increase of 1.3%.
6 Refer Annexure-2 for details.

12 State of Public (School) Education in Delhi
Table 7: Total enrolments in State Government, Central Government & Other Schools - Class 7 to Class 12
State Government School
Class 2013-14 2014-15 2015-16 2016-17
7 2,28,887 2,24,239 2,09,637 2,14,434
8 2,15,941 2,17,008 2,18,431 2,06,602
9 2,19,377 2,59,705 2,88,094 3,11,824
10 1,82,085 1,40,570 1,42,618 1,64,065
11 2,19,968 2,04,051 1,66,150 1,50,480
12 1,68,901 1,41,891 1,33,411 1,23,008
Central Government School
Class 2013-14 2014-15 2015-16 2016-17
7 8,600 8,695 9,007 9,451
8 8,483 8,978 9,088 9,412
9 8,957 9,446 10,206 10,434
10 8,388 8,022 8,236 8,594
11 8,810 9,242 9,319 9,260
12 7,744 7,395 7,771 7,686
Other School
Class 2013-14 2014-15 2015-16 2016-17
7 1,32,818 1,39,681 1,50,560 1,50,106
8 1,36,721 1,40,566 1,43,746 1,53,078
9 1,17,927 1,28,489 1,30,155 1,30,566
10 1,06,736 1,05,911 1,12,372 1,15,448
11 1,06,061 1,07,340 1,06,319 1,06,499
12 88,532 91,858 93,500 94,872
Inference:
Of the 2,19,377 students who got enrolled in class 9th in State government schools of Delhi in
2013-14, 44% students did not reach class 12th in 2016-17.
26% didn’t go to the class 12th (academic year 2016-17) from class 11th (academic year 2015-
16) in State Government schools.
43% didn’t go to the class 10th (academic year 2016-17) from class 9th (academic year 2015-
16) in State Government schools.

13 State of Public (School) Education in Delhi
Table 8: Comparison between State Government and Private Schools: X Results7
Year Government school
Private School Pass in (%) State Government
Pass in (%) KV
Pass in (%)
Mar-11 99.09 99.38 97.92
Mar-12 99.23 99.61 98.78
Mar-13 99.45 99.80 99.17
Mar-14 98.81 99.58 99.04
Mar-15 95.81 99.59 97.05
Mar-16 89.25 99.52 95.43
Mar-17 92.44 99.83 92.85
Inference:
Pass percentage is the highest for KV schools at 99.83%. On an average, pass percentage of government schools is better than that of private schools. Private school pass percentage in March 2017 has fallen as compared to March 2016 whereas that of government schools has seen a rise.
Result of Class 10th was released on 3rd June, 2017 but even after 6 months of the release, Education department has yet not published a consolidated report of the result on their website.
Note: When it comes to evaluating the student’s academic performance, class 10th and 12th results are
crucial indicators. These results act as litmus test that gives you a clear indication of where the education
system is heading and where it stands today as compared to students/ systems across India.
7 Source: Class 10th result from 2011 to 2016 has been taken from Delhi government’s education website (http://www.edudel.nic.in/welcome_folder/Result_Analysis2006.htm) while data for class 10th result for 2016-17 has been received through RTI (Annexure 9).

14 State of Public (School) Education in Delhi
Table 9: Comparison between State Government and Private Schools: XII Results8
Year Government school
Private School Pass in (%) State Government
Pass in (%) KV
Pass in (%)
Mar-11 87.54 95.66 89.06
Mar-12 87.72 95.53 90.06
Mar-13 88.65 97.56 91.83
Mar-14 88.67 98.02 92.09
Mar-15 88.11 95.94 89.75
Mar-16 88.91 95.71 86.67
Mar-17 88.36 95.96 84.02
Inference:
Pass percentage is the highest for KV schools at 95.96% in March 2017 whereas it is relatively less
for state government schools (88.36%) and private schools (84.02%). On an average, government
schools have a better pass percentage than private schools.
Result of class 12th was released on 28th May, 2017 but even after 6 months of the release, Education department has yet not published a consolidated report of the result on their website.
8 Source: Class 12th result from 2011 to 2016 has been taken from Delhi government’s education website (http://www.edudel.nic.in/welcome_folder/Result_Analysis2006.htm) while data for class 12th result for 2016-17 has been received through RTI (Annexure 9)

15 State of Public (School) Education in Delhi
Table 10: Comparison between State Government, MCD, Central Goverment and Other Schools on RTE Indicators
RTE indicator No. of School
Enrolment Teachers Student-teacher
ratio
Separate Toilet
for Girls
Separate Toilet
for Boys Playground Ramp
MCD
NDMC
2014-15 764 3,39,369 8,475 40:1 100% 100% 75% 80%
2015-16 734 3,30,313 8,276 40:1 100% 100% 75% 78%
2016-17 719 3,09,724 8,180 38:1 100% 100% 76% 79%
SDMC
2014-15 587 2,88,922 7,236 40:1 100% 100% 88% 94%
2015-16 588 2,74,296 7,321 37:1 100% 100% 90% 94%
2016-17 580 2,63,019 7,120 37:1 100% 100% 89% 92%
EDMC
2014-15 387 2,10,749 5,441 39:1 100% 100% 78% 83%
2015-16 387 2,14,098 5,129 42:1 100% 100% 84% 85%
2016-17 365 2,03,353 4,996 41:1 100% 100% 88% 85%
State
2014-15 999 15,20,829 45,758 33:1 100% 100% 91% 96%
2015-16 1009 14,92,132 50,236 30:1 100% 100% 91% 95%
2016-17 1017 15,09,514 50,428 30:1 100% 100% 90% 95%
Central Goverment
2014-15 43 1,00,303 3,371 30:1 100% 100% 100% 81%
2015-16 46 1,05,665 3,473 30:1 100% 100% 100% 87%
2016-17 46 1,09,598 3,531 31:1 100% 100% 100% 91%
Other School
2014-15 2963 17,44,815 62,445 28:1 100% 100% 87% 57%
2015-16 2991 17,98,657 64,508 28:1 100% 100% 89% 59%
2016-17 3004 18,26,029 66,507 27:1 100% 100% 89% 58%
Inference:
According to RTE rules, primary schools need to have student- teacher ratio of 30. MCD schools
on the contrary had a much high student teacher ratio from 2014-15 to 2016-17.
Having a playground in every school is mandatory as per the RTE norms. Contrary to this, 24%
schools from NDMC, 11% from SDMC and 12% from EDMC reported not having play grounds in
academic year 2016-17.
Talking about inclusive education, a ramp for differentially abled is mandatory in every school
under RTE norms. However in the academic 2016- 17, 21% of the NDMC schools, 8% of SDMC
and 15% of EDMC schools did not have ramps for the differently abled students making it difficult
for them to exercise their Right to Education.

16 State of Public (School) Education in Delhi
School Management Committees
Section 21 of the Right to Free and Compulsory Education Act 2009 (RTE), mandates the formation of
School Management Committees (SMCs) in all elementary government, government-aided schools and
special category schools in the country. The SMC is the basic unit of a decentralised model of governance
with active involvement of parents in the school’s functioning. SMCs are primarily composed of parents,
teachers, head masters and local authorities.
Table 11: Schools with School Management Committee from 2014-15 to 2016-17
School Management Committee
Not Applicable No Yes
Total Number % Number % Number %
MCD
NDMC
2014-15 19 2.5% 55 7.2% 690 90% 764
2015-16 6 0.8% 34 4.6% 694 95% 734
2016-17 4 0.6% 17 2.4% 698 97% 719
SDMC
2014-15 6 1.0% 7 1.2% 574 98% 587
2015-16 4 0.7% 4 0.7% 580 99% 588
2016-17 3 0.5% 3 0.5% 574 99% 580
EDMC
2014-15 2 0.5% 1 0.3% 384 99% 387
2015-16 1 0.3% 1 0.3% 385 99% 387
2016-17 0 0% 0 0% 365 100% 365
State
2014-15 1 0.1% 8 0.8% 990 99% 999
2015-16 1 0.1% 11 1.1% 997 99% 1,009
2016-17 1 0.1% 9 0.9% 1007 99% 1,017
Central Goverment
2014-15 4 9.3% 8 18.6% 31 72% 43
2015-16 5 10.9% 7 15.2% 34 74% 46
2016-17 4 8.7% 5 10.9% 37 80% 46
Other School
2014-15 522 17.6% 386 13% 2055 69% 2,963
2015-16 501 16.8% 388 13% 2102 70% 2,991
2016-17 494 16.4% 369 12.3% 2141 71% 3,004
Inference:
99% MCD and state government schools have School Management Committees established in the year
2016-17.
17 State of Public (School) Education in Delhi
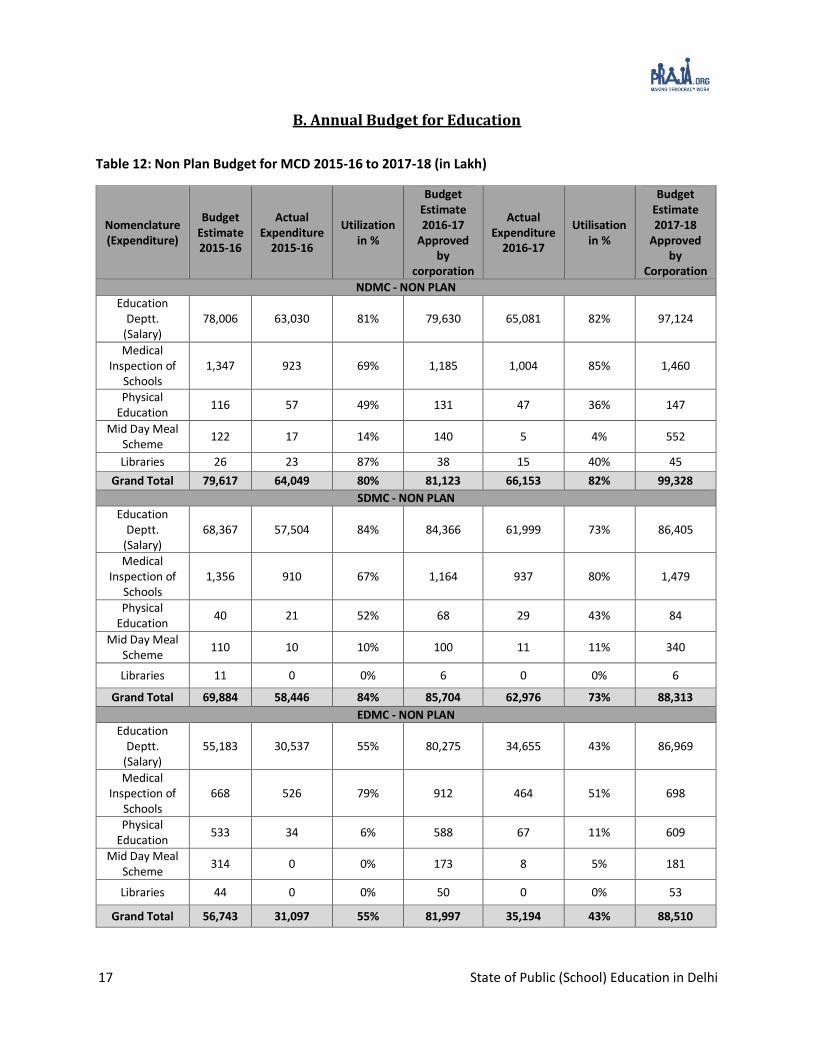
B. Annual Budget for Education
Table 12: Non Plan Budget for MCD 2015-16 to 2017-18 (in Lakh)
Nomenclature (Expenditure)
Budget Estimate 2015-16
Actual Expenditure
2015-16
Utilization in %
Budget Estimate 2016-17
Approved by
corporation
Actual Expenditure
2016-17
Utilisation in %
Budget Estimate 2017-18
Approved by
Corporation
NDMC - NON PLAN Education
Deptt. (Salary)
78,006 63,030 81% 79,630 65,081 82% 97,124
Medical Inspection of
Schools 1,347 923 69% 1,185 1,004 85% 1,460
Physical Education
116 57 49% 131 47 36% 147
Mid Day Meal Scheme
122 17 14% 140 5 4% 552
Libraries 26 23 87% 38 15 40% 45
Grand Total 79,617 64,049 80% 81,123 66,153 82% 99,328
SDMC - NON PLAN
Education Deptt.
(Salary) 68,367 57,504 84% 84,366 61,999 73% 86,405
Medical Inspection of
Schools 1,356 910 67% 1,164 937 80% 1,479
Physical Education
40 21 52% 68 29 43% 84
Mid Day Meal Scheme
110 10 10% 100 11 11% 340
Libraries 11 0 0% 6 0 0% 6
Grand Total 69,884 58,446 84% 85,704 62,976 73% 88,313
EDMC - NON PLAN Education
Deptt. (Salary)
55,183 30,537 55% 80,275 34,655 43% 86,969
Medical Inspection of
Schools 668 526 79% 912 464 51% 698
Physical Education
533 34 6% 588 67 11% 609
Mid Day Meal Scheme
314 0 0% 173 8 5% 181
Libraries 44 0 0% 50 0 0% 53
Grand Total 56,743 31,097 55% 81,997 35,194 43% 88,510

18 State of Public (School) Education in Delhi
Table 13: Plan Budget 2016-17 to 2017-18 (in Lakh)
Municipal Corporation
Budget Estimate 2015-16
Actual Expenditure
2015-16
Budget Estimate 2016-17
Actual Expenditure
2016-17
Utilisation in %
Budget Estimate 2017-18
NDMC 15460 14037 15505 13191 85.08% 18435
SDMC 13800 9269 12360 9207 74.49% 14595
EDMC 12385 8544 14075 10219 72.60% 14467
Inference:
NDMC has the highest budget utilisation amongst the three corporations which amounts to 85.08%.
furthermore, the estimated budget is also highest for NDMC which is Rs.18,435 (lakhs).
Table 14: State Education Budget (in Crore)
Budget Estimate 2015-16
Actual Expenditure 2015-16
Budget Estimate 2016-17
Actual Expenditure 2016-17
Budget Estimate 2017-18
6,459 5,441 7,508 NA 7815
Inference:
Budget estimates for 2017-18 have increased to Rs.7,815 as compared to Rs. 7,508 for 2016-17.

19 State of Public (School) Education in Delhi
Table 15: Per-Child Allocation and Expenditure (in Crore)
Particular Budget
Estimate 2015-16
Actual Expenditure
2015-16
Budget Estimate 2016-17
Actual Expenditure
2016-17
Budget Estimate 2017-18
NDMC
NDMC- Non Plan 796 640 811 662 993
NDMC- Plan 155 140 155 132 184
Total budget 951 781 966 793 1,178
Total students 3,30,313 3,30,313 3,09,724 3,09,724 3,09,724
Per Capita cost for every student (in actual rupees)
28,784 23,640 31,198 25,618 38,022
EDMC
EDMC- Non Plan 567 311 820 352 885
EDMC- Plan 124 85 141 102 145
Total budget 691 396 961 454 1,030
Total students 2,14,098 2,14,098 2,03,353 2,03,353 2,03,353
Per Capita cost for every student (in actual rupees)
32,288 18,515 47,244 22,332 50,640
SDMC
SDMC - Non Plan 699 584 857 630 883
SDMC - Plan 138 93 124 92 146
Total budget 837 677 981 722 1,029
Total students 2,74,296 2,74,296 2,63,019 2,63,019 2,63,019
Per Capita cost for every student (in actual rupees)
30,509 24,687 37,284 27,444 39,126
State
State 6,459 5,441 7,508 NA 7,815
Total students 14,92,132 14,92,132 15,09,514 15,09,514 15,09,514
Per Capita cost for every student (in actual rupees)
43,289 36,464 49,740 NA 51,773
Inference:
The per student budget estimate of state government has increased from 2016-17 (Rs. 49,740) to 2017- 18 (Rs. 51,773). This is despite the fact that number of students enrolling in state government schools has been constantly falling.

20 State of Public (School) Education in Delhi
IV. Monitoring and Evaluation
For making governance more accountable and transparent, it is important to have timely and regular evaluations of all the activities that the government undertakes. These activities and evaluations need to be documented and it is equally very essential to make these reports/ documents available for public use. Government schools run for the public and all its staff/ personnel are remunerated from public money, making it all the more important for the administration to make these reports open for the public.
These reports help us to find out if they are functioning in accordance with the Regulations, Norms and standards prescribed by RTE.
Shaala Siddhi
The National Programme on School Standards and Evaluation(NPSSE), commonly known as Shaala Siddhi is an initiative by the Ministry of Human Resource Development(MHRD) and is designed by the National University of Educational Planning and Administration (NUEPA) in 2015. It visualizes evaluation as a means to improvement by looking at each school as an individual unit. The initiative aims to focus on self-improvement and accountability. It seeks to provide each school an opportunity for holistic development by analyzing and working on incremental improvement of its strengths and weaknesses through a collaborative stakeholder process, while providing uniformity through fixed parameters of evaluation as developed in the School Standards and Evaluation Framework (SSEF). It is an ICT 9 initiative as accountability and transparency of a school’s performance will be ensured through a School Evaluation Dashboard that would contain consolidated evaluation reports of every school.10 In the academic year 2016-17, data was uploaded on the Dashboard as a part of school self-evaluation. We have used the Shaala Siddhi data for the Teacher Evaluation and Continuous and Comprehensive Evaluation indicators.
Teacher Evaluation
Teacher performance evaluation reports are integral for maintaining quality of education in schools. Under this provision performance of each and every teacher in Government schools is evaluated based on certain criterions.
A Key Domain of the Shaala Siddhi evaluation is Teaching- Learning and Assessment that focusses on nine parameters related to pedagogy and learning practices. Each parameter is assessed through three levels: Level 1 (Low), Level 2 (Medium), Level 3 (High). Details of each parameter can be found in Annexure 3.
9 Information and Communication Technology. 10 Source: National Programme on School Standards and Evaluation. http://shaalasiddhi.nuepa.org/index.html

21 State of Public (School) Education in Delhi
Table 16 : Teacher Self-Evaluation by Percentage of schools for the year 2016-1711
Teacher Evaluation Parameters
State Government MCD Private Schools12
Level 1
Level 2
Level 3
Level 1
Level 2
Level 3
Level 1
Level 2
Level 3
Teachers' Understanding of Learners
13 63 24 12 51 37 12 53 35
Subject and Pedagogical Knowledge of Teachers
8 52 40 8 34 58 10 41 49
Planning for Teaching 15 67 18 8 64 28 11 65 24
Enabling Learning Environment 16 57 27 11 48 41 13 48 38
Teaching-learning Process 13 72 15 9 65 26 13 65 22
Class Management 15 60 25 11 48 41 20 42 38
Learners' Assessment 17 62 20 12 57 31 15 60 25
Utilization of Teaching-learning Resources
16 70 13 13 71 16 16 69 15
Teachers' Reflection on their own Teaching-learning Practice
16 64 20 11 60 29 16 61 23
Average Percentage 14 63 22 11 55 34 14 56 30
Inference:
On an average, teachers from 55% MCD schools reported to have a medium level of teaching
quality based on the various parameters under SSEF whereas 34% reported to have a high quality
of teaching. For state government schools 63% schools reported medium teacher quality. In
private schools, maximum number (56%) reported to have medium teaching quality levels
whereas 30% schools reported high teacher quality.
14% of teachers in state government, 11% in MCD and 14% in private schools reported to have a
low teacher quality.
11 Data Provided is for 1695 MCD schools, 995 state government schools and 252 private schools from the Shaala Siddhi portal. 12 Private Schools include: Private Aided, Private Unaided

22 State of Public (School) Education in Delhi
V. Continuous Comprehensive Evaluation
Continuous and Comprehensive Evaluation (CCE) refers to a system of school-based assessment of students that is designed to cover all aspects of students' development. The new evaluation system was introduced under the Right to Education Act (2009). It is a developmental process of assessment which emphasizes on two fold objectives, continuity in evaluation, and assessment of broad based learning and behavioural outcomes. The scheme is thus a curricular initiative, attempting to shift emphasis from memorizing to holistic learning. It aims at creating citizens possessing sound values, appropriate skills and desirable qualities besides academic excellence. It is hoped that this will equip the learners to meet the challenges of life with confidence and success. It is the task of school based co-scholastic assessment to focus on holistic development that will lead to lifelong learning. As per the guidelines for evaluation, teachers should aim at helping the child to obtain minimum C2 grade. It will be compulsory for a teacher and school to provide extra guidance and coaching to children who score grade D or below, and help them attain minimum C2 grade. Under any circumstances, no child should be detained in the same class.
A1 and A2 as A (marks between 100% to 80%),
B1and B2 as B (marks between 80% to 60%)
C1 and C2 as C (marks between 60% to 40%),
Less than C2 is below 40%.
‘Less than C2’ in turn includes three grades: D, E1 and E2
D: 33% to 40%
E1: Students that have never been enrolled in a school. This is an indicator of out of school children.
E2: As per RTE norms, students continuously absent for a month or more are graded as E2 under the
CCE system. This is an indicator of students who are irregular in their attendance.
Data for CCE has been collected through the School Evaluation Dashboard of Shaala Siddhi under the
indicator of Learning Outcomes-Performance in Key Subjects for the academic year 2016-17 for the
Standards V, VIII, IX and X.
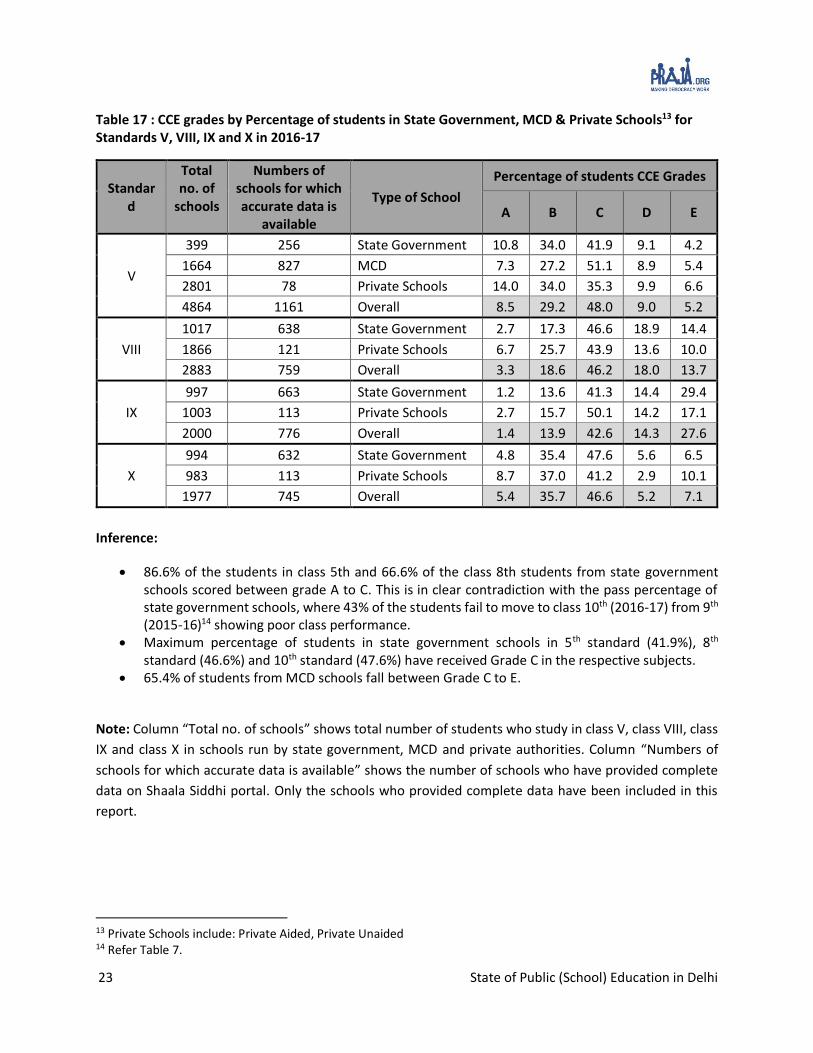
23 State of Public (School) Education in Delhi
Table 17 : CCE grades by Percentage of students in State Government, MCD & Private Schools13 for Standards V, VIII, IX and X in 2016-17
Standard
Total no. of
schools
Numbers of schools for which accurate data is
available
Type of School
Percentage of students CCE Grades
A B C D E
V
399 256 State Government 10.8 34.0 41.9 9.1 4.2
1664 827 MCD 7.3 27.2 51.1 8.9 5.4
2801 78 Private Schools 14.0 34.0 35.3 9.9 6.6
4864 1161 Overall 8.5 29.2 48.0 9.0 5.2
VIII
1017 638 State Government 2.7 17.3 46.6 18.9 14.4
1866 121 Private Schools 6.7 25.7 43.9 13.6 10.0
2883 759 Overall 3.3 18.6 46.2 18.0 13.7
IX
997 663 State Government 1.2 13.6 41.3 14.4 29.4
1003 113 Private Schools 2.7 15.7 50.1 14.2 17.1
2000 776 Overall 1.4 13.9 42.6 14.3 27.6
X
994 632 State Government 4.8 35.4 47.6 5.6 6.5
983 113 Private Schools 8.7 37.0 41.2 2.9 10.1
1977 745 Overall 5.4 35.7 46.6 5.2 7.1
Inference:
86.6% of the students in class 5th and 66.6% of the class 8th students from state government schools scored between grade A to C. This is in clear contradiction with the pass percentage of state government schools, where 43% of the students fail to move to class 10th (2016-17) from 9th (2015-16)14 showing poor class performance.
Maximum percentage of students in state government schools in 5th standard (41.9%), 8th standard (46.6%) and 10th standard (47.6%) have received Grade C in the respective subjects.
65.4% of students from MCD schools fall between Grade C to E.
Note: Column “Total no. of schools” shows total number of students who study in class V, class VIII, class
IX and class X in schools run by state government, MCD and private authorities. Column “Numbers of
schools for which accurate data is available” shows the number of schools who have provided complete
data on Shaala Siddhi portal. Only the schools who provided complete data have been included in this
report.
13 Private Schools include: Private Aided, Private Unaided 14 Refer Table 7.
24 State of Public (School) Education in Delhi
VI. Deliberation by Municipal Councillors and MLAs
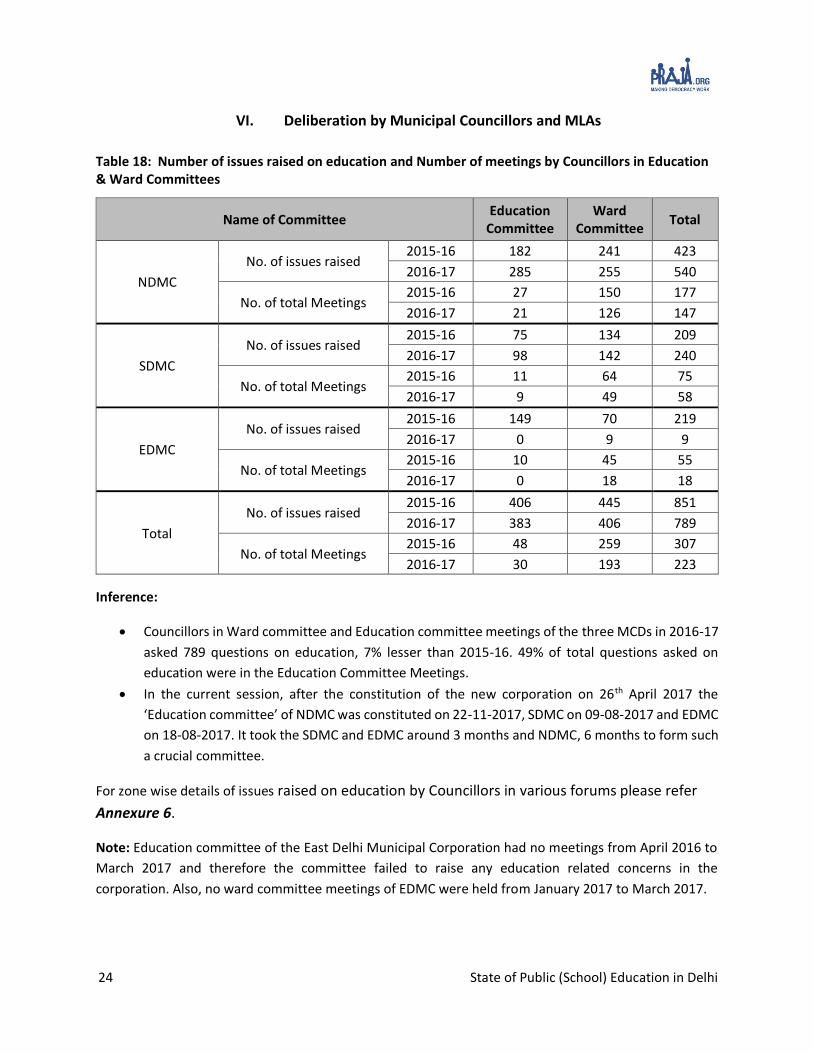
Table 18: Number of issues raised on education and Number of meetings by Councillors in Education & Ward Committees
Name of Committee Education
Committee Ward
Committee Total
NDMC
No. of issues raised 2015-16 182 241 423
2016-17 285 255 540
No. of total Meetings 2015-16 27 150 177
2016-17 21 126 147
SDMC
No. of issues raised 2015-16 75 134 209
2016-17 98 142 240
No. of total Meetings 2015-16 11 64 75
2016-17 9 49 58
EDMC
No. of issues raised 2015-16 149 70 219
2016-17 0 9 9
No. of total Meetings 2015-16 10 45 55
2016-17 0 18 18
Total
No. of issues raised 2015-16 406 445 851
2016-17 383 406 789
No. of total Meetings 2015-16 48 259 307
2016-17 30 193 223
Inference:
Councillors in Ward committee and Education committee meetings of the three MCDs in 2016-17
asked 789 questions on education, 7% lesser than 2015-16. 49% of total questions asked on
education were in the Education Committee Meetings.
In the current session, after the constitution of the new corporation on 26th April 2017 the
‘Education committee’ of NDMC was constituted on 22-11-2017, SDMC on 09-08-2017 and EDMC
on 18-08-2017. It took the SDMC and EDMC around 3 months and NDMC, 6 months to form such
a crucial committee.
For zone wise details of issues raised on education by Councillors in various forums please refer
Annexure 6.
Note: Education committee of the East Delhi Municipal Corporation had no meetings from April 2016 to
March 2017 and therefore the committee failed to raise any education related concerns in the
corporation. Also, no ward committee meetings of EDMC were held from January 2017 to March 2017.

25 State of Public (School) Education in Delhi
Table 19: Category wise number of issues raised by Councillors on Education
No. of issues raised
NDMC SDMC EDMC Total
2015-16
2016-17
2015-16
2016-17
2015-16
2016-17
2015-16
2016-17
0 36 43 45 46 29 58 110 147
1 to 5 48 40 45 48 26 6 119 94
6 to 10 10 13 4 6 3 0 17 19
11 to 20 1 3 1 3 1 0 3 6
21 to 40 1 2 2 0 1 0 4 2
above 40 4 3 0 1 2 0 6 4
Vacant 4 0 7 0 2 0 13 0
Total 104 104 104 104 64 64 272 272
Inference:
Across the three Municipal Corporations of Delhi, 147 councillors did not raise a single issue on
education.
26 State of Public (School) Education in Delhi
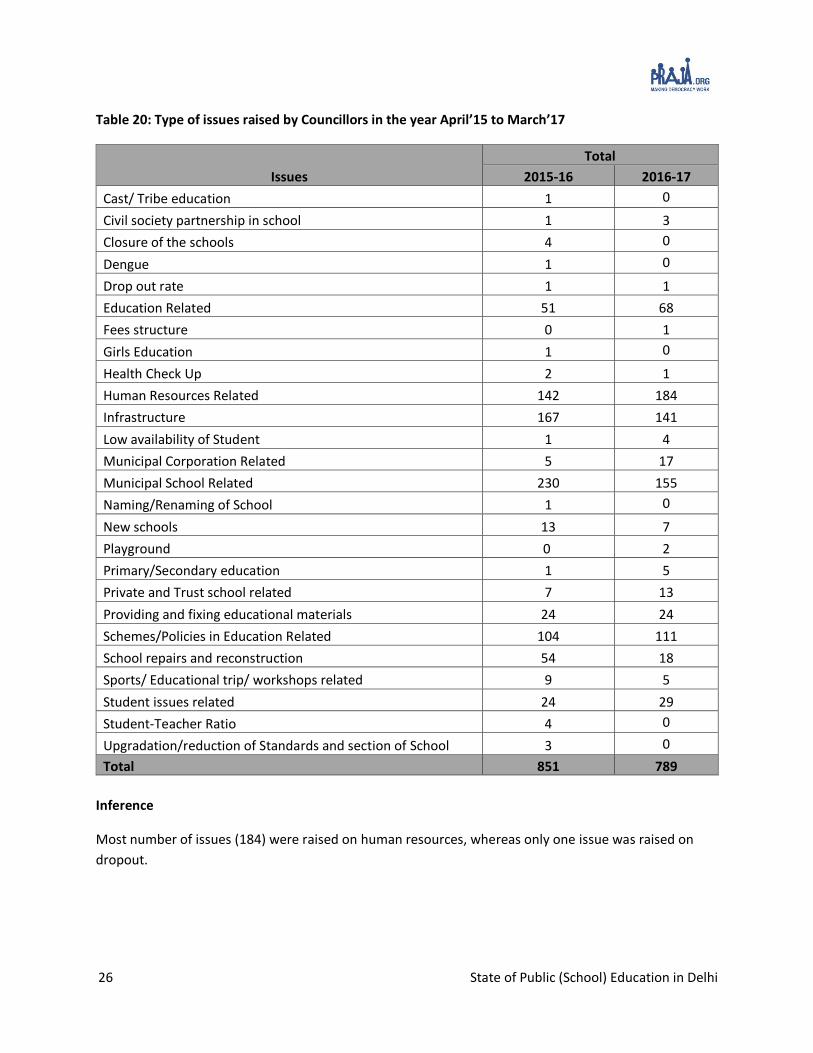
Table 20: Type of issues raised by Councillors in the year April’15 to March’17
Issues
Total
2015-16 2016-17
Cast/ Tribe education 1 0
Civil society partnership in school 1 3
Closure of the schools 4 0
Dengue 1 0
Drop out rate 1 1
Education Related 51 68
Fees structure 0 1
Girls Education 1 0
Health Check Up 2 1
Human Resources Related 142 184
Infrastructure 167 141
Low availability of Student 1 4
Municipal Corporation Related 5 17
Municipal School Related 230 155
Naming/Renaming of School 1 0
New schools 13 7
Playground 0 2
Primary/Secondary education 1 5
Private and Trust school related 7 13
Providing and fixing educational materials 24 24
Schemes/Policies in Education Related 104 111
School repairs and reconstruction 54 18
Sports/ Educational trip/ workshops related 9 5
Student issues related 24 29
Student-Teacher Ratio 4 0
Upgradation/reduction of Standards and section of School 3 0
Total 851 789
Inference
Most number of issues (184) were raised on human resources, whereas only one issue was raised on
dropout.
27 State of Public (School) Education in Delhi
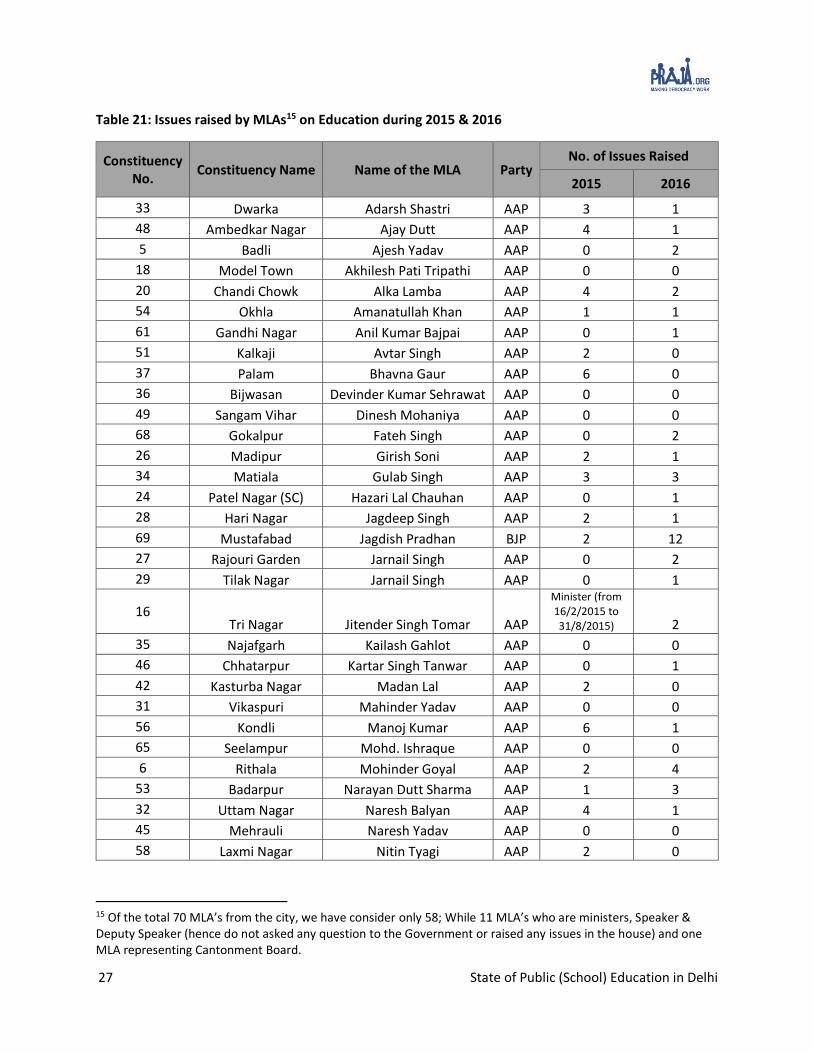
Table 21: Issues raised by MLAs15 on Education during 2015 & 2016
Constituency No.
Constituency Name Name of the MLA Party No. of Issues Raised
2015 2016
33 Dwarka Adarsh Shastri AAP 3 1
48 Ambedkar Nagar Ajay Dutt AAP 4 1
5 Badli Ajesh Yadav AAP 0 2
18 Model Town Akhilesh Pati Tripathi AAP 0 0
20 Chandi Chowk Alka Lamba AAP 4 2
54 Okhla Amanatullah Khan AAP 1 1
61 Gandhi Nagar Anil Kumar Bajpai AAP 0 1
51 Kalkaji Avtar Singh AAP 2 0
37 Palam Bhavna Gaur AAP 6 0
36 Bijwasan Devinder Kumar Sehrawat AAP 0 0
49 Sangam Vihar Dinesh Mohaniya AAP 0 0
68 Gokalpur Fateh Singh AAP 0 2
26 Madipur Girish Soni AAP 2 1
34 Matiala Gulab Singh AAP 3 3
24 Patel Nagar (SC) Hazari Lal Chauhan AAP 0 1
28 Hari Nagar Jagdeep Singh AAP 2 1
69 Mustafabad Jagdish Pradhan BJP 2 12
27 Rajouri Garden Jarnail Singh AAP 0 2
29 Tilak Nagar Jarnail Singh AAP 0 1
16 Tri Nagar Jitender Singh Tomar AAP
Minister (from 16/2/2015 to 31/8/2015) 2
35 Najafgarh Kailash Gahlot AAP 0 0
46 Chhatarpur Kartar Singh Tanwar AAP 0 1
42 Kasturba Nagar Madan Lal AAP 2 0
31 Vikaspuri Mahinder Yadav AAP 0 0
56 Kondli Manoj Kumar AAP 6 1
65 Seelampur Mohd. Ishraque AAP 0 0
6 Rithala Mohinder Goyal AAP 2 4
53 Badarpur Narayan Dutt Sharma AAP 1 3
32 Uttam Nagar Naresh Balyan AAP 4 1
45 Mehrauli Naresh Yadav AAP 0 0
58 Laxmi Nagar Nitin Tyagi AAP 2 0
15 Of the total 70 MLA’s from the city, we have consider only 58; While 11 MLA’s who are ministers, Speaker & Deputy Speaker (hence do not asked any question to the Government or raised any issues in the house) and one MLA representing Cantonment Board.

28 State of Public (School) Education in Delhi
Constituency No.
Constituency Name Name of the MLA Party No. of Issues Raised
2015 2016
59 Vishwas Nagar Om Prakash Sharma* BJP 4
Suspended (from
9/6/2016 to 10/3/2017)
3 Timarpur Pankaj Kant Singhal AAP 7 3
44 R K Puram Parmila Tokas AAP 0 1
4 Adarsh Nagar Pawan Kumar Sharma AAP 1 0
47 Deoli (SC) Prakash AAP 0 0
41 Jangpura Praveen Kumar AAP 1 2
11 Nangloi Jat Raghuvinder Shokeen AAP 0 0
63 Seema puri Rajendra Pal Gautam AAP 6 4
17 Wazirpur Rajesh Gupta AAP 1 1
30 Janakpuri Rajesh Rishi AAP 0 0
55 Trilokpuri Raju Dhingan AAP 1 0
12 Mangol Puri (SC) Rakhi Birla AAP 0 0
9 Kirari Rituraj Govind AAP 0 0
60 Krishna Nagar S. K. Bagga AAP 0 0
52 Tuglakabad Sahi Ram AAP 0 0
2 Burari Sanjeev Jha AAP 2 1
64 Rohtas Nagar Sarita Singh AAP 0 1
50 Greater Kailash Saurabh Bharadwaj AAP 0 0
1 Narela Sharad Kumar AAP 0 0
25 Moti Nagar Shiv Charan Goel AAP 0 0
66 Ghonda Shri Dutt Sharma AAP 2 4
19 Sadar Bazar Som Dutt AAP 0 0
43 Malviya Nagar Somnath Bharti AAP 2 1
8 Mundka Sukhvir Singh AAP 0 3
7 Bawana (SC) Ved Parkash AAP 4 4
39 Rajinder Nagar Vijender Garg Vijay AAP 2 1
13 Rohini Vijender Kumar BJP 6 9
23 Karol Bagh Vishesh Ravi AAP 2 0
Total 87 78
Inference:
25 MLAs in the year 2016 did not raise a single issue related to Education in Delhi.
Maximum issues on Education were raised by Jagdish Pradhan (12) and Vijender Kumar (9) in
the year 2016.

29 State of Public (School) Education in Delhi
Table 22: Category wise number of issues raised by MLAs on Education
No. of issues raised
No. of MLAs
2015 2016
0 28 25
1 6 17
2 to 5 19 14
Above 6 5 2
Total 58 58
Inference:
Only 2 MLAs of Delhi raised more than 6 issues related to Education.
Table 23: Type of issues raised by MLAs
Issues
No. of issues raised
2015 2016
Anganwadi/Balwadi/Creche related 1 5
Dropout rate 0 1
Education related 10 12
Fees/Donation Related 3 1
Girls Education 0 2
Higher/ Technical Education 13 6
Human Resources Related 10 9
Infrastructure issues 13 7
Municipal School 7 7
New schools 3 4
Primary/Secondary education 0 2
Private and Trust School 6 2
Private College 0 1
Schemes/ Policies in Education Related 17 18
Student issues related 2 0
Syllabus/Curriculum 2 1
Total 87 78
Inference:
Most number of issues (18) were raised on schemes/policies in education. Only one issue related to
dropout was raised.

30 State of Public (School) Education in Delhi
VII. Data from Household Survey
Praja Foundation had commissioned a household survey to Hansa Research which was conducted in April-
June 2017 across the city of Delhi. The total sample size for the survey was 24,301 households. Out of the
total sample size of 24,301 households, 5,417 households had children in the age group of 3-15 years, out
of which 4,346 households had children going to school (678- MCD, 1,279- State and 2,389- Others).
Hence, the education questionnaire was administered further with those (4,346) households only. For
details on the survey methodology and Socio Economic Classification (SEC) of households, refer to
Annexure 4 and Annexure 5.
Following are the key findings of the survey:
Table 24 : Current Medium of Education (%)
Language All SEC A SEC B SEC C SEC D SEC E
English
Other Schools16 50 70 63 47 35 30
Municipal Schools 5 2 3 6 5 7
State Govt Schools 13 10 12 13 15 16
Hindi
Other Schools 7 9 6 6 9 5
Municipal Schools 9 3 6 9 12 18
State Govt Schools 16 6 10 18 23 25
Urdu
Other Schools 0 0 0 0 0 0
Municipal Schools 0 0 0 0 0 0
State Govt Schools 0 0 0 0 0 0
Inference: Preference for other English- medium schools increases as one moves up the affluence level17 whereas it
falls for that of public, which shows that higher the socio-economic status greater is the preference for a
other English Medium School. However even a significant percentage (30%) from SEC E prefers sending
their children to a other English school.
16 Other school category here includes Private and KV schools. 17 Determined by occupation and education, see appendix for details of socio-economic classification.
31 State of Public (School) Education in Delhi
Table 25 : Respondents from Table 24 whose current medium of education is other than English and would want to change to English medium (%)
Language All SEC A SEC B SEC C SEC D SEC E
English 46 49 32 46 43 58
Inference:
58% households from SEC E and 43% households from SEC D prefer their children be educated in
English medium. On an average, 46% of the respondents prefer English medium education.
Table 26: Respondents taking private tuitions/coaching classes (%)
All Other School Municipal School State Govt. School
Yes 66 69 63 61
No 34 31 37 39
Inference:
More than half of the parents send their children for private tuitions. Of the households sending their children to municipal schools, 63% are also taking private tuitions/coaching classes.
Table 27: Details on source of Tuitions (%)
All Other School Municipal School State Govt. School
School Class teacher 17 19 3 18
Private tuitions 74 71 85 74
Coaching classes 6 7 8 4
Others 3 3 3 3
Inference:
Amongst households who send their children for tuitions, majority of them send their children to
private tuitions.
85% municipal school students from respondent households go for private tuition, while 8% go to
coaching classes, 3% students take tuitions from their municipal school teacher.
32 State of Public (School) Education in Delhi
Table 28: Percentage of Respondents happy with the School
All Other School Municipal School State Govt. School
Yes 83 90 71 76
No 17 10 29 24
Inference:
Although majority of the parents are happy with their child’s school (justifying their decision), satisfaction
is much higher amongst parents sending their children to other Schools as compared to MCD and State
Government. Parents of 29% MCD school students are not happy with their children’s school.
Chart 1: Reasons for not being happy
Inference:
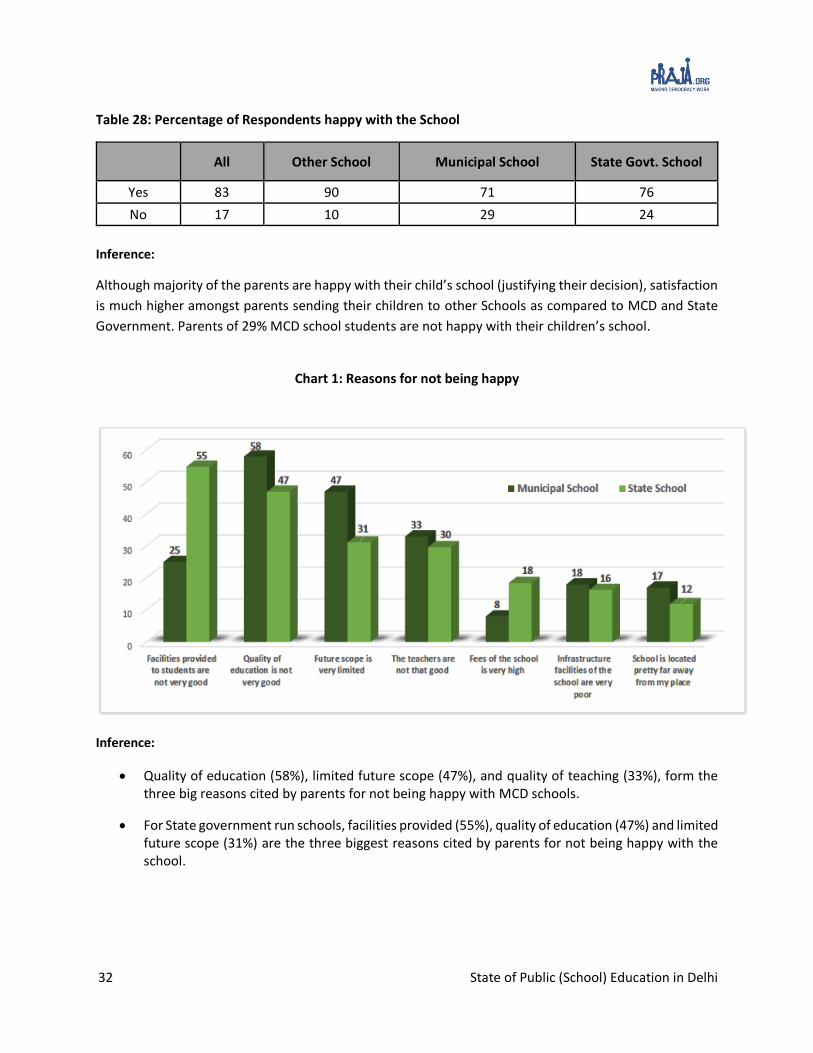
Quality of education (58%), limited future scope (47%), and quality of teaching (33%), form the three big reasons cited by parents for not being happy with MCD schools.
For State government run schools, facilities provided (55%), quality of education (47%) and limited future scope (31%) are the three biggest reasons cited by parents for not being happy with the school.

33 State of Public (School) Education in Delhi
Annexure 1 - Note on Forecasting Methodology
Extracted data for enrolments over the past few years: Praja had enrolment data for MCDs, State
Government schools and Kendriya Vidyalayas for 2010 to 2016. This data was extracted for
forecasting values for enrolment for the next few years.
Converted data into time series: Extracted data was converted into time series. A time series is
obtained by measuring a variable (or set of variables) regularly over a period of time. Time series
data transformations assume a data file structure in which each case (row) represents a set of
observations at a different time, and the length of time between cases is uniform. In this case, we
were measuring the number of enrolments across years.
Checked the stationarity of the data: Stationarity of the data was checked and later this data was
transformed to make it stationary wherever required. A stationary time series has properties
wherein mean, variance etc. are constant over time.
ARIMA (Autoregressive Integrated Moving Average) model was used for forecasting: ARIMA
was used for the forecast. ARIMA models are, in theory, the most general class of models for
forecasting a time series which can be made to be “stationary” by differencing (if necessary),
perhaps in conjunction with nonlinear transformations such as logging or deflating (if necessary).
A random variable that in a time series is stationary if its statistical properties are all constant over
time. An ARIMA model can be viewed as a “filter” that tries to separate the signal from the noise,
and the signal is then extrapolated into the future to obtain forecasts.
This model considers trends and seasonality in data for forecasting values: Hence, for the
forecast of enrolments in schools, this model was best suited to the data.
34 State of Public (School) Education in Delhi
Annexure 2 - Zone / District Wise Data – Enrolment & Dropout
Table 29 : Zone-wise enrolment retention rate in MCD Schools - Class 1 to Class 5
Zone
Year 2011-12 2012-13 2013-14 2014-15 2015-16
Standards 1 2 3 4 5
Central
Number 16,780 19,334 20,400 20,082 21,038
Retention Rate (%) 115.2% 121.6% 119.7% 125.4%
City
Number 1,453 1,750 1,808 1,823 1,795
Retention Rate (%) 120.4% 124.4% 1250.5% 123.5%
Civil Line
Number 18,779 20,494 20,891 21,299 22,683
Retention Rate (%) 109.1% 111.2% 113.4% 120.8%
Karol Bagh
Number 8,138 8,587 8,051 7,839 8,107
Retention Rate (%) 105.5% 98.9% 96.3% 99.6%
Najafgarh
Number 13,542 14,562 14,515 14,461 14,681
Retention Rate (%) 107.5% 107.2% 106.8% 108.4%
Narela
Number 14,362 15,387 15,616 15,954 16,452
Retention Rate (%) 107.1% 108.7% 111.1% 114.6%
Rohini
Number 23,368 24,585 24,618 24,666 25,643
Retention Rate (%) 105.2% 105.3% 105.6% 109.7%
Sadar Paharganj
Number 2,792 2,981 2,877 2,633 2,535
Retention Rate (%) 106.8% 103% 94.3% 90.8%
Shahadra North
Number 24,088 27,623 30,553 30,930 36,353
Retention Rate (%) 114.7% 126.8% 128.4% 150.9%
Shahadra South
Number 15,393 16,338 17,980 18,687 19,579
Retention Rate (%) 106.1% 116.8% 121.4% 127.2%
South
Number 11,890 12,943 12,878 13,064 14,033
Retention Rate (%) 108.9% 108.3% 109.9% 118%
West
Number 15,374 16,529 16,505 16,301 17,218
Retention Rate (%) 107.5% 107.4% 106% 112%
Total
Number 1,65,959 1,81,113 1,86,692 1,87,739 2,00,117
Retention Rate (%) 109.1% 112.5% 113.1% 120.6%
Inference: Table shows zone wise retention of students who enrolled in class 1 in 2011- 12 and must be in class 5th in the year 2015-16. Sadar Paharganj Zone and Karol Bagh zone and of North Delhi Municipal Corporation have retained least number of students in class 5 in 2015-16.
35 State of Public (School) Education in Delhi
Table 30: District-wise enrolment retention rate in State Government Schools - Class 1 to Class 6
District
Year 1 2 3 4 5 6
Standards 2011-12
2012-13
2013-14 2014-15 2015-16 2016-1718
Central Delhi
Number 1,007 1,038 1,001 945 928 3,611
Retention Rate (%)
103.1% 99.4% 93.8% 92.2%
East Delhi
Number 3,296 3,406 3,552 3,563 3,731 22,199
Retention Rate (%)
103.3% 107.8% 108.1% 113.2%
New Delhi
Number 206 217 230 229 242 340
Retention Rate (%)
105.3% 111.7% 111.2% 117.5%
North Delhi
Number 1,506 1,566 1,537 1,541 1,560 8,685
Retention Rate (%)
104% 102.1% 102.3% 103.6%
North East Delhi
Number 2,334 2,659 2,596 2,436 2,370 36,259
Retention Rate (%)
113.9% 111.2% 104.4% 101.5%
North West Delhi
Number 5,212 5,259 5,313 5,279 5,366 53,378
Retention Rate (%)
100.9% 101.9% 101.3% 103%
South Delhi
Number 2,850 2,894 2,916 2,839 2,922 37,800
Retention Rate (%)
101.5% 102.3% 99.6% 102.5%
South West Delhi
Number 2,815 2,821 2,863 2,894 2,853 21,435
Retention Rate (%)
100.2% 101.7% 102.8% 101.3%
West Delhi
Number 3,747 3,854 3,857 3,918 3,986 35,746
Retention Rate (%)
102.9% 102.9% 104.6% 106.4%
Total
Number 22,973 23,714 23,865 23,644 23,958 2,19,453
Retention Rate (%)
103.2% 103.9% 102.9% 104.3%
Inference: Retention rate of state government schools for class 6th seems to have improved as students from MCD schools are transferred to state government schools after class 5.
18 Retention Rate in % not shown for 2016-17 (Class 5 to Class 6), since MCD schools students are transferred to state government schools, and hence the figure would be inflated.
36 State of Public (School) Education in Delhi
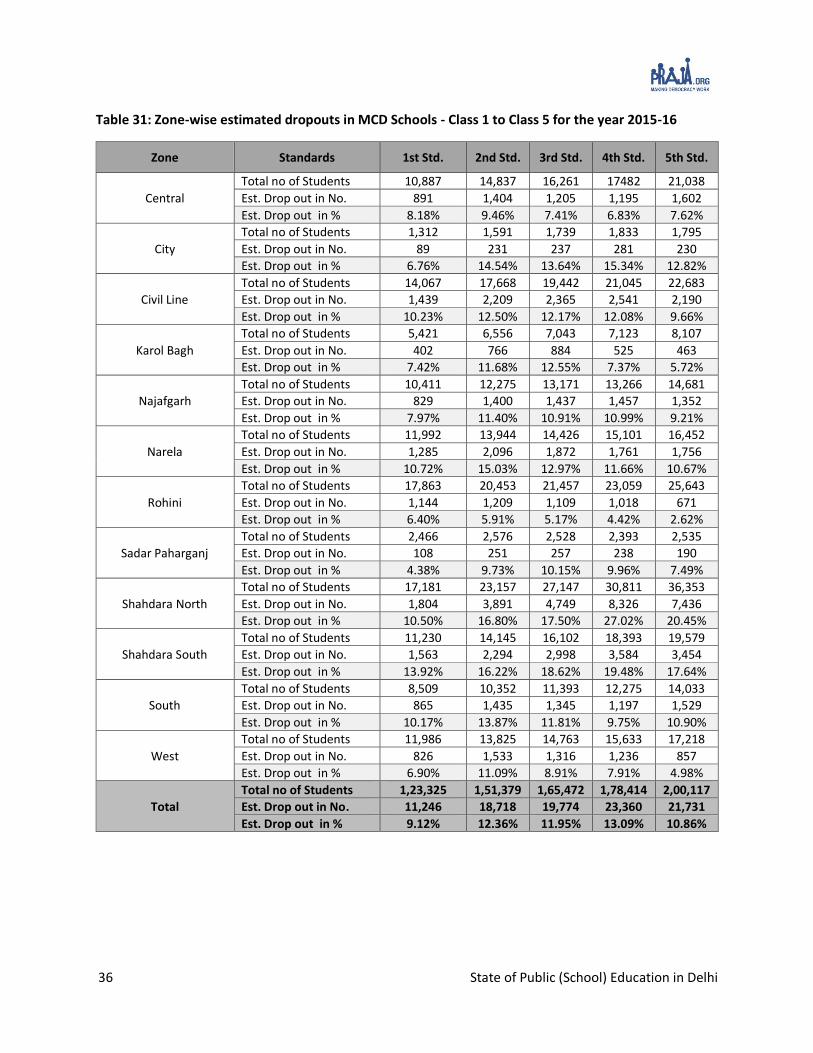
Table 31: Zone-wise estimated dropouts in MCD Schools - Class 1 to Class 5 for the year 2015-16
Zone Standards 1st Std. 2nd Std. 3rd Std. 4th Std. 5th Std.
Central
Total no of Students 10,887 14,837 16,261 17482 21,038
Est. Drop out in No. 891 1,404 1,205 1,195 1,602
Est. Drop out in % 8.18% 9.46% 7.41% 6.83% 7.62%
City
Total no of Students 1,312 1,591 1,739 1,833 1,795
Est. Drop out in No. 89 231 237 281 230
Est. Drop out in % 6.76% 14.54% 13.64% 15.34% 12.82%
Civil Line
Total no of Students 14,067 17,668 19,442 21,045 22,683
Est. Drop out in No. 1,439 2,209 2,365 2,541 2,190
Est. Drop out in % 10.23% 12.50% 12.17% 12.08% 9.66%
Karol Bagh
Total no of Students 5,421 6,556 7,043 7,123 8,107
Est. Drop out in No. 402 766 884 525 463
Est. Drop out in % 7.42% 11.68% 12.55% 7.37% 5.72%
Najafgarh
Total no of Students 10,411 12,275 13,171 13,266 14,681
Est. Drop out in No. 829 1,400 1,437 1,457 1,352
Est. Drop out in % 7.97% 11.40% 10.91% 10.99% 9.21%
Narela
Total no of Students 11,992 13,944 14,426 15,101 16,452
Est. Drop out in No. 1,285 2,096 1,872 1,761 1,756
Est. Drop out in % 10.72% 15.03% 12.97% 11.66% 10.67%
Rohini
Total no of Students 17,863 20,453 21,457 23,059 25,643
Est. Drop out in No. 1,144 1,209 1,109 1,018 671
Est. Drop out in % 6.40% 5.91% 5.17% 4.42% 2.62%
Sadar Paharganj
Total no of Students 2,466 2,576 2,528 2,393 2,535
Est. Drop out in No. 108 251 257 238 190
Est. Drop out in % 4.38% 9.73% 10.15% 9.96% 7.49%
Shahdara North
Total no of Students 17,181 23,157 27,147 30,811 36,353
Est. Drop out in No. 1,804 3,891 4,749 8,326 7,436
Est. Drop out in % 10.50% 16.80% 17.50% 27.02% 20.45%
Shahdara South
Total no of Students 11,230 14,145 16,102 18,393 19,579
Est. Drop out in No. 1,563 2,294 2,998 3,584 3,454
Est. Drop out in % 13.92% 16.22% 18.62% 19.48% 17.64%
South
Total no of Students 8,509 10,352 11,393 12,275 14,033
Est. Drop out in No. 865 1,435 1,345 1,197 1,529
Est. Drop out in % 10.17% 13.87% 11.81% 9.75% 10.90%
West
Total no of Students 11,986 13,825 14,763 15,633 17,218
Est. Drop out in No. 826 1,533 1,316 1,236 857
Est. Drop out in % 6.90% 11.09% 8.91% 7.91% 4.98%
Total
Total no of Students 1,23,325 1,51,379 1,65,472 1,78,414 2,00,117
Est. Drop out in No. 11,246 18,718 19,774 23,360 21,731
Est. Drop out in % 9.12% 12.36% 11.95% 13.09% 10.86%

37 State of Public (School) Education in Delhi
Table 32: Zone-wise estimated dropouts in MCD Schools - Class 1 to Class 5 for the year 2016-17 Zone19 Standards 1st Std 2nd Std 3rd Std 4th Std 5th Std
Central
Total no of Students 10320 13501 16114 17006 18918
Est. Drop out in No. 483 871 1011 1176 998
Est. Drop out in % 4.68% 6.45% 6.27% 6.92% 5.28%
City
Total no of Students 934 1414 1519 1495 1585
Est. Drop out in No. 162 264 249 248 170
Est. Drop out in % 17.34% 18.65% 16.38% 16.56% 10.73%
Civil Line
Total no of Students 13007 15811 17671 18728 20896
Est. Drop out in No. 856 1453 1222 1207 991
Est. Drop out in % 6.58% 9.19% 6.92% 6.44% 4.74%
Karol Bagh
Total no of Students 5209 5984 6726 6962 7351
Est. Drop out in No. 504 750 642 558 381
Est. Drop out in % 9.68% 12.53% 9.55% 8.02% 5.18%
Najafgarh
Total no of Students 9478 11477 12944 13463 14206
Est. Drop out in No.
Est. Drop out in %
Narela
Total no of Students 10984 13490 14565 14596 15625
Est. Drop out in No. 564 908 835 673 629
Est. Drop out in % 5.14% 6.73% 5.74% 4.61% 4.03%
Rohini
Total no of Students 15760 19927 21348 21893 24196
Est. Drop out in No. 924 1032 1015 798 585
Est. Drop out in % 5.86% 5.18% 4.76% 3.64% 2.42%
Sadar Paharganj
Total no of Students 2172 2582 2545 2444 2305
Est. Drop out in No. 125 176 150 147 121
Est. Drop out in % 5.77% 6.83% 5.91% 6.02% 5.26%
Shahadra North
Total no of Students 15054 20865 26220 29949 33508
Est. Drop out in No.
Est. Drop out in %
Shahadra South
Total no of Students 10228 14030 16080 17415 20004
Est. Drop out in No.
Est. Drop out in %
South
Total no of Students 7954 9980 11127 11695 13239
Est. Drop out in No. 522 927 782 768 719
Est. Drop out in % 6.57% 9.29% 7.03% 6.57% 5.43%
West
Total no of Students 11087 13484 14939 15294 16793
Est. Drop out in No. 676 806 799 648 534
Est. Drop out in % 6.10% 5.98% 5.35% 4.23% 3.18%
Total
Total no of Students 112187 142545 161798 170940 188626
Est. Drop out in No. 4818 7188 6706 6222 5129
Est. Drop out in % 4.29% 5.04% 4.14% 3.64% 2.72%
19Najafgarh zone, Shahdara South zone and Shahdara North zone did not provide any data for dropouts for this year (2016-17).
38 State of Public (School) Education in Delhi
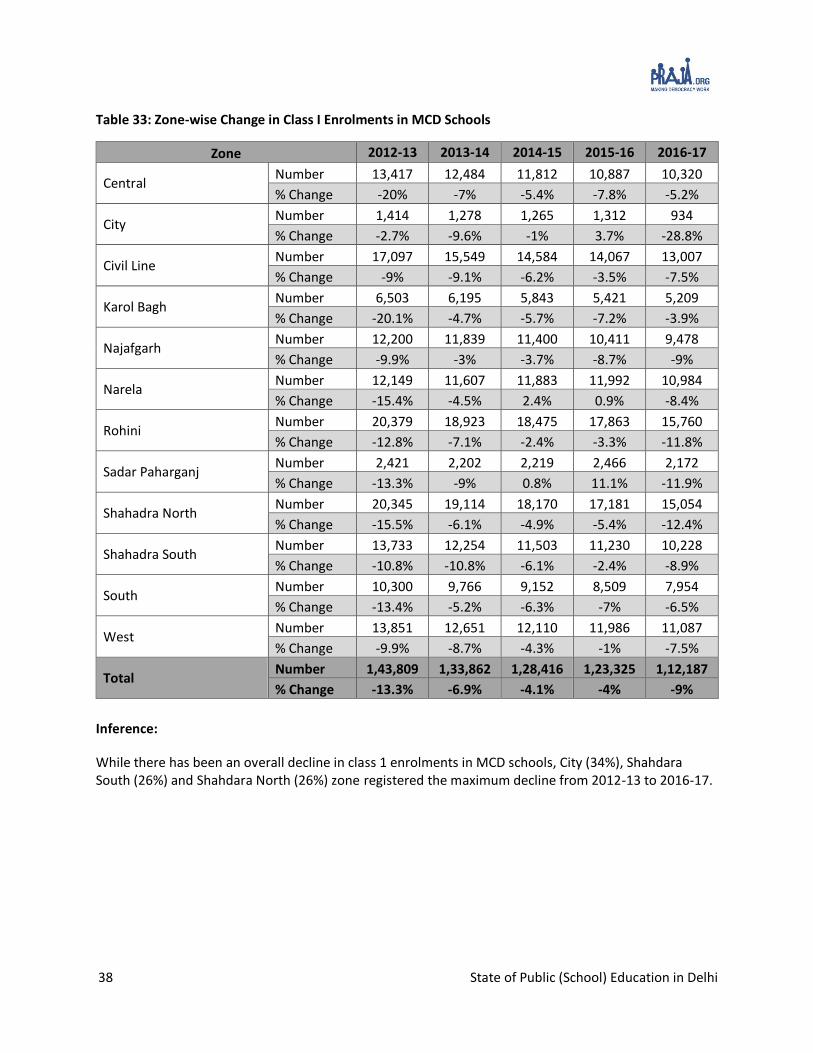
Table 33: Zone-wise Change in Class I Enrolments in MCD Schools
Zone 2012-13 2013-14 2014-15 2015-16 2016-17
Central Number 13,417 12,484 11,812 10,887 10,320
% Change -20% -7% -5.4% -7.8% -5.2%
City Number 1,414 1,278 1,265 1,312 934
% Change -2.7% -9.6% -1% 3.7% -28.8%
Civil Line Number 17,097 15,549 14,584 14,067 13,007
% Change -9% -9.1% -6.2% -3.5% -7.5%
Karol Bagh Number 6,503 6,195 5,843 5,421 5,209
% Change -20.1% -4.7% -5.7% -7.2% -3.9%
Najafgarh Number 12,200 11,839 11,400 10,411 9,478
% Change -9.9% -3% -3.7% -8.7% -9%
Narela Number 12,149 11,607 11,883 11,992 10,984
% Change -15.4% -4.5% 2.4% 0.9% -8.4%
Rohini Number 20,379 18,923 18,475 17,863 15,760
% Change -12.8% -7.1% -2.4% -3.3% -11.8%
Sadar Paharganj Number 2,421 2,202 2,219 2,466 2,172
% Change -13.3% -9% 0.8% 11.1% -11.9%
Shahadra North Number 20,345 19,114 18,170 17,181 15,054
% Change -15.5% -6.1% -4.9% -5.4% -12.4%
Shahadra South Number 13,733 12,254 11,503 11,230 10,228
% Change -10.8% -10.8% -6.1% -2.4% -8.9%
South Number 10,300 9,766 9,152 8,509 7,954
% Change -13.4% -5.2% -6.3% -7% -6.5%
West Number 13,851 12,651 12,110 11,986 11,087
% Change -9.9% -8.7% -4.3% -1% -7.5%
Total Number 1,43,809 1,33,862 1,28,416 1,23,325 1,12,187
% Change -13.3% -6.9% -4.1% -4% -9%
Inference:
While there has been an overall decline in class 1 enrolments in MCD schools, City (34%), Shahdara South (26%) and Shahdara North (26%) zone registered the maximum decline from 2012-13 to 2016-17.

39 State of Public (School) Education in Delhi
Table 34: District-wise Change in Class I Enrolments in State Government Schools
District 2012-13 2013-14 2014-15 2015-16 2016-17
Central Delhi Number 953 889 833 760 820
% Change -5.4% -6.7% -6.3% -8.8% 7.9%
East Delhi Number 3,106 3,283 3,311 3,022 3,179
% Change -5.8% 5.7% 0.9% -8.7% 5.2%
New Delhi Number 225 218 168 145 141
% Change 9.2% -3.1% -22.9% -13.7% -2.8%
North Delhi Number 1,570 1,659 1,594 1,525 1,517
% Change 4.2% 5.7% -3.9% -4.3% -0.5%
North East Delhi Number 2,263 2,259 2,477 2,313 2,292
% Change -3% -0.2% 9.7% -6.6% -0.9%
North West Delhi Number 5,127 5,333 5,538 5,338 5,507
% Change -1.6% 4% 3.8% -3.6% 3.2%
South Delhi Number 2,798 2,909 2,805 3,064 3,290
% Change -1.8% 4% -3.6% 9.2% 7.4%
South West Delhi Number 2,982 3,049 2,975 2,702 2,761
% Change 5.9% 2.2% -2.4% -9.2% 2.2%
West Delhi Number 3,604 3,761 3,821 3,710 3,797
% Change -3.8% 4.4% 1.6% -2.9% 2.3%
Total Number 22,628 23,360 23,522 22,579 23,304
% Change -1.5% 3.2% 0.7% -4% 3.2%
Inference:
Overall there was 3% incerese in class 1 enrolments in Delhi government schools.
Central Delhi has the highest change in Class 1 enrolment (7.9%), whereas North Delhi has the
least change (-0.5%).

40 State of Public (School) Education in Delhi
Table 35: Zone-wise total number of students and estimated dropout of MCD Schools20
MCD ZONE Total No. of Students
Estimated Drop Out
In Number In (%)
2014-15 2015-16 2016-17 2014-15 2015-16 2016-17 2014-15 2015-16 2016-17
NDMC
City 8,391 8,270 6,947 1,390 992 1,093 16.57 12.00 15.73
Civil Line 96,691 94,905 86,113 9,375 10,738 5,723 9.70 11.31 6.65
Karol Bagh 35,952 34,250 32,232 2,293 3,043 2,832 6.38 8.88 8.79
Narela 72,683 71,915 69,260 4,762 10,271 3,609 6.55 14.28 5.21
Rohini 1,13,283 1,08,475 1,03,124 5,525 5,181 4,368 4.88 4.78 4.24
Sadar Paharganj 12,369 12,498 12,048 1,070 1,304 721 8.65 10.43 5.98
SDMC
Central 86,380 80,505 75,859 6,826 6,298 4,533 7.90 7.82 5.98
Najafgarh21 68,310 63,804 61,568 6,981 7,261 10.22 11.38
South 59,385 56,562 53,995 6,484 6,360 3,730 10.92 11.24 6.91
West 74,847 73,425 71,597 5,185 5,771 3,472 6.93 7.86 4.85
EDMC22 Shahdara North 1,30,066 1,34,649 1,25,596 23,281 25,738 17.90 19.11
Shahdara South 80,683 79,449 77,757 12,950 13,890 16.05 17.48
Grand Total 8,39,040 8,18,707 7,76,096 76,416 94,747 47,005 9.11 11.57 6.06
Inference:
In the academic year 2016-17, from total 7,76,096 students in all MCD schools, 47,005 students
dropped out of the education system.
From all the 12 zones who provided data on drop outs, City zone (15.73%) had the highest drop
out rate.
20 RTIs were filed with the 12 MCD zones to get information of drop out students of all MCD schools in Delhi. In reply,
only 749 schools of MCD provided the data for 2016-17, hence only those have been included in this report. 21 Najafgarh zone of SDMC did not provide any data for dropouts for this year (2016-17). 22 Shahdara South and Shahdara North zone of EDMC did not provide any data for dropouts for this year (2016-17)
41 State of Public (School) Education in Delhi
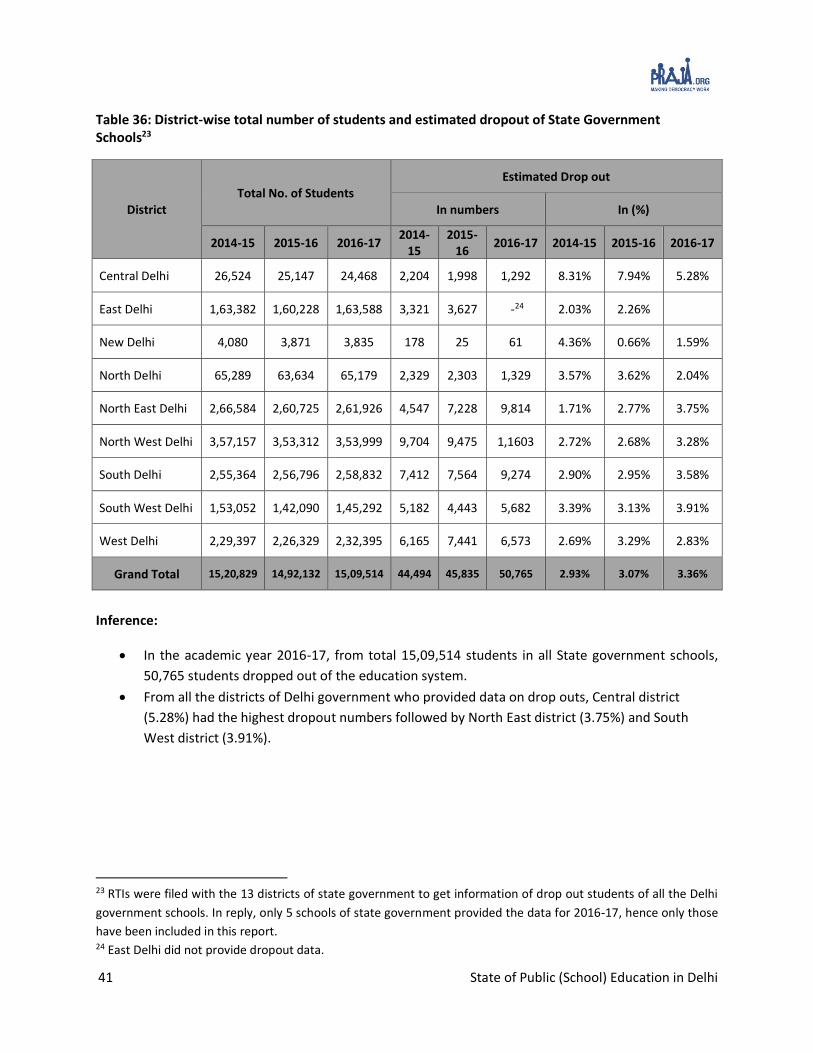
Table 36: District-wise total number of students and estimated dropout of State Government Schools23
District Total No. of Students
Estimated Drop out
In numbers In (%)
2014-15 2015-16 2016-17 2014-
15 2015-
16 2016-17 2014-15 2015-16 2016-17
Central Delhi 26,524 25,147 24,468 2,204 1,998 1,292 8.31% 7.94% 5.28%
East Delhi 1,63,382 1,60,228 1,63,588 3,321 3,627 -24 2.03% 2.26%
New Delhi 4,080 3,871 3,835 178 25 61 4.36% 0.66% 1.59%
North Delhi 65,289 63,634 65,179 2,329 2,303 1,329 3.57% 3.62% 2.04%
North East Delhi 2,66,584 2,60,725 2,61,926 4,547 7,228 9,814 1.71% 2.77% 3.75%
North West Delhi 3,57,157 3,53,312 3,53,999 9,704 9,475 1,1603 2.72% 2.68% 3.28%
South Delhi 2,55,364 2,56,796 2,58,832 7,412 7,564 9,274 2.90% 2.95% 3.58%
South West Delhi 1,53,052 1,42,090 1,45,292 5,182 4,443 5,682 3.39% 3.13% 3.91%
West Delhi 2,29,397 2,26,329 2,32,395 6,165 7,441 6,573 2.69% 3.29% 2.83%
Grand Total 15,20,829 14,92,132 15,09,514 44,494 45,835 50,765 2.93% 3.07% 3.36%
Inference:
In the academic year 2016-17, from total 15,09,514 students in all State government schools,
50,765 students dropped out of the education system.
From all the districts of Delhi government who provided data on drop outs, Central district
(5.28%) had the highest dropout numbers followed by North East district (3.75%) and South
West district (3.91%).
23 RTIs were filed with the 13 districts of state government to get information of drop out students of all the Delhi
government schools. In reply, only 5 schools of state government provided the data for 2016-17, hence only those
have been included in this report. 24 East Delhi did not provide dropout data.

42 State of Public (School) Education in Delhi
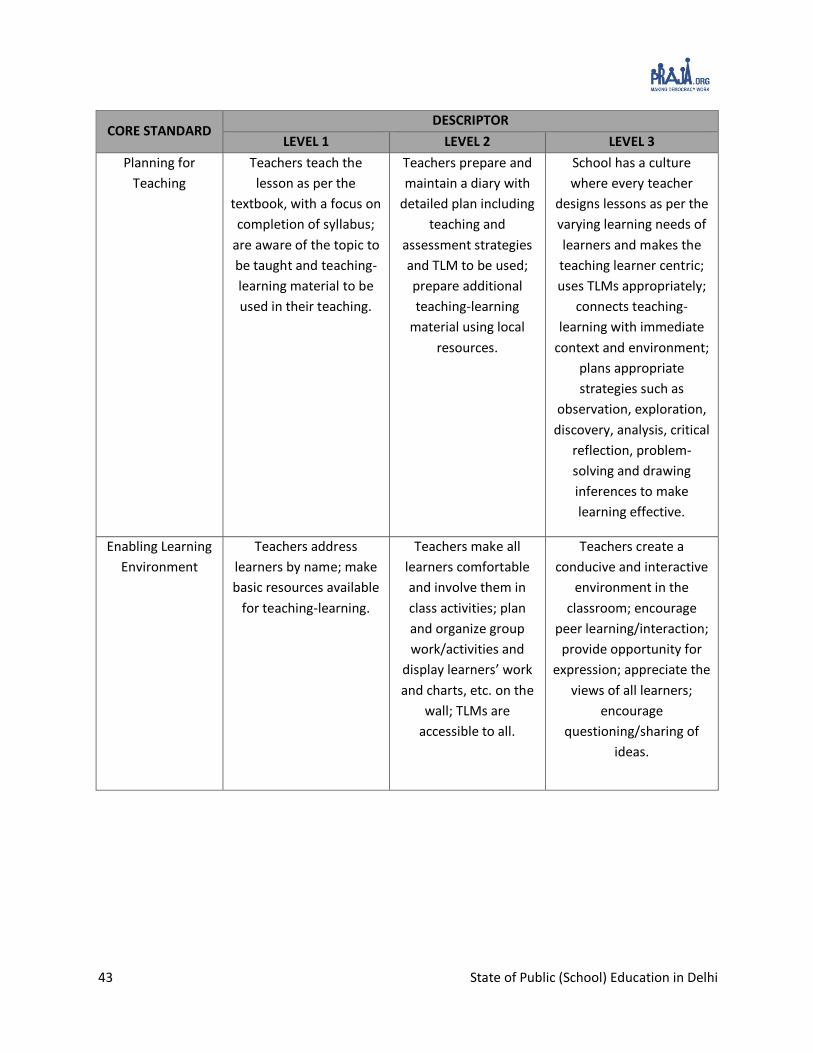
Annexure 3 – Teacher Inspection
Details of parameters under Teaching- Learning and Assessment indicator of Shaala Siddhi.25
CORE STANDARD DESCRIPTOR
LEVEL 1 LEVEL 2 LEVEL 3
Teachers’
Understanding of
Learners
Teachers are aware of the
sociocultural and
economic background of
the community from
where learners come;
have a general idea of the
home background and
learning levels of the
learners.
Teachers understand
the sociocultural and
economic background
of the community and
the learning needs of
the learner; develop an
understanding of the
learning needs of
learners through
classroom experiences
and personal
interaction with other
teachers, parents/
guardians and
community.
Teachers seek feedback
from learners and
parents regarding
learners’ performance
in a systematic
manner; address
individual needs,
learning style and
strengths of learners.
Subject and
Pedagogical
Knowledge of
Teachers
Teachers often experience
difficulty in teaching
certain concepts due to
lack of understanding of
the same; make limited
efforts to improve their
content knowledge and
pedagogical skills.
Teachers sometimes
face difficulty in
explaining difficult
concepts in their
subjects; lack
appropriate
pedagogical skills;
make efforts to
upgrade their content
knowledge and
pedagogical skills with
the available support
and resources e.g.
subject forums,
training programmes.
Teachers have mastery
over content and
pedagogical skills and
hence rarely face
difficulty in classroom
transaction; take their
own initiative and the
support of their fellow
teachers if needed for
updating their
knowledge and
pedagogical skills;
school also extends
support in updating the
same.
25 Source: Shaala Siddhi. ‘School Standards and Evaluation Framework.’ http://shaalasiddhi.nuepa.org/pdf-doc/Framwork_English.pdf
43 State of Public (School) Education in Delhi
CORE STANDARD DESCRIPTOR
LEVEL 1 LEVEL 2 LEVEL 3
Planning for
Teaching
Teachers teach the
lesson as per the
textbook, with a focus on
completion of syllabus;
are aware of the topic to
be taught and teaching-
learning material to be
used in their teaching.
Teachers prepare and
maintain a diary with
detailed plan including
teaching and
assessment strategies
and TLM to be used;
prepare additional
teaching-learning
material using local
resources.
School has a culture
where every teacher
designs lessons as per the
varying learning needs of
learners and makes the
teaching learner centric;
uses TLMs appropriately;
connects teaching-
learning with immediate
context and environment;
plans appropriate
strategies such as
observation, exploration,
discovery, analysis, critical
reflection, problem-
solving and drawing
inferences to make
learning effective.
Enabling Learning
Environment
Teachers address
learners by name; make
basic resources available
for teaching-learning.
Teachers make all
learners comfortable
and involve them in
class activities; plan
and organize group
work/activities and
display learners’ work
and charts, etc. on the
wall; TLMs are
accessible to all.
Teachers create a
conducive and interactive
environment in the
classroom; encourage
peer learning/interaction;
provide opportunity for
expression; appreciate the
views of all learners;
encourage
questioning/sharing of
ideas.
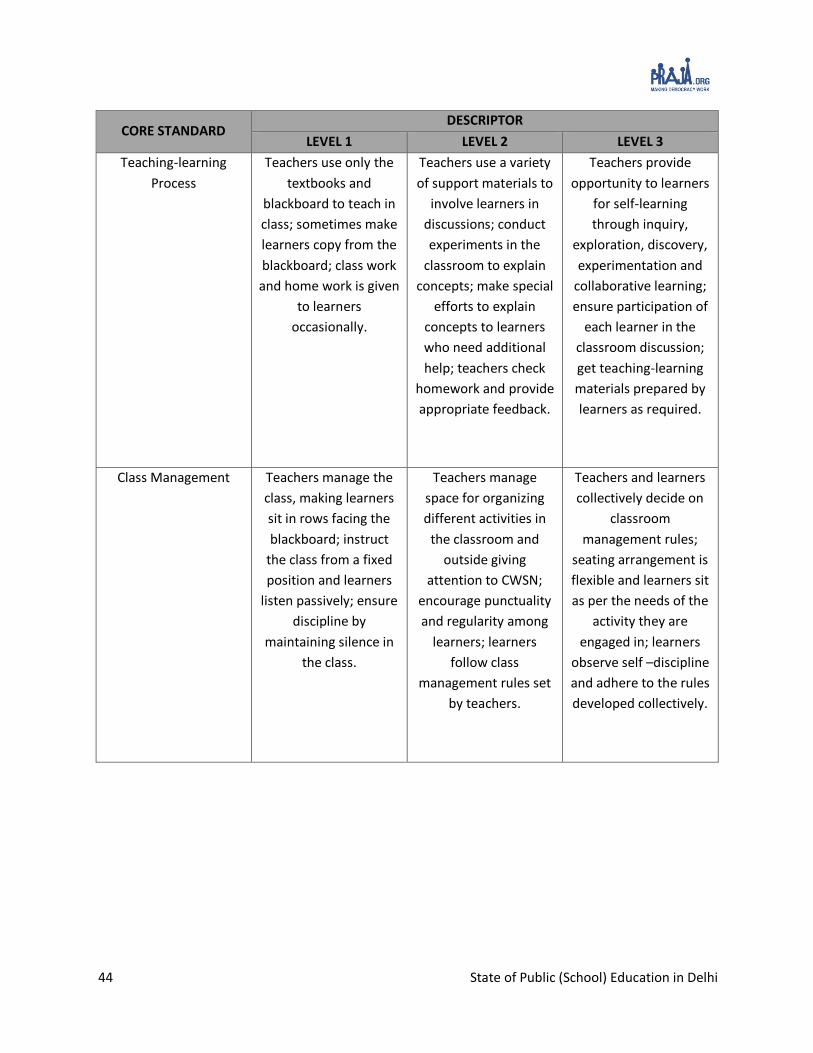
44 State of Public (School) Education in Delhi
CORE STANDARD DESCRIPTOR
LEVEL 1 LEVEL 2 LEVEL 3
Teaching-learning
Process
Teachers use only the
textbooks and
blackboard to teach in
class; sometimes make
learners copy from the
blackboard; class work
and home work is given
to learners
occasionally.
Teachers use a variety
of support materials to
involve learners in
discussions; conduct
experiments in the
classroom to explain
concepts; make special
efforts to explain
concepts to learners
who need additional
help; teachers check
homework and provide
appropriate feedback.
Teachers provide
opportunity to learners
for self-learning
through inquiry,
exploration, discovery,
experimentation and
collaborative learning;
ensure participation of
each learner in the
classroom discussion;
get teaching-learning
materials prepared by
learners as required.
Class Management
Teachers manage the
class, making learners
sit in rows facing the
blackboard; instruct
the class from a fixed
position and learners
listen passively; ensure
discipline by
maintaining silence in
the class.
Teachers manage
space for organizing
different activities in
the classroom and
outside giving
attention to CWSN;
encourage punctuality
and regularity among
learners; learners
follow class
management rules set
by teachers.
Teachers and learners
collectively decide on
classroom
management rules;
seating arrangement is
flexible and learners sit
as per the needs of the
activity they are
engaged in; learners
observe self –discipline
and adhere to the rules
developed collectively.

45 State of Public (School) Education in Delhi
CORE
STANDARD
DESCRIPTOR
LEVEL 1 LEVEL 2 LEVEL 3
Learners’
Assessment
Teachers assess learners
as per applicable policy;
generally, tests that are
given to assess rote
learning and factual
knowledge obtained from
the content and exercises
in the textbooks;
learners’ performance is
communicated to the
parents only through
report cards.
Teachers use a variety of
activities/ tasks to assess
all the curricular areas
including art, health and
physical education on set
criteria; provide
descriptive feedback
highlighting areas of
improvement in the
progress report card;
regularly interact with
parents to share learners’
progress.
Teachers consider
assessment as an integral
part of the teaching
learning process; analyse
the learners’ past
assessment records and
link it with the current
achievement levels; make
continuous assessment and
provide feedback on
progress and attainment;
assess other curricular
areas, including personal
and social qualities
systematically with follow
up measures for
improvement; use
feedback from assessment
to improve teaching-
learning.
Utilization of
Teaching-
learning
Resources
Teachers mainly use
textbooks for teaching in
the class; use other TLM,
which may be sporadic
and not planned for.
Teachers use other
resources in addition to
textbooks such as
reference materials,
charts, maps, models,
digital learning kits, local
resources; use science,
mathematics and
language kits/
laboratories, as and when
appropriate; school
maintains a catalogue of
resources and makes it
available to the teachers
as and when required.
Teachers integrate the use
of TLM, local community
resources, ICT support
material, laboratories,
library, etc. with the
lessons appropriately;
school facilitates
networking with other
schools for sharing
resources.

46 State of Public (School) Education in Delhi
CORE STANDARD DESCRIPTOR
LEVEL 1 LEVEL 2 LEVEL 3
Teachers’ Reflection on
their own Teaching-
learning Practice
Teachers occasionally
reflect on their
teaching-learning
practice and learners’
progress.
Teachers regularly
reflect on their
teaching-learning
practice and record the
same; revisit their
plans, teaching-
learning practice and
make efforts for
necessary
improvement.
Teachers reflect
individually and
collectively on the
planned and actual
teaching-learning
process in the light of
its outcomes; identify
the gaps between the
two and plan for
improvement; design
alternative learning
experiences based on
the reflection.

47 State of Public (School) Education in Delhi
Annexure 4 – Survey Methodology
Praja Foundation had commissioned the household survey to Hansa Research and the survey
methodology followed is as below:
In order to meet the desired objectives of the study, we represented the city by covering a sample
from each of its 272 wards. Target Group for the study was :
Both Males & Females
18 years and above
Belonging to that particular ward.
Sample quotas were set for representing gender and age groups on the basis of their split available
through Indian Readership Study (Large scale baseline study conducted nationally by Media Research
Users Council (MRUC) & Hansa Research group) for Mumbai Municipal Corporation Region.
The required information was collected through face to face interviews with the help of structured
questionnaire.
In order to meet the respondent within a ward, following sampling process was followed:
5 prominent areas in the ward were identified as the starting point
In each starting point about 20 individuals were selected randomly and the questionnaire was
administered with them.
Once the survey was completed, sample composition of age & gender was corrected to match the
population profile using the baseline data from IRS. This helped us to make the survey findings more
representatives in nature and ensured complete coverage.
The total study sample was 24,301
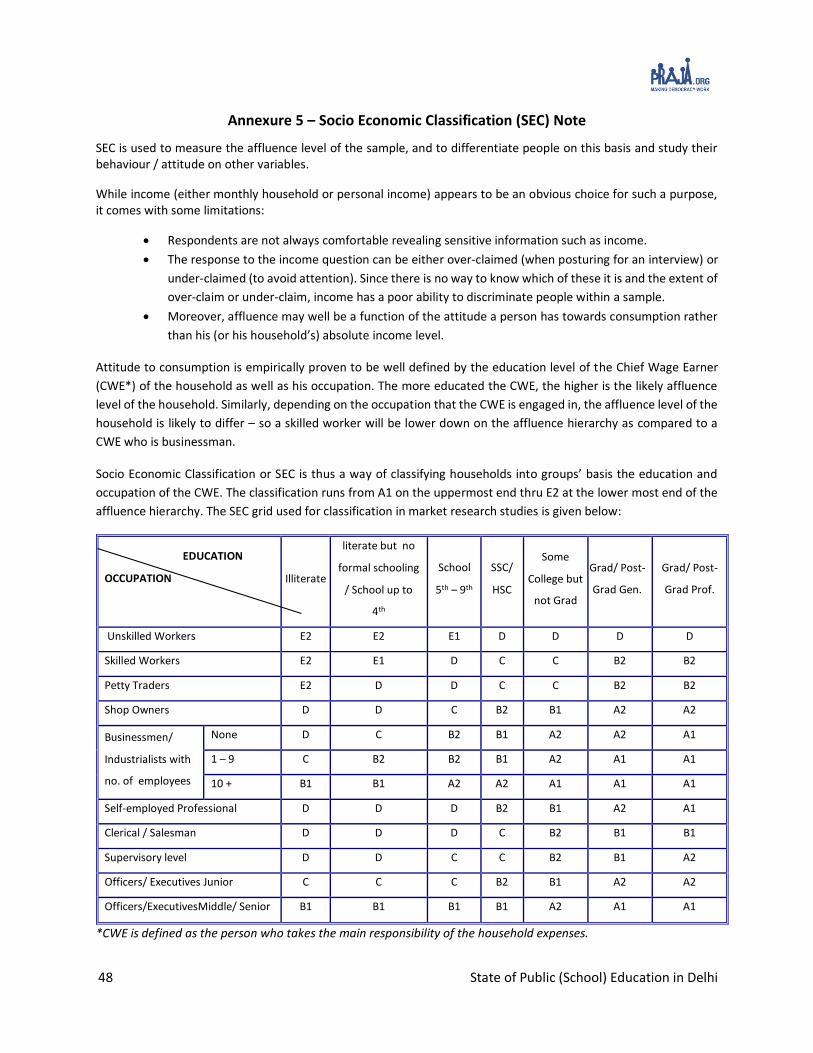
48 State of Public (School) Education in Delhi
Annexure 5 – Socio Economic Classification (SEC) Note
SEC is used to measure the affluence level of the sample, and to differentiate people on this basis and study their behaviour / attitude on other variables.
While income (either monthly household or personal income) appears to be an obvious choice for such a purpose, it comes with some limitations:
Respondents are not always comfortable revealing sensitive information such as income.
The response to the income question can be either over-claimed (when posturing for an interview) or
under-claimed (to avoid attention). Since there is no way to know which of these it is and the extent of
over-claim or under-claim, income has a poor ability to discriminate people within a sample.
Moreover, affluence may well be a function of the attitude a person has towards consumption rather
than his (or his household’s) absolute income level.
Attitude to consumption is empirically proven to be well defined by the education level of the Chief Wage Earner
(CWE*) of the household as well as his occupation. The more educated the CWE, the higher is the likely affluence
level of the household. Similarly, depending on the occupation that the CWE is engaged in, the affluence level of the
household is likely to differ – so a skilled worker will be lower down on the affluence hierarchy as compared to a
CWE who is businessman.
Socio Economic Classification or SEC is thus a way of classifying households into groups’ basis the education and
occupation of the CWE. The classification runs from A1 on the uppermost end thru E2 at the lower most end of the
affluence hierarchy. The SEC grid used for classification in market research studies is given below:
EDUCATION
OCCUPATION Illiterate
literate but no
formal schooling
/ School up to
4th
School
5th – 9th
SSC/
HSC
Some
College but
not Grad
Grad/ Post-
Grad Gen.
Grad/ Post-
Grad Prof.
Unskilled Workers E2 E2 E1 D D D D
Skilled Workers E2 E1 D C C B2 B2
Petty Traders E2 D D C C B2 B2
Shop Owners D D C B2 B1 A2 A2
Businessmen/
Industrialists with
no. of employees
None D C B2 B1 A2 A2 A1
1 – 9 C B2 B2 B1 A2 A1 A1
10 + B1 B1 A2 A2 A1 A1 A1
Self-employed Professional D D D B2 B1 A2 A1
Clerical / Salesman D D D C B2 B1 B1
Supervisory level D D C C B2 B1 A2
Officers/ Executives Junior C C C B2 B1 A2 A2
Officers/ExecutivesMiddle/ Senior B1 B1 B1 B1 A2 A1 A1
*CWE is defined as the person who takes the main responsibility of the household expenses.
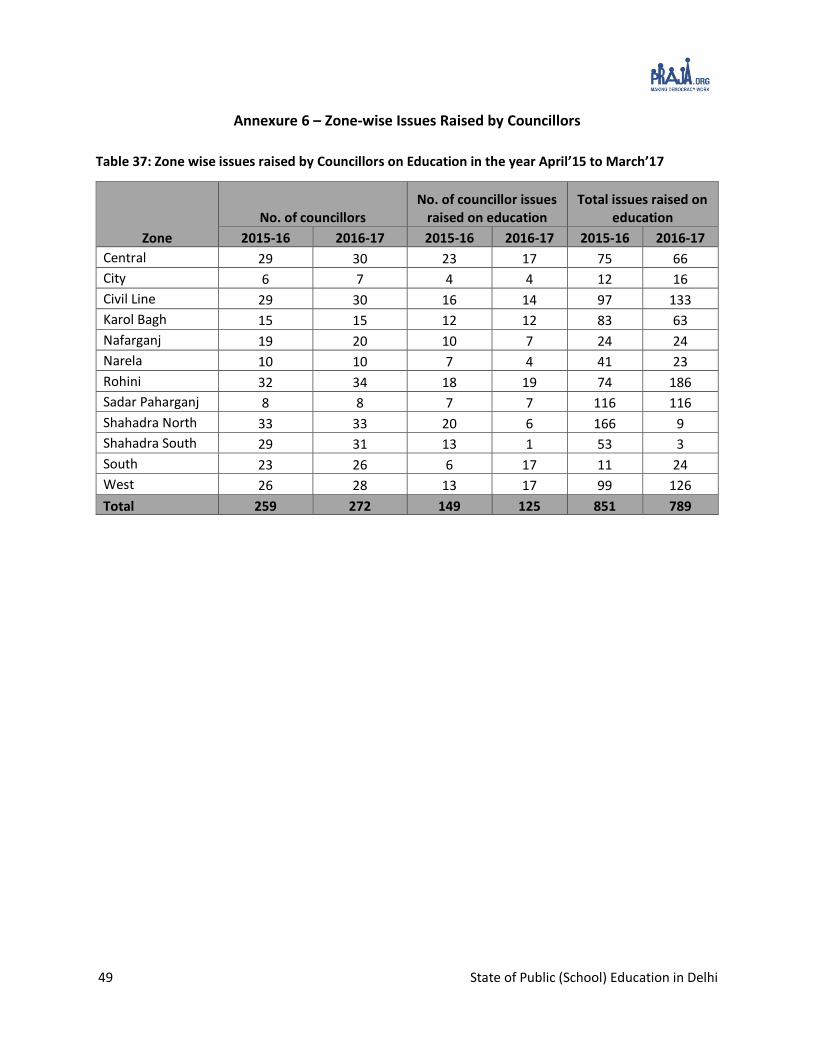
49 State of Public (School) Education in Delhi
Annexure 6 – Zone-wise Issues Raised by Councillors
Table 37: Zone wise issues raised by Councillors on Education in the year April’15 to March’17
Zone
No. of councillors No. of councillor issues
raised on education Total issues raised on
education
2015-16 2016-17 2015-16 2016-17 2015-16 2016-17
Central 29 30 23 17 75 66
City 6 7 4 4 12 16
Civil Line 29 30 16 14 97 133
Karol Bagh 15 15 12 12 83 63
Nafarganj 19 20 10 7 24 24
Narela 10 10 7 4 41 23
Rohini 32 34 18 19 74 186
Sadar Paharganj 8 8 7 7 116 116
Shahadra North 33 33 20 6 166 9
Shahadra South 29 31 13 1 53 3
South 23 26 6 17 11 24
West 26 28 13 17 99 126
Total 259 272 149 125 851 789

50 State of Public (School) Education in Delhi
Annexure 7 – Category wise number of issues raised by MLAs
Table 38: Category wise number of issues raised by MLAs on Education during 2015 & 2016
No. of issues raised
No. of MLAs
2015 2016
AAP BJP AAP BJP
0 28 0 25 0
1 6 0 17 0
2 to 5 17 2 14 0
Above 6 4 1 0 2
No. of MLAs 55 3 56 2
Total issues raised 75 12 57 21
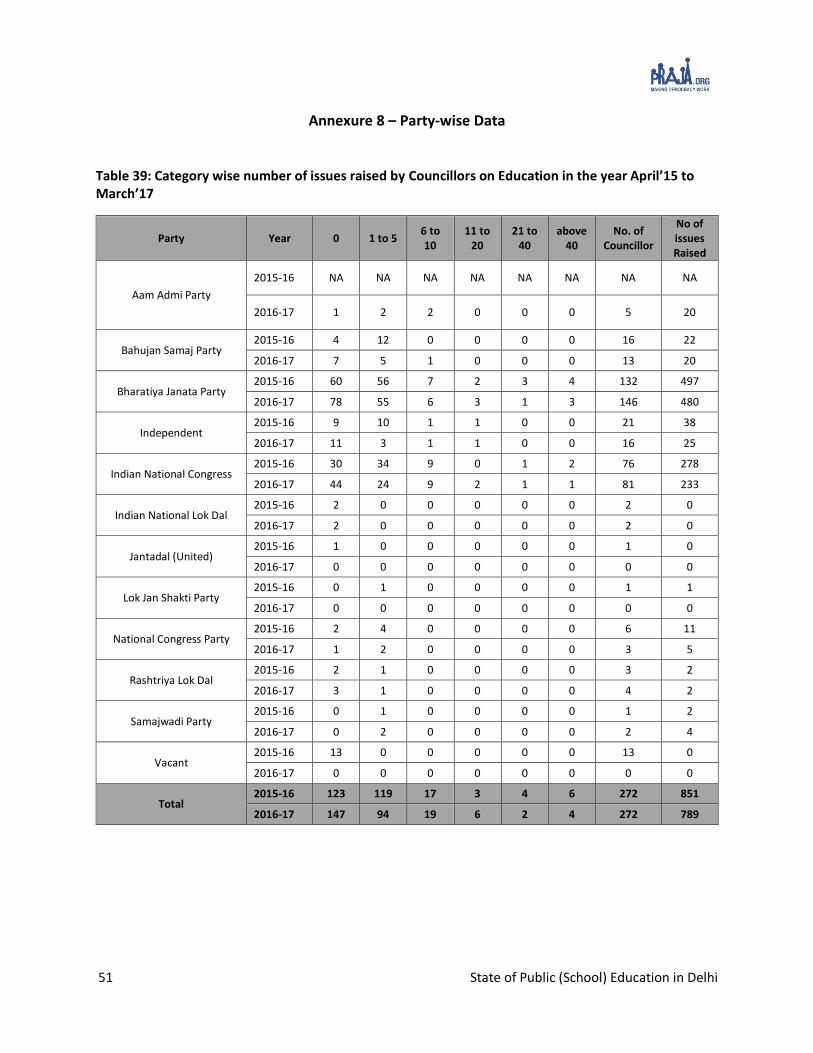
51 State of Public (School) Education in Delhi
Annexure 8 – Party-wise Data
Table 39: Category wise number of issues raised by Councillors on Education in the year April’15 to March’17
Party Year 0 1 to 5 6 to 10
11 to 20
21 to 40
above 40
No. of Councillor
No of issues Raised
Aam Admi Party
2015-16 NA NA NA NA NA NA NA NA
2016-17 1 2 2 0 0 0 5 20
Bahujan Samaj Party 2015-16 4 12 0 0 0 0 16 22
2016-17 7 5 1 0 0 0 13 20
Bharatiya Janata Party 2015-16 60 56 7 2 3 4 132 497
2016-17 78 55 6 3 1 3 146 480
Independent 2015-16 9 10 1 1 0 0 21 38
2016-17 11 3 1 1 0 0 16 25
Indian National Congress 2015-16 30 34 9 0 1 2 76 278
2016-17 44 24 9 2 1 1 81 233
Indian National Lok Dal 2015-16 2 0 0 0 0 0 2 0
2016-17 2 0 0 0 0 0 2 0
Jantadal (United) 2015-16 1 0 0 0 0 0 1 0
2016-17 0 0 0 0 0 0 0 0
Lok Jan Shakti Party 2015-16 0 1 0 0 0 0 1 1
2016-17 0 0 0 0 0 0 0 0
National Congress Party 2015-16 2 4 0 0 0 0 6 11
2016-17 1 2 0 0 0 0 3 5
Rashtriya Lok Dal 2015-16 2 1 0 0 0 0 3 2
2016-17 3 1 0 0 0 0 4 2
Samajwadi Party 2015-16 0 1 0 0 0 0 1 2
2016-17 0 2 0 0 0 0 2 4
Vacant 2015-16 13 0 0 0 0 0 13 0
2016-17 0 0 0 0 0 0 0 0
Total 2015-16 123 119 17 3 4 6 272 851
2016-17 147 94 19 6 2 4 272 789
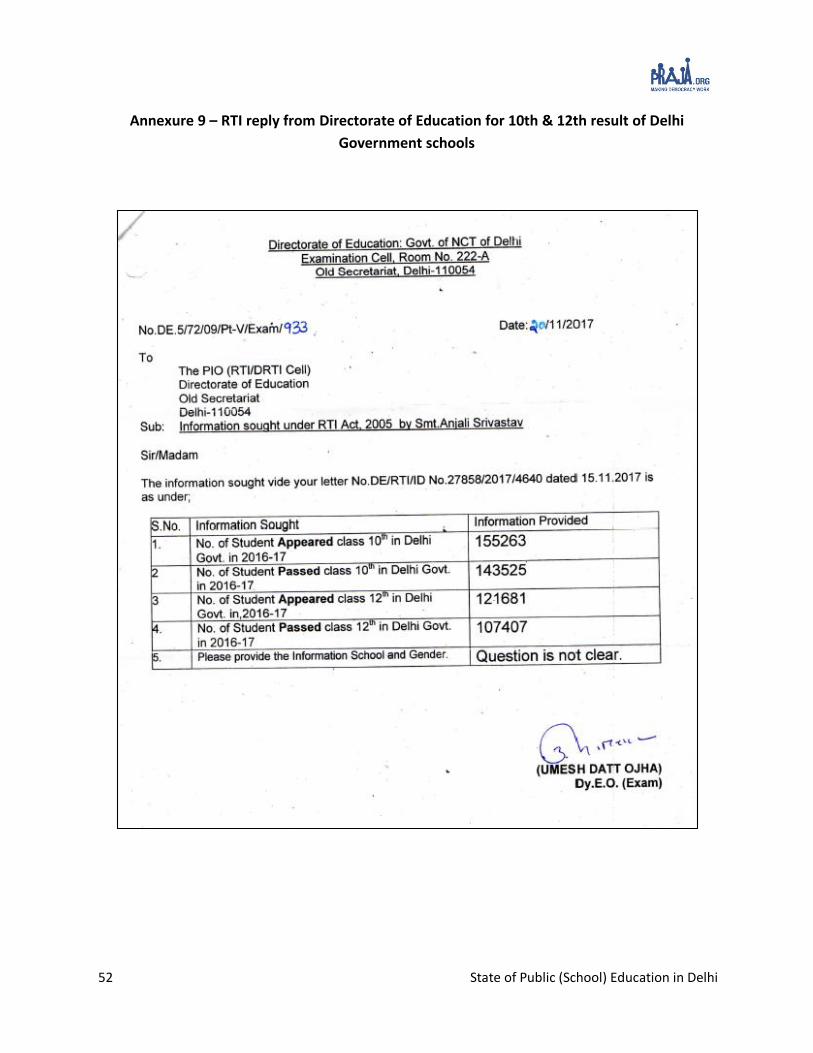
52 State of Public (School) Education in Delhi
Annexure 9 – RTI reply from Directorate of Education for 10th & 12th result of Delhi
Government schools
Top Related