


Languages
Pages
Legal

STANFORD MASS SPECTROMETRY STANFORD MASS SPECTROMETRY STANFORD MASS SPECTROMETRY STANFORD MASS SPECTROMETRY USERS’ MEETINGUSERS’ MEETING
Qualitative Mass Spectrometry for Elucidationfor Elucidation
of Natural & Synthetic Products
For personal use only.Please do not reuse or reproducewithout the author’s permission.
2
O iOverview
• General aspects of mass spectrometry
• Open Access Lab
• Example of Qualitative AnalysisExample of Qualitative Analysis
M S t tMass Spectrometry
• IonizationIonization• Ions are tractable
S iti it• Sensitivity • Destructive analytical method• Selective m/z (MS/MS)
Ionization
• The formation of ions is a critical part of every application of mass spectrometry
• Ion formation has to do with the energy required to produce an ion from a q pneutral molecule or the energy required to transfer pre-existing ions from a liquid p g qor a solid phase into the gas phase
– gas phase ion chemistrygas phase ion chemistryPhysical Review (1925-1930)
dIonization and Energy
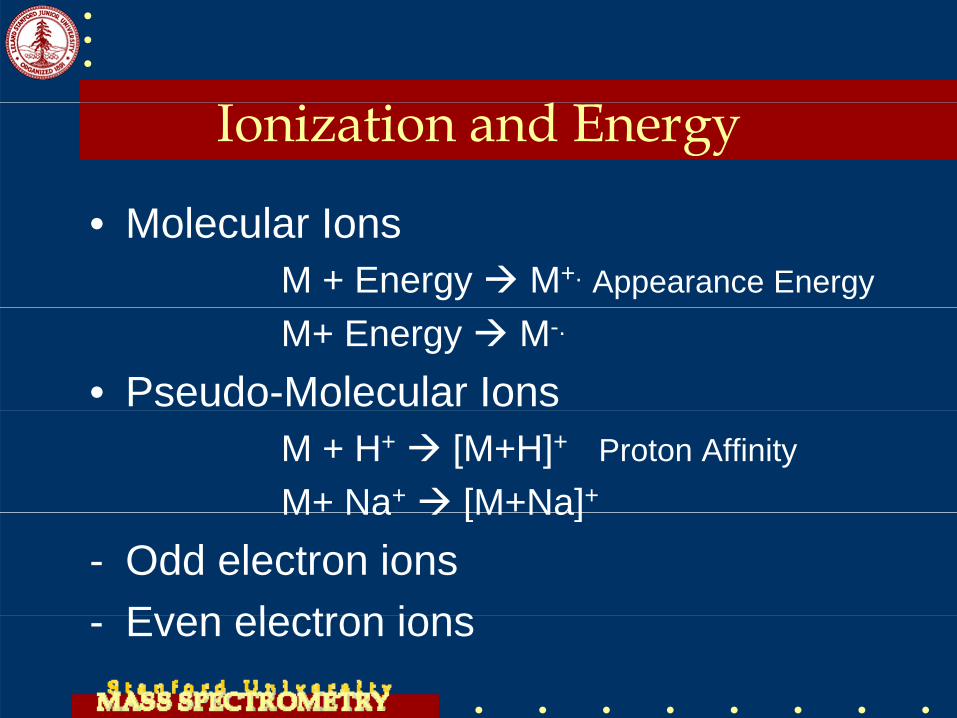
• Molecular IonsM + Energy M+. Appearance Energy
M+ Energy M-.
• Pseudo-Molecular IonsM + H+ [M+H]+ Proton Affinity
M+ Na+ [M+Na]+ M Na [M Na]- Odd electron ions
Even electron ions- Even electron ions
Ion Fragmentation
• Ion fragmentation has to do with the energy required to break particular chemical bonds that hold the ion together
• When the amount of energy transfer to the bond is controlled, specific bonds , pcan be broken and molecular structural information can be obtained
I S iIon Suppression
• Competition for either space or charge – Proton affinityy– Surface tension– Viscosity y
• Matrix effect• Media of synthetic reactions• Media of synthetic reactions
– Reactants, products, co-factors
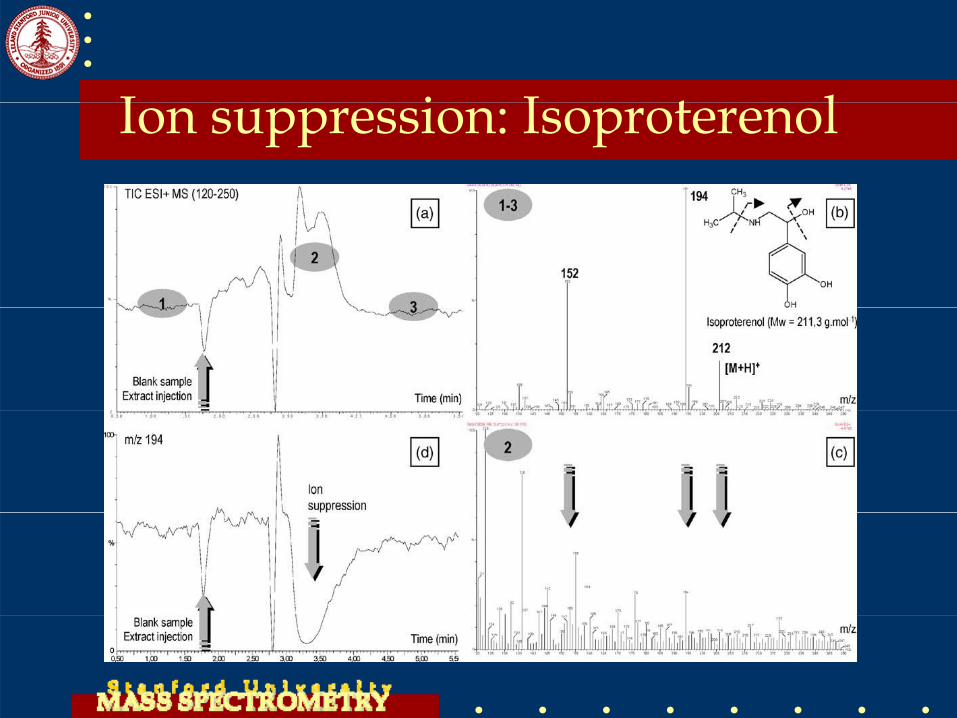
I i I t lIon suppression: Isoproterenol
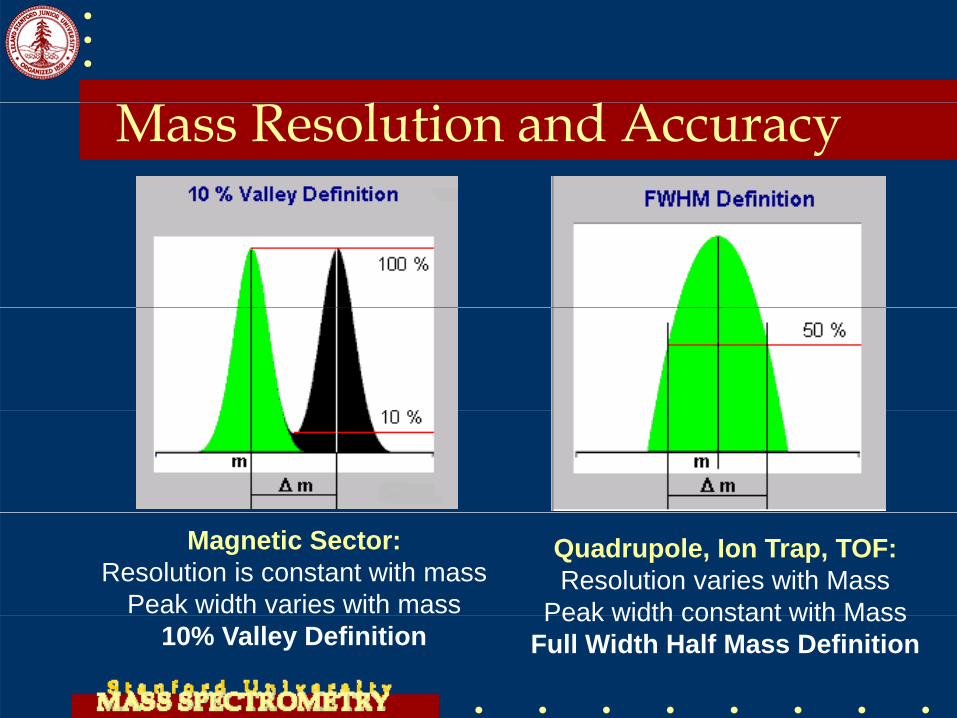
l dMass Resolution and Accuracy
Magnetic Sector:Resolution is constant with mass
Peak width varies with mass
Quadrupole, Ion Trap, TOF:Resolution varies with Mass
Peak width constant with Mass10% Valley Definition
Peak width constant with MassFull Width Half Mass Definition
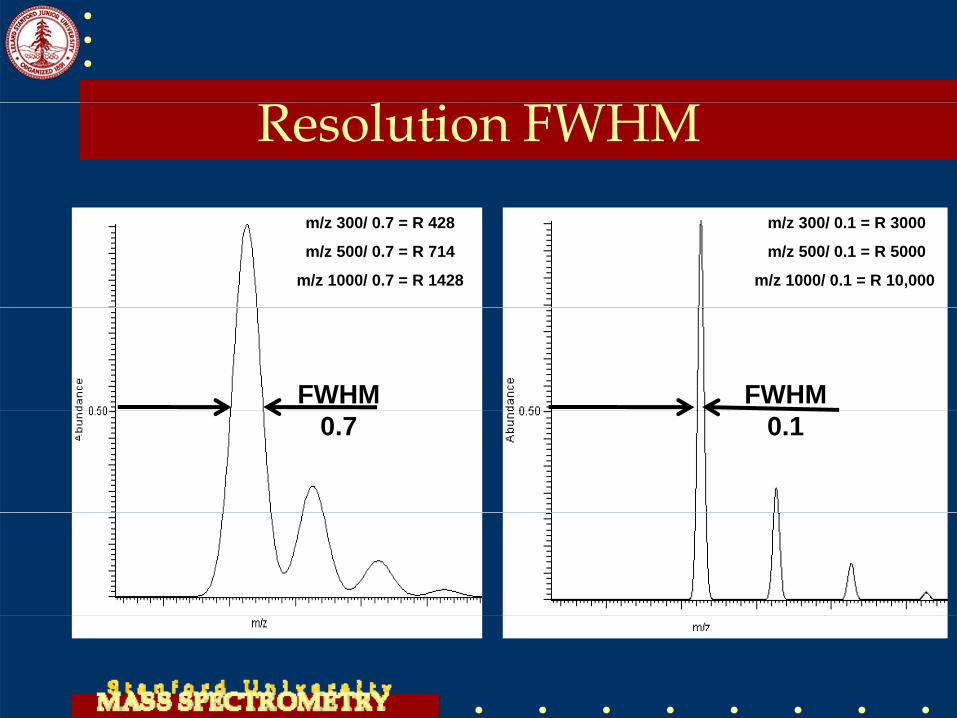
lResolution FWHMm/z 300/ 0.7 = R 428
m/z 500/ 0.7 = R 714
m/z 1000/ 0.7 = R 1428
m/z 300/ 0.1 = R 3000
m/z 500/ 0.1 = R 5000
m/z 1000/ 0.1 = R 10,000
FWHM FWHM0.7 0.1
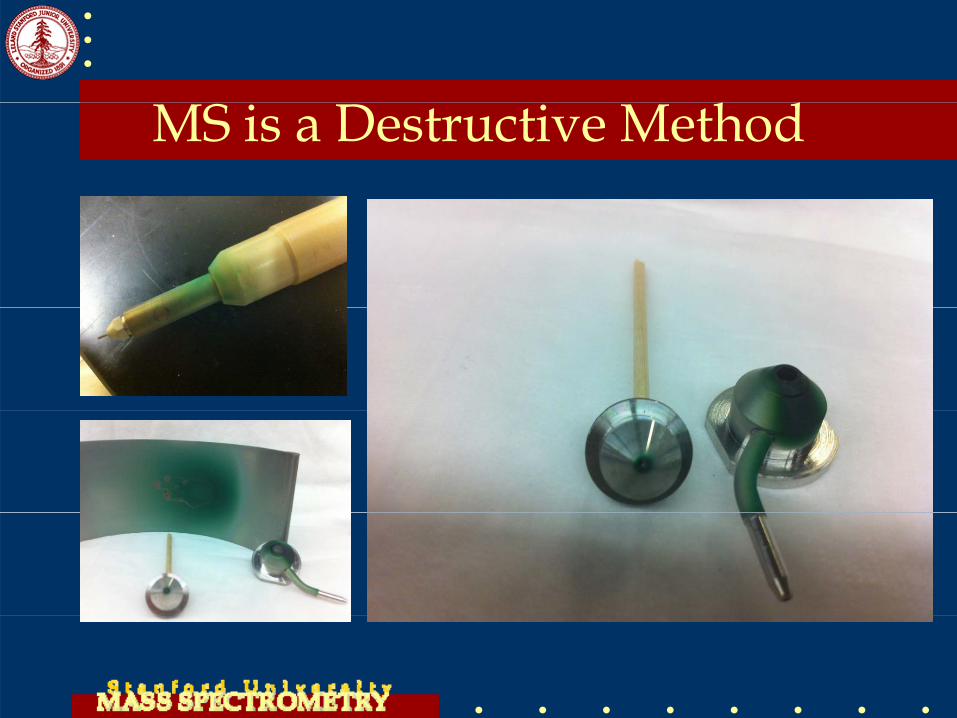
h dMS is a Destructive Method
Open Access LabOpen Access Lab
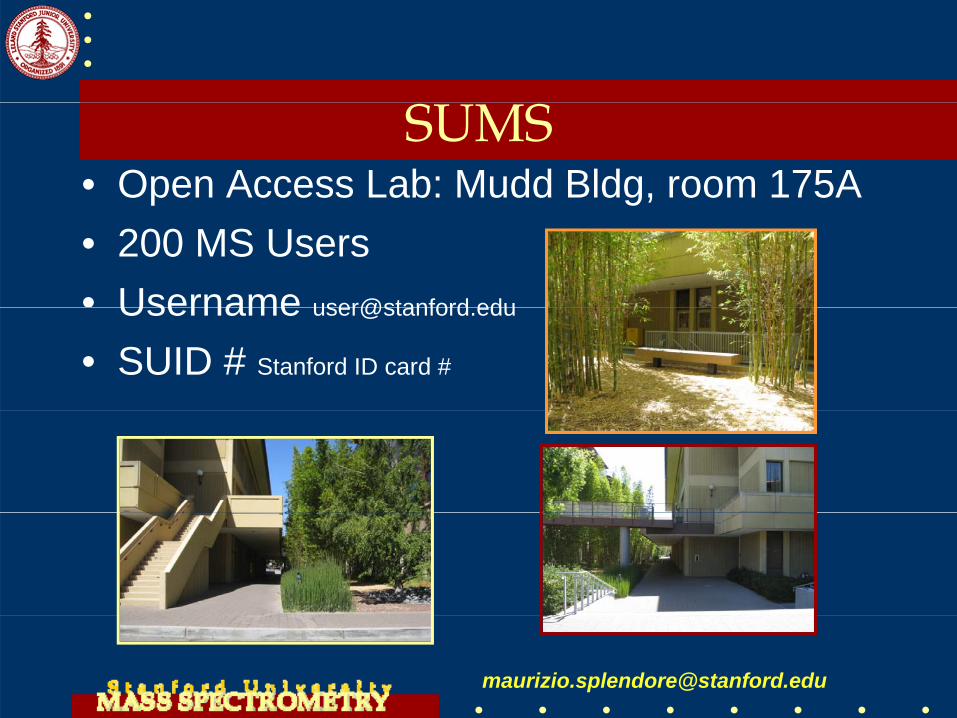
SUMS• Open Access Lab: Mudd Bldg, room 175Ap g• 200 MS Users• Username user@stanford eduUsername [email protected]
• SUID # Stanford ID card #
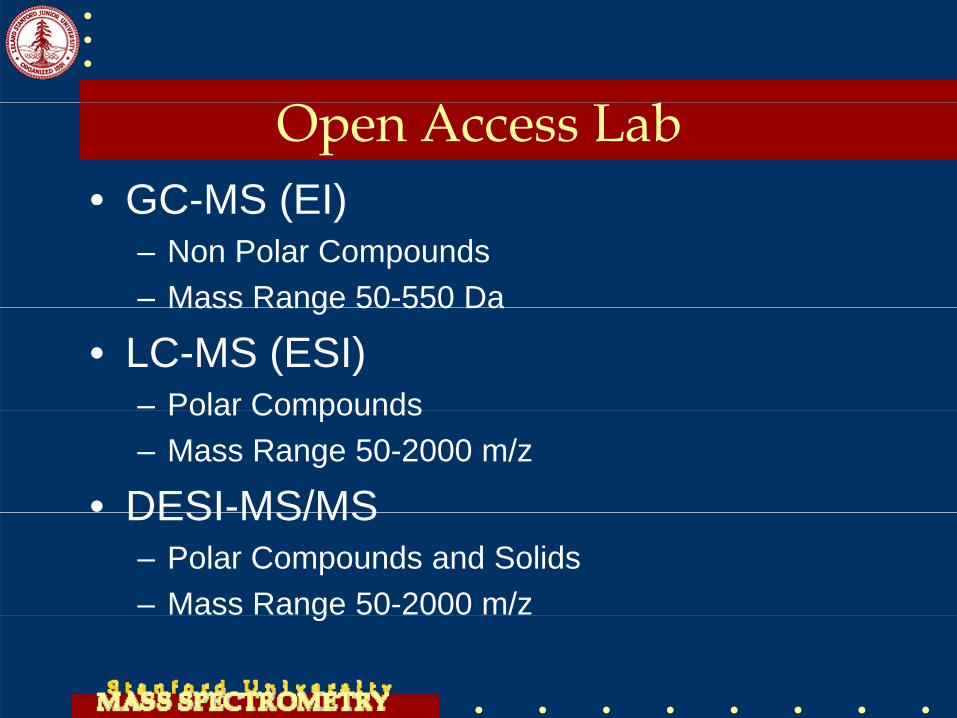
bOpen Access Lab • GC-MS (EI)GC MS (EI)
– Non Polar Compounds– Mass Range 50-550 DaMass Range 50 550 Da
• LC-MS (ESI)– Polar CompoundsPolar Compounds– Mass Range 50-2000 m/z
• DESI-MS/MSDESI MS/MS– Polar Compounds and Solids– Mass Range 50-2000 m/zg
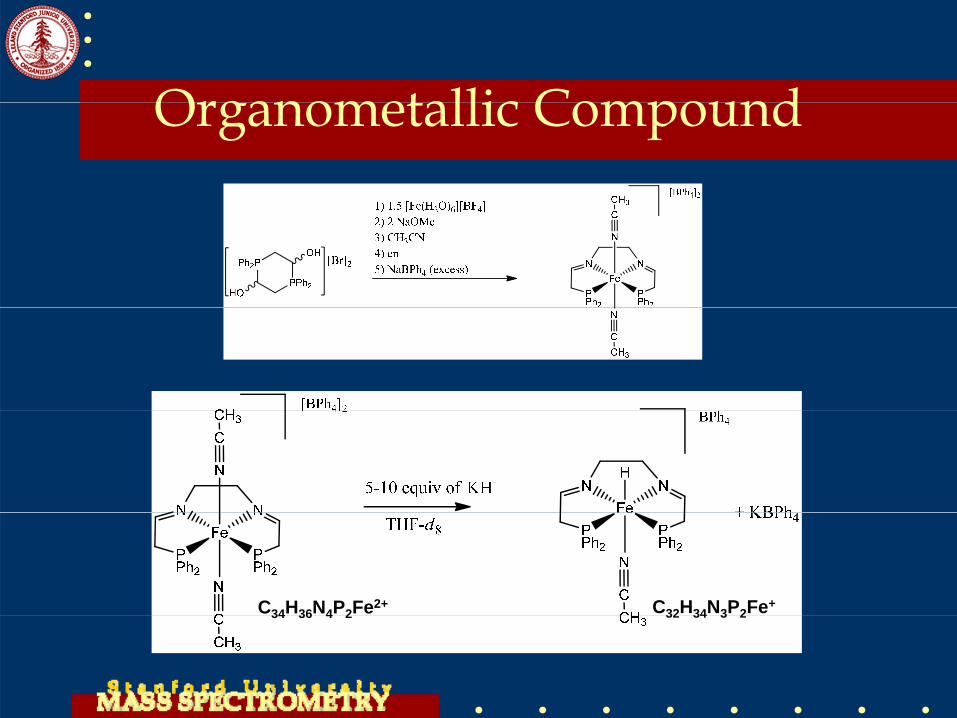
Organometallic CompoundOrganometallic Compound
C34H36N4P2Fe2+ C32H34N3P2Fe+34 36 4 2 32 34 3 2
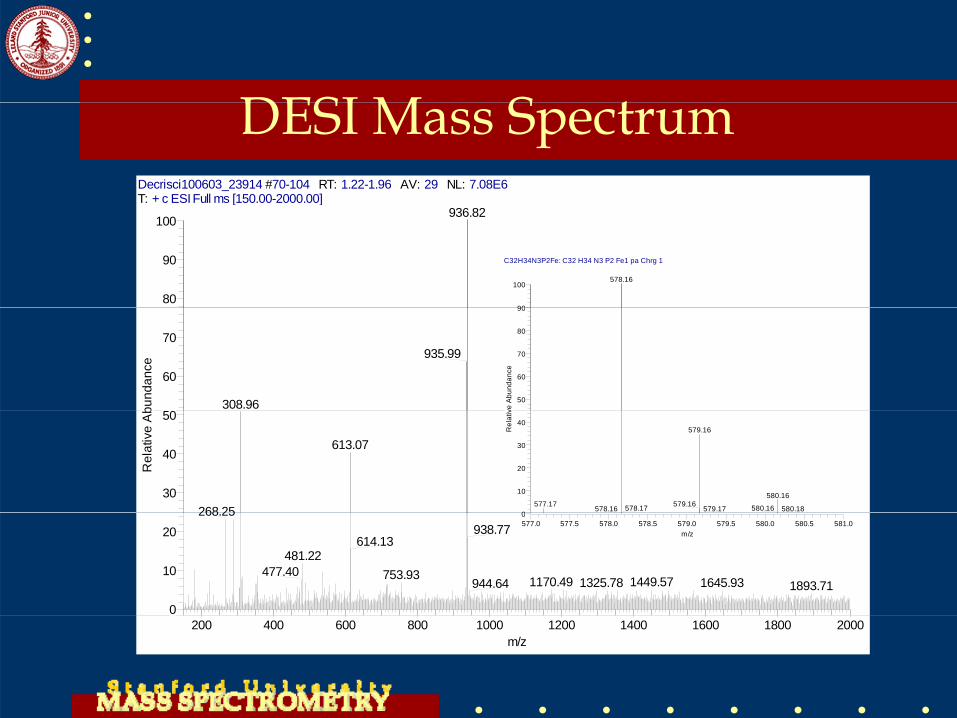
DESI M S tDESI Mass SpectrumDecrisci100603_23914 #70-104 RT: 1.22-1.96 AV: 29 NL: 7.08E6T: + c ESI Full ms [150.00-2000.00][ ]
80
90
100936.82
C32H34N3P2Fe: C32 H34 N3 P2 Fe1 pa Chrg 1
90
100578.16
60
70
bund
ance
935.99
308.96 50
60
70
80
90
ve A
bund
ance
30
40
50
Rel
ativ
e A
b
613.07
268 25 0
10
20
30
40
Rel
ativ
579.16
580.16579.16577.17 580.16578.17 579.17 580.18578.16
0
10
20268.25
938.77614.13
481.22477.40 753.93 1449.571170.49 1645.931325.78944.64 1893.71
577.0 577.5 578.0 578.5 579.0 579.5 580.0 580.5 581.0m/z
0
200 400 600 800 1000 1200 1400 1600 1800 2000m/z
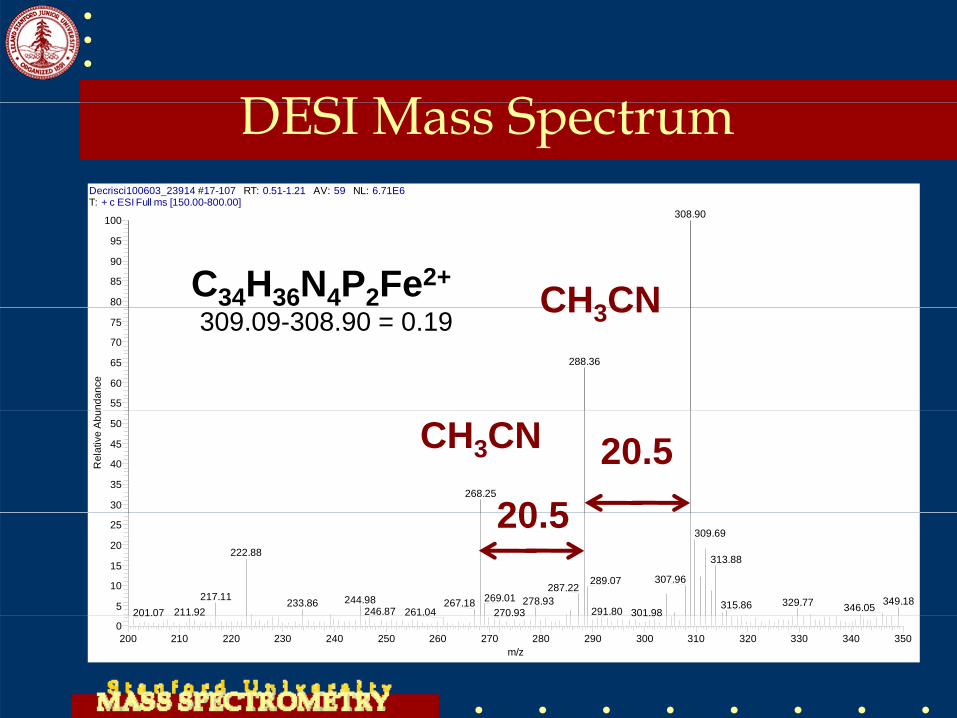
DESI M S tDecrisci100603_23914 #17-107 RT: 0.51-1.21 AV: 59 NL: 6.71E6T: + c ESI Full ms [150.00-800.00]
DESI Mass SpectrumT: c ESI Full ms [150.00 800.00]
80
85
90
95
100 308.90
C34H36N4P2Fe2+CH3CN
55
60
65
70
75
ndan
ce
288.36
309.09-308.90 = 0.19CH3CN
30
35
40
45
50
Rel
ativ
e A
bu
268.25
20.520 5
CH3CN
5
10
15
20
25309.69
222.88313.88
307.96289.07287.22
217.11 269.01244.98 349.18278.93 329.77267.18233.86 315.86 346.05246.87 291.80211.92 261.04201.07 301.98270.93
20.5
200 210 220 230 240 250 260 270 280 290 300 310 320 330 340 350m/z
0211.92 261.04201.07 301.98270.93
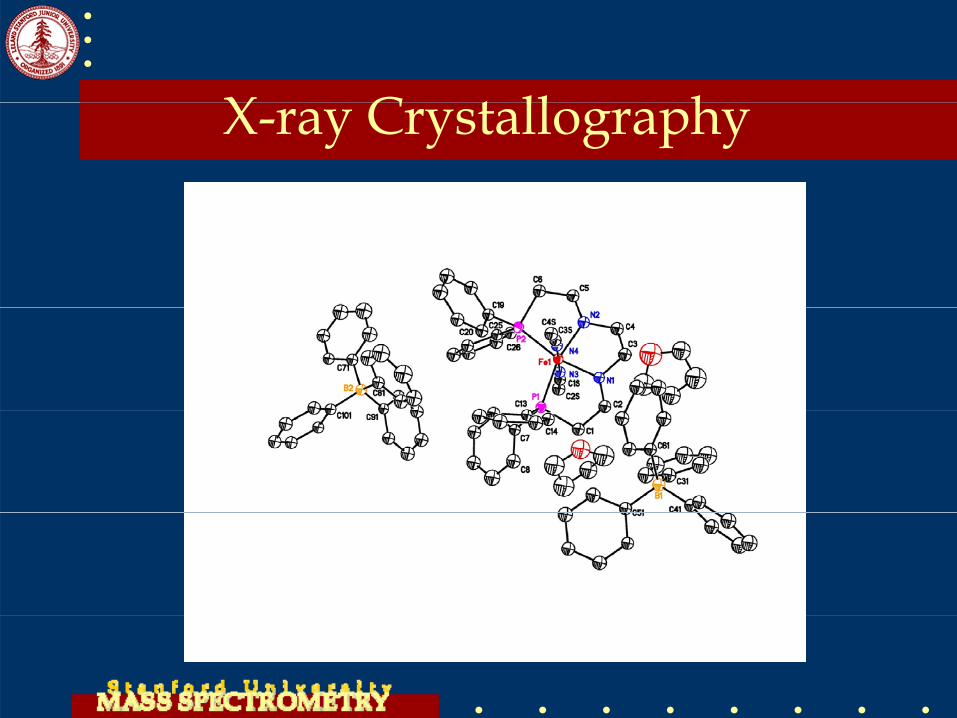
X C t ll hX-ray Crystallography
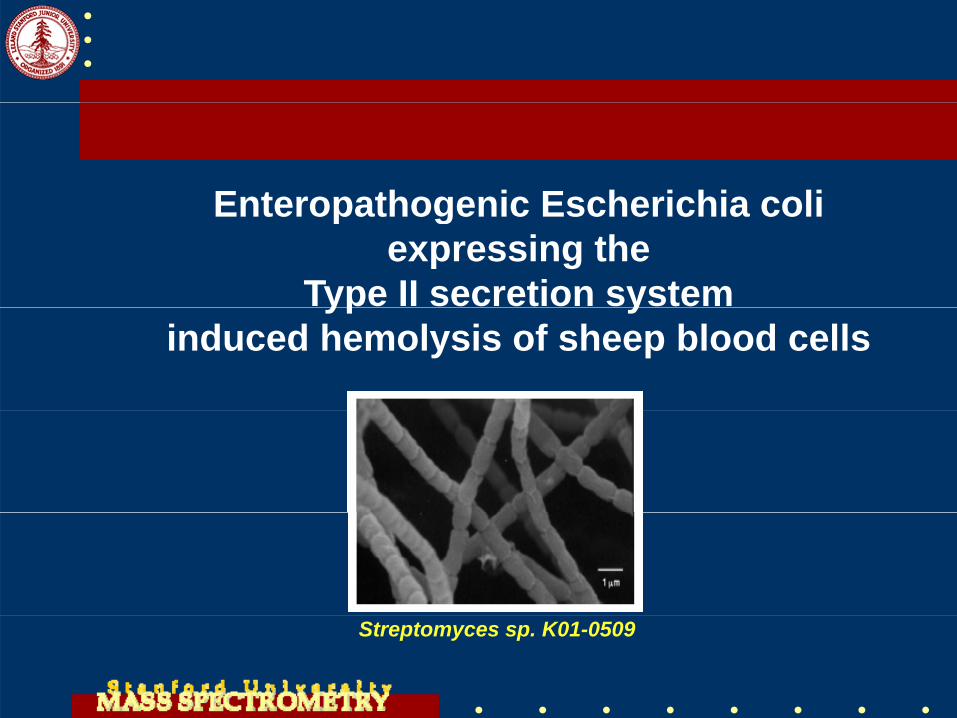
Enteropathogenic Escherichia coliEnteropathogenic Escherichia coli expressing the
Type II secretion systemyp yinduced hemolysis of sheep blood cells
Streptomyces sp. K01-0509
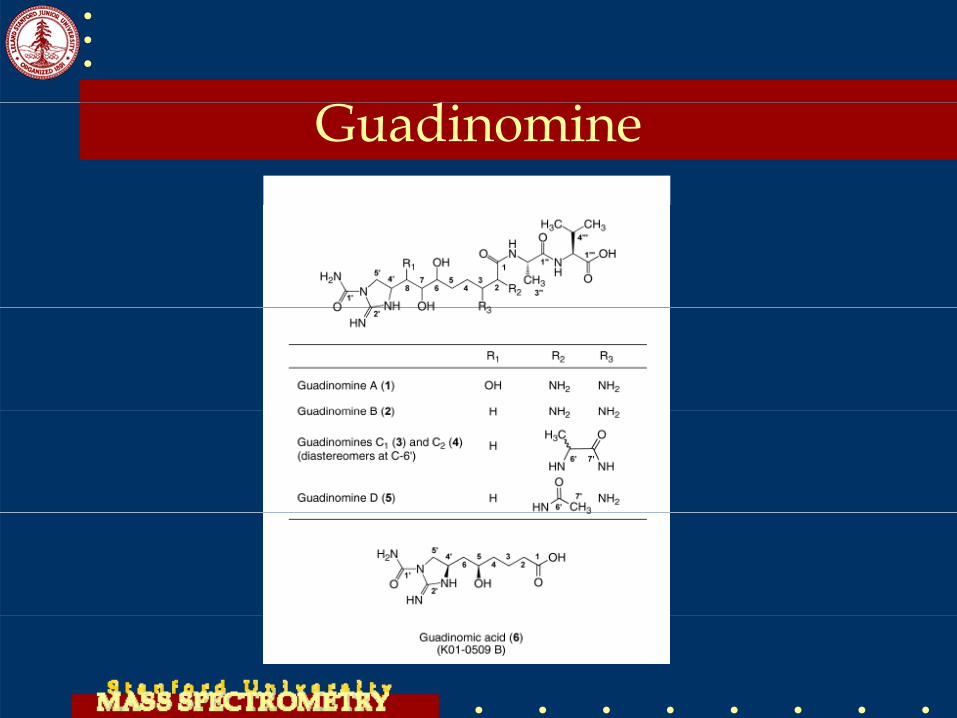
dGuadinomine
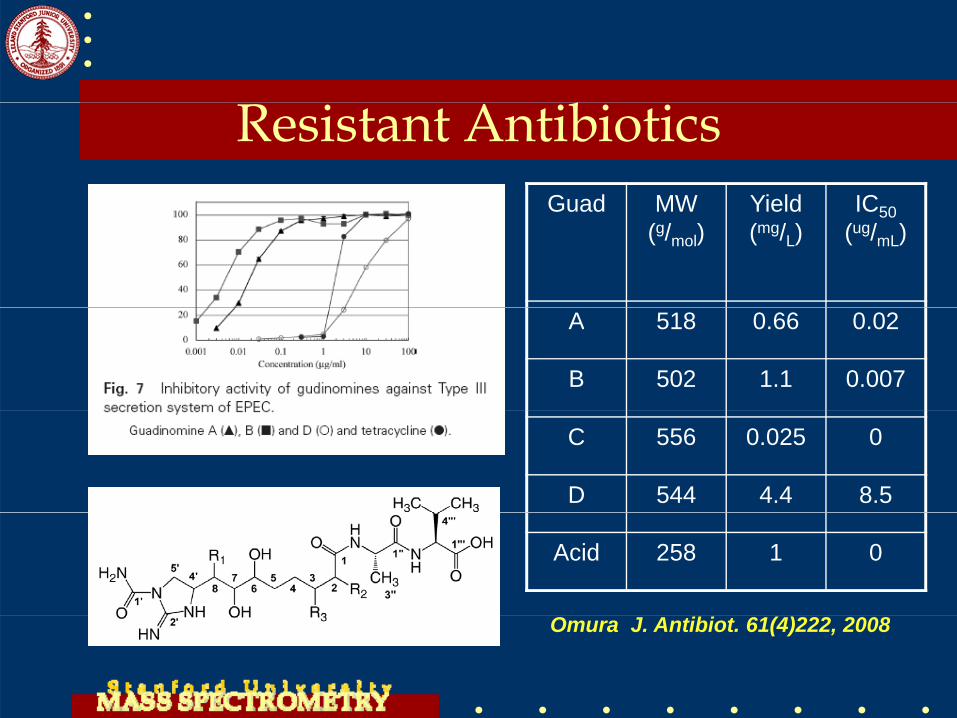
bResistant AntibioticsGuad MW Yield ICGuad MW
(g/mol)Yield (mg/L)
IC50(ug/mL)
A 518 0.66 0.02
B 502 1.1 0.007
C 556 0.025 0
D 544 4.4 8.5
Acid 258 1 0
Omura J. Antibiot. 61(4)222, 2008
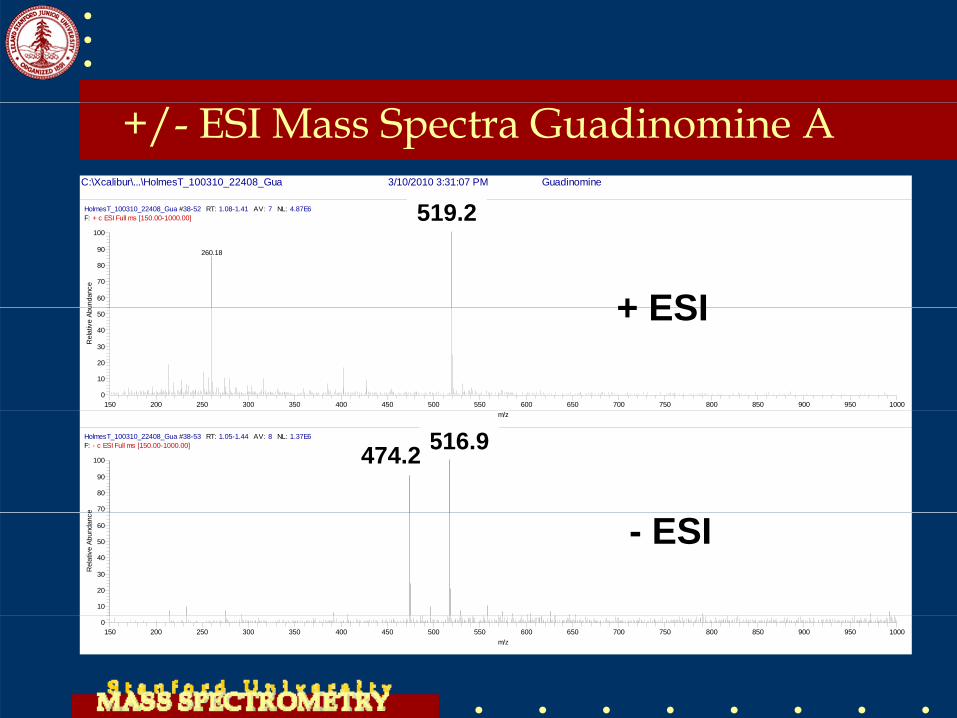
+/- ESI Mass Spectra Guadinomine A C:\Xcalibur\...\HolmesT_100310_22408_Gua 3/10/2010 3:31:07 PM Guadinomine
519 2HolmesT_100310_22408_Gua #38-52 RT: 1.08-1.41 AV: 7 NL: 4.87E6F: + c ESI Full ms [150.00-1000.00]
60
70
80
90
100
unda
nce
519.20
260.18
+ ESI
519.2
150 200 250 300 350 400 450 500 550 600 650 700 750 800 850 900 950 10000
10
20
30
40
50
Rel
ativ
e Ab
u + ESI
m/z
HolmesT_100310_22408_Gua #38-53 RT: 1.05-1.44 AV: 8 NL: 1.37E6F: - c ESI Full ms [150.00-1000.00]
70
80
90
100
e
516.91
474.22
516.9474.2
10
20
30
40
50
60
Rel
ativ
e Ab
unda
nce
- ESI
150 200 250 300 350 400 450 500 550 600 650 700 750 800 850 900 950 1000m/z
0
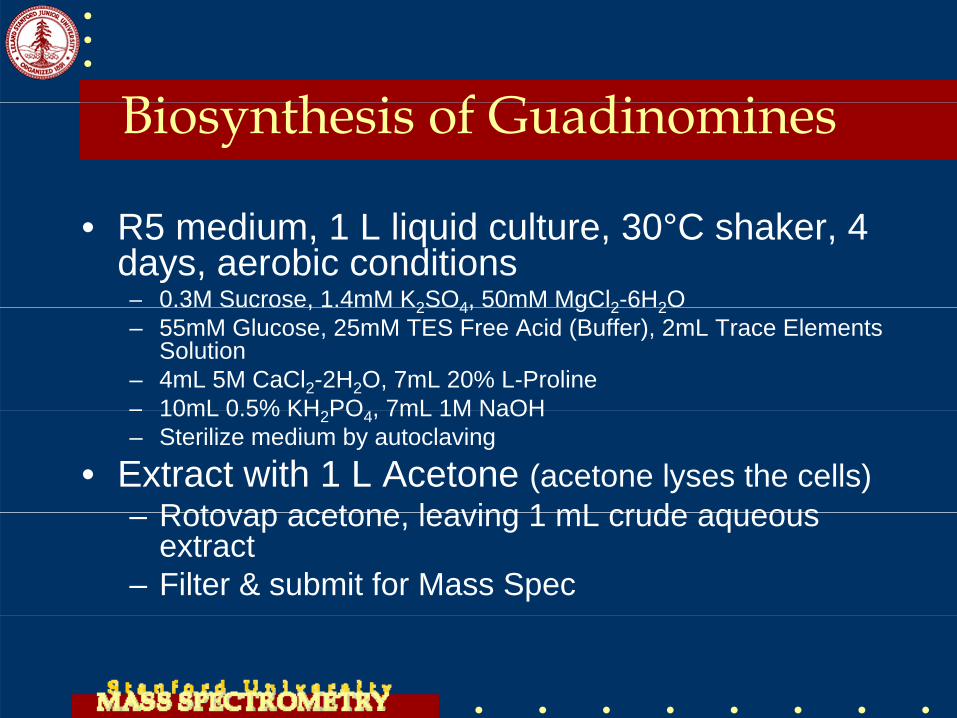
Bi th i f G di iBiosynthesis of Guadinomines
• R5 medium, 1 L liquid culture, 30°C shaker, 4 days, aerobic conditions– 0.3M Sucrose, 1.4mM K2SO4, 50mM MgCl2-6H2O, 2 4, g 2 2– 55mM Glucose, 25mM TES Free Acid (Buffer), 2mL Trace Elements
Solution– 4mL 5M CaCl2-2H2O, 7mL 20% L-Proline– 10mL 0 5% KH PO 7mL 1M NaOH– 10mL 0.5% KH2PO4, 7mL 1M NaOH– Sterilize medium by autoclaving
• Extract with 1 L Acetone (acetone lyses the cells)Rotovap acetone leaving 1 mL crude aqueous– Rotovap acetone, leaving 1 mL crude aqueous extract
– Filter & submit for Mass Spec
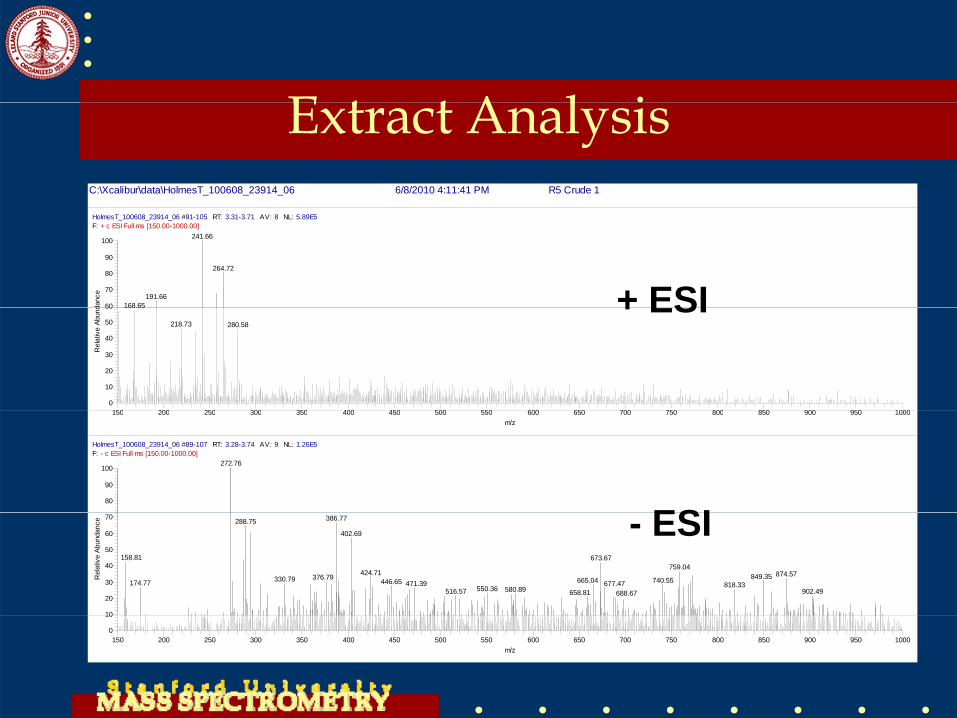
E t t A l iExtract AnalysisC:\Xcalibur\data\HolmesT_100608_23914_06 6/8/2010 4:11:41 PM R5 Crude 1
HolmesT_100608_23914_06 #91-105 RT: 3.31-3.71 AV: 8 NL: 5.89E5F: + c ESI Full ms [150.00-1000.00]
60
70
80
90
100
danc
e
241.66
264.72
191.66168.65 + ESI
150 200 250 300 350 400 450 500 550 600 650 700 750 800 850 900 950 10000
10
20
30
40
50
60
Rel
ativ
e Ab
und 168.65
218.73 280.58
+ ESI
150 200 250 300 350 400 450 500 550 600 650 700 750 800 850 900 950 1000m/z
HolmesT_100608_23914_06 #89-107 RT: 3.28-3.74 AV: 9 NL: 1.26E5F: - c ESI Full ms [150.00-1000.00]
80
90
100272.76
ESI
10
20
30
40
50
60
70
Rel
ativ
e Ab
unda
nce 386.77288.75
402.69
158.81 673.67759.04
424.71 874.57849.35376.79330.79 665.04 740.55446.65174.77 471.39 677.47 818.33550.36 580.89516.57 902.49658.81 688.67
- ESI
150 200 250 300 350 400 450 500 550 600 650 700 750 800 850 900 950 1000m/z
0
10
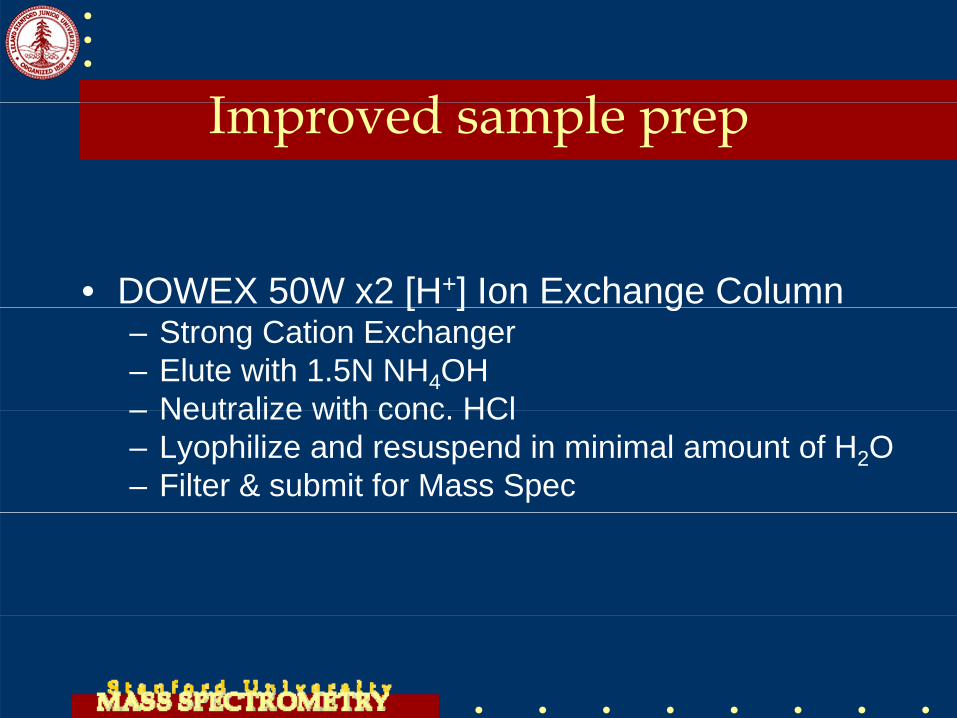
I d l Improved sample prep
• DOWEX 50W x2 [H+] Ion Exchange Column[ ] g– Strong Cation Exchanger– Elute with 1.5N NH4OH– Neutralize with conc HCl– Neutralize with conc. HCl– Lyophilize and resuspend in minimal amount of H2O– Filter & submit for Mass Spec
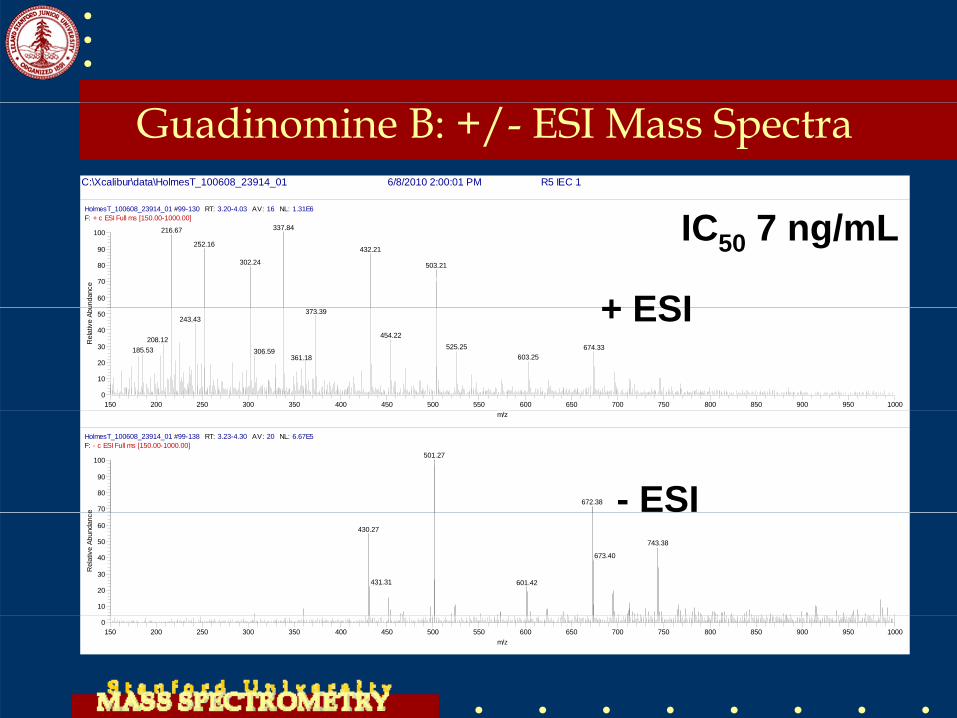
C:\Xcalibur\data\HolmesT_100608_23914_01 6/8/2010 2:00:01 PM R5 IEC 1
Guadinomine B: +/- ESI Mass Spectra
HolmesT_100608_23914_01 #99-130 RT: 3.20-4.03 AV: 16 NL: 1.31E6F: + c ESI Full ms [150.00-1000.00]
60
70
80
90
100
unda
nce
337.84216.67
252.16432.21
302.24 503.21
+ ESI
IC50 7 ng/mL
150 200 250 300 350 400 450 500 550 600 650 700 750 800 850 900 950 10000
10
20
30
40
50
Rel
ativ
e Ab
u
373.39243.43
454.22208.12525.25 674.33185.53 306.59
603.25361.18
+ ESI
m/z
HolmesT_100608_23914_01 #99-138 RT: 3.23-4.30 AV: 20 NL: 6.67E5F: - c ESI Full ms [150.00-1000.00]
70
80
90
100
e
501.27
672.38 - ESI
10
20
30
40
50
60
Rel
ativ
e Ab
unda
nce
430.27
743.38
673.40
431.31 601.42
150 200 250 300 350 400 450 500 550 600 650 700 750 800 850 900 950 1000m/z
0
k l dAcknowledgementsAlli Chi Vi t & St ll C t• Allis Chien
• Karolina Krasinska• Ludmila Alexandrova
• Vincent & Stella Coates Foundation
• Pavel Aronov• Chris Adams• Richard Zare• Richard Perry• Robert Waymouth• Antonio De Crisci• Chaitan Khosla• Tracy Holmes II
Top Related