Languages
Pages
Legal

Spotting Opportunities in the FX Market
Presented by Toni Hansenhttp://www.TradingFromMainStreet.com
Sponsored by
For the sake of simplicity, the examples that follow do not take into consideration commissions and other transaction fees, tax considerations, or margin requirements, which are factors that may significantly affect the economic consequences of a given strategy. An investor should review transaction costs, margin requirements and tax considerations with a broker and tax advisor before entering into any options strategy.
Options involve risk and are not suitable for everyone. Prior to buying or selling an option, a person must receive a copy of CHARACTERISTICS AND RISKS OF STANDARDIZED OPTIONS. Copies have been provided for you today and may be obtained from your broker, one of the exchanges or The Options Clearing Corporation. A prospectus, which discusses the role of The Options Clearing Corporation, is also available, without charge, upon request at 1-888-OPTIONS or www.888options.com.
Any strategies discussed, including examples using actual securities price data, are strictly for illustrative and educational purposes and are not to be construed as an endorsement, recommendation or solicitation to buy or sell securities.
Copyright 2008 © Toni Hansen & The Bastiat Group, Inc. All rights reserved. Terms of use apply. Reproduction, adaptation, distribution, public display, exhibition for profit, or storage in any electronic storage media in whole or in part is prohibited under penalty of law.
Disclaimer: The Bastiat Group, Inc., the holding company for ToniHansen.com, Swingtrader.net and TradingFromMainStreet.com does not make solicitations, recommendations or offers to buy or sell any security or investment. The Bastiat Group, Inc. does not advocate the purchase or sale of any security or investment. The information provided by The Bastiat Group, Inc. should not be construed as investment, financial, tax or legal advice. The Bastiat Group, Inc. is not a registered investment advisor, commodity trading advisor, broker or broker dealer. Trading in securities may not be suitable for all individuals. The Bastiat Group, Inc. and its members, employees, agents, consultants, analysts, representatives, content and/or service providers, affiliates, subsidiaries, successors and assigns (hereinafter collectively, “The Bastiat Indemnities") assume no responsibility or liability for your trading and investment results. Prior to the execution of any securities trade, you should always consult with your broker or other financial advisor. There is a very high degree of risk involved in trading securities. Past results are not indicative of future returns.
Disclaimer and Terms of Use:

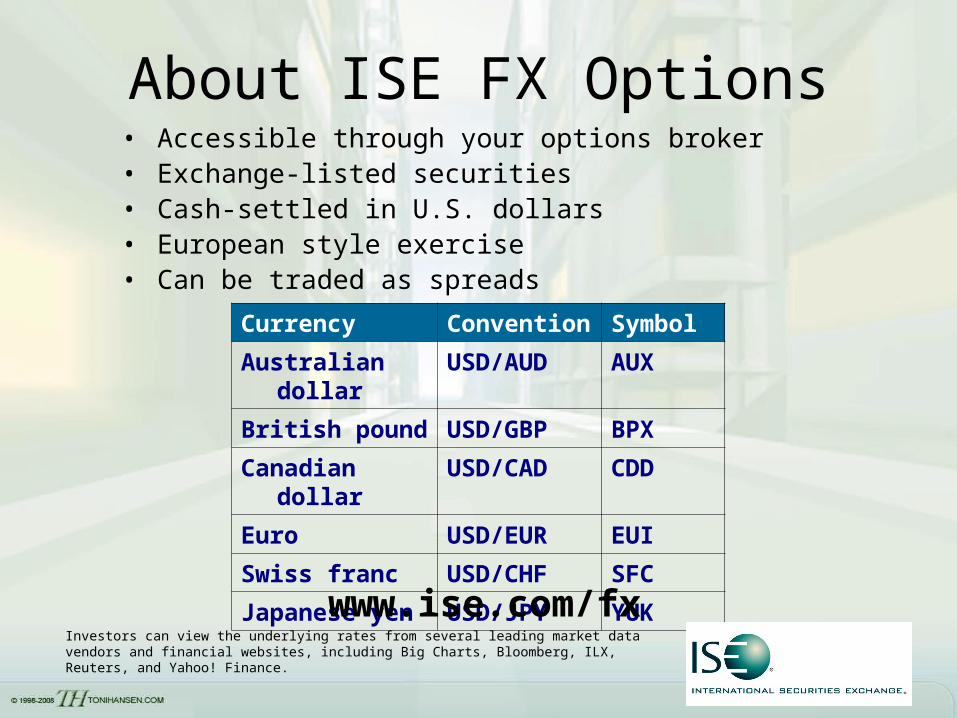
About ISE FX Options• Accessible through your options broker• Exchange-listed securities • Cash-settled in U.S. dollars • European style exercise• Can be traded as spreads
Currency Convention
Symbol
Australian dollar
USD/AUD AUX
British pound USD/GBP BPX
Canadian dollar
USD/CAD CDD
Euro USD/EUR EUI
Swiss franc USD/CHF SFC
Japanese yen USD/JPY YUKwww.ise.com/fx
Investors can view the underlying rates from several leading market data vendors and financial websites, including Big Charts, Bloomberg, ILX, Reuters, and Yahoo! Finance.
Time Frame Analysis
In order to succeed in any market arena, you must have a firm understanding of how the time frame upon which you are focusing your efforts plays a role in determining your success in any position.
Toni’s Building Blocks
Support/Resistance Levels
Pace (aka Momentum)
Trend Development
Support & Resistance
Support & Resistance levels are price zones in the market where a security is liable to react in some manner that affects the trend which is in play as the support or resistance level hits.
Support & Resistance
Support & Resistance levels must be thought of as zones and not exact price levels.
Support & Resistance
Two Main Types of Support & Resistance used in technical analysis:
Prior highs or lows Prior zones of congestion
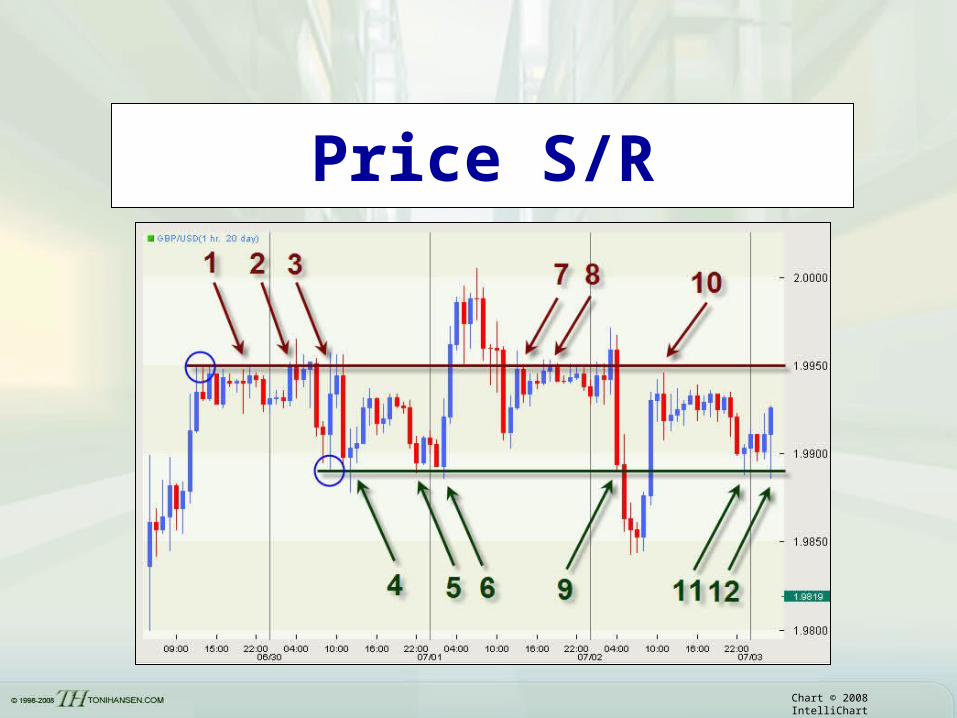
Price S/R
Chart © 2008 IntelliChart
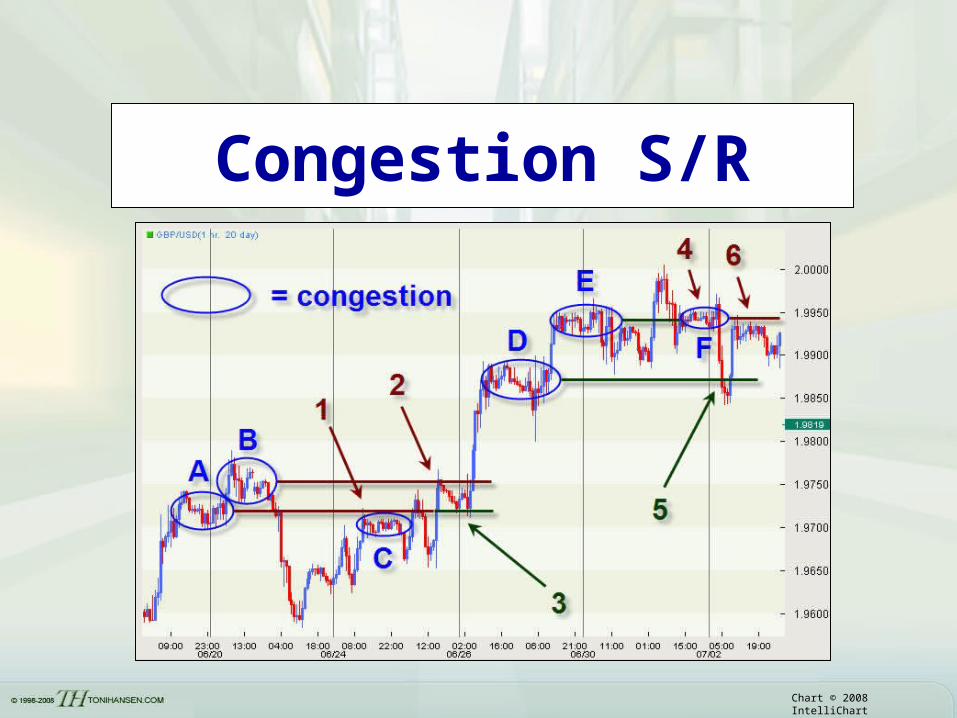
Congestion S/R
Chart © 2008 IntelliChart
Pace / Momentum
Pace is a measurement of the momentum of a trend move in a security as compared to not only the average move, but also the most recent move on a given time frame.
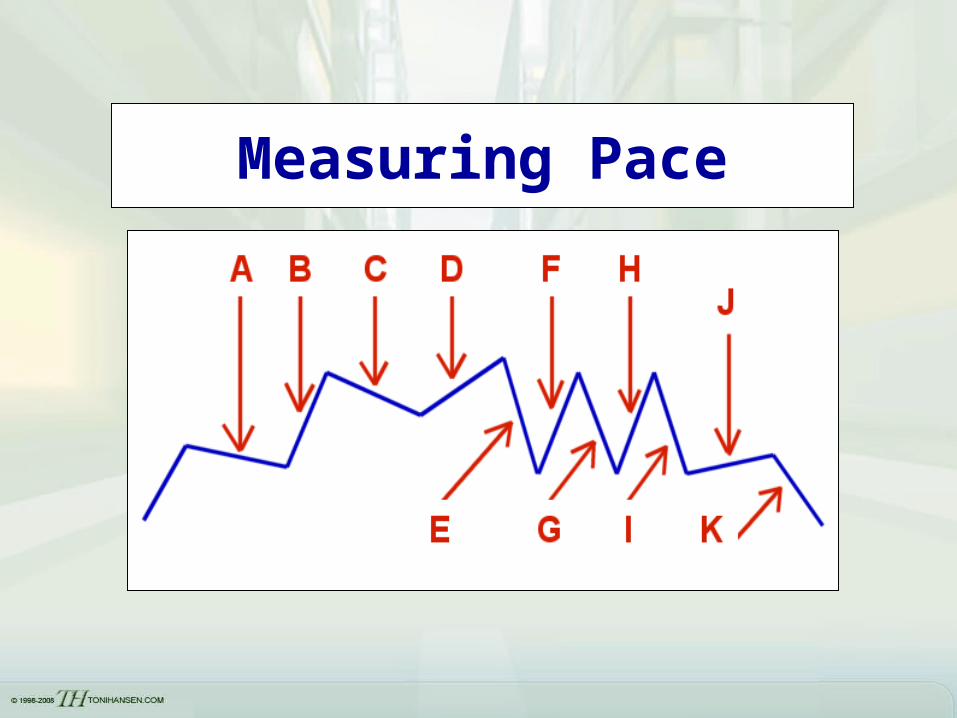
Measuring Pace
Pace / Momentum
Slower than average moves will often lead to continuations of the prior trend (A-B in pace chart).
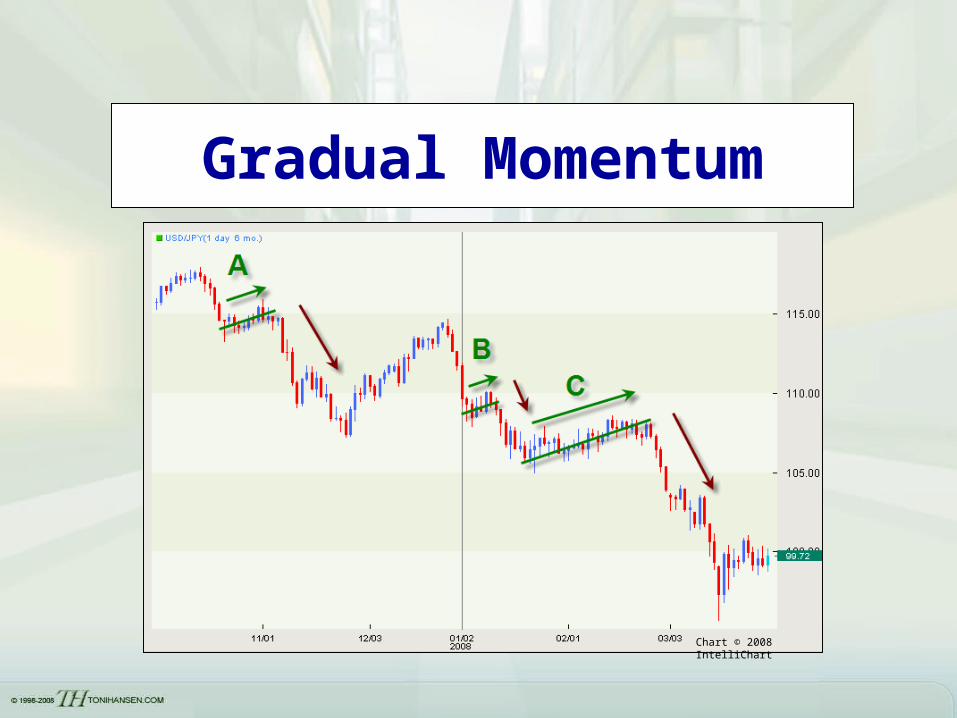
Gradual Momentum
Chart © 2008 IntelliChart
Pace / Momentum
Stronger than average moves will tend to correct more slowly, by either basing or pulling back gradually (B-C in pace chart). They can also correct by rounding off at highs or lows in order to shift the momentum.
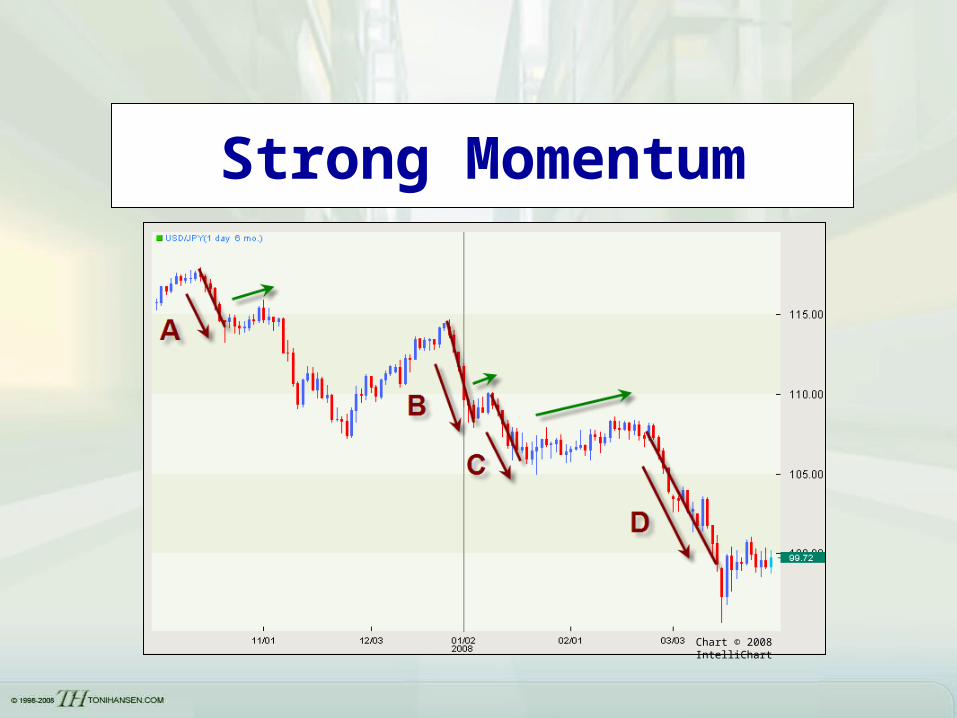
Strong Momentum
Chart © 2008 IntelliChart
Pace / Momentum
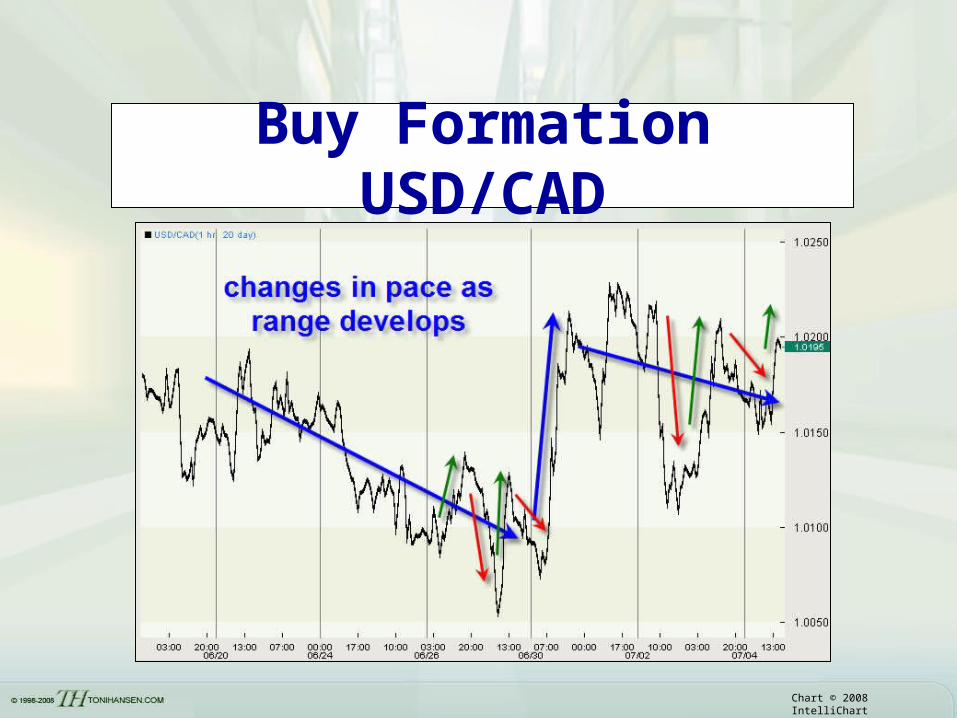
Comparable moves back and forth will usually create trading ranges until the momentum within the range shifts once again (E-J in pace chart).
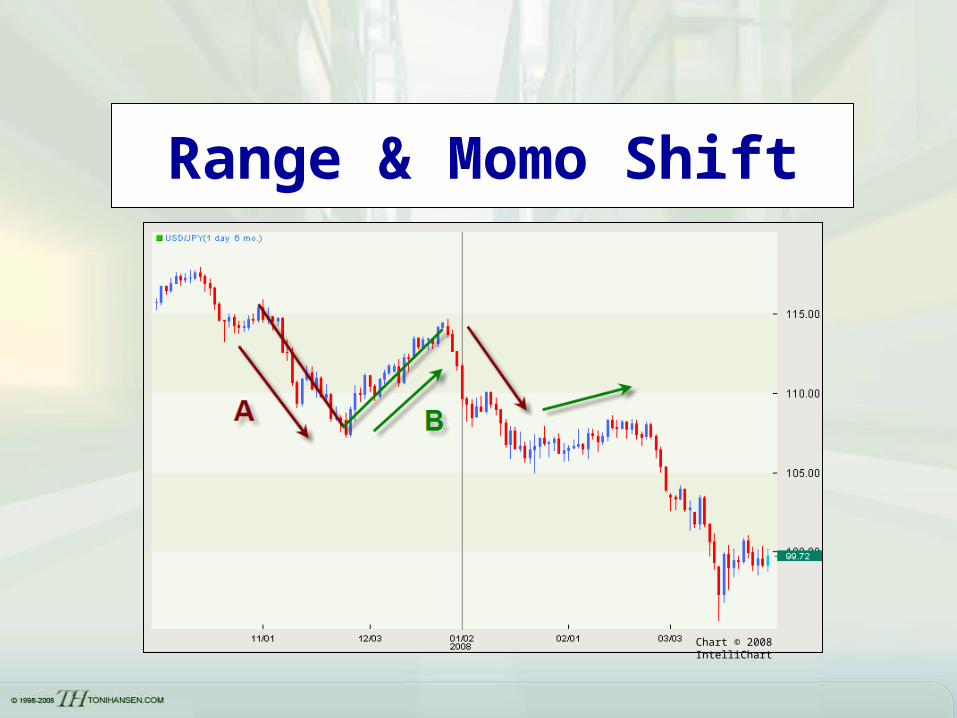
Range & Momo Shift
Chart © 2008 IntelliChart
The Nature of Trends
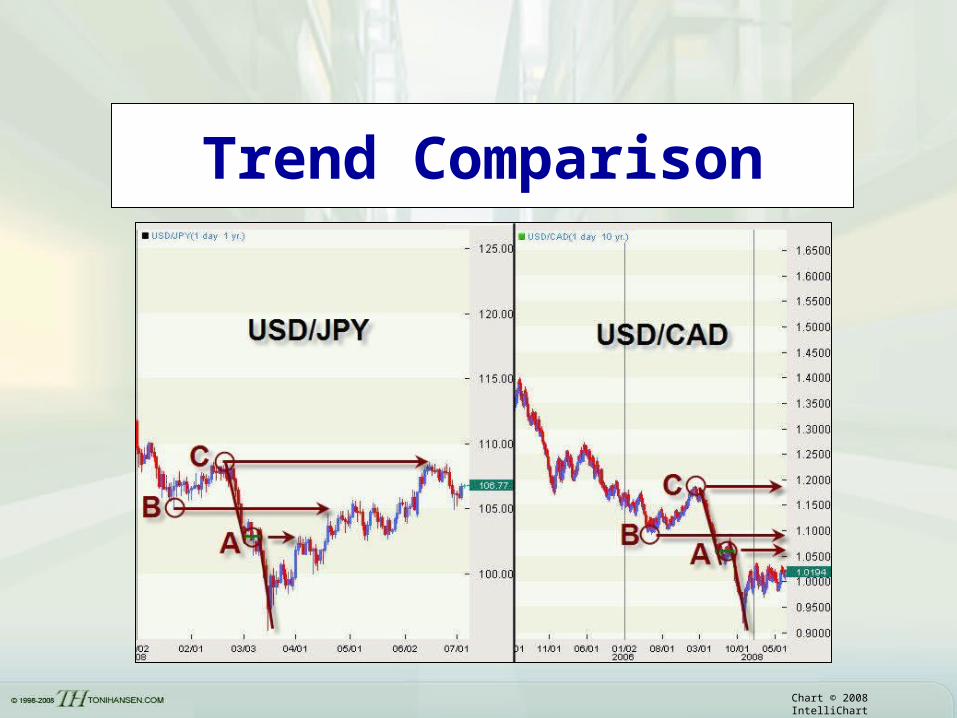
Trends are the primary direction of price movement at any given time. They are repetitive, but the placement of a pattern in the context of the larger trend is key to identifying target levels or to assess if the setup is even viable in the first place.
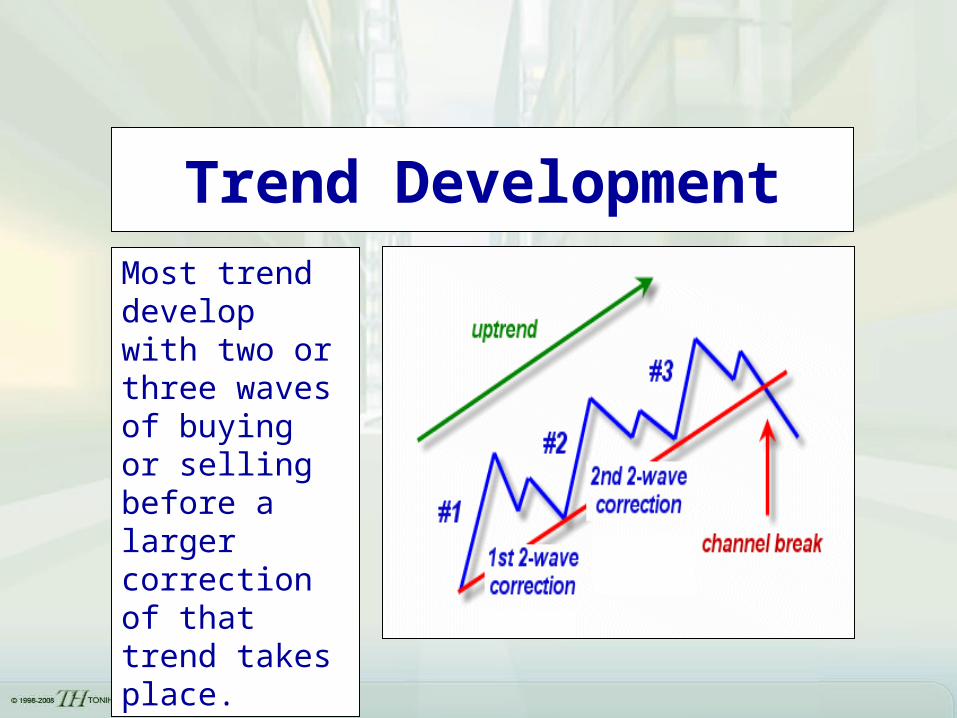
Trend DevelopmentMost trend develop with two or three waves of buying or selling before a larger correction of that trend takes place.
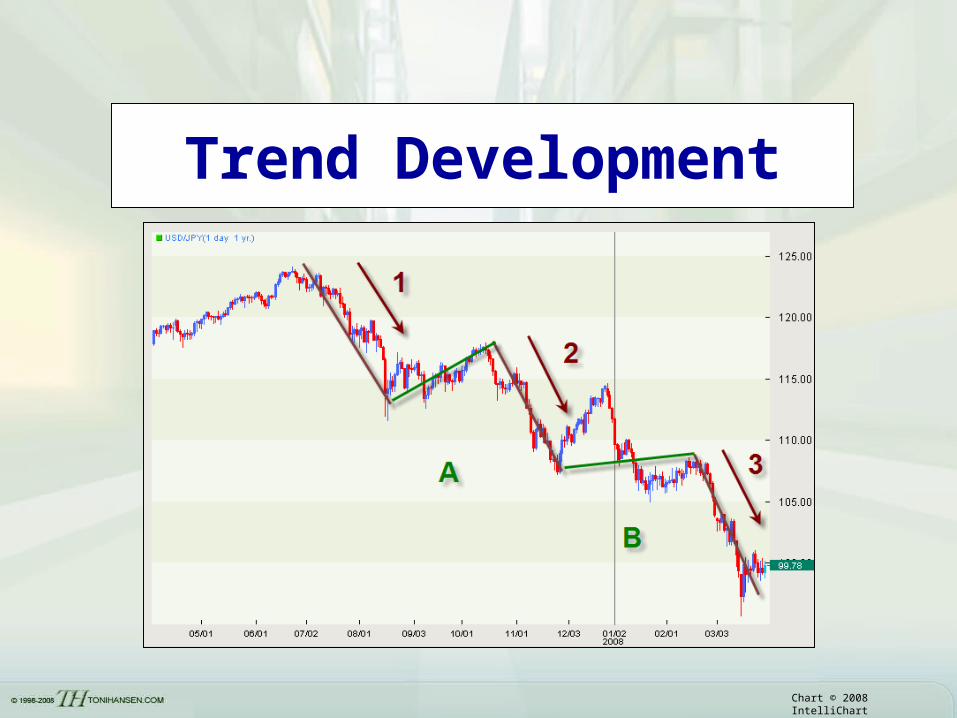
Trend Development
Chart © 2008 IntelliChart
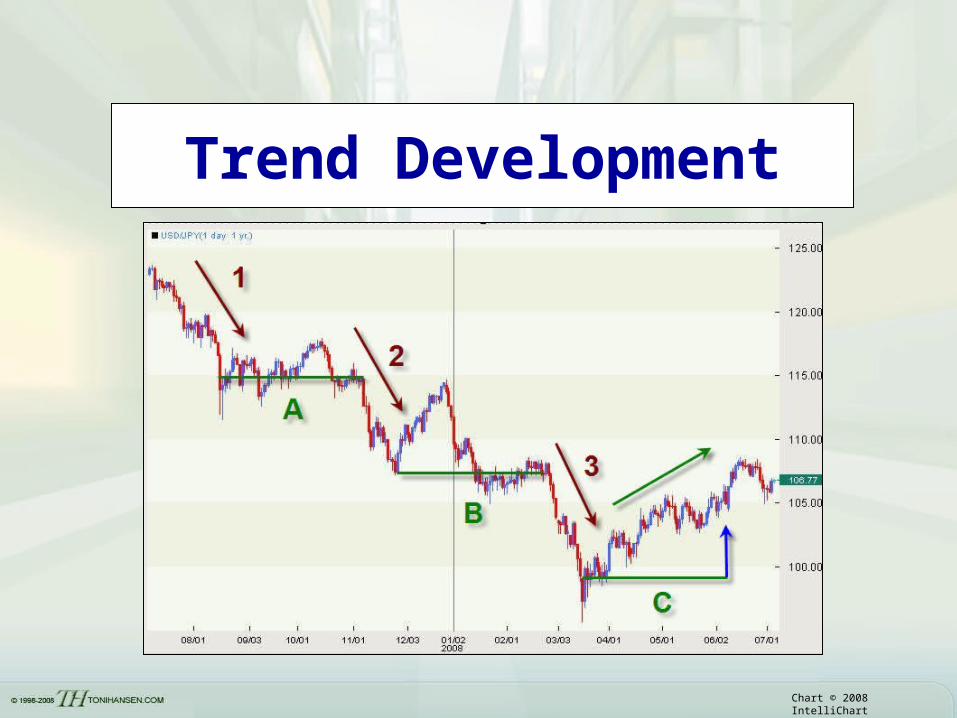
Trend Development
Chart © 2008 IntelliChart
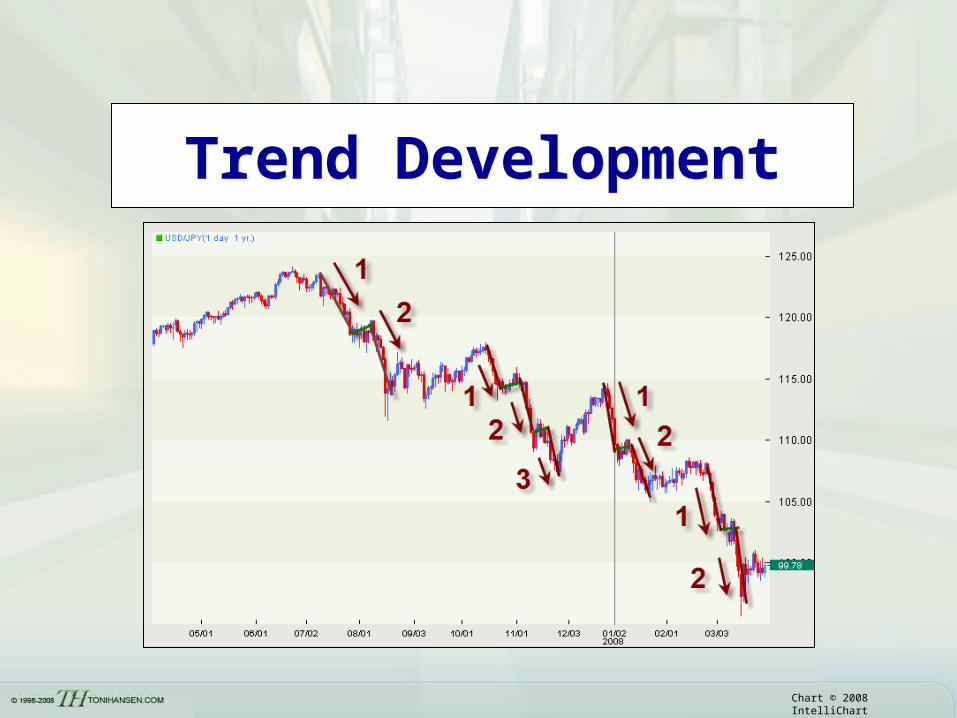
Trend Development
Chart © 2008 IntelliChart
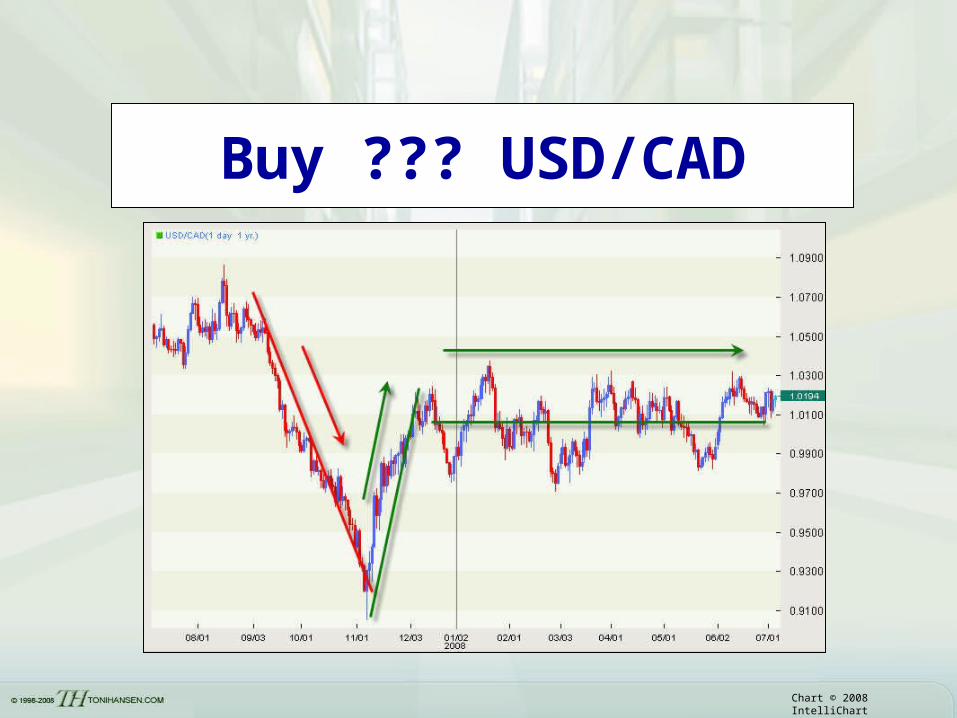
Buy ??? USD/CAD
Chart © 2008 IntelliChart
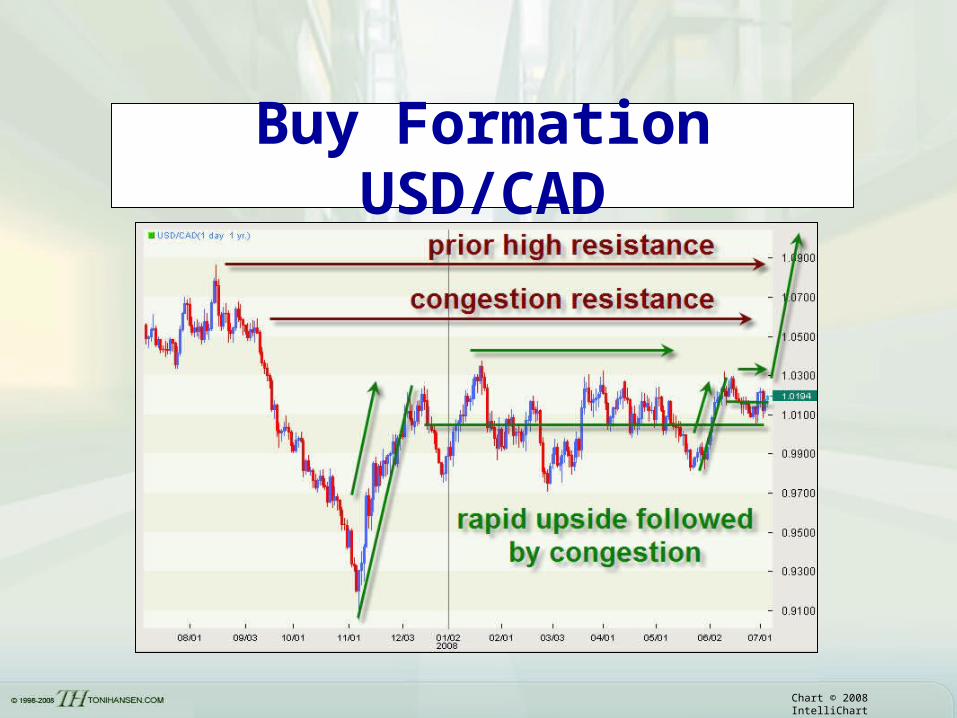
Buy Formation USD/CAD
Chart © 2008 IntelliChart
Buy Formation USD/CAD
Chart © 2008 IntelliChart
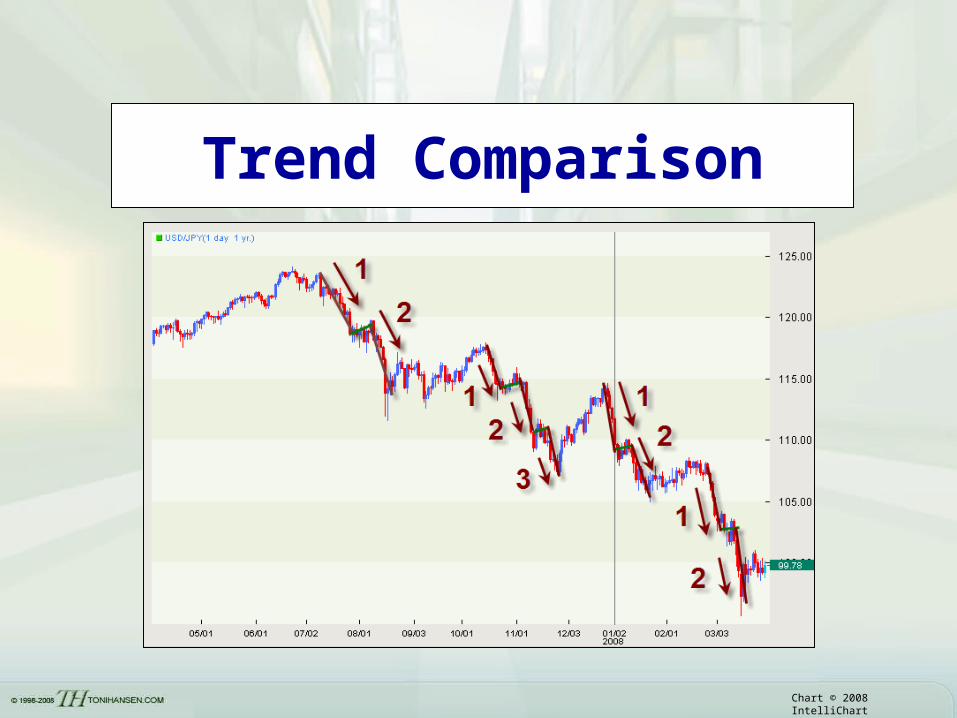
Trend Comparison
Chart © 2008 IntelliChart
Trend Comparison
Chart © 2008 IntelliChart
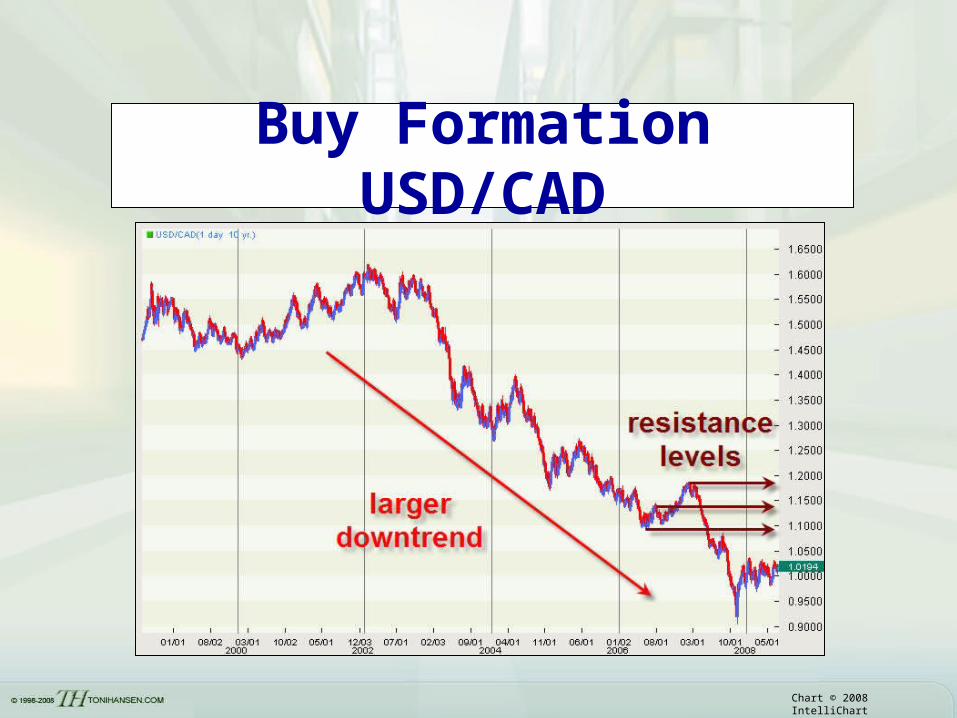
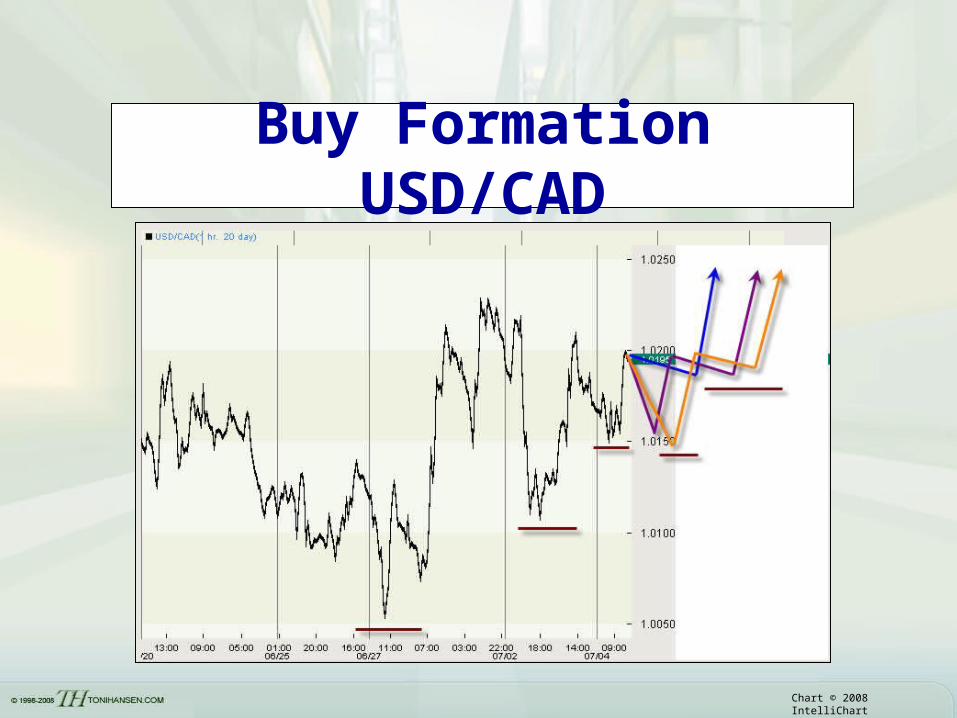
Buy Formation USD/CAD
Chart © 2008 IntelliChart
Buy Formation USD/CAD
Chart © 2008 IntelliChart
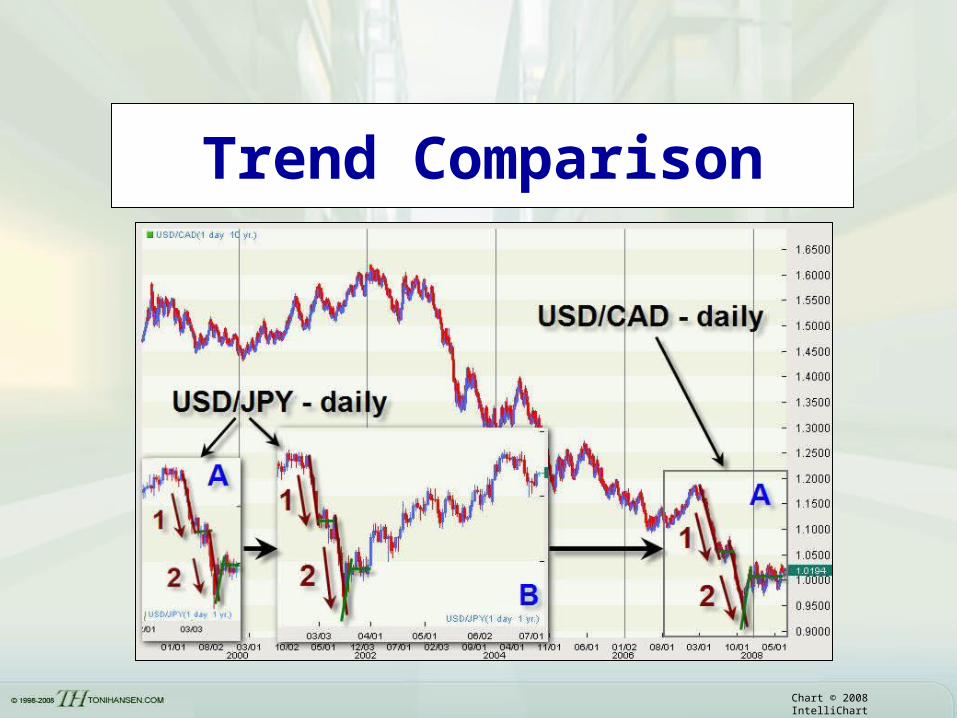
Trend Comparison
Chart © 2008 IntelliChart
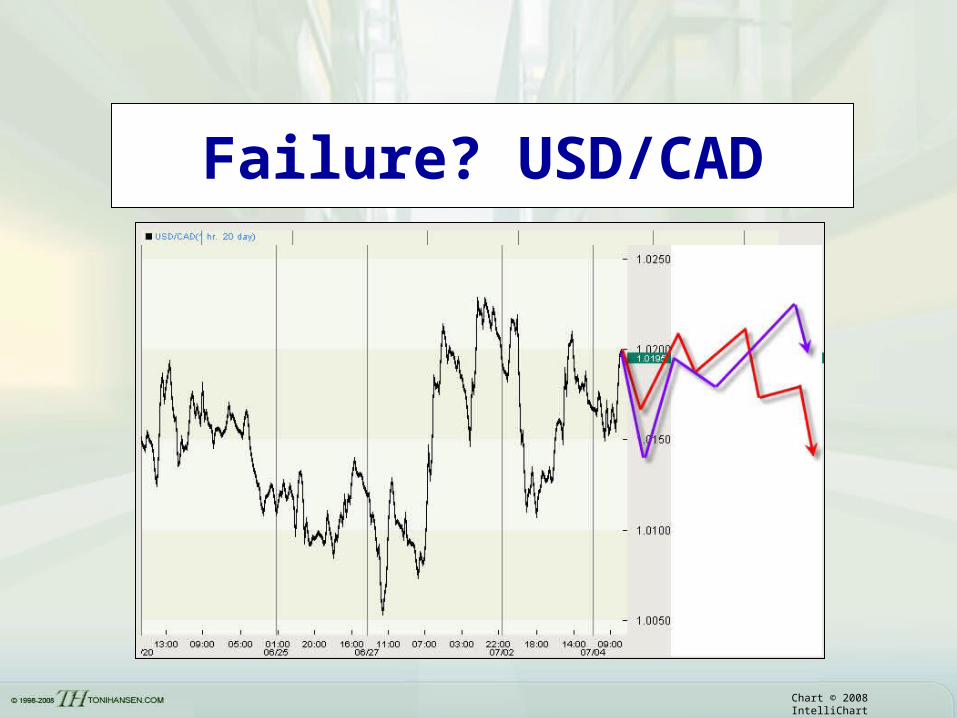
Failure? USD/CAD
Chart © 2008 IntelliChart
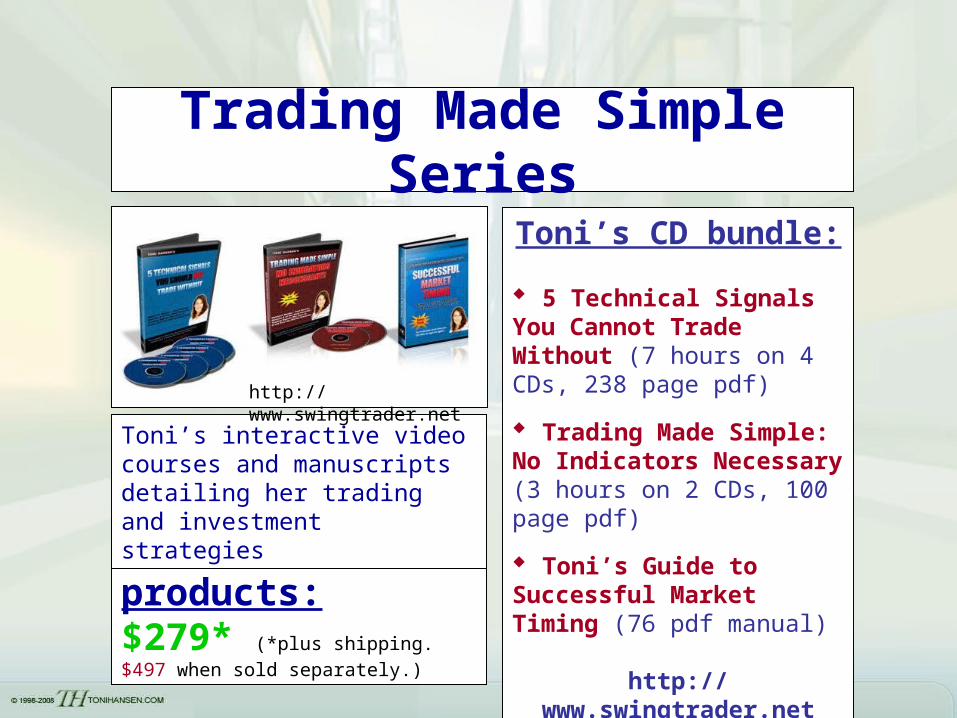
Trading Made Simple Series
Toni’s CD bundle:
5 Technical Signals You Cannot Trade Without (7 hours on 4 CDs, 238 page pdf)
Trading Made Simple: No Indicators Necessary (3 hours on 2 CDs, 100 page pdf)
Toni’s Guide to Successful Market Timing (76 pdf manual)
http://www.swingtrader.net
All three products: $279* (*plus shipping. $497 when sold separately.)
Toni’s interactive video courses and manuscripts detailing her trading and investment strategies
http://www.swingtrader.net
About ISE FX Options• Accessible through your options broker• Exchange-listed securities • Cash-settled in U.S. dollars • European style exercise• Can be traded as spreads
Currency Convention
Symbol
Australian dollar
USD/AUD AUX
British pound USD/GBP BPX
Canadian dollar
USD/CAD CDD
Euro USD/EUR EUI
Swiss franc USD/CHF SFC
Japanese yen USD/JPY YUKwww.ise.com/fx
Investors can view the underlying rates from several leading market data vendors and financial websites, including Big Charts, Bloomberg, ILX, Reuters, and Yahoo! Finance.
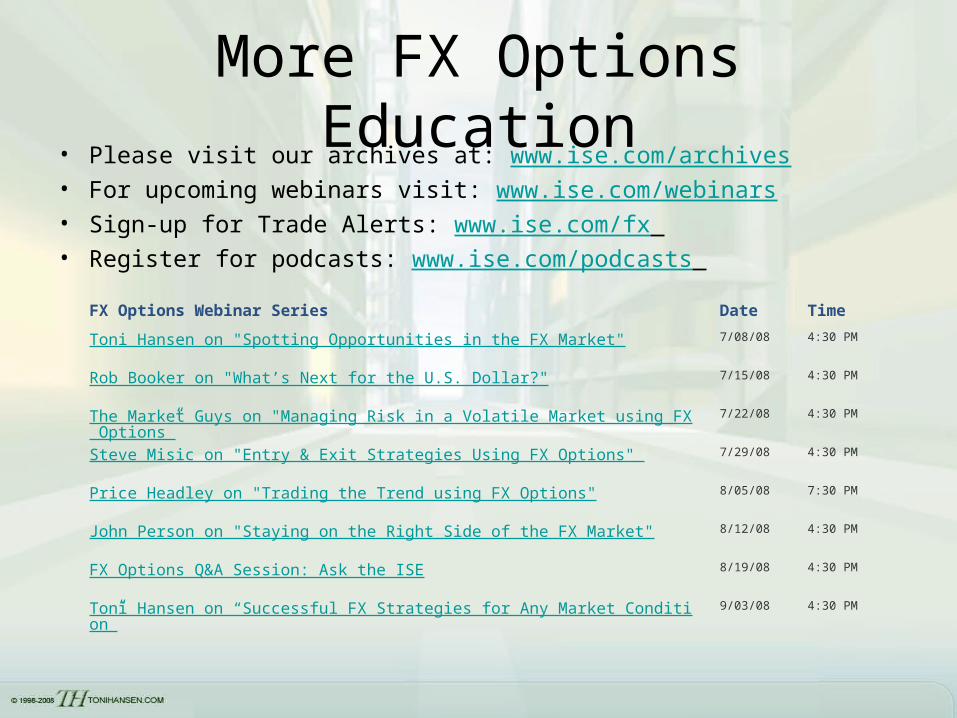
More FX Options Education• Please visit our archives at: www.ise.com/archives• For upcoming webinars visit: www.ise.com/webinars• Sign-up for Trade Alerts: www.ise.com/fx • Register for podcasts: www.ise.com/podcasts
FX Options Webinar Series Date Time
Toni Hansen on "Spotting Opportunities in the FX Market" 7/08/08 4:30 PM
Rob Booker on "What’s Next for the U.S. Dollar?" 7/15/08 4:30 PM
The Market Guys on "Managing Risk in a Volatile Market using FX Options” 7/22/08 4:30 PM
Steve Misic on "Entry & Exit Strategies Using FX Options" 7/29/08 4:30 PM
Price Headley on "Trading the Trend using FX Options" 8/05/08 7:30 PM
John Person on "Staying on the Right Side of the FX Market" 8/12/08 4:30 PM
FX Options Q&A Session: Ask the ISE 8/19/08 4:30 PM
Toni Hansen on “Successful FX Strategies for Any Market Condition” 9/03/08 4:30 PM
Top Related