


Languages
Pages
Legal


Document 3 Asset Category – Cables SPN
Asset Stewardship Report 2014
Faisal Khanzada
Asset Stewardship Report 2014 Working draft v0.1 SPN Underground Cables Version 2.0 All of the cost numbers displayed in this document are before the application of on-going efficiencies and real price effects.
UK Power Networks (Operations) Limited. Registered in England and Wales. Registered No. 3870728. Registered Office: Newington House, 237 Southwark Bridge Road, London, SE1 6NP 2
Approved by: Richard Wakelen / Barry Hatton
Approved Date: 06/03/2014
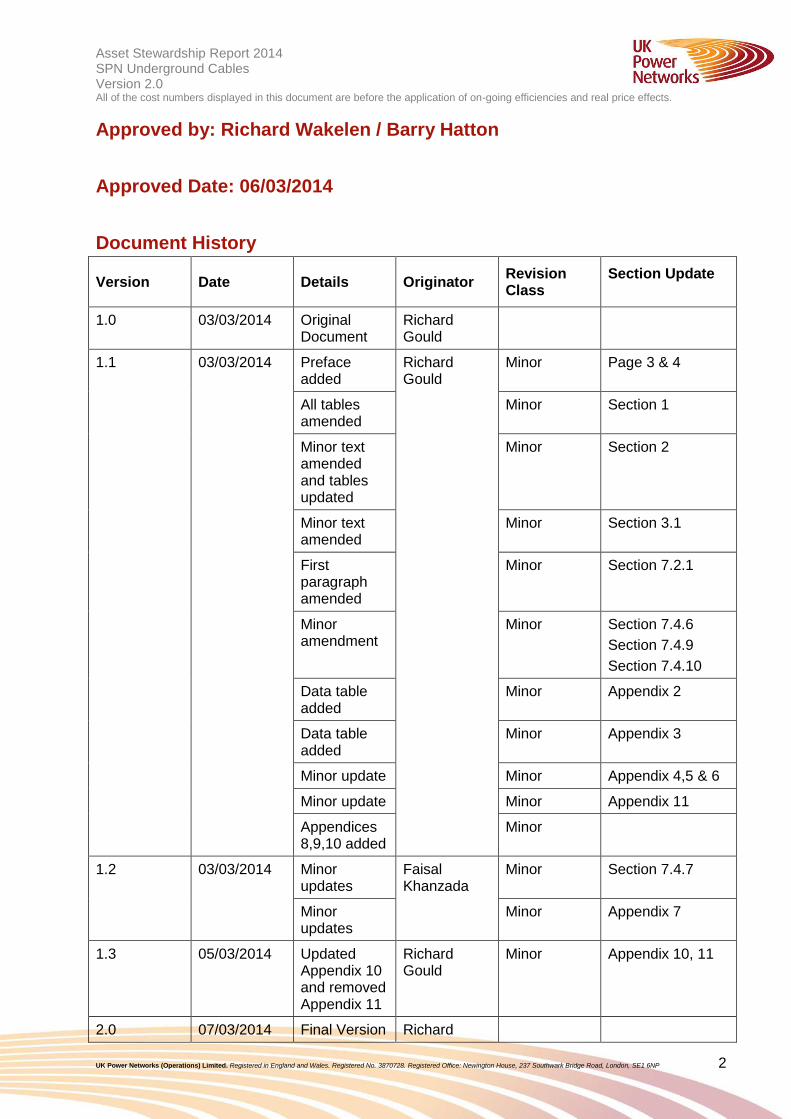
Document History
Version Date Details Originator Revision Class
Section Update
1.0 03/03/2014 Original Document
Richard Gould
1.1 03/03/2014 Preface added
Richard Gould
Minor Page 3 & 4
All tables amended
Minor Section 1
Minor text amended and tables updated
Minor Section 2
Minor text amended
Minor Section 3.1
First paragraph amended
Minor Section 7.2.1
Minor amendment
Minor Section 7.4.6
Section 7.4.9
Section 7.4.10
Data table added
Minor Appendix 2
Data table added
Minor Appendix 3
Minor update Minor Appendix 4,5 & 6
Minor update Minor Appendix 11
Appendices 8,9,10 added
Minor
1.2 03/03/2014 Minor updates
Faisal Khanzada
Minor Section 7.4.7
Minor updates
Minor Appendix 7
1.3 05/03/2014 Updated Appendix 10 and removed Appendix 11
Richard Gould
Minor Appendix 10, 11
2.0 07/03/2014 Final Version Richard
Asset Stewardship Report 2014 Working draft v0.1 SPN Underground Cables Version 2.0 All of the cost numbers displayed in this document are before the application of on-going efficiencies and real price effects.
UK Power Networks (Operations) Limited. Registered in England and Wales. Registered No. 3870728. Registered Office: Newington House, 237 Southwark Bridge Road, London, SE1 6NP 3
Version Date Details Originator Revision Class
Section Update
Gould
Preface
UK Power Networks uses Asset Stewardship Reports (‘ASR’) to describe the optimum asset
management strategy and proposals for different groups of assets. This optimised asset
management strategy and plan details the levels of investment required and the targeted
interventions and outputs needed. Separate ASRs define the most efficient maintenance and
inspection regimes needed and all documents detail the new forms of innovation which are
required to maximise value, service and safety for all customers and staff throughout the
ED1 regulatory period. Outline proposals for the ED2 period are also included.
Each DNO has a suite of approximately 20 ASR’s. Although asset policy and strategy is
similar for the same assets in each DNO the detailed plans and investment proposals are
different for each DNO. There are also local issues which must be taken into account.
Accordingly each DNO has its own complete set of ASR documents.
A complete list of titles of the ASR’s, a summary of capex and opex investment is included in
‘Document 20: Asset Stewardship Report: Capex/Opex Overview’. This document also
defines how costs and outputs in the various ASR’s build up UK Power Networks ‘NAMP’
(Network Asset Management Plan) and how the NAMP aligns with Ofgem’s ED1 RIGs
tables and row numbers.
Where ‘HI’ or asset ‘Health Index’ information is included please note predicted ED1 profiles
are before any benefits from ‘Load driven investment.’
This ASR has also been updated to reflect the feedback from Ofgem on our July 2013 ED1
business plan submission. Accordingly to aid the reader three additional appendices have
been added. They are;
1. Appendix 8 - Output NAMP/ED1 RIGS reconciliation: This section explains the
‘line of sight’ between the UKPN Network Asset Management Plan (NAMP)
replacement volumes contained in the Ofgem RIGS tables. The NAMP is the UKPN
ten year rolling asset management investment plan. It is used as the overarching
plan to drive both direct and indirect Capex and Opex interventions volumes and
costs. The volume and cost data used in this ASR to explain our investment plan is
taken from the UK Power Networks NAMP. Appendix 8 explains how the NAMP
outputs are translated into the Ofgem RIGS tables. The translation of costs from the
NAMP to the ED1 RIGS tables is more complex and it is not possible to explain this
in a simple table. This is because the costs of a project in the ‘NAMP’ are allocated to
a wide variety of tables and rows in the RIGS. For example the costs of a typical
switchgear replacement project will be allocated to a range of different Ofgem ED1
RIGs tables and rows such as CV3 (Replacement), CV5 (Refurbishment) CV6 (Civil
works) and CV105 (Operational IT Technology and Telecoms). However guidance
notes of the destination RIGs tables for NAMP expenditure and included in the table
in the Section 1.1 of the Executive Summary of each ASR.
Asset Stewardship Report 2014 Working draft v0.1 SPN Underground Cables Version 2.0 All of the cost numbers displayed in this document are before the application of on-going efficiencies and real price effects.
UK Power Networks (Operations) Limited. Registered in England and Wales. Registered No. 3870728. Registered Office: Newington House, 237 Southwark Bridge Road, London, SE1 6NP 4
2. Appendix 9 – Efficiency benchmarking with other DNO’s: This helps to inform
readers how UK Power Networks is positioned from a benchmarking position with
other DNO’s. It aims to show why we believe our investment plans in terms of both
volume and money is the right answer when compared to the industry, and why we
believe our asset replacement and refurbishment investment proposals are efficient
and effective and in the best interest for our customers.
3. Appendix 10 – Material changes since the July 2013 ED1 submission: This
section shows the differences between the ASR submitted in July 2013 and the ASR
submitted for the re-submission in March 2014. It aims to inform the reader about the
changes made to volumes and costs as a result of reviewing the plans submitted in
July 2013. Generally the number of changes made is very small, as we believe the
original plan submitted in July 2013 meets the requirements of a well justified plan.
However there are areas where we have identified further efficiencies and
improvements or recent events have driven us to amend our plans to protect
customer safety and service.
We have sought to avoid duplication in other ED1 documents, such as ‘Scheme Justification
Papers’, by referring the reader to key issues of asset policy and asset engineering which
are included in the appropriate ASR documents.
Asset Stewardship Report 2014 Working draft v0.1 SPN Underground Cables Version 2.0 All of the cost numbers displayed in this document are before the application of on-going efficiencies and real price effects.
UK Power Networks (Operations) Limited. Registered in England and Wales. Registered No. 3870728. Registered Office: Newington House, 237 Southwark Bridge Road, London, SE1 6NP 5
Contents Approved by: Richard Wakelen / Barry Hatton ...................................................................... 2
Approved Date: 06/03/2014 .................................................................................................. 2
Document History ................................................................................................................. 2
Preface ................................................................................................................................. 3
1.0 Executive Summary Underground Cables .................................................................. 7
1.1 Scope ..................................................................................................................... 7
1.2 Investment Strategy ................................................................................................ 8
1.3 ED1 Proposals ........................................................................................................ 8
1.4 Innovation ............................................................................................................... 9
1.5 Risks and Opportunities .......................................................................................... 9
2.0 Description of Underground Cables .......................................................................... 10
2.1 Fluid-Filled Cables ................................................................................................ 12
2.2 Gas Cables ........................................................................................................... 14
2.3 Solid Cables.......................................................................................................... 16
3.0 Investment Drivers ................................................................................................... 19
3.1 Investment Drivers for Fluid-Filled Cables ............................................................. 19
3.2 Investment Drivers for Gas Cables ....................................................................... 22
3.3 Investment Drivers for Solid Cables ...................................................................... 23
3.4 Cable Fault Rates ................................................................................................. 24
4.0 Asset Assessment .................................................................................................... 26
4.1 Health Assessment of Fluid-Filled Cables (FFC) ................................................... 26
4.2 Asset Criticality .................................................................................................. 27
4.3 Network Risk ..................................................................................................... 27
4.4 Data Validation ..................................................................................................... 27
4.5 Data Verification ................................................................................................ 28
4.6 Data Completeness ........................................................................................... 28
4.7 Health Assessment of Gas Cables ........................................................................ 28
4.8 Health Assessment of Solid Cables ...................................................................... 28
5.0 Intervention Policies ................................................................................................. 29
5.1 Intervention Options .............................................................................................. 29
6.0 Innovation ................................................................................................................. 30
6.1 Fluid-Filled Cables ................................................................................................ 30
6.2 Gas-Filled Cables ................................................................................................. 31
6.3 Solid Cables.......................................................................................................... 31
Asset Stewardship Report 2014 Working draft v0.1 SPN Underground Cables Version 2.0 All of the cost numbers displayed in this document are before the application of on-going efficiencies and real price effects.
UK Power Networks (Operations) Limited. Registered in England and Wales. Registered No. 3870728. Registered Office: Newington House, 237 Southwark Bridge Road, London, SE1 6NP 6
7.0 Expenditure Requirements for Underground Cables................................................. 33
7.1 Method .................................................................................................................. 33
7.2 Constructing the Plan ............................................................................................ 36
7.3 Additional Considerations ..................................................................................... 38
7.4 Asset Volumes and Expenditure ........................................................................... 39
7.5 Commentary ......................................................................................................... 47
7.6 Sensitivity Analysis and Plan Validation ................................................................ 49
7.7 Model Testing ....................................................................................................... 51
7.8 Network Risk ......................................................................................................... 52
8.0 Deliverability ............................................................................................................. 53
Appendices ......................................................................................................................... 54
Appendix 1 – Age Profiles ............................................................................................... 54
Appendix 2 – HI Profiles .................................................................................................. 58
Appendix 3 – Fault Data .................................................................................................. 59
Appendix 4 – WLC Case Studies ..................................................................................... 61
Appendix 5 – NLRE Expenditure Plan ............................................................................. 62
Appendix 6 – Sensitivity Analysis .................................................................................... 71
Appendix 7 – Named Schemes ....................................................................................... 75
Appendix 8 – Output NAMP/ED1 Business Plan Data Tables ......................................... 76
Appendix 9 – Efficiency benchmarking with other DNO’s................................................. 77
Appendix 10 – Material changes since the July 2013 ED1 submission ............................ 78
Asset Stewardship Report 2014 Working draft v0.1 SPN Underground Cables Version 2.0 All of the cost numbers displayed in this document are before the application of on-going efficiencies and real price effects.
UK Power Networks (Operations) Limited. Registered in England and Wales. Registered No. 3870728. Registered Office: Newington House, 237 Southwark Bridge Road, London, SE1 6NP 7
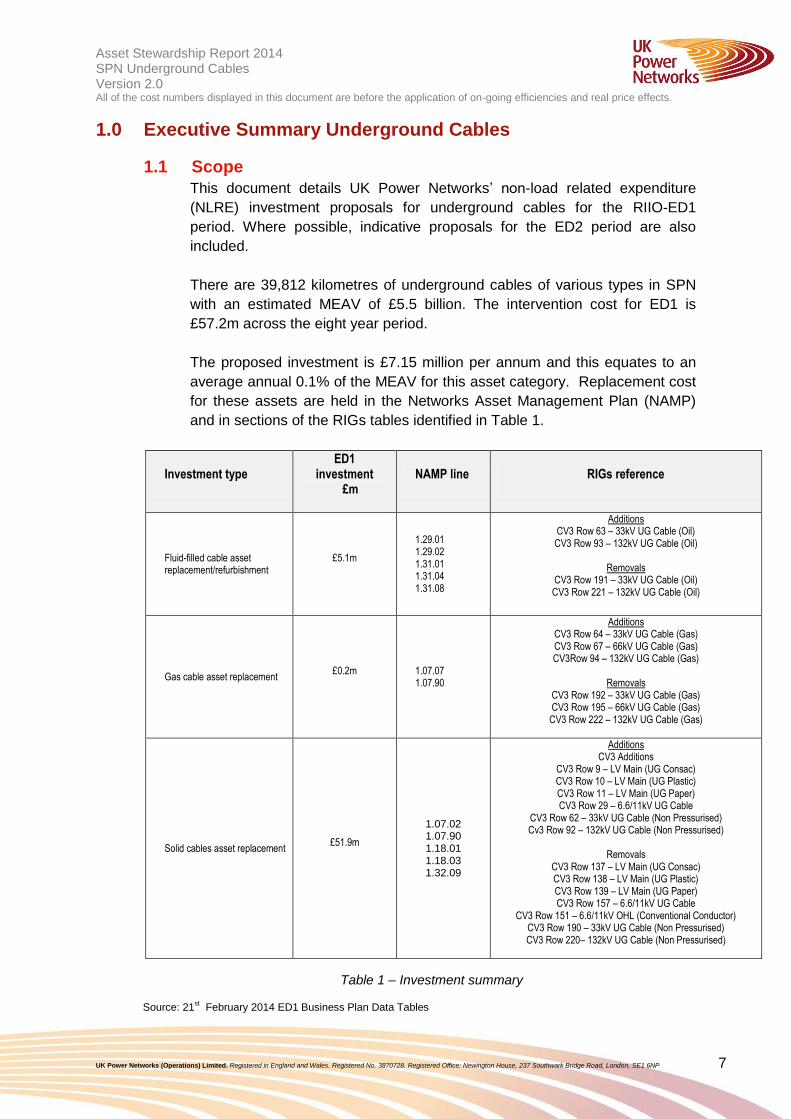
1.0 Executive Summary Underground Cables
1.1 Scope
This document details UK Power Networks’ non-load related expenditure
(NLRE) investment proposals for underground cables for the RIIO-ED1
period. Where possible, indicative proposals for the ED2 period are also
included.
There are 39,812 kilometres of underground cables of various types in SPN
with an estimated MEAV of £5.5 billion. The intervention cost for ED1 is
£57.2m across the eight year period.
The proposed investment is £7.15 million per annum and this equates to an
average annual 0.1% of the MEAV for this asset category. Replacement cost
for these assets are held in the Networks Asset Management Plan (NAMP)
and in sections of the RIGs tables identified in Table 1.
Investment type ED1
investment £m
NAMP line RIGs reference
Fluid-filled cable asset replacement/refurbishment
£5.1m
1.29.01 1.29.02 1.31.01 1.31.04 1.31.08
Additions CV3 Row 63 – 33kV UG Cable (Oil) CV3 Row 93 – 132kV UG Cable (Oil)
Removals
CV3 Row 191 – 33kV UG Cable (Oil) CV3 Row 221 – 132kV UG Cable (Oil)
Gas cable asset replacement £0.2m 1.07.07
1.07.90
Additions CV3 Row 64 – 33kV UG Cable (Gas) CV3 Row 67 – 66kV UG Cable (Gas) CV3Row 94 – 132kV UG Cable (Gas)
Removals
CV3 Row 192 – 33kV UG Cable (Gas) CV3 Row 195 – 66kV UG Cable (Gas) CV3 Row 222 – 132kV UG Cable (Gas)
Solid cables asset replacement £51.9m
1.07.02 1.07.90
1.18.01
1.18.03
1.32.09
Additions CV3 Additions
CV3 Row 9 – LV Main (UG Consac) CV3 Row 10 – LV Main (UG Plastic) CV3 Row 11 – LV Main (UG Paper) CV3 Row 29 – 6.6/11kV UG Cable
CV3 Row 62 – 33kV UG Cable (Non Pressurised) Cv3 Row 92 – 132kV UG Cable (Non Pressurised)
Removals
CV3 Row 137 – LV Main (UG Consac) CV3 Row 138 – LV Main (UG Plastic) CV3 Row 139 – LV Main (UG Paper) CV3 Row 157 – 6.6/11kV UG Cable
CV3 Row 151 – 6.6/11kV OHL (Conventional Conductor) CV3 Row 190 – 33kV UG Cable (Non Pressurised) CV3 Row 220– 132kV UG Cable (Non Pressurised)
Table 1 – Investment summary
Source: 21st February 2014 ED1 Business Plan Data Tables
Asset Stewardship Report 2014 Working draft v0.1 SPN Underground Cables Version 2.0 All of the cost numbers displayed in this document are before the application of on-going efficiencies and real price effects.
UK Power Networks (Operations) Limited. Registered in England and Wales. Registered No. 3870728. Registered Office: Newington House, 237 Southwark Bridge Road, London, SE1 6NP 8
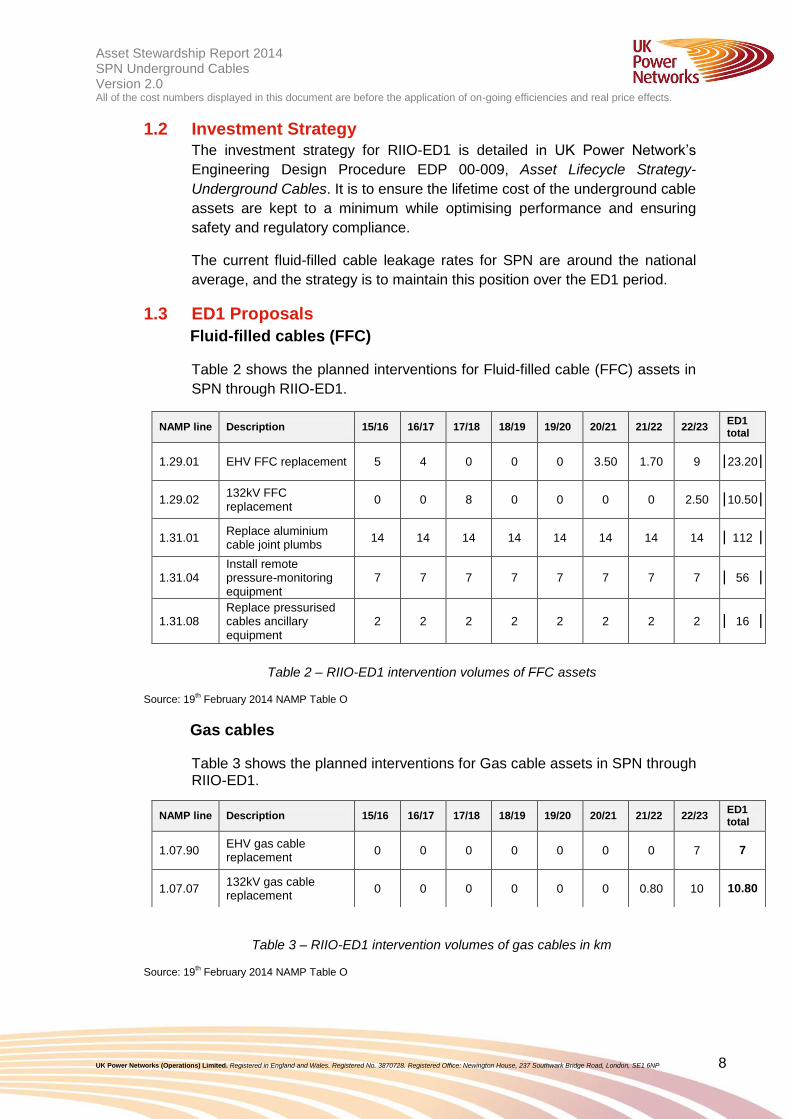
1.2 Investment Strategy
The investment strategy for RIIO-ED1 is detailed in UK Power Network’s
Engineering Design Procedure EDP 00-009, Asset Lifecycle Strategy-
Underground Cables. It is to ensure the lifetime cost of the underground cable
assets are kept to a minimum while optimising performance and ensuring
safety and regulatory compliance.
The current fluid-filled cable leakage rates for SPN are around the national
average, and the strategy is to maintain this position over the ED1 period.
1.3 ED1 Proposals
Fluid-filled cables (FFC)
Table 2 shows the planned interventions for Fluid-filled cable (FFC) assets in
SPN through RIIO-ED1.
Table 2 – RIIO-ED1 intervention volumes of FFC assets
Source: 19th February 2014 NAMP Table O
Gas cables
Table 3 shows the planned interventions for Gas cable assets in SPN through RIIO-ED1.
Table 3 – RIIO-ED1 intervention volumes of gas cables in km
Source: 19th February 2014 NAMP Table O
NAMP line Description 15/16 16/17 17/18 18/19 19/20 20/21 21/22 22/23 ED1 total
1.29.01 EHV FFC replacement 5 4 0 0 0 3.50 1.70 9 23.20
1.29.02 132kV FFC replacement
0 0 8 0 0 0 0 2.50 10.50
1.31.01 Replace aluminium cable joint plumbs
14 14 14 14 14 14 14 14 112
1.31.04 Install remote pressure-monitoring equipment
7 7 7 7 7 7 7 7 56
1.31.08 Replace pressurised cables ancillary equipment
2 2 2 2 2 2 2 2 16
NAMP line Description 15/16 16/17 17/18 18/19 19/20 20/21 21/22 22/23 ED1 total
1.07.90 EHV gas cable replacement
0 0 0 0 0 0 0 7 7
1.07.07 132kV gas cable replacement
0 0 0 0 0 0 0.80 10 10.80

Asset Stewardship Report 2014 Working draft v0.1 SPN Underground Cables Version 2.0 All of the cost numbers displayed in this document are before the application of on-going efficiencies and real price effects.
UK Power Networks (Operations) Limited. Registered in England and Wales. Registered No. 3870728. Registered Office: Newington House, 237 Southwark Bridge Road, London, SE1 6NP 9
Solid cables
Table 4 shows the planned interventions for Solid cable assets in SPN
through RIIO-ED1.
NAMP line
Description 15/16 16/17 17/18 18/19 19/20 20/21 21/22 22/23 ED1 total
1.07.02 ED1 replace 132kV solid cable provision
0.25 0.25 0.25 0.25 0.25 0.25 0.25 0.25 2.00
1.07.01 ED1 replace 33kV solid cable provision (planned)
1 1 1 1 1 1 1 0.75 7.75
1.18.01 Replace HV cable (planned)
4 4 4 4 4 4 4 4 32
1.18.03 Replace LV cable (planned)
4 4 4 4 4 4 4 4 32
1.32.09 Underground 11kV Overheadline
25 25 25 25 25 25 25 25 200
Table 4 – RIIO-ED1 intervention volumes of solid cable assets in km
Source: 19th February 2014 NAMP Table O
1.4 Innovation
UK Power Networks has undertaken several initiatives to explore innovative
solutions that will improve the performance of the underground cable network.
Details of these are given in section 6 of the document.
Examples of innovation include online pressure monitoring, PFT leak location
and partial discharge mapping.
1.5 Risks and Opportunities
Description of similarly likely opportunities or
risks arising in ED1 period
Uncertainties
Opportunity Successful trials of self-healing fluids allow 10% of
leaking FFC sections to remain in service.
£3.4m
Risk 10 % increase in the proposed ED1 intervention
volumes due to sudden degradation of fluid filled
cable (FFC) sections..
£2.1m
Table 5 – Risks and opportunities
Asset Stewardship Report 2014 Working draft v0.1 SPN Underground Cables Version 2.0 All of the cost numbers displayed in this document are before the application of on-going efficiencies and real price effects.
UK Power Networks (Operations) Limited. Registered in England and Wales. Registered No. 3870728. Registered Office: Newington House, 237 Southwark Bridge Road, London, SE1 6NP 10
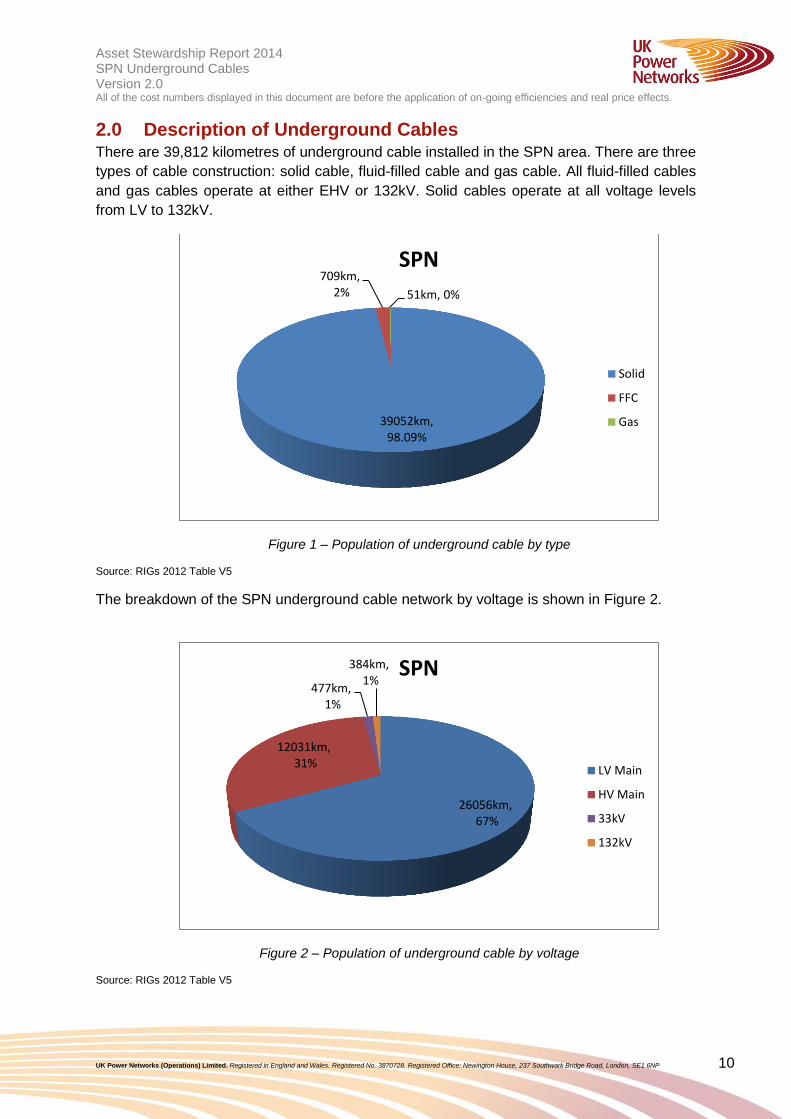
2.0 Description of Underground Cables There are 39,812 kilometres of underground cable installed in the SPN area. There are three
types of cable construction: solid cable, fluid-filled cable and gas cable. All fluid-filled cables
and gas cables operate at either EHV or 132kV. Solid cables operate at all voltage levels
from LV to 132kV.
Figure 1 – Population of underground cable by type
Source: RIGs 2012 Table V5
The breakdown of the SPN underground cable network by voltage is shown in Figure 2.
Figure 2 – Population of underground cable by voltage
Source: RIGs 2012 Table V5
39052km, 98.09%
709km, 2% 51km, 0%
SPN
Solid
FFC
Gas
26056km, 67%
12031km, 31%
477km, 1%
384km, 1%
SPN
LV Main
HV Main
33kV
132kV
Asset Stewardship Report 2014 Working draft v0.1 SPN Underground Cables Version 2.0 All of the cost numbers displayed in this document are before the application of on-going efficiencies and real price effects.
UK Power Networks (Operations) Limited. Registered in England and Wales. Registered No. 3870728. Registered Office: Newington House, 237 Southwark Bridge Road, London, SE1 6NP 11
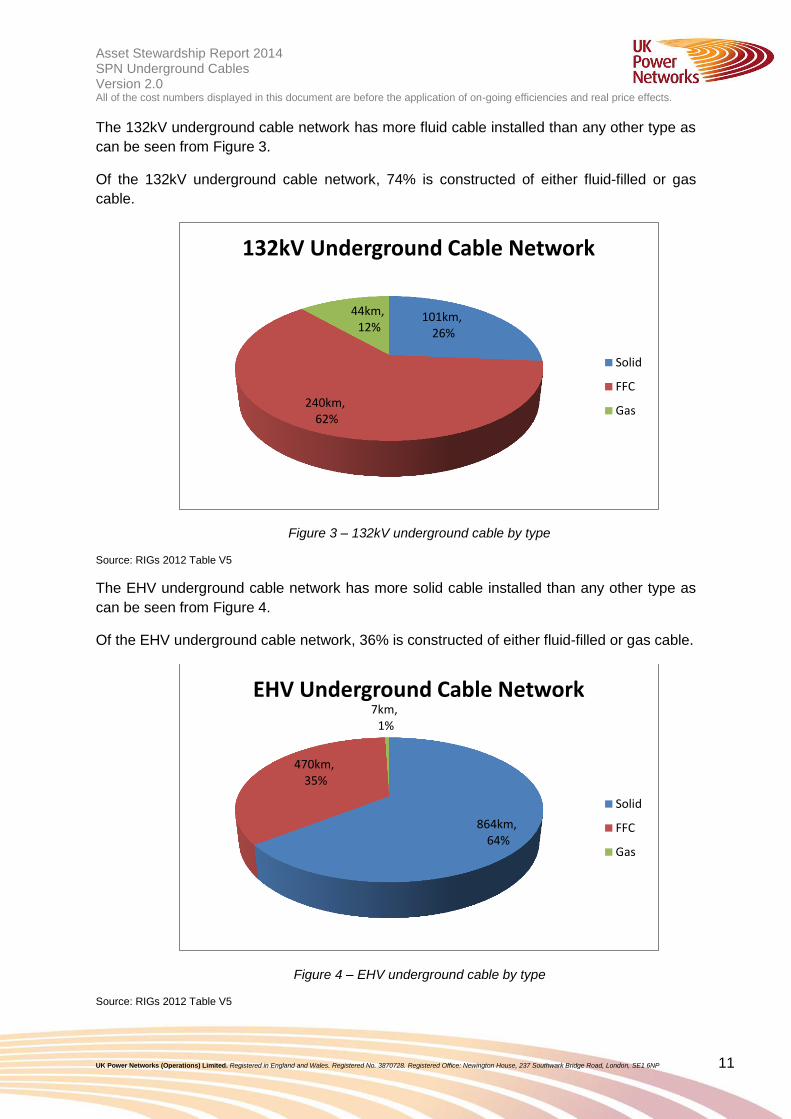
The 132kV underground cable network has more fluid cable installed than any other type as
can be seen from Figure 3.
Of the 132kV underground cable network, 74% is constructed of either fluid-filled or gas
cable.
Figure 3 – 132kV underground cable by type
Source: RIGs 2012 Table V5
The EHV underground cable network has more solid cable installed than any other type as
can be seen from Figure 4.
Of the EHV underground cable network, 36% is constructed of either fluid-filled or gas cable.
Figure 4 – EHV underground cable by type
Source: RIGs 2012 Table V5
101km, 26%
240km, 62%
44km, 12%
132kV Underground Cable Network
Solid
FFC
Gas
864km, 64%
470km, 35%
7km, 1%
EHV Underground Cable Network
Solid
FFC
Gas
Asset Stewardship Report 2014 Working draft v0.1 SPN Underground Cables Version 2.0 All of the cost numbers displayed in this document are before the application of on-going efficiencies and real price effects.
UK Power Networks (Operations) Limited. Registered in England and Wales. Registered No. 3870728. Registered Office: Newington House, 237 Southwark Bridge Road, London, SE1 6NP 12
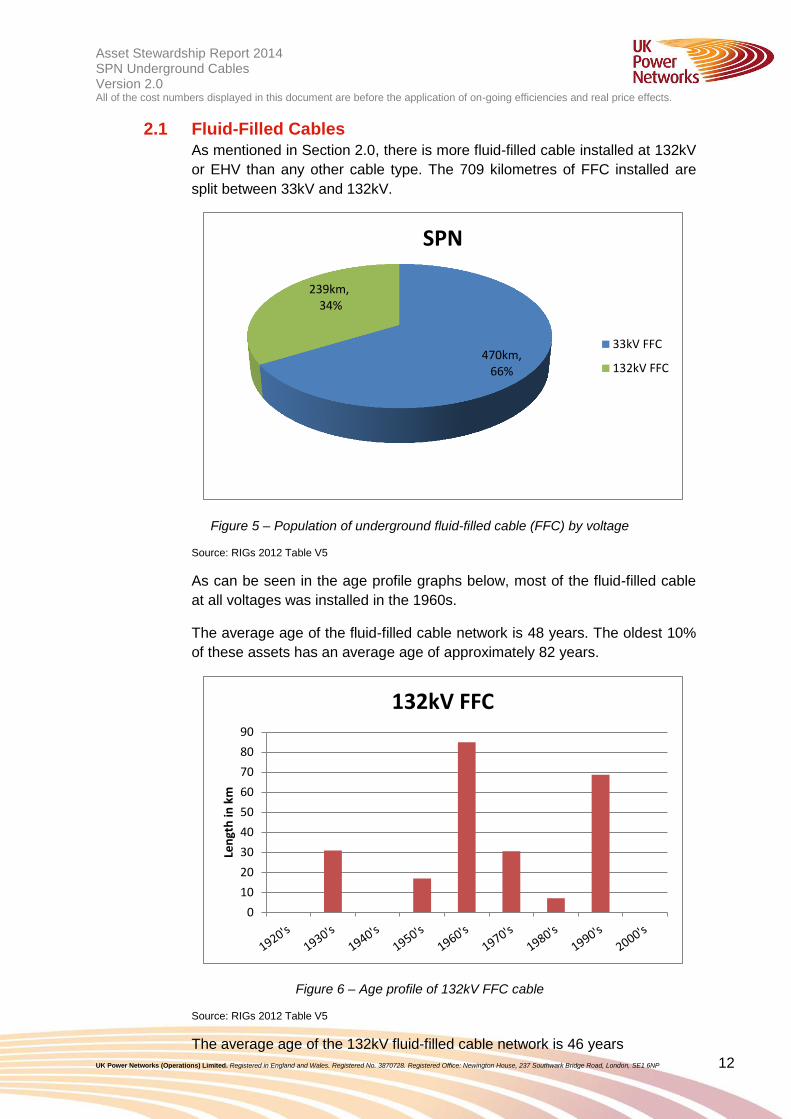
2.1 Fluid-Filled Cables
As mentioned in Section 2.0, there is more fluid-filled cable installed at 132kV
or EHV than any other cable type. The 709 kilometres of FFC installed are
split between 33kV and 132kV.
Figure 5 – Population of underground fluid-filled cable (FFC) by voltage
Source: RIGs 2012 Table V5
As can be seen in the age profile graphs below, most of the fluid-filled cable
at all voltages was installed in the 1960s.
The average age of the fluid-filled cable network is 48 years. The oldest 10%
of these assets has an average age of approximately 82 years.
Figure 6 – Age profile of 132kV FFC cable
Source: RIGs 2012 Table V5
The average age of the 132kV fluid-filled cable network is 46 years
470km, 66%
239km, 34%
SPN
33kV FFC
132kV FFC
0
10
20
30
40
50
60
70
80
90
Len
gth
in k
m
132kV FFC
Asset Stewardship Report 2014 Working draft v0.1 SPN Underground Cables Version 2.0 All of the cost numbers displayed in this document are before the application of on-going efficiencies and real price effects.
UK Power Networks (Operations) Limited. Registered in England and Wales. Registered No. 3870728. Registered Office: Newington House, 237 Southwark Bridge Road, London, SE1 6NP 13
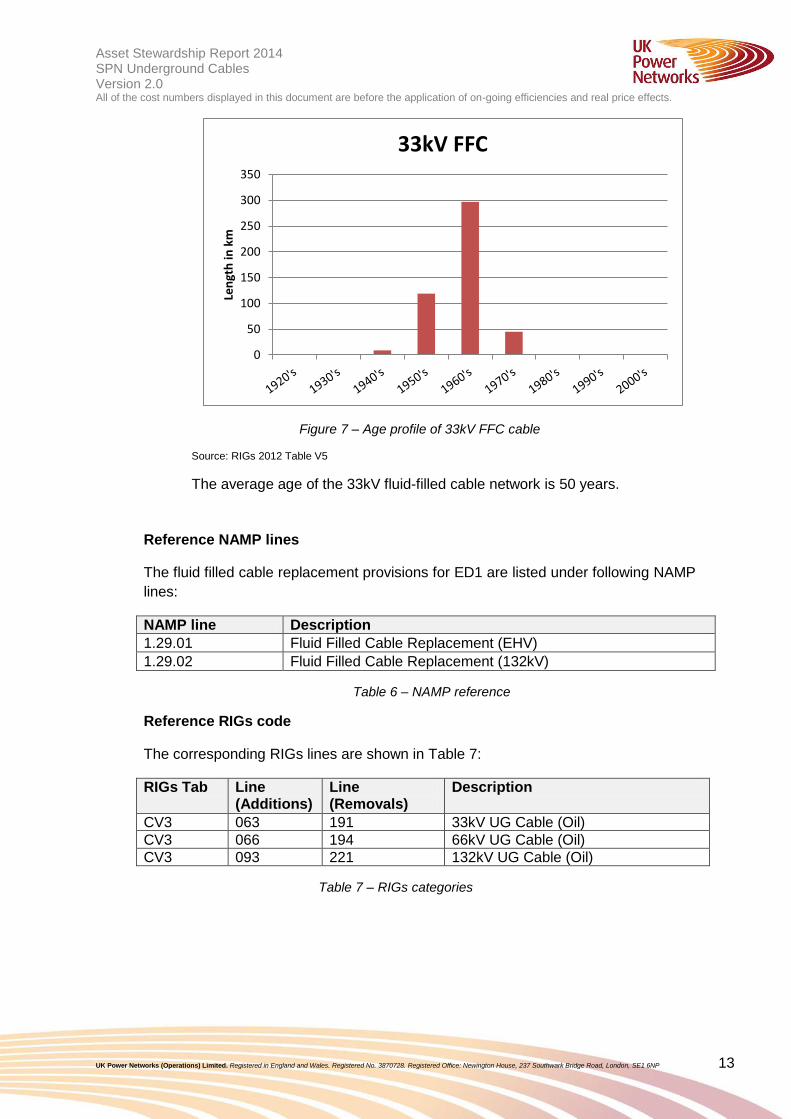
Figure 7 – Age profile of 33kV FFC cable
Source: RIGs 2012 Table V5
The average age of the 33kV fluid-filled cable network is 50 years.
Reference NAMP lines
The fluid filled cable replacement provisions for ED1 are listed under following NAMP
lines:
NAMP line Description 1.29.01 Fluid Filled Cable Replacement (EHV)
1.29.02 Fluid Filled Cable Replacement (132kV)
Table 6 – NAMP reference
Reference RIGs code
The corresponding RIGs lines are shown in Table 7:
RIGs Tab Line (Additions)
Line (Removals)
Description
CV3 063 191 33kV UG Cable (Oil) CV3 066 194 66kV UG Cable (Oil) CV3 093 221 132kV UG Cable (Oil)
Table 7 – RIGs categories
0
50
100
150
200
250
300
350
Len
gth
in k
m
33kV FFC
Asset Stewardship Report 2014 Working draft v0.1 SPN Underground Cables Version 2.0 All of the cost numbers displayed in this document are before the application of on-going efficiencies and real price effects.
UK Power Networks (Operations) Limited. Registered in England and Wales. Registered No. 3870728. Registered Office: Newington House, 237 Southwark Bridge Road, London, SE1 6NP 14
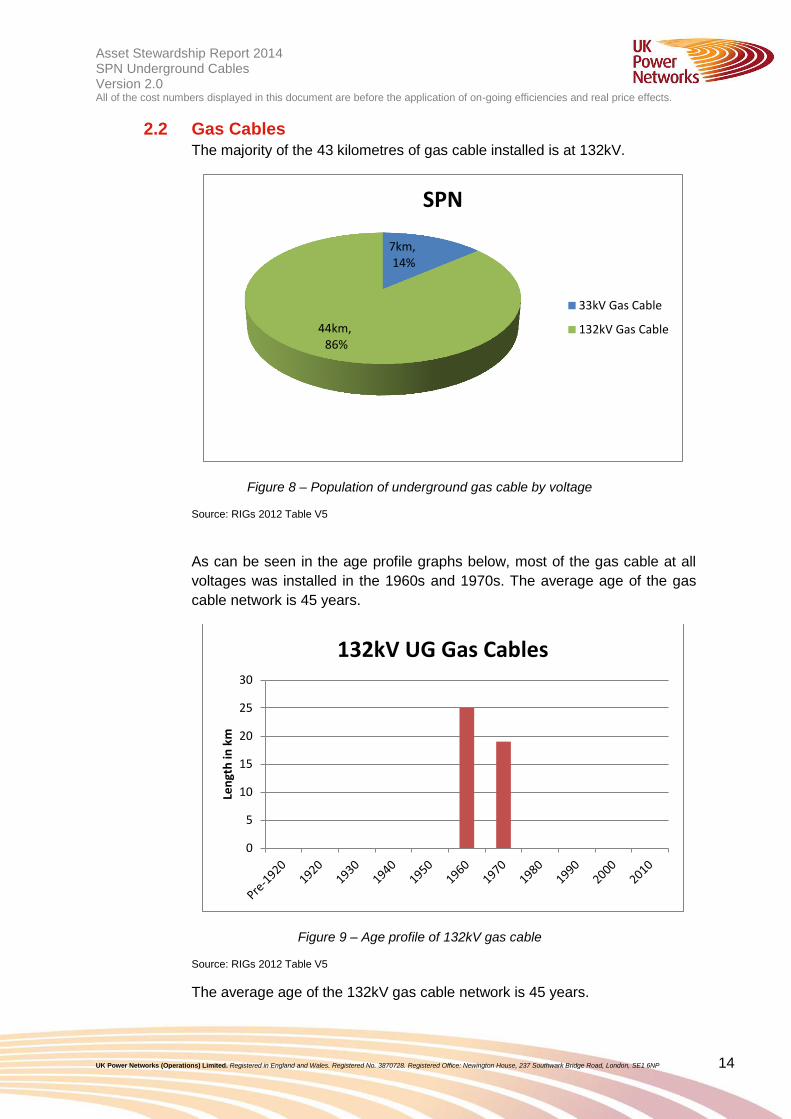
2.2 Gas Cables
The majority of the 43 kilometres of gas cable installed is at 132kV.
Figure 8 – Population of underground gas cable by voltage
Source: RIGs 2012 Table V5
As can be seen in the age profile graphs below, most of the gas cable at all
voltages was installed in the 1960s and 1970s. The average age of the gas
cable network is 45 years.
Figure 9 – Age profile of 132kV gas cable
Source: RIGs 2012 Table V5
The average age of the 132kV gas cable network is 45 years.
7km, 14%
44km, 86%
SPN
33kV Gas Cable
132kV Gas Cable
0
5
10
15
20
25
30
Len
gth
in k
m
132kV UG Gas Cables
Asset Stewardship Report 2014 Working draft v0.1 SPN Underground Cables Version 2.0 All of the cost numbers displayed in this document are before the application of on-going efficiencies and real price effects.
UK Power Networks (Operations) Limited. Registered in England and Wales. Registered No. 3870728. Registered Office: Newington House, 237 Southwark Bridge Road, London, SE1 6NP 15
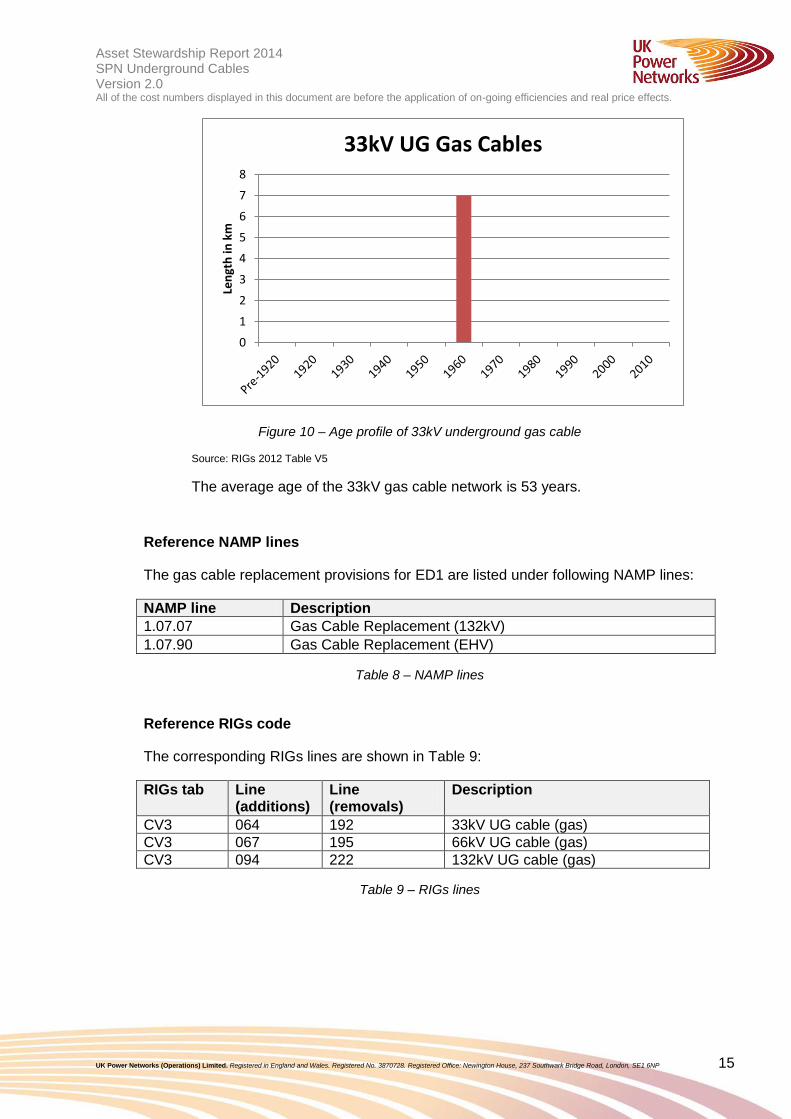
Figure 10 – Age profile of 33kV underground gas cable
Source: RIGs 2012 Table V5
The average age of the 33kV gas cable network is 53 years.
Reference NAMP lines
The gas cable replacement provisions for ED1 are listed under following NAMP lines:
NAMP line Description
1.07.07 Gas Cable Replacement (132kV)
1.07.90 Gas Cable Replacement (EHV)
Table 8 – NAMP lines
Reference RIGs code
The corresponding RIGs lines are shown in Table 9:
RIGs tab Line (additions)
Line (removals)
Description
CV3 064 192 33kV UG cable (gas)
CV3 067 195 66kV UG cable (gas)
CV3 094 222 132kV UG cable (gas)
Table 9 – RIGs lines
0
1
2
3
4
5
6
7
8
Len
gth
in k
m
33kV UG Gas Cables
Asset Stewardship Report 2014 Working draft v0.1 SPN Underground Cables Version 2.0 All of the cost numbers displayed in this document are before the application of on-going efficiencies and real price effects.
UK Power Networks (Operations) Limited. Registered in England and Wales. Registered No. 3870728. Registered Office: Newington House, 237 Southwark Bridge Road, London, SE1 6NP 16
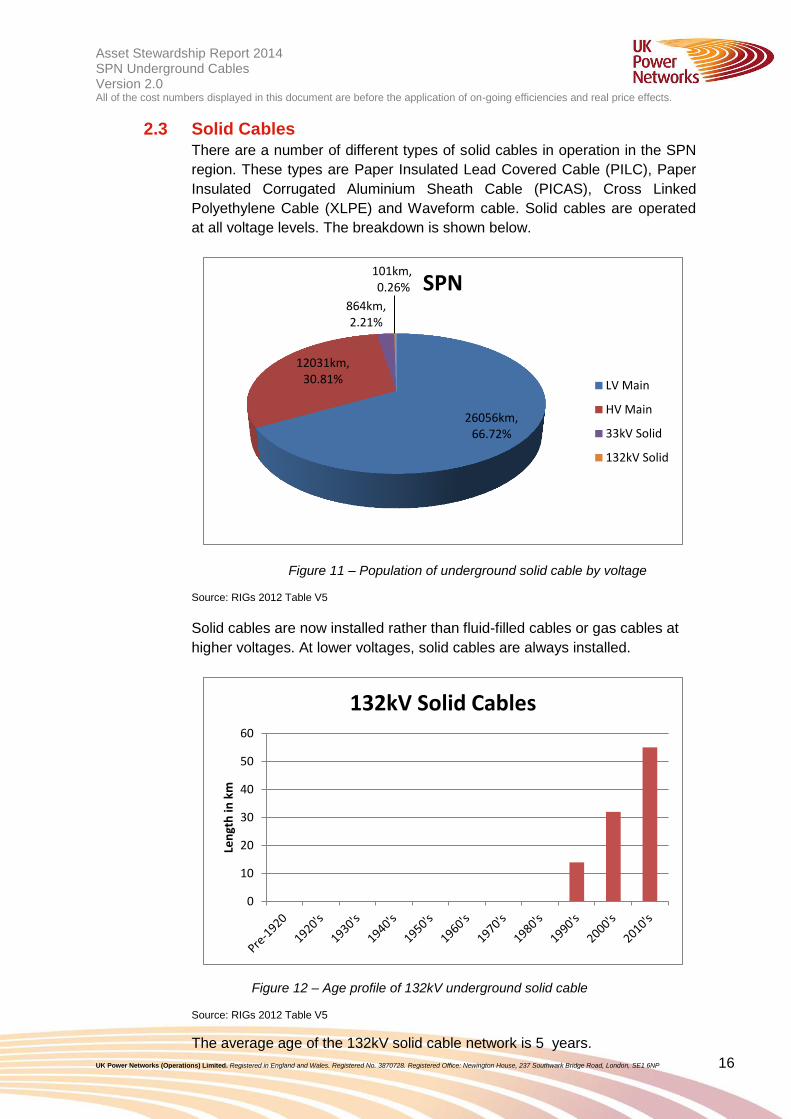
2.3 Solid Cables
There are a number of different types of solid cables in operation in the SPN
region. These types are Paper Insulated Lead Covered Cable (PILC), Paper
Insulated Corrugated Aluminium Sheath Cable (PICAS), Cross Linked
Polyethylene Cable (XLPE) and Waveform cable. Solid cables are operated
at all voltage levels. The breakdown is shown below.
Figure 11 – Population of underground solid cable by voltage
Source: RIGs 2012 Table V5
Solid cables are now installed rather than fluid-filled cables or gas cables at
higher voltages. At lower voltages, solid cables are always installed.
Figure 12 – Age profile of 132kV underground solid cable
Source: RIGs 2012 Table V5
The average age of the 132kV solid cable network is 5 years.
26056km, 66.72%
12031km, 30.81%
864km, 2.21%
101km, 0.26% SPN
LV Main
HV Main
33kV Solid
132kV Solid
0
10
20
30
40
50
60
Len
gth
in k
m
132kV Solid Cables
Asset Stewardship Report 2014 Working draft v0.1 SPN Underground Cables Version 2.0 All of the cost numbers displayed in this document are before the application of on-going efficiencies and real price effects.
UK Power Networks (Operations) Limited. Registered in England and Wales. Registered No. 3870728. Registered Office: Newington House, 237 Southwark Bridge Road, London, SE1 6NP 17
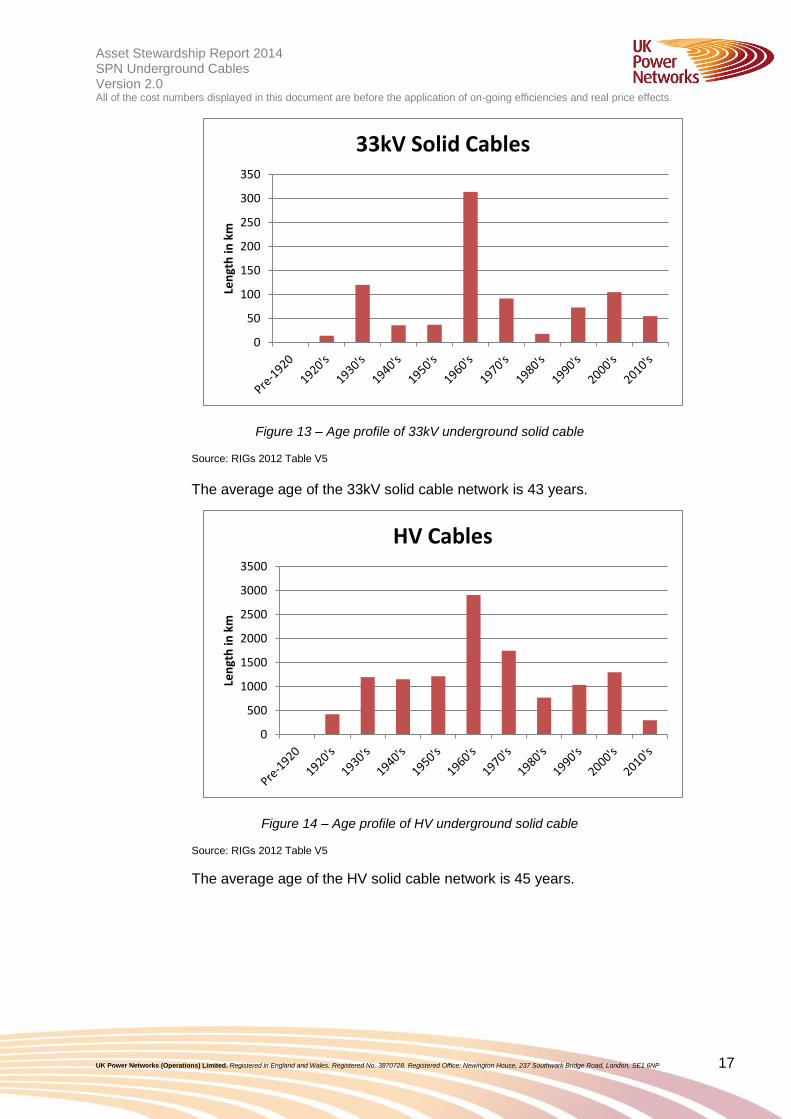
Figure 13 – Age profile of 33kV underground solid cable
Source: RIGs 2012 Table V5
The average age of the 33kV solid cable network is 43 years.
Figure 14 – Age profile of HV underground solid cable
Source: RIGs 2012 Table V5
The average age of the HV solid cable network is 45 years.
0
50
100
150
200
250
300
350
Len
gth
in k
m
33kV Solid Cables
0
500
1000
1500
2000
2500
3000
3500
Len
gth
in k
m
HV Cables
Asset Stewardship Report 2014 Working draft v0.1 SPN Underground Cables Version 2.0 All of the cost numbers displayed in this document are before the application of on-going efficiencies and real price effects.
UK Power Networks (Operations) Limited. Registered in England and Wales. Registered No. 3870728. Registered Office: Newington House, 237 Southwark Bridge Road, London, SE1 6NP 18
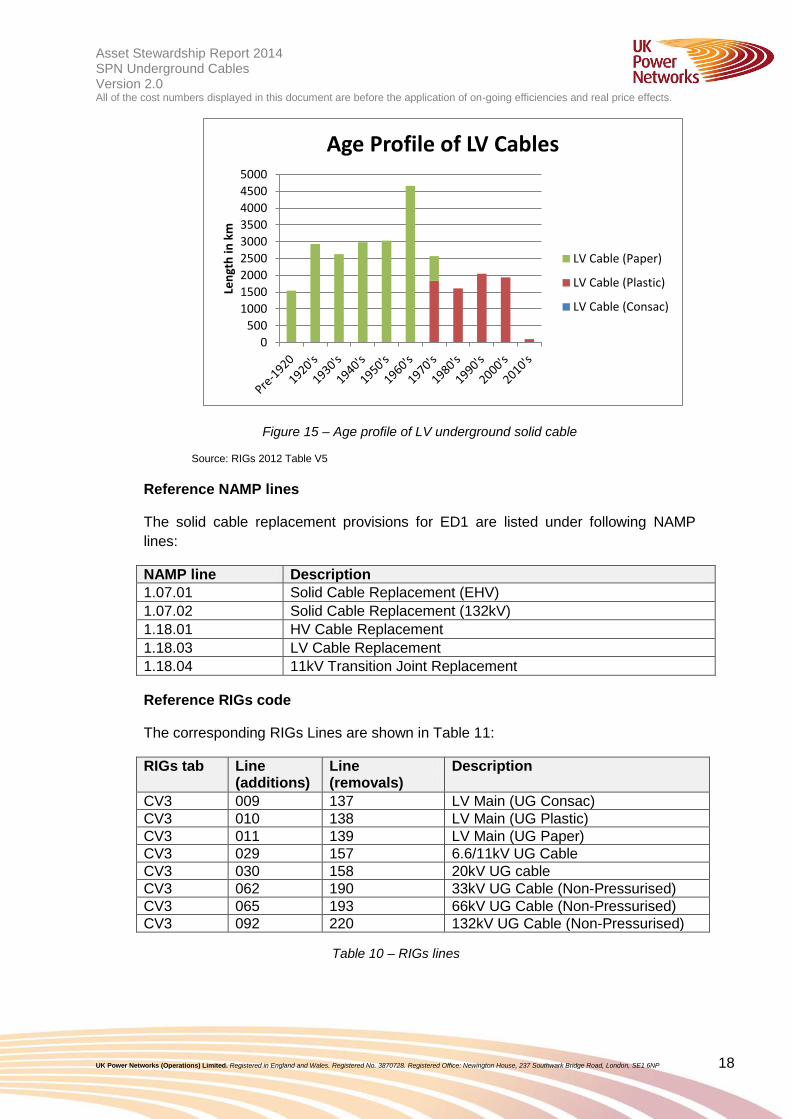
Figure 15 – Age profile of LV underground solid cable
Source: RIGs 2012 Table V5
Reference NAMP lines
The solid cable replacement provisions for ED1 are listed under following NAMP
lines:
NAMP line Description
1.07.01 Solid Cable Replacement (EHV)
1.07.02 Solid Cable Replacement (132kV)
1.18.01 HV Cable Replacement
1.18.03 LV Cable Replacement
1.18.04 11kV Transition Joint Replacement
Reference RIGs code
The corresponding RIGs Lines are shown in Table 11:
RIGs tab Line (additions)
Line (removals)
Description
CV3 009 137 LV Main (UG Consac)
CV3 010 138 LV Main (UG Plastic)
CV3 011 139 LV Main (UG Paper)
CV3 029 157 6.6/11kV UG Cable
CV3 030 158 20kV UG cable
CV3 062 190 33kV UG Cable (Non-Pressurised)
CV3 065 193 66kV UG Cable (Non-Pressurised)
CV3 092 220 132kV UG Cable (Non-Pressurised)
Table 10 – RIGs lines
0
500
1000
1500
2000
2500
3000
3500
4000
4500
5000
Len
gth
in k
m
Age Profile of LV Cables
LV Cable (Paper)
LV Cable (Plastic)
LV Cable (Consac)
Asset Stewardship Report 2014 Working draft v0.1 SPN Underground Cables Version 2.0 All of the cost numbers displayed in this document are before the application of on-going efficiencies and real price effects.
UK Power Networks (Operations) Limited. Registered in England and Wales. Registered No. 3870728. Registered Office: Newington House, 237 Southwark Bridge Road, London, SE1 6NP 19
3.0 Investment Drivers The high-level investment drivers for underground cables are detailed in EDP 00-0009 Asset
Lifecycle Strategy Underground Cables. The principal drivers for the replacement of
underground cables are safety, network security, public safety, environment, condition and
compliance with relevant legislation. The industry code of practice governing fluid filled
cabled is ENA Engineering Technical Report (ETR)135 – Guidance on the operation and
maintenance of Fluid-Filled Cables.
3.1 Investment Drivers for Fluid-Filled Cables
3.1.1 Fluid-filled cable types and known issues
Fluid-filled cables are constructed with either a lead sheath or an aluminium
sheath. Both types of cables have known failure mechanisms.
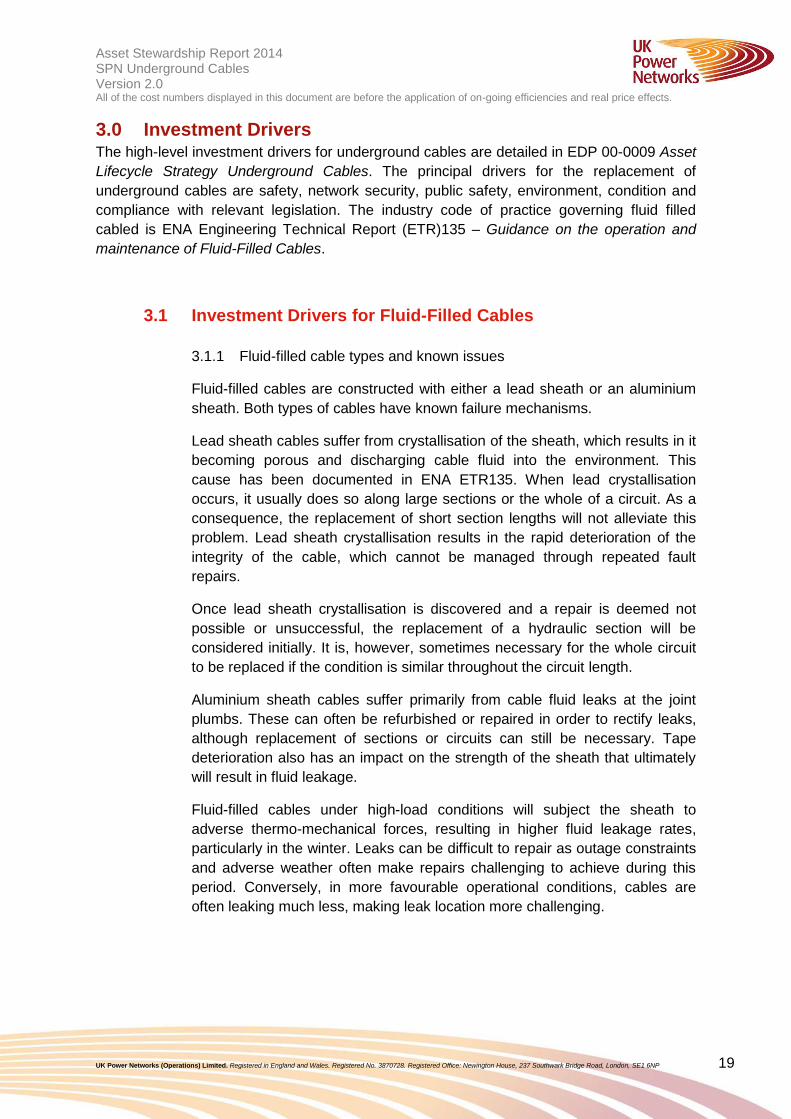
Lead sheath cables suffer from crystallisation of the sheath, which results in it
becoming porous and discharging cable fluid into the environment. This
cause has been documented in ENA ETR135. When lead crystallisation
occurs, it usually does so along large sections or the whole of a circuit. As a
consequence, the replacement of short section lengths will not alleviate this
problem. Lead sheath crystallisation results in the rapid deterioration of the
integrity of the cable, which cannot be managed through repeated fault
repairs.
Once lead sheath crystallisation is discovered and a repair is deemed not
possible or unsuccessful, the replacement of a hydraulic section will be
considered initially. It is, however, sometimes necessary for the whole circuit
to be replaced if the condition is similar throughout the circuit length.
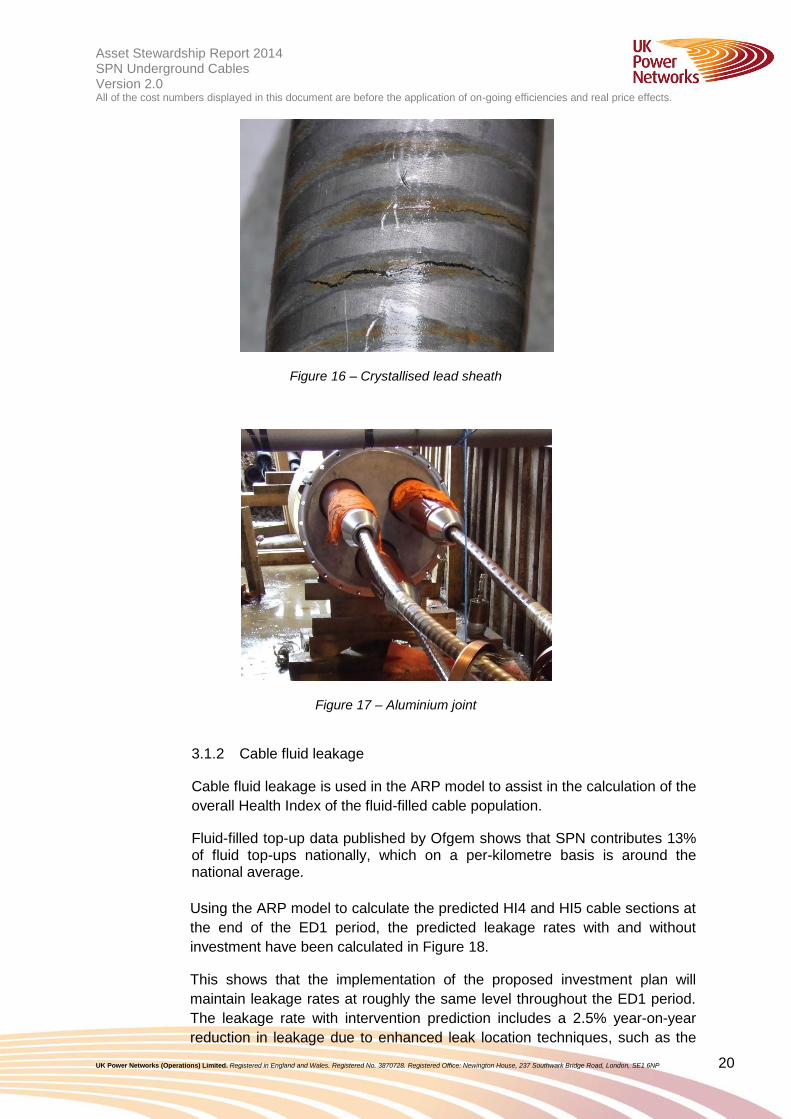
Aluminium sheath cables suffer primarily from cable fluid leaks at the joint
plumbs. These can often be refurbished or repaired in order to rectify leaks,
although replacement of sections or circuits can still be necessary. Tape
deterioration also has an impact on the strength of the sheath that ultimately
will result in fluid leakage.
Fluid-filled cables under high-load conditions will subject the sheath to
adverse thermo-mechanical forces, resulting in higher fluid leakage rates,
particularly in the winter. Leaks can be difficult to repair as outage constraints
and adverse weather often make repairs challenging to achieve during this
period. Conversely, in more favourable operational conditions, cables are
often leaking much less, making leak location more challenging.
Asset Stewardship Report 2014 Working draft v0.1 SPN Underground Cables Version 2.0 All of the cost numbers displayed in this document are before the application of on-going efficiencies and real price effects.
UK Power Networks (Operations) Limited. Registered in England and Wales. Registered No. 3870728. Registered Office: Newington House, 237 Southwark Bridge Road, London, SE1 6NP 20
Figure 16 – Crystallised lead sheath
Figure 17 – Aluminium joint
3.1.2 Cable fluid leakage
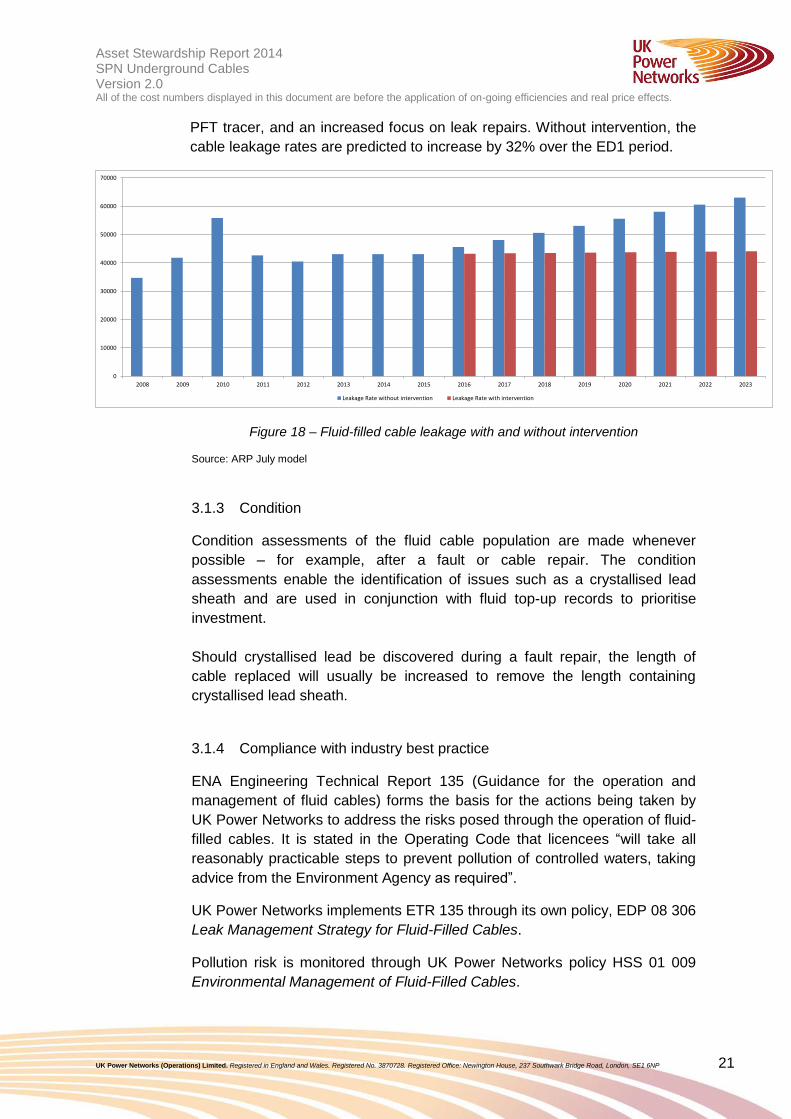
Cable fluid leakage is used in the ARP model to assist in the calculation of the
overall Health Index of the fluid-filled cable population.
Fluid-filled top-up data published by Ofgem shows that SPN contributes 13% of fluid top-ups nationally, which on a per-kilometre basis is around the national average.
Using the ARP model to calculate the predicted HI4 and HI5 cable sections at
the end of the ED1 period, the predicted leakage rates with and without
investment have been calculated in Figure 18.
This shows that the implementation of the proposed investment plan will
maintain leakage rates at roughly the same level throughout the ED1 period.
The leakage rate with intervention prediction includes a 2.5% year-on-year
reduction in leakage due to enhanced leak location techniques, such as the
Asset Stewardship Report 2014 Working draft v0.1 SPN Underground Cables Version 2.0 All of the cost numbers displayed in this document are before the application of on-going efficiencies and real price effects.
UK Power Networks (Operations) Limited. Registered in England and Wales. Registered No. 3870728. Registered Office: Newington House, 237 Southwark Bridge Road, London, SE1 6NP 21
PFT tracer, and an increased focus on leak repairs. Without intervention, the
cable leakage rates are predicted to increase by 32% over the ED1 period.
Figure 18 – Fluid-filled cable leakage with and without intervention
Source: ARP July model
3.1.3 Condition
Condition assessments of the fluid cable population are made whenever
possible – for example, after a fault or cable repair. The condition
assessments enable the identification of issues such as a crystallised lead
sheath and are used in conjunction with fluid top-up records to prioritise
investment.
Should crystallised lead be discovered during a fault repair, the length of
cable replaced will usually be increased to remove the length containing
crystallised lead sheath.
3.1.4 Compliance with industry best practice
ENA Engineering Technical Report 135 (Guidance for the operation and
management of fluid cables) forms the basis for the actions being taken by
UK Power Networks to address the risks posed through the operation of fluid-
filled cables. It is stated in the Operating Code that licencees “will take all
reasonably practicable steps to prevent pollution of controlled waters, taking
advice from the Environment Agency as required”.
UK Power Networks implements ETR 135 through its own policy, EDP 08 306
Leak Management Strategy for Fluid-Filled Cables.
Pollution risk is monitored through UK Power Networks policy HSS 01 009
Environmental Management of Fluid-Filled Cables.
0
10000
20000
30000
40000
50000
60000
70000
2008 2009 2010 2011 2012 2013 2014 2015 2016 2017 2018 2019 2020 2021 2022 2023
Leakage Rate without intervention Leakage Rate with intervention
Asset Stewardship Report 2014 Working draft v0.1 SPN Underground Cables Version 2.0 All of the cost numbers displayed in this document are before the application of on-going efficiencies and real price effects.
UK Power Networks (Operations) Limited. Registered in England and Wales. Registered No. 3870728. Registered Office: Newington House, 237 Southwark Bridge Road, London, SE1 6NP 22
3.1.5 Environmental risk
Compliance with environmental legislation is a key investment driver for fluid-
filled cables. As per the Guidance on the National Operating Code for the
Management of the Fluid Filled Cable system, produced by Energy Network
Association (ENA) and Environment Agency (EA), responsibilities of Network
operators are, in sensitive areas, to:
determine the length of cable passing through the area
report all leaks above 40 litres per month as soon as confirmed (this is
the limit of leak detection/location)
prioritise leak location and repairs in consultation with the Agency.
And in non-sensitive areas to:
report all leaks above 100 litres per month during office hours once
confirmed
put repairs in hand without delay;
put repairs in hand within two months for leaks below 100 litres per
month (subject to the practical thresholds of leak location).
The Environment Agency defines an area of environmental sensitivity as an
area within 50 metres of a watercourse, a major aquifer with high or
intermediate vulnerability or where groundwater is close to the surface (10
metres) or a Source Protection Zone (SPZ) around groundwater abstractions.
The ARP uses environmental sensitivity data in the prioritisation of cable
replacement.
3.2 Investment Drivers for Gas Cables
3.2.1 Gas cable types and known issues
There are two types of gas cables in use: pipeline construction and
impregnated pressure type cables. Pipeline construction gas cables consist of
a cable inserted into a steel pipe that is then filled with pressurised nitrogen.
Pipeline construction cables are often referred to as external pressure cables.
Impregnated pressure cables are sometimes referred to as internal pressure
cables and are laid directly in the ground rather than in a steel pipe.
The ‘Skipper’1 report in 1988 highlighted a number of inherent design flaws
associated with gas compression pipeline cables, including gas leaks, cable
faults, control tape fractures, lead sheath distension, thermal instability of the
insulating papers and the explosive failure of sealing ends.
In particular, the issue of a double circuit outage is a significant concern, with
both circuits feeding a primary substation of a similar gas cable construction.
The failure mode most commonly encountered is the migration of cable
impregnate. If the cable load is increased, even within its rating, the
Asset Stewardship Report 2014 Working draft v0.1 SPN Underground Cables Version 2.0 All of the cost numbers displayed in this document are before the application of on-going efficiencies and real price effects.
UK Power Networks (Operations) Limited. Registered in England and Wales. Registered No. 3870728. Registered Office: Newington House, 237 Southwark Bridge Road, London, SE1 6NP 23
accumulated impregnate expands causing mechanical damage to the cable
construction or joints. It is widely accepted within the industry that the issues
with gas cables are sufficiently severe to warrant their withdrawal from
service. It is UK Power Networks policy to withdraw all gas cables from
service by the end of the ED1 period. It is UK Power Networks’ understanding
that National Grid has already completed a programme of removal of this type
of cable.
1Gas Compression Cable Systems – A review of the current situation. D J Skipper 1988
3.2.2 Repair times and network security
In comparison to other cable types, the repair of a gas cable takes a
considerable amount of time. A typical repair time could easily be 16 weeks
due to the length of time taken to de-gas the cable, locate the fault, obtain
spares, affect the repair and repressurise the system.
During this time, network security is severely compromised as often the
remaining healthy circuit is of an identical construction. Gas cables are also
prone to failure when the load on them is suddenly increased, as is the case
for a single circuit outage.
3.2.3 Availability of spares and repair costs
Spare parts for the gas pressurisation equipment, sealing ends and joints are
now very difficult and expensive to source due to the lack of support offered
by current cable manufacturers. There is also a lack of suitable transition
joints for use with modern XLPE cables. The typical cost for a gas cable
repair is £200-£250k. This is a key investment driver for the removal of these
types of cable.
3.3 Investment Drivers for Solid Cables
The investment drivers for the replacement of solid cables are based primarily
on a case-by-case condition assessment of faulted cable sections. It is UK
Power Networks policy to collect cable samples for assessment following a
cable fault, as specified in EDS 02-0043, Solid Cable Non-Load Related
Repair and Refurbishment.
In addition, partial discharge mapping is used at HV to identify circuits on
raised activity levels and any potential failure risk, although this in isolation
would not be sufficient an investment driver for the replacement of a cable
without further condition assessment.
Asset Stewardship Report 2014 Working draft v0.1 SPN Underground Cables Version 2.0 All of the cost numbers displayed in this document are before the application of on-going efficiencies and real price effects.
UK Power Networks (Operations) Limited. Registered in England and Wales. Registered No. 3870728. Registered Office: Newington House, 237 Southwark Bridge Road, London, SE1 6NP 24
3.4 Cable Fault Rates
The figures show fault rates for cables by voltage level. It is not possible to
separate out different cable types from the data. Overall cable fault rates are
increasing at all voltages.
Figure 19 – Fault trends of 132kV underground cable
Source: UKPN Faults Cube
Figure 20 – Fault trends of EHV underground cable
Source: UKPN Faults Cube
0.0000
0.0020
0.0040
0.0060
0.0080
0.0100
0.0120
0.0140
2007 2008 2009 2010 2011 2012
Fau
lts/
UG
Cab
le (
km)
Year
SPN 132KV UG Cable
All Faults
Poor Condn Due ToAge & Wear
Linear (Poor CondnDue To Age & Wear)
0.0000
0.0020
0.0040
0.0060
0.0080
0.0100
0.0120
0.0140
0.0160
0.0180
0.0200
2007 2008 2009 2010 2011 2012
Fau
lts
/ U
G C
able
(km
)
Year
SPN EHV UG Cable
All Faults
Poor Condn Due ToAge & Wear
Linear (Poor CondnDue To Age & Wear)
Asset Stewardship Report 2014 Working draft v0.1 SPN Underground Cables Version 2.0 All of the cost numbers displayed in this document are before the application of on-going efficiencies and real price effects.
UK Power Networks (Operations) Limited. Registered in England and Wales. Registered No. 3870728. Registered Office: Newington House, 237 Southwark Bridge Road, London, SE1 6NP 25
Figure 21 – Fault trends of HV underground cable
Source: UKPN Faults Cube
Figure 22 – Fault trends of LV underground cable
Source: UKPN Faults Cube
0.0000
0.0100
0.0200
0.0300
0.0400
0.0500
0.0600
0.0700
0.0800
2007 2008 2009 2010 2011 2012
Fau
lts
/ U
G C
able
(km
)
Year
SPN HV UG Cable
All Faults
Poor Condn Due ToAge & Wear
Linear (Poor CondnDue To Age & Wear)
0.0000
0.0100
0.0200
0.0300
0.0400
0.0500
0.0600
0.0700
0.0800
0.0900
0.1000
2007 2008 2009 2010 2011 2012
Fau
lts
/ U
G C
able
(km
)
Year
SPN LV UG Cable
All Faults
Poor Condn Due ToAge & Wear
Linear (Poor CondnDue To Age & Wear)

Asset Stewardship Report 2014 Working draft v0.1 SPN Underground Cables Version 2.0 All of the cost numbers displayed in this document are before the application of on-going efficiencies and real price effects.
UK Power Networks (Operations) Limited. Registered in England and Wales. Registered No. 3870728. Registered Office: Newington House, 237 Southwark Bridge Road, London, SE1 6NP 26
4.0 Asset Assessment
4.1 Health Assessment of Fluid-Filled Cables (FFC)
An innovative asset health modelling tool, the Asset Risk and Prioritisation
(ARP) model, has been developed for several asset categories including fluid-
filled cables for all voltages. The methodology behind the modelling is the
same for all asset categories but the fluid-filled cable model has been tailored
specifically to utilise the historical oil leak data.
4.1.1 Calculation of HI
The general methodology for the ARP model can be found in Commentary
Document 15: Model Overview.
4.1.2 Condition information
The initial age-based health index is modified by incorporating condition-
assessment measurements, as well as the history of oil leaks and defects.
The details of each of these factors are discussed below.
Condition factors – The fluid-filled cables model includes a number of
condition points, including oversheath condition, bedding condition, screen
condition, conductor condition, armour condition, metallic sheath condition,
insulation condition and paper condition.
Field engineers are requested to provide condition data when repairing
cables. However, this is a relatively recent initiative, so at present no
comprehensive sets of condition data are available. Available data is entered
into the model and set up as such that each condition point is assigned a
score of 1 or 4 and then translated to a condition factor.
Oil leak history – The critical issue for fluid-filled cables is the condition of the
fluid containment system. The leak history of each section is a useful proxy
for this and the model includes oil leaks for up to five years. The annual oil
loss per section is then estimated as the weighted average of the actual oil
loss figures over the past five years.
Defect history – The rate of occurrence of defects can be considered to be an
indication of both the condition of an asset and the likelihood of future defects
or failure. At present, the model has no defect parameters defined but this is
a facility that could be used in the future.
Final Health Index – An overall factor value is derived for each cable section
and is the highest of the following three factors (as described in Condition
information):
condition
oil leakage history
fault history.
An interim final Health Index is calculated for each section. This is the product
Asset Stewardship Report 2014 Working draft v0.1 SPN Underground Cables Version 2.0 All of the cost numbers displayed in this document are before the application of on-going efficiencies and real price effects.
UK Power Networks (Operations) Limited. Registered in England and Wales. Registered No. 3870728. Registered Office: Newington House, 237 Southwark Bridge Road, London, SE1 6NP 27
of the overall factor value and the initial age-related Health Index (see age-
related Health Index section).
Initial HI(1)Oil Leak History
Factor
Leak Cause
History
Final HI(y0)
Observed
Condition Ratings
Figure 23 – Flowchart showing calculation of Health Index from ARP model
4.2 Asset Criticality
The ARP model can also be used to calculate the criticality of a particular
hydraulic section of the FFC asset. This is then output in the form of a
Criticality Index 1 to 4, with 1 being the least critical and 4 being the most. A
detailed methodology for calculating the criticality index can be found in
Commentary Document 15: Model Overview.
In the FFC ARP model, there are five main areas considered when
calculating the criticality of an assets; network performance, safety,
operational expenditure, capital expenditure and environment. A number of
key factors are considered in each of these areas.
This area of the model is still in its infancy and in the process of being further
developed.
4.3 Network Risk
The network risk in monetary terms can also be calculated in the ARP model.
This is done using the probability of failure, the criticality and the
consequence of failure. The probability of failure is calculated using the
current Health Index of the item of FFC, and the criticality is calculated as
described in the previous section. The consequence of failure is the average
cost to either repair or replace the section of cables following one of failure
modes.
This area of the model is still in its infancy and in the process of being further
developed.
4.4 Data Validation
All data used in the ARP model is subject to validation against a set of data
requirements. The requirements ensure data is within specified limits, up to
date and in the correct format for use in the model. On completion of the
validation process, an exception report is issued providing details of every
non-compliance allowing continual improvement of data quality.
Asset Stewardship Report 2014 Working draft v0.1 SPN Underground Cables Version 2.0 All of the cost numbers displayed in this document are before the application of on-going efficiencies and real price effects.
UK Power Networks (Operations) Limited. Registered in England and Wales. Registered No. 3870728. Registered Office: Newington House, 237 Southwark Bridge Road, London, SE1 6NP 28
4.5 Data Verification
A sampling approach to data verification follows each data upload to ensure
accurate transfer into the models.
4.6 Data Completeness
The completeness, accuracy and timeliness of the data used in the ARP
model are routinely checked. For the results of the data used in the fluid-filled
cable model, refer to Table 12.
Area Result
Completeness 87 %
Accuracy Not available*
Timeliness Not available*
Table 11 – Data CAT scores
Source: Decision Lab report “CAT Scoring” 8th February 2013 * Not available: quality standards are under review
The completeness score is a combination of fluid filled name plate data and
pumping information in asset register. The completeness of any data used in
the network risk section, such as customer numbers, is also used in the
overall completeness score.
The accuracy and timeliness scores are a measure of how reliable and
correct the condition data stored in Ellipse is. As condition data is not
collected for fluid-filled cables, this analysis has not been completed.
4.7 Health Assessment of Gas Cables
Due to issues described in Section 3, all gas cables operated by UK Power
Networks have been assessed as being at end-of-life. It is UK Power
Networks policy to remove these cables from service by the end of ED1.
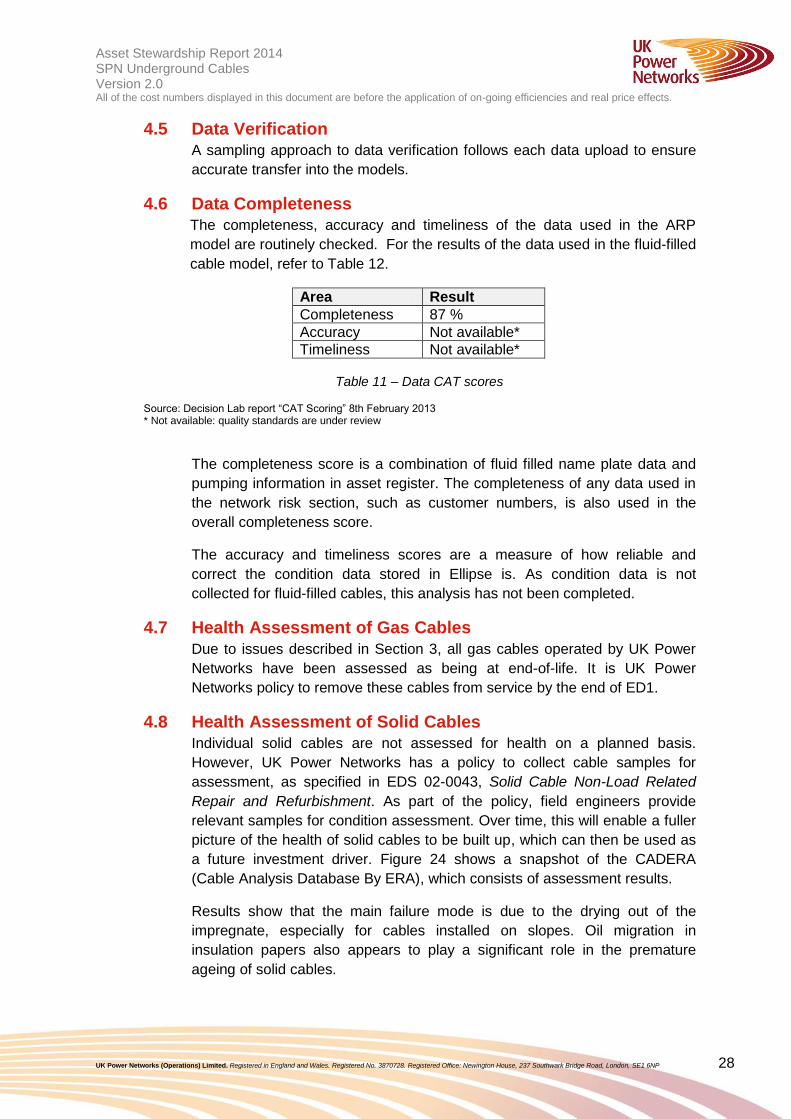
4.8 Health Assessment of Solid Cables
Individual solid cables are not assessed for health on a planned basis.
However, UK Power Networks has a policy to collect cable samples for
assessment, as specified in EDS 02-0043, Solid Cable Non-Load Related
Repair and Refurbishment. As part of the policy, field engineers provide
relevant samples for condition assessment. Over time, this will enable a fuller
picture of the health of solid cables to be built up, which can then be used as
a future investment driver. Figure 24 shows a snapshot of the CADERA
(Cable Analysis Database By ERA), which consists of assessment results.
Results show that the main failure mode is due to the drying out of the
impregnate, especially for cables installed on slopes. Oil migration in
insulation papers also appears to play a significant role in the premature
ageing of solid cables.
Asset Stewardship Report 2014 Working draft v0.1 SPN Underground Cables Version 2.0 All of the cost numbers displayed in this document are before the application of on-going efficiencies and real price effects.
UK Power Networks (Operations) Limited. Registered in England and Wales. Registered No. 3870728. Registered Office: Newington House, 237 Southwark Bridge Road, London, SE1 6NP 29
Figure 24 – Snapshot of the cable analysis database
5.0 Intervention Policies
5.1 Intervention Options
5.1.1 Interventions for fluid-filled cables
Interventions on fluid-filled cables consist of the replacement of a complete
circuit, the replacement of a hydraulic section or leak repair. The type of
intervention used is driven by application of the investment drivers highlighted
in section 3.
If possible, a leak repair is carried out. However, if crystallised lead is
discovered, consideration will be given to the replacement of a hydraulic
section or possibly the circuit depending on leak-rate history and the extent of
the sheath degradation.
5.1.2 Interventions for gas cables
UK Power Networks policy is to replace all gas cables before the end of ED1
due to the issues described in section 3. Hence the only planned intervention
option is the replacement of the circuit with a solid XLPE cable. In an
unplanned outage situation, a repair or partial overlay may have to be
considered in the context of restoring the security of the network for
customers.
5.1.3 Interventions for solid cables
Interventions on solid cables consist of either a cable repair or the
replacement of faulted cable sections. A reactive replacement of cable may
also be considered if the cable in poor condition is discovered during other
work. This decision is usually based on a condition assessment by a field
engineer in consultation with Asset Management as required.
Asset Stewardship Report 2014 Working draft v0.1 SPN Underground Cables Version 2.0 All of the cost numbers displayed in this document are before the application of on-going efficiencies and real price effects.
UK Power Networks (Operations) Limited. Registered in England and Wales. Registered No. 3870728. Registered Office: Newington House, 237 Southwark Bridge Road, London, SE1 6NP 30
6.0 Innovation UK Power Networks has taken several initiatives to explore innovative solutions in order to
improve the performance of the underground cable network.
6.1 Fluid-Filled Cables
6.1.1 Online pressure monitoring
The use of pressure transducers to monitor fluid-filled cable operating
pressures remotely has the potential to provide a more holistic approach to
maintenance and inspection based on real-time condition against the current
regime of periodic-based scheduled tasks. The topping up of fluid reservoirs
could be done based on trends rather than planned ‘milk runs’. This
equipment is in the process of being installed during the DPCR5 period and is
expected to be complete by end of DPCR5 period.
Figure 25 – Online pressure-monitoring system
6.1.2 PFT leak location
In order to offset the long-term leakage from fluid-filled cables, an innovative
solution has been developed and deployed. A minute amount of
Perflurocarbon Tracer (PFT) is added to the cable fluid. PFT introduced in this
way is vented to the atmosphere at the point where a leak in the cable is
present, where it can be detected using highly sensitive mobile equipment.
This method greatly improves performance in the detection and resolution of
leaking cable incidents, reducing cost of work, outage time and environmental
impact.
A
B
Remote Cable Pressure Monitoring
Environmental Sensitivity Maps
pumping figures recorded directly into asset register
Water
Nature

Asset Stewardship Report 2014 Working draft v0.1 SPN Underground Cables Version 2.0 All of the cost numbers displayed in this document are before the application of on-going efficiencies and real price effects.
UK Power Networks (Operations) Limited. Registered in England and Wales. Registered No. 3870728. Registered Office: Newington House, 237 Southwark Bridge Road, London, SE1 6NP 31
Figure 26 – PFT leak location system
6.1.3 FFC self-healing
This project will identify, develop and assess self-repairing systems for fluid-
filled cable sheath, such that damage to the sheath will selfheal, avoiding oil
leakage and a subsequent environmental clean-up.
This is an IFI project currently at the R&D stage. Phase 1 is due to complete
in January 2015 and is an exercise to identify potentially suitable additives.
There would potentially be subsequent laboratory and field trial phases,
depending on the success of this phase.
6.2 Gas-Filled Cables
UK Power Networks has introduced a novel and innovative design of three
core XLPE cable for retrofitting into the existing steel pipe, which used to
contain obsolete and poorly performing gas compression cable. It is a low-
cost solution with less environmental impact compared to a new open-cut
trench. Work also involved the development and type testing of a transition
joint to existing gas compression cable.
The technique has already been successfully trialled by UK Power Networks
on the Laleham–Twickenham circuits in the SPN licence area.
6.3 Solid Cables
6.3.1 Innovative design of 132kV and 66kV solid cables
Design modification opportunities are being explored to reduce the cost of the
132kV and 66kV solid cables through design modification by eliminating
copper and reducing insulation thickness without comprising the integrity and
quality of the cables.
This is a UK Power Networks-led initiative in conjunction with cable
manufacturers.
Asset Stewardship Report 2014 Working draft v0.1 SPN Underground Cables Version 2.0 All of the cost numbers displayed in this document are before the application of on-going efficiencies and real price effects.
UK Power Networks (Operations) Limited. Registered in England and Wales. Registered No. 3870728. Registered Office: Newington House, 237 Southwark Bridge Road, London, SE1 6NP 32
6.3.2 Innovative design of 33kV and 11kV solid cables
Design modifications being developed will remove all copper. The reduction in
cost is still to be determined, but will be in the region of 10 to 20%, and the
cables will be less susceptible to theft.
This is a UK Power Networks-led initiative in conjunction with cable
manufacturers.
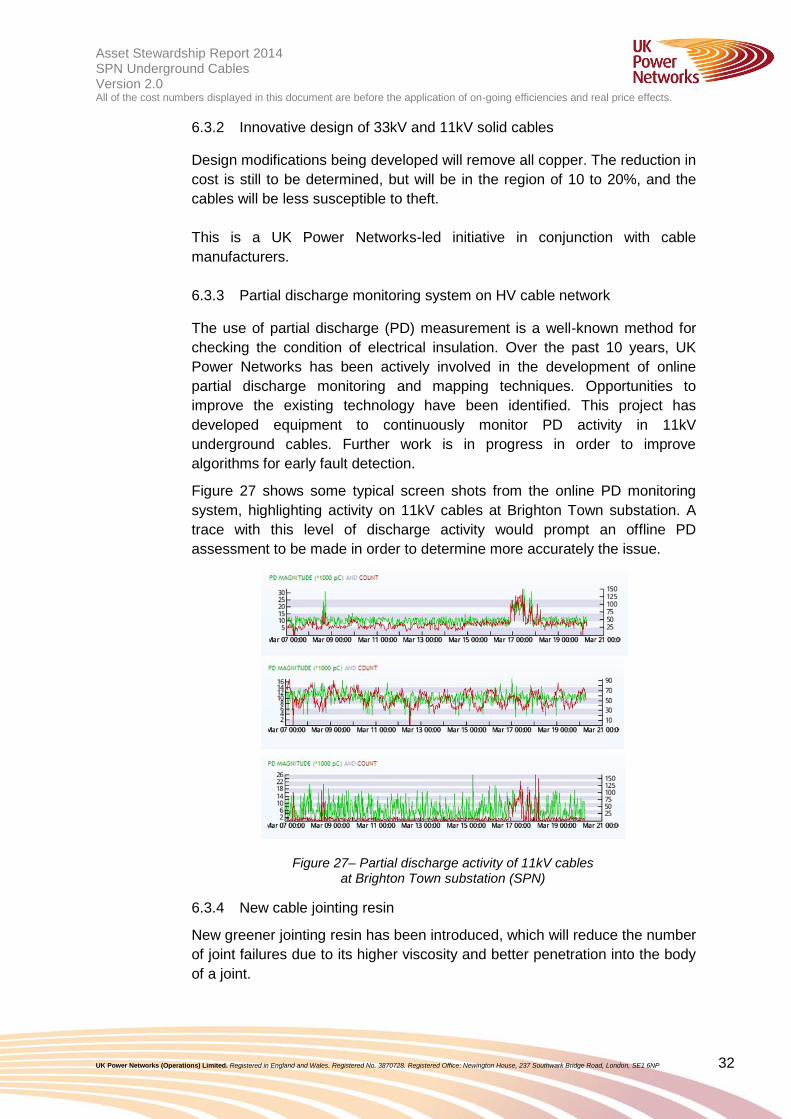
6.3.3 Partial discharge monitoring system on HV cable network
The use of partial discharge (PD) measurement is a well-known method for
checking the condition of electrical insulation. Over the past 10 years, UK
Power Networks has been actively involved in the development of online
partial discharge monitoring and mapping techniques. Opportunities to
improve the existing technology have been identified. This project has
developed equipment to continuously monitor PD activity in 11kV
underground cables. Further work is in progress in order to improve
algorithms for early fault detection.
Figure 27 shows some typical screen shots from the online PD monitoring
system, highlighting activity on 11kV cables at Brighton Town substation. A
trace with this level of discharge activity would prompt an offline PD
assessment to be made in order to determine more accurately the issue.
Figure 27– Partial discharge activity of 11kV cables at Brighton Town substation (SPN)
6.3.4 New cable jointing resin
New greener jointing resin has been introduced, which will reduce the number
of joint failures due to its higher viscosity and better penetration into the body
of a joint.
Asset Stewardship Report 2014 Working draft v0.1 SPN Underground Cables Version 2.0 All of the cost numbers displayed in this document are before the application of on-going efficiencies and real price effects.
UK Power Networks (Operations) Limited. Registered in England and Wales. Registered No. 3870728. Registered Office: Newington House, 237 Southwark Bridge Road, London, SE1 6NP 33
7.0 Expenditure Requirements for Underground Cables
7.1 Method
7.1.1 Fluid-filled cables
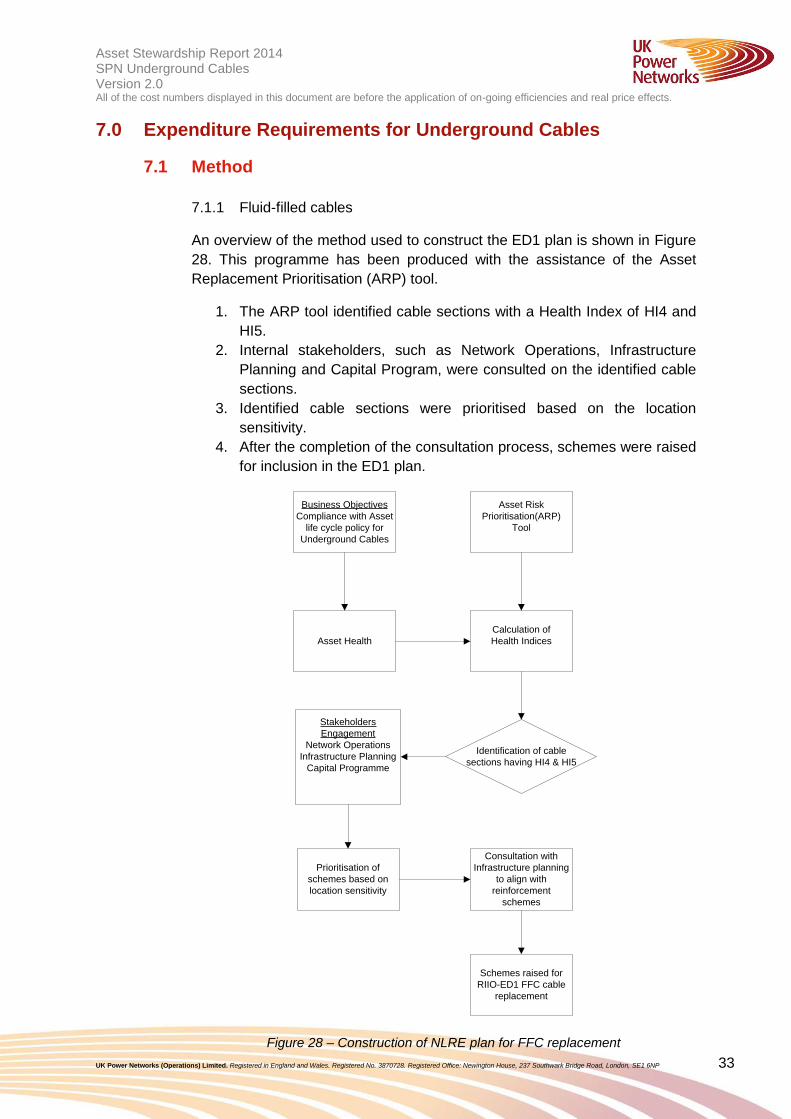
An overview of the method used to construct the ED1 plan is shown in Figure
28. This programme has been produced with the assistance of the Asset
Replacement Prioritisation (ARP) tool.
1. The ARP tool identified cable sections with a Health Index of HI4 and
HI5.
2. Internal stakeholders, such as Network Operations, Infrastructure
Planning and Capital Program, were consulted on the identified cable
sections.
3. Identified cable sections were prioritised based on the location
sensitivity.
4. After the completion of the consultation process, schemes were raised
for inclusion in the ED1 plan.
Figure 28 – Construction of NLRE plan for FFC replacement
Business Objectives
Compliance with Asset
life cycle policy for
Underground Cables
Asset Health
Asset Risk
Prioritisation(ARP)
Tool
Calculation of
Health Indices
Identification of cable
sections having HI4 & HI5
Stakeholders
Engagement
Network Operations
Infrastructure Planning
Capital Programme
Prioritisation of
schemes based on
location sensitivity
Consultation with
Infrastructure planning
to align with
reinforcement
schemes
Schemes raised for
RIIO-ED1 FFC cable
replacement
Asset Stewardship Report 2014 Working draft v0.1 SPN Underground Cables Version 2.0 All of the cost numbers displayed in this document are before the application of on-going efficiencies and real price effects.
UK Power Networks (Operations) Limited. Registered in England and Wales. Registered No. 3870728. Registered Office: Newington House, 237 Southwark Bridge Road, London, SE1 6NP 34
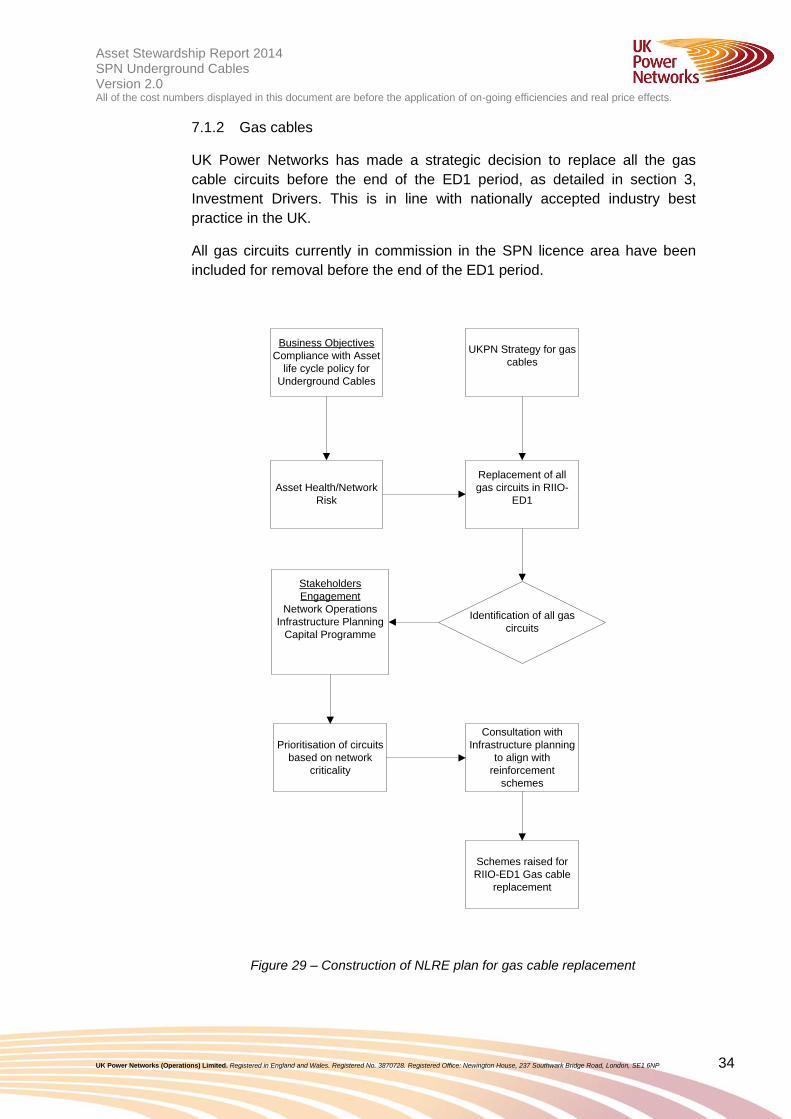
7.1.2 Gas cables
UK Power Networks has made a strategic decision to replace all the gas
cable circuits before the end of the ED1 period, as detailed in section 3,
Investment Drivers. This is in line with nationally accepted industry best
practice in the UK.
All gas circuits currently in commission in the SPN licence area have been
included for removal before the end of the ED1 period.
Business Objectives
Compliance with Asset
life cycle policy for
Underground Cables
Asset Health/Network
Risk
UKPN Strategy for gas
cables
Replacement of all
gas circuits in RIIO-
ED1
Identification of all gas
circuits
Stakeholders
Engagement
Network Operations
Infrastructure Planning
Capital Programme
Prioritisation of circuits
based on network
criticality
Consultation with
Infrastructure planning
to align with
reinforcement
schemes
Schemes raised for
RIIO-ED1 Gas cable
replacement
Figure 29 – Construction of NLRE plan for gas cable replacement

Asset Stewardship Report 2014 Working draft v0.1 SPN Underground Cables Version 2.0 All of the cost numbers displayed in this document are before the application of on-going efficiencies and real price effects.
UK Power Networks (Operations) Limited. Registered in England and Wales. Registered No. 3870728. Registered Office: Newington House, 237 Southwark Bridge Road, London, SE1 6NP 35
7.1.3 Solid cables
This programme is compiled on the basis of historical replacement levels.
Post-fault analysis is carried out on historical faults. Solid cables are replaced
with a modern XLPE cable, but only when their condition is found to be poor.
Solid cable condition is not recorded in Ellipse, but partial discharge mapping
can be used on short lengths of circuit where poor fault history is found.
The following process has been adopted for the ED1 solid cable replacement
plan.
Figure 30 – Construction of NLRE plan for solid cable replacement
Business Objectives
Compliance with Asset
life cycle policy for
Underground Cables
Asset Condition/
Network Risk
Analysis of historical
achievements/fault
trends
Planning of solid cable
replacement provision
Stakeholders
Engagement
Network Operations
Infrastructure Planning
Capital Programme
Provision raised for
RIIO-ED1 Solid cable
replacement
UK Power Networks
policy for cables with
solid insulation
Asset Stewardship Report 2014 Working draft v0.1 SPN Underground Cables Version 2.0 All of the cost numbers displayed in this document are before the application of on-going efficiencies and real price effects.
UK Power Networks (Operations) Limited. Registered in England and Wales. Registered No. 3870728. Registered Office: Newington House, 237 Southwark Bridge Road, London, SE1 6NP 36
7.2 Constructing the Plan
7.2.1 Fluid-filled cables
Intervention volumes – The business objective throughout the planning
process for ED1 was to invest at a level that will maintain maintain leakage
rates at roughly the same level throughout the ED1 period. To achieve this,
the ARP model was used to determine the HI profiles for 132kV and 33kV
FFC cable sections at the end of DPCR5 and at the end of ED1 to project
how the number of HI4s and HI5s would increase without investment.
Figure 31 and Figure 32 show how the lengths of HI4 and HI5 fluid-filled cable
are projected to change over the remaining period of DPCR5 and ED1 both
with and without investment.
HI profiles
Figure 31– HI profiles of 132kV fluid-filled cables (FFC)
Source: ARP Model W_FFC_25Jul2012_March 2014 submission
0
10
20
30
40
50
60
70
80
90
HI1 HI2 HI3 HI4 HI5
Len
gth
in
km
132kV FFC
Start of ED1
End of ED1 withoutInvestment
End of ED1 withInvestment
Asset Stewardship Report 2014 Working draft v0.1 SPN Underground Cables Version 2.0 All of the cost numbers displayed in this document are before the application of on-going efficiencies and real price effects.
UK Power Networks (Operations) Limited. Registered in England and Wales. Registered No. 3870728. Registered Office: Newington House, 237 Southwark Bridge Road, London, SE1 6NP 37
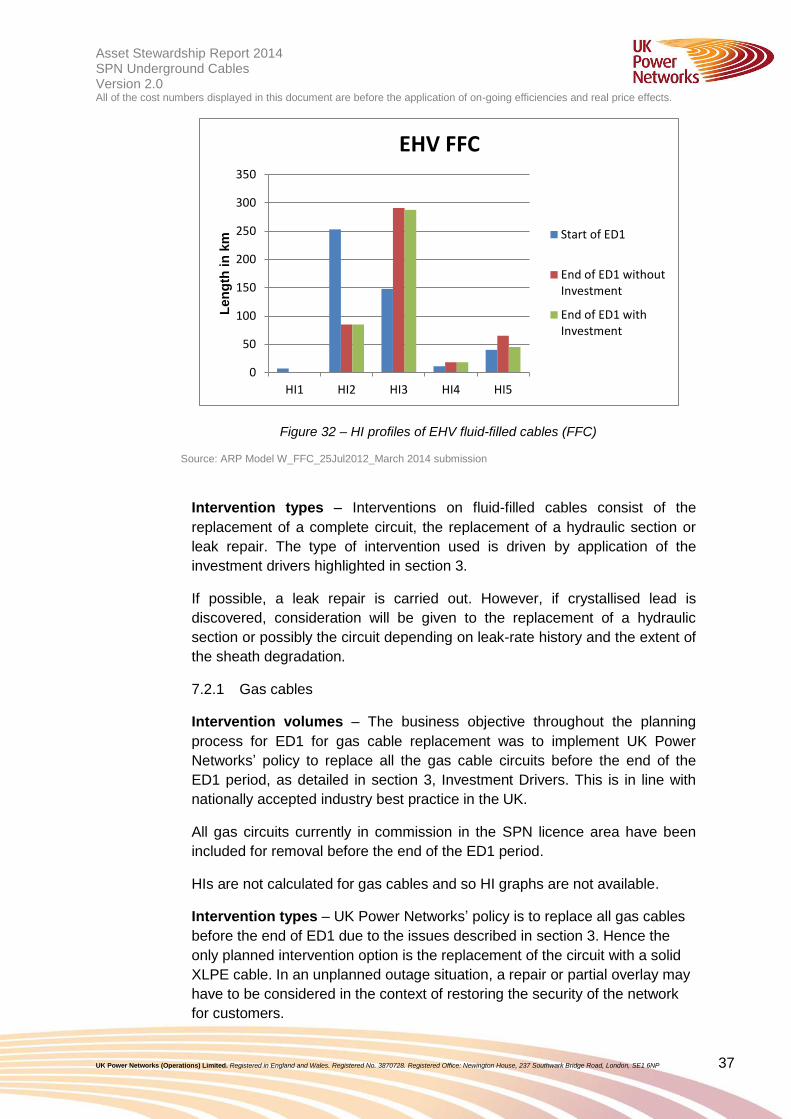
Figure 32 – HI profiles of EHV fluid-filled cables (FFC)
Source: ARP Model W_FFC_25Jul2012_March 2014 submission
Intervention types – Interventions on fluid-filled cables consist of the
replacement of a complete circuit, the replacement of a hydraulic section or
leak repair. The type of intervention used is driven by application of the
investment drivers highlighted in section 3.
If possible, a leak repair is carried out. However, if crystallised lead is
discovered, consideration will be given to the replacement of a hydraulic
section or possibly the circuit depending on leak-rate history and the extent of
the sheath degradation.
7.2.1 Gas cables
Intervention volumes – The business objective throughout the planning
process for ED1 for gas cable replacement was to implement UK Power
Networks’ policy to replace all the gas cable circuits before the end of the
ED1 period, as detailed in section 3, Investment Drivers. This is in line with
nationally accepted industry best practice in the UK.
All gas circuits currently in commission in the SPN licence area have been
included for removal before the end of the ED1 period.
HIs are not calculated for gas cables and so HI graphs are not available.
Intervention types – UK Power Networks’ policy is to replace all gas cables
before the end of ED1 due to the issues described in section 3. Hence the
only planned intervention option is the replacement of the circuit with a solid
XLPE cable. In an unplanned outage situation, a repair or partial overlay may
have to be considered in the context of restoring the security of the network
for customers.
0
50
100
150
200
250
300
350
HI1 HI2 HI3 HI4 HI5
Len
gth
in
km
EHV FFC
Start of ED1
End of ED1 withoutInvestment
End of ED1 withInvestment
Asset Stewardship Report 2014 Working draft v0.1 SPN Underground Cables Version 2.0 All of the cost numbers displayed in this document are before the application of on-going efficiencies and real price effects.
UK Power Networks (Operations) Limited. Registered in England and Wales. Registered No. 3870728. Registered Office: Newington House, 237 Southwark Bridge Road, London, SE1 6NP 38
7.2.2 Solid cables
Intervention volumes – The business objective throughout the planning
process for ED1 solid cable replacement plans was to use historical
replacement trends to inform the future replacement programme.
HIs are not calculated for solid cables and hence HI graphs are not available. Intervention types – Interventions on solid cables consist of either a cable
repair or the replacement of faulted cable sections. A reactive replacement of
cable may also be considered if the cable in poor condition is discovered
during other work or a circuit with an unacceptably high fault rate is identified.
7.3 Additional Considerations
The Network Asset Management Plan (NAMP) has been used to ensure that
the proposed underground cable projects are not duplicated in the Non-Load
Related Expenditure and Load Related plans.
Stakeholder engagement was an important part of the process to finalise the
ED1 plan. Network Operations, Infrastructure Planning and Capital
Programme were consulted through formal peer review sessions and various
informal discussions during the construction of the ED1 plan.
Asset Stewardship Report 2014 Working draft v0.1 SPN Underground Cables Version 2.0 All of the cost numbers displayed in this document are before the application of on-going efficiencies and real price effects.
UK Power Networks (Operations) Limited. Registered in England and Wales. Registered No. 3870728. Registered Office: Newington House, 237 Southwark Bridge Road, London, SE1 6NP 39
7.4 Asset Volumes and Expenditure
7.4.1 132kV Fluid-Filled Cables
In total, there are 10.50km of 132kV fluid-filled cables proposed for
intervention during ED1. This represents 4.4% of the installed population of
132kV FFC in SPN. The ED2 figures shown in the graph below have been
derived on the basis of assumption that similar rate of ED1 investment will
continue in ED2. Further work will be done in ED1 to explore additional
intervention options that can be used to extend asset life.
Figure 33 – Intervention volumes of 132kV fluid-filled cables
Sources: DPCR4 & DPCR5 FBPQ - Table NL3 (DPCR5 FBPQ) DPCR5 (First three years) - 2013/2014 RIGS CV3 table DPCR5 (Last Two years) - 2013/2014 RIGS CV3 table ED1 - 2013/2014 RIGS CV3 table ED2 - Similar rate of investment in ED1 assumed
The estimated cost of the proposed investment plan in ED1 is £13.81m.
Figure 34 – Intervention cost of 132kV fluid-filled cables
Sources: DPCR4 - Table NL1 (DPCR5 FBPQ) DPCR5 (First three years) - 2013/2014 RIGS CV3 table DPCR5 (Last Two years) – 14thJune NAMP (Table JLI) ED1 – 19th February NAMP 2014 (Table J Less Indirect) ED2 - Average from ED1 costs
0.00
2.00
4.00
6.00
8.00
10.00
12.00
2006 2007 2008 2009 2010 2011 2012 2013 2014 2015 2016 2017 2018 2019 2020 2021 2022 2023 2024 2025 2026 2027 2028 2029 2030 2031
Vo
lum
es
in
km
Intervention Volumes of 132kV FFC
132kV UG Cable (Oil) (Removals) FBPQ
DPCR4 DPCR5 ED1 ED2
Asset Stewardship Report 2014 Working draft v0.1 SPN Underground Cables Version 2.0 All of the cost numbers displayed in this document are before the application of on-going efficiencies and real price effects.
UK Power Networks (Operations) Limited. Registered in England and Wales. Registered No. 3870728. Registered Office: Newington House, 237 Southwark Bridge Road, London, SE1 6NP 40
7.4.2 EHV fluid-filled cables
In total, there are 23.20km of EHV hydraulic sections proposed for
intervention during ED1. This represents 4.9% of the installed population of
EHV FFC in SPN. The ED2 figures shown in the graph below have been
derived on the basis of assumption that similar rate of ED1 investment will
continue in ED2. Further work will be done in ED1 to explore additional
intervention options that can be used to extend asset life.
Figure 35 – Intervention volumes of EHV fluid-filled cables
Sources: DPCR4 & DPCR5 FBPQ - Table NL3 (DPCR5 FBPQ) DPCR5 (First three years) - 2013/2014 RIGS CV3 table DPCR5 (Last Two years) - 2013/2014 RIGS CV3 table ED1 - 2013/2014 RIGS CV3 table ED2 - Similar rate of investment in ED1 assumed
The estimated cost of the proposed investment plan in ED1 is £7.51m.
Figure 36 – Intervention cost of EHV fluid-filled cables
Sources: DPCR4 - Table NL1 (DPCR5 FBPQ) DPCR5 (First three years) - 2013/2014 RIGS CV3 table DPCR5 (Last Two years) – 14thJune NAMP (Table JLI) ED1 – 19th February NAMP 2014 (Table J Less Indirect) ED2 - Average from ED1 costs
0.00
2.00
4.00
6.00
8.00
10.00
12.00
14.00
16.00
18.00
20.00
2006 2007 2008 2009 2010 2011 2012 2013 2014 2015 2016 2017 2018 2019 2020 2021 2022 2023 2024 2025 2026 2027 2028 2029 2030 2031
Vo
lum
es
in
km
Intervention Volumes of EHV FFC
EHV UG Cable (Oil) (Removals) FBPQ
DPCR4 DPCR5 ED1 ED2
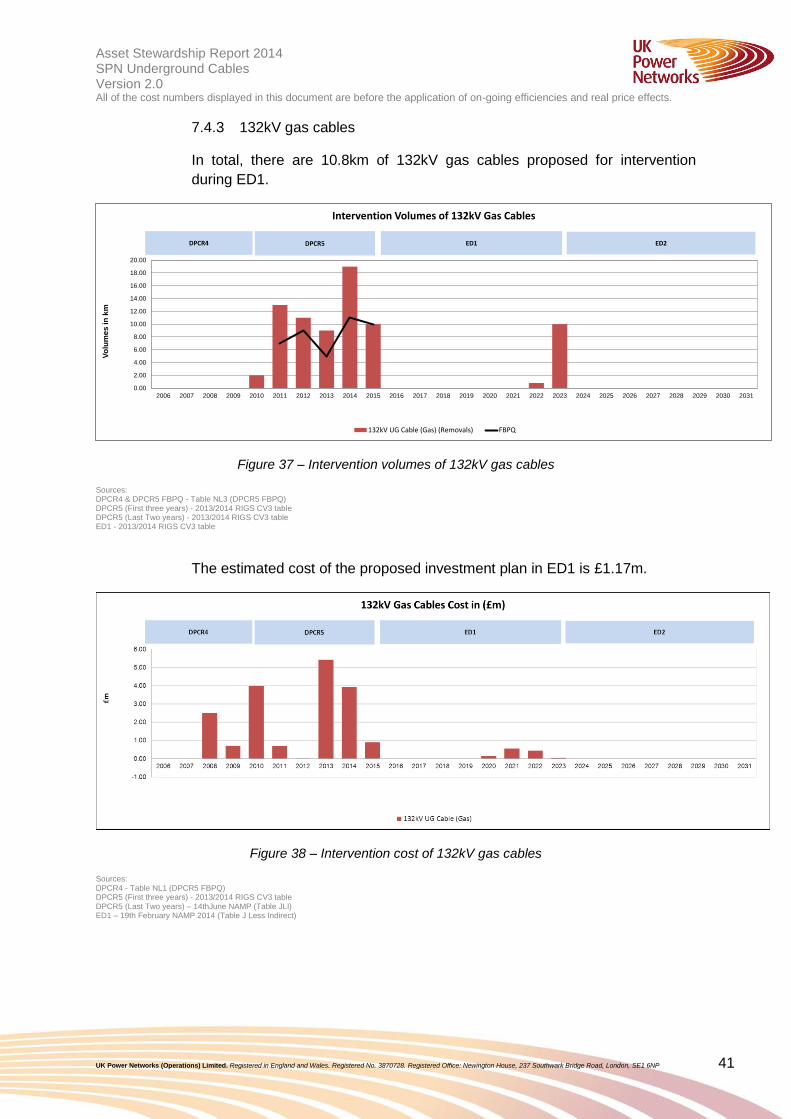
Asset Stewardship Report 2014 Working draft v0.1 SPN Underground Cables Version 2.0 All of the cost numbers displayed in this document are before the application of on-going efficiencies and real price effects.
UK Power Networks (Operations) Limited. Registered in England and Wales. Registered No. 3870728. Registered Office: Newington House, 237 Southwark Bridge Road, London, SE1 6NP 41
7.4.3 132kV gas cables
In total, there are 10.8km of 132kV gas cables proposed for intervention
during ED1.
Figure 37 – Intervention volumes of 132kV gas cables
Sources: DPCR4 & DPCR5 FBPQ - Table NL3 (DPCR5 FBPQ) DPCR5 (First three years) - 2013/2014 RIGS CV3 table DPCR5 (Last Two years) - 2013/2014 RIGS CV3 table ED1 - 2013/2014 RIGS CV3 table
The estimated cost of the proposed investment plan in ED1 is £1.17m.
Figure 38 – Intervention cost of 132kV gas cables
Sources: DPCR4 - Table NL1 (DPCR5 FBPQ) DPCR5 (First three years) - 2013/2014 RIGS CV3 table DPCR5 (Last Two years) – 14thJune NAMP (Table JLI) ED1 – 19th February NAMP 2014 (Table J Less Indirect)
0.00
2.00
4.00
6.00
8.00
10.00
12.00
14.00
16.00
18.00
20.00
2006 2007 2008 2009 2010 2011 2012 2013 2014 2015 2016 2017 2018 2019 2020 2021 2022 2023 2024 2025 2026 2027 2028 2029 2030 2031
Vo
lum
es
in
km
Intervention Volumes of 132kV Gas Cables
132kV UG Cable (Gas) (Removals) FBPQ
DPCR4 DPCR5 ED1 ED2
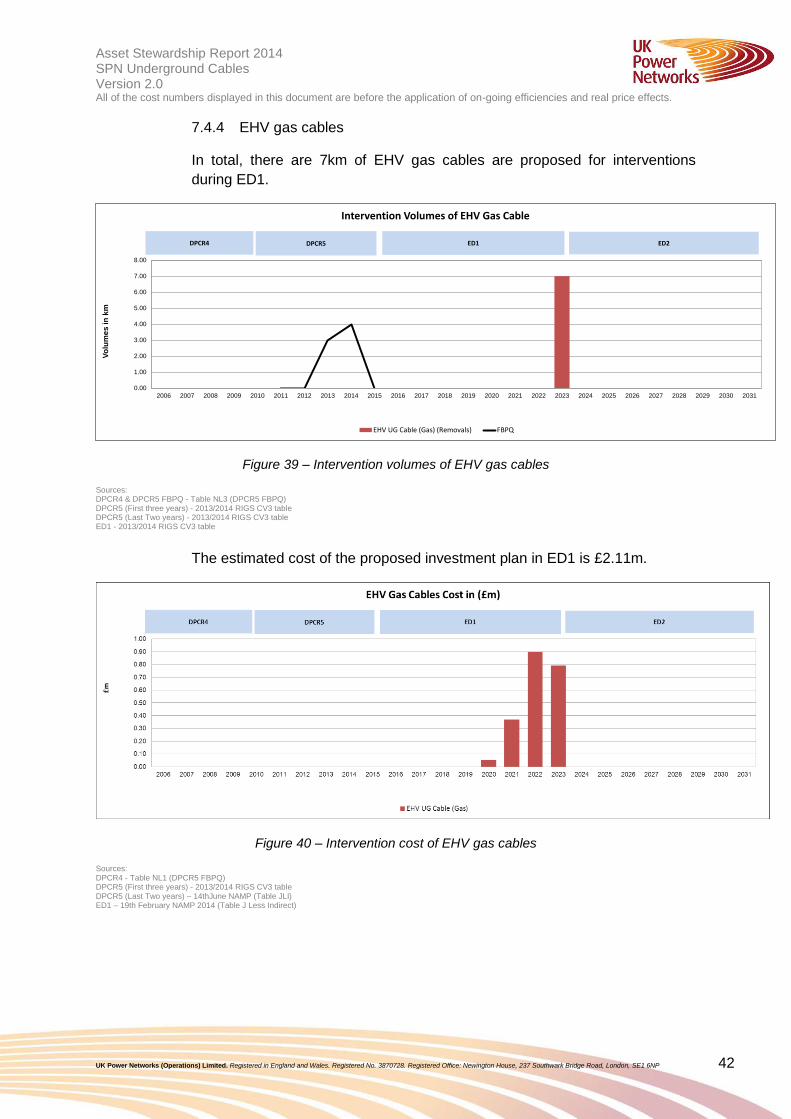
Asset Stewardship Report 2014 Working draft v0.1 SPN Underground Cables Version 2.0 All of the cost numbers displayed in this document are before the application of on-going efficiencies and real price effects.
UK Power Networks (Operations) Limited. Registered in England and Wales. Registered No. 3870728. Registered Office: Newington House, 237 Southwark Bridge Road, London, SE1 6NP 42
7.4.4 EHV gas cables
In total, there are 7km of EHV gas cables are proposed for interventions
during ED1.
Figure 39 – Intervention volumes of EHV gas cables
Sources: DPCR4 & DPCR5 FBPQ - Table NL3 (DPCR5 FBPQ) DPCR5 (First three years) - 2013/2014 RIGS CV3 table DPCR5 (Last Two years) - 2013/2014 RIGS CV3 table ED1 - 2013/2014 RIGS CV3 table
The estimated cost of the proposed investment plan in ED1 is £2.11m.
Figure 40 – Intervention cost of EHV gas cables
Sources: DPCR4 - Table NL1 (DPCR5 FBPQ) DPCR5 (First three years) - 2013/2014 RIGS CV3 table DPCR5 (Last Two years) – 14thJune NAMP (Table JLI) ED1 – 19th February NAMP 2014 (Table J Less Indirect)
0.00
1.00
2.00
3.00
4.00
5.00
6.00
7.00
8.00
2006 2007 2008 2009 2010 2011 2012 2013 2014 2015 2016 2017 2018 2019 2020 2021 2022 2023 2024 2025 2026 2027 2028 2029 2030 2031
Vo
lum
es
in
km
Intervention Volumes of EHV Gas Cable
EHV UG Cable (Gas) (Removals) FBPQ
DPCR4 DPCR5 ED1 ED2
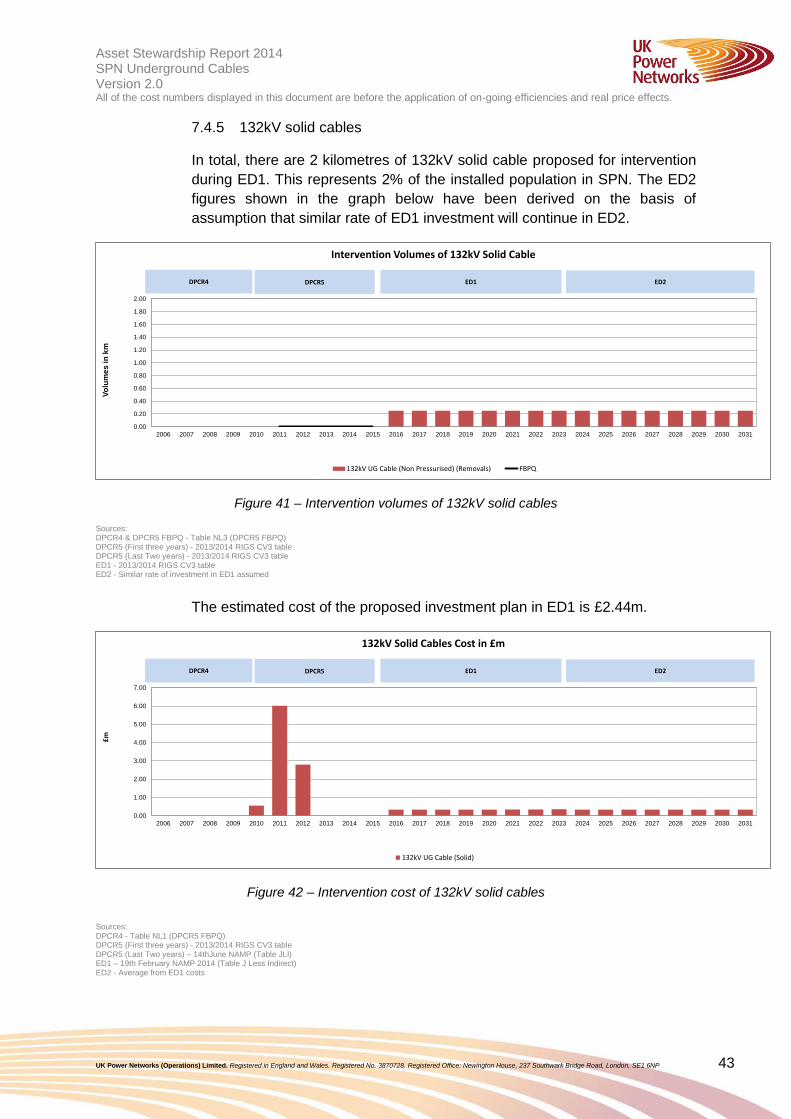
Asset Stewardship Report 2014 Working draft v0.1 SPN Underground Cables Version 2.0 All of the cost numbers displayed in this document are before the application of on-going efficiencies and real price effects.
UK Power Networks (Operations) Limited. Registered in England and Wales. Registered No. 3870728. Registered Office: Newington House, 237 Southwark Bridge Road, London, SE1 6NP 43
7.4.5 132kV solid cables
In total, there are 2 kilometres of 132kV solid cable proposed for intervention
during ED1. This represents 2% of the installed population in SPN. The ED2
figures shown in the graph below have been derived on the basis of
assumption that similar rate of ED1 investment will continue in ED2.
Figure 41 – Intervention volumes of 132kV solid cables
Sources: DPCR4 & DPCR5 FBPQ - Table NL3 (DPCR5 FBPQ) DPCR5 (First three years) - 2013/2014 RIGS CV3 table DPCR5 (Last Two years) - 2013/2014 RIGS CV3 table ED1 - 2013/2014 RIGS CV3 table ED2 - Similar rate of investment in ED1 assumed
The estimated cost of the proposed investment plan in ED1 is £2.44m.
Figure 42 – Intervention cost of 132kV solid cables
Sources: DPCR4 - Table NL1 (DPCR5 FBPQ) DPCR5 (First three years) - 2013/2014 RIGS CV3 table DPCR5 (Last Two years) – 14thJune NAMP (Table JLI) ED1 – 19th February NAMP 2014 (Table J Less Indirect) ED2 - Average from ED1 costs
0.00
0.20
0.40
0.60
0.80
1.00
1.20
1.40
1.60
1.80
2.00
2006 2007 2008 2009 2010 2011 2012 2013 2014 2015 2016 2017 2018 2019 2020 2021 2022 2023 2024 2025 2026 2027 2028 2029 2030 2031
Vo
lum
es
in
km
Intervention Volumes of 132kV Solid Cable
132kV UG Cable (Non Pressurised) (Removals) FBPQ
DPCR4 DPCR5 ED1 ED2
0.00
1.00
2.00
3.00
4.00
5.00
6.00
7.00
2006 2007 2008 2009 2010 2011 2012 2013 2014 2015 2016 2017 2018 2019 2020 2021 2022 2023 2024 2025 2026 2027 2028 2029 2030 2031
£m
132kV Solid Cables Cost in £m
132kV UG Cable (Solid)
DPCR4 DPCR5 ED1 ED2
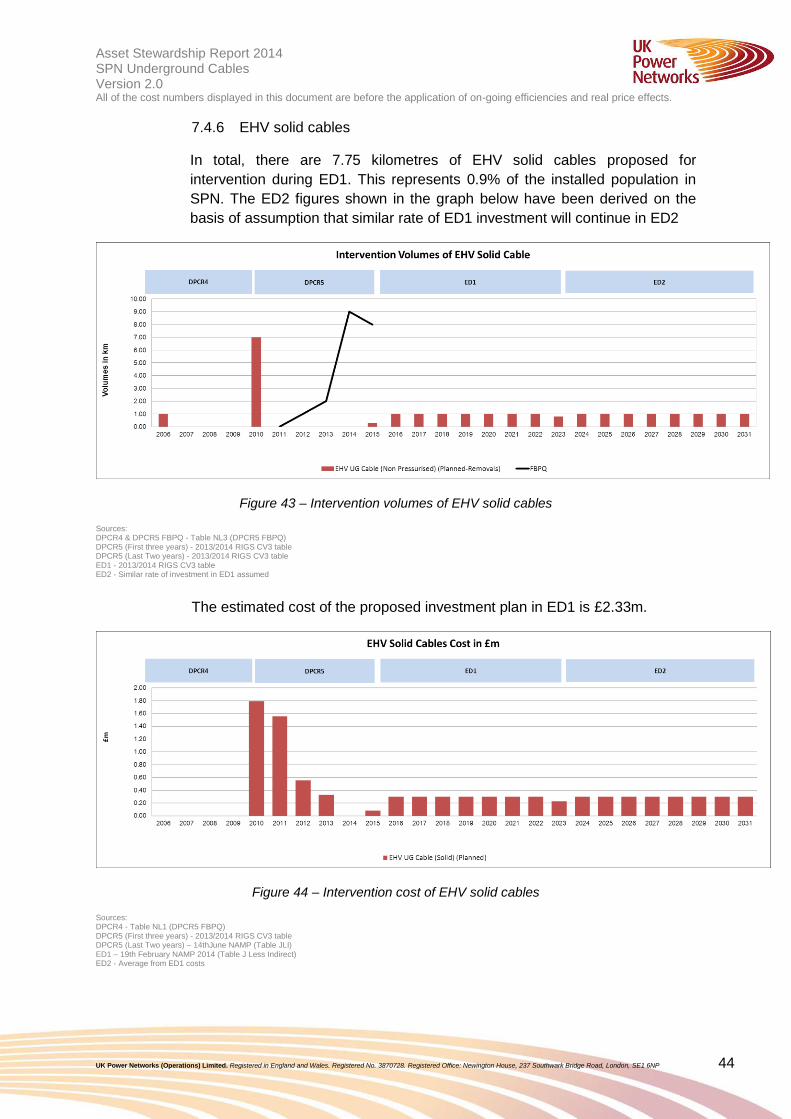
Asset Stewardship Report 2014 Working draft v0.1 SPN Underground Cables Version 2.0 All of the cost numbers displayed in this document are before the application of on-going efficiencies and real price effects.
UK Power Networks (Operations) Limited. Registered in England and Wales. Registered No. 3870728. Registered Office: Newington House, 237 Southwark Bridge Road, London, SE1 6NP 44
7.4.6 EHV solid cables
In total, there are 7.75 kilometres of EHV solid cables proposed for
intervention during ED1. This represents 0.9% of the installed population in
SPN. The ED2 figures shown in the graph below have been derived on the
basis of assumption that similar rate of ED1 investment will continue in ED2
Figure 43 – Intervention volumes of EHV solid cables
Sources: DPCR4 & DPCR5 FBPQ - Table NL3 (DPCR5 FBPQ) DPCR5 (First three years) - 2013/2014 RIGS CV3 table DPCR5 (Last Two years) - 2013/2014 RIGS CV3 table ED1 - 2013/2014 RIGS CV3 table ED2 - Similar rate of investment in ED1 assumed
The estimated cost of the proposed investment plan in ED1 is £2.33m.
Figure 44 – Intervention cost of EHV solid cables
Sources: DPCR4 - Table NL1 (DPCR5 FBPQ) DPCR5 (First three years) - 2013/2014 RIGS CV3 table DPCR5 (Last Two years) – 14thJune NAMP (Table JLI) ED1 – 19th February NAMP 2014 (Table J Less Indirect) ED2 - Average from ED1 costs
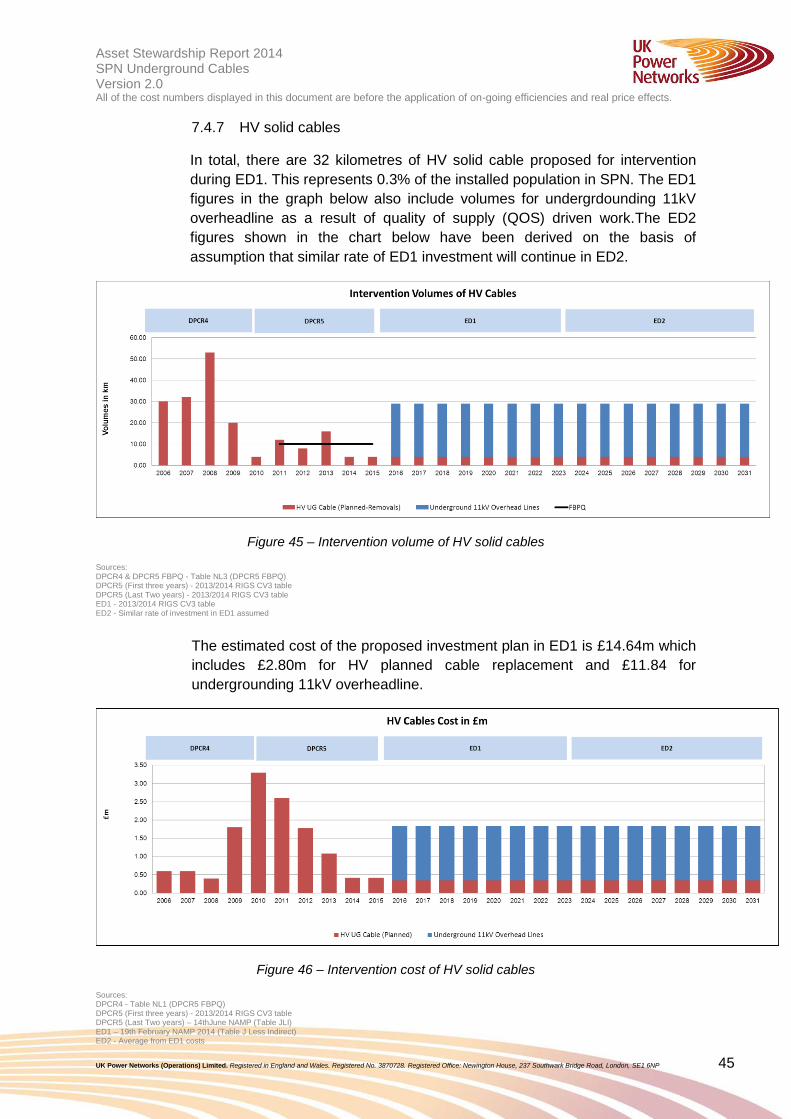
Asset Stewardship Report 2014 Working draft v0.1 SPN Underground Cables Version 2.0 All of the cost numbers displayed in this document are before the application of on-going efficiencies and real price effects.
UK Power Networks (Operations) Limited. Registered in England and Wales. Registered No. 3870728. Registered Office: Newington House, 237 Southwark Bridge Road, London, SE1 6NP 45
7.4.7 HV solid cables
In total, there are 32 kilometres of HV solid cable proposed for intervention
during ED1. This represents 0.3% of the installed population in SPN. The ED1
figures in the graph below also include volumes for undergrdounding 11kV
overheadline as a result of quality of supply (QOS) driven work.The ED2
figures shown in the chart below have been derived on the basis of
assumption that similar rate of ED1 investment will continue in ED2.
Figure 45 – Intervention volume of HV solid cables
Sources: DPCR4 & DPCR5 FBPQ - Table NL3 (DPCR5 FBPQ) DPCR5 (First three years) - 2013/2014 RIGS CV3 table DPCR5 (Last Two years) - 2013/2014 RIGS CV3 table ED1 - 2013/2014 RIGS CV3 table ED2 - Similar rate of investment in ED1 assumed
The estimated cost of the proposed investment plan in ED1 is £14.64m which
includes £2.80m for HV planned cable replacement and £11.84 for
undergrounding 11kV overheadline.
Figure 46 – Intervention cost of HV solid cables
Sources: DPCR4 - Table NL1 (DPCR5 FBPQ) DPCR5 (First three years) - 2013/2014 RIGS CV3 table DPCR5 (Last Two years) – 14thJune NAMP (Table JLI) ED1 – 19th February NAMP 2014 (Table J Less Indirect) ED2 - Average from ED1 costs
Asset Stewardship Report 2014 Working draft v0.1 SPN Underground Cables Version 2.0 All of the cost numbers displayed in this document are before the application of on-going efficiencies and real price effects.
UK Power Networks (Operations) Limited. Registered in England and Wales. Registered No. 3870728. Registered Office: Newington House, 237 Southwark Bridge Road, London, SE1 6NP 46
7.4.8 LV solid cables
In total, there are 32 kilometres of LV solid cable proposed for intervention
during ED1. This represents 0.1% of the installed population in SPN. The ED2
figures shown in the graph below have been derived on the basis of
assumption that similar rate of ED1 investment will continue in ED2.
Figure 47 – Intervention volume of LV solid cables
Sources: DPCR4 & DPCR5 FBPQ - Table NL3 (DPCR5 FBPQ) DPCR5 (First three years) - 2013/2014 RIGS CV3 table DPCR5 (Last Two years) - 2013/2014 RIGS CV3 table ED1 - 2013/2014 RIGS CV3 table ED2 - Similar rate of investment in ED1 assumed
The estimated cost of the proposed investment plan in ED1 is £3.36m.
Figure 48 – Intervention cost of LV solid cables
Sources: DPCR4 - Table NL1 (DPCR5 FBPQ) DPCR5 (First three years) - 2013/2014 RIGS CV3 table DPCR5 (Last Two years) – 14thJune NAMP (Table JLI) ED1 – 19th February NAMP 2014 (Table J Less Indirect) ED2 - Average from ED1 costs
Asset Stewardship Report 2014 Working draft v0.1 SPN Underground Cables Version 2.0 All of the cost numbers displayed in this document are before the application of on-going efficiencies and real price effects.
UK Power Networks (Operations) Limited. Registered in England and Wales. Registered No. 3870728. Registered Office: Newington House, 237 Southwark Bridge Road, London, SE1 6NP 47
7.4.9 FFC joints and ancillary equipment
Intervention volumes
Description 15/16 16/17 17/18 18/19 19/20 20/21 21/22 22/23
Replace aluminium cable joint plumbs
14 14 14 14 14 14 14 14
Install remote pressure-monitoring equipment
7 7 7 7 7 7 7 7
Replace pressurised cables ancillary equipment (tanks, gauges, etc.)
2 2 2 2 2 2 2 2
Table 12 – Intervention volumes of joints and ancillary equipment
Intervention cost in £m
Description 15/16 16/17 17/18 18/19 19/20 20/21 21/22 22/23
Replace aluminium cable joint plumbs
0.20 0.20 0.20 0.20 0.20 0.20 0.20 0.20
Install remote pressure-monitoring equipment
0.01 0.01 0.01 0.01 0.01 0.01 0.01 0.01
Replace pressurised cables ancillary equipment (tanks, gauges, etc.)
0.04 0.04 0.04 0.04 0.04 0.04 0.04 0.04
Table 13 – Intervention cost of joints and ancillary equipment in £m
7.5 Commentary
7.5.1 Fluid Filled Cables
As previously discussed in section 3, Investment Drivers, SPN has a leakage
rate per kilometre of installed fluid-filled cable that is around the national
average.
The hydraulic sections and circuits identified for replacement in ED1 with the
assistance of the ARP model represent 5% of the total fluid-filled cable
population in SPN and yet are responsible for 24% of the fluid leakage.
The health indices calculated using the ARP model are based primarily on
age and leakage history of the hydraulic circuit. These identified circuits were
then investigated in detail based on the available condition information, which
is gathered when available during fault repairs.
Asset Stewardship Report 2014 Working draft v0.1 SPN Underground Cables Version 2.0 All of the cost numbers displayed in this document are before the application of on-going efficiencies and real price effects.
UK Power Networks (Operations) Limited. Registered in England and Wales. Registered No. 3870728. Registered Office: Newington House, 237 Southwark Bridge Road, London, SE1 6NP 48
7.5.2 Gas cables
As previously discussed in section 3, Investment Drivers, it is UK Power
Networks’ policy to withdraw all gas cables from service by the end of ED1.
Following the Skipper report in 1988, there has been industry-wide support for
the phased decommissioning of the gas cables.
This was justified because of the potential for explosive sealing end failures,
gas leaks that require an immediate and prolonged circuit outage, a higher-
than-average cable fault rate and inherent design flaws.
It is understood that all of the DNOs in the UK are currently completing or
have completed a gas cable replacement programme, with National Grid
completing a replacement programme in 2001. These issues are discussed
fully in section 3.2.1.
The work to comply with this policy decision has already commenced in
DPCR5, with interventions on gas cables well in excess of FBPQ levels, and
the plan will complete in ED1.
7.5.3 Solid cables
The replacement of solid cables is based on a case-by-case condition
assessment of faulted sections. Named schemes are not identified in
advance and the planned provision is based primarily on historical levels of
activity in each of the voltage level areas, as can been seen in the graphs in
section 7.4.5 to 7.4.8
Asset Stewardship Report 2014 Working draft v0.1 SPN Underground Cables Version 2.0 All of the cost numbers displayed in this document are before the application of on-going efficiencies and real price effects.
UK Power Networks (Operations) Limited. Registered in England and Wales. Registered No. 3870728. Registered Office: Newington House, 237 Southwark Bridge Road, London, SE1 6NP 49
7.6 Sensitivity Analysis and Plan Validation
An independent report has been carried out by Decision Lab to understand
how the Health Index profile of assets may change if the average asset life
does not turn out as predicted. The full results are shown in Appendix 6.
Average life
change
2015 percentage HI profile
HI1 HI2 HI3 HI4 HI5
-4 29.9 37.7 28.9 1.8 1.1
-2 29.9 42.6 24.3 1.8 1.1
-1 30.6 42.3 24.3 2.1 0.7
0 30.6 42.3 24.3 2.1 0.7
1 32.4 40.5 24.3 2.1 0.7
2 32.7 42.3 23.6 0.7 0.7
4 33.8 47.2 17.6 1.1 0.0
Average life
change
2023 percentage HI profile
HI1 HI2 HI3 HI4 HI5
-4 29.6 19.0 45.4 2.8 2.8
-2 29.6 25.0 39.8 2.8 2.8
-1 29.6 25.7 38.7 2.8 2.8
0 29.6 26.8 38.0 4.2 1.1
1 29.6 29.6 35.6 4.2 1.1
2 29.6 31.7 34.5 3.2 1.1
4 29.6 35.9 29.9 3.2 1.1
Average
life change
2015 percentage HI profile
HI1 HI2 HI3 HI4 HI5
-4 0.0 58.9 33.8 5.6 1.6
-2 0.0 61.5 33.3 4.5 0.9
-1 1.4 61.0 32.4 4.5 0.9
0 1.4 62.7 30.5 4.5 0.9
1 1.4 64.8 29.6 3.5 0.9
2 2.3 66.7 27.5 2.8 0.9
4 2.3 67.6 28.4 0.9 0.7
Average
life change
2023 percentage HI profile
HI1 HI2 HI3 HI4 HI5
-4 0.0 14.6 74.6 1.9 8.7
-2 0.0 30.3 60.1 2.1 7.3
-1 0.0 35.7 54.7 3.5 5.9
0 0.0 36.9 53.5 4.2 5.2
1 0.0 40.6 49.8 5.2 4.2
2 0.0 46.0 44.4 5.9 3.8
4 0.0 49.8 41.5 7.0 1.6
Table 15 – Results of sensitivity analysis of EHV FFC
In Tables 15 and 16, each average asset life change of years +/- 1, 2 and 4 are
represented as a percentage of the current population. With each change in average
asset life, there is a subsequent movement in the percentage of population in each
Health Index. An average asset life at 0 represents the current population split within
each Health Index with intervention strategies applied. The two tables range from the
start of ED1 (2015) and the end of ED1 (2023).
These tables show the percentage population movements over the eight-year period
and the impact any change in average asset life will have on the asset group’s HI
profile.
Table 14 – Results of sensitivity analysis of 132kV FFC
Asset Stewardship Report 2014 Working draft v0.1 SPN Underground Cables Version 2.0 All of the cost numbers displayed in this document are before the application of on-going efficiencies and real price effects.
UK Power Networks (Operations) Limited. Registered in England and Wales. Registered No. 3870728. Registered Office: Newington House, 237 Southwark Bridge Road, London, SE1 6NP 50
Figure 49 – Effect of average asset life variation on volumes of HI4 and HI5 of 132kV FFC
Figure 49 represents the summed HI4s and HI5s as a percentage of the population,
showing the change at each average asset life iteration, comparing 2015 and 2023.
In 2015, if average asset life is four years longer, the proportion of HI4 and HI5
assets will reduce from 2.8% to 1.1%; but if four years shorter, it will increase to
2.9%. In 2023, if average asset life is four years longer, the proportion of HI4 and HI5
assets will reduce from 5.3% to 4.3%; but if four years shorter, it will increase to
5.6%.
It is concluded from the above observations that the ED1 replacement plan for SPN
132kV UG Cable (Oil) is slightly sensitive to a variation in average asset life of up to
four years.
Figure 50 – Effect of average asset life variation on volumes of HI4 and HI5 of EHV FFC
Figure 50 represents the summed HI4s and HI5s as a percentage of the population,
showing the change at each average asset life iteration, comparing 2015 and 2023.
In 2015, if average asset life is four years longer, the proportion of HI4 and HI5
assets will reduce from 5.4% to 1.6%; but if 4our years shorter, it will increase to
7.2%. In 2023, if average asset life is four years longer, the proportion of HI4 and HI5
assets will reduce from 9.4% to 8.6%; but if four years shorter, it will increase to
10.6%.
0
1
2
3
4
5
6
-4 -2 -1 0 1 2 4
%
Variation in average life (years)
Percentage in HI4 & HI5
2015
2023
0
2
4
6
8
10
12
-4 -2 -1 0 1 2 4
%
Variation in average life (years)
Percentage in HI4 & HI5
2015
2023
Asset Stewardship Report 2014 Working draft v0.1 SPN Underground Cables Version 2.0 All of the cost numbers displayed in this document are before the application of on-going efficiencies and real price effects.
UK Power Networks (Operations) Limited. Registered in England and Wales. Registered No. 3870728. Registered Office: Newington House, 237 Southwark Bridge Road, London, SE1 6NP 51
It is concluded from the above observations that the ED1 replacement plan for SPN
EHV UG Cable (Oil) is fairly insensitive to a variation in average asset life of up to
four years.
7.7 Model Testing
The ARP model had undergone rigorous testing to ensure it met the defined
requirements prior to acceptance. There were four distinct subsets to the
testing process: algorithm testing, software testing, data flow testing and user
and methodology testing. Each test is designed to capture potential errors in
specific parts of the system. The completion of all tests provides assurance
that a thorough evaluation has been carried out to ensure correctness and
validity of the outputs.
7.7.1 Algorithm testing
The ARP model comprises a set of algorithms implemented within the
database code. The tester in a spread sheet mimics each algorithm, with the
results compared with those of the ARP algorithm for a given set of test data
inputs. The test data comprised data within normal expected ranges, low-
value numbers, high-value numbers, floating point numbers, integers,
negative numbers and unpopulated values. In order to pass the test, all
results from the ARP algorithm are required to match the spread sheet
calculation.
7.7.2 Software testing
A number of new software functions used in the model required testing to
ensure they performed correctly. A test script was created to identify the
functional requirement, the method to carry out the function and the expected
outcome. In order to pass the test, the achieved outcome had to match the
expected outcome.
7.7.3 Data-flow testing
Data-flow testing was carried out to ensure that data presented in the ARP
upload files passes into the model correctly. Data counts from the ARP model
upload files were compared to data successfully uploaded to the model. To
pass the test, counts of the data had to match within specified tolerances.
7.7.4 User and methodology testing
The aim of the user and methodology testing is to ensure that the models are
fit for purpose. A test script has been created to check that displays operate
correctly and that outputs respond appropriately to changes in calibration
settings.
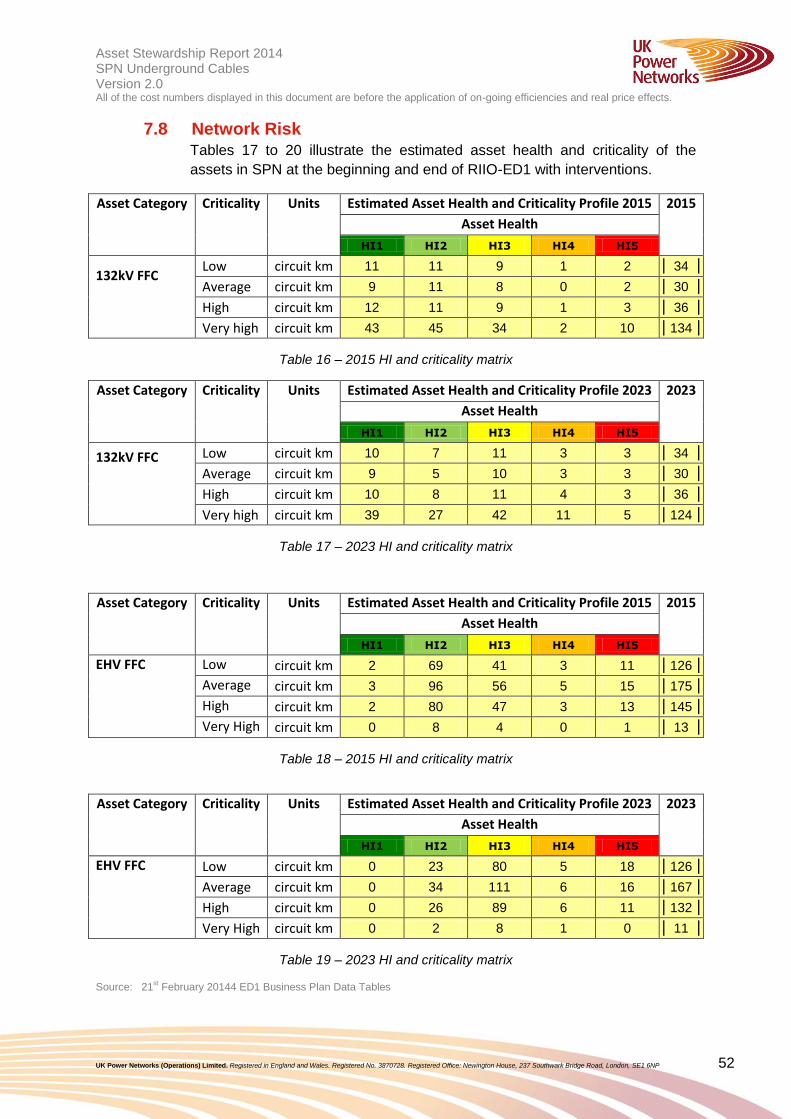
Asset Stewardship Report 2014 Working draft v0.1 SPN Underground Cables Version 2.0 All of the cost numbers displayed in this document are before the application of on-going efficiencies and real price effects.
UK Power Networks (Operations) Limited. Registered in England and Wales. Registered No. 3870728. Registered Office: Newington House, 237 Southwark Bridge Road, London, SE1 6NP 52
7.8 Network Risk
Tables 17 to 20 illustrate the estimated asset health and criticality of the
assets in SPN at the beginning and end of RIIO-ED1 with interventions.
Asset Category Criticality Units Estimated Asset Health and Criticality Profile 2015 2015
Asset Health
HI1 HI2 HI3 HI4 HI5
132kV FFC
Low circuit km 11 11 9 1 2 34
Average circuit km 9 11 8 0 2 30
High circuit km 12 11 9 1 3 36
Very high circuit km 43 45 34 2 10 134
Table 16 – 2015 HI and criticality matrix
Asset Category Criticality Units Estimated Asset Health and Criticality Profile 2023 2023
Asset Health
HI1 HI2 HI3 HI4 HI5
132kV FFC
Low circuit km 10 7 11 3 3 34
Average circuit km 9 5 10 3 3 30
High circuit km 10 8 11 4 3 36
Very high circuit km 39 27 42 11 5 124
Table 17 – 2023 HI and criticality matrix
Asset Category Criticality Units Estimated Asset Health and Criticality Profile 2015 2015
Asset Health
HI1 HI2 HI3 HI4 HI5
EHV FFC Low circuit km 2 69 41 3 11 126 Average circuit km 3 96 56 5 15 175 High circuit km 2 80 47 3 13 145 Very High circuit km 0 8 4 0 1 13
Table 18 – 2015 HI and criticality matrix
Asset Category Criticality Units Estimated Asset Health and Criticality Profile 2023 2023
Asset Health
HI1 HI2 HI3 HI4 HI5
EHV FFC Low circuit km 0 23 80 5 18 126
Average circuit km 0 34 111 6 16 167
High circuit km 0 26 89 6 11 132
Very High circuit km 0 2 8 1 0 11
Table 19 – 2023 HI and criticality matrix
Source: 21st February 20144 ED1 Business Plan Data Tables

Asset Stewardship Report 2014 Working draft v0.1 SPN Underground Cables Version 2.0 All of the cost numbers displayed in this document are before the application of on-going efficiencies and real price effects.
UK Power Networks (Operations) Limited. Registered in England and Wales. Registered No. 3870728. Registered Office: Newington House, 237 Southwark Bridge Road, London, SE1 6NP 53
8.0 Deliverability The appropriate use of both internal and external resources will be necessary to successfully
deliver the plan. Consultation with internal stakeholders responsible for the delivery of the
plan was taken at an early stage and will continue throughout the process.
.
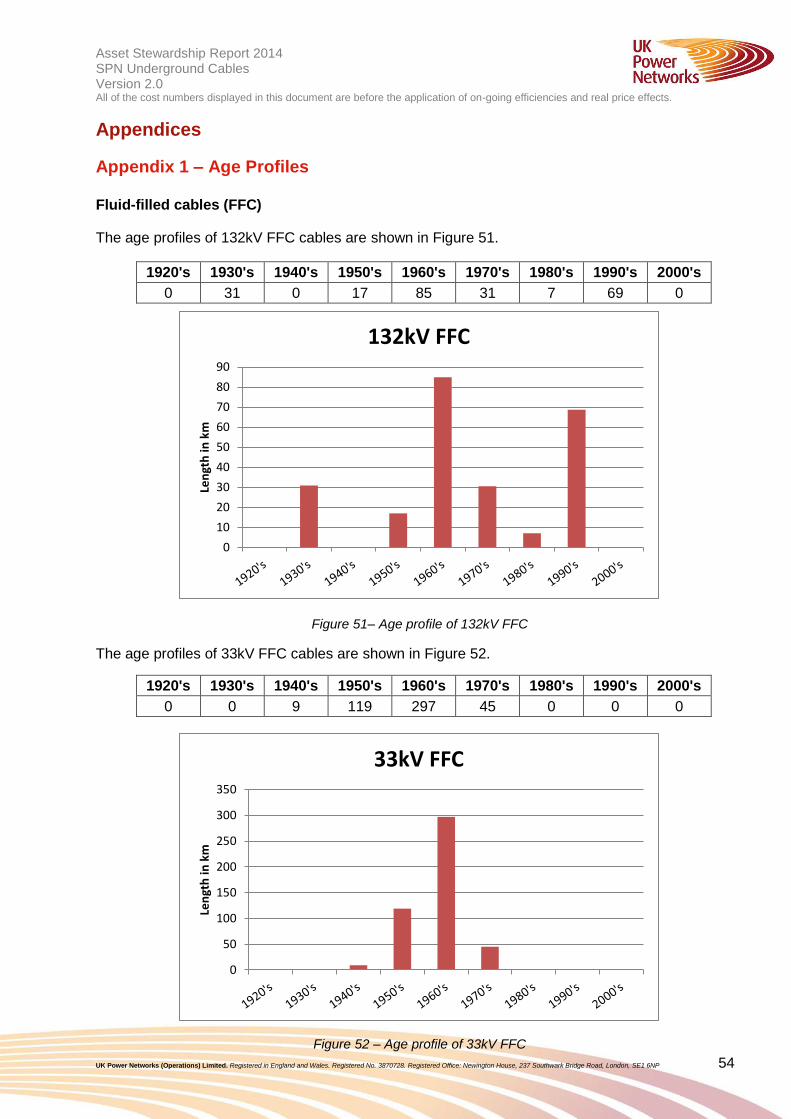
Asset Stewardship Report 2014 Working draft v0.1 SPN Underground Cables Version 2.0 All of the cost numbers displayed in this document are before the application of on-going efficiencies and real price effects.
UK Power Networks (Operations) Limited. Registered in England and Wales. Registered No. 3870728. Registered Office: Newington House, 237 Southwark Bridge Road, London, SE1 6NP 54
Appendices
Appendix 1 – Age Profiles
Fluid-filled cables (FFC)
The age profiles of 132kV FFC cables are shown in Figure 51.
1920's 1930's 1940's 1950's 1960's 1970's 1980's 1990's 2000's
0 31 0 17 85 31 7 69 0
Figure 51– Age profile of 132kV FFC
The age profiles of 33kV FFC cables are shown in Figure 52.
1920's 1930's 1940's 1950's 1960's 1970's 1980's 1990's 2000's
0 0 9 119 297 45 0 0 0
Figure 52 – Age profile of 33kV FFC
0
10
20
30
40
50
60
70
80
90
Len
gth
in k
m
132kV FFC
0
50
100
150
200
250
300
350
Len
gth
in k
m
33kV FFC
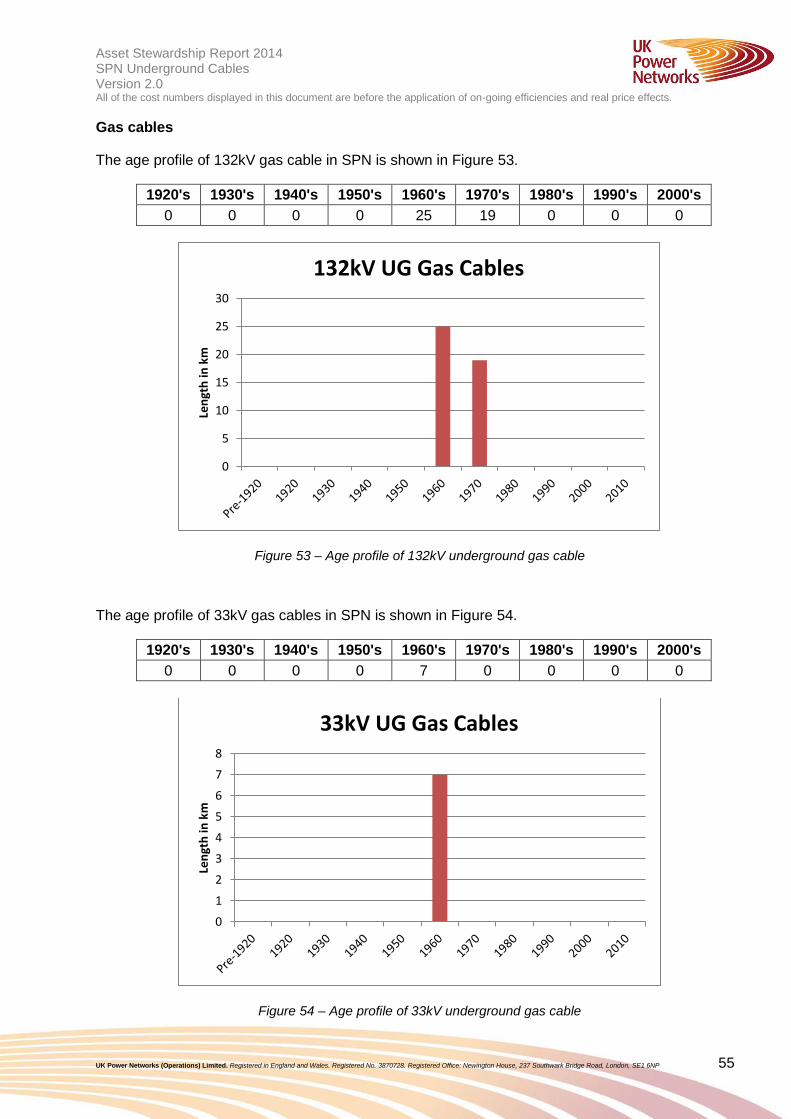
Asset Stewardship Report 2014 Working draft v0.1 SPN Underground Cables Version 2.0 All of the cost numbers displayed in this document are before the application of on-going efficiencies and real price effects.
UK Power Networks (Operations) Limited. Registered in England and Wales. Registered No. 3870728. Registered Office: Newington House, 237 Southwark Bridge Road, London, SE1 6NP 55
Gas cables
The age profile of 132kV gas cable in SPN is shown in Figure 53.
1920's 1930's 1940's 1950's 1960's 1970's 1980's 1990's 2000's
0 0 0 0 25 19 0 0 0
Figure 53 – Age profile of 132kV underground gas cable
The age profile of 33kV gas cables in SPN is shown in Figure 54.
1920's 1930's 1940's 1950's 1960's 1970's 1980's 1990's 2000's
0 0 0 0 7 0 0 0 0
Figure 54 – Age profile of 33kV underground gas cable
0
5
10
15
20
25
30
Len
gth
in k
m
132kV UG Gas Cables
0
1
2
3
4
5
6
7
8
Len
gth
in k
m
33kV UG Gas Cables
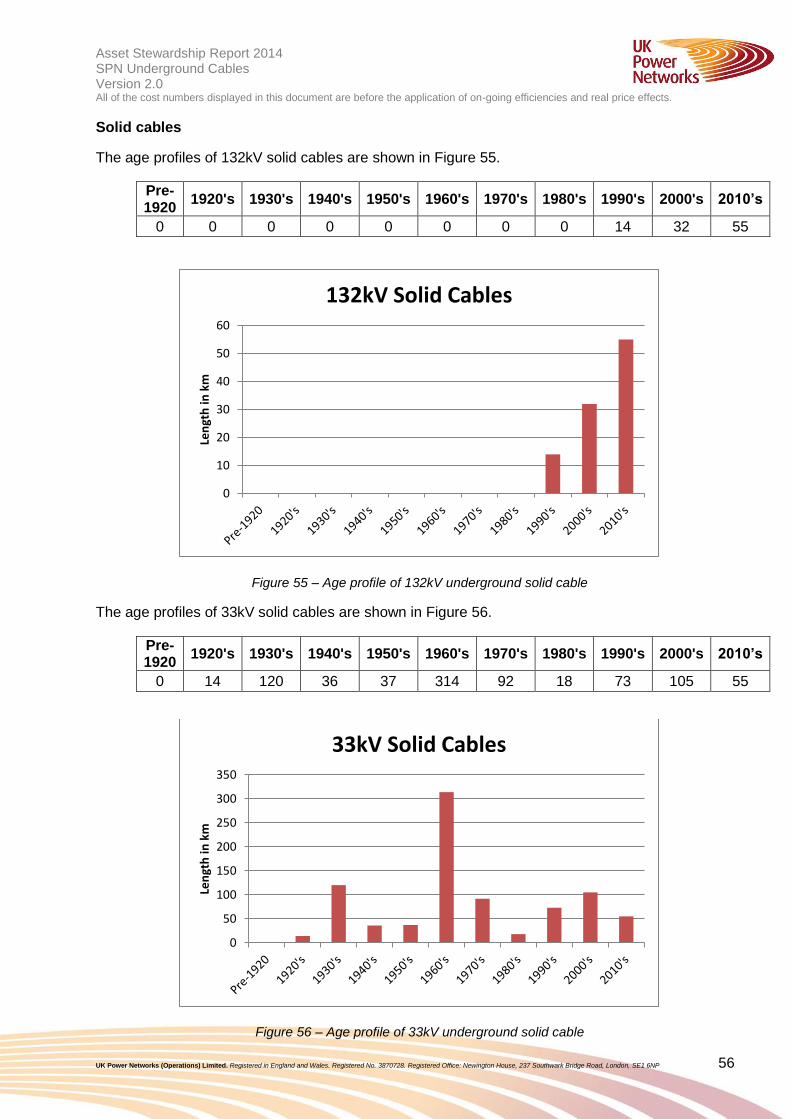
Asset Stewardship Report 2014 Working draft v0.1 SPN Underground Cables Version 2.0 All of the cost numbers displayed in this document are before the application of on-going efficiencies and real price effects.
UK Power Networks (Operations) Limited. Registered in England and Wales. Registered No. 3870728. Registered Office: Newington House, 237 Southwark Bridge Road, London, SE1 6NP 56
Solid cables
The age profiles of 132kV solid cables are shown in Figure 55.
Pre-1920
1920's 1930's 1940's 1950's 1960's 1970's 1980's 1990's 2000's 2010’s
0 0 0 0 0 0 0 0 14 32 55
Figure 55 – Age profile of 132kV underground solid cable
The age profiles of 33kV solid cables are shown in Figure 56.
Pre-1920
1920's 1930's 1940's 1950's 1960's 1970's 1980's 1990's 2000's 2010’s
0 14 120 36 37 314 92 18 73 105 55
Figure 56 – Age profile of 33kV underground solid cable
0
10
20
30
40
50
60
Len
gth
in k
m
132kV Solid Cables
0
50
100
150
200
250
300
350
Len
gth
in k
m
33kV Solid Cables
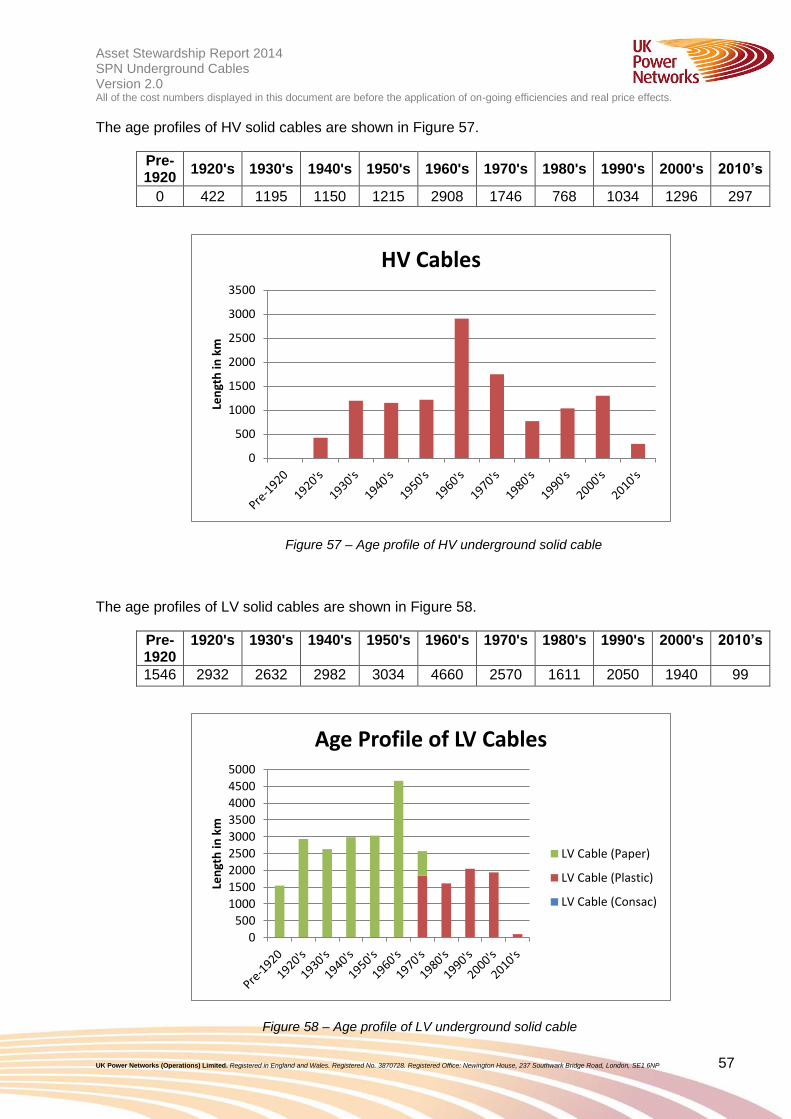
Asset Stewardship Report 2014 Working draft v0.1 SPN Underground Cables Version 2.0 All of the cost numbers displayed in this document are before the application of on-going efficiencies and real price effects.
UK Power Networks (Operations) Limited. Registered in England and Wales. Registered No. 3870728. Registered Office: Newington House, 237 Southwark Bridge Road, London, SE1 6NP 57
The age profiles of HV solid cables are shown in Figure 57.
Pre-1920
1920's 1930's 1940's 1950's 1960's 1970's 1980's 1990's 2000's 2010’s
0 422 1195 1150 1215 2908 1746 768 1034 1296 297
Figure 57 – Age profile of HV underground solid cable
The age profiles of LV solid cables are shown in Figure 58.
Pre-1920
1920's 1930's 1940's 1950's 1960's 1970's 1980's 1990's 2000's 2010’s
1546 2932 2632 2982 3034 4660 2570 1611 2050 1940 99
Figure 58 – Age profile of LV underground solid cable
0
500
1000
1500
2000
2500
3000
3500
Len
gth
in k
m
HV Cables
0
500
1000
1500
2000
2500
3000
3500
4000
4500
5000
Len
gth
in k
m
Age Profile of LV Cables
LV Cable (Paper)
LV Cable (Plastic)
LV Cable (Consac)
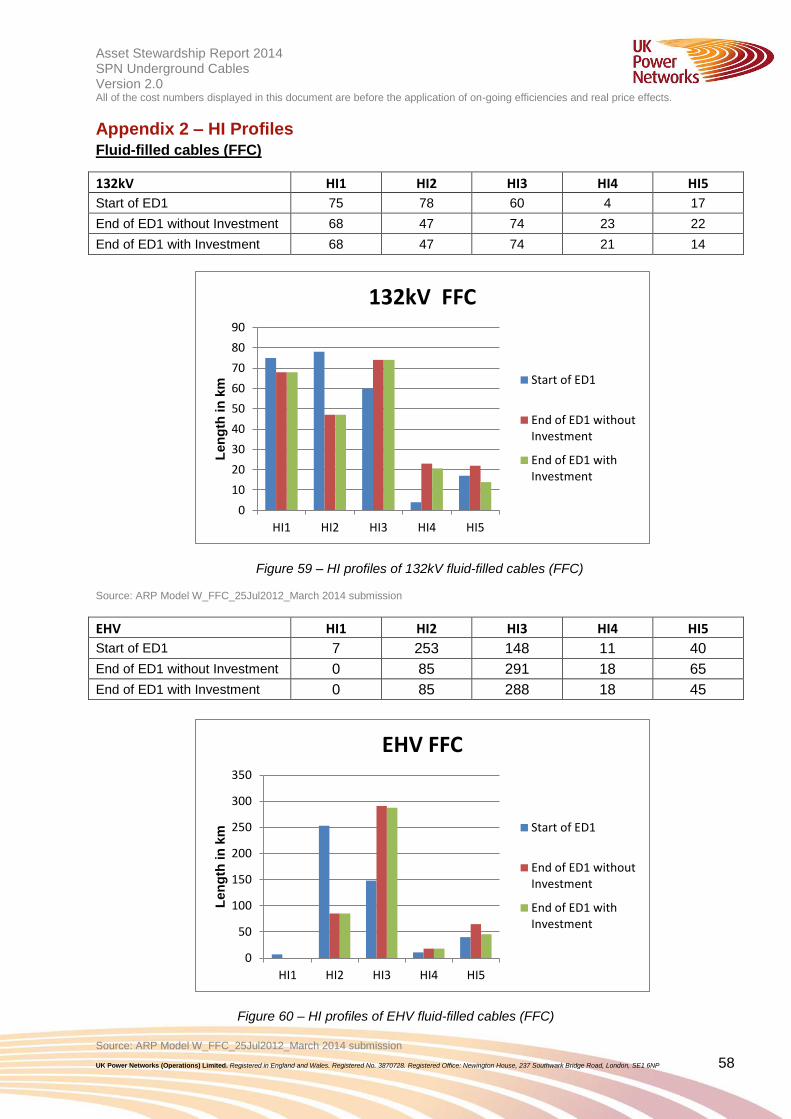
Asset Stewardship Report 2014 Working draft v0.1 SPN Underground Cables Version 2.0 All of the cost numbers displayed in this document are before the application of on-going efficiencies and real price effects.
UK Power Networks (Operations) Limited. Registered in England and Wales. Registered No. 3870728. Registered Office: Newington House, 237 Southwark Bridge Road, London, SE1 6NP 58
Appendix 2 – HI Profiles
Fluid-filled cables (FFC)
132kV HI1 HI2 HI3 HI4 HI5
Start of ED1 75 78 60 4 17
End of ED1 without Investment 68 47 74 23 22
End of ED1 with Investment 68 47 74 21 14
Figure 59 – HI profiles of 132kV fluid-filled cables (FFC)
Source: ARP Model W_FFC_25Jul2012_March 2014 submission
EHV HI1 HI2 HI3 HI4 HI5
Start of ED1 7 253 148 11 40
End of ED1 without Investment 0 85 291 18 65
End of ED1 with Investment 0 85 288 18 45
Figure 60 – HI profiles of EHV fluid-filled cables (FFC)
Source: ARP Model W_FFC_25Jul2012_March 2014 submission
0
10
20
30
40
50
60
70
80
90
HI1 HI2 HI3 HI4 HI5
Len
gth
in
km
132kV FFC
Start of ED1
End of ED1 withoutInvestment
End of ED1 withInvestment
0
50
100
150
200
250
300
350
HI1 HI2 HI3 HI4 HI5
Len
gth
in
km
EHV FFC
Start of ED1
End of ED1 withoutInvestment
End of ED1 withInvestment
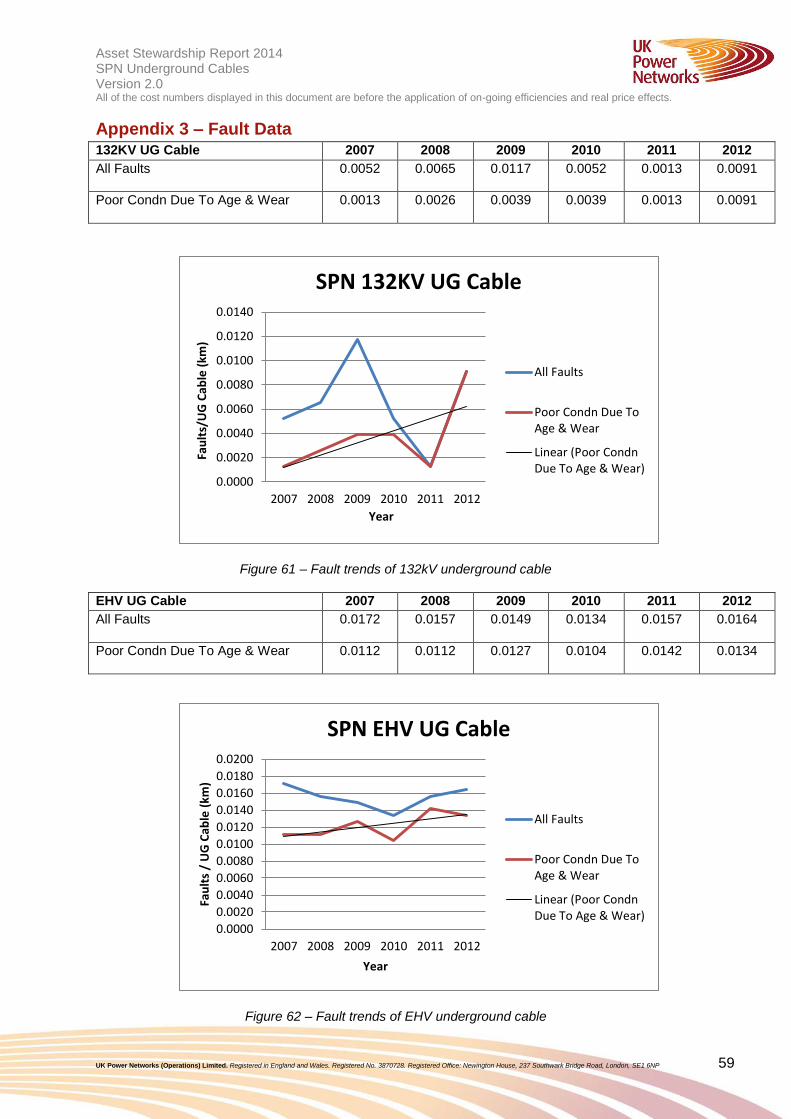
Asset Stewardship Report 2014 Working draft v0.1 SPN Underground Cables Version 2.0 All of the cost numbers displayed in this document are before the application of on-going efficiencies and real price effects.
UK Power Networks (Operations) Limited. Registered in England and Wales. Registered No. 3870728. Registered Office: Newington House, 237 Southwark Bridge Road, London, SE1 6NP 59
Appendix 3 – Fault Data 132KV UG Cable 2007 2008 2009 2010 2011 2012
All Faults 0.0052 0.0065 0.0117 0.0052 0.0013 0.0091
Poor Condn Due To Age & Wear 0.0013 0.0026 0.0039 0.0039 0.0013 0.0091
Figure 61 – Fault trends of 132kV underground cable
EHV UG Cable 2007 2008 2009 2010 2011 2012
All Faults 0.0172 0.0157 0.0149 0.0134 0.0157 0.0164
Poor Condn Due To Age & Wear 0.0112 0.0112 0.0127 0.0104 0.0142 0.0134
Figure 62 – Fault trends of EHV underground cable
0.0000
0.0020
0.0040
0.0060
0.0080
0.0100
0.0120
0.0140
2007 2008 2009 2010 2011 2012
Fau
lts/
UG
Cab
le (
km)
Year
SPN 132KV UG Cable
All Faults
Poor Condn Due ToAge & Wear
Linear (Poor CondnDue To Age & Wear)
0.0000
0.0020
0.0040
0.0060
0.0080
0.0100
0.0120
0.0140
0.0160
0.0180
0.0200
2007 2008 2009 2010 2011 2012
Fau
lts
/ U
G C
able
(km
)
Year
SPN EHV UG Cable
All Faults
Poor Condn Due ToAge & Wear
Linear (Poor CondnDue To Age & Wear)
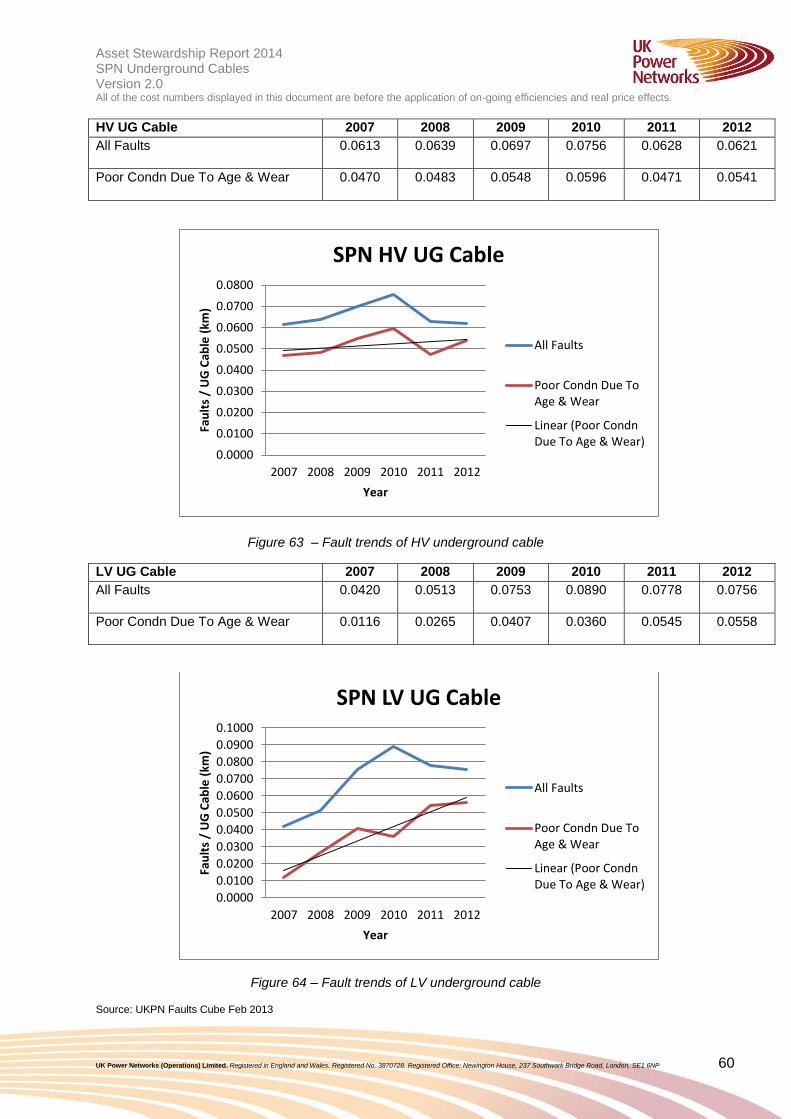
Asset Stewardship Report 2014 Working draft v0.1 SPN Underground Cables Version 2.0 All of the cost numbers displayed in this document are before the application of on-going efficiencies and real price effects.
UK Power Networks (Operations) Limited. Registered in England and Wales. Registered No. 3870728. Registered Office: Newington House, 237 Southwark Bridge Road, London, SE1 6NP 60
HV UG Cable 2007 2008 2009 2010 2011 2012
All Faults 0.0613 0.0639 0.0697 0.0756 0.0628 0.0621
Poor Condn Due To Age & Wear 0.0470 0.0483 0.0548 0.0596 0.0471 0.0541
Figure 63 – Fault trends of HV underground cable
LV UG Cable 2007 2008 2009 2010 2011 2012
All Faults 0.0420 0.0513 0.0753 0.0890 0.0778 0.0756
Poor Condn Due To Age & Wear 0.0116 0.0265 0.0407 0.0360 0.0545 0.0558
Figure 64 – Fault trends of LV underground cable
Source: UKPN Faults Cube Feb 2013
0.0000
0.0100
0.0200
0.0300
0.0400
0.0500
0.0600
0.0700
0.0800
2007 2008 2009 2010 2011 2012
Fau
lts
/ U
G C
able
(km
)
Year
SPN HV UG Cable
All Faults
Poor Condn Due ToAge & Wear
Linear (Poor CondnDue To Age & Wear)
0.0000
0.0100
0.0200
0.0300
0.0400
0.0500
0.0600
0.0700
0.0800
0.0900
0.1000
2007 2008 2009 2010 2011 2012
Fau
lts
/ U
G C
able
(km
)
Year
SPN LV UG Cable
All Faults
Poor Condn Due ToAge & Wear
Linear (Poor CondnDue To Age & Wear)
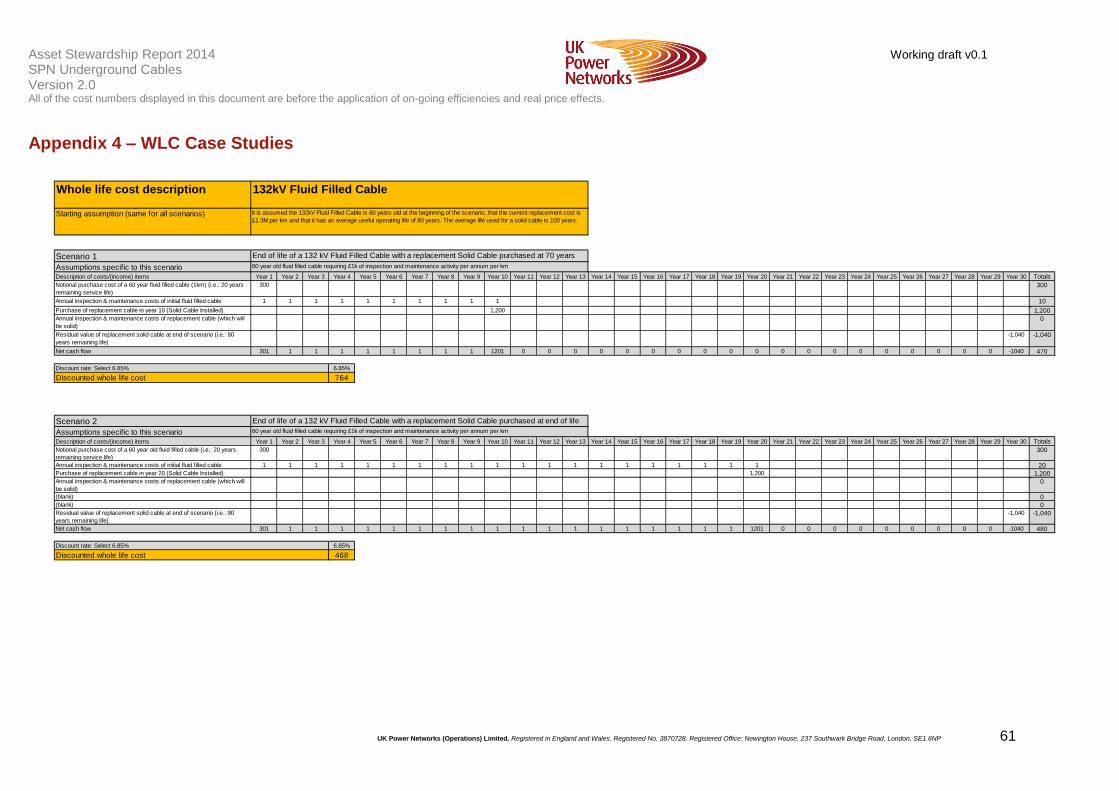
Asset Stewardship Report 2014 Working draft v0.1 SPN Underground Cables Version 2.0 All of the cost numbers displayed in this document are before the application of on-going efficiencies and real price effects.
UK Power Networks (Operations) Limited. Registered in England and Wales. Registered No. 3870728. Registered Office: Newington House, 237 Southwark Bridge Road, London, SE1 6NP 61
Appendix 4 – WLC Case Studies
Whole life cost description
Starting assumption (same for all scenarios)
Scenario 1
Assumptions specific to this scenarioDescription of costs/(income) items Year 1 Year 2 Year 3 Year 4 Year 5 Year 6 Year 7 Year 8 Year 9 Year 10 Year 11 Year 12 Year 13 Year 14 Year 15 Year 16 Year 17 Year 18 Year 19 Year 20 Year 21 Year 22 Year 23 Year 24 Year 25 Year 26 Year 27 Year 28 Year 29 Year 30 Totals
Notional purchase cost of a 60 year fluid filled cable (1km) (i.e.: 20 years
remaining service life)
300 300
Annual inspection & maintenance costs of initial fluid filled cable 1 1 1 1 1 1 1 1 1 1 10
Purchase of replacement cable in year 10 (Solid Cable Installed) 1,200 1,200
Annual inspection & maintenance costs of replacement cable (which will
be solid)
0
Residual value of replacement solid cable at end of scenario (i.e.: 80
years remaining life)
-1,040 -1,040
Net cash flow 301 1 1 1 1 1 1 1 1 1201 0 0 0 0 0 0 0 0 0 0 0 0 0 0 0 0 0 0 0 -1040 470
6.85%
764
Scenario 2
Assumptions specific to this scenarioDescription of costs/(income) items Year 1 Year 2 Year 3 Year 4 Year 5 Year 6 Year 7 Year 8 Year 9 Year 10 Year 11 Year 12 Year 13 Year 14 Year 15 Year 16 Year 17 Year 18 Year 19 Year 20 Year 21 Year 22 Year 23 Year 24 Year 25 Year 26 Year 27 Year 28 Year 29 Year 30 Totals
Notional purchase cost of a 60 year old fluid filled cable (i.e.: 20 years
remaining service life)
300 300
Annual inspection & maintenance costs of initial fluid filled cable 1 1 1 1 1 1 1 1 1 1 1 1 1 1 1 1 1 1 1 1 20
Purchase of replacement cable in year 20 (Solid Cable Installed) 1,200 1,200
Annual inspection & maintenance costs of replacement cable (which will
be solid)
0
(blank) 0
(blank) 0
Residual value of replacement solid cable at end of scenario (i.e.: 90
years remaining life)
-1,040 -1,040
Net cash flow 301 1 1 1 1 1 1 1 1 1 1 1 1 1 1 1 1 1 1 1201 0 0 0 0 0 0 0 0 0 -1040 480
6.85%
468
End of life of a 132 kV Fluid Filled Cable with a replacement Solid Cable purchased at end of life
(80 years)60 year old fluid filled cable requiring £1k of inspection and maintenance activity per annum per km
Discount rate: Select 6.85%
Discounted whole life cost
132kV Fluid Filled Cable
It is assumed the 132kV Fluid Filled Cable is 60 years old at the beginning of the scenario, that the current replacement cost is
£1.3M per km and that it has an average useful operating life of 80 years. The average life used for a solid cable is 100 years.
End of life of a 132 kV Fluid Filled Cable with a replacement Solid Cable purchased at 70 years
60 year old fluid filled cable requiring £1k of inspection and maintenance activity per annum per km
Discount rate: Select 6.85%
Discounted whole life cost

Asset Stewardship Report 2014 Working draft v0.1 SPN Underground Cables Version 2.0 All of the cost numbers displayed in this document are before the application of on-going efficiencies and real price effects.
UK Power Networks (Operations) Limited. Registered in England and Wales. Registered No. 3870728. Registered Office: Newington House, 237 Southwark Bridge Road, London, SE1 6NP 62
Appendix 5 – NLRE Expenditure Plan
132kV fluid-filled cable volumes:
132kV fluid-filled cable cost:
Volumes
Year end 2006 2007 2008 2009 2010 2011 2012 2013 2014 2015
132kV UG Cable (Oil) FBPQ (Removals only) 0.00 0.00 0.00 0.00 0.00
132kV UG Cable (Oil) (Removals) 0.00 10.00 0.00 0.00 0.00 0.00 0.00 1.80 0.00 3.00
DPCR5 (Actual and Forecast from RIgs)DPCR4 (FBPQ)
Volumes
Year end 2016 2017 2018 2019 2020 2021 2022 2023 2024 2025 2026 2027 2028 2029 2030 2031
132kV UG Cable (Oil) FBPQ (Removals only)
132kV UG Cable (Oil) (Removals) 0.00 0.00 8.00 0.00 0.00 0.00 0.00 2.50 1.31 1.31 1.31 1.31 1.31 1.31 1.31 1.31
ED1 Plan ED2 Plan
0.00
2.00
4.00
6.00
8.00
10.00
12.00
2006 2007 2008 2009 2010 2011 2012 2013 2014 2015 2016 2017 2018 2019 2020 2021 2022 2023 2024 2025 2026 2027 2028 2029 2030 2031
Vo
lum
es
in
km
Intervention Volumes of 132kV FFC
132kV UG Cable (Oil) (Removals) FBPQ
DPCR4 DPCR5 ED1 ED2
Investment £'m
Year end 2006 2007 2008 2009 2010 2011 2012 2013 2014 2015
132kV UG Cable (Oil) 4.50 2.80 0.00 0.00 0.00 0.00 0.00 0.43 2.47 0.48
DPCR5 (Actual and Forecast from RIgs)DPCR4 (FBPQ)
Investment £'m
Year end 2016 2017 2018 2019 2020 2021 2022 2023 2024 2025 2026 2027 2028 2029 2030 2031
132kV UG Cable (Oil) 1.39 5.55 4.16 0.00 0.00 0.00 0.69 2.02 1.75 1.75 1.75 1.75 1.75 1.75 1.75 1.75
ED1 Plan ED2 Plan
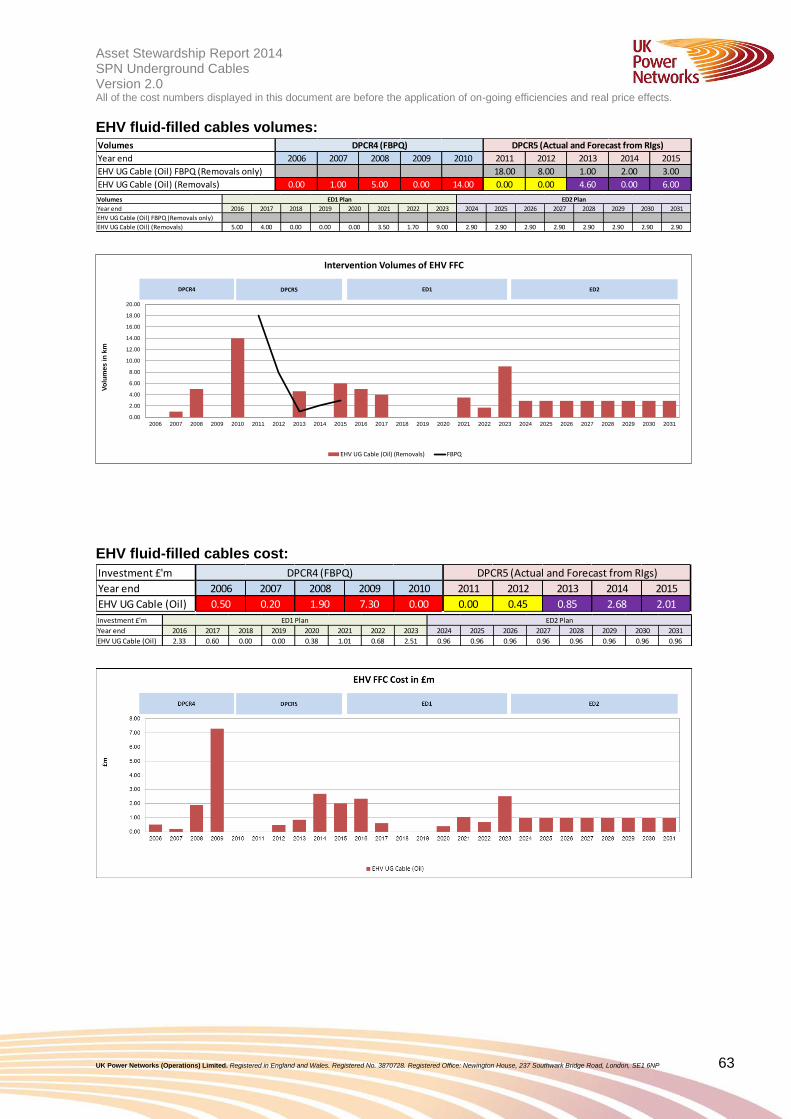
Asset Stewardship Report 2014 Working draft v0.1 SPN Underground Cables Version 2.0 All of the cost numbers displayed in this document are before the application of on-going efficiencies and real price effects.
UK Power Networks (Operations) Limited. Registered in England and Wales. Registered No. 3870728. Registered Office: Newington House, 237 Southwark Bridge Road, London, SE1 6NP 63
EHV fluid-filled cables volumes:
EHV fluid-filled cables cost:
Volumes
Year end 2006 2007 2008 2009 2010 2011 2012 2013 2014 2015
EHV UG Cable (Oil) FBPQ (Removals only) 18.00 8.00 1.00 2.00 3.00
EHV UG Cable (Oil) (Removals) 0.00 1.00 5.00 0.00 14.00 0.00 0.00 4.60 0.00 6.00
DPCR5 (Actual and Forecast from RIgs)DPCR4 (FBPQ)
Volumes
Year end 2016 2017 2018 2019 2020 2021 2022 2023 2024 2025 2026 2027 2028 2029 2030 2031
EHV UG Cable (Oil) FBPQ (Removals only)
EHV UG Cable (Oil) (Removals) 5.00 4.00 0.00 0.00 0.00 3.50 1.70 9.00 2.90 2.90 2.90 2.90 2.90 2.90 2.90 2.90
ED1 Plan ED2 Plan
0.00
2.00
4.00
6.00
8.00
10.00
12.00
14.00
16.00
18.00
20.00
2006 2007 2008 2009 2010 2011 2012 2013 2014 2015 2016 2017 2018 2019 2020 2021 2022 2023 2024 2025 2026 2027 2028 2029 2030 2031
Vo
lum
es
in
km
Intervention Volumes of EHV FFC
EHV UG Cable (Oil) (Removals) FBPQ
DPCR4 DPCR5 ED1 ED2
Investment £'m
Year end 2006 2007 2008 2009 2010 2011 2012 2013 2014 2015
EHV UG Cable (Oil) 0.50 0.20 1.90 7.30 0.00 0.00 0.45 0.85 2.68 2.01
DPCR5 (Actual and Forecast from RIgs)DPCR4 (FBPQ)
Investment £'m
Year end 2016 2017 2018 2019 2020 2021 2022 2023 2024 2025 2026 2027 2028 2029 2030 2031
EHV UG Cable (Oil) 2.33 0.60 0.00 0.00 0.38 1.01 0.68 2.51 0.96 0.96 0.96 0.96 0.96 0.96 0.96 0.96
ED1 Plan ED2 Plan
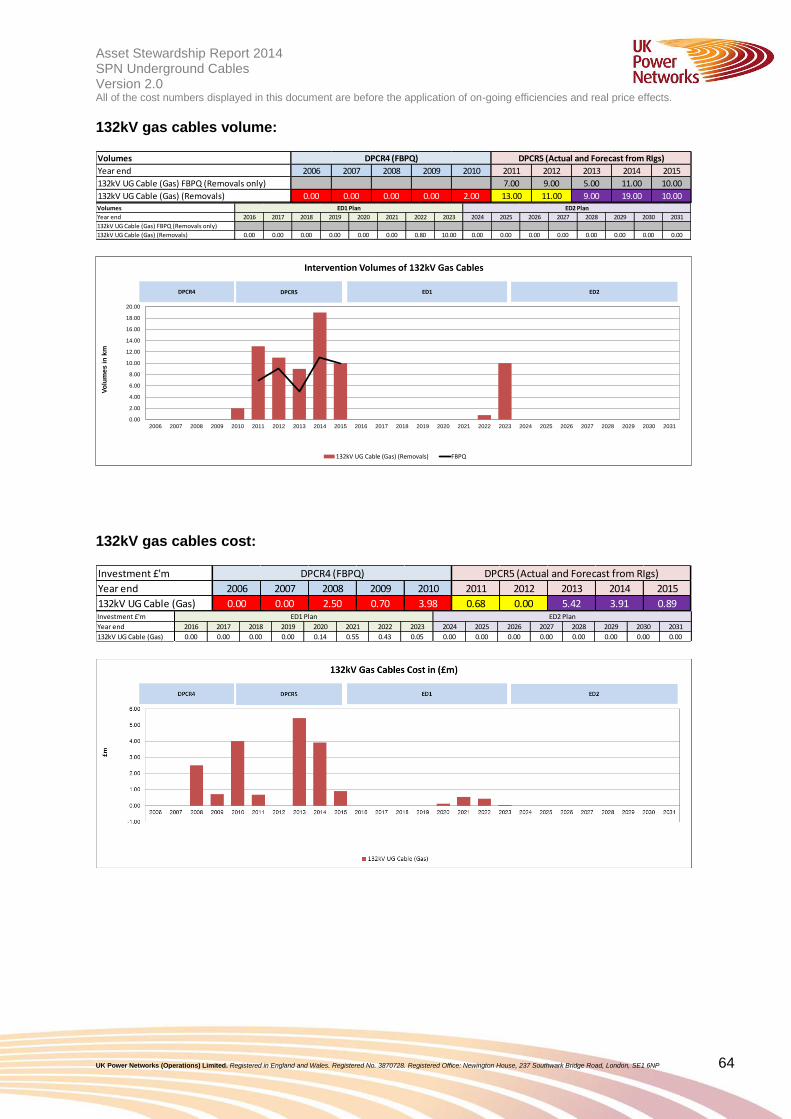
Asset Stewardship Report 2014 Working draft v0.1 SPN Underground Cables Version 2.0 All of the cost numbers displayed in this document are before the application of on-going efficiencies and real price effects.
UK Power Networks (Operations) Limited. Registered in England and Wales. Registered No. 3870728. Registered Office: Newington House, 237 Southwark Bridge Road, London, SE1 6NP 64
132kV gas cables volume:
132kV gas cables cost:
Volumes
Year end 2006 2007 2008 2009 2010 2011 2012 2013 2014 2015
132kV UG Cable (Gas) FBPQ (Removals only) 7.00 9.00 5.00 11.00 10.00
132kV UG Cable (Gas) (Removals) 0.00 0.00 0.00 0.00 2.00 13.00 11.00 9.00 19.00 10.00
DPCR5 (Actual and Forecast from RIgs)DPCR4 (FBPQ)
Volumes
Year end 2016 2017 2018 2019 2020 2021 2022 2023 2024 2025 2026 2027 2028 2029 2030 2031
132kV UG Cable (Gas) FBPQ (Removals only)
132kV UG Cable (Gas) (Removals) 0.00 0.00 0.00 0.00 0.00 0.00 0.80 10.00 0.00 0.00 0.00 0.00 0.00 0.00 0.00 0.00
ED1 Plan ED2 Plan
0.00
2.00
4.00
6.00
8.00
10.00
12.00
14.00
16.00
18.00
20.00
2006 2007 2008 2009 2010 2011 2012 2013 2014 2015 2016 2017 2018 2019 2020 2021 2022 2023 2024 2025 2026 2027 2028 2029 2030 2031
Vo
lum
es
in
km
Intervention Volumes of 132kV Gas Cables
132kV UG Cable (Gas) (Removals) FBPQ
DPCR4 DPCR5 ED1 ED2
Investment £'m
Year end 2006 2007 2008 2009 2010 2011 2012 2013 2014 2015
132kV UG Cable (Gas) 0.00 0.00 2.50 0.70 3.98 0.68 0.00 5.42 3.91 0.89
DPCR5 (Actual and Forecast from RIgs)DPCR4 (FBPQ)
Investment £'m
Year end 2016 2017 2018 2019 2020 2021 2022 2023 2024 2025 2026 2027 2028 2029 2030 2031
132kV UG Cable (Gas) 0.00 0.00 0.00 0.00 0.14 0.55 0.43 0.05 0.00 0.00 0.00 0.00 0.00 0.00 0.00 0.00
ED1 Plan ED2 Plan
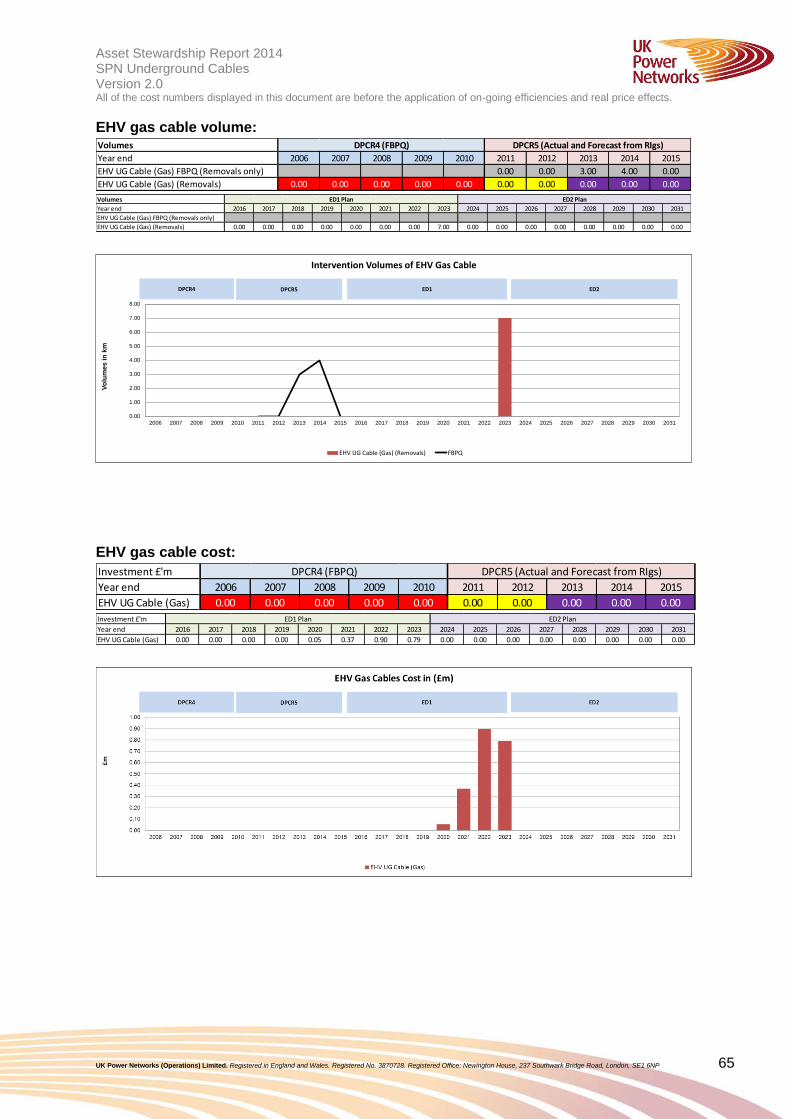
Asset Stewardship Report 2014 Working draft v0.1 SPN Underground Cables Version 2.0 All of the cost numbers displayed in this document are before the application of on-going efficiencies and real price effects.
UK Power Networks (Operations) Limited. Registered in England and Wales. Registered No. 3870728. Registered Office: Newington House, 237 Southwark Bridge Road, London, SE1 6NP 65
EHV gas cable volume:
EHV gas cable cost:
Volumes
Year end 2006 2007 2008 2009 2010 2011 2012 2013 2014 2015
EHV UG Cable (Gas) FBPQ (Removals only) 0.00 0.00 3.00 4.00 0.00
EHV UG Cable (Gas) (Removals) 0.00 0.00 0.00 0.00 0.00 0.00 0.00 0.00 0.00 0.00
DPCR5 (Actual and Forecast from RIgs)DPCR4 (FBPQ)
Volumes
Year end 2016 2017 2018 2019 2020 2021 2022 2023 2024 2025 2026 2027 2028 2029 2030 2031
EHV UG Cable (Gas) FBPQ (Removals only)
EHV UG Cable (Gas) (Removals) 0.00 0.00 0.00 0.00 0.00 0.00 0.00 7.00 0.00 0.00 0.00 0.00 0.00 0.00 0.00 0.00
ED1 Plan ED2 Plan
0.00
1.00
2.00
3.00
4.00
5.00
6.00
7.00
8.00
2006 2007 2008 2009 2010 2011 2012 2013 2014 2015 2016 2017 2018 2019 2020 2021 2022 2023 2024 2025 2026 2027 2028 2029 2030 2031
Vo
lum
es
in
km
Intervention Volumes of EHV Gas Cable
EHV UG Cable (Gas) (Removals) FBPQ
DPCR4 DPCR5 ED1 ED2
Investment £'m
Year end 2006 2007 2008 2009 2010 2011 2012 2013 2014 2015
EHV UG Cable (Gas) 0.00 0.00 0.00 0.00 0.00 0.00 0.00 0.00 0.00 0.00
DPCR5 (Actual and Forecast from RIgs)DPCR4 (FBPQ)
Investment £'m
Year end 2016 2017 2018 2019 2020 2021 2022 2023 2024 2025 2026 2027 2028 2029 2030 2031
EHV UG Cable (Gas) 0.00 0.00 0.00 0.00 0.05 0.37 0.90 0.79 0.00 0.00 0.00 0.00 0.00 0.00 0.00 0.00
ED1 Plan ED2 Plan
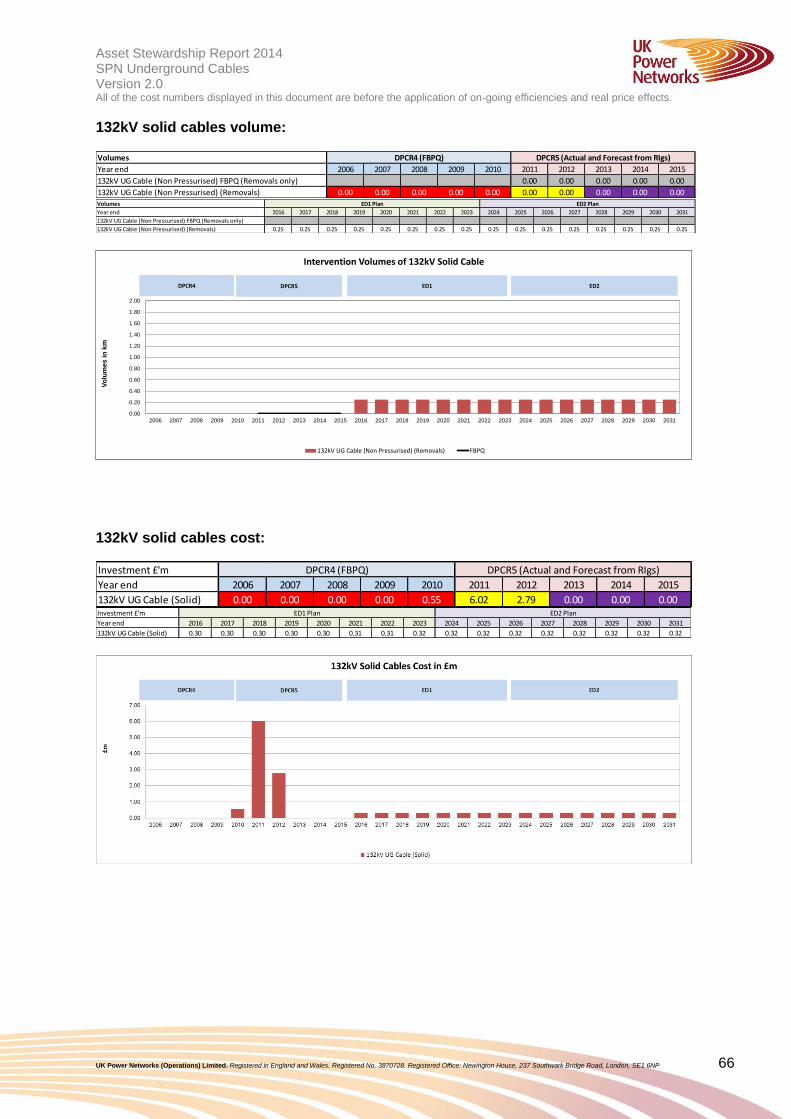
Asset Stewardship Report 2014 Working draft v0.1 SPN Underground Cables Version 2.0 All of the cost numbers displayed in this document are before the application of on-going efficiencies and real price effects.
UK Power Networks (Operations) Limited. Registered in England and Wales. Registered No. 3870728. Registered Office: Newington House, 237 Southwark Bridge Road, London, SE1 6NP 66
132kV solid cables volume:
132kV solid cables cost:
Volumes
Year end 2006 2007 2008 2009 2010 2011 2012 2013 2014 2015
132kV UG Cable (Non Pressurised) FBPQ (Removals only) 0.00 0.00 0.00 0.00 0.00
132kV UG Cable (Non Pressurised) (Removals) 0.00 0.00 0.00 0.00 0.00 0.00 0.00 0.00 0.00 0.00
DPCR5 (Actual and Forecast from RIgs)DPCR4 (FBPQ)
Volumes
Year end 2016 2017 2018 2019 2020 2021 2022 2023 2024 2025 2026 2027 2028 2029 2030 2031
132kV UG Cable (Non Pressurised) FBPQ (Removals only)
132kV UG Cable (Non Pressurised) (Removals) 0.25 0.25 0.25 0.25 0.25 0.25 0.25 0.25 0.25 0.25 0.25 0.25 0.25 0.25 0.25 0.25
ED1 Plan ED2 Plan
0.00
0.20
0.40
0.60
0.80
1.00
1.20
1.40
1.60
1.80
2.00
2006 2007 2008 2009 2010 2011 2012 2013 2014 2015 2016 2017 2018 2019 2020 2021 2022 2023 2024 2025 2026 2027 2028 2029 2030 2031
Vo
lum
es
in
km
Intervention Volumes of 132kV Solid Cable
132kV UG Cable (Non Pressurised) (Removals) FBPQ
DPCR4 DPCR5 ED1 ED2
Investment £'m
Year end 2006 2007 2008 2009 2010 2011 2012 2013 2014 2015
132kV UG Cable (Solid) 0.00 0.00 0.00 0.00 0.55 6.02 2.79 0.00 0.00 0.00
DPCR5 (Actual and Forecast from RIgs)DPCR4 (FBPQ)
Investment £'m
Year end 2016 2017 2018 2019 2020 2021 2022 2023 2024 2025 2026 2027 2028 2029 2030 2031
132kV UG Cable (Solid) 0.30 0.30 0.30 0.30 0.30 0.31 0.31 0.32 0.32 0.32 0.32 0.32 0.32 0.32 0.32 0.32
ED1 Plan ED2 Plan
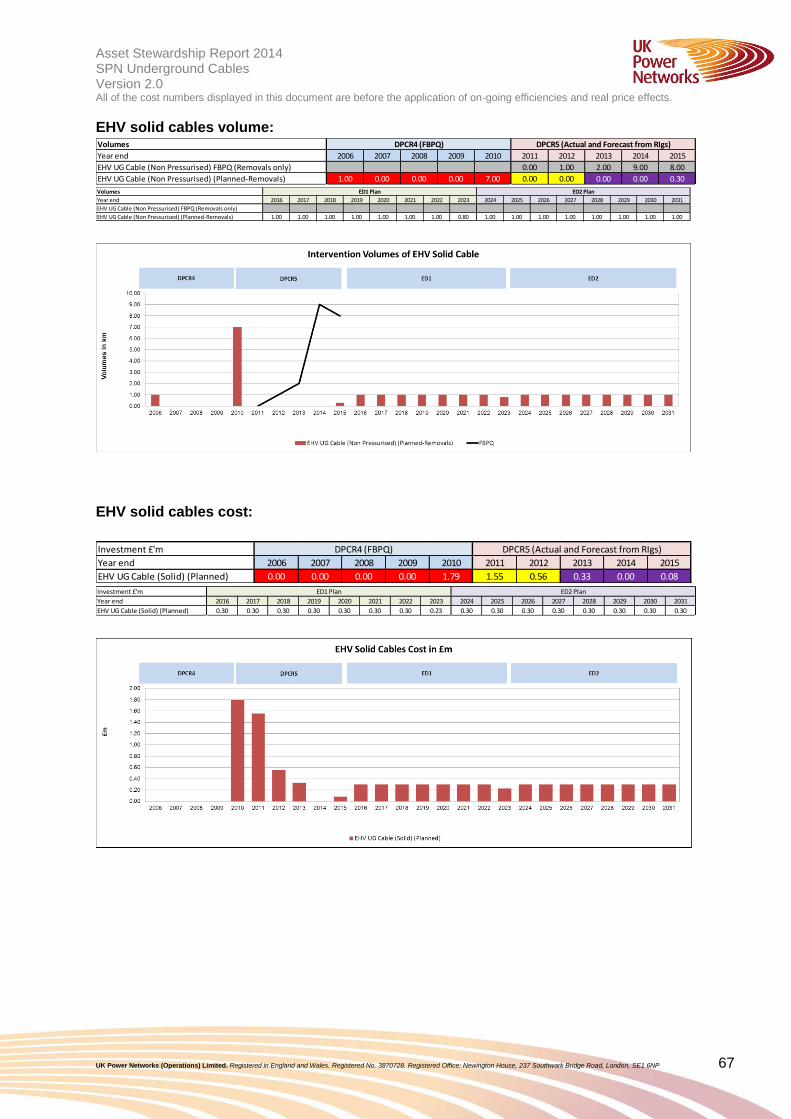
Asset Stewardship Report 2014 Working draft v0.1 SPN Underground Cables Version 2.0 All of the cost numbers displayed in this document are before the application of on-going efficiencies and real price effects.
UK Power Networks (Operations) Limited. Registered in England and Wales. Registered No. 3870728. Registered Office: Newington House, 237 Southwark Bridge Road, London, SE1 6NP 67
EHV solid cables volume:
EHV solid cables cost:
Volumes
Year end 2006 2007 2008 2009 2010 2011 2012 2013 2014 2015
EHV UG Cable (Non Pressurised) FBPQ (Removals only) 0.00 1.00 2.00 9.00 8.00
EHV UG Cable (Non Pressurised) (Planned-Removals) 1.00 0.00 0.00 0.00 7.00 0.00 0.00 0.00 0.00 0.30
DPCR5 (Actual and Forecast from RIgs)DPCR4 (FBPQ)
Volumes
Year end 2016 2017 2018 2019 2020 2021 2022 2023 2024 2025 2026 2027 2028 2029 2030 2031
EHV UG Cable (Non Pressurised) FBPQ (Removals only)
EHV UG Cable (Non Pressurised) (Planned-Removals) 1.00 1.00 1.00 1.00 1.00 1.00 1.00 0.80 1.00 1.00 1.00 1.00 1.00 1.00 1.00 1.00
ED1 Plan ED2 Plan
Investment £'m
Year end 2006 2007 2008 2009 2010 2011 2012 2013 2014 2015
EHV UG Cable (Solid) (Planned) 0.00 0.00 0.00 0.00 1.79 1.55 0.56 0.33 0.00 0.08
DPCR5 (Actual and Forecast from RIgs)DPCR4 (FBPQ)
Investment £'m
Year end 2016 2017 2018 2019 2020 2021 2022 2023 2024 2025 2026 2027 2028 2029 2030 2031
EHV UG Cable (Solid) (Planned) 0.30 0.30 0.30 0.30 0.30 0.30 0.30 0.23 0.30 0.30 0.30 0.30 0.30 0.30 0.30 0.30
ED1 Plan ED2 Plan
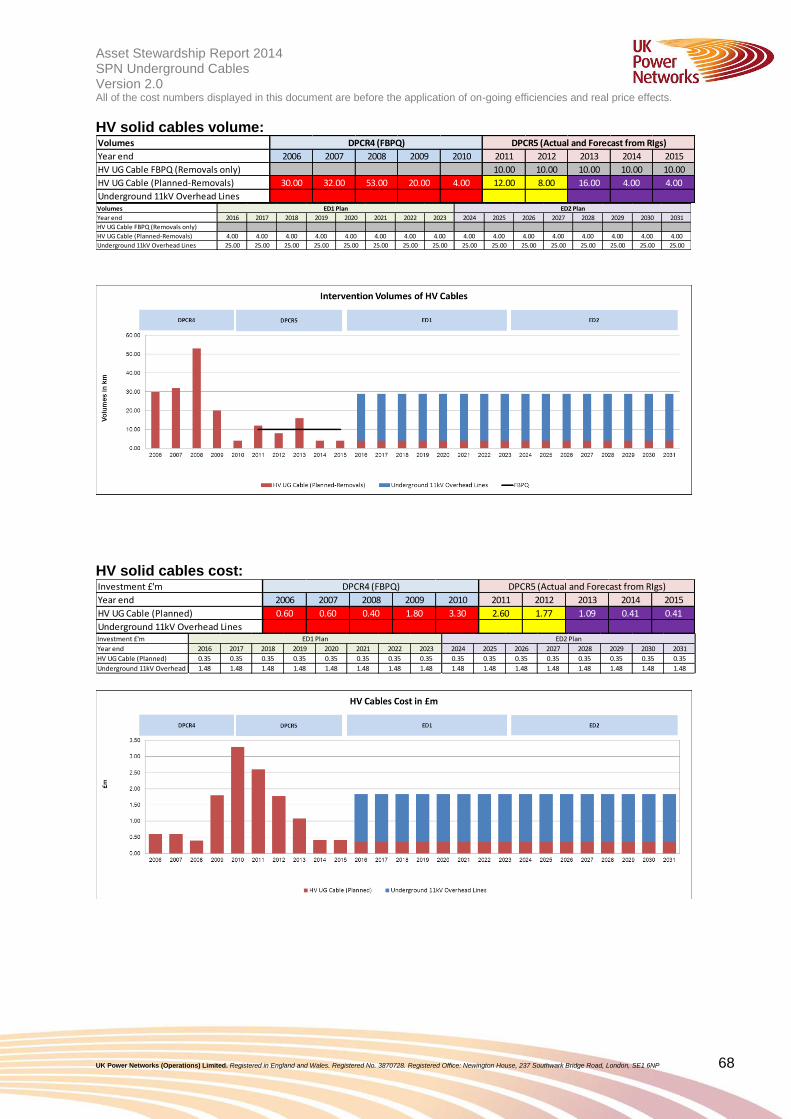
Asset Stewardship Report 2014 Working draft v0.1 SPN Underground Cables Version 2.0 All of the cost numbers displayed in this document are before the application of on-going efficiencies and real price effects.
UK Power Networks (Operations) Limited. Registered in England and Wales. Registered No. 3870728. Registered Office: Newington House, 237 Southwark Bridge Road, London, SE1 6NP 68
HV solid cables volume:
HV solid cables cost:
Volumes
Year end 2006 2007 2008 2009 2010 2011 2012 2013 2014 2015
HV UG Cable FBPQ (Removals only) 10.00 10.00 10.00 10.00 10.00
HV UG Cable (Planned-Removals) 30.00 32.00 53.00 20.00 4.00 12.00 8.00 16.00 4.00 4.00
Underground 11kV Overhead Lines
DPCR5 (Actual and Forecast from RIgs)DPCR4 (FBPQ)
Volumes
Year end 2016 2017 2018 2019 2020 2021 2022 2023 2024 2025 2026 2027 2028 2029 2030 2031
HV UG Cable FBPQ (Removals only)
HV UG Cable (Planned-Removals) 4.00 4.00 4.00 4.00 4.00 4.00 4.00 4.00 4.00 4.00 4.00 4.00 4.00 4.00 4.00 4.00
Underground 11kV Overhead Lines 25.00 25.00 25.00 25.00 25.00 25.00 25.00 25.00 25.00 25.00 25.00 25.00 25.00 25.00 25.00 25.00
ED1 Plan ED2 Plan
Investment £'m
Year end 2006 2007 2008 2009 2010 2011 2012 2013 2014 2015
HV UG Cable (Planned) 0.60 0.60 0.40 1.80 3.30 2.60 1.77 1.09 0.41 0.41
Underground 11kV Overhead Lines
DPCR5 (Actual and Forecast from RIgs)DPCR4 (FBPQ)
Investment £'m
Year end 2016 2017 2018 2019 2020 2021 2022 2023 2024 2025 2026 2027 2028 2029 2030 2031
HV UG Cable (Planned) 0.35 0.35 0.35 0.35 0.35 0.35 0.35 0.35 0.35 0.35 0.35 0.35 0.35 0.35 0.35 0.35
Underground 11kV Overhead Lines1.48 1.48 1.48 1.48 1.48 1.48 1.48 1.48 1.48 1.48 1.48 1.48 1.48 1.48 1.48 1.48
ED1 Plan ED2 Plan
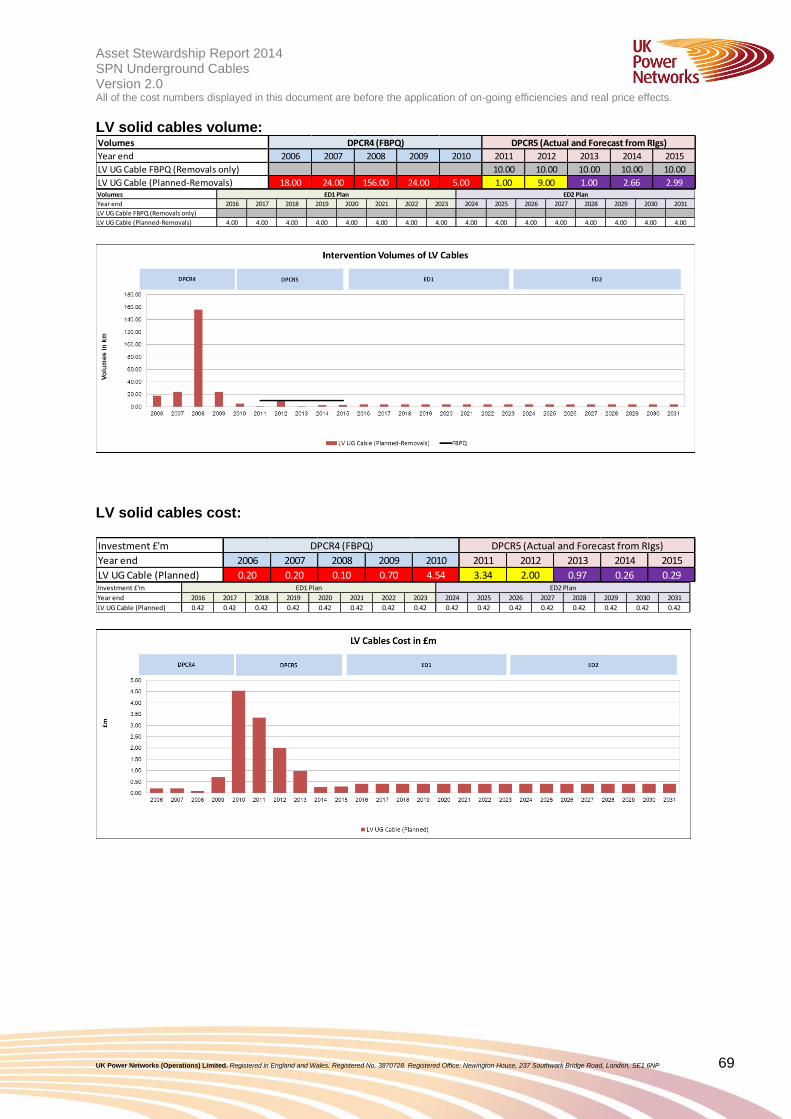
Asset Stewardship Report 2014 Working draft v0.1 SPN Underground Cables Version 2.0 All of the cost numbers displayed in this document are before the application of on-going efficiencies and real price effects.
UK Power Networks (Operations) Limited. Registered in England and Wales. Registered No. 3870728. Registered Office: Newington House, 237 Southwark Bridge Road, London, SE1 6NP 69
LV solid cables volume:
LV solid cables cost:
Volumes
Year end 2006 2007 2008 2009 2010 2011 2012 2013 2014 2015
LV UG Cable FBPQ (Removals only) 10.00 10.00 10.00 10.00 10.00
LV UG Cable (Planned-Removals) 18.00 24.00 156.00 24.00 5.00 1.00 9.00 1.00 2.66 2.99
DPCR5 (Actual and Forecast from RIgs)DPCR4 (FBPQ)
Volumes
Year end 2016 2017 2018 2019 2020 2021 2022 2023 2024 2025 2026 2027 2028 2029 2030 2031
LV UG Cable FBPQ (Removals only)
LV UG Cable (Planned-Removals) 4.00 4.00 4.00 4.00 4.00 4.00 4.00 4.00 4.00 4.00 4.00 4.00 4.00 4.00 4.00 4.00
ED1 Plan ED2 Plan
Investment £'m
Year end 2006 2007 2008 2009 2010 2011 2012 2013 2014 2015
LV UG Cable (Planned) 0.20 0.20 0.10 0.70 4.54 3.34 2.00 0.97 0.26 0.29
DPCR5 (Actual and Forecast from RIgs)DPCR4 (FBPQ)
Investment £'m
Year end 2016 2017 2018 2019 2020 2021 2022 2023 2024 2025 2026 2027 2028 2029 2030 2031
LV UG Cable (Planned) 0.42 0.42 0.42 0.42 0.42 0.42 0.42 0.42 0.42 0.42 0.42 0.42 0.42 0.42 0.42 0.42
ED1 Plan ED2 Plan
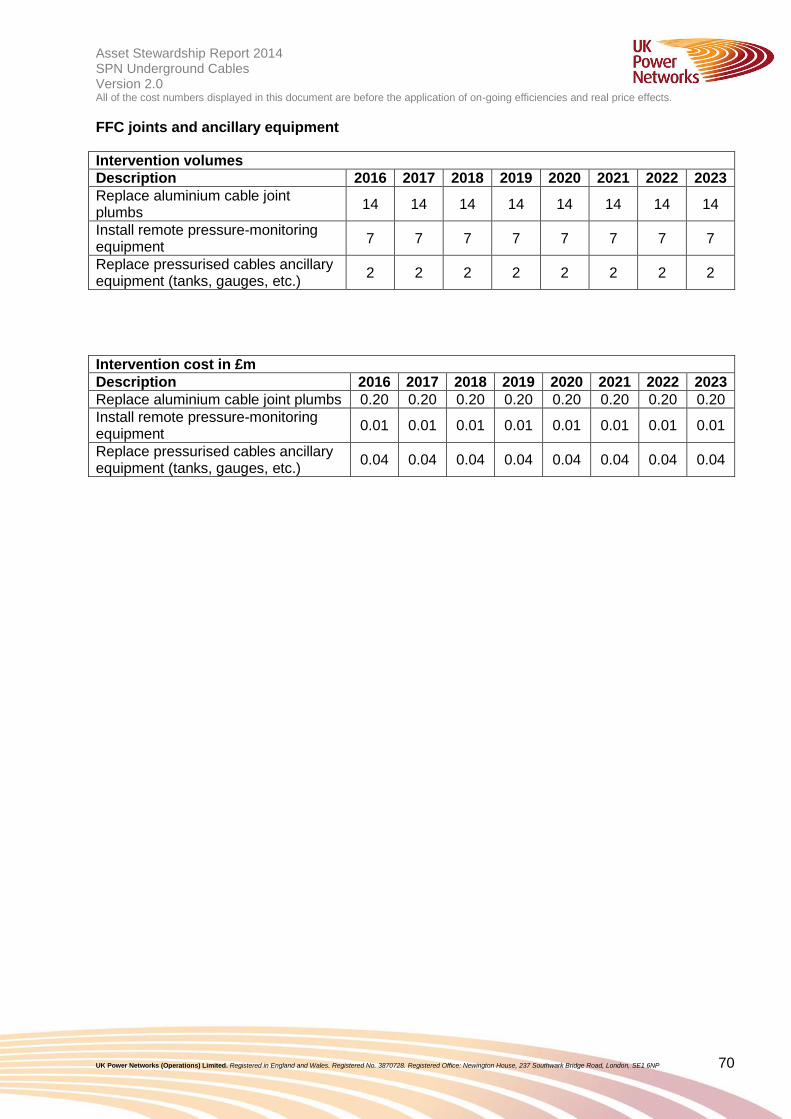
Asset Stewardship Report 2014 Working draft v0.1 SPN Underground Cables Version 2.0 All of the cost numbers displayed in this document are before the application of on-going efficiencies and real price effects.
UK Power Networks (Operations) Limited. Registered in England and Wales. Registered No. 3870728. Registered Office: Newington House, 237 Southwark Bridge Road, London, SE1 6NP 70
FFC joints and ancillary equipment
Intervention volumes
Description 2016 2017 2018 2019 2020 2021 2022 2023
Replace aluminium cable joint plumbs
14 14 14 14 14 14 14 14
Install remote pressure-monitoring equipment
7 7 7 7 7 7 7 7
Replace pressurised cables ancillary equipment (tanks, gauges, etc.)
2 2 2 2 2 2 2 2
Intervention cost in £m
Description 2016 2017 2018 2019 2020 2021 2022 2023
Replace aluminium cable joint plumbs 0.20 0.20 0.20 0.20 0.20 0.20 0.20 0.20
Install remote pressure-monitoring equipment
0.01 0.01 0.01 0.01 0.01 0.01 0.01 0.01
Replace pressurised cables ancillary equipment (tanks, gauges, etc.)
0.04 0.04 0.04 0.04 0.04 0.04 0.04 0.04

71
for evidence-based operational, tactical and strategic decisions ©DecisionLab Ltd
Appendix 6 – Sensitivity Analysis
Sensitivity Analysis: Asset Risk and Prioritisation Model for SPN 132kV UG
Cable (Oil) (written by Decision Lab)
Introduction
This is a report on the sensitivity analysis conducted on the Asset Risk and Prioritisation (ARP)
Model, developed by EA Technology and used to support the asset replacement and investment
strategy for SPN 132kV UG Cable (Oil), which is included in the ED1 plan.
The objective is to understand how the Health Index profile of assets may change if the average
asset life does not turn out as predicted.
An input to the ARP model is the starting asset population in each Health Index, which is different
in each region. Therefore, sensitivity analysis has been done on a region-by-region basis.
The Asset Risk and Prioritisation Model
The ARP model uses database information about each individual asset, and models many
parameters to predict the Health Index of each asset in the future. Significant parameters are age,
location, loading and current average asset life.
Sensitivity Analysis
Variation in average asset life can occur, but this is significantly less than the variation in
individual asset lives.
Standard average asset lives are used in the ARP model. These are 70, 80 and 95 years. In 2012,
about 46% had a current average asset life of 80 years, and about 42% of 70 years. This study
covered the full population of SPN 132kV UG Cable (Oil).
Using 2012 asset data and the replacement plans up to 2023, the ARP model was used to predict
the Health Index of each asset at the beginning and end of ED1. This was then repeated varying
each current average asset life by +/- 1, 2 and 4 years.
All results are shown below as the percentages of the population.
Average life
change
2015 percentage HI profile
HI1 HI2 HI3 HI4 HI5
-4 29.9 37.7 28.9 1.8 1.1
-2 29.9 42.6 24.3 1.8 1.1
-1 30.6 42.3 24.3 2.1 0.7
0 30.6 42.3 24.3 2.1 0.7
1 32.4 40.5 24.3 2.1 0.7
2 32.7 42.3 23.6 0.7 0.7
4 33.8 47.2 17.6 1.1 0.0
Average life
change
2023 percentage HI profile
HI1 HI2 HI3 HI4 HI5
-4 29.6 19.0 45.4 2.8 2.8
-2 29.6 25.0 39.8 2.8 2.8
-1 29.6 25.7 38.7 2.8 2.8
0 29.6 26.8 38.0 4.2 1.1
1 29.6 29.6 35.6 4.2 1.1
2 29.6 31.7 34.5 3.2 1.1
4 29.6 35.9 29.9 3.2 1.1
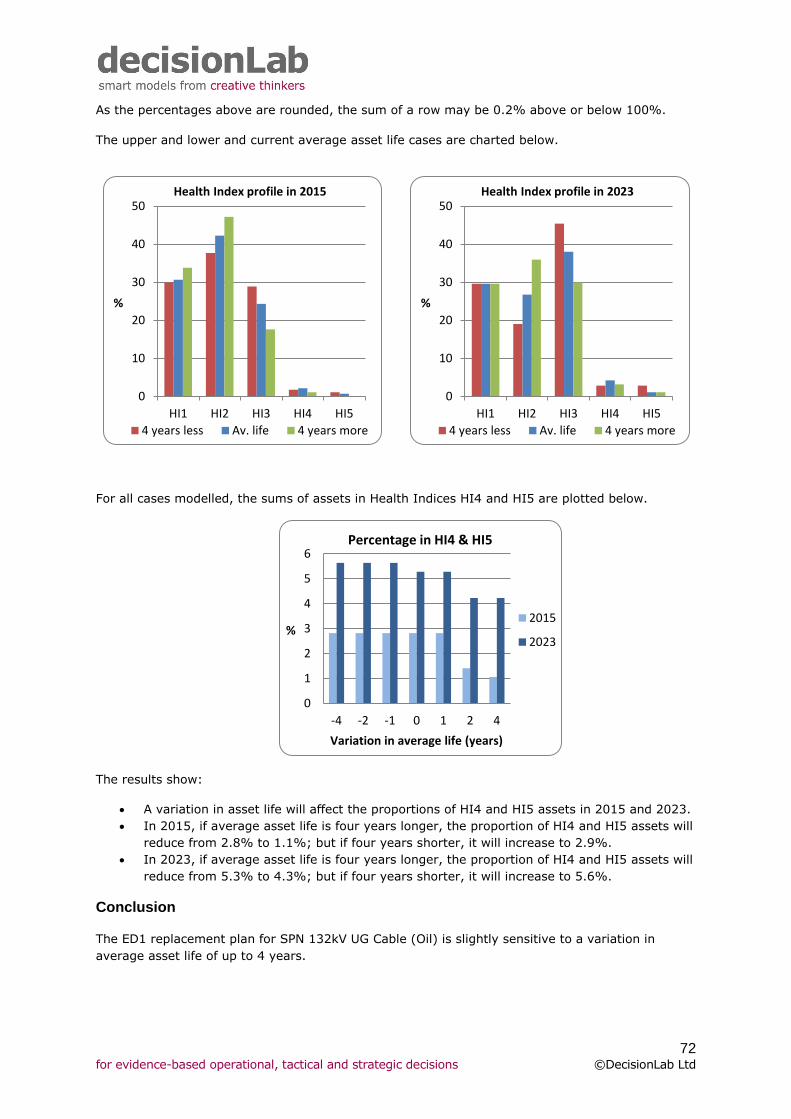
72
for evidence-based operational, tactical and strategic decisions ©DecisionLab Ltd
As the percentages above are rounded, the sum of a row may be 0.2% above or below 100%.
The upper and lower and current average asset life cases are charted below.
For all cases modelled, the sums of assets in Health Indices HI4 and HI5 are plotted below.
The results show:
A variation in asset life will affect the proportions of HI4 and HI5 assets in 2015 and 2023.
In 2015, if average asset life is four years longer, the proportion of HI4 and HI5 assets will
reduce from 2.8% to 1.1%; but if four years shorter, it will increase to 2.9%.
In 2023, if average asset life is four years longer, the proportion of HI4 and HI5 assets will
reduce from 5.3% to 4.3%; but if four years shorter, it will increase to 5.6%.
Conclusion
The ED1 replacement plan for SPN 132kV UG Cable (Oil) is slightly sensitive to a variation in
average asset life of up to 4 years.
0
10
20
30
40
50
HI1 HI2 HI3 HI4 HI5
%
Health Index profile in 2015
4 years less Av. life 4 years more
0
10
20
30
40
50
HI1 HI2 HI3 HI4 HI5
%
Health Index profile in 2023
4 years less Av. life 4 years more
0
1
2
3
4
5
6
-4 -2 -1 0 1 2 4
%
Variation in average life (years)
Percentage in HI4 & HI5
2015
2023
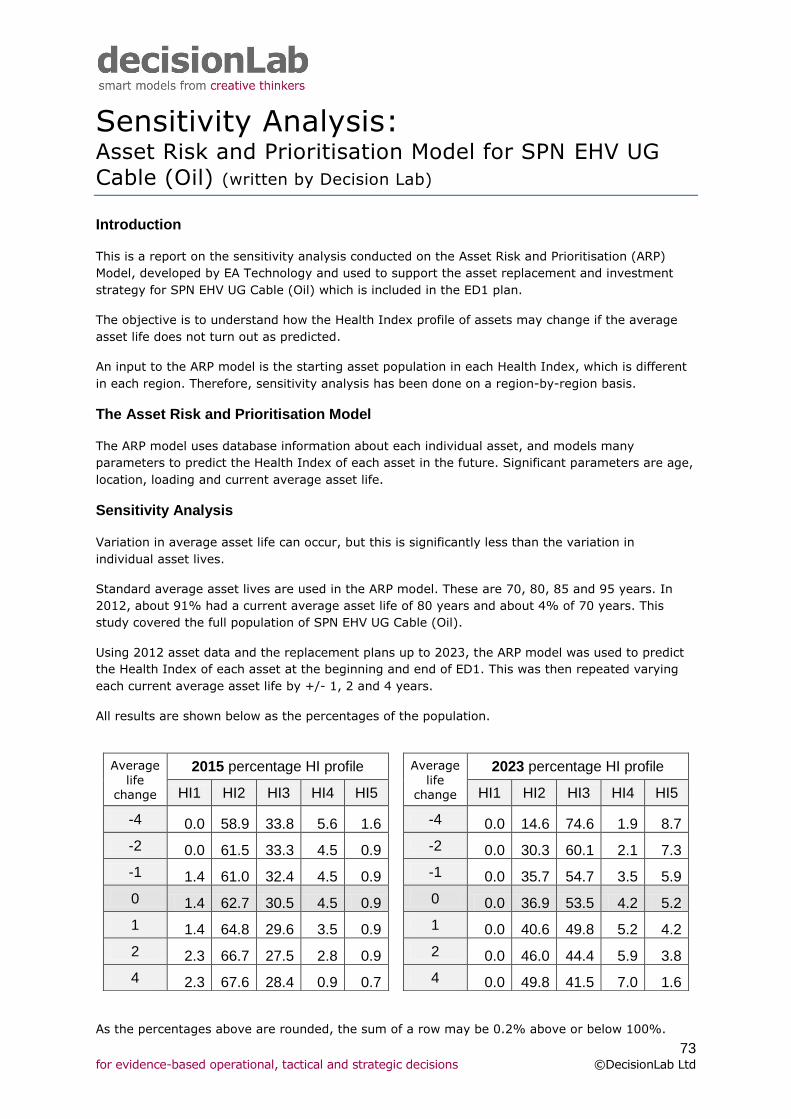
73
for evidence-based operational, tactical and strategic decisions ©DecisionLab Ltd
Sensitivity Analysis: Asset Risk and Prioritisation Model for SPN EHV UG
Cable (Oil) (written by Decision Lab)
Introduction
This is a report on the sensitivity analysis conducted on the Asset Risk and Prioritisation (ARP)
Model, developed by EA Technology and used to support the asset replacement and investment
strategy for SPN EHV UG Cable (Oil) which is included in the ED1 plan.
The objective is to understand how the Health Index profile of assets may change if the average
asset life does not turn out as predicted.
An input to the ARP model is the starting asset population in each Health Index, which is different
in each region. Therefore, sensitivity analysis has been done on a region-by-region basis.
The Asset Risk and Prioritisation Model
The ARP model uses database information about each individual asset, and models many
parameters to predict the Health Index of each asset in the future. Significant parameters are age,
location, loading and current average asset life.
Sensitivity Analysis
Variation in average asset life can occur, but this is significantly less than the variation in
individual asset lives.
Standard average asset lives are used in the ARP model. These are 70, 80, 85 and 95 years. In
2012, about 91% had a current average asset life of 80 years and about 4% of 70 years. This
study covered the full population of SPN EHV UG Cable (Oil).
Using 2012 asset data and the replacement plans up to 2023, the ARP model was used to predict
the Health Index of each asset at the beginning and end of ED1. This was then repeated varying
each current average asset life by +/- 1, 2 and 4 years.
All results are shown below as the percentages of the population.
Average
life change
2015 percentage HI profile
HI1 HI2 HI3 HI4 HI5
-4 0.0 58.9 33.8 5.6 1.6
-2 0.0 61.5 33.3 4.5 0.9
-1 1.4 61.0 32.4 4.5 0.9
0 1.4 62.7 30.5 4.5 0.9
1 1.4 64.8 29.6 3.5 0.9
2 2.3 66.7 27.5 2.8 0.9
4 2.3 67.6 28.4 0.9 0.7
Average
life change
2023 percentage HI profile
HI1 HI2 HI3 HI4 HI5
-4 0.0 14.6 74.6 1.9 8.7
-2 0.0 30.3 60.1 2.1 7.3
-1 0.0 35.7 54.7 3.5 5.9
0 0.0 36.9 53.5 4.2 5.2
1 0.0 40.6 49.8 5.2 4.2
2 0.0 46.0 44.4 5.9 3.8
4 0.0 49.8 41.5 7.0 1.6
As the percentages above are rounded, the sum of a row may be 0.2% above or below 100%.
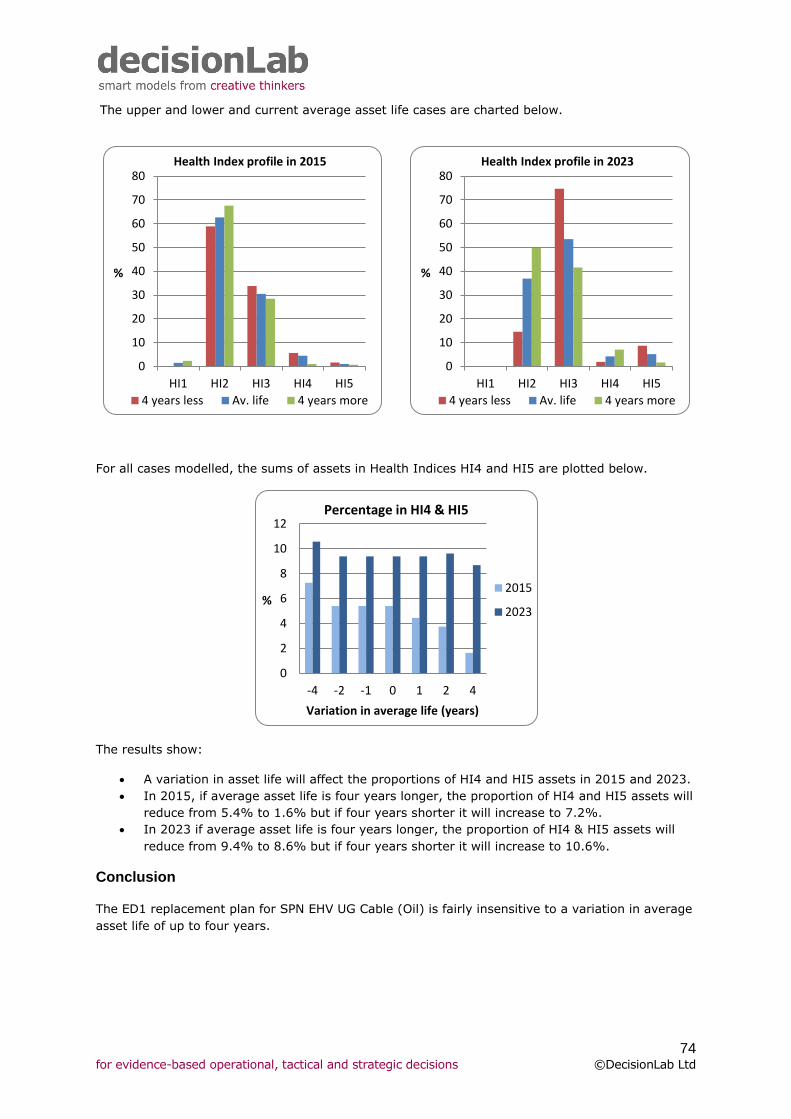
74
for evidence-based operational, tactical and strategic decisions ©DecisionLab Ltd
The upper and lower and current average asset life cases are charted below.
For all cases modelled, the sums of assets in Health Indices HI4 and HI5 are plotted below.
The results show:
A variation in asset life will affect the proportions of HI4 and HI5 assets in 2015 and 2023.
In 2015, if average asset life is four years longer, the proportion of HI4 and HI5 assets will
reduce from 5.4% to 1.6% but if four years shorter it will increase to 7.2%.
In 2023 if average asset life is four years longer, the proportion of HI4 & HI5 assets will
reduce from 9.4% to 8.6% but if four years shorter it will increase to 10.6%.
Conclusion
The ED1 replacement plan for SPN EHV UG Cable (Oil) is fairly insensitive to a variation in average
asset life of up to four years.
0
10
20
30
40
50
60
70
80
HI1 HI2 HI3 HI4 HI5
%
Health Index profile in 2015
4 years less Av. life 4 years more
0
10
20
30
40
50
60
70
80
HI1 HI2 HI3 HI4 HI5
%
Health Index profile in 2023
4 years less Av. life 4 years more
0
2
4
6
8
10
12
-4 -2 -1 0 1 2 4
%
Variation in average life (years)
Percentage in HI4 & HI5
2015
2023
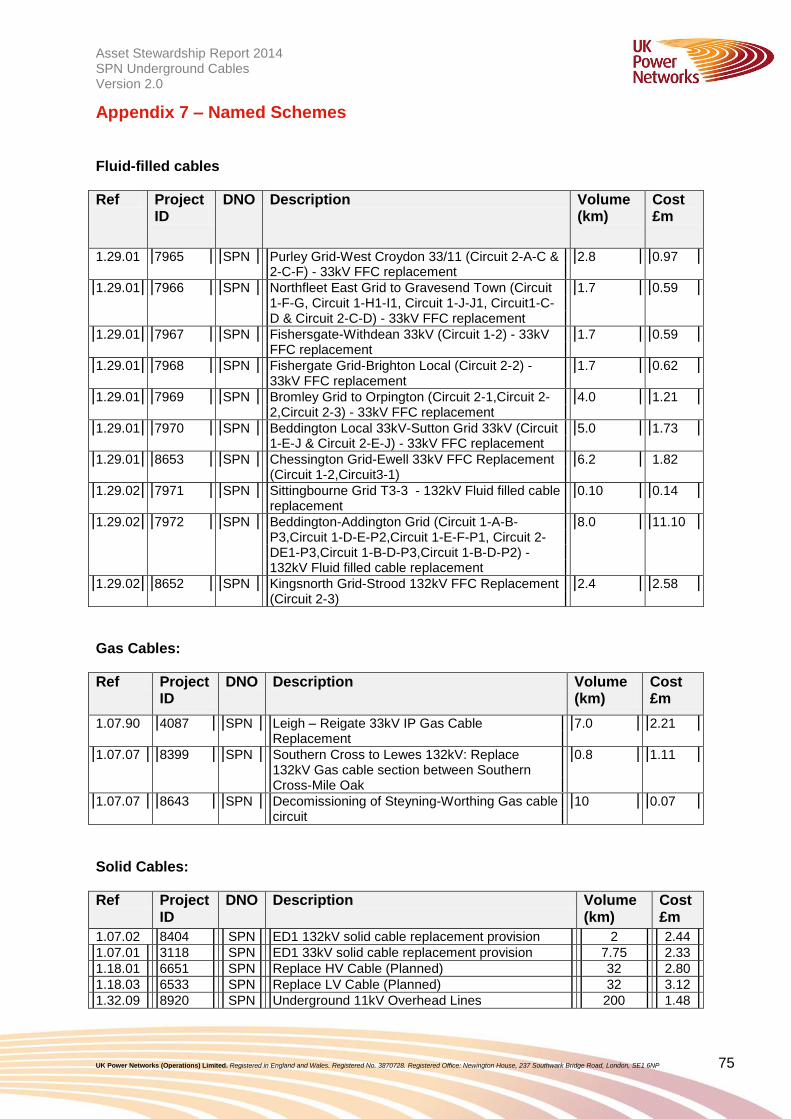
Asset Stewardship Report 2014 Working draft v0.1 SPN Underground Cables Version 2.0
UK Power Networks (Operations) Limited. Registered in England and Wales. Registered No. 3870728. Registered Office: Newington House, 237 Southwark Bridge Road, London, SE1 6NP 75
Appendix 7 – Named Schemes
Fluid-filled cables
Ref Project ID
DNO Description Volume (km)
Cost £m
1.29.01 7965 SPN Purley Grid-West Croydon 33/11 (Circuit 2-A-C & 2-C-F) - 33kV FFC replacement
2.8 0.97
1.29.01 7966 SPN Northfleet East Grid to Gravesend Town (Circuit 1-F-G, Circuit 1-H1-I1, Circuit 1-J-J1, Circuit1-C-D & Circuit 2-C-D) - 33kV FFC replacement
1.7 0.59
1.29.01 7967 SPN Fishersgate-Withdean 33kV (Circuit 1-2) - 33kV FFC replacement
1.7 0.59
1.29.01 7968 SPN Fishergate Grid-Brighton Local (Circuit 2-2) - 33kV FFC replacement
1.7 0.62
1.29.01 7969 SPN Bromley Grid to Orpington (Circuit 2-1,Circuit 2-2,Circuit 2-3) - 33kV FFC replacement
4.0 1.21
1.29.01 7970 SPN Beddington Local 33kV-Sutton Grid 33kV (Circuit 1-E-J & Circuit 2-E-J) - 33kV FFC replacement
5.0 1.73
1.29.01 8653 SPN Chessington Grid-Ewell 33kV FFC Replacement (Circuit 1-2,Circuit3-1)
6.2 1.82
1.29.02 7971 SPN Sittingbourne Grid T3-3 - 132kV Fluid filled cable replacement
0.10 0.14
1.29.02 7972 SPN Beddington-Addington Grid (Circuit 1-A-B-P3,Circuit 1-D-E-P2,Circuit 1-E-F-P1, Circuit 2-DE1-P3,Circuit 1-B-D-P3,Circuit 1-B-D-P2) - 132kV Fluid filled cable replacement
8.0 11.10
1.29.02 8652 SPN Kingsnorth Grid-Strood 132kV FFC Replacement (Circuit 2-3)
2.4 2.58
Gas Cables:
Ref Project ID
DNO Description Volume (km)
Cost £m
1.07.90 4087 SPN Leigh – Reigate 33kV IP Gas Cable Replacement
7.0 2.21
1.07.07 8399 SPN Southern Cross to Lewes 132kV: Replace 132kV Gas cable section between Southern Cross-Mile Oak
0.8 1.11
1.07.07 8643 SPN Decomissioning of Steyning-Worthing Gas cable circuit
10 0.07
Solid Cables:
Ref Project ID
DNO Description Volume (km)
Cost £m
1.07.02 8404 SPN ED1 132kV solid cable replacement provision 2 2.44
1.07.01 3118 SPN ED1 33kV solid cable replacement provision 7.75 2.33
1.18.01 6651 SPN Replace HV Cable (Planned) 32 2.80
1.18.03 6533 SPN Replace LV Cable (Planned) 32 3.12
1.32.09 8920 SPN Underground 11kV Overhead Lines 200 1.48

Asset Stewardship Report 2014 Working draft v0.1 SPN Underground Cables Version 2.0
UK Power Networks (Operations) Limited. Registered in England and Wales. Registered No. 3870728. Registered Office: Newington House, 237 Southwark Bridge Road, London, SE1 6NP 76
Appendix 8 – Output NAMP/ED1 Business Plan Data Tables
Source: 19th February 2014 NAMP Table O 21st February 2014 ED1 Business Plan Data Tables
Outputs
Investment destription NAMP Line 2015/16 2016/17 2017/18 2018/19 2019/20 2020/21 2021/22 2022/23 Total RIG TableRIG Row 2015/16 2016/17 2017/18 2018/19 2019/20 2020/21 2021/22 2022/23 Total
132kV FFC replacement 1.29.02 0.00 0.00 8.00 0.00 0.00 0.00 0.00 2.50 10.50 CV3 221 - - 8.00 - - - - 2.50 10.50
CV3 191 5.00 4.00 - - - 3.50 1.70 9.00 23.20
CV3 194 - - - - - - - -
132kV Gas replacement 1.07.07 0.00 0.00 0.00 0.00 0.00 0.00 0.80 10.00 10.80 CV3 222 - - - - - - 0.80 10.00 10.80
CV3 192 - - - - - - - 7.00 7.00
CV3 195 - - - - - - - -
Replace 132kV solid cable 1.07.02 0.25 0.25 0.25 0.25 0.25 0.25 0.25 0.25 2.00 CV3 220 0.25 0.25 0.25 0.25 0.25 0.25 0.25 0.26 2.00
CV3 190 1.00 1.00 1.00 1.00 1.00 1.00 1.00 0.75 7.75
CV3 193 - - - - - - - -
Replace HV cable (planned) 1.18.01 4.00 4.00 4.00 4.00 4.00 4.00 4.00 4.00 32.00 CV3 157 4.00 4.00 4.00 4.00 4.00 4.00 4.00 4.00 32.00
Underground 11kV Overhead Lines 1.32.09 25.00 25.00 25.00 25.00 25.00 25.00 25.00 25.00 200.00 CV3 151 25.00 25.00 25.00 25.00 25.00 25.00 25.00 25.00 200.00
CV3 137 - - - - - - - - 0.00
CV3 138 2.89 2.89 2.89 2.89 2.89 2.89 2.89 2.89 23.12
CV3 139 1.11 1.11 1.11 1.11 1.11 1.11 1.11 1.11 8.87
Total 39.25 38.25 42.25 34.25 34.25 37.75 36.75 62.50 325.25 39.25 38.25 42.25 34.25 34.25 37.75 36.75 62.51 325.23
32.004.00 4.00 4.00 4.00 4.00Replace LV cable (planned) 1.18.03 4.00 4.00 4.00
7.00
Replace EHV solid cable (planned) 1.07.01 1.00 1.00 1.00 1.00 1.00 1.00 1.00 0.75 7.75
0.00 0.00 0.00 0.00 7.00EHV Gas replacement 1.07.90 0.00 0.00 0.00
1.70 9.00 23.204.00 0.00EHV FFC replacement 1.29.01 0.00 0.00 3.505.00
Asset Stewardship reports RIG Table

Asset Stewardship Report 2014 Working draft v0.1 SPN Underground Cables Version 2.0
UK Power Networks (Operations) Limited. Registered in England and Wales. Registered No. 3870728. Registered Office: Newington House, 237 Southwark Bridge Road, London, SE1 6NP 77
Appendix 9 – Efficiency benchmarking with other DNO’s
This graph shows SPN have below average level of investment. The business objective
throughout the planning process for ED1 was to invest at a level that will maintain leakage
rates at roughly the same level throughout the ED1 period
EPN
LPN
SPN
EMID
WMID
SWALES
SWEST
ENW NPGN
NPGY
SPD SPMW
SSES
SSEH
0%
5%
10%
15%
20%
25%
30%
35%
32.0 37.0 42.0 47.0 52.0 57.0
ED1
Re
pla
cem
en
ts (
% o
f P
op
ula
tio
n)
Mean Age (Years)
132kV & EHV Cables (FFC and Gas)(Removals)
All DNO Average Age
All DNO AverageReplacement Rate
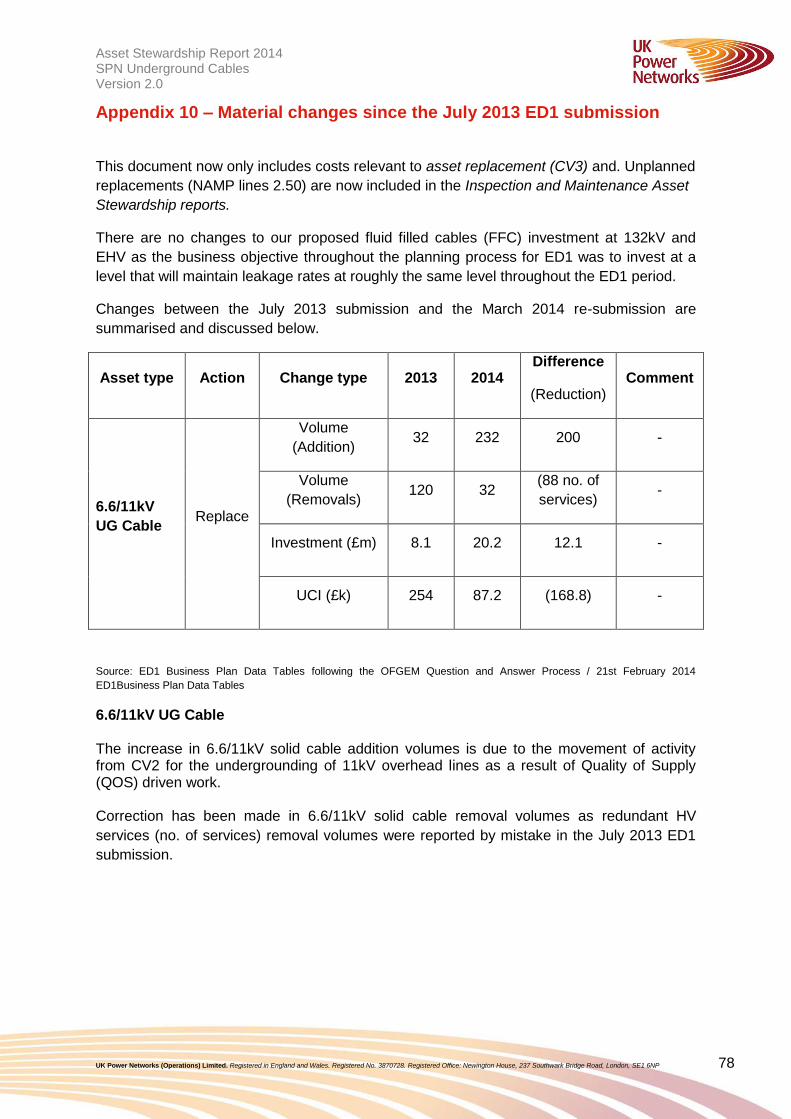
Asset Stewardship Report 2014 Working draft v0.1 SPN Underground Cables Version 2.0
UK Power Networks (Operations) Limited. Registered in England and Wales. Registered No. 3870728. Registered Office: Newington House, 237 Southwark Bridge Road, London, SE1 6NP 78
Appendix 10 – Material changes since the July 2013 ED1 submission
This document now only includes costs relevant to asset replacement (CV3) and. Unplanned
replacements (NAMP lines 2.50) are now included in the Inspection and Maintenance Asset
Stewardship reports.
There are no changes to our proposed fluid filled cables (FFC) investment at 132kV and
EHV as the business objective throughout the planning process for ED1 was to invest at a
level that will maintain leakage rates at roughly the same level throughout the ED1 period.
Changes between the July 2013 submission and the March 2014 re-submission are
summarised and discussed below.
Asset type Action Change type 2013 2014 Difference
(Reduction) Comment
6.6/11kV
UG Cable Replace
Volume
(Addition) 32 232 200 -
Volume
(Removals) 120 32
(88 no. of
services) -
Investment (£m) 8.1 20.2 12.1 -
UCI (£k) 254 87.2 (168.8) -
Source: ED1 Business Plan Data Tables following the OFGEM Question and Answer Process / 21st February 2014
ED1Business Plan Data Tables
6.6/11kV UG Cable The increase in 6.6/11kV solid cable addition volumes is due to the movement of activity from CV2 for the undergrounding of 11kV overhead lines as a result of Quality of Supply (QOS) driven work. Correction has been made in 6.6/11kV solid cable removal volumes as redundant HV
services (no. of services) removal volumes were reported by mistake in the July 2013 ED1
submission.
Top Related