


Languages
Pages
Legal


Development in inclusive education
1
Special needs education in the Netherlands
Sip Jan Pijl
Development in inclusive education
2
Education in the Netherlands, some facts:
• Total population: 16.7 million
• Elementary education (4-12) incl. pupils with SEN: 1.5 million
• Secondary education (12+): .95 million
• Pupils with SEN (4-12): 81000
• Pupils with SEN (12+): 53000
• Urban / rural spread: 13.7 vs 3million
• GPD per capita: 42,333
Development in inclusive education
3
Regular and Special schools
• Separate laws and regulations for regular
and special schools
• Special schools as a highly specialized
system
• Negative effects of special school
placement limited
• Growing attendance in Special Education
Development in inclusive education
4
Criticising special schools
• Growing international pressure
• Growing expenditure
• Concerns about segregation
• Parents pushing for inclusion
• Pressure valve for regular education?
Or: who is protected?

Development in inclusive education
5
Development in inclusive education
6
New laws:
• Law on primary education (1995)
introduced the ‘Together to school
again’ policy
• Law on the Expertise Centres (2002)
introduced the ‘Back-pack’ policy

Development in inclusive education
7
Together to school again
• About 25 regular schools, 1 LD school and 1 MMR school in a regional cluster
• Half of the funding for the two special schools to the cluster
• Funding based on population data
• Each school appointed an internal support teacher
• Each cluster has an assessment team
Development in inclusive education
8
Back-pack policy• 10 types of special schools reorganized in
4 types of Expertise Centres
• Regional assessment committees decide on granting back-packs
• National rules and criteria for assessment
• Funding follows pupil
• IEP is obliged
• Parents can choose (?)

Development in inclusive education
9
Back-pack policy: Eligibility for funding:
• Apply for funding at the Regional assessment committee
• The committee uses national rules and criteria
• Criteria largely based on psycho-medical criteria e.g. > 80 dB hearing loss, IQ < 60 or DSM IV criteria.
• Argued deviation from the rules
• National committee evaluating the decisions of the regional committees
Development in inclusive education
10
Effects
Development in inclusive education
11
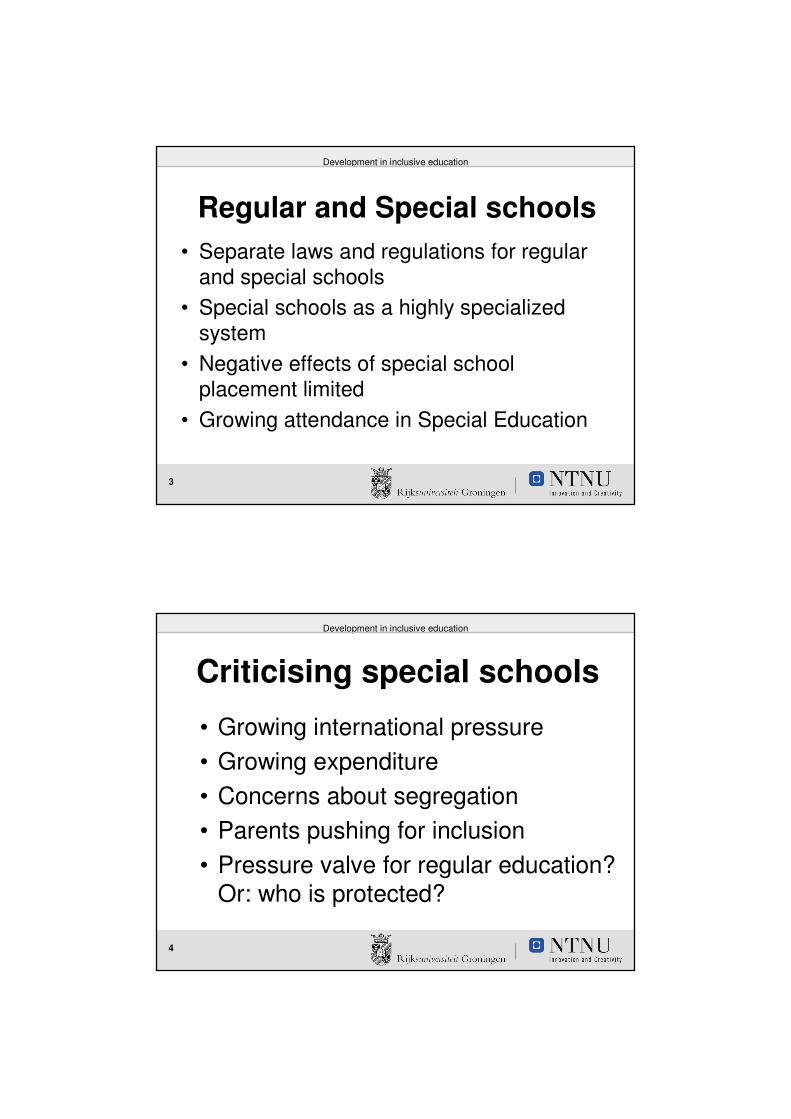
Effects 2• Untill 2002 the percentage of pupils with SEN in
clusterschools went down
• Untill 2002 the percentage in special schools went up.
• After the introduction of the back-pack policy the percentage in special schools and the percentage of pupils with SEN in regular education exploded (5 to 20 % per year).
• Huge financial problems! Drastic measures and budget cuts announced in 2011. Strikes and demonstrations.
Development in inclusive education
12
New developments:
• Schools will have a duty to care
• Abolishing the special schools in clusters
• Stopping the growth of special education
• Reorganizing all schools into large regional clusters
• Throughput funding to the clusters

Development in inclusive education
13
Obstacles in making education in the Netherlands more inclusive:
• Freedom of schooling
• No detailed national curriculum
• Standard assessment tests
• Both public and other school boards
• National Inspectorate has limited power
• Population density
Development in inclusive education
14
Progress in:• Education policy
• Legislation / regulations
• Funding
• Regional organization of education
• Teacher training
• Awareness in society
• Daily practice?

Development in inclusive education
15
International trends and statistics
Development in inclusive education
16
How inclusive is education? Country: % SEN % SE
Austria 3.2 1.6
Belgium 4.5 4.7
Denmark 11.9 2.5
Finland 17.8 3.8
Italy 1.5 < 0.5
Germany 5.3 4.8
Greece 0.9 < 0.5
Netherlands 2.1 2.2
Norway 5.6 0.3
Sweden 2.0 1.6
UK 3.2 1.2
Source: European Agency, 2003 / Eurostat 2006

Development in inclusive education
17
Has education become more inclusive?
Country: 96-98 99-01 02-04 05-06 07-08Austria 2.0 1.6 1.6 1.6 1.5Belgium 4.9 4.9 4.9 4.7 4.8Denmark 1.6 1.5 2.3 2.5 3.1Finland 3.0 3.7 3.6 3.8 3.9Italy <0.5 <0.5 <0.5 <0.5 <0.5Germany 4.4 4.6 4.8 4.8 4.8Greece 0.8 0.3 0.6 0.3 <0.5 Netherlands 4.9 1.8 1.9 2.2 2.5
Norway 0.6 0.5 0.4 0.3 0.3Sweden 0.9 1.3 1.5 1.6 1.5UK 1.2 1.1 1.1 1.2 1.4
Source: Eurostat, 2005; Eruropean agency data
Development in inclusive education
18
Lies, damned lies and statistics
Under Dutch special education legislation:
3.1 % in schools for LD and EMR +
1.8 % in all other schools for special education =
4.9 % total in special schools
New Dutch legislation in regular education:
All schools for LD and EMR part of regular school
system
Result: only 1.8 % pupils in special schools! (now: � 2.2)

Development in inclusive education
19
Some more tricks:
• Transfer responsibility for e.g. pupils with
behaviour problems to another department
• Widen the age ranges
• Place pupils in special classes in regular
schools
• Stop diagnosing and labelling pupils
Development in inclusive education
20
What do these data tell us?
• The percentage of pupils in special schools is at least 0.3 per cent
• In most countries however it is >1 per cent
• In some it is close to or above 5 per cent
• Implementing inclusive education seems to halt

Development in inclusive education
21
Development in inclusive education
22
Inclusion: Criteria for success?
• Percentage of pupils with special
needs not in segregated settings
• Percentage of pupils with special
needs socially included in their
peer-group

Development in inclusive education
23
Social participation of pupils with special needs in regular schools
• Being in a regular school is a huge advantage:easier to have relations with peers
• However, being in a regular school is not automatically: being included
Development in inclusive education
24
Being socially included is:• Accepted by peers
• Having friends
• Belonging to an in-class network
• Pupil’s own evaluation of being accepted and having friends

Development in inclusive education
25
Data collectionSample: pupils from 15 regular elementary and lower secondary schools in Trondheim
Grade Age N pupils with special educational needs
(SEN)
N pupils without special educational needs
(NSEN)
4 9-10 42 (8,6%) 449
7 12-13 37 (7,4%) 461
79 (8,0%) 910
Development in inclusive education
26
Social position – 2) reciprocal choices
The number of reciprocal choices

Development in inclusive education
27
Social position – 2) reciprocal choices
Grade Group N No friends
at all (%)
� 1 friend
(%)
4Non SEN 449 4.9 17.6
SEN 42 16.7 47.6
7Non SEN 461 7.4 22.6
SEN 37 24.3 43.2
Development in inclusive education
28
Social position –3) in-class network
• Memberships in cohesive subgroup
• A set of at least three individuals, who
have more links with members of the group than with non-members

Development in inclusive education
29
17
27
19
34
32
3
43
39
1
35
1547
29
2013
1416
2533
3828
1118
446 108
26
5
12
41
2137
40
30 22
23
36
42
29
24
Isolate 1: 17, 19, 27, 34
Isolate 2: 22, 24
Tree: 30
Dyade: 1, 35, 39, 43
Liaison 2: 3, 5, 12, 29, 40, 42
Group members: 28, 38, 33, 25
Social position – 3) in-class network
Development in inclusive education
30
How many are socially excluded?
• Overrepresented by a factor of 2 to 3 in the at-risk categories
• Based on acceptance scores at least 15 – 25 % excluded (peer group 3-4 %)

Development in inclusive education
31
Conclusion:
• Many pupils succeed in finding a position in the peer group
• For the others is physical integration only a very basic condition
• Becoming part of the group is not an automatism
• Some pupils need extra support
Top Related