


Languages
Pages
Legal

SP2 New Concepts for Efficient Freight systemsInteractive Workshop
A New Competitive, Reliable, Sustainable and Connected Rail Freight Transport
Brussels, 26/06/2017
Capacity for Rail
Stefano Ricci
Sapienza Università di Roma
DICEA

Afternoon’s program
14:30 to 15:45 Rail-Road; Rail-Sea, Marshalling Yards: Enhancement of
Interfaces
0. Introduction and scopes
1. Features and role of typical terminals and yards
2. Key Performance Indicators (KPI)
3. Real world case studies
4. Innovative technologies and operational measures: role
and applicability fields
5. Future scenarios: effects of innovations
6. Economical and financial feasibility
15:45 to 16:30 Questions and answers
16:30 to 16:45 Conclusions
2

Introduction and scopes: focus
“CAPACITY4RAIL aims at paving the way for the future railway system, delivering
coherent, demonstrated, innovative and sustainable solutions”
SUB-PROJECT 2 works towards
“a modern, automated, intelligent and fully-integrated system for efficient, reliable
freight Operations”
By means of:
WP2.1 “Progress beyond State of the Art on Rail Freight Systems” (Reference
standards 2030 and 2050)
WP2.2 “Novel rail freight vehicles”
WP2.3 “Co-modal transshipment and interchange/logistics”
WP2.4 “Catalogue of specifications”
3

Introduction and scopes: team
4
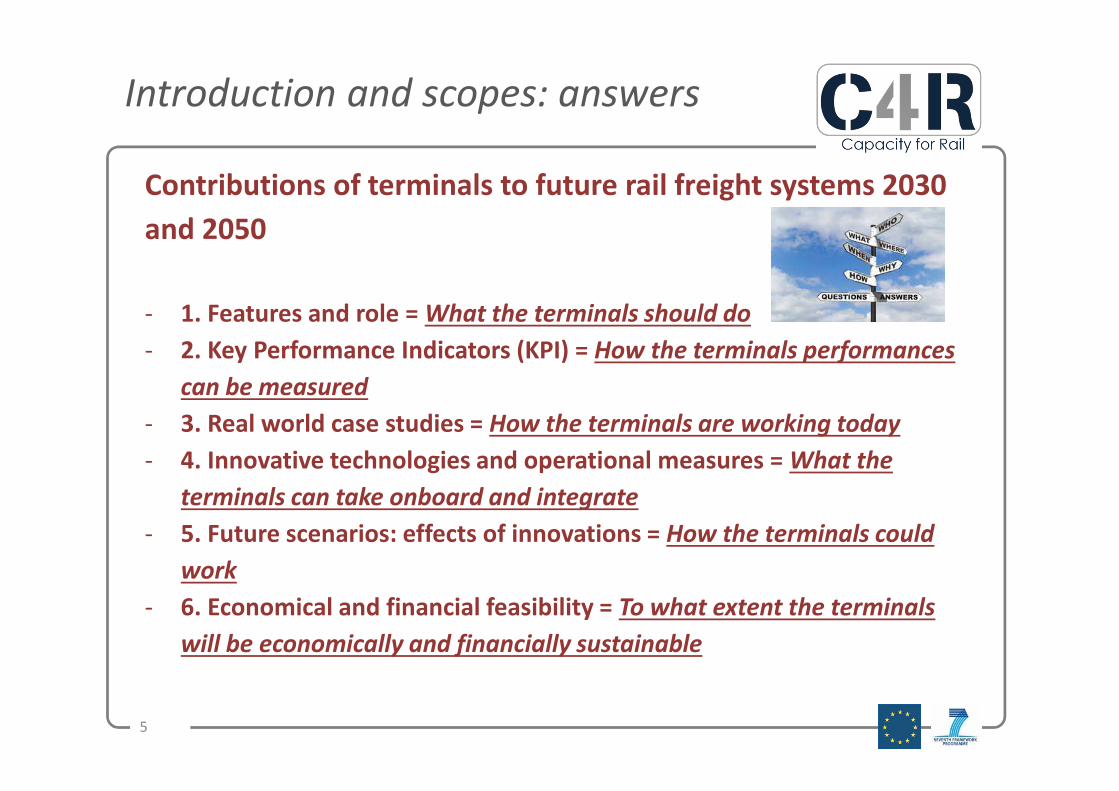
Introduction and scopes: answers
Contributions of terminals to future rail freight systems 2030
and 2050
- 1. Features and role = What the terminals should do
- 2. Key Performance Indicators (KPI) = How the terminals performances
can be measured
- 3. Real world case studies = How the terminals are working today
- 4. Innovative technologies and operational measures = What the
terminals can take onboard and integrate
- 5. Future scenarios: effects of innovations = How the terminals could
work
- 6. Economical and financial feasibility = To what extent the terminals
will be economically and financially sustainable
5
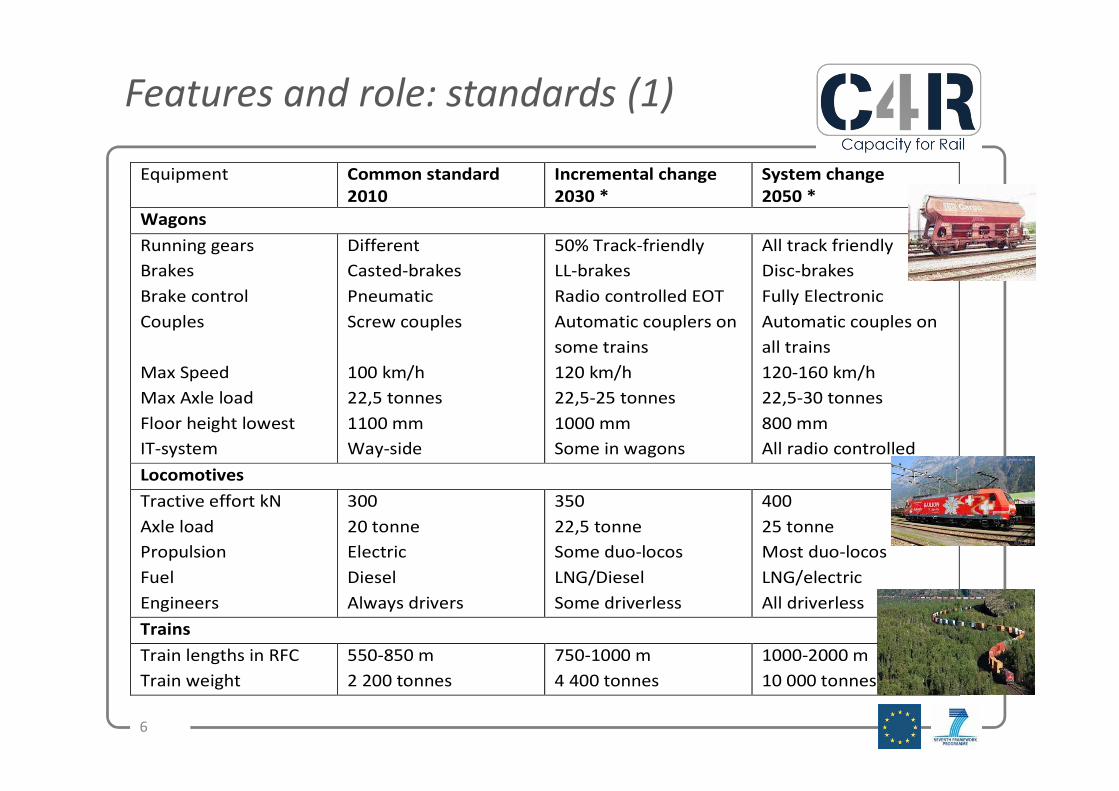
Features and role: standards (1)
Equipment Common standard
2010
Incremental change
2030 *
System change
2050 *
Wagons
Running gears
Brakes
Brake control
Couples
Max Speed
Max Axle load
Floor height lowest
IT-system
Different
Casted-brakes
Pneumatic
Screw couples
100 km/h
22,5 tonnes
1100 mm
Way-side
50% Track-friendly
LL-brakes
Radio controlled EOT
Automatic couplers on
some trains
120 km/h
22,5-25 tonnes
1000 mm
Some in wagons
All track friendly
Disc-brakes
Fully Electronic
Automatic couples on
all trains
120-160 km/h
22,5-30 tonnes
800 mm
All radio controlled
Locomotives
Tractive effort kN
Axle load
Propulsion
Fuel
Engineers
300
20 tonne
Electric
Diesel
Always drivers
350
22,5 tonne
Some duo-locos
LNG/Diesel
Some driverless
400
25 tonne
Most duo-locos
LNG/electric
All driverless
Trains
Train lengths in RFC
Train weight
550-850 m
2 200 tonnes
750-1000 m
4 400 tonnes
1000-2000 m
10 000 tonnes
6
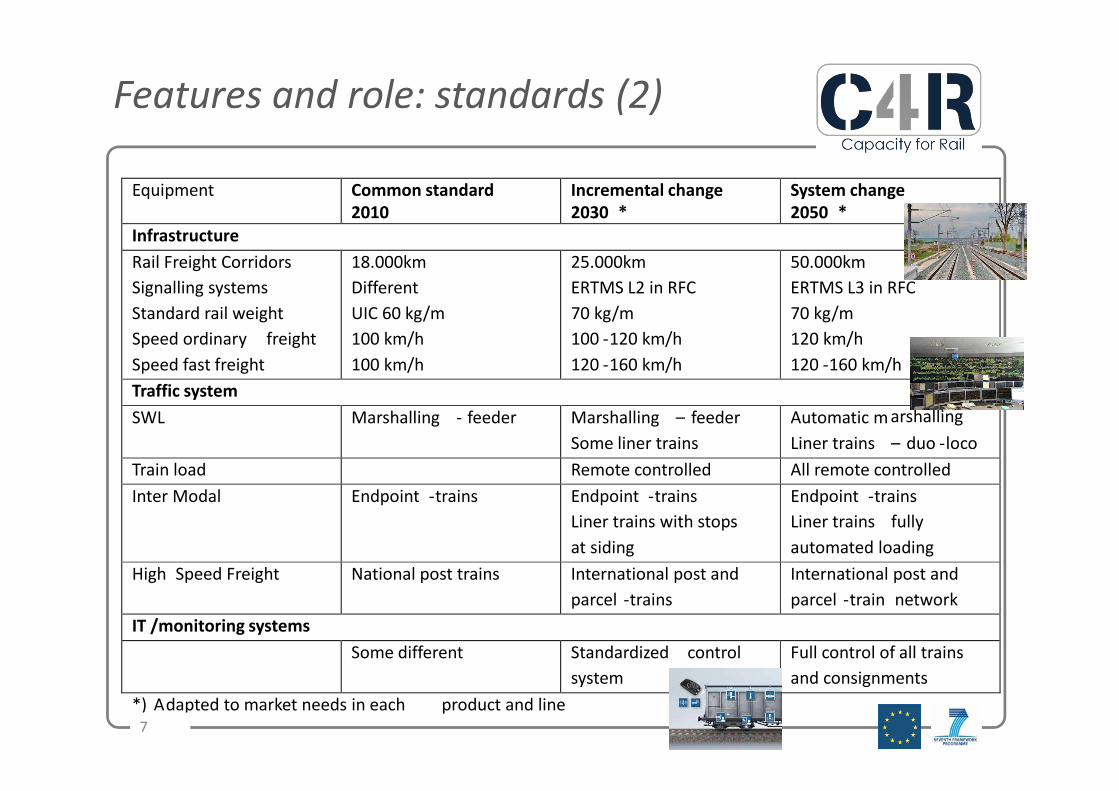
Equipment Common standard
2010
Incremental change
2030 *
System change
2050 *
Infrastructure
Rail Freight Corridors
Signalling systems
Standard rail weight
Speed ordinary freight
Speed fast freight
18.000km
Different
UIC 60 kg/m
100 km/h
100 km/h
25.000km
ERTMS L2 in RFC
70 kg/m
100 -120 km/h
120 -160 km/h
50.000km
ERTMS L3 in RFC
70 kg/m
120 km/h
120 -160 km/h
Traffic system
SWL Marshalling - feeder Marshalling – feeder
Some liner trains
Automatic m arshalling
Liner trains – duo -loco
Train load Remote controlled All remote controlled
Inter Modal Endpoint -trains Endpoint -trains
Liner trains with stops
at siding
Endpoint -trains
Liner trains fully
automated loading
High Speed Freight National post trains International post and
parcel -trains
International post and
parcel -train network
IT /monitoring systems
Some different Standardized control
system
Full control of all trains
and consignments
*) Adapted to market needs in each product and line7
Features and role: standards (2)

Features and role: typical terminals
Rail-Road: interchange interchange
DB DUSS Riem – Munich (Germany)
IFB Zomerweg – Antwerpen (Belgium)
NV Combinant – Antwerpen (Belgium)
HUPAC HTA – Antwerpen (Belgium)
Typical small scale automatic linear terminal
DB DUSS Duisburg (Germany)
Rail-Rail: marshalling yard
Hallsberg (Sweden)
Rail-Sea: port rail terminal
Valencia Principe Felipe (Spain)
8
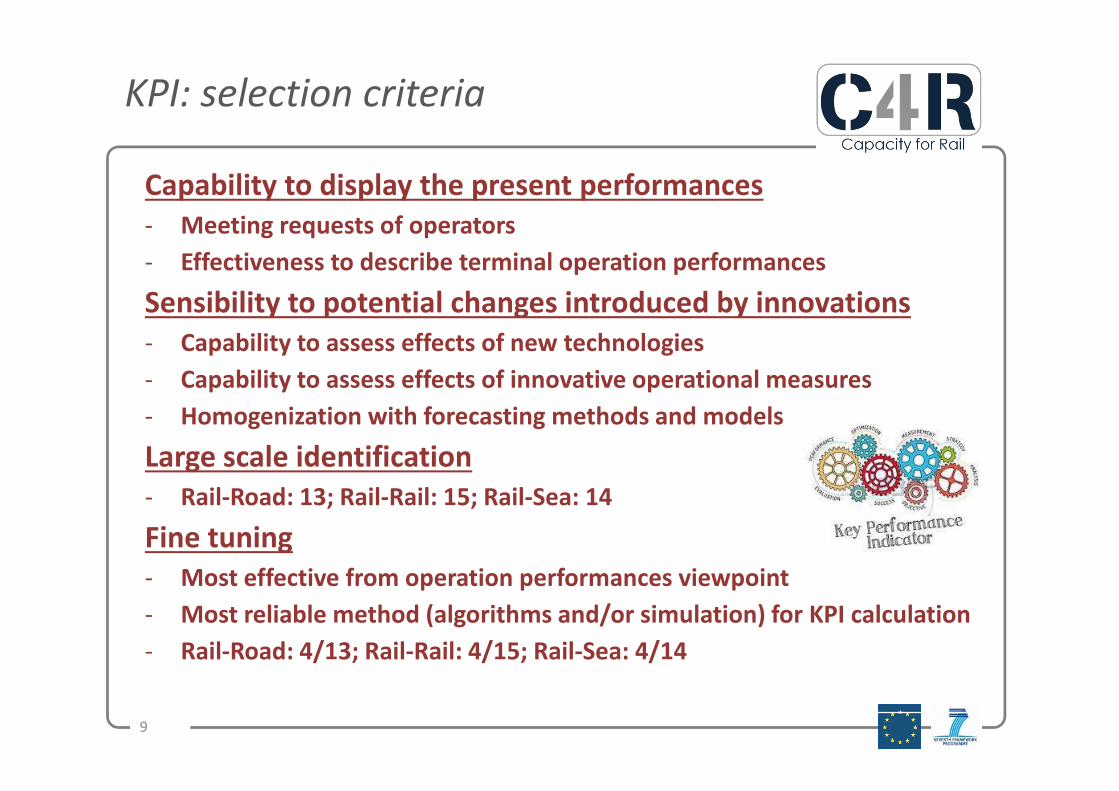
KPI: selection criteria
Capability to display the present performances
- Meeting requests of operators
- Effectiveness to describe terminal operation performances
Sensibility to potential changes introduced by innovations
- Capability to assess effects of new technologies
- Capability to assess effects of innovative operational measures
- Homogenization with forecasting methods and models
Large scale identification
- Rail-Road: 13; Rail-Rail: 15; Rail-Sea: 14
Fine tuning
- Most effective from operation performances viewpoint
- Most reliable method (algorithms and/or simulation) for KPI calculation
- Rail-Road: 4/13; Rail-Rail: 4/15; Rail-Sea: 4/14
9
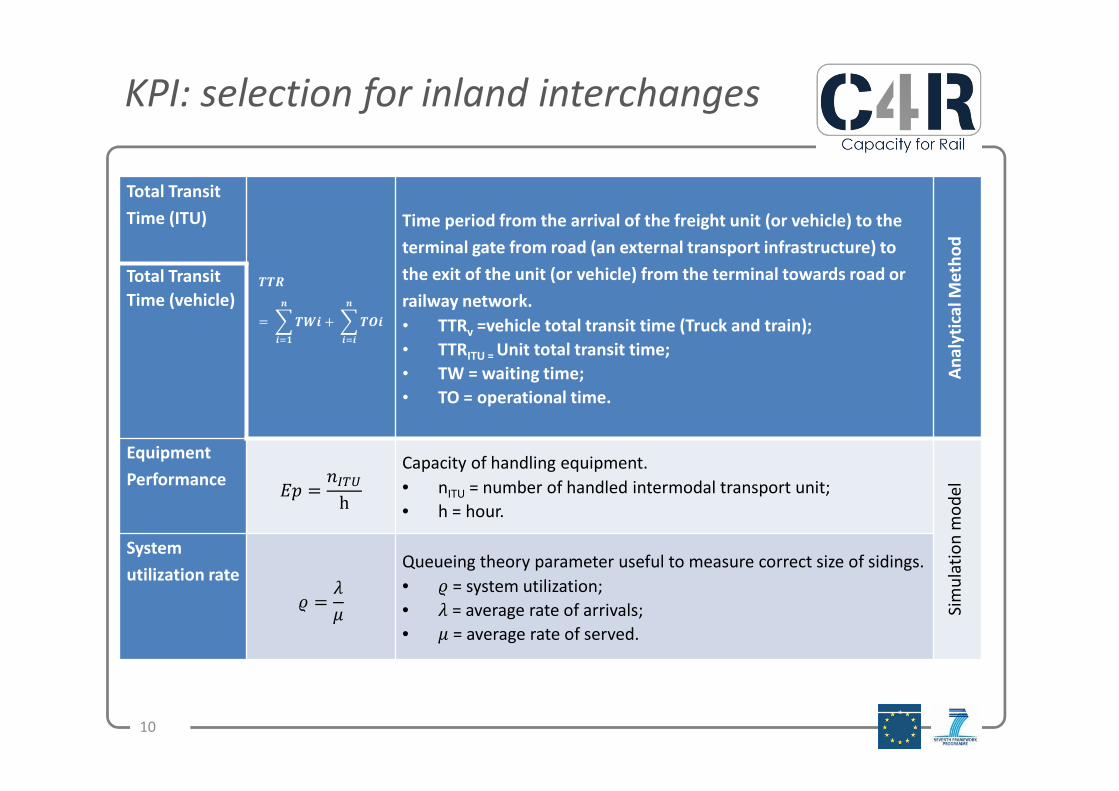
KPI: selection for inland interchanges
10
Total Transit
Time (ITU)
���
= � ��� + � ��
���
���
Time period from the arrival of the freight unit (or vehicle) to the
terminal gate from road (an external transport infrastructure) to
the exit of the unit (or vehicle) from the terminal towards road or
railway network.
• TTRv =vehicle total transit time (Truck and train);
• TTRITU = Unit total transit time;
• TW = waiting time;
• TO = operational time.
An
aly
tica
l M
eth
od
Total Transit
Time (vehicle)
Equipment
Performance � = ����h
Capacity of handling equipment.
• nITU = number of handled intermodal transport unit;
• h = hour.
Sim
ula
tio
n m
od
el
System
utilization rate
� = ��
Queueing theory parameter useful to measure correct size of sidings.
• � = system utilization;
• � = average rate of arrivals;
• � = average rate of served.
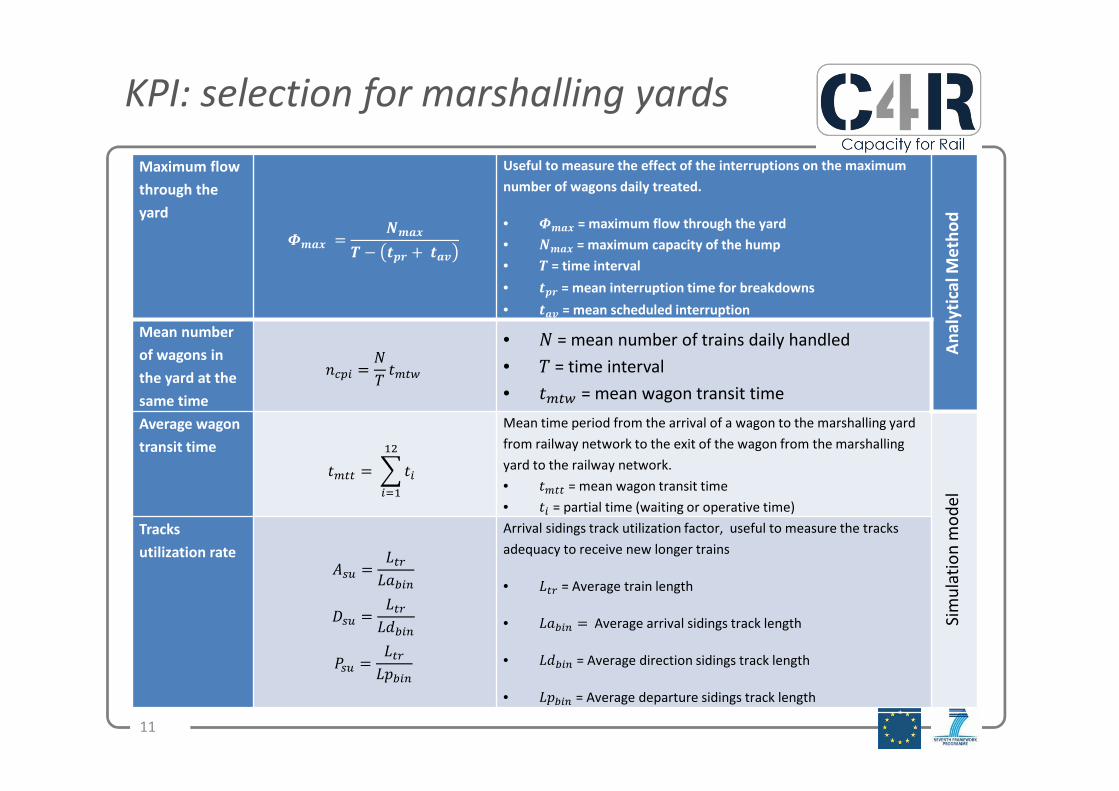
KPI: selection for marshalling yards
11
Maximum flow
through the
yard
���� = ����� − ��� + ��
Useful to measure the effect of the interruptions on the maximum
number of wagons daily treated.
• ���� = maximum flow through the yard
• ���� = maximum capacity of the hump
• � = time interval
• ��� = mean interruption time for breakdowns
• �� = mean scheduled interruption
An
aly
tica
l M
eth
od
Mean number
of wagons in
the yard at the
same time
�!"# = $% &'()
• $ = mean number of trains daily handled
• % = time interval
• &'() = mean wagon transit time
Average wagon
transit time
&'(( = � &# *+
#�*
Mean time period from the arrival of a wagon to the marshalling yard
from railway network to the exit of the wagon from the marshalling
yard to the railway network.
• &'(( = mean wagon transit time
• &# = partial time (waiting or operative time)
Sim
ula
tio
n m
od
el
Tracks
utilization rate,-. = /(0
/12#3
4-. = /(0/52#3
6-. = /(0/�2#3
Arrival sidings track utilization factor, useful to measure the tracks
adequacy to receive new longer trains
• /(0 = Average train length
• /12#3 = Average arrival sidings track length
• /52#3 = Average direction sidings track length
• /�2#3 = Average departure sidings track length

KPI: selection for port rail terminals
12
Total Transit
Time (ITU)
���
= � ��� + � ��
���
���
Time period from the arrival of the freight unit (or vehicle) to the
terminal gate from road (an external transport infrastructure) to
the exit of the unit (or vehicle) from the terminal towards road or
railway network.
• TTRv =vehicle total transit time (Ship and train);
• TTRITU = Unit total transit time;
• TW = waiting time;
• TO = operational time.
An
aly
tica
l M
eth
od
Total Transit
Time (vehicle)
Equipment
Performance � = ����
hCapacity of handling equipment.
• n ITU = number of handled intermodal transport unit;
• h = hour.
Sim
ula
tio
n m
od
el
System
utilization rate� = �
�
Queueing theory parameter, useful to measure correct size of
sidings.
• � = system utilization;
• � = average rate of arrivals;
• � = average rate of served.

Case studies: Riem
DB DUSS Riem Terminal – Munich (Germany)
5 arrivals tracks in the holding area
3 operative modules
14 loading/unloading tracks
6 trucks lanes
8 storage lanes
6 RMG cranes
24 trains/day
13
Case studies: IFB Zomerweg
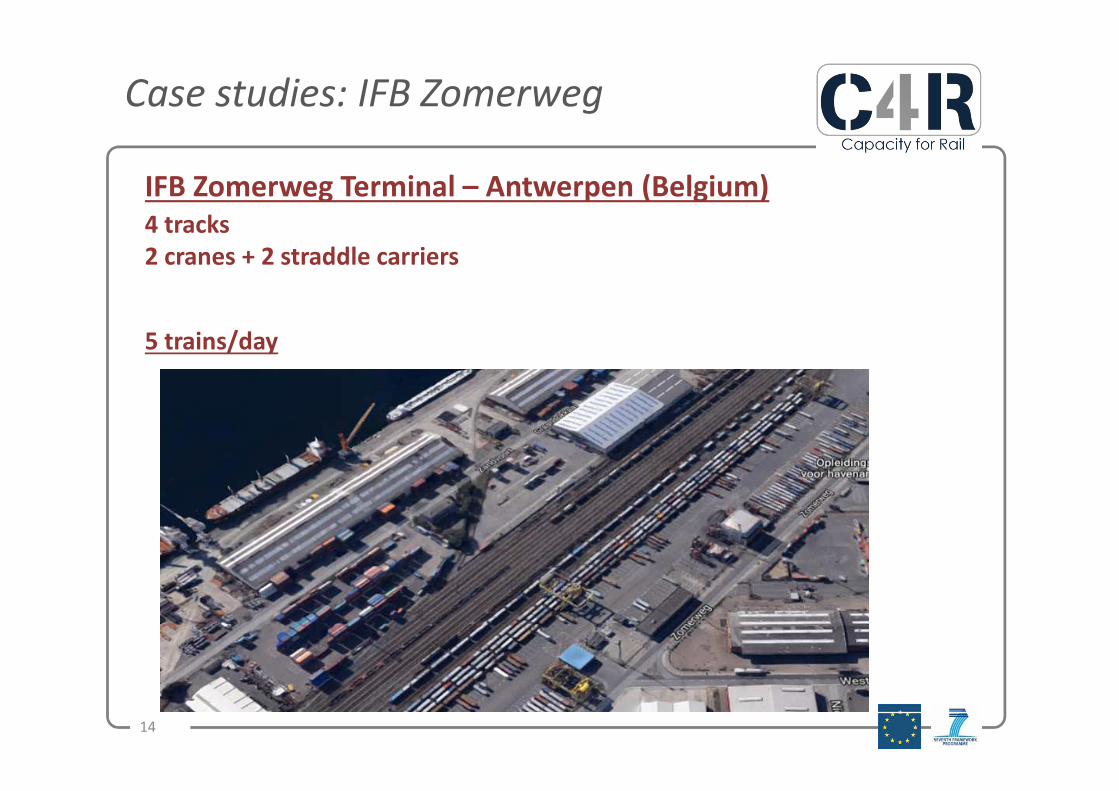
IFB Zomerweg Terminal – Antwerpen (Belgium)
4 tracks
2 cranes + 2 straddle carriers
5 trains/day
14
Case studies: IFB Zomerweg
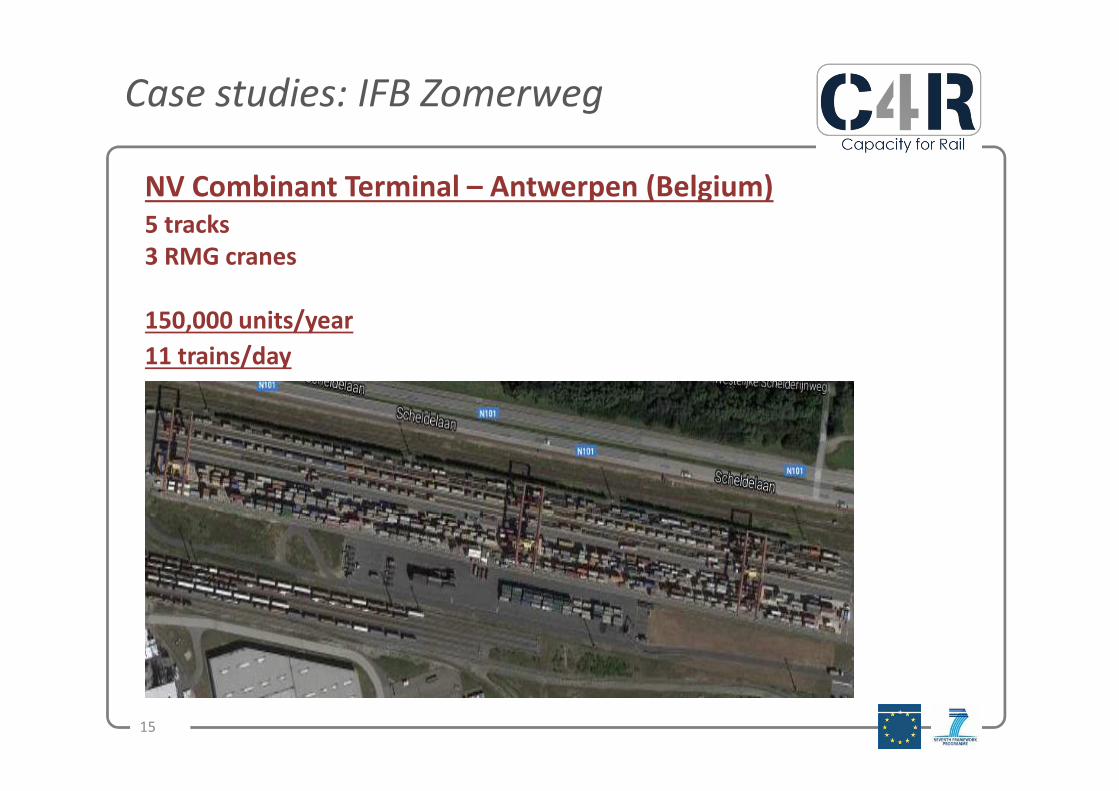
NV Combinant Terminal – Antwerpen (Belgium)
5 tracks
3 RMG cranes
150,000 units/year
11 trains/day
15
Case studies: HUPAC HTA
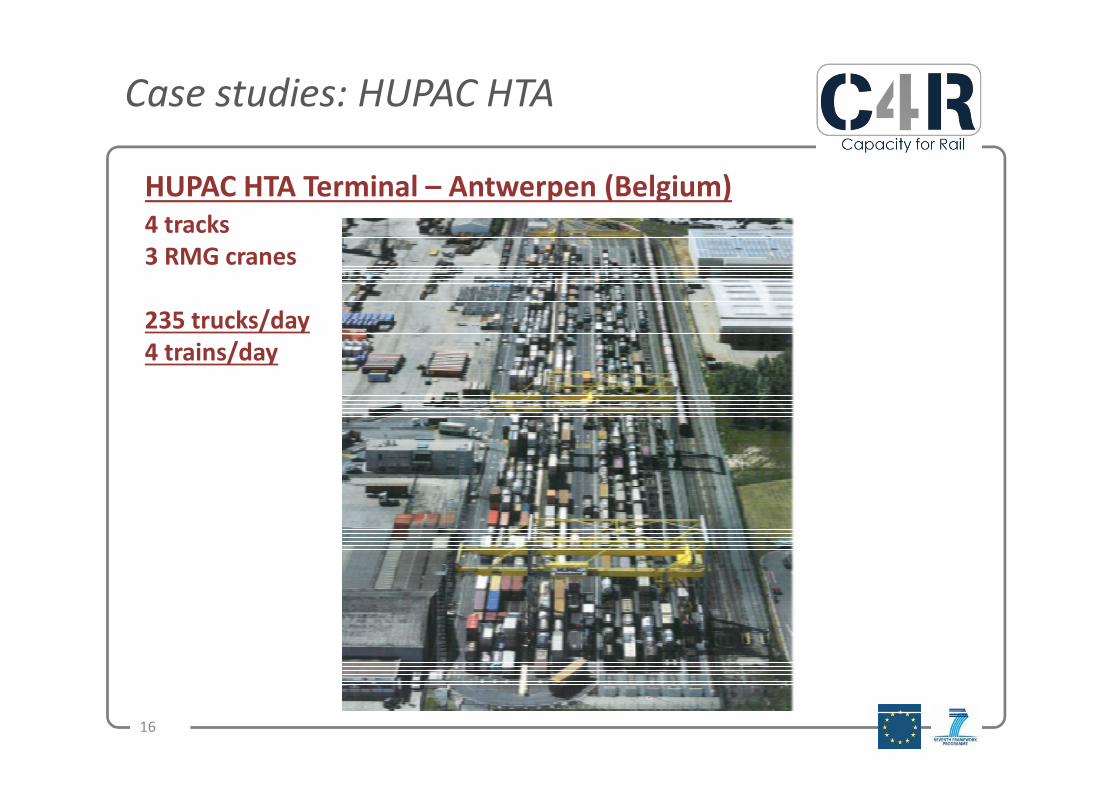
HUPAC HTA Terminal – Antwerpen (Belgium)
4 tracks
3 RMG cranes
235 trucks/day
4 trains/day
16

Case studies: linear terminal
Typical small scale automatic linear terminal
1 track (600 m)
2 temporary storages (200 m)
1 trucks lane (200 m)
17

Case studies: Duisburg
DB DUSS Duisburg Terminal (Germany)
5 arrivals tracks in the holding area
1 operative module
8 operative tracks (680 m) electrified up to the cranes
1 external track dedicated to specific traffic
2 trucks lanes (1 operative for 27 trucks + 1 for crossing through)
2 short term storage lanes (680 m, 2 levels, 424 TEU)
2 long term storage areas (1 with 9 lanes for dangerous goods)
3 RMG cranes with intermodal spreader (2 over 6 tracks + 1 over 8 tracks)
1 trucks check-in area with 2 gates + 18 parking places
24 h 6/7 days operational time
9 trains/day
252 units/day
280 trucks/day
18
Case studies: Hallsberg
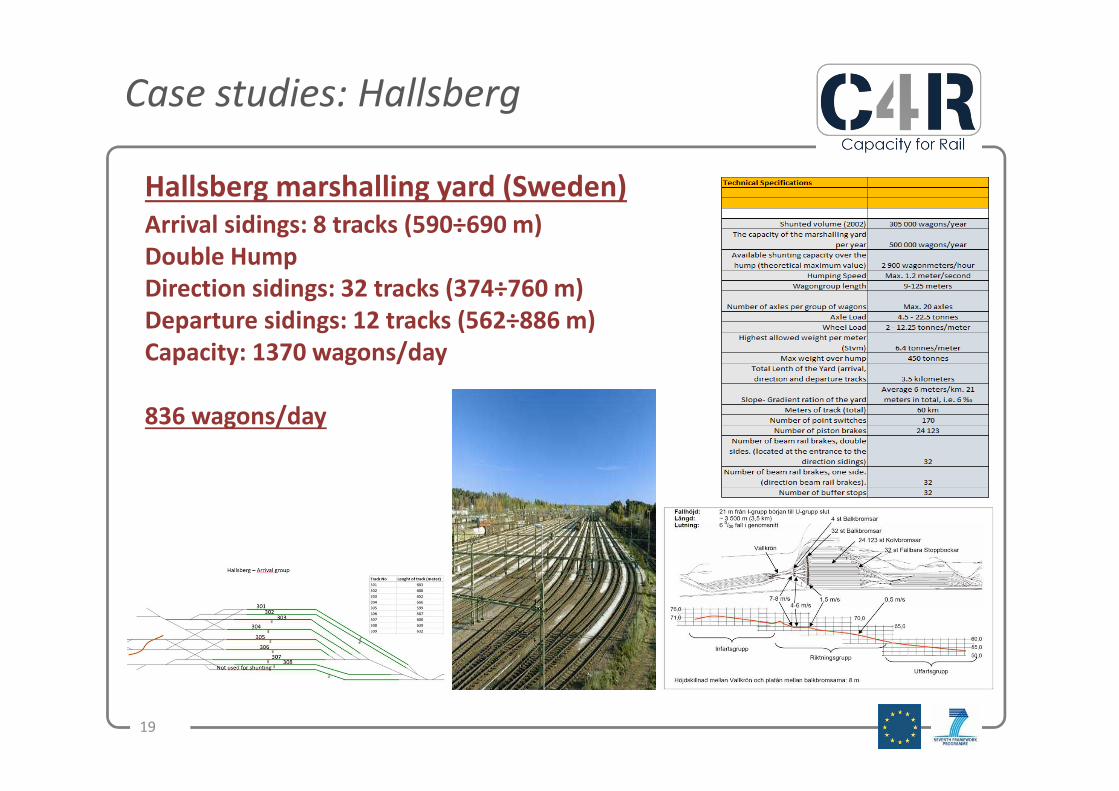
Hallsberg marshalling yard (Sweden)
Arrival sidings: 8 tracks (590÷690 m)
Double Hump
Direction sidings: 32 tracks (374÷760 m)
Departure sidings: 12 tracks (562÷886 m)
Capacity: 1370 wagons/day
836 wagons/day
19

Case studies: Valencia Principe Felipe
Valencia Principe Felipe port rail terminal (Spain)
Total area: 50,000 m2
4 loading/unloading tracks
Extra track to shunt locomotives
Electrified tracks until approaching loading/unloading area
Two road access
Two storage areas (9,000 + 20,000 m2)
20

Innovations: Rail-Road
Examples for inland interchanges
21
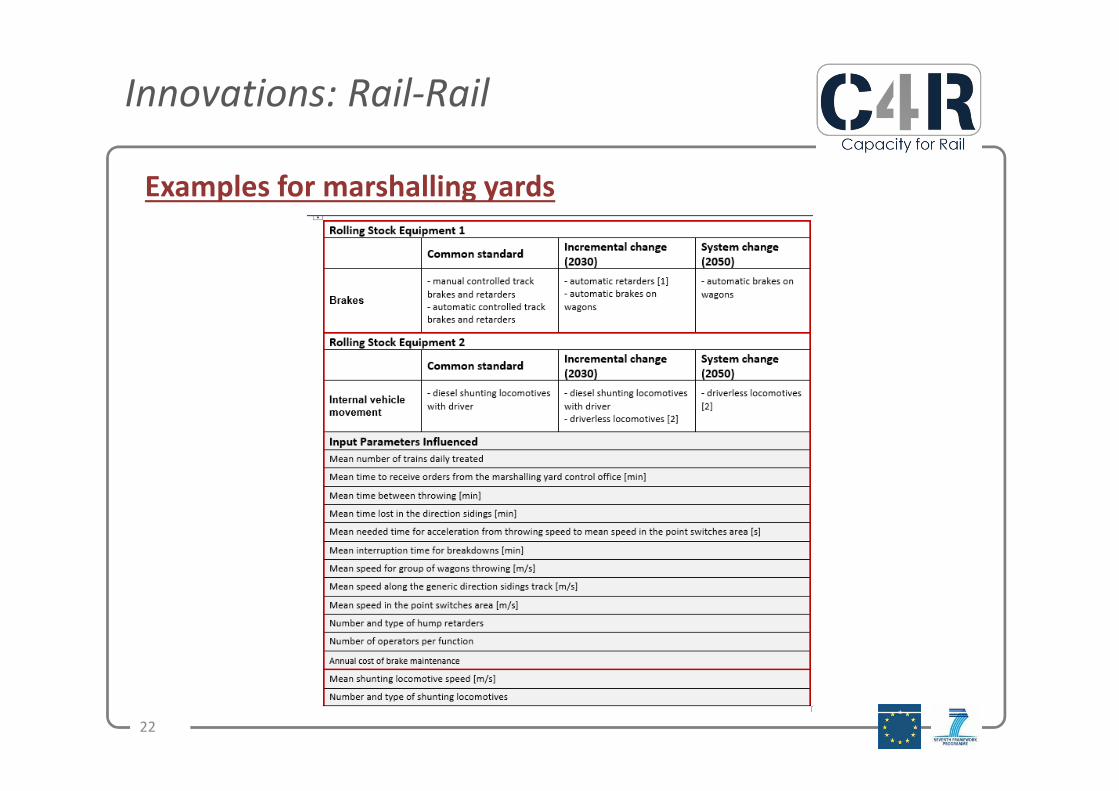
Innovations: Rail-Rail
Examples for marshalling yards
22
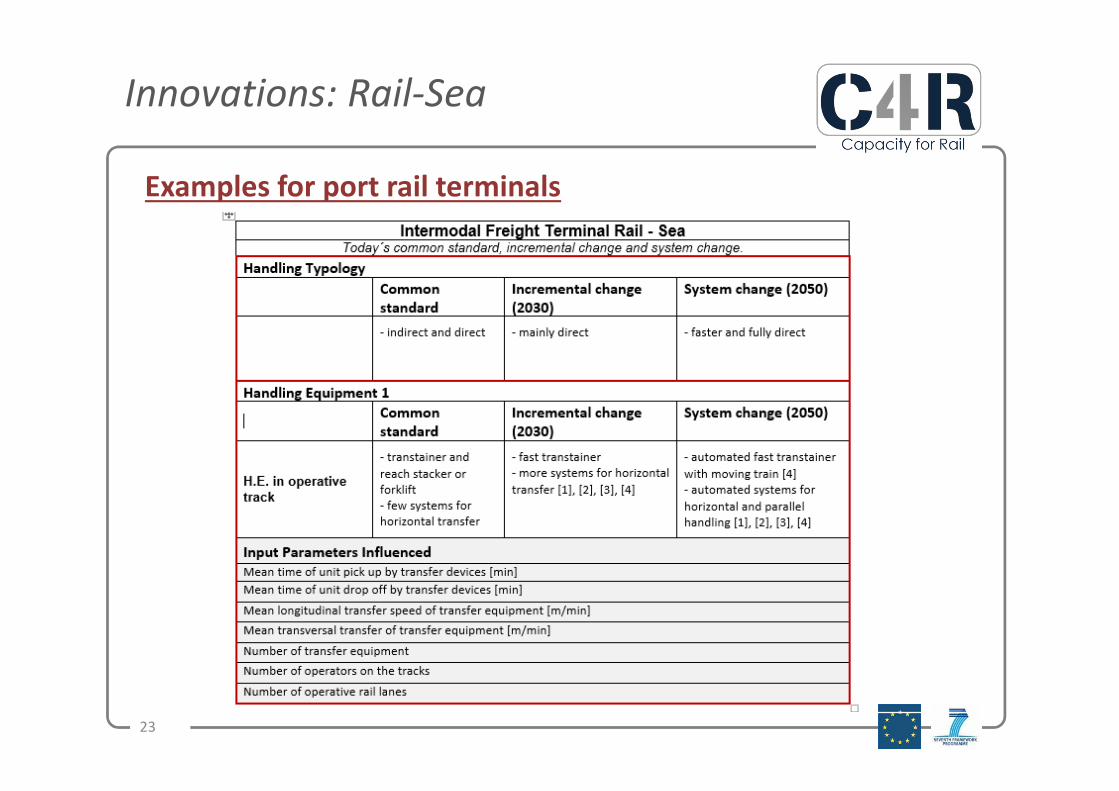
Innovations: Rail-Sea
Examples for port rail terminals
23
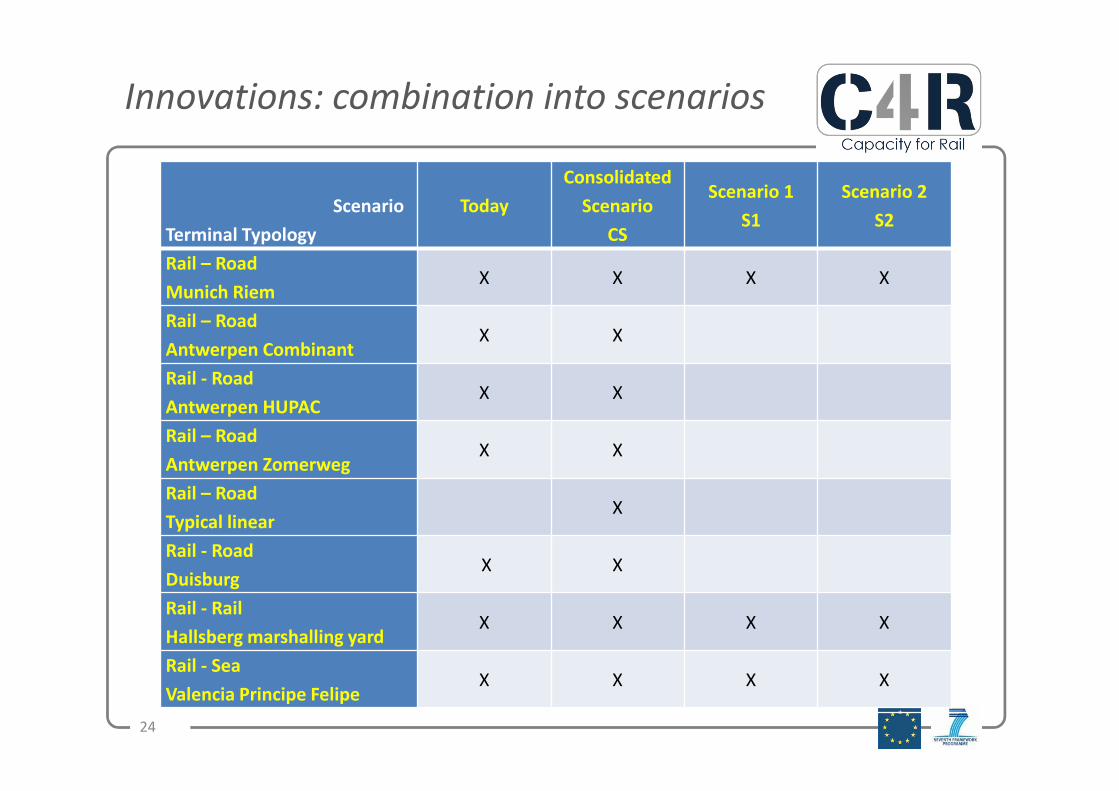
Innovations: combination into scenarios
24
Scenario
Terminal Typology
Today
Consolidated
Scenario
CS
Scenario 1
S1
Scenario 2
S2
Rail – Road
Munich RiemX X X X
Rail – Road
Antwerpen CombinantX X
Rail - Road
Antwerpen HUPACX X
Rail – Road
Antwerpen ZomerwegX X
Rail – Road
Typical linear X
Rail - Road
DuisburgX X
Rail - Rail
Hallsberg marshalling yardX X X X
Rail - Sea
Valencia Principe FelipeX X X X

Innovations: CS for Riem
25
- Mean number of containers: 65 (10.36 m per ITU)
- Long Train: 670 m
- H24 working time
- Direct access of train in operative area
- Automatic coupling/uncoupling loco
- Multi lift spreader handling
- ITU and vehicles automatic control and data
exchange

Innovations: CS for Hallsberg
26
- Tracks operative length till 1500 m
- MMM (Multi Modal Marshalling) Yard:
classification tracks accessible not only via hump
- Automatic wagon identification
- Automatic coupling and uncoupling
- Automatic brakes on wagons
- Self-propelled wagons
- Duo propulsion and driverless locomotives
- Working time 24 hours
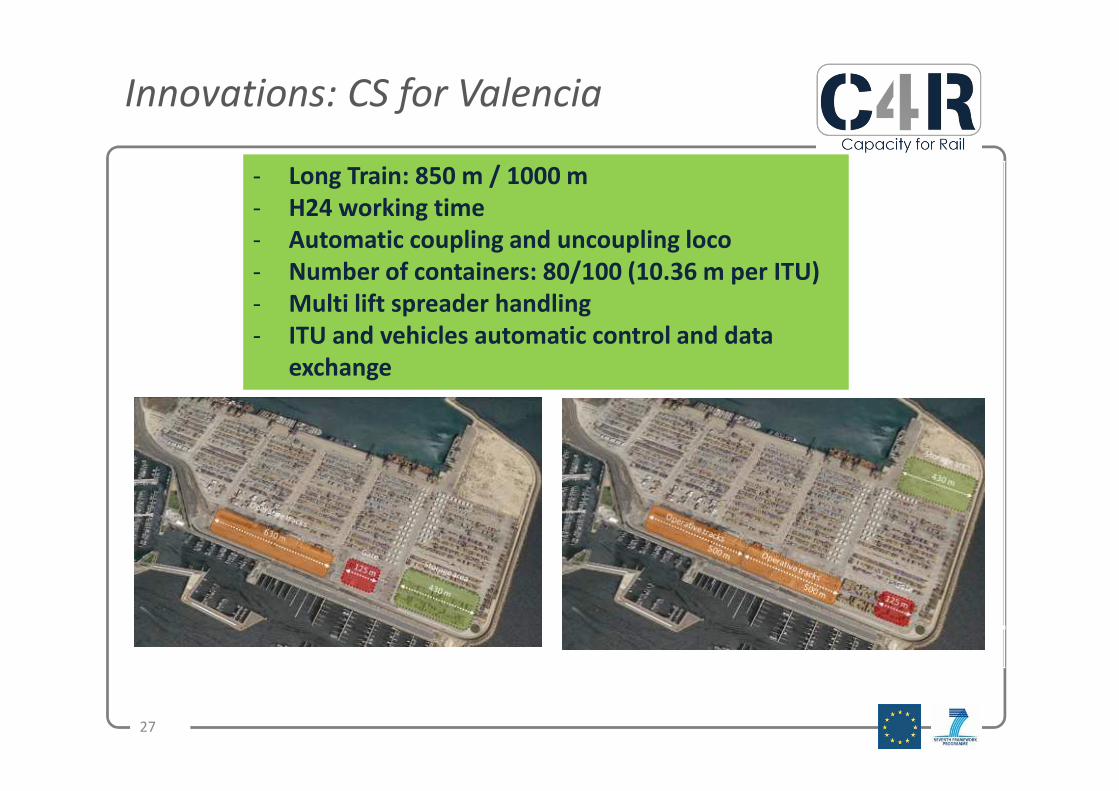
Innovations: CS for Valencia
27
- Long Train: 850 m / 1000 m
- H24 working time
- Automatic coupling and uncoupling loco
- Number of containers: 80/100 (10.36 m per ITU)
- Multi lift spreader handling
- ITU and vehicles automatic control and data
exchange

Effects of innovations: evaluation
Requirement: capability to reproduce terminals’ operation
Analytical methods based on combined algorithms (e.g. queuing theory)
Simulation models based on event-based processes reproduction
Calibration on typical terminals
Subset of data describing the typical operation
Cross analysis of typical/calculated /simulated KPI
Tests for validation on case studies
More extended set of data describing the present operation
Cross analysis of real world/calculated /simulated KPI
Extended application to selected scenarios for case studies
28

Effects of innovations: analytical methods
Generalised approach
Customisation to case studies
KPI calculation
Examples of calculation flows
29

Effects of innovations: simulation models
Original development by Planimate® freeware
Customisation by terminal typology
KPI calculation
Examples of hierarchical layers
30

Effects of innovations: Riem
ITUs total transit time Vehicles total transit time
Equipment performance Vehicles utilisation rate
31
0
2
4
6
8
10
TRUCK_TRAIN TRAIN_TRUCK
TT
R [
h]
Pilot Consolidated Scenario 1 Scenario 2
0
1
2
3
4
5
6
TRAIN TRUCK
TT
R [
h]
Pilot Consolidated Scenario 1 Scenario 2
0
10
20
30
40
50
60
70
80
Ep
[IT
Us/
h]
Pilot Consolidated Scenario 1 Scenario 2
0
0,2
0,4
0,6
0,8
TRAIN TRUCK
Sy
sUR
Pilot Consolidated Scenario 1 Scenario 2
Relevant reduction in truck-train
direction (14% in CS)General reduction for train
Relevant increase (25% in CS) Important decrease in CS
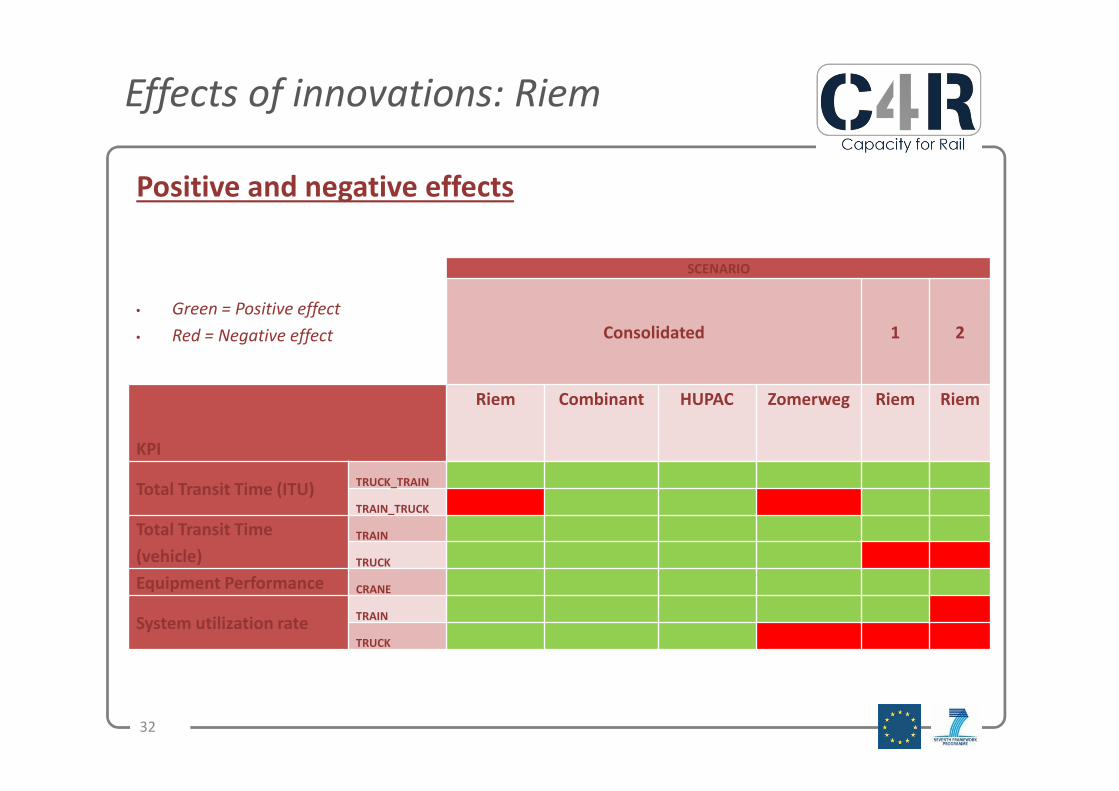
Effects of innovations: Riem
32
• Green = Positive effect
• Red = Negative effect
SCENARIO
Consolidated 1 2
KPI
Riem Combinant HUPAC Zomerweg Riem Riem
Total Transit Time (ITU)TRUCK_TRAIN
TRAIN_TRUCK
Total Transit Time
(vehicle)
TRAIN
TRUCK
Equipment Performance CRANE
System utilization rateTRAIN
TRUCK
Positive and negative effects

Effects of innovation: Hallsberg
Average wagon transit time Tracks utilization rate
Maximum flow through the yard Average number of wagons in the yard
33
Relevant reduction in CS (about 60%) Relevant increase (48% in CS with long trains)
Relevant increase (75% in CS with
long trains)
Relevant reduction (50% in CS)
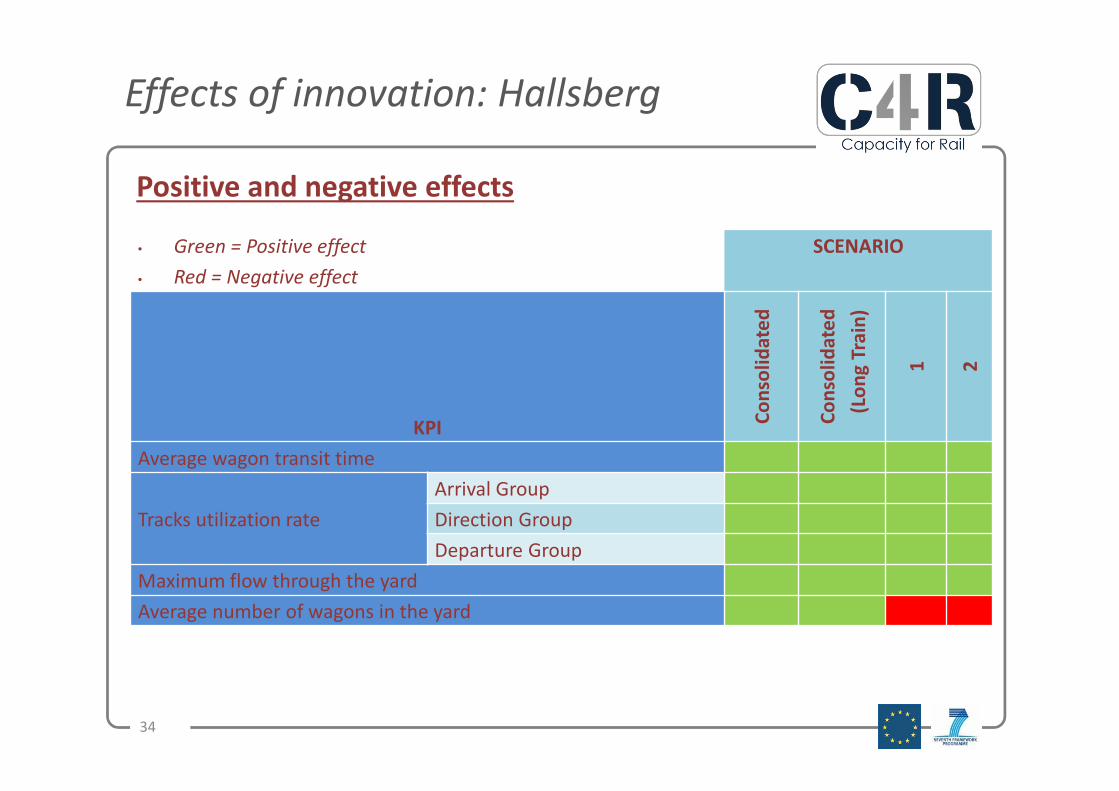
Effects of innovation: Hallsberg
Positive and negative effects
34
• Green = Positive effect
• Red = Negative effect
SCENARIO
KPI
Co
nso
lid
ate
d
Co
nso
lid
ate
d
(Lo
ng
Tra
in)
1 2
Average wagon transit time
Tracks utilization rate
Arrival Group
Direction Group
Departure Group
Maximum flow through the yard
Average number of wagons in the yard
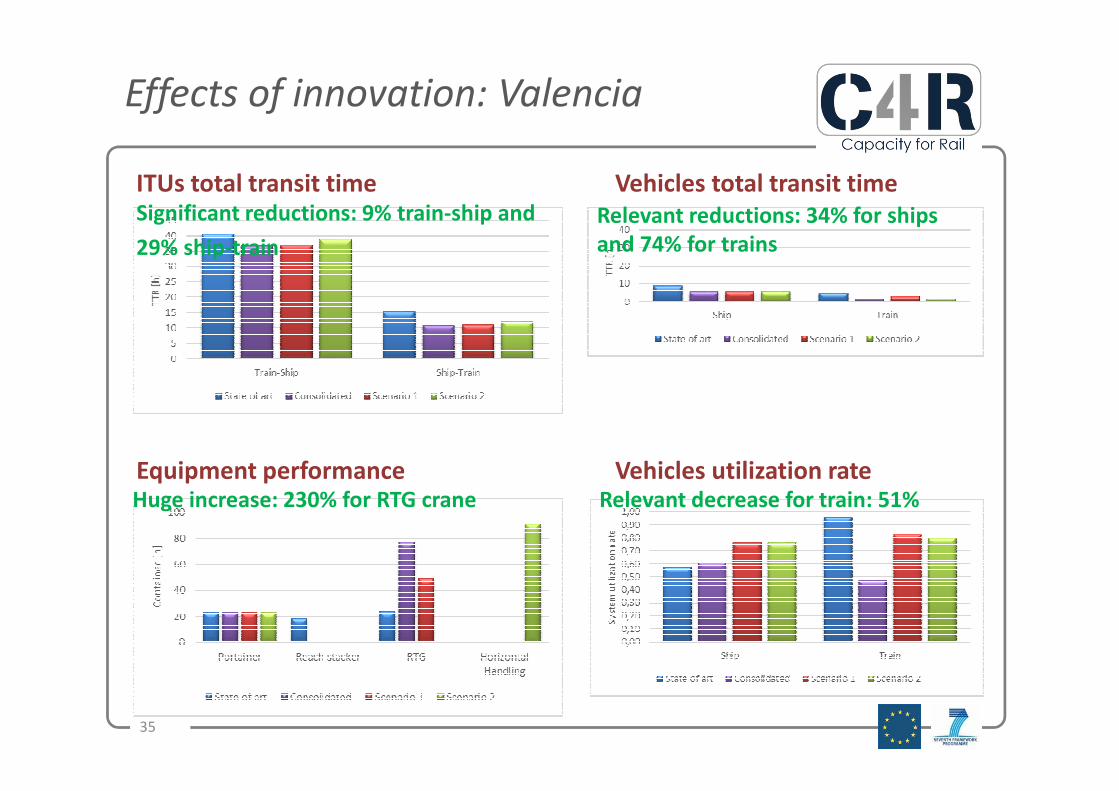
Effects of innovation: Valencia
ITUs total transit time Vehicles total transit time
Equipment performance Vehicles utilization rate
35
Significant reductions: 9% train-ship and
29% ship-train
Relevant reductions: 34% for ships
and 74% for trains
Huge increase: 230% for RTG crane Relevant decrease for train: 51%
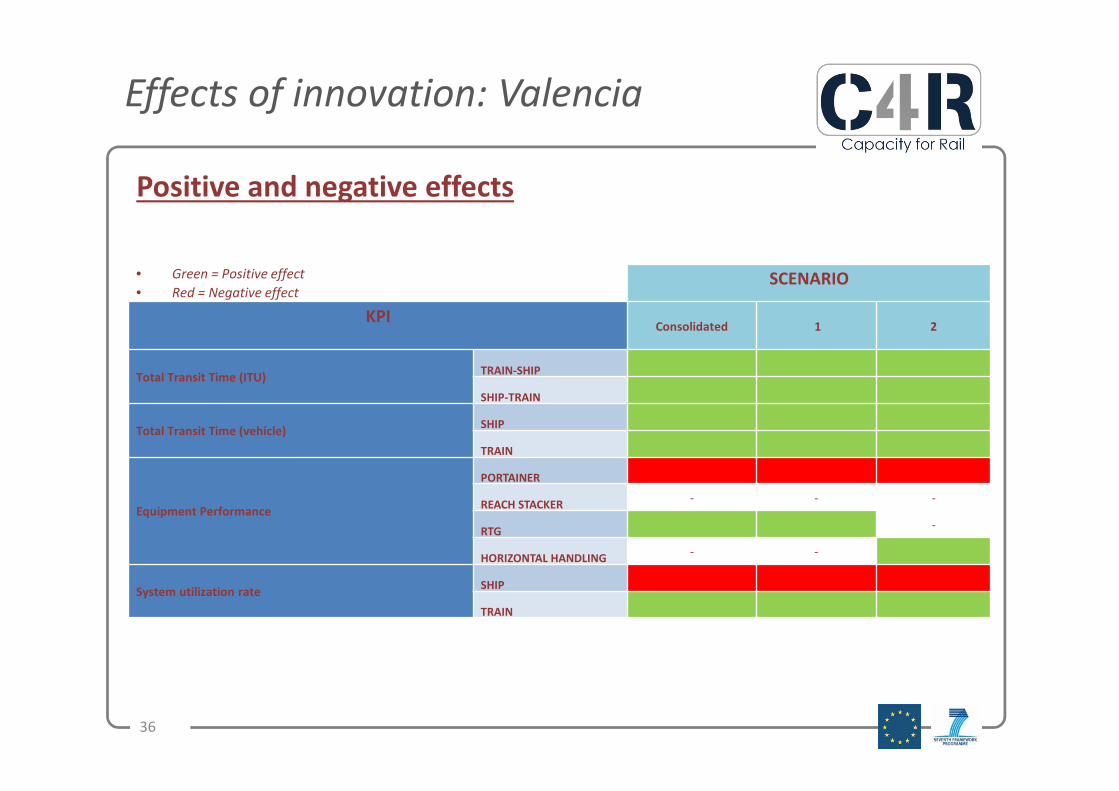
Effects of innovation: Valencia
Positive and negative effects
36
• Green = Positive effect
• Red = Negative effectSCENARIO
KPIConsolidated 1 2
Total Transit Time (ITU)TRAIN-SHIP
SHIP-TRAIN
Total Transit Time (vehicle)SHIP
TRAIN
Equipment Performance
PORTAINER
REACH STACKER- - -
RTG-
HORIZONTAL HANDLING- -
System utilization rateSHIP
TRAIN
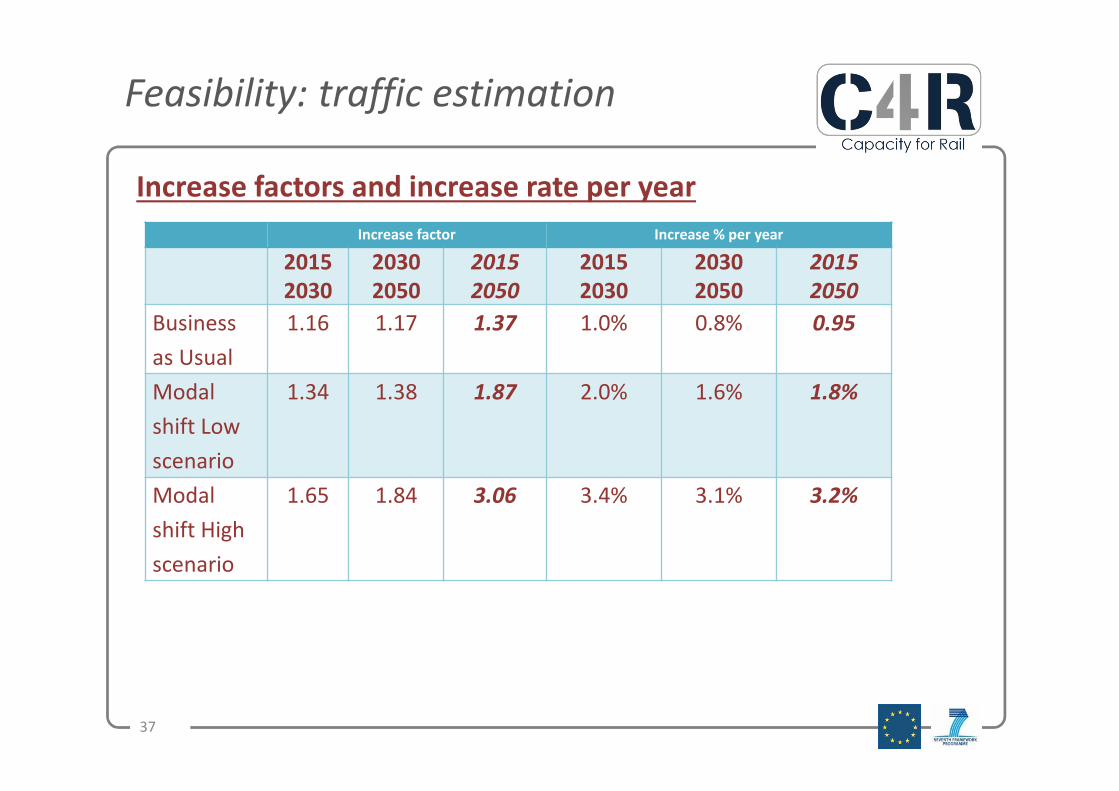
Feasibility: traffic estimation
Increase factors and increase rate per year
37
Increase factor Increase % per year
2015
2030
2030
2050
2015
2050
2015
2030
2030
2050
2015
2050
Business
as Usual
1.16 1.17 1.37 1.0% 0.8% 0.95
Modal
shift Low
scenario
1.34 1.38 1.87 2.0% 1.6% 1.8%
Modal
shift High
scenario
1.65 1.84 3.06 3.4% 3.1% 3.2%
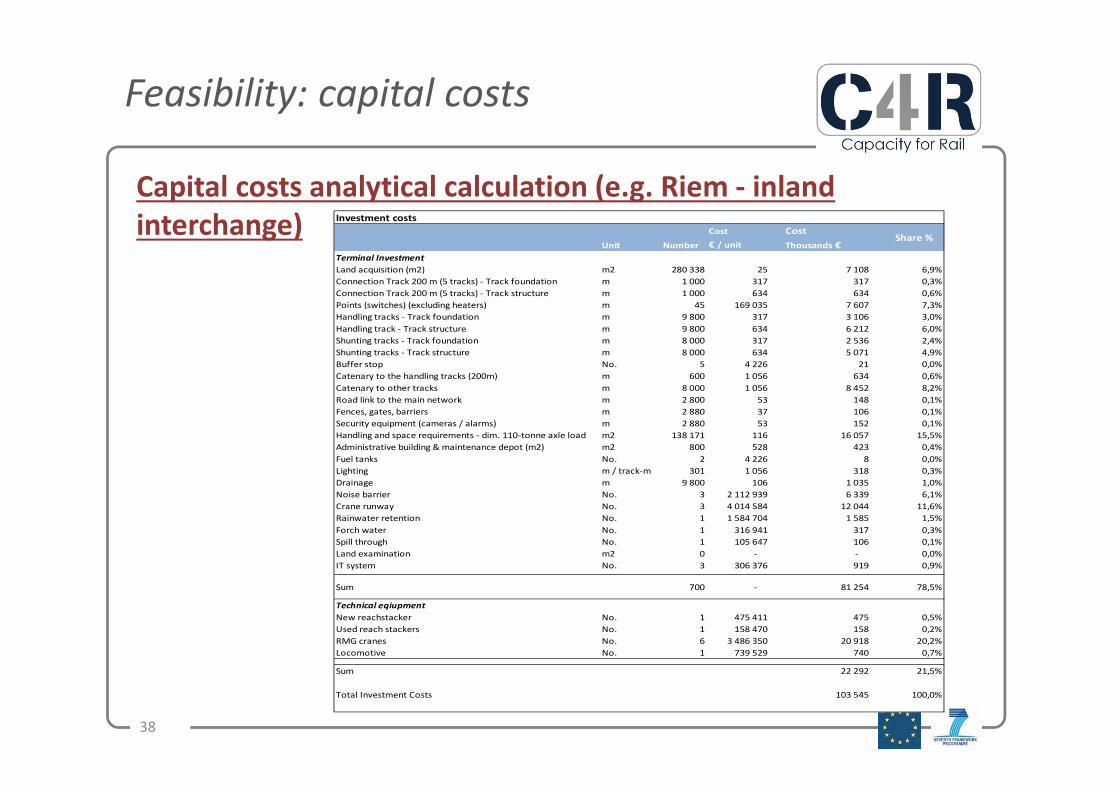
Feasibility: capital costs
Capital costs analytical calculation (e.g. Riem - inland
interchange)
38
Investment costs
Cost Cost
Unit Number € / unit Thousands €Terminal Investment
Land acquisition (m2) m2 280 338 25 7 108 6,9%
Connection Track 200 m (5 tracks) - Track foundation m 1 000 317 317 0,3%
Connection Track 200 m (5 tracks) - Track structure m 1 000 634 634 0,6%
Points (switches) (excluding heaters) m 45 169 035 7 607 7,3%
Handling tracks - Track foundation m 9 800 317 3 106 3,0%
Handling track - Track structure m 9 800 634 6 212 6,0%
Shunting tracks - Track foundation m 8 000 317 2 536 2,4%
Shunting tracks - Track structure m 8 000 634 5 071 4,9%
Buffer stop No. 5 4 226 21 0,0%
Catenary to the handling tracks (200m) m 600 1 056 634 0,6%
Catenary to other tracks m 8 000 1 056 8 452 8,2%
Road link to the main network m 2 800 53 148 0,1%
Fences, gates, barriers m 2 880 37 106 0,1%
Security equipment (cameras / alarms) m 2 880 53 152 0,1%
Handling and space requirements - dim. 110-tonne axle load m2 138 171 116 16 057 15,5%
Administrative building & maintenance depot (m2) m2 800 528 423 0,4%
Fuel tanks No. 2 4 226 8 0,0%
Lighting m / track-m 301 1 056 318 0,3%
Drainage m 9 800 106 1 035 1,0%
Noise barrier No. 3 2 112 939 6 339 6,1%
Crane runway No. 3 4 014 584 12 044 11,6%
Rainwater retention No. 1 1 584 704 1 585 1,5%
Forch water No. 1 316 941 317 0,3%
Spill through No. 1 105 647 106 0,1%
Land examination m2 0 - - 0,0%
IT system No. 3 306 376 919 0,9%
Sum 700 - 81 254 78,5%
Technical eqiupment
New reachstacker No. 1 475 411 475 0,5%
Used reach stackers No. 1 158 470 158 0,2%
RMG cranes No. 6 3 486 350 20 918 20,2%
Locomotive No. 1 739 529 740 0,7%
Sum 22 292 21,5%
Total Investment Costs 103 545 100,0%
Share %

Feasibility: operational costs
Operational costs analytical calculation (e.g. Riem - inland
interchange)
39
DUSS Munich-Reim terminal Share Cost €
Annual terminal operational cost components/items % Thousands Source
Annual transhipment equipment running/hire (excluding procurement) cost 5,8% 487 DB
Annual transhipment equipment maintenance cost including procurement 12,6% 1 053 DB
of spare parts but excluding major procurement /investment
Annual Personnel cost (split into salaries + social/health/pension insurance) 43,1% 3 585 DB
Annual insurance cost (equipment + operation) 1,7% 142 DB
Annual energy cost 4,1% 338 DB
Annual Terminal hire/rent/mortgage/bank interest cost 3,9% 323 DB
Annual infrastructure maintenance cost 9,8% 813 DB
Other terminal costs (fuel tanks, truck depots security and others) 9,6% 802 DB
Rent 4,2% 350 DB
Annual cost for shunting engine 5,2% 433 KTH model
Cost in thousand Euros - Total (Average for the period 2011-2014, Excluding VAT) 100% 8 326

Feasibility: total costs
Total costs calculation (e.g. Riem - inland interchange)
40
Total costs
Cost Cost
€/year €/TEU
Capacity for calculation TEU/year 300 000
Operational cost
Cost for shunting engine 433 153 1,4
Other operating costs 7 949 000 26,5
Sum 8 382 153 27,9
Capital cost
Annuity technical equipment 1 395 268 4,7
Annuity basic terminal investment 5 033 966 16,8
Sum 6 429 234 21,4
Total cost 14 811 386 49,4
Total cost excluding basic terminal investment 9 777 420 32,6
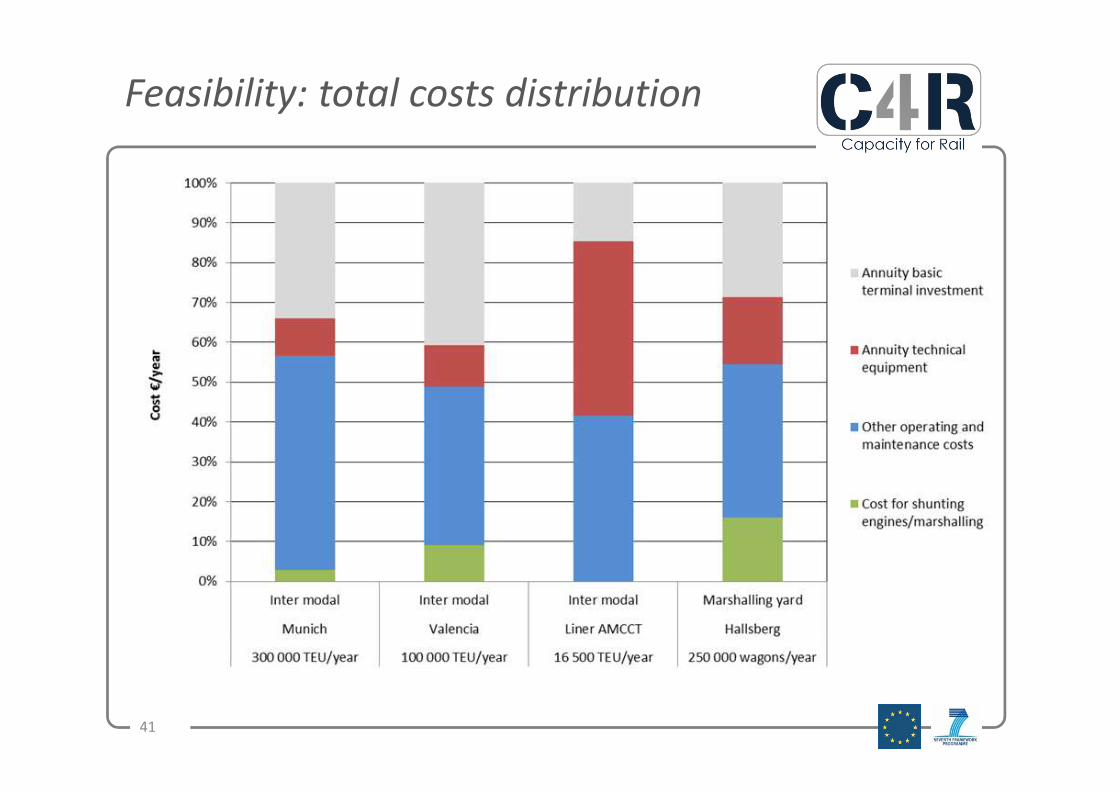
Feasibility: total costs distribution
41
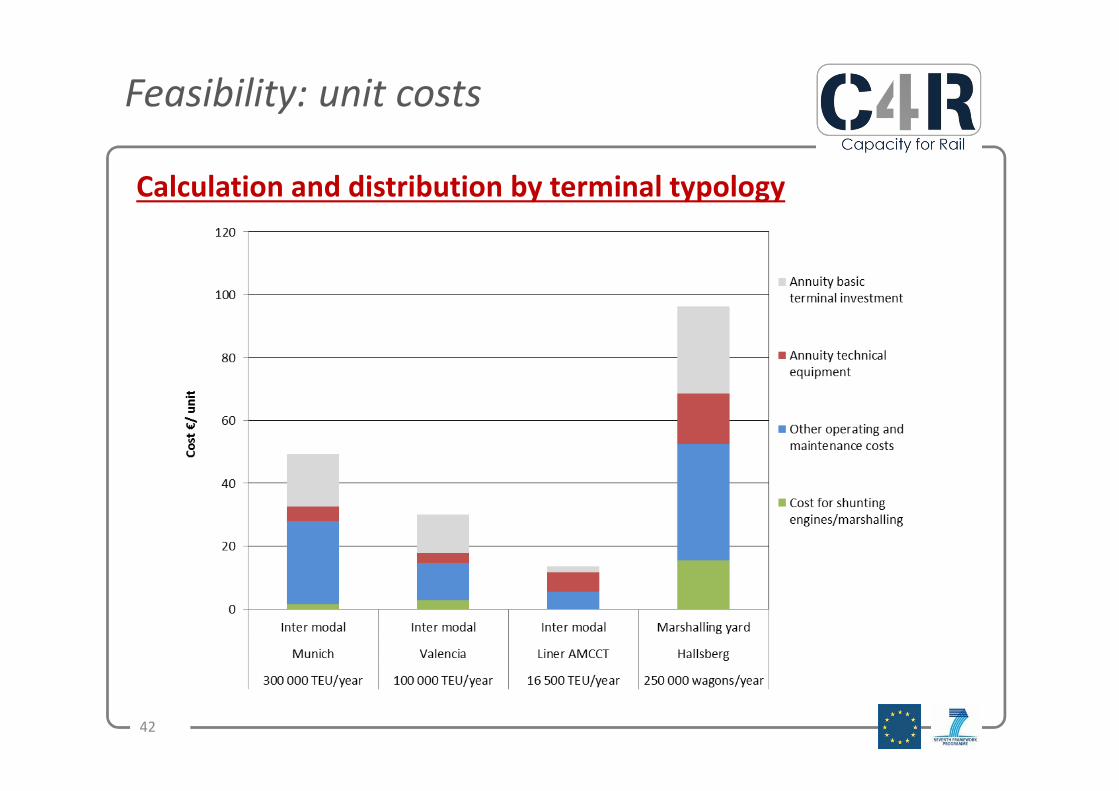
Feasibility: unit costs
Calculation and distribution by terminal typology
42
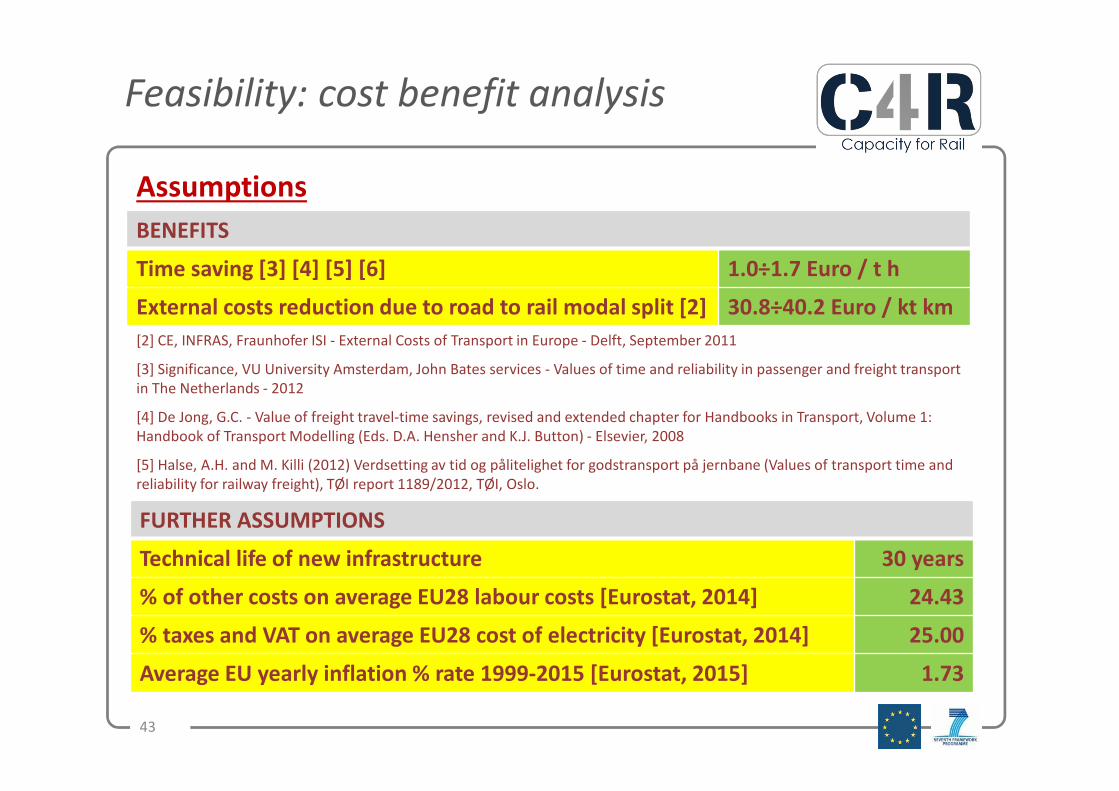
Feasibility: cost benefit analysis
Assumptions
43
BENEFITS
Time saving [3] [4] [5] [6] 1.0÷1.7 Euro / t h
External costs reduction due to road to rail modal split [2] 30.8÷40.2 Euro / kt km
[2] CE, INFRAS, Fraunhofer ISI - External Costs of Transport in Europe - Delft, September 2011
[3] Significance, VU University Amsterdam, John Bates services - Values of time and reliability in passenger and freight transport
in The Netherlands - 2012
[4] De Jong, G.C. - Value of freight travel-time savings, revised and extended chapter for Handbooks in Transport, Volume 1:
Handbook of Transport Modelling (Eds. D.A. Hensher and K.J. Button) - Elsevier, 2008
[5] Halse, A.H. and M. Killi (2012) Verdsetting av tid og pålitelighet for godstransport på jernbane (Values of transport time and
reliability for railway freight), TØI report 1189/2012, TØI, Oslo.
[6] Feo Valero M., Garcia-Menendez L., Garrido-Hidalgo R. - Valuing freight transport time using transport demand modelling: a
bibliographical review - Transport Reviews, 2011, 201, 1-27.FURTHER ASSUMPTIONS
Technical life of new infrastructure 30 years
% of other costs on average EU28 labour costs [Eurostat, 2014] 24.43
% taxes and VAT on average EU28 cost of electricity [Eurostat, 2014] 25.00
Average EU yearly inflation % rate 1999-2015 [Eurostat, 2015] 1.73
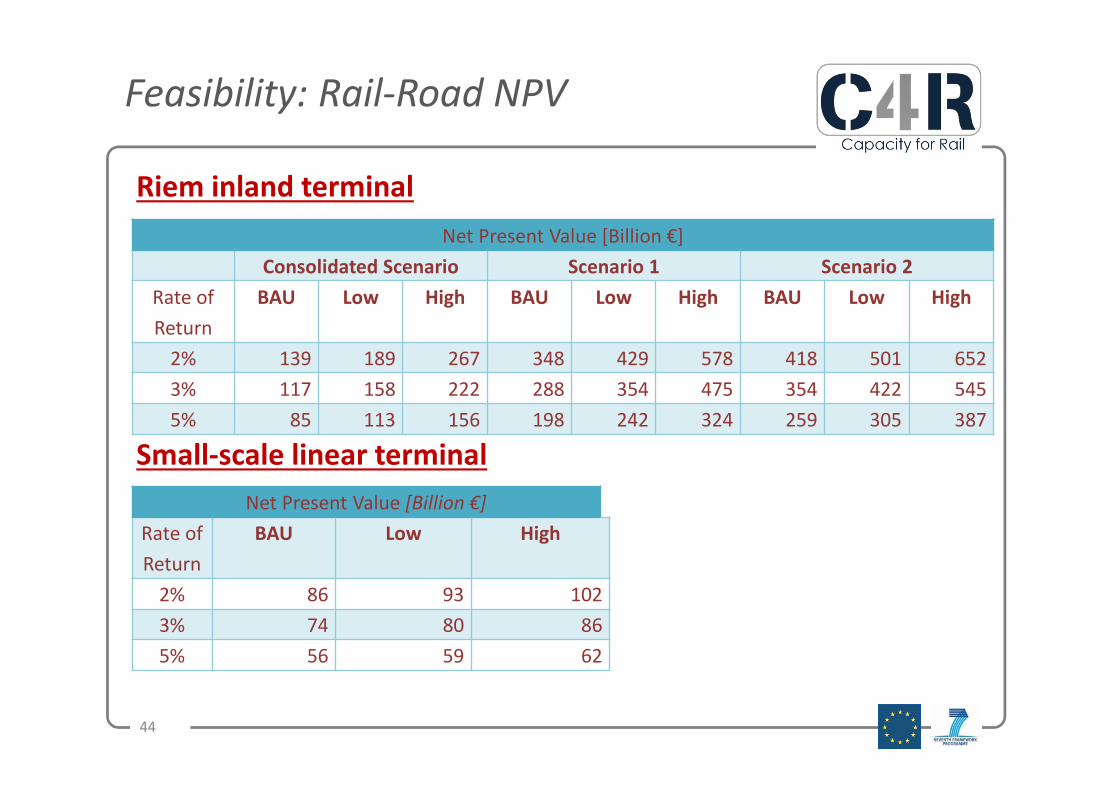
Feasibility: Rail-Road NPV
Riem inland terminal
Small-scale linear terminal
44
Net Present Value [Billion €]
Consolidated Scenario Scenario 1 Scenario 2
Rate of
Return
BAU Low High BAU Low High BAU Low High
2% 139 189 267 348 429 578 418 501 652
3% 117 158 222 288 354 475 354 422 545
5% 85 113 156 198 242 324 259 305 387
Net Present Value [Billion €]
Rate of
Return
BAU Low High
2% 86 93 102
3% 74 80 86
5% 56 59 62
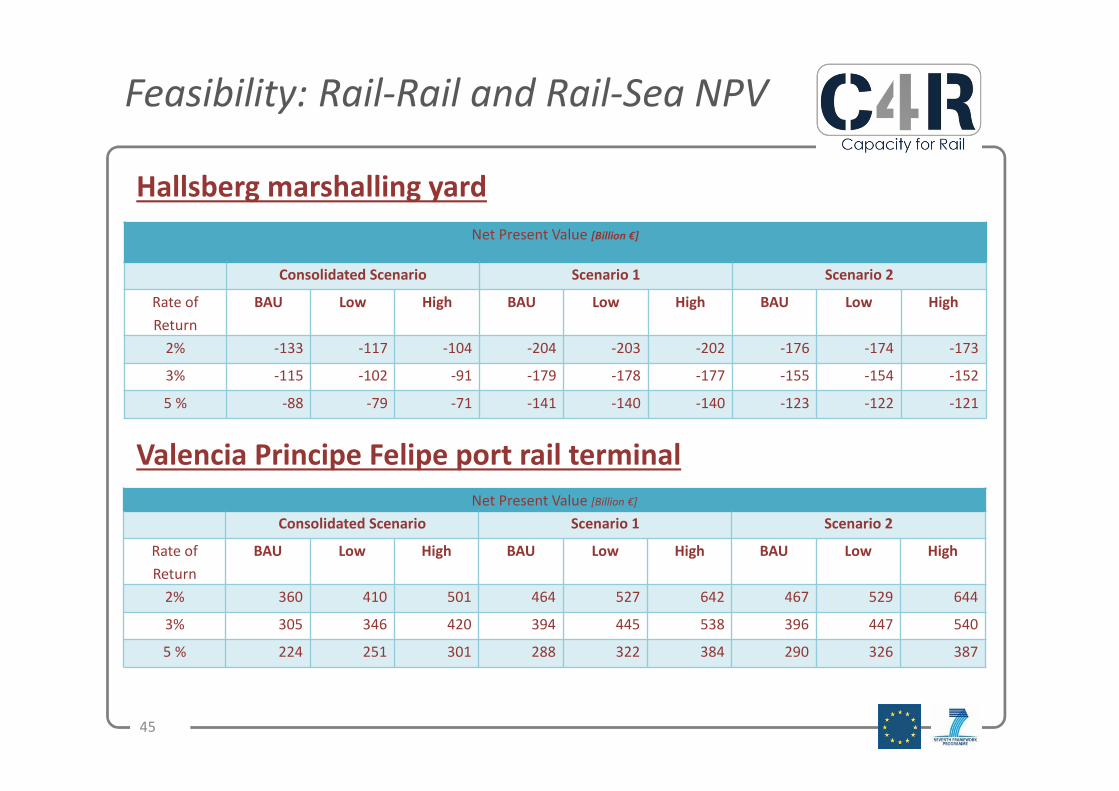
Feasibility: Rail-Rail and Rail-Sea NPV
Hallsberg marshalling yard
Valencia Principe Felipe port rail terminal
45
Net Present Value [Billion €]
Consolidated Scenario Scenario 1 Scenario 2
Rate of
Return
BAU Low High BAU Low High BAU Low High
2% -133 -117 -104 -204 -203 -202 -176 -174 -173
3% -115 -102 -91 -179 -178 -177 -155 -154 -152
5 % -88 -79 -71 -141 -140 -140 -123 -122 -121
Net Present Value [Billion €]
Consolidated Scenario Scenario 1 Scenario 2
Rate of
Return
BAU Low High BAU Low High BAU Low High
2% 360 410 501 464 527 642 467 529 644
3% 305 346 420 394 445 538 396 447 540
5 % 224 251 301 288 322 384 290 326 387
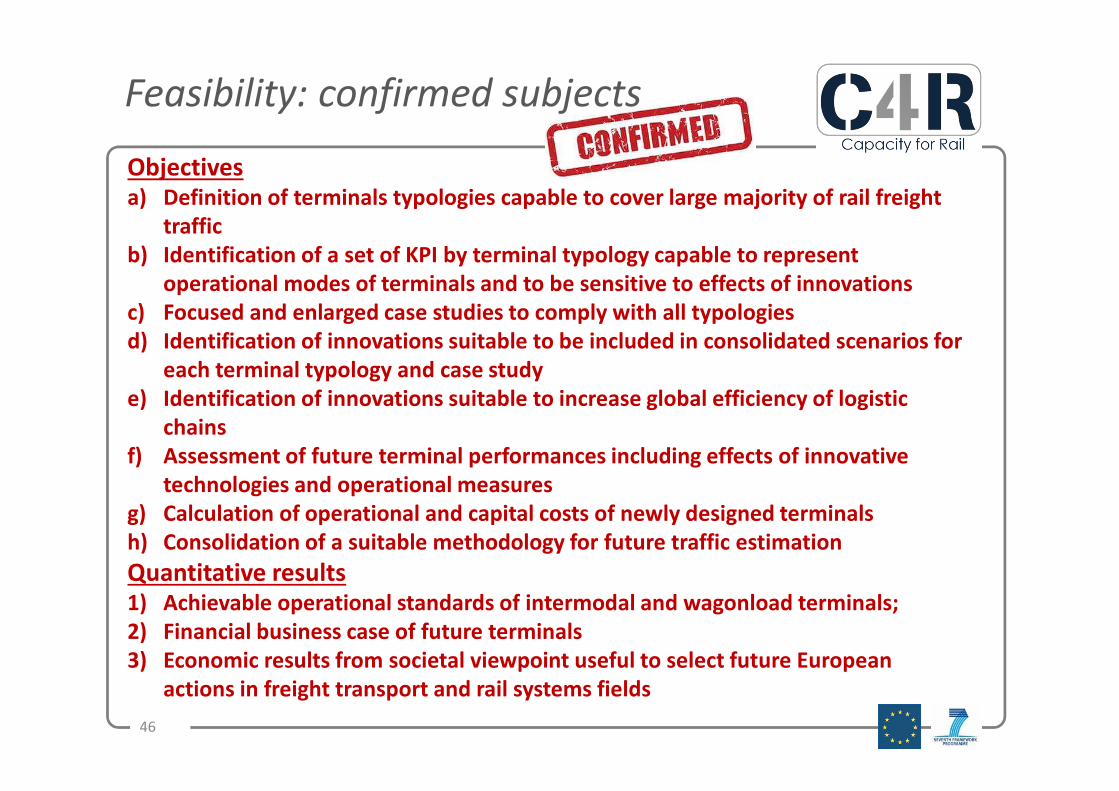
Feasibility: confirmed subjects
Objectivesa) Definition of terminals typologies capable to cover large majority of rail freight
traffic
b) Identification of a set of KPI by terminal typology capable to represent
operational modes of terminals and to be sensitive to effects of innovations
c) Focused and enlarged case studies to comply with all typologies
d) Identification of innovations suitable to be included in consolidated scenarios for
each terminal typology and case study
e) Identification of innovations suitable to increase global efficiency of logistic
chains
f) Assessment of future terminal performances including effects of innovative
technologies and operational measures
g) Calculation of operational and capital costs of newly designed terminals
h) Consolidation of a suitable methodology for future traffic estimation
Quantitative results1) Achievable operational standards of intermodal and wagonload terminals;
2) Financial business case of future terminals
3) Economic results from societal viewpoint useful to select future European
actions in freight transport and rail systems fields
46

Discussion: feedback from 10/09/15
Suggestions from the audience
• Self-propelled wagons to be included in all scenarios for marshalling yards
• Duo-locomotive already used today not to be considered in 2030-2050
scenarios
• Smaller shunting stations to be proposed and simulated
• Digitalization of information to be included in all scenarios to overcome barriers
against transparency in information exchanges
• Vision papers on future framework of logistics (EC projects, logistic operators
associations, etc.) to be considered for scenarios
• Added value of logistic services to be taken into account in business cases
• Future terminals able to manage effectively traffic of parcels and carriers
services
47
Discussion: suggested items for today
Terminals for 2030-2050
• ambitious and visionary, anyway feasible?
Declared scope “modern, automated, intelligent and fully-integrated
system for efficient, reliable freight Operations”
• addressed?
Different approaches
• KPI? Scenarios? Methods and models? Case studies? Integration with
logistic chains? Economic and financial analysis? Others?
Suggestions for next steps
• Compilation of a catalogue of solutions in SP2 (WP2.4) by 09/2017
• Shift2Rail projects: CFM and OC 2016 (ongoing), CFM and OC 2017
(start: 09-10/2017)
48
Thank you!
49
Top Related