


Languages
Pages
Legal

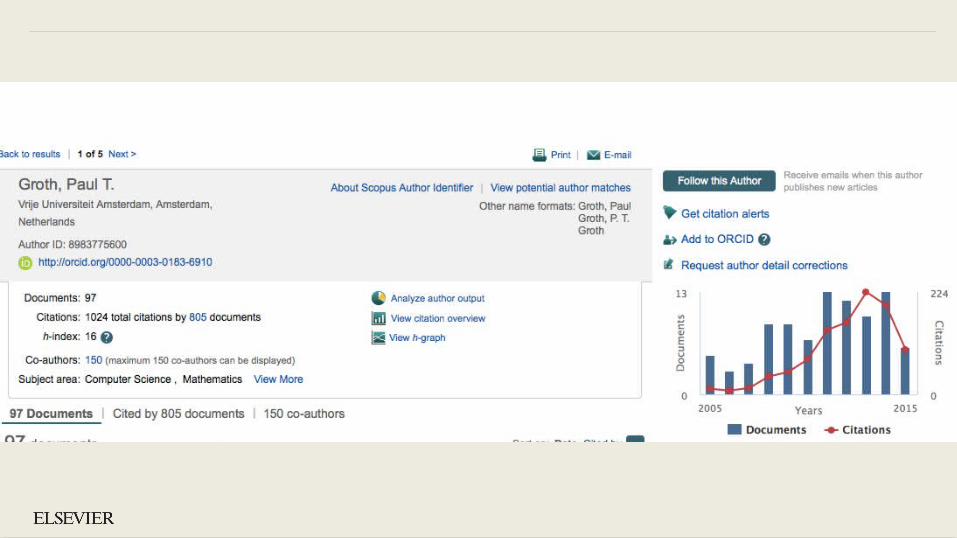
SOURCES OF CHANGE IN MODERN KNOWLEDGE ORGANIZATION SYSTEMSPaul Groth (@pgroth)
Disruptive Technology Director
Elsevier Labs (@elsevierlabs)
February 2, 2016
Contributions: Brad Allen, Michael Lauruhn

KNOWLEDGE ORGANIZATION IS IMPORTANT


https://www.elsevier.com/authors/author-schemas/elsevier-xml-dtds-and-transport-schemas
• 548 page document • defines the content structure of
a document
• “Developing a DTD alone is insufficient to allow an XML-based process; high-quality documentation helps in clarifying the interpretation of the tags and specifying the ways in which they are used”


Education
8
• Elsevier Enterprise Content Model ontology• 40+ properties• 20 datatypes• 10 Content types• 20 Asset types
• Adaptive Learning ontology• Recommendation• Teaching• Assessing• Remediation
• SKOS ontology • 3 third-party vocabularies: QSEN, Bloom etc.
• QTI 2.1 compliant schema• XHTML5 schema
• 50+ data-type attribute definitions
• Student Learning Objective ontology• SKOS ontology extended with 2 properties
• Multi-media assets incl. Text Time based Markup Language

BIG KOS
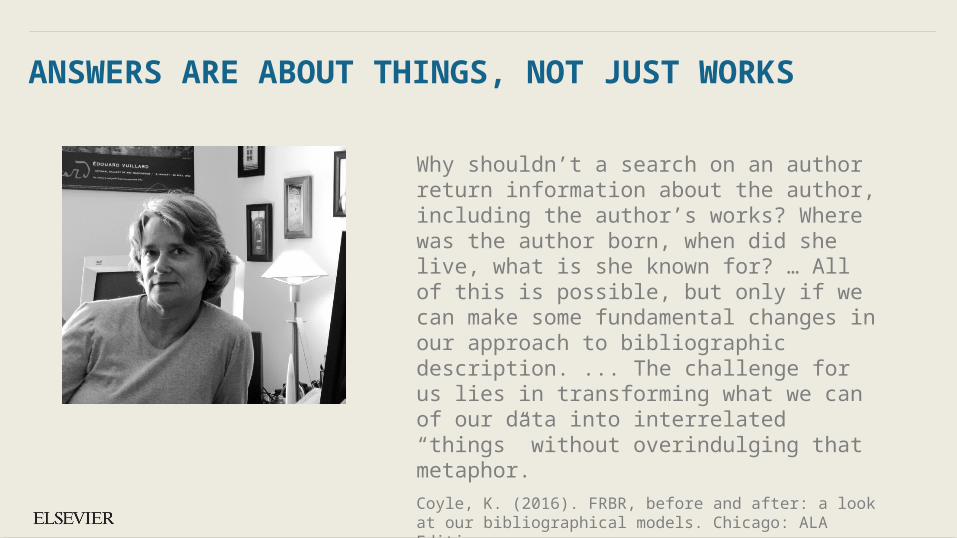
ANSWERS ARE ABOUT THINGS, NOT JUST WORKS
Why shouldn’t a search on an author return information about the author, including the author’s works? Where was the author born, when did she live, what is she known for? … All of this is possible, but only if we can make some fundamental changes in our approach to bibliographic description. ... The challenge for us lies in transforming what we can of our data into interrelated “things” without overindulging that metaphor. Coyle, K. (2016). FRBR, before and after: a look at our bibliographical models. Chicago: ALA Editions.

KNOWLEDGE GRAPHS AND MACHINE READING TURN CONTENT INTO ANSWERS
• Knowledge graphs are "graph structured knowledge bases (KBs) which store factual information in form of relationships between entities” (Nickel, M., Murphy, K., Tresp, V. and Gabrilovich, E. (2015). A review of relational machine learning for knowledge graphs. arXiv:1503.00759v3)
• Knowledge graphs are metadata evolved beyond the focus on the work, linking people, concepts, things and events
• Knowledge graphs organize data extracted from content through machine reading so that queries can provide answers

ELSEVIER: KNOWLEDGE GRAPHS FOR RESEARCH
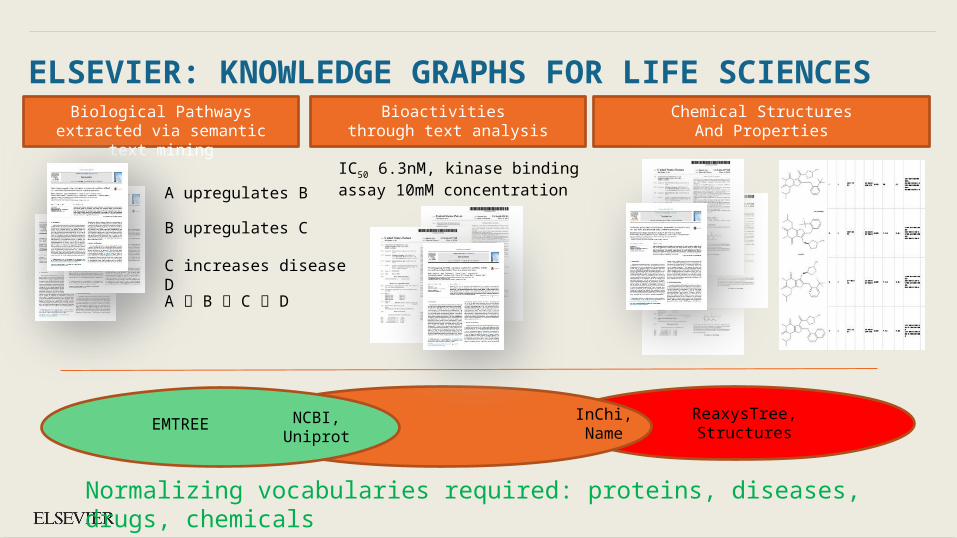
ELSEVIER: KNOWLEDGE GRAPHS FOR LIFE SCIENCESBiological Pathways extracted via
semantic text mining
A upregulates B
B upregulates C
C increases disease D
Normalizing vocabularies required: proteins, diseases, drugs, chemicals
A B C D
Bioactivities through text analysis
IC50 6.3nM, kinase binding assay 10mM concentration
Chemical StructuresAnd Properties
InChi,Name
NCBI,Uniprot
EMTREEReaxysTree,Structures

ELSEVIER’S KNOWLEDGE PLATFORMProducts
Data & Content Sources
KnowledgeGraphs
Platforms & Shared Services
Entity Hubs
Usage logs Pathways EHRsArticles Authors Institutions
SyllabiCitations ChemicalsBooks DrugsFunders
Funder Hub Article HubProfile Hub Journal Hub Institution Hub
Research HealthcareLife Sciences
Content Life Sciences Search IdentityResearch
Reaxys CK SherpathScopus SD ROS

THE BATTLE FOR THE KNOWLEDGE GRAPH
I really believe that the key battleground in any industry is that of its knowledge graph. Google has it for media/advertising, Netflix has it for filmed entertainment, Uber has it for inner city transportation, Facebook has it across social media as well as messaging and the multiples speak for themselves. Tony Askew, Founder/Partner at REV (personal communication, September 29, 2016)

CHANGE

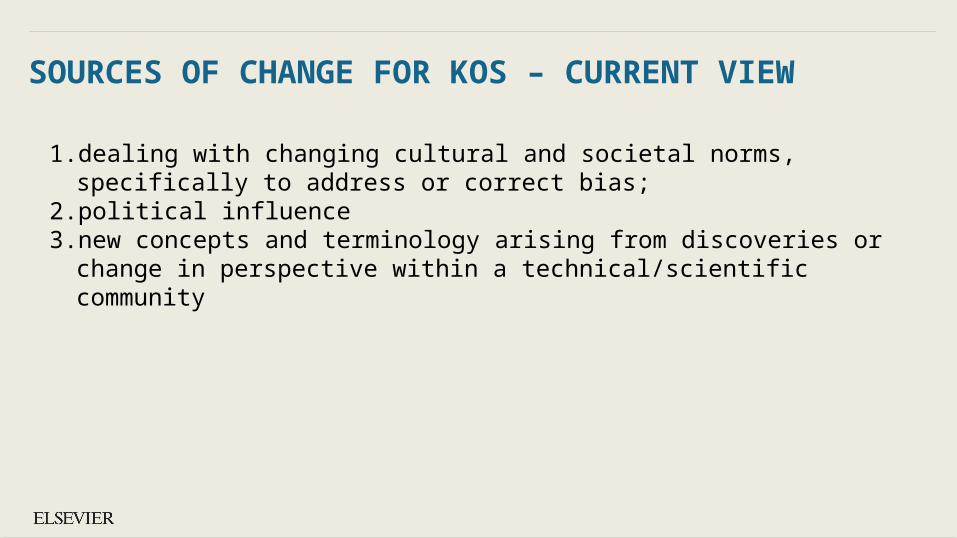
SOURCES OF CHANGE FOR KOS – CURRENT VIEW
1. dealing with changing cultural and societal norms, specifically to address or correct bias;
2. political influence3. new concepts and terminology arising from discoveries or change in
perspective within a technical/scientific community

4. GARDENING
Wikipedia Categories25% increase in the number of categories over the 2012 - 2014 period vs a 12% increase in the number of articles. Likewise, the number of disambiguation pages has increased by 13%. (Bairi et al. 2015)
http://blog.schema.org/2015/11/schemaorg-whats-new.html

5. INCREMENTAL CONTRIBUTORSHIP
Over 17,000 active users on wikidata as of Feb 2017
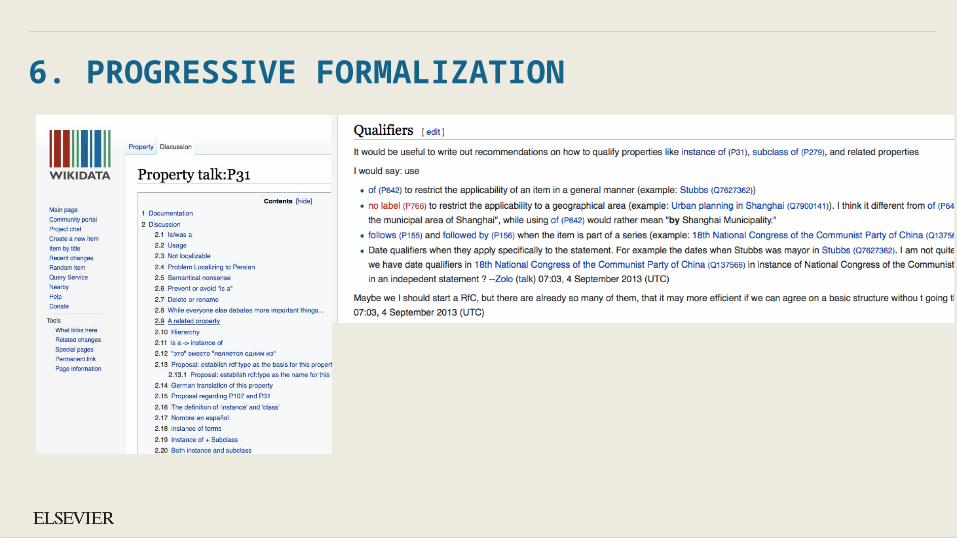
6. PROGRESSIVE FORMALIZATION
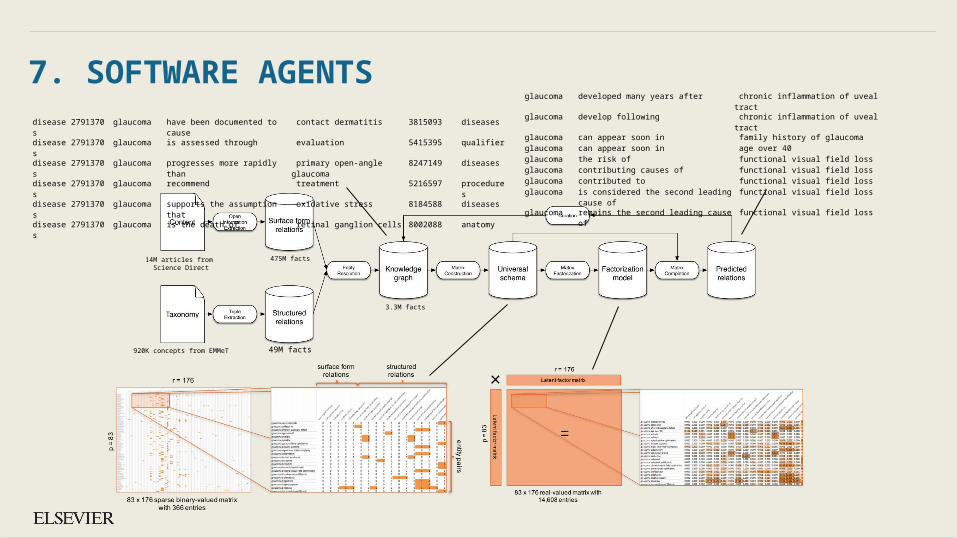
7. SOFTWARE AGENTS
14M articles from Science Direct
3.3M facts
475M facts
49M facts920K concepts from EMMeT
glaucoma developed many years after chronic inflammation of uveal tractglaucoma develop following chronic inflammation of uveal tract glaucoma can appear soon in family history of glaucomaglaucoma can appear soon in age over 40glaucoma the risk of functional visual field lossglaucoma contributing causes of functional visual field lossglaucoma contributed to functional visual field lossglaucoma is considered the second leading cause of functional visual field lossglaucoma remains the second leading cause of functional visual field loss
diseases 2791370 glaucoma have been documented to cause contact dermatitis 3815093 diseasesdiseases 2791370 glaucoma is assessed through evaluation 5415395 qualifierdiseases 2791370 glaucoma progresses more rapidly than primary open-angle glaucoma 8247149 diseasesdiseases 2791370 glaucoma recommend treatment 5216597 proceduresdiseases 2791370 glaucoma supports the assumption that oxidative stress 8184588 diseasesdiseases 2791370 glaucoma is the death of retinal ganglion cells 8002088 anatomy

8. INTEGRATION OF LARGE NUMBERS OF DATA SOURCES
Groth, Paul, "The Knowledge-Remixing Bottleneck," Intelligent Systems, IEEE , vol.28, no.5, pp.44,48, Sept.-Oct. 2013 doi: 10.1109/MIS.2013.138
• 10 different extractors• E.g mapping-based infobox extractor • Infobox uses a hand-built ontology based on the 350 • Based on acommonly used English language
infoboxes• Integrates with Yago
• Yago relies on Wikipedia + Wordnet• Upper ontology from Wordnet and then a mapping to
Wikipedia categories based frequencies• Wordnet is built by psycholinguists

9. TRAINING DATA

CONCLUSION AND A QUESTION
• KOSs are important and are expanding in size
• A focus on organizing information about entities not just “content”
• The construction and maintenance of massive KOSs new sources of change
• Two new actors: software and non-professionals
• How do we deal with theses sources?• New biases, opaque systems
• The role of a KOS observatory?• Empirical evidence for what to do
Top Related