![Build Your Own Flat Panel Solar Thermal Collector[1]](https://static.fdocuments.us/doc/165x107/552a6e354a79597b6d8b45e5/build-your-own-flat-panel-solar-thermal-collector1.jpg)
![solar thermal pre-packaged systems€¦ · Launch of the system Collector type Collector sur-face [m2] 1 Absorber coating Collector war-ranty [years] Mounting system Pre-insulated](https://static.fdocuments.us/doc/165x107/60174fad5270e5116f7bd1f7/solar-thermal-pre-packaged-systems-launch-of-the-system-collector-type-collector.jpg)


Languages
Pages
Legal


SOLAR THERMAL COLLECTOR MARKET IN IEA MEMBER COUNTRIES
Werner Weiss and Gerhard Faninger
SOLAR THERMAL COLLECTOR MARKET
IN IEA MEMBER COUNTRIES
Werner Weiss* and Gerhard Faninger**
* Arbeitsgemeinschaft ERNEUERBARE ENERGIE
Institute for Sustainable Technologies A-8200 Gleisdorf, Austria
**University of Klagenfurt
A-9020 Klagenfurt, Austria
Supported by the Austrian Ministry for Transport, Innovation and Technology
IEA Solar Heating & Cooling Programme, December 2002
Table of Contents 1 Summary ................................................................................................................................................... 4 2 Total solar thermal collector area in operation by the year 2000........................................................ 6
2.1 Glazed flat plate and evacuated tube collectors in operation by the year 2000 in IEA Member countries.............................................................................................................................................. 7
2.2 Glazed flat plate and evacuated tube collectors in operation in 2000 by economic region................ 8 2.3 Unglazed collectors in operation by the year 2000 in IEA-SHC member countries ........................... 9 2.4 Unglazed collectors in operation by economic region in 2000 ......................................................... 10
3 Market development............................................................................................................................... 11
3.1 Installed collector area in the year 1999 ........................................................................................... 11 Installed collector area in the year 2000 ........................................................................................... 12 3.2 Market development of glazed flat plate and evacuated tube collectors by country ........................ 12 3.3 Market development of unglazed collectors for swimming pool heating by country......................... 13
4 Contribution to the energy supply and CO2 reduction....................................................................... 14
4.1 Calculated collector yield .................................................................................................................. 19 4.1.1 Collector yield of glazed flat plate and evacuated tube collectors .................................................... 19 4.1.2 Collector yield of unglazed collectors ............................................................................................... 20 4.2 Calculated energy savings................................................................................................................ 21 4.2.1 Energy savings in oil equivalent - glazed flat plate and evacuated tube collectors.......................... 21 4.2.2 Energy savings in oil equivalent - unglazed collectors ..................................................................... 22 4.3 Calculated contribution to CO2 reduction.......................................................................................... 23 4.3.1 Contribution to CO2 reduction: Flat plate and evacuated tube collectors ......................................... 23 4.3.2 Contribution to CO2 reduction: Unglazed collectors ......................................................................... 24 4.4 Contribution of solar thermal collectors to CO2 reduction by economic region ................................ 25
5 APPENDIX ............................................................................................................................................... 26
5.1 Reference systems ........................................................................................................................... 26 5.1.1 Solar thermal systems for swimming pool heating with unglazed plastic absorbers........................ 27 5.1.2 Solar domestic hot water systems for single family houses ............................................................. 28 5.1.3 Solar domestic hot water systems for multi-family houses and district heating ............................... 29 5.1.4 Solar combisystems for domestic hot water and space heating....................................................... 30 5.2 Reference collector ........................................................................................................................... 31 5.3 Reference climates ........................................................................................................................... 31 5.4 Population data ................................................................................................................................. 32 5.5 References to reports or persons that have supplied the market data............................................. 33
3
1 Summary This study was prepared within the framework of the Solar Heating and Cooling Programme (SHC) of the International Energy Agency (IEA). The goal of the study was to document the collector areas previously installed in the SHC Member countries and other IEA Member countries, and to ascertain the contribution of solar plants to the supply of energy and the CO2 emissions avoided as a result of operating these plants. The collectors documented were unglazed collectors recorded used to warm swimming pools, flat-plate and vacuum tube collectors with water as the energy carrier, and air collectors. The data was collected within the framework of a questionnaire survey of the national delegates of the Executive Committee of the SHC Programme. Since some countries have very detailed statistics and others could only provide estimates from experts, the data was checked for its plausibility on the basis of various publications, and if necessary, corrected. Starting with the collector area installed the contributions of solar plants towards the supply of energy and reduction of CO2 were ascertained. The most important results The installed collector area in the 22 IEA Member countries equaled around 58 million square meters at the end of year 2000. Of this, 17 million square meters was accounted for by unglazed collectors, which are used mainly to heat swimming pools, and 40 million square meters of flat-plate and evacuated tube collectors, which are used to prepare hot water and for space heating. Air collectors were installed to an extent of 1.35 million square meters. These are used for drying agricultural products and to a lesser extent for space heating. If one observes the use of solar thermal energy it becomes clear that it greatly varies in the different countries respective economic regions. In North America (USA and Canada) swimming pool heating is dominant with 15 million square meters of unglazed collectors while in Europe (9.7 million square meters) and Japan (11.7 million square meters) plants with flat-plate and evacuated tube collectors mainly used to prepare hot water and for space heating are dominant. Focusing on the installed flat-plate and evacuated tube collectors through the year 2000, then Greece, Austria and Turkey are leading with 264 m², 195 m², 113 m² per 1000 inhabitants respectively. They are followed by Japan, Denmark and Germany with collector areas between 93 and 34 m² per 1000 inhabitants. With regard to the heating of swimming pools with unglazed collectors, Austria leads with 73 m² ahead of the USA with 52 m² and Switzerland with 31 m² per 1000 inhabitants. In fourth to sixth place there is Canada, Germany and the Netherlands with collector areas between 6 and 16 m² per 1000 inhabitants. Analyzing the market development from 1999 and 2000 in the field of plants for the preparation of hot water and space heating it can be seen that the market of flat plate and evacuated tube collectors grew from 2,025,384 m² in the year 1999 to 2,285,797 m² in the year 2000. This corresponds to a growth of 13%. The markets that underwent the greatest growth between 1999 and 2000 included Mexico at 226%, Sweden at 99%, Spain at 65%, Germany at 47% and France at 42%. The countries with stagnating markets were Japan, Italy, Norway and Turkey. Decreasing markets were recorded in Denmark at -16%, Switzerland at -11%, Portugal at -6%, and the USA and the Netherlands at -4%. The market of unglazed collectors for swimming pool heating recorded a slight decrease from 915,378 m² in the year 1999 to 907,903 m² in the year 2000. This corresponds to a reduction of 0.8%. The markets that underwent the greatest growth in this sector between 1999 and 2000 included Mexico at 66%, New Zealand at 12% and France at 7%. Decreasing markets were recorded in Denmark at -73%, Switzerland at -16%, Austria at -13% and the Netherlands at -6%.
4

Until now there has been scarcely any information available on the contribution of solar collectors to the supply of energy, and the potential of this technology has been, for the greater part, underestimated. The calculated annual collector yield of all recorded systems1 in the 20 Member countries of the IEA SHC Programme is approximately 24,367 GWh (87,721 TJ). This corresponds to an oil equivalent of 3.9 billion liter and an annual avoidance of 10.7 million tons of CO2.
1 All water based systems excl. air based systems. Since the database of the applications of air collectors is insufficient, the contribution of air collectors to the energy supply and CO2 reduction was not calculated.
5

2 Total solar thermal collector area in operation by the year 2000
Since the beginning of the 1990s, the solar thermal market has undergone a favorable development. At the end of 2000, a total of 58.2 million square meters of collector area were installed in the IEA Member countries. As shown in Table 1, this collector area is divided in 16.97 million square meters of unglazed collectors for swimming pool heating; 36.69 million square meters of glazed flat plate collectors, and 3.16 million square meters of evacuated tube collectors (mainly used for domestic hot water preparation and space heating), and 1.35 million square meters of glazed and unglazed air collectors for space heating and drying applications. With regard to flat plate and evacuated tube water collectors, it has to be noted that in the US the majority was installed in the 1980s and about 70% was installed up to the year 1985. In comparison to that, most systems in Europe were installed in the 1990s. Table 1: Total collector area in operation by the year 2000 in IEA Member countries
unglazed glazed evacuated tube unglazed glazedAustraliaAustria 571,806 1,581,185 26,219 3,500 2,182,710Belgium 21,875 19,400 1,700 42,975Canada 493,000 72,000 509 41,000 0 606,509Denmark 15,563 243,169 258,732Finland 10,200 100 10,300France 84,500 470,000 554,500Germany 615,000 2,399,000 392,000 40,000 3,446,000Greece 2,815,000 2,815,000Italy 20,000 300,000 20,000 2,000 2,000 344,000Japan 11,445,008 307,481 11,752,489Mexico 283,800 94,600 378,400The Netherlands 100,305 176,580 5,341 282,226New Zealand 64,000 64,000Norway 500 7,000 100 1,000 8,600Portugal 1,000 238,000 500 239,500Spain 399,922 399,922Sweden 30,000 175,045 3,000 208,045Switzerland 221,200 250,800 15,000 816,000 1,303,000Turkey 0 7,500,000 0 0 0 7,500,000United Kingdom 0 149,000 2,000 151,000United States 14,513,000 8,277,000 2,390,000 439,000 25,619,000
TOTAL 16,971,549 36,686,909 3,158,609 864,341 485,500 58,166,908
Total Collector Area in Operation in the Year 2000 in the IEA-Member Countries
Country Water collectors AIR COLLECTOR TOTAL
6

2.1 Glazed flat plate and evacuated tube collectors in operation by the year 2000 in IEA Member countries
Total: glazed flat plate and evacuated tube water collectors in IEA countries in 2000
0
2,000,000
4,000,000
6,000,000
8,000,000
10,000,000
12,000,000
14,000,000Au
stra
lia
Aust
ria
Belg
ium
Can
ada
Den
mar
k
Finl
and
Fran
ce
Ger
man
y
Gre
ece
Italy
Japa
n
Mex
ico
The
Net
herla
nds
New
Zea
land
Nor
way
Portu
gal
Spai
n
Swed
en
Switz
erla
nd
Turk
ey
Uni
ted
King
dom
Uni
ted
Stat
es
Col
lect
or a
rea
[m²]
Figure 1: Glazed flat plate and evacuated tube collectors in operation in the year 2000.
Total: Glazed flat plate and evacuated tube water collectors in IEA countries per 1000 inhabitants in 2000
0
50
100
150
200
250
300
Aust
ralia
Aust
ria
Belg
ium
Can
ada
Den
mar
k
Finl
and
Fran
ce
Ger
man
y
Gre
ece
Italy
Japa
n
Mex
ico
Net
herla
nds
New
Zea
land
Nor
way
Portu
gal
Spai
n
Swed
en
Switz
erla
nd
Turk
ey
Uni
ted
King
dom
Uni
ted
Stat
es
Col
lect
or a
rea
per 1
000
inha
bita
nts
[m²]
Figure 1: Glazed flat plate and evacuated tube collectors in operation in the year 2000 per 1000
inhabitants
7
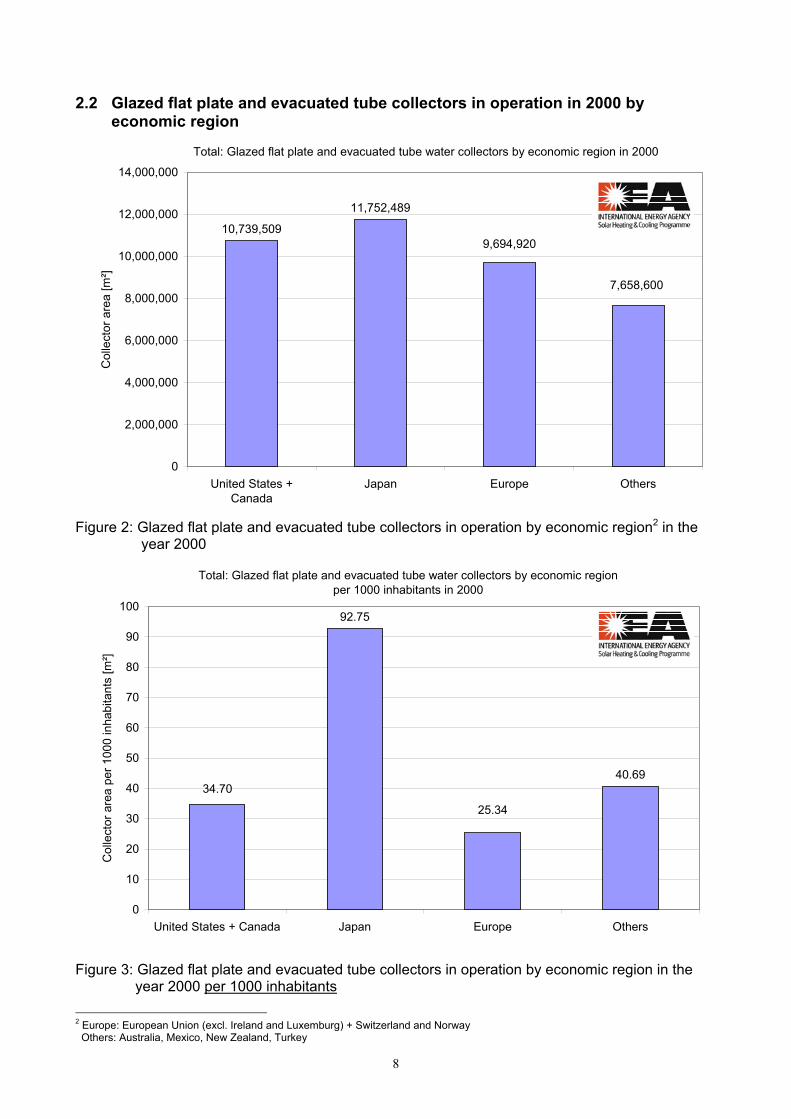
2.2 Glazed flat plate and evacuated tube collectors in operation in 2000 by economic region
Total: Glazed flat plate and evacuated tube water collectors by economic region in 2000
10,739,509
11,752,489
7,658,600
9,694,920
0
2,000,000
4,000,000
6,000,000
8,000,000
10,000,000
12,000,000
14,000,000
United States +Canada
Japan Europe Others
Col
lect
or a
rea
[m²]
Figure 2: Glazed flat plate and evacuated tube collectors in operation by economic region2 in the
year 2000
Total: Glazed flat plate and evacuated tube water collectors by economic regionper 1000 inhabitants in 2000
92.75
40.6934.70
25.34
0
10
20
30
40
50
60
70
80
90
100
United States + Canada Japan Europe Others
Col
lect
or a
rea
per 1
000
inha
bita
nts
[m²]
Figure 3: Glazed flat plate and evacuated tube collectors in operation by economic region in the year 2000 per 1000 inhabitants
2 Europe: European Union (excl. Ireland and Luxemburg) + Switzerland and Norway Others: Australia, Mexico, New Zealand, Turkey
8

2.3 Unglazed collectors in operation by the year 2000 in IEA-SHC member countries
Total: Unglazed water collectors in IEA countries in 2000
0
2,000,000
4,000,000
6,000,000
8,000,000
10,000,000
12,000,000
14,000,000
16,000,000Au
stra
lia
Aust
ria
Belg
ium
Can
ada
Den
mar
k
Finl
and
Fran
ce
Ger
man
y
Gre
ece
Italy
Japa
n
Mex
ico
The
Net
herla
nds
New
Zea
land
Nor
way
Portu
gal
Spai
n
Swed
en
Switz
erla
nd
Turk
ey
Uni
ted
King
dom
Uni
ted
Stat
es
Col
lect
or a
rea
[m²]
Figure 4: Unglazed collectors in operation in the year 2000
Total: Unglazed water collectors in IEA countries per 1000 inhabitants in 2000
0
10
20
30
40
50
60
70
80
Aust
ralia
Aust
ria
Belg
ium
Can
ada
Den
mar
k
Finl
and
Fran
ce
Ger
man
y
Gre
ece
Italy
Japa
n
Mex
ico
Net
herla
nds
New
Zea
land
Nor
way
Portu
gal
Spai
n
Swed
en
Switz
erla
nd
Turk
ey
Uni
ted
King
dom
Uni
ted
Stat
es
Col
lect
or a
rea
per 1
000
inha
bita
nts
[m²]
Figure 5: Unglazed collectors in operation in different countries in the year 2000 per 1000
inhabitants
9
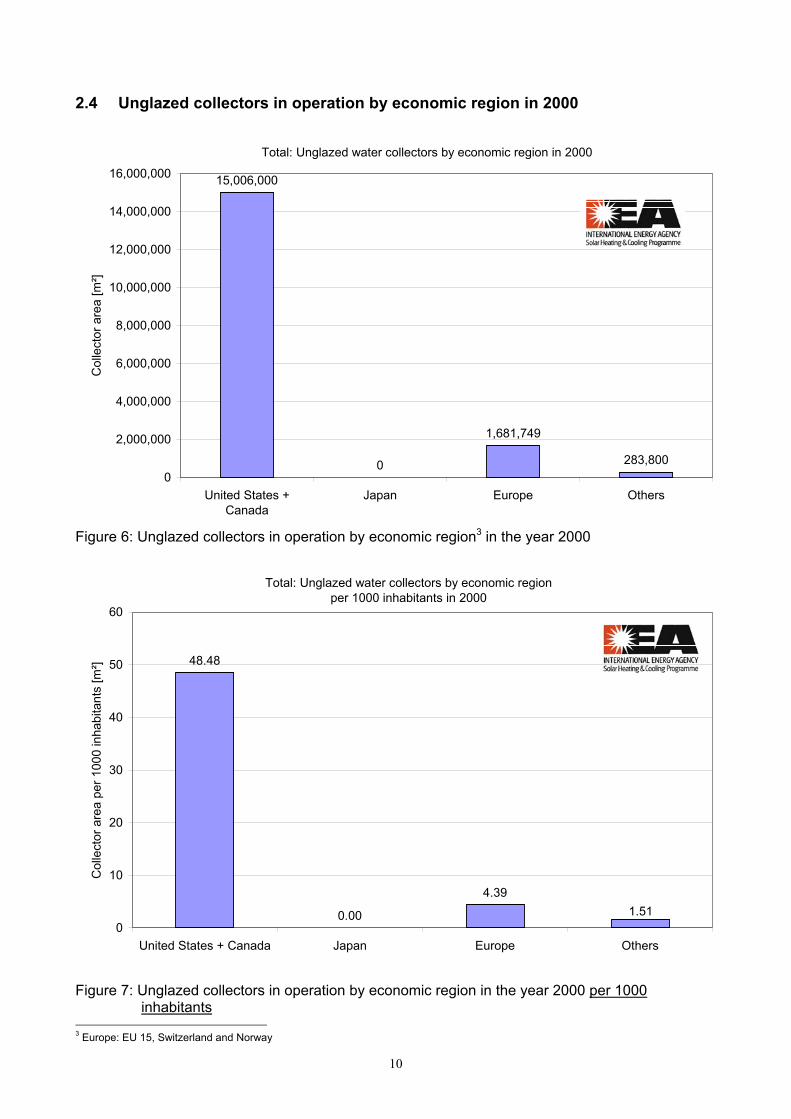
2.4 Unglazed collectors in operation by economic region in 2000
Total: Unglazed water collectors by economic region in 2000
15,006,000
0
1,681,749
283,8000
2,000,000
4,000,000
6,000,000
8,000,000
10,000,000
12,000,000
14,000,000
16,000,000
United States +Canada
Japan Europe Others
Col
lect
or a
rea
[m²]
Figure 6: Unglazed collectors in operation by economic region3 in the year 2000
Total: Unglazed water collectors by economic region per 1000 inhabitants in 2000
48.48
0.00
4.391.51
0
10
20
30
40
50
60
United States + Canada Japan Europe Others
Col
lect
or a
rea
per 1
000
inha
bita
nts
[m²]
Figure 7: Unglazed collectors in operation by economic region in the year 2000 per 1000
inhabitants 3 Europe: EU 15, Switzerland and Norway
10
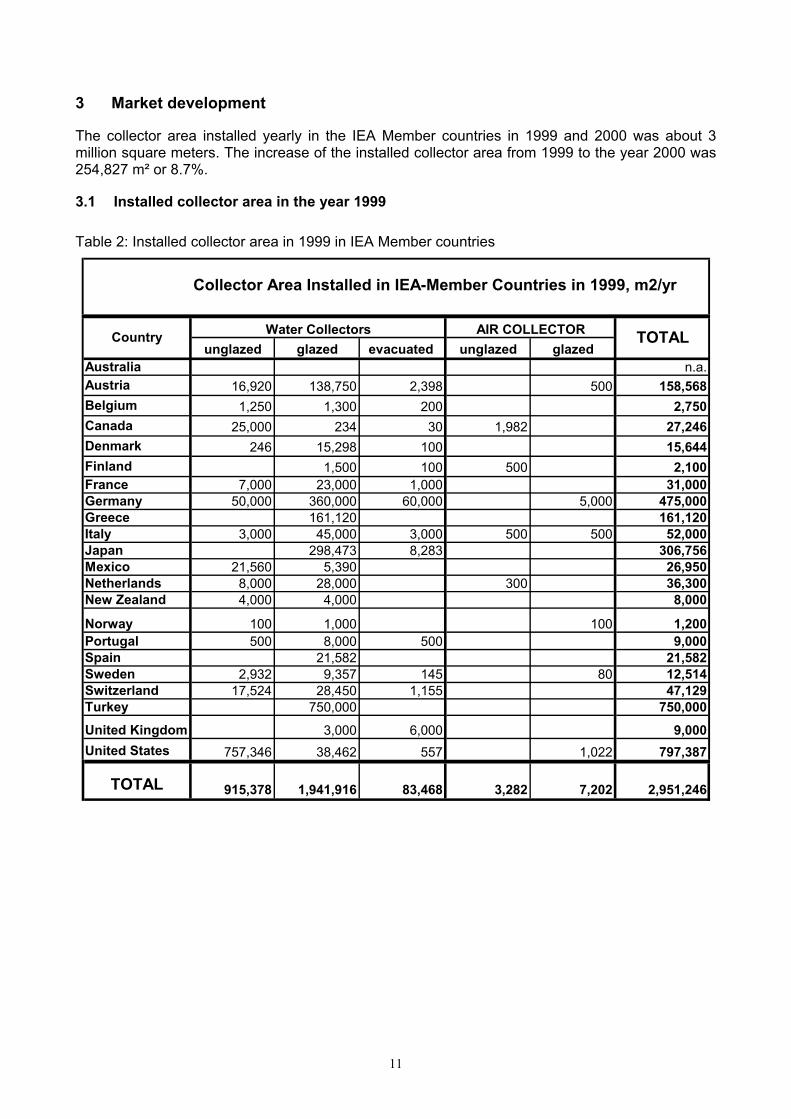
3 Market development The collector area installed yearly in the IEA Member countries in 1999 and 2000 was about 3 million square meters. The increase of the installed collector area from 1999 to the year 2000 was 254,827 m² or 8.7%. 3.1 Installed collector area in the year 1999
Table 2: Installed collector area in 1999 in IEA Member countries
Collector Area Installed in IEA-Member Countries in 1999, m2/yr
unglazed glazed evacuated unglazed glazedAustralia n.a.Austria 16,920 138,750 2,398 500 158,568Belgium 1,250 1,300 200 2,750Canada 25,000 234 30 1,982 27,246Denmark 246 15,298 100 15,644Finland 1,500 100 500 2,100France 7,000 23,000 1,000 31,000Germany 50,000 360,000 60,000 5,000 475,000Greece 161,120 161,120Italy 3,000 45,000 3,000 500 500 52,000Japan 298,473 8,283 306,756Mexico 21,560 5,390 26,950Netherlands 8,000 28,000 300 36,300New Zealand 4,000 4,000 8,000
Norway 100 1,000 100 1,200Portugal 500 8,000 500 9,000Spain 21,582 21,582Sweden 2,932 9,357 145 80 12,514Switzerland 17,524 28,450 1,155 47,129Turkey 750,000 750,000United Kingdom 3,000 6,000 9,000United States 757,346 38,462 557 1,022 797,387
TOTAL 915,378 1,941,916 83,468 3,282 7,202 2,951,246
Country Water Collectors TOTALAIR COLLECTOR
11

Installed collector area in the year 2000
Table 3: Installed collector area in 2000 in IEA Member countries
Collector Area Installed in IEA-Member Countries in 2000, m2/yr
unglazed glazed evacuated unglazed glazedAustralia n.a.Austria 14,738 150,543 2,401 550 168,232Belgium 1,250 1,400 200 2,850Canada 27,000 626 161 3,366 0 31,153Denmark 67 12,874 50 12,991Finland 2,000 500 2,500France 7,500 34,000 41,500Germany 50,000 510,000 110,000 7,000 677,000Greece 170,000 170,000Italy 3,000 45,000 3,000 500 500 52,000Japan 301,620 5,891 307,511Mexico 35,778 17,622 53,400Netherlands 7,500 27,000 300 34,800New Zealand 4,500 4,500 9,000Norway 100 1,000 100 1,200Portugal 500 7,500 500 8,500Spain 35,667 35,667Sweden 2,983 18,045 872 21,900Switzerland 14,779 24,701 1,555 41,035Turkey 0 750,000 0 0 0 750,000United Kingdom 9,000 1,000 10,000United States 738,208 35,675 1,394 557 775,834
TOTAL 907,903 2,158,773 127,024 4,666 8,707 3,207,073
TOTALCountry Water Collectors AIR COLLECTOR
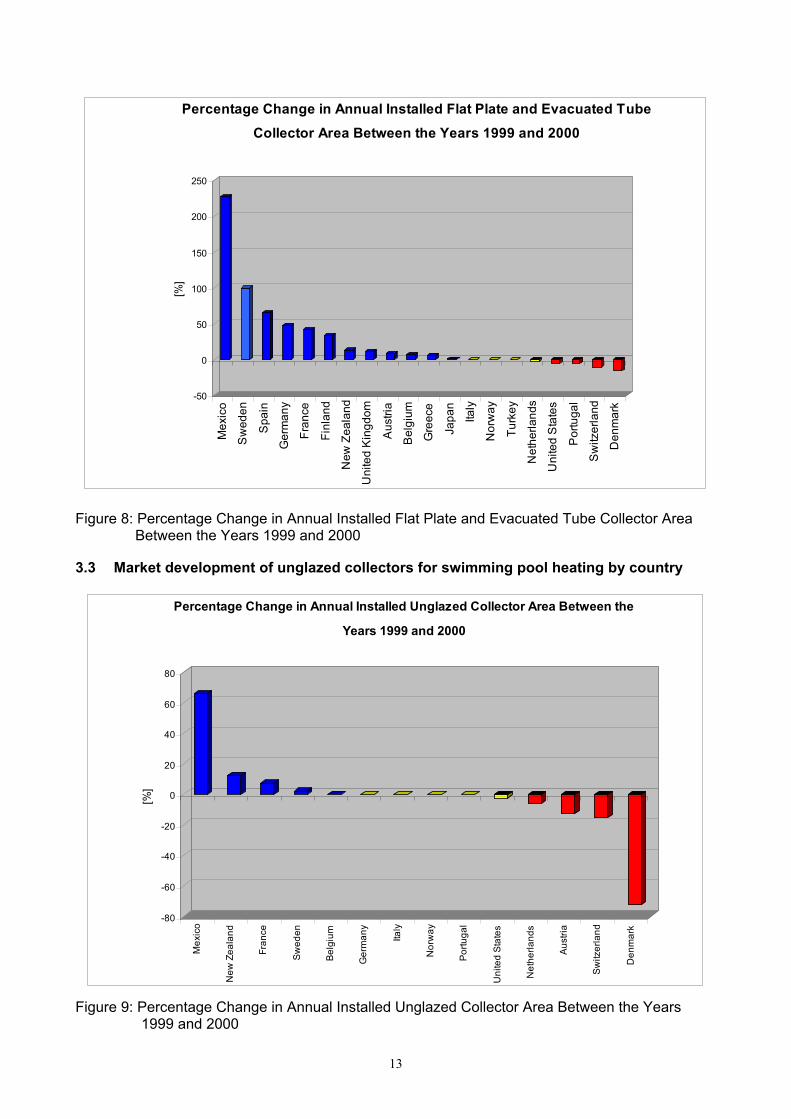
3.2 Market development of glazed flat plate and evacuated tube collectors by country The market for flat plate and evacuated tube collectors grew from 2,025,384 m² in the year 1999 to 2,285,797 m² in the year 2000. This corresponds to a growth of 13%. The markets that underwent the greatest growth between 1999 and 2000 included Mexico at 226%, Sweden at 99%, Spain at 65%, Germany at 47% and France at 42%. The countries with stagnating markets were Japan, Italy, Norway and Turkey. Decreasing markets were recorded in Denmark at -16%, Switzerland at -11%, Portugal at -6% and the USA and the Netherlands at -4%.
12
-50
0
50
100
150
200
250[%
]
Mex
ico
Sw
eden
Spa
in
Ger
man
y
Fran
ce
Finl
and
New
Zea
land
Uni
ted
Kin
gdom
Aus
tria
Bel
gium
Gre
ece
Japa
n
Italy
Nor
way
Turk
ey
Net
herla
nds
Uni
ted
Sta
tes
Por
tuga
l
Sw
itzer
land
Den
mar
k
Percentage Change in Annual Installed Flat Plate and Evacuated Tube Collector Area Between the Years 1999 and 2000
Figure 8: Percentage Change in Annual Installed Flat Plate and Evacuated Tube Collector Area Between the Years 1999 and 2000
3.3 Market development of unglazed collectors for swimming pool heating by country
-80
-60
-40
-20
0
20
40
60
80
[%]
Mex
ico
New
Zea
land
Fran
ce
Swed
en
Belg
ium
Ger
man
y
Italy
Nor
way
Portu
gal
Uni
ted
Stat
es
Net
herla
nds
Aust
ria
Switz
erla
nd
Den
mar
k
Percentage Change in Annual Installed Unglazed Collector Area Between the
Years 1999 and 2000
Figure 9: Percentage Change in Annual Installed Unglazed Collector Area Between the Years
1999 and 2000
13

The market for unglazed collectors recorded a slight decrease from 915,378 m² in the year 1999 to 907,903 m² in the year 2000. This corresponds to a reduction of 0.8%. The markets that underwent the greatest growth between 1999 and 2000 included Mexico at 66%, New Zealand at 12% and France at 7%. Decreasing markets were recorded in Denmark at -73%, Switzerland at -16%, Austria at -13% and the Netherlands at -6%.
Glazed flat plate and evacuated tube water collectors installed in 2000 by economic region
37,856
307,511
1,168,308
772,122
0
200,000
400,000
600,000
800,000
1,000,000
1,200,000
1,400,000
United States+Canada Japan Europe Others
Col
lect
or a
rea
[m²]
Figure 10: Glazed flat plate and evacuated tube water collectors installed in 2000
4 Contribution to the energy supply and CO2 reduction Until now there has been scarcely any information available on the contribution of solar collectors to the supply of energy, the potential of this technology has been, for the greater part, under- estimated. In this section, the contribution of the installed water collectors to the energy supply and CO2 reduction is shown. The data for air collector applications was insufficient, therefore, the contribution of air collectors to the energy supply and CO2 reduction was not calculated. As shown in Table 1, around 56,82 million square meters of unglazed, flat plate and evacuated tube collectors were installed by the end of the year 2000 in the IEA Member countries. The annual yield of these collector areas is calculated to be 24,367 GWh (87,721 TJ). This corresponds to a calculated oil equivalent of 3.9 billion liter and an annual CO2 reduction of 10.7 million tons of CO2. Basis for calculation In order to ascertain the energy yield of thermal solar plants, the oil equivalent saved and the CO2 emissions avoided, the following procedure was used: • Only water collectors were used for the calculations (unglazed, flat plate and evacuated tube
collectors). Air collector plants were not considered.
14

• For each country, the overall collector area installed (water collectors) was allocated to the four plant types: Collector area for: - swimming pool heating
- domestic hot water systems for single family houses - domestic hot water systems for multi-family houses and district heating - solar combisystems for domestic hot water and space heating
• Reference plants were defined for each country for each type of plant. • The number of plants for each country was ascertained from the share of collector area for
each plant type and the collector area per reference system. Reference collectors and a reference climate were determined for each country apart from the reference plants. On the basis of these reference conditions simulations were performed with the simulation program T-Sol4 and in this way the solar yields, energy savings and CO2 emissions were ascertained. The reference conditions, which formed the basis for the simulation, can be found in the appendix. Results The annual collector yield per square meter of collector area lies, depending on the application (domestic hot water preparation, space heating...), the local climatic conditions and the plant dimensioning (high or low solar fraction), between 250 kWh/m² for solar combisystems for hot water and space heating in northern climate zones and 600 kWh/m² for plants used to prepare hot water in southern climate zones. The energy savings were ascertained from the energy equivalent of the fuel used and the rate of efficiency of the auxiliary heating system. For the auxiliary heating system oil was taken as the fuel for all plants and the energy equivalent per liter of oil 36.700 kJ respectively 10.2 kWh was used in all countries. To obtain an exact statement about the CO2 emissions avoided the substituted energy medium would have to be ascertained for each country. Since this could only be done in a very detailed survey which goes beyond the scope of this study, the energy savings and the CO2 emissions avoided relate to oil. This represents a simplification since gas, coal, biomass or electricity can be used as the energy medium for the auxiliary heating system instead of oil. The CO2 emissions avoided by solar plants were ascertained from the energy savings (oil equivalent). 2.73 kg CO2 per liter of oil was used as the emission factor.
4 T-Sol, Version 4.03, dynamic simulation program to design and optimize thermal solar plants, Valentin Energiesoftware, www.valentin.de
15
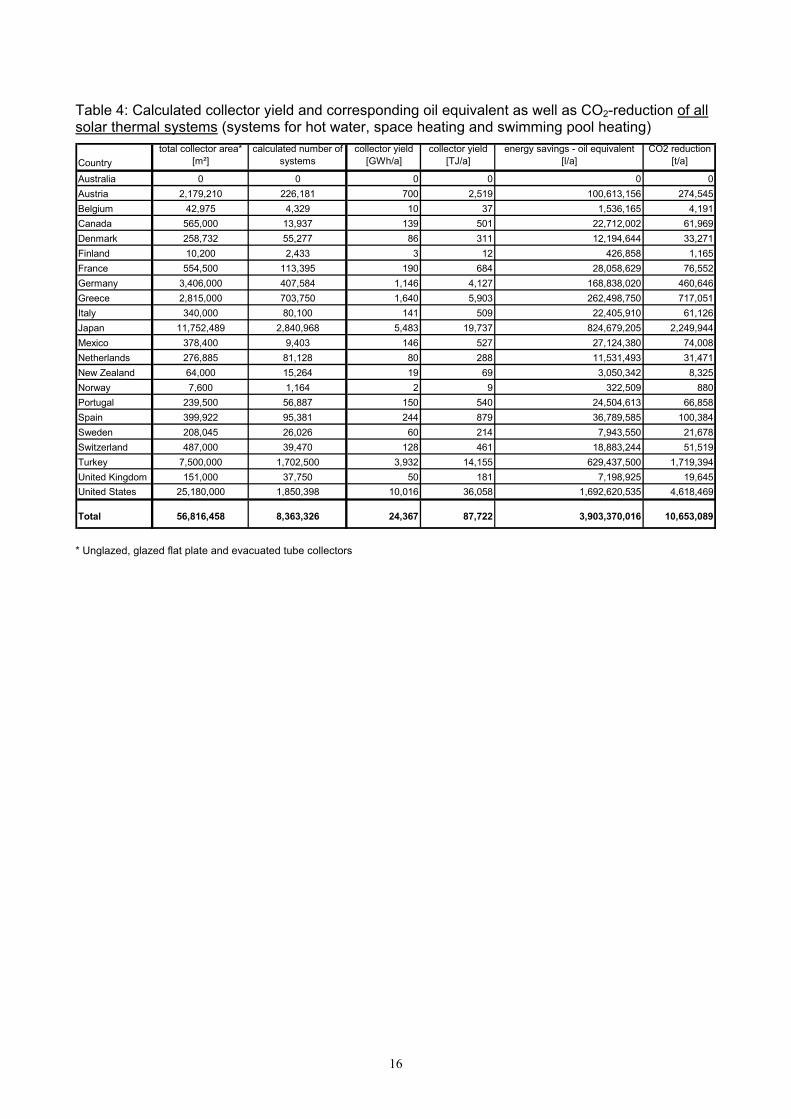
Table 4: Calculated collector yield and corresponding oil equivalent as well as CO2-reduction of all solar thermal systems (systems for hot water, space heating and swimming pool heating)
Countrytotal collector area*
[m²]calculated number of
systemscollector yield
[GWh/a]collector yield
[TJ/a]energy savings - oil equivalent
[l/a]CO2 reduction
[t/a]
Australia 0 0 0 0 0 0Austria 2,179,210 226,181 700 2,519 100,613,156 274,545Belgium 42,975 4,329 10 37 1,536,165 4,191Canada 565,000 13,937 139 501 22,712,002 61,969Denmark 258,732 55,277 86 311 12,194,644 33,271Finland 10,200 2,433 3 12 426,858 1,165France 554,500 113,395 190 684 28,058,629 76,552Germany 3,406,000 407,584 1,146 4,127 168,838,020 460,646Greece 2,815,000 703,750 1,640 5,903 262,498,750 717,051Italy 340,000 80,100 141 509 22,405,910 61,126Japan 11,752,489 2,840,968 5,483 19,737 824,679,205 2,249,944Mexico 378,400 9,403 146 527 27,124,380 74,008Netherlands 276,885 81,128 80 288 11,531,493 31,471New Zealand 64,000 15,264 19 69 3,050,342 8,325Norway 7,600 1,164 2 9 322,509 880Portugal 239,500 56,887 150 540 24,504,613 66,858Spain 399,922 95,381 244 879 36,789,585 100,384Sweden 208,045 26,026 60 214 7,943,550 21,678Switzerland 487,000 39,470 128 461 18,883,244 51,519Turkey 7,500,000 1,702,500 3,932 14,155 629,437,500 1,719,394United Kingdom 151,000 37,750 50 181 7,198,925 19,645United States 25,180,000 1,850,398 10,016 36,058 1,692,620,535 4,618,469
Total 56,816,458 8,363,326 24,367 87,722 3,903,370,016 10,653,089
* Unglazed, glazed flat plate and evacuated tube collectors
16
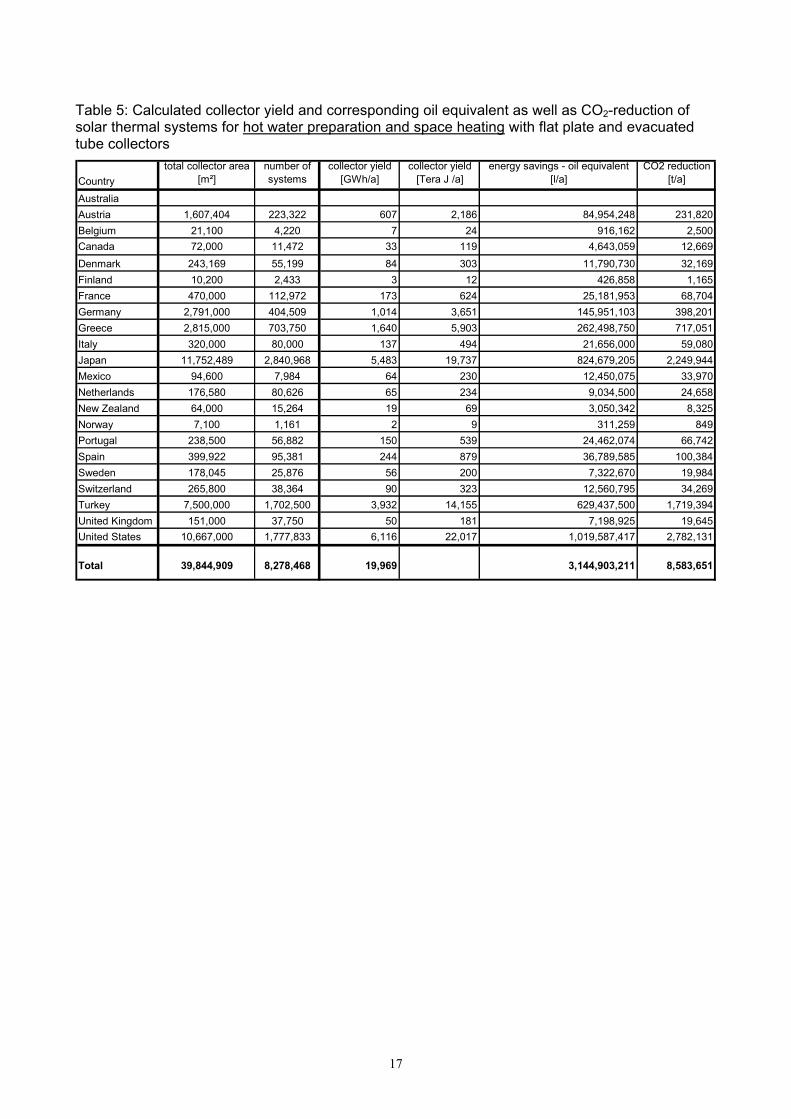
Table 5: Calculated collector yield and corresponding oil equivalent as well as CO2-reduction of solar thermal systems for hot water preparation and space heating with flat plate and evacuated tube collectors
Countrytotal collector area
[m²]number of systems
collector yield [GWh/a]
collector yield [Tera J /a]
energy savings - oil equivalent [l/a]
CO2 reduction [t/a]
AustraliaAustria 1,607,404 223,322 607 2,186 84,954,248 231,820Belgium 21,100 4,220 7 24 916,162 2,500Canada 72,000 11,472 33 119 4,643,059 12,669Denmark 243,169 55,199 84 303 11,790,730 32,169Finland 10,200 2,433 3 12 426,858 1,165France 470,000 112,972 173 624 25,181,953 68,704Germany 2,791,000 404,509 1,014 3,651 145,951,103 398,201Greece 2,815,000 703,750 1,640 5,903 262,498,750 717,051Italy 320,000 80,000 137 494 21,656,000 59,080Japan 11,752,489 2,840,968 5,483 19,737 824,679,205 2,249,944Mexico 94,600 7,984 64 230 12,450,075 33,970Netherlands 176,580 80,626 65 234 9,034,500 24,658New Zealand 64,000 15,264 19 69 3,050,342 8,325Norway 7,100 1,161 2 9 311,259 849Portugal 238,500 56,882 150 539 24,462,074 66,742Spain 399,922 95,381 244 879 36,789,585 100,384Sweden 178,045 25,876 56 200 7,322,670 19,984Switzerland 265,800 38,364 90 323 12,560,795 34,269Turkey 7,500,000 1,702,500 3,932 14,155 629,437,500 1,719,394United Kingdom 151,000 37,750 50 181 7,198,925 19,645United States 10,667,000 1,777,833 6,116 22,017 1,019,587,417 2,782,131
Total 39,844,909 8,278,468 19,969 3,144,903,211 8,583,651
17
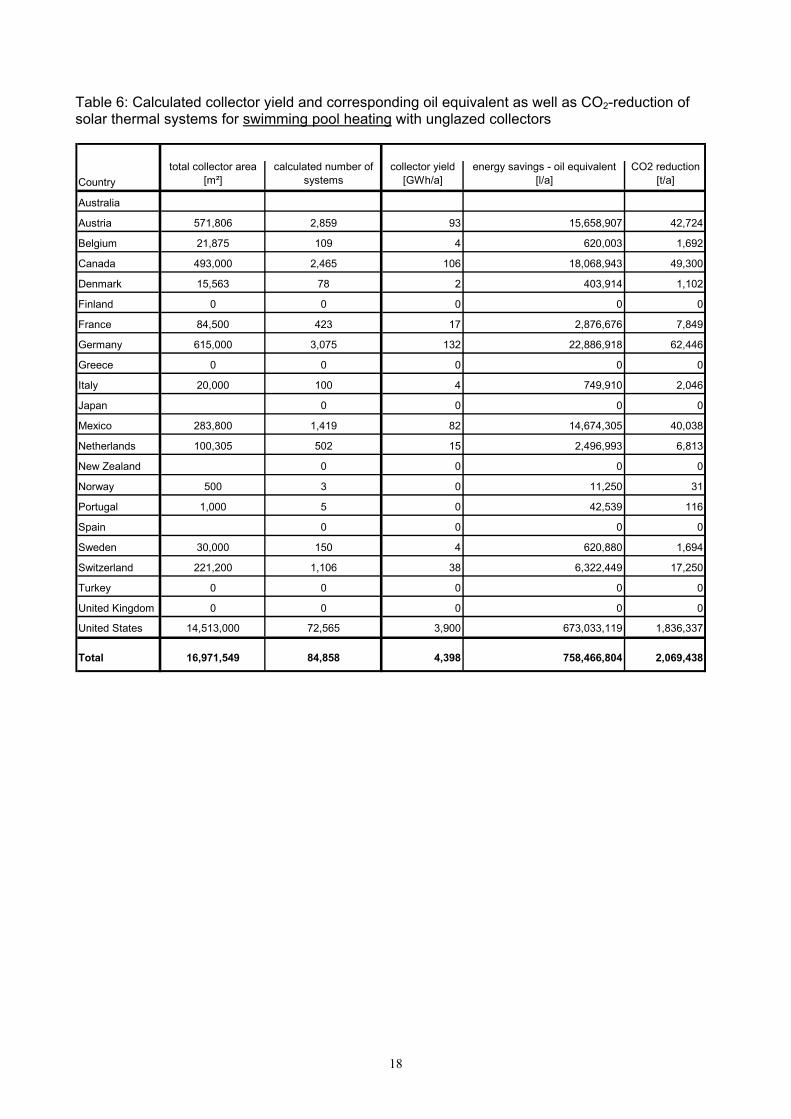
Table 6: Calculated collector yield and corresponding oil equivalent as well as CO2-reduction of solar thermal systems for swimming pool heating with unglazed collectors
Countrytotal collector area
[m²]calculated number of
systemscollector yield
[GWh/a]energy savings - oil equivalent
[l/a]CO2 reduction
[t/a]
Australia
Austria 571,806 2,859 93 15,658,907 42,724
Belgium 21,875 109 4 620,003 1,692
Canada 493,000 2,465 106 18,068,943 49,300
Denmark 15,563 78 2 403,914 1,102
Finland 0 0 0 0 0
France 84,500 423 17 2,876,676 7,849
Germany 615,000 3,075 132 22,886,918 62,446
Greece 0 0 0 0 0
Italy 20,000 100 4 749,910 2,046
Japan 0 0 0 0
Mexico 283,800 1,419 82 14,674,305 40,038
Netherlands 100,305 502 15 2,496,993 6,813
New Zealand 0 0 0 0
Norway 500 3 0 11,250 31
Portugal 1,000 5 0 42,539 116
Spain 0 0 0 0
Sweden 30,000 150 4 620,880 1,694
Switzerland 221,200 1,106 38 6,322,449 17,250
Turkey 0 0 0 0 0
United Kingdom 0 0 0 0 0
United States 14,513,000 72,565 3,900 673,033,119 1,836,337
Total 16,971,549 84,858 4,398 758,466,804 2,069,438
18
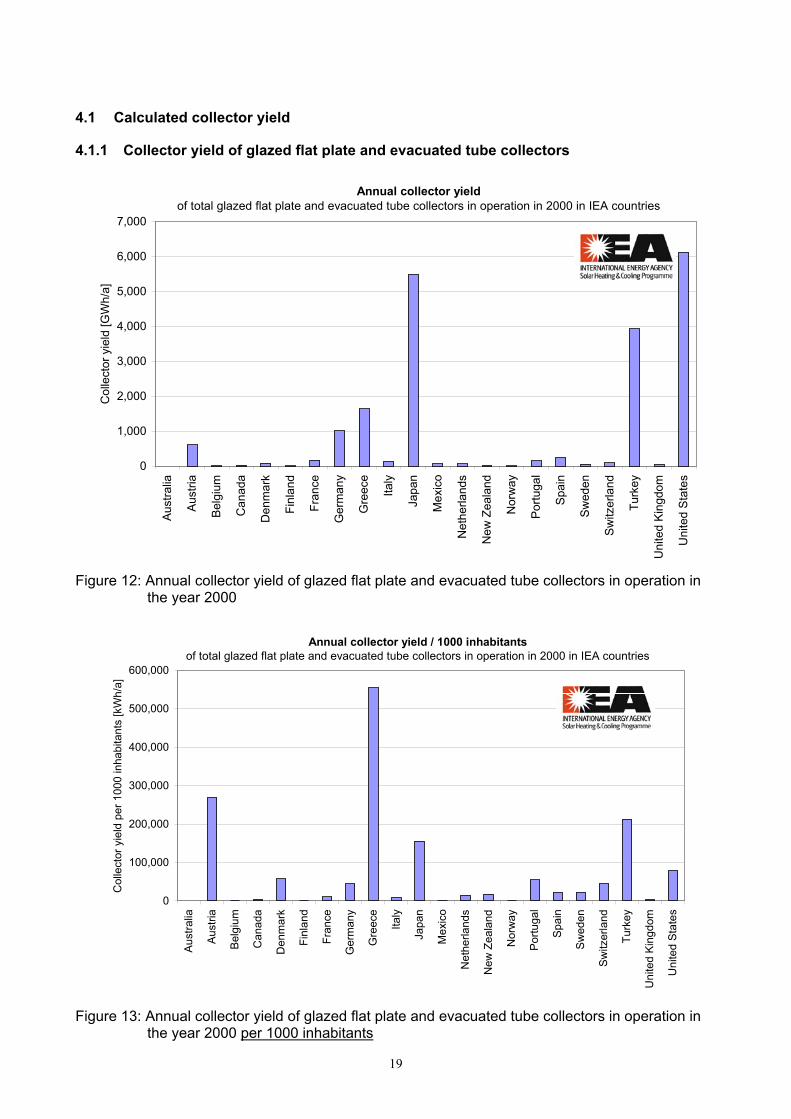
4.1 Calculated collector yield
4.1.1 Collector yield of glazed flat plate and evacuated tube collectors
Annual collector yield of total glazed flat plate and evacuated tube collectors in operation in 2000 in IEA countries
0
1,000
2,000
3,000
4,000
5,000
6,000
7,000
Aust
ralia
Aust
ria
Belg
ium
Can
ada
Den
mar
k
Finl
and
Fran
ce
Ger
man
y
Gre
ece
Italy
Japa
n
Mex
ico
Net
herla
nds
New
Zea
land
Nor
way
Portu
gal
Spai
n
Swed
en
Switz
erla
nd
Turk
ey
Uni
ted
King
dom
Uni
ted
Stat
es
Col
lect
or y
ield
[GW
h/a]
Figure 12: Annual collector yield of glazed flat plate and evacuated tube collectors in operation in
the year 2000
Annual collector yield / 1000 inhabitants of total glazed flat plate and evacuated tube collectors in operation in 2000 in IEA countries
0
100,000
200,000
300,000
400,000
500,000
600,000
Aust
ralia
Aust
ria
Belg
ium
Can
ada
Den
mar
k
Finl
and
Fran
ce
Ger
man
y
Gre
ece
Italy
Japa
n
Mex
ico
Net
herla
nds
New
Zea
land
Nor
way
Portu
gal
Spai
n
Swed
en
Switz
erla
nd
Turk
ey
Uni
ted
King
dom
Uni
ted
Stat
es
Col
lect
or y
ield
per
100
0 in
habi
tant
s [k
Wh/
a]
Figure 13: Annual collector yield of glazed flat plate and evacuated tube collectors in operation in
the year 2000 per 1000 inhabitants
19

4.1.2 Collector yield of unglazed collectors
Annual collector yield of the total unglazed collectors in operation until 2000 in IEA countries
0
500
1,000
1,500
2,000
2,500
3,000
3,500
4,000
4,500Au
stra
lia
Aust
ria
Belg
ium
Can
ada
Den
mar
k
Finl
and
Fran
ce
Ger
man
y
Gre
ece
Italy
Japa
n
Mex
ico
Net
herla
nds
New
Zea
land
Nor
way
Portu
gal
Spai
n
Swed
en
Switz
erla
nd
Turk
ey
Uni
ted
King
dom
Uni
ted
Stat
es
Col
lect
or y
ield
[GW
h/a]
Figure 14: Annual collector yield of unglazed collectors in operation in the year 2000
Annual collector yield of the total unglazed collectors in operation in 2000 in IEA countries per 1000 inhabitants
0
2,000
4,000
6,000
8,000
10,000
12,000
14,000
16,000
Aust
ralia
Aust
ria
Belg
ium
Can
ada
Den
mar
k
Finl
and
Fran
ce
Ger
man
y
Gre
ece
Italy
Japa
n
Mex
ico
Net
herla
nds
New
Zea
land
Nor
way
Portu
gal
Spai
n
Swed
en
Switz
erla
nd
Turk
ey
Uni
ted
King
dom
Uni
ted
Stat
es
Col
lect
or y
ield
per
100
0 in
habi
tant
s [k
Wh/
a]
Figure 15: Annual collector yield of unglazed collectors in operation in the year 2000 per 1000
inhabitants
20

4.2 Calculated energy savings
4.2.1 Energy savings in oil equivalent - glazed flat plate and evacuated tube collectors
Annual energy savings: Oil equivalent of total glazed flat plate and evacuated tube collectors in operation in 2000 in IEA countries
0
200,000,000
400,000,000
600,000,000
800,000,000
1,000,000,000
1,200,000,000Au
stra
lia
Aust
ria
Belg
ium
Can
ada
Den
mar
k
Finl
and
Fran
ce
Ger
man
y
Gre
ece
Italy
Japa
n
Mex
ico
Net
herla
nds
New
Zea
land
Nor
way
Portu
gal
Spai
n
Swed
en
Switz
erla
nd
Turk
ey
Uni
ted
King
dom
Uni
ted
Stat
es
ener
gy s
avin
gs -
oil e
quiv
alen
t [l/a
]
Figure 16: Annual energy savings in oil equivalent - glazed flat plate and evacuated tube collectors
Annual energy savings: Oil equivalent / 1000 inhabitants of total glazed flat plate and evacuated tube collectors in operation in 2000 in IEA countries
0
5,000
10,000
15,000
20,000
25,000
30,000
Aust
ralia
Aust
ria
Belg
ium
Can
ada
Den
mar
k
Finl
and
Fran
ce
Ger
man
y
Gre
ece
Italy
Japa
n
Mex
ico
Net
herla
nds
New
Zea
land
Nor
way
Portu
gal
Spai
n
Swed
en
Switz
erla
nd
Turk
ey
Uni
ted
King
dom
Uni
ted
Stat
esener
gy s
avin
gs -
oil e
quiv
alen
t per
100
0 in
habi
tant
s [l/
a]
Figure 17: Annual energy savings in oil equivalent - glazed flat plate and evacuated tube collectors
per 1000 inhabitants
21
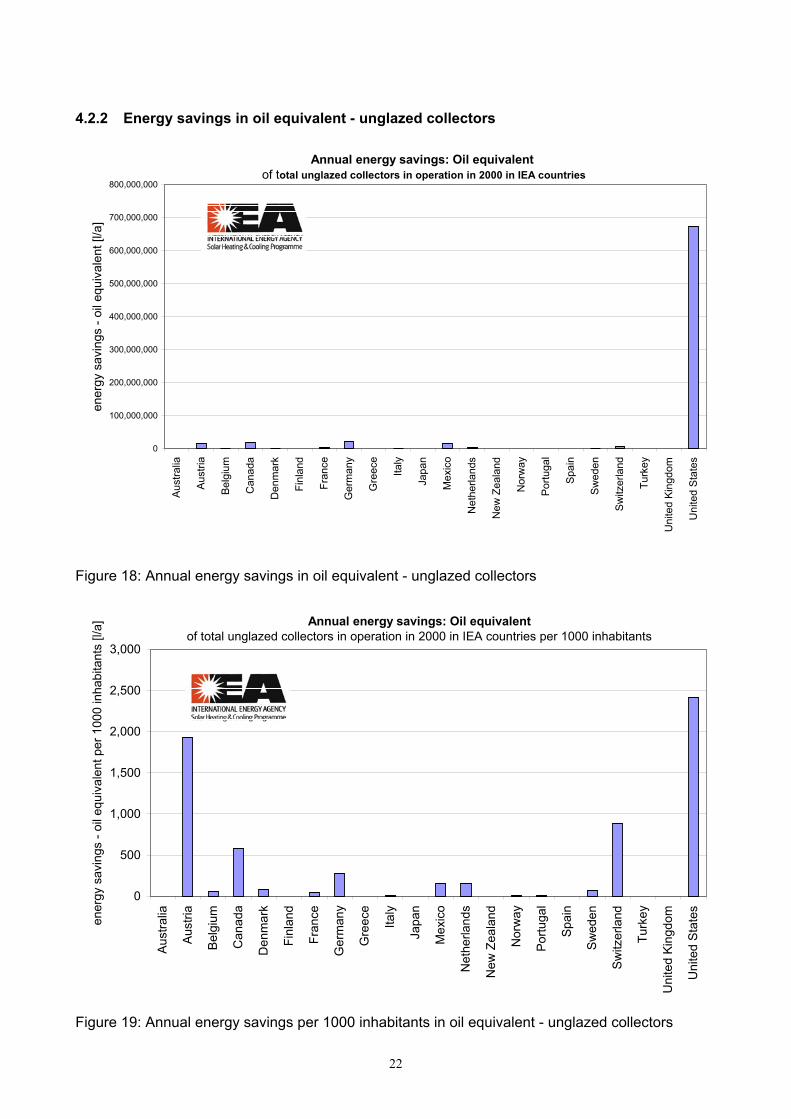
4.2.2 Energy savings in oil equivalent - unglazed collectors
Annual energy savings: Oil equivalent of total unglazed collectors in operation in 2000 in IEA countries
0
100,000,000
200,000,000
300,000,000
400,000,000
500,000,000
600,000,000
700,000,000
800,000,000Au
stra
lia
Aust
ria
Belg
ium
Can
ada
Den
mar
k
Finl
and
Fran
ce
Ger
man
y
Gre
ece
Italy
Japa
n
Mex
ico
Net
herla
nds
New
Zea
land
Nor
way
Portu
gal
Spai
n
Swed
en
Switz
erla
nd
Turk
ey
Uni
ted
King
dom
Uni
ted
Stat
es
ener
gy s
avin
gs -
oil e
quiv
alen
t [l/a
]
Figure 18: Annual energy savings in oil equivalent - unglazed collectors
Annual energy savings: Oil equivalent of total unglazed collectors in operation in 2000 in IEA countries per 1000 inhabitants
0
500
1,000
1,500
2,000
2,500
3,000
Aust
ralia
Aust
ria
Belg
ium
Can
ada
Den
mar
k
Finl
and
Fran
ce
Ger
man
y
Gre
ece
Italy
Japa
n
Mex
ico
Net
herla
nds
New
Zea
land
Nor
way
Portu
gal
Spai
n
Swed
en
Switz
erla
nd
Turk
ey
Uni
ted
King
dom
Uni
ted
Stat
esener
gy s
avin
gs -
oil e
quiv
alen
t per
100
0 in
habi
tant
s [l/
a]
Figure 19: Annual energy savings per 1000 inhabitants in oil equivalent - unglazed collectors
22
4.3 Calculated contribution to CO2 reduction
4.3.1 Contribution to CO2 reduction: Flat plate and evacuated tube collectors
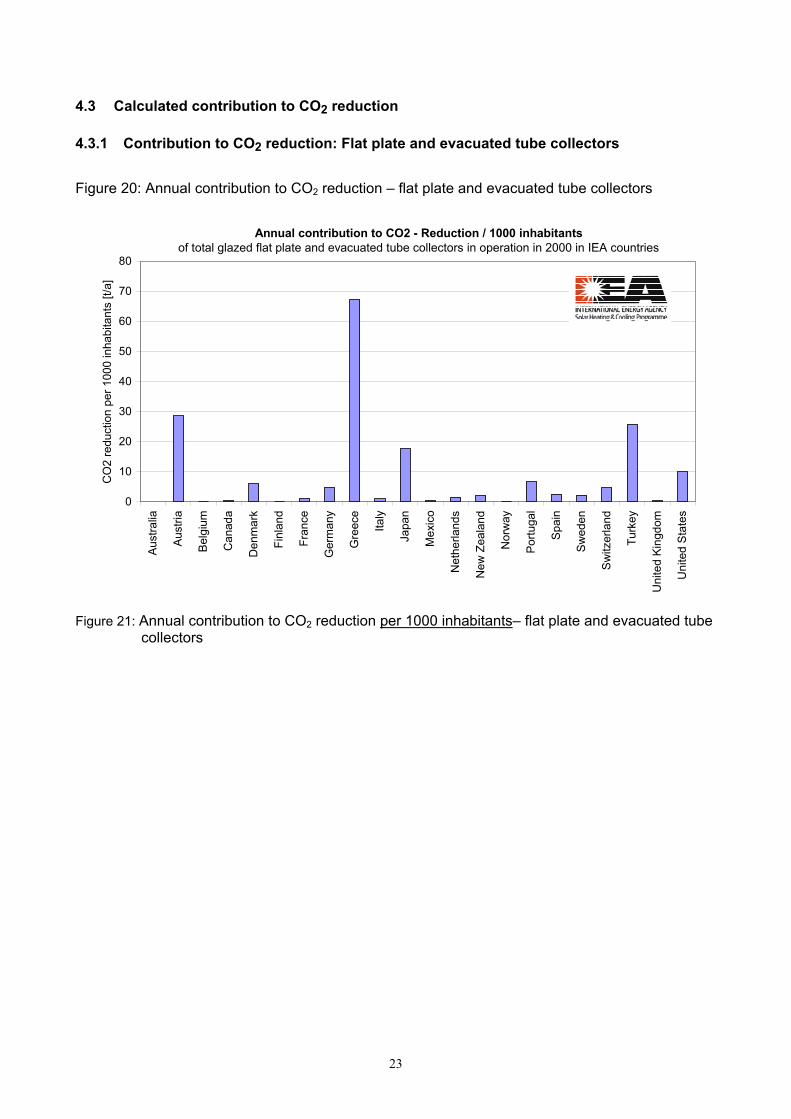
Figure 20: Annual contribution to CO2 reduction – flat plate and evacuated tube collectors
Annual contribution to CO2 - Reduction / 1000 inhabitantsof total glazed flat plate and evacuated tube collectors in operation in 2000 in IEA countries
0
10
20
30
40
50
60
70
80
Aust
ralia
Aust
ria
Belg
ium
Can
ada
Den
mar
k
Finl
and
Fran
ce
Ger
man
y
Gre
ece
Italy
Japa
n
Mex
ico
Net
herla
nds
New
Zea
land
Nor
way
Portu
gal
Spai
n
Swed
en
Switz
erla
nd
Turk
ey
Uni
ted
King
dom
Uni
ted
Stat
es
CO
2 re
duct
ion
per 1
000
inha
bita
nts
[t/a]
Figure 21: Annual contribution to CO2 reduction per 1000 inhabitants– flat plate and evacuated tube
collectors
23

4.3.2 Contribution to CO2 reduction: Unglazed collectors
Annual contribution to CO2 reduction of total unglazed collectors in operation in 2000 in IEA countries
0
200,000
400,000
600,000
800,000
1,000,000
1,200,000
1,400,000
1,600,000
1,800,000
2,000,000
Aust
ralia
Aust
ria
Belg
ium
Can
ada
Den
mar
k
Finl
and
Fran
ce
Ger
man
y
Gre
ece
Italy
Japa
n
Mex
ico
Net
herla
nds
New
Zea
land
Nor
way
Portu
gal
Spai
n
Swed
en
Switz
erla
nd
Turk
ey
Uni
ted
King
dom
Uni
ted
Stat
es
CO
2 re
duct
ion
[t/a]
Figure 22: Annual contribution to CO2 reduction – unglazed collectors
Annual contribution to CO2 reduction of total unglazed collectors in operation in 2000 in IEA countries per 1000 inhabitants
0
1
2
3
4
5
6
7
Aust
ralia
Aust
ria
Belg
ium
Can
ada
Den
mar
k
Finl
and
Fran
ce
Ger
man
y
Gre
ece
Italy
Japa
n
Mex
ico
Net
herla
nds
New
Zea
land
Nor
way
Portu
gal
Spai
n
Swed
en
Switz
erla
nd
Turk
ey
Uni
ted
King
dom
Uni
ted
Stat
es
CO
2 re
duct
ion
per 1
000
inha
bita
nts
[t/a]
Figure 23: Annual contribution to CO2 reduction per 1000 inhabitants – unglazed collectors
24
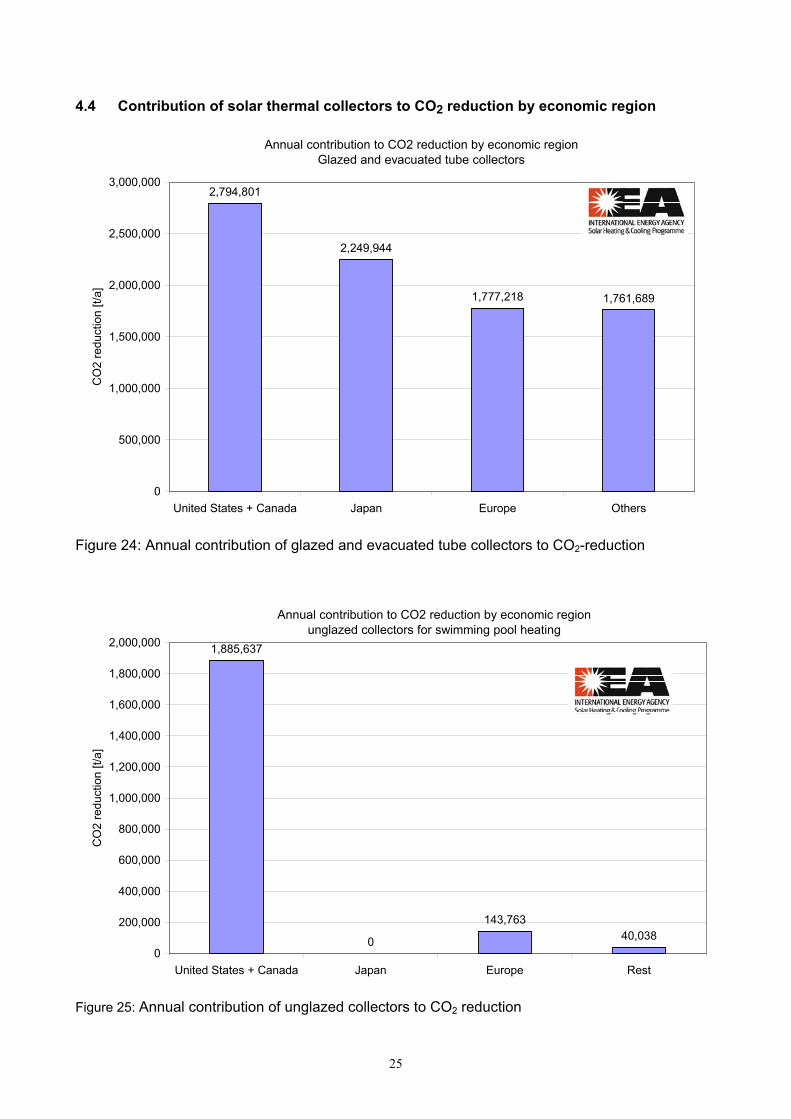
4.4 Contribution of solar thermal collectors to CO2 reduction by economic region
Annual contribution to CO2 reduction by economic region Glazed and evacuated tube collectors
2,794,801
2,249,944
1,777,218 1,761,689
0
500,000
1,000,000
1,500,000
2,000,000
2,500,000
3,000,000
United States + Canada Japan Europe Others
CO
2 re
duct
ion
[t/a]
Figure 24: Annual contribution of glazed and evacuated tube collectors to CO2-reduction
Annual contribution to CO2 reduction by economic regionunglazed collectors for swimming pool heating
1,885,637
0
143,76340,038
0
200,000
400,000
600,000
800,000
1,000,000
1,200,000
1,400,000
1,600,000
1,800,000
2,000,000
United States + Canada Japan Europe Rest
CO
2 re
duct
ion
[t/a]
Figure 25: Annual contribution of unglazed collectors to CO2 reduction
25
5 APPENDIX 5.1 Reference systems To make the simulations to determine the energy output of a solar thermal heating system, it was necessary to define reference systems for different applications and countries (regions). Based on the reference systems, hot water demand, heat load (only for solar combisystems5) and weather data, the energy output of the systems and the resulting energy savings in oil equivalent were calculated. For the simulations, four major applications and reference systems—described in section 4—were chosen. For these reference systems, the daily hot water demand, the heat demand (only for solar combisystems) and the weather data (location) were defined. The reference systems, are those systems most common in the respective country. The following tables describe the key data of the reference systems in different countries, the location of the reference climate used and the share of the total collector area6 in use for the respective application. Furthermore, a hydraulic scheme is shown for each reference system.
5 Solar combisystems are solar heating installations providing space heating as well as domestic hot water for the inhabitants of the building. The primary energy sources are solar energy as well as an auxiliary source such as biomass, gas, oil and electricity. 6 Glazed flat plate and evacuated tube collector
26

5.1.1 Solar thermal systems for swimming pool heating with unglazed plastic absorbers Country reference system Total collector area
[m²] number of systems reference climate
Australia C: 200 m² unglazed plastic absorber n.a. n.a. Sydney Austria C: 200 m² unglazed plastic absorber 571,806 2,859 Graz Belgium C: 200 m² unglazed plastic absorber 21,875 109 Brussels Canada C: 200 m² unglazed plastic absorber 493,000 2,465 Montreal Denmark C: 200 m² unglazed plastic absorber 15,563 78 Copenhagen Finland C: 200 m² unglazed plastic absorber 0 0 Helsinki France C: 200 m² unglazed plastic absorber 84,500 423 Paris Germany C: 200 m² unglazed plastic absorber 615,000 3,075 Würzburg Italy C: 200 m² unglazed plastic absorber 20,000 100 Bologna Japan C: 200 m² unglazed plastic absorber n.a. n.a. Tokyo Mexico C: 200 m² unglazed plastic absorber 283,800 1,419 Mexico City Netherlands C: 200 m² unglazed plastic absorber 100,305 502 Amsterdam New Zealand C: 200 m² unglazed plastic absorber n.a. n.a. Wellington Norway C: 200 m² unglazed plastic absorber 500 3 Oslo Portugal C: 200 m² unglazed plastic absorber 1,000 5 Lisbon Spain C: 200 m² unglazed plastic absorber n.a. n.a. Madrid Sweden C: 200 m² unglazed plastic absorber 30,000 150 Gothenburg Switzerland C: 200 m² unglazed plastic absorber 221,200 1,106 Zurich United Kingdom C: 200 m² unglazed plastic absorber 0 0 London United States C: 200 m² unglazed plastic absorber 14,513,000 72,565 Denver
Los Angeles C: collector area
Figure 1: Hydraulic scheme of the swimming pool reference system
27

5.1.2 Solar domestic hot water systems for single family houses Country reference system reference climate %
of total market7
Australia C: 4 m² / ST: 300 l / HWD: 150 l/d / TS Sydney 90 Austria C: 6 m² / ST: 300 l / HWD: 150 l/d / PS Graz 77 Belgium C: 4 m² / ST: 200 l / HWD: 150 l/d / PDS Brussels 100 Canada C: 6 m² / ST: 300 l / HWD: 150 l/d / PS Montreal 95 Denmark C: 4 m² / ST: 200 l / HWD: 150 l/d / PS Copenhagen 90 Finland C: 4 m² / ST: 200 l / HWD: 150 l/d / PS Helsinki 95 France C: 4 m² / ST: 200 l / HWD: 150 l/d / PS Paris 95 Germany C: 6 m² / ST: 300 l / HWD: 150 l/d / PS Würzburg 80 Greece C: 4 m² / ST: 200 l / HWD: 150 l/d / PS Athens 100 Italy C: 4 m² / ST: 200 l / HWD: 150 l/d / PS Bologna 100 Japan C: 4 m² / ST: 200 l / HWD: 150 l/d / PS Tokyo 96 Mexico C: 4 m² / ST: 200 l / HWD: 150 l/d / PS Mexico City 28 Netherlands C: 2 m² / ST: 150 l / HWD: 150 l/d / PDS Amsterdam 90 New Zealand C: 4 m² / ST: 300 l / HWD: 150 l/d / TS Wellington 95 Norway C: 6 m² / ST: 300 l / HWD: 150 l/d / PS Oslo 98 Portugal C: 4 m² / ST: 200 l / HWD: 150 l/d / TS Lisbon 95 Spain C: 4 m² / ST: 200 l / HWD: 150 l/d / TS Madrid 95 Sweden C: 6 m² / ST: 300 l / HWD: 150 l/d / PS Gothenburg 25 Switzerland C: 6 m² / ST: 300 l / HWD: 150 l/d / PS Zurich 80 Turkey C: 4 m² / ST: 200 l / HWD: 150 l/d / PS Istanbul 90 United Kingdom C: 4 m² / ST: 200 l / HWD: 150 l/d / PS London 100 United States C: 6 m² / ST: 300 l / HWD: 150 l/d / PS Denver
Los Angeles 100
C collector area ST hot water storage HWD hot water demand / day with 60°C TS thermosiphon system PS pumped system PDS pumped, drain back system
Figure 2: Hydraulic scheme of the DHW reference system
7 percentage of total installed collector area (flat plate and vacuum tube) by the year 2000 for DHW systems for single family houses
28
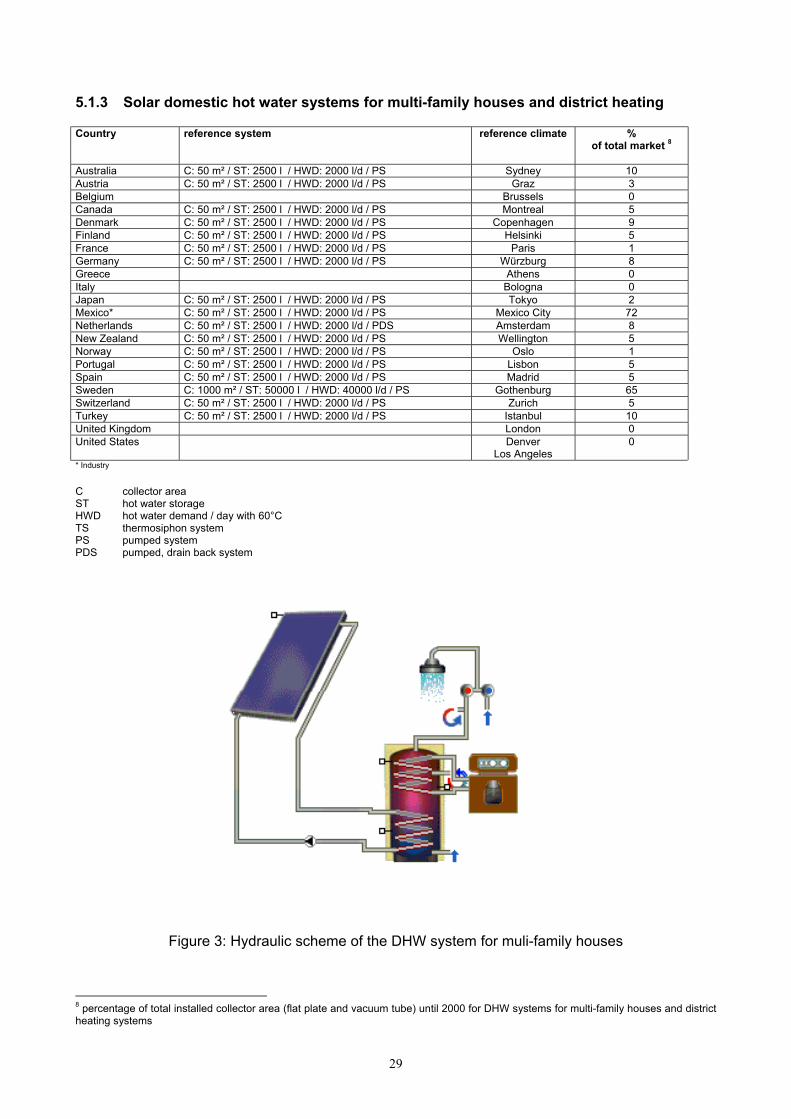
5.1.3 Solar domestic hot water systems for multi-family houses and district heating Country reference system reference climate %
of total market 8
Australia C: 50 m² / ST: 2500 l / HWD: 2000 l/d / PS Sydney 10 Austria C: 50 m² / ST: 2500 l / HWD: 2000 l/d / PS Graz 3 Belgium Brussels 0 Canada C: 50 m² / ST: 2500 l / HWD: 2000 l/d / PS Montreal 5 Denmark C: 50 m² / ST: 2500 l / HWD: 2000 l/d / PS Copenhagen 9 Finland C: 50 m² / ST: 2500 l / HWD: 2000 l/d / PS Helsinki 5 France C: 50 m² / ST: 2500 l / HWD: 2000 l/d / PS Paris 1 Germany C: 50 m² / ST: 2500 l / HWD: 2000 l/d / PS Würzburg 8 Greece Athens 0 Italy Bologna 0 Japan C: 50 m² / ST: 2500 l / HWD: 2000 l/d / PS Tokyo 2 Mexico* C: 50 m² / ST: 2500 l / HWD: 2000 l/d / PS Mexico City 72 Netherlands C: 50 m² / ST: 2500 l / HWD: 2000 l/d / PDS Amsterdam 8 New Zealand C: 50 m² / ST: 2500 l / HWD: 2000 l/d / PS Wellington 5 Norway C: 50 m² / ST: 2500 l / HWD: 2000 l/d / PS Oslo 1 Portugal C: 50 m² / ST: 2500 l / HWD: 2000 l/d / PS Lisbon 5 Spain C: 50 m² / ST: 2500 l / HWD: 2000 l/d / PS Madrid 5 Sweden C: 1000 m² / ST: 50000 l / HWD: 40000 l/d / PS Gothenburg 65 Switzerland C: 50 m² / ST: 2500 l / HWD: 2000 l/d / PS Zurich 5 Turkey C: 50 m² / ST: 2500 l / HWD: 2000 l/d / PS Istanbul 10 United Kingdom London 0 United States Denver
Los Angeles 0
* Industry C collector area ST hot water storage HWD hot water demand / day with 60°C TS thermosiphon system PS pumped system PDS pumped, drain back system
Figure 3: Hydraulic scheme of the DHW system for muli-family houses
8 percentage of total installed collector area (flat plate and vacuum tube) until 2000 for DHW systems for multi-family houses and district heating systems
29

5.1.4 Solar combisystems for domestic hot water and space heating (one family house with 140 m² gross area)
Country reference system reference climate % of total market9
Australia Sydney 0 Austria C: 20 m² / ST: 2000 l / HWD: 160 l/d /
SHD: 80 kWh/m² / PS Graz 20
Belgium C: 4 m² / ST 240 l / HWD: 160 l/d SHD: 80 kWh/m² / PDS
Brussels
0
Canada Montreal 0 Denmark C: 15 m² / ST: 800 l / HWD: 160 l/d
SHD: 80 kWh/m² / PS Copenhagen
1
Finland C: 8m² / ST: 300 l / HWD: 160 l/d SHD: 100 kWh/m² / PS
Helsinki
0
France C: 15 m² / ST: 250 l / HWD: 160 l/d SHD: 80 kWh/m² / PS
Paris
4
Germany C: 12 m² / ST: 750 l / HWD: 160 l/d SHD: 80 kWh/m² / PS
Würzburg
12
Greece Athens 0 Italy Bologna 0 Japan Tokyo 2 Mexico Mexico City 0 Netherlands C: 4 m² / ST 240 l / HWD: 160 l/d
SHD: 80 kWh/m² / PDS Amsterdam 2
New Zealand Wellington 0 Norway C: 10 m² / ST: 1500 l / HWD: 160 l/d
SHD: 100 kWh/m² / PS Oslo
1
Portugal Lisbon 0 Spain Madrid 0 Sweden C: 12 m² / ST: 1000 l / HWD: 160 l/d
SHD: 100 kWh/m² / PS Gothenburg
10
Switzerland C: 15 m² / ST: 1000 l / HWD: 160 l/d SHD: 80 kWh/m² / PS
Zurich
15
Turkey Instanbul 0 United Kingdom London 0 United States Denver
Los Angeles
0 C collector area ST hot water storage TS thermosiphon system PS pumped system PDS pumped, drain back system HWD hot water demand / day with 60°C SHD space heat demand [kWh/m² a]
Figure 4: Hydraulic scheme of the solar combi reference system
9 percentage of total installed collector area (flat plate and vacuum tube) until 2000 for solar combisystems
30

5.2 Reference collector Data of the reference absorber for swimming pool heating η = 0.85 a1 = 20 [W/m²K] a2 = 0.1 [W/m² K²] Data of the reference collector for all other applications: η = 0.8 a1 = 3.69 [W/m²K] a2 = 0.007 [W/m² K²] 5.3 Reference climates
Country Used reference climate10 Australia Sydney Austria Graz Belgium Brussels Canada Montreal Denmark Copenhagen Finland Helsinki France Paris Germany Würzburg Italy Bologna Japan Tokyo Mexico Mexico City Netherlands Amsterdam New Zealand Wellington Norway Oslo Portugal Lisbon Spain Madrid Sweden Gothenburg Switzerland Zurich United Kingdom London United States Denver
Los Angeles
10 Meteonorm
31
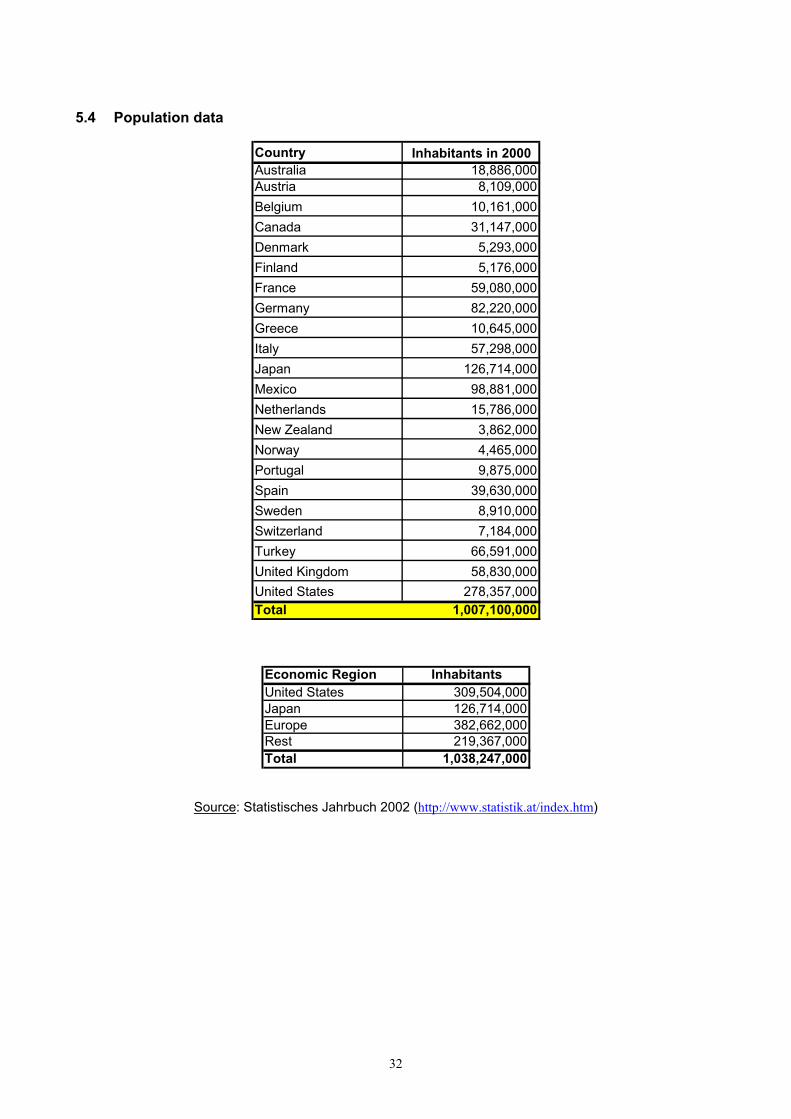
5.4 Population data
Country Inhabitants in 2000Australia 18,886,000Austria 8,109,000Belgium 10,161,000Canada 31,147,000Denmark 5,293,000Finland 5,176,000France 59,080,000Germany 82,220,000Greece 10,645,000Italy 57,298,000Japan 126,714,000Mexico 98,881,000Netherlands 15,786,000New Zealand 3,862,000Norway 4,465,000Portugal 9,875,000Spain 39,630,000Sweden 8,910,000Switzerland 7,184,000Turkey 66,591,000United Kingdom 58,830,000United States 278,357,000Total 1,007,100,000
Economic Region InhabitantsUnited States 309,504,000Japan 126,714,000Europe 382,662,000Rest 219,367,000Total 1,038,247,000
Source: Statistisches Jahrbuch 2002 (http://www.statistik.at/index.htm)
32
5.5 References to reports or persons that have supplied the market data The following persons and members of the Executive Committee of the IEA Solar Heating and Cooling Programme supplied the market data (installed collector area) and the reference systems for their respective countries: Australia Ballinger, John
Solar Efficient Architecture, Kanogroo Valley
Austria Faninger, Gerhard IFF-University of Klagenfurt, Klagenfurt
Belgium De Herde, André Université Catholique de Louvain, Lauvain-la-Neuve
Canada Mc Clenahan, Doug CANMET - Natural resources Canada, Ottawa
Denmark Kristensen, Poul E. Virum
Finland Lund, Peter Helsinki University of Technology, Espoo
France Loyen, Richard ASSOCIATION DE PROFESSIONNELS POUR LE DEVELOPPEMENT DES ÉNERGIES RENOUVELABLES, CASTELLET
Germany Stry-Hipp, Gerhard German Solar Industry Association – DFS, Freiburg
Greece Stry-Hipp, Gerhard German Solar Industry Association – DFS, Freiburg
Italy Zampetti, Paolo ENEA, Rome
Japan Yoshimura, Kazuki National Institute of Advanced Industrial Science and Technology, Nagoya
Mexico Pilatowsky, Isaac Centro de Investigacion en Energia, Temixco, Morelos
Netherlands Bosselaar, Lex NOVEM, Utrecht
New Zealand Donn, Michael School of Architecture, Wellington
Norway Salvesen, Fritjof KanEnergi AS, 1351 Rud
Portugal Farinha Mendes, João INETI - Edificio G, Lisbon
Spain Delgado, Maria Luisa CIEMAT, Madrid
Sweden Dalenbäck, Jan-Olof Chalmers University of Technology, Göteborg
33

34
Switzerland Wolfer, Urs Bundesamt für Energie, Bern
Turkey Erkul, Gulsun First Secretary (Energy Adviser), Permanent Delegation of Turkey to the OECD
United Kingdom Stry-Hipp, Gerhard German Solar Industry Association – DFS, Freiburg
United States Crawley, Drury U.S. Department of Energy, EE-41, Washington D.C.
Reports Active Solar Thermal Industry Group (ASTIG): Solar Thermal Markets in Europe, Brussels, March, 2002 European Solar Industry Federation (ESIF)/European Commission: Sun in action - The solar thermal
market - A strategic plan for action in Europe, Office for Official Publications of the European Communities, Luxembourg, 1996
Faninger, Gerhard.: Der Solarmarkt in Österreich 2001, Bundesverband SOLAR in WKO and IFF-
Universität Klagenfurt, Klagenfurt, 2002 Stry-Hipp, Gerhard: Der europäische Solarthermiemarkt, German Solar Industry Association – DFS,
Freiburg, published at the 5th international symposium Gleisdorf SOLAR , Gleisdorf, Austria, September 2000
SOFAS: Markterhebung Sonnenenergie 2001, Teilstatistik der Schweizerischen Statistik der erneuerbaren
Energien, Bundesamt für Energie, Bern, Mai, 2002 U.S. Department of Energy: Renewable Energy Annuals 1995-2001, Energy Information Administration,
Office of Coal, Nuclear, Electric and Alternate Fuels, Washington D.C., March 2001
Top Related