


Languages
Pages
Legal


© OECD/IEA 2015
Solar process heat: the IEA scenarios
Cédric Philibert
Renewable Energy Division
International Energy Agency
SHIP 2015 – Montpellier – 15 September 2015

© OECD/IEA 2014 Medium-Term Renewable Energy Market Report 2014
Renewable electricity projected to scale up by 45% from 2013 to 2020
Strong momentum for renewable electricity
Global renewable electricity production, historical and projected
0%
5%
10%
15%
20%
25%
30%
5001 0001 5002 0002 5003 0003 5004 0004 5005 0005 5006 0006 5007 0007 500
2005 2006 2007 2008 2009 2010 2011 2012 2013 2014 2015 2016 2017 2018 2019 2020
TW
h
Hydropower Bioenergy Onshore wind
Offshore wind Solar PV Geothermal
STE/CSP Ocean % total generation (right axis)
Historical data and estimates Forecast
Natural gas
2013Nuclear
2013
© OECD/IEA 2014 Medium-Term Renewable Energy Market Report 2014
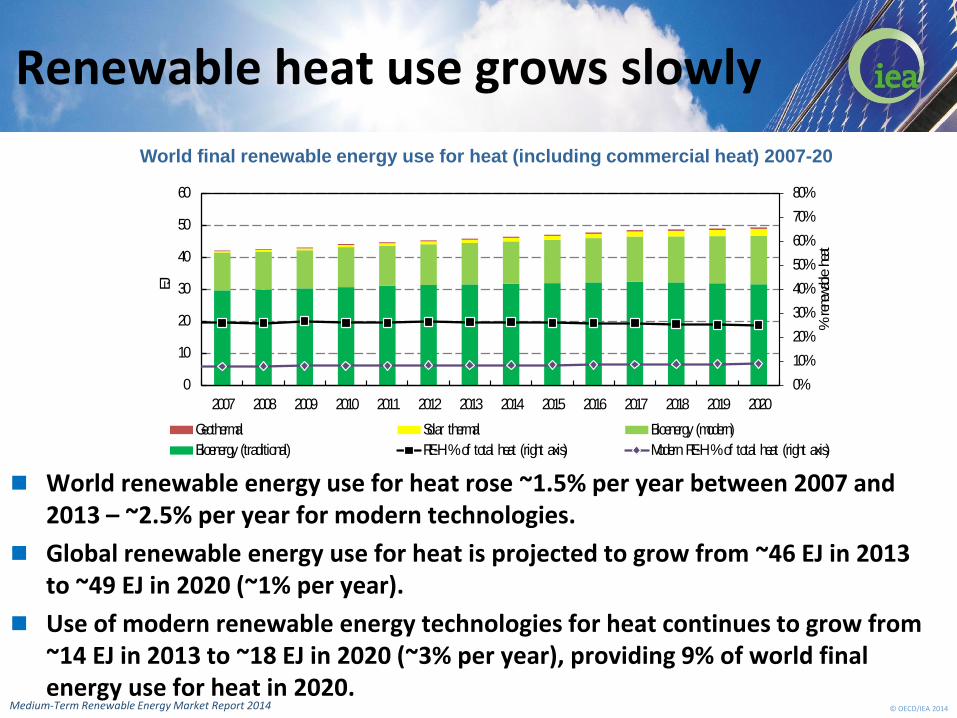
Renewable heat use grows slowly
World renewable energy use for heat rose ~1.5% per year between 2007 and 2013 – ~2.5% per year for modern technologies.
Global renewable energy use for heat is projected to grow from ~46 EJ in 2013 to ~49 EJ in 2020 (~1% per year).
Use of modern renewable energy technologies for heat continues to grow from ~14 EJ in 2013 to ~18 EJ in 2020 (~3% per year), providing 9% of world final energy use for heat in 2020.
.
World final renewable energy use for heat (including commercial heat) 2007-20
0%
10%
20%
30%
40%
50%
60%
70%
80%
0
10
20
30
40
50
60
2007 2008 2009 2010 2011 2012 2013 2014 2015 2016 2017 2018 2019 2020
% r
enew
able h
eat
EJ
Geothermal Solar thermal Bioenergy (modern)
Bioenergy (traditional) RE-H % of total heat (right axis) Modern RE-H % of total heat (right axis)

© OECD/IEA 2014 Medium-Term Renewable Energy Market Report 2014
Policy support still limited
Broader adoption of support policies for renewable heat could reduce energy consumption and enhance energy security
Low oil prices likely more detrimental to renewable heat
Countries with targets and support policies for renewable heat
This map is without prejudice to the status of or sovereignty over any territory to the delimitation of international frontiers and boundaries and to the name of any territory, city or area.

© OECD/IEA 2014
But stakes are high
© OECD/IEA 2015 5
Direct energy-related CO2 emissions from industry
second to power (2014)

© OECD/IEA 2014
Fossil fuels dominate industrial energy use
© OECD/IEA 2015 6
Final energy demand by
sub-sectors
Final industrial energy supply by
sources

© OECD/IEA 2014
Solar heat for industry is not a new concept
1907,
Egypt
(Shuman)
2014,
Morocco
(Italcementi)

© OECD/IEA 2014
Solar heat for industry is not a new concept
1949,
France
(F. Trombe)
© OECD/IEA 2010 © IEA/OECD 2010
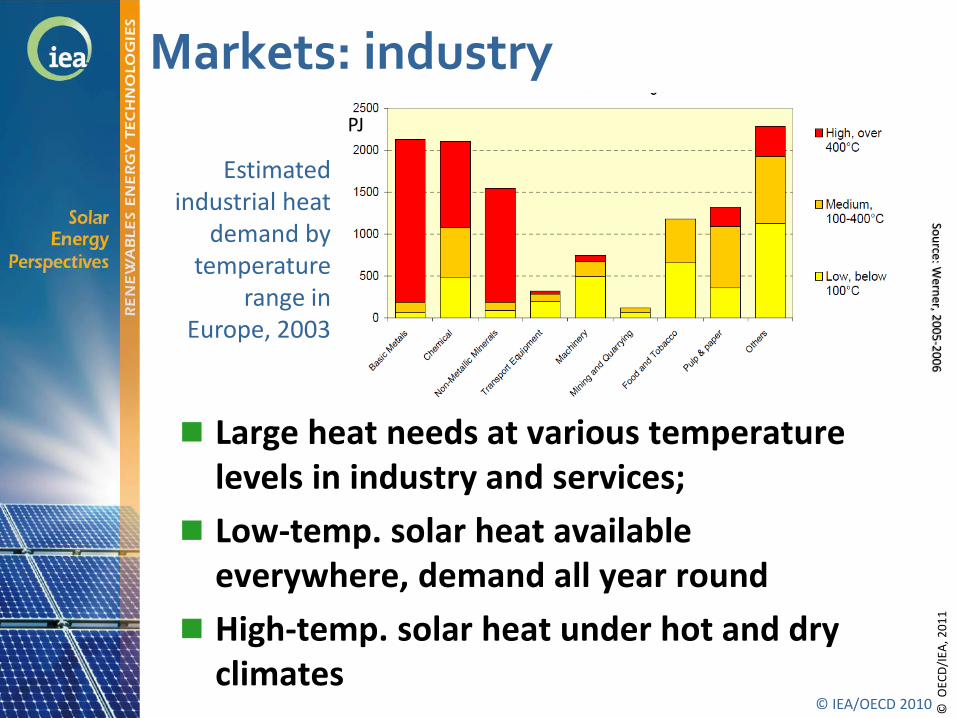
Markets: industry
Large heat needs at various temperature levels in industry and services;
Low-temp. solar heat available everywhere, demand all year round
High-temp. solar heat under hot and dry climates
Estimated industrial heat
demand by temperature
range in Europe, 2003
© O
ECD
/IEA
, 20
11
Sou
rce: Wern
er, 20
05
-20
06
PJ
© OECD/IEA 2010 © IEA/OECD 2010
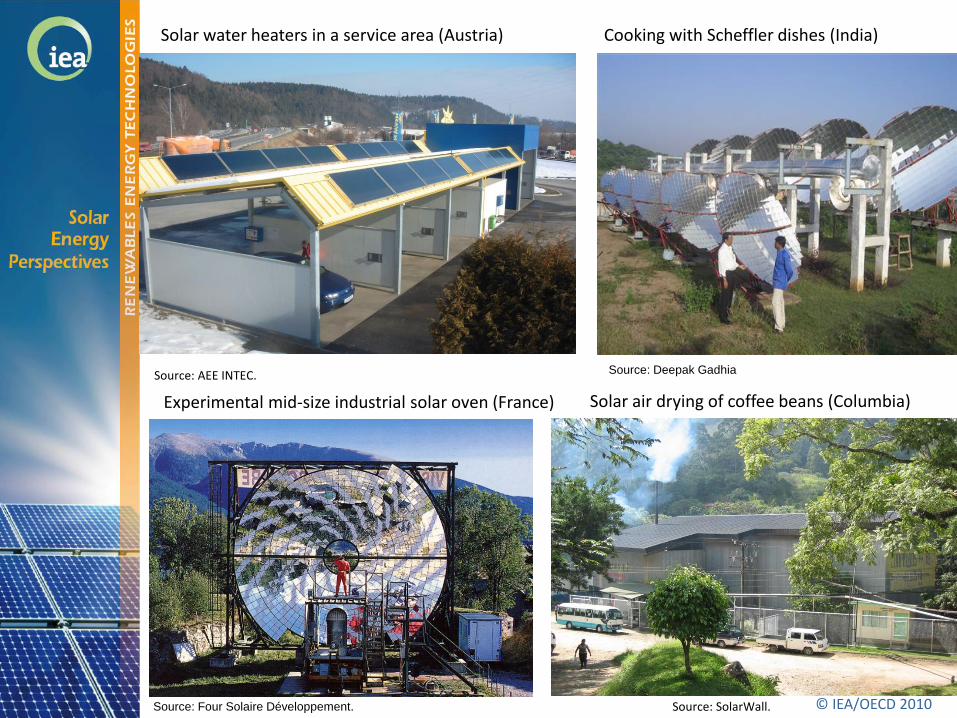
Source: AEE INTEC. Source: Deepak Gadhia
Solar water heaters in a service area (Austria) Cooking with Scheffler dishes (India)
Source: SolarWall.
Solar air drying of coffee beans (Columbia)Experimental mid-size industrial solar oven (France)
Source: Four Solaire Développement.
© OECD/IEA 2015
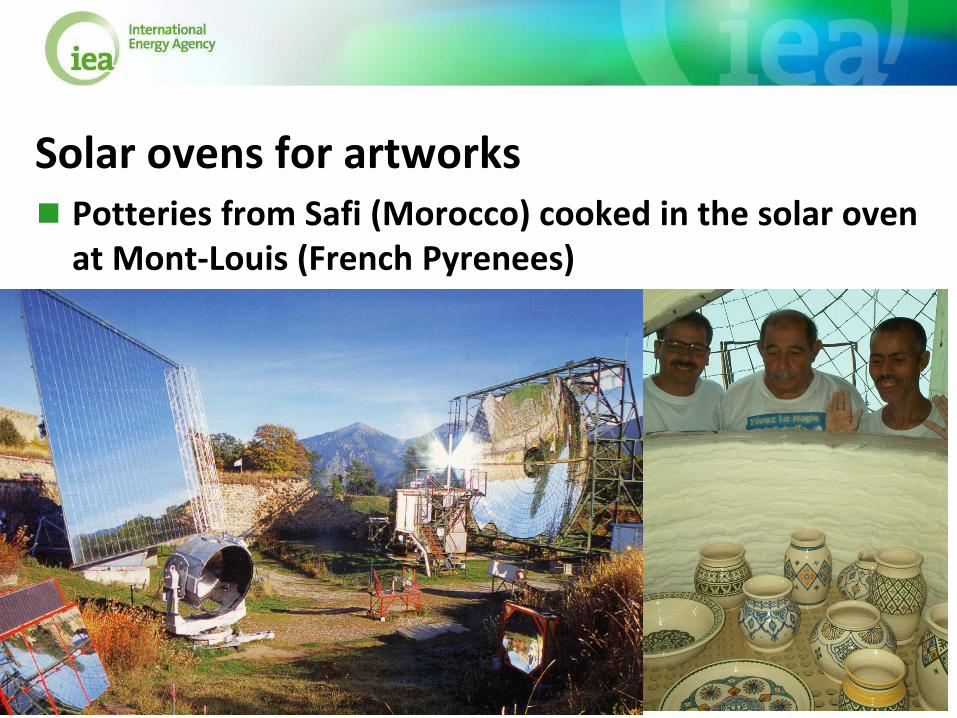
Solar ovens for artworks Potteries from Safi (Morocco) cooked in the solar oven
at Mont-Louis (French Pyrenees)

© OECD/IEA 2015
Roadmap vision of solar heating and cooling
Solar heating and cooling capacity could produce annually by 2050: - 16.5 EJ solar heat (16% of TFE low temp. heat)
- Of which, >7 EJ of low-temp. solar industrial process heat- 1.5 EJ solar cooling (17% of TFE cooling)
7.2 EJ/a
8.9 EJ/a
1.5 EJ/a
0.4 EJ/a
Source: IEA Technology Roadmap – Solar Heating & Cooling
© OECD/IEA 2014
0
2000
4000
6000
8000
10000
12000
14000
2012 2020 2030 2040 2050
Mt
CO
2
6DS
4DS
2DS
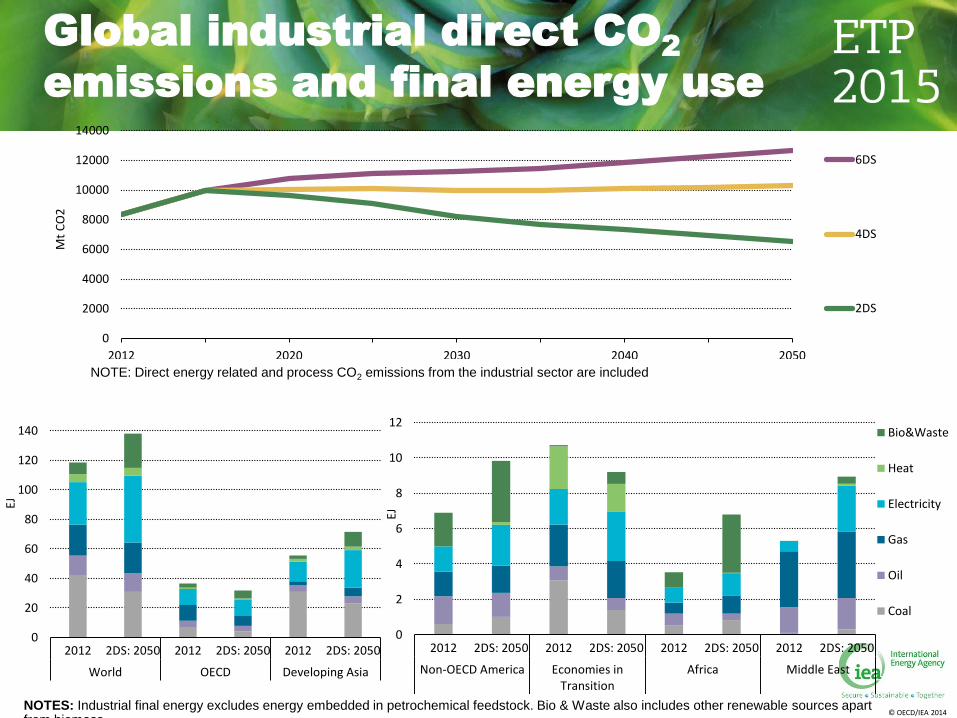
Global industrial direct CO2
emissions and final energy use
NOTE: Direct energy related and process CO2 emissions from the industrial sector are included
NOTES: Industrial final energy excludes energy embedded in petrochemical feedstock. Bio & Waste also includes other renewable sources apart from biomass.
0
20
40
60
80
100
120
140
2012 2DS: 2050 2012 2DS: 2050 2012 2DS: 2050
World OECD Developing Asia
EJ
0
2
4
6
8
10
12
2012 2DS: 2050 2012 2DS: 2050 2012 2DS: 2050 2012 2DS: 2050
Non-OECD America Economies inTransition
Africa Middle East
EJ
Bio&Waste
Heat
Electricity
Gas
Oil
Coal

© OECD/IEA 2014
Coal28%
Oil11%
Gas19%
Electricity 29%
Heat4%
Bio&Waste9%
Global industrial final
energy use mix
NOTES: In this presentation,
• Industrial final energy excludes energy embedded in petrochemical feedstock.
• Bio & Waste also includes other renewable sources apart from biomass.
Coal36%
Oil11%
Gas18%
Electricity 24%
Heat4%
Bio&Waste7%
2012
6DS: 2050
2DS: 2050
Coal22%
Oil9%
Gas15%
Electricity
33%
Heat4%
Bio&Waste
17%
0%
20%
40%
60%
80%
100%
Pchem feedstock
Biomass
Gas
Oil
Coal
0%
20%
40%
60%
80%
100%
Pchem feedstock
Biomass
Gas
Oil
Coal
0%
20%
40%
60%
80%
100%
Pchem feedstock
Biomass
Gas
Oil
Coal

© OECD/IEA 2014
Iron & Steel sector:
Renewable main options
Charcoal based Blast Furnaces
Electric Arc Furnaces based on renewable electricity
Iron ore reduction supported with hydrogen from renewable sources
Renewable based captive utilities
0,0
0,5
1,0
1,5
2,0
2,5
2012 2020 2030 2040 2050
GtC
O2
Energy efficiency
Natural gas - DRI
Recycling (increased scrap use)
Innovative processes
Direct CO2 emission savings 2DS vs 6DS
0%
20%
40%
60%
80%
100%
2012 2DS: 2050 2012 2DS: 2050 2012 2DS: 2050 2012 2DS: 2050 2012 2DS: 2050 2012 2DS: 2050 2012 2DS: 2050
World OECD Developing Asia Non-OECD America Economies inTransition
Africa Middle East
Biomass&Waste
Heat
Electricity
Gas
Oil
Coal

© OECD/IEA 2014
Cement sector: Renewable
main options
Fuel switching
Renewable based captive utilities
0,0
0,2
0,4
0,6
0,8
1,0
1,2
1,4
2012 2020 2030 2040 2050
GtC
O2
Energy efficiency
Fuel switching
Clinker substitutes
Innovative processes
Direct CO2 emission savings 2DS vs 6DS
0%
20%
40%
60%
80%
100%
2012 2DS: 2050 2012 2DS: 2050 2012 2DS: 2050 2012 2DS: 2050 2012 2DS: 2050 2012 2DS: 2050 2012 2DS: 2050
World OECD Developing Asia Non-OECD America Economies inTransition
Africa Middle East
Biomass&Waste
Heat
Electricity
Gas
Oil
Coal
© OECD/IEA 2014
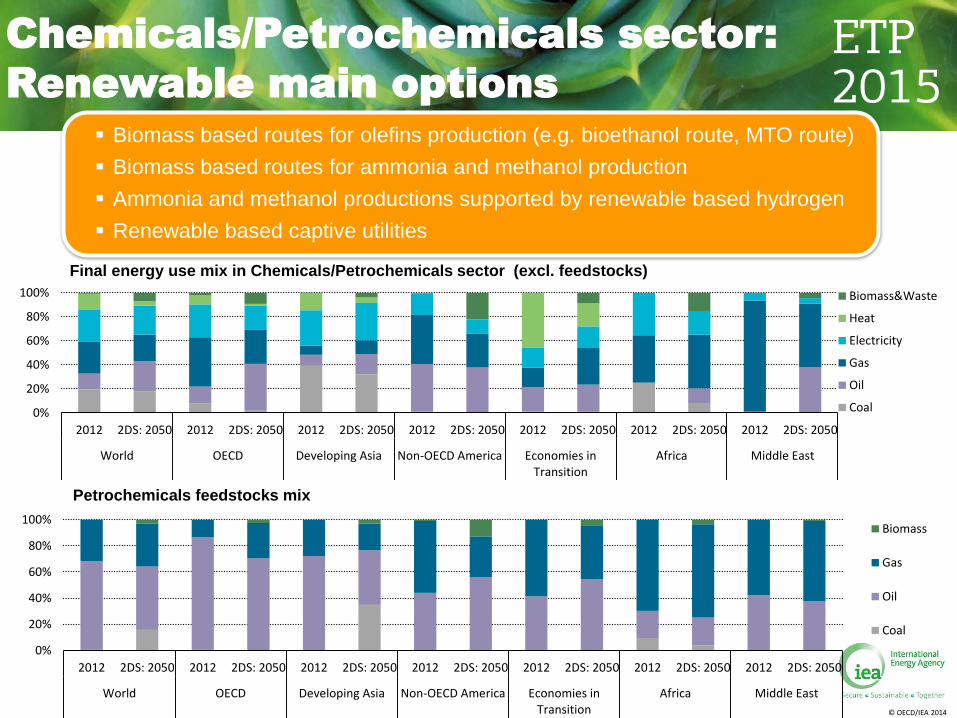
Chemicals/Petrochemicals sector:
Renewable main options
Biomass based routes for olefins production (e.g. bioethanol route, MTO route)
Biomass based routes for ammonia and methanol production
Ammonia and methanol productions supported by renewable based hydrogen
Renewable based captive utilities
0%
20%
40%
60%
80%
100%
2012 2DS: 2050 2012 2DS: 2050 2012 2DS: 2050 2012 2DS: 2050 2012 2DS: 2050 2012 2DS: 2050 2012 2DS: 2050
World OECD Developing Asia Non-OECD America Economies inTransition
Africa Middle East
Biomass&Waste
Heat
Electricity
Gas
Oil
Coal
0%
20%
40%
60%
80%
100%
2012 2DS: 2050 2012 2DS: 2050 2012 2DS: 2050 2012 2DS: 2050 2012 2DS: 2050 2012 2DS: 2050 2012 2DS: 2050
World OECD Developing Asia Non-OECD America Economies inTransition
Africa Middle East
Biomass
Gas
Oil
Coal
Final energy use mix in Chemicals/Petrochemicals sector (excl. feedstocks)
Petrochemicals feedstocks mix

© OECD/IEA 2014
Pulp & Paper sector:
Renewable main options
Bio-refinery developments: biomass based routes for chemicals and fuels production
Renewable based captive utilities
0%
20%
40%
60%
80%
100%
2012 2DS: 2050 2012 2DS: 2050 2012 2DS: 2050 2012 2DS: 2050 2012 2DS: 2050 2012 2DS: 2050 2012 2DS: 2050
World OECD Developing Asia Non-OECD America Economies inTransition
Africa Middle East
Biomass&Waste
Heat
Electricity
Gas
Oil
Coal

© OECD/IEA 2014
Non-energy intensive industrial
sector: Renewable main options
0
100
200
300
400
500
600
700
2012 2020 2030 2040 2050
g C
O2
/kW
h
6DS
4DS
2DS
Industrial operations based on renewable electricity
Renewable based captive utilities (e.g. opportunities for solar thermal for lower temperature heat demand applications and possible upgrade through heat pumps)
© OECD/IEA 2015
Renewable energies for manufacturing industries
REMI Workshop, 11-12 May 2015, IEA, Paris

© OECD/IEA 2014
Manufacting industries use ~ 30% of global energy
40% including feedstock, blast furnace and coke oven
Fossil fuels energy sources, feedstock, processing agents…
Some CO2 emissions linked to processes (e.g. steel, cement)
Demand would grow until 2050
by 83% in the 6DS scenario (ETP 2014)
By 40% in the 2DS scenario
Some substitution would occur
Biomass would grow from 6% to day to 13% in 2050 (2DS)
Electricity would grow from 24% today to 32% in 2050 (2DS)
A new in-depth technology study
© OECD/IEA 2015 21
© OECD/IEA 2014
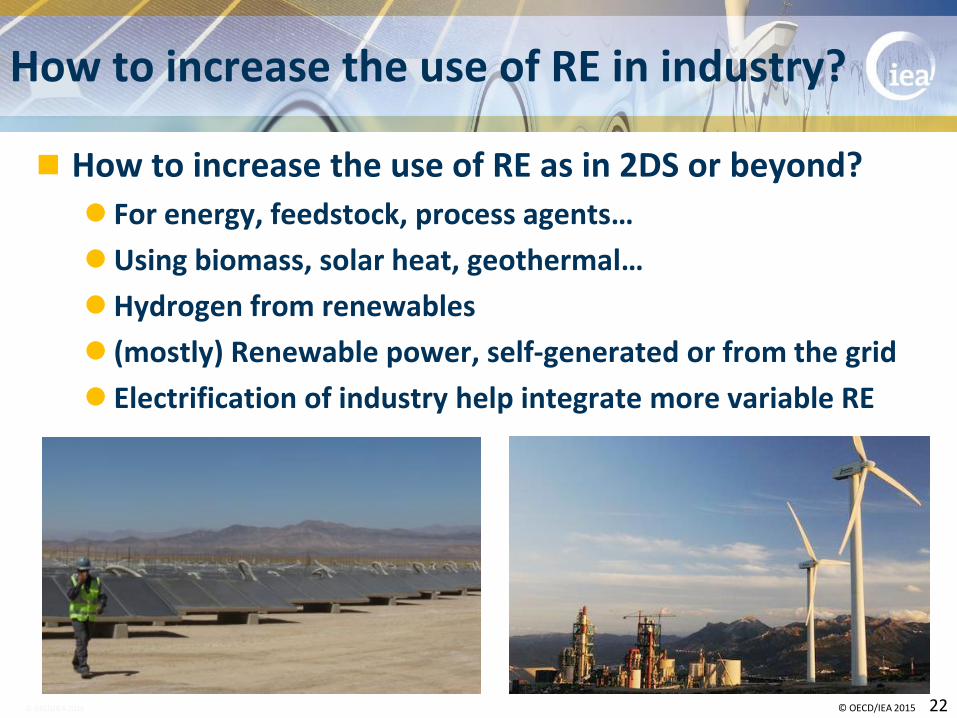
How to increase the use of RE in industry?
© OECD/IEA 2015 22
How to increase the use of RE as in 2DS or beyond?
For energy, feedstock, process agents…
Using biomass, solar heat, geothermal…
Hydrogen from renewables
(mostly) Renewable power, self-generated or from the grid
Electrification of industry help integrate more variable RE

© OECD/IEA 2014 Medium-Term Renewable Energy Market Report 2014
To conclude – where are the largest solar thermal systems
2011-12: University buildings, Riyadh, KSA, 25 MWth, 36 000 m2
2013: Copper recovery, Pampa Elvira, Chile, 27 MWth, 39 300 m2
2014: District heating, Vojens, Denmark, 37 MWth, 52 500 m2
2017: Industry, Mirrah, Oman, 1021 MWth, 3 million m2
Princess Nora Bint Abdul Rahman University in Riyadh

© OECD/IEA 2014 Medium-Term Renewable Energy Market Report 2014
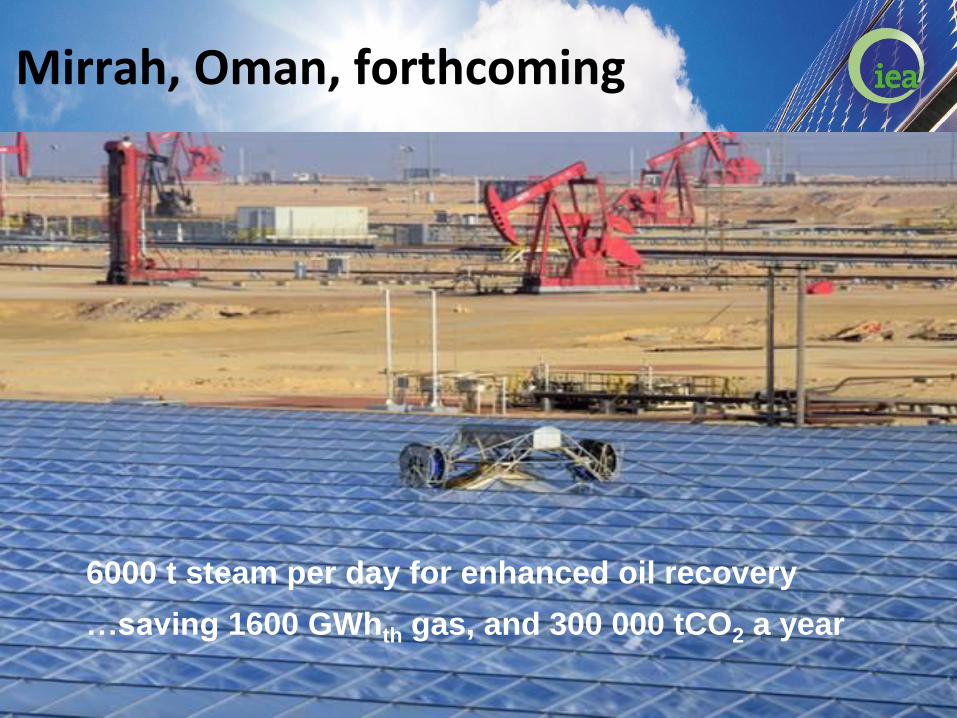
Mirrah, Oman, forthcoming
Parabolic
troughs
protected
from
soiling
…in a greenhouse
(Glasspoint technology)
© OECD/IEA 2014 Medium-Term Renewable Energy Market Report 2014
Mirrah, Oman, forthcoming
…saving 1600 GWhth gas, and 300 000 tCO2 a year
6000 t steam per day for enhanced oil recovery

© OECD/IEA 2014 Medium-Term Renewable Energy Market Report 2014
The IEA Technology roadmap for solar
heating and cooling: http://goo.gl/EtNX2J
The IEA Solar Heating and Cooling Initiative:
http://www.iea-shc.org/
Task 49 of the Solar Heating and Cooling
Initiative (common with the SolarPACES
Initiative): http://task49.iea-shc.org/
The Solar Heat for Industrial Processes
database: http://ship-plants.info/
Renewable Energies for Manufacturing
Industries: https://goo.gl/zqodvI
For more information
Top Related