


Languages
Pages
Legal


Socio-Economic and Energy Related Indicators
Riccardo Mereu
Dipartimento di Energia - Politecnico di Milano

R. Mereu
2
Basic rules for System Analysis
Socio-Economic Indicators
Energy related Indicators
Energy & Development: some examples
Contents
References:
World Bank, Little green data book, 2012-14
IAEA, Energy Indicators for Sustainable Development: Guidelines and Methodologies, 2005
UNDP, HDI, 2011-14
R. Mereu
3
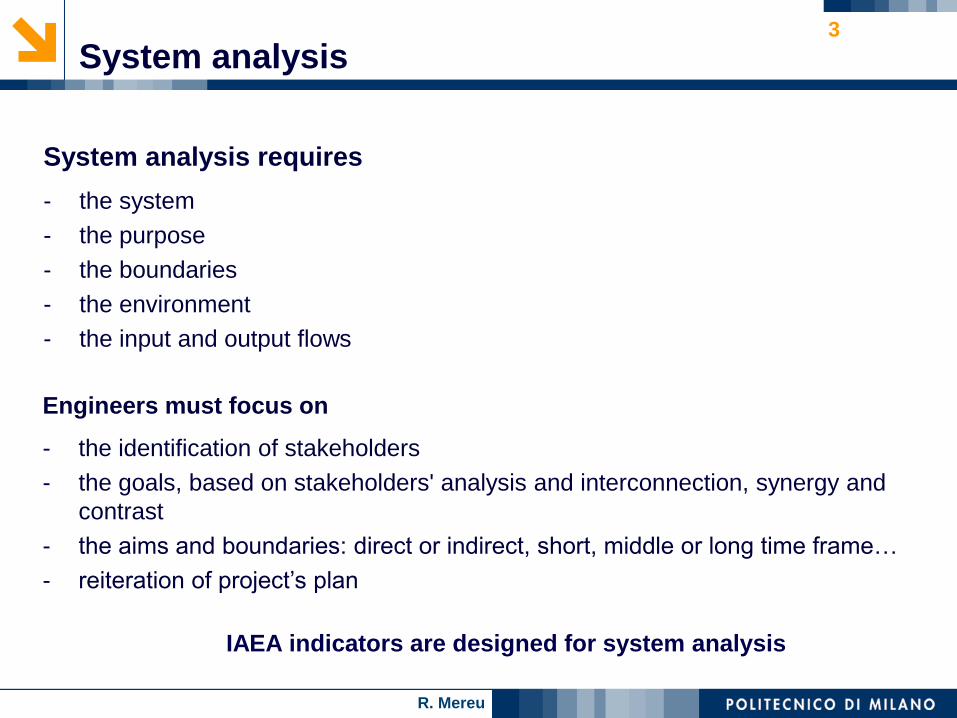
System analysis requires
- the system
- the purpose
- the boundaries
- the environment
- the input and output flows
Engineers must focus on
- the identification of stakeholders
- the goals, based on stakeholders' analysis and interconnection, synergy and
contrast
- the aims and boundaries: direct or indirect, short, middle or long time frame…
- reiteration of project’s plan
IAEA indicators are designed for system analysis
System analysis
R. Mereu
4
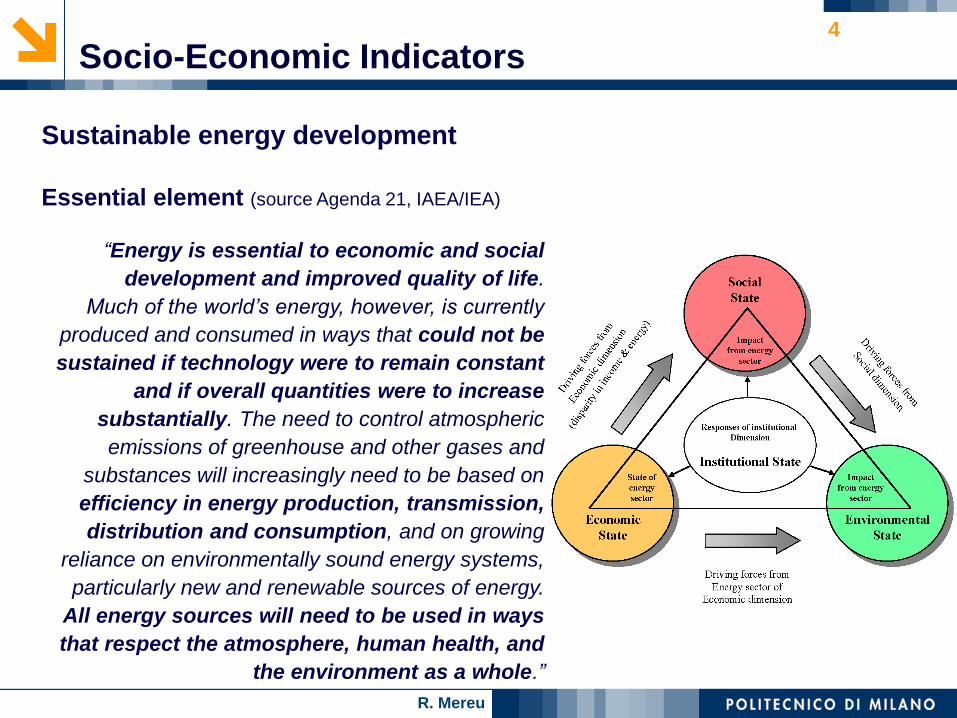
Sustainable energy development
Essential element (source Agenda 21, IAEA/IEA)
“Energy is essential to economic and social
development and improved quality of life.
Much of the world’s energy, however, is currently
produced and consumed in ways that could not be
sustained if technology were to remain constant
and if overall quantities were to increase
substantially. The need to control atmospheric
emissions of greenhouse and other gases and
substances will increasingly need to be based on
efficiency in energy production, transmission,
distribution and consumption, and on growing
reliance on environmentally sound energy systems,
particularly new and renewable sources of energy.
All energy sources will need to be used in ways
that respect the atmosphere, human health, and
the environment as a whole.”
Socio-Economic Indicators

R. Mereu
5
Socio-Economic Indicators
Some selected general and common indicators are here analyzed in order to give a first
idea of the different socio - economic situations in which they can be used for a system
analysis.
In this course the focus is on some socio-economic indicators closely related to energy:
Total population and Share of urban population
Gross Domestic Product (GDP) and Gross Domestic Product per capita
Human Development Index (HDI)
Socio-Economic Indicators

R. Mereu
6
Total Population and Share of urban population
Data about population are very important in the energy investigation because of the direct
proportionality between the country energy consumption and the number of persons.
Moreover the percentage of urban population is meaningful because of the higher energy
consumption per capita respect to the rural population and because of the shifting towards
“modern” energy vectors.
The urban population has higher energy consumption rather than the rural one, so the
country energy consumption is expected to rise in the next future for:
population growth
migration towards the urban area
the general increasing of the living quality standards
Important: The divide between rural and urban energy vectors and consumption is
stronger in the developing countries.
Socio-Economic Indicators

R. Mereu
7
Gross Domestic Product
The Gross Domestic Product (GDP) is one of the most common and wildly used economic
indicator. GDP is defined as:
GDP = C + I + G + X − M
where:
C: private consumption and personal expenditures of households such as food, rent, medical
expenses…
I: defined as investments by business or households in capital (no financial products).
G: government expenditures on final goods and services. It includes salaries of public servants,
purchase of weapons for the military, and any investment expenditure by a government.
X: gross exports.
M: gross imports.
The level of GDP in different countries may be compared through different ways. It is possible to
convert the value from the national currency according to:
the current currency exchange rate or
the purchasing power parity (PPP) exchange rate
Socio-Economic Indicators

R. Mereu
8
Gross Domestic Product per capita
The choice of the approach can have an heavy impact on the relative ranking of the analyzed
countries.
With the current currency exchange rate methodology GDP is calculated by exchange rates
prevailing on international currency markets.
This can offer better indications about the countries international purchasing power and
relative economic strength, becoming meaningful for high foreign dependency economy.
With the purchasing power parity of each currency relative to a selected standard (usually
the United States dollar) and fixed years (for data trends).
The purchasing power parity method shows the relative effective domestic purchasing
power of the average producer or consumer within the specific economy. This can be a
better indicator of the living standards of less-developed countries because it compensates for
the weakness of local currencies in world markets: with the PPP application the disparity in
GDP between high and low income countries decreases, as compared to the current
exchange rate method. This phenomenon is known as Penn Effect.
Socio-Economic Indicators

R. Mereu
9
Gross Domestic Product - Limits
It is important to highlight some limitation of GDP as wellness indicator:
does not take in account disparity in incomes between the rich and poor
includes works that do not produce net change or those resulting from repairing
damage. For example, rebuilding after a natural disaster or war may produce a
considerable amount of economic activity and increase the GDP value. The same results
happens when many people are sick and receive expensive treatment.
ignores externalities (such as damage to the environment) and the sustainability of
growth: a country may achieve a temporarily high GDP by over-exploiting natural resources.
estimates may not take into account the black market, where the money spent is not
registered, and the non-monetary economy in general.
However GDP can be used as a rough indicator of the economy situation of a country.
In the energy analysis GDP indicator is used because of the linkage between energy
demand and economy growth.
Socio-Economic Indicators

R. Mereu
10
Human Development Index
(Source UNDP )
Human Development is a development paradigm about the creation of an
environment in which people can develop their full potential and lead productive,
creative lives in accord with their needs and interests. People are the real wealth of
nations. Development is thus much more than economic growth, which is only a means
of enlarging people’s choices.
Fundamental for enlarging these choices is to build human capacities. These core
capacities for human development are:
Enjoying a long and healthy life
Being educated
Access to resources that enable people to live in dignity
Being able to participate in decisions that affect their community
Without these, many choices are simply not available, and many opportunities in
life remain inaccessible and the fight against poverty only a “chimera”
Socio-Economic Indicators

R. Mereu
11
Human Development Index
(Source UNDP )
This way of looking at development is not new: philosophers, economists and political
leaders have long emphasized human wellbeing as the purpose, the end, of
development.
As Aristotle said in ancient Greece, “Wealth is evidently not the good we are seeking, for
it is merely useful for the sake of something else.”
In seeking that something else, human development shares a common vision with
human rights. The goal is human freedom.
People must be free to exercise their choices and to participate in decision-making that
affects their lives.
Human development and human rights are mutually reinforcing, helping to secure
the well-being and dignity of all people, building self-respect and the respect of
others (fostering peace!)
Socio-Economic Indicators

R. Mereu
12
Human Development Index
One of the most meaningful social indicator is the HDI, that combines the normalized
measures of life expectancy, literacy, educational attainment, and GDP per capita for
countries worldwide.
With this index is possible to create a rank for different level of development. Country with
a HDI higher than 0.8 are considered High Human Developed,
a HDI between 0.5 and 0.8 are consider Medium Human Developed while
a HDI lower then 0.5 Low Human Developed countries.
Socio-Economic Indicators

R. Mereu
13
The HDI is build up as follows:
• Life Expectancy Index (LEI)
• Education Index (EI)
Adult Literacy Index (ALI)
Gross Enrollment Index (GEI)
• GDP Index (GDPindex)
Human Development index
Methodology
100
ALALI
GEI3
1ALI
3
2EI
2585
25LELEI
100
GEGEI
100log40000log
100logppp_GDPlogGDPindex
GDPindex3
1EI
3
1LEI
3
1HDI
valueminvaluemax
valueminvalueIndicator
Socio-Economic Indicators
R. Mereu
14
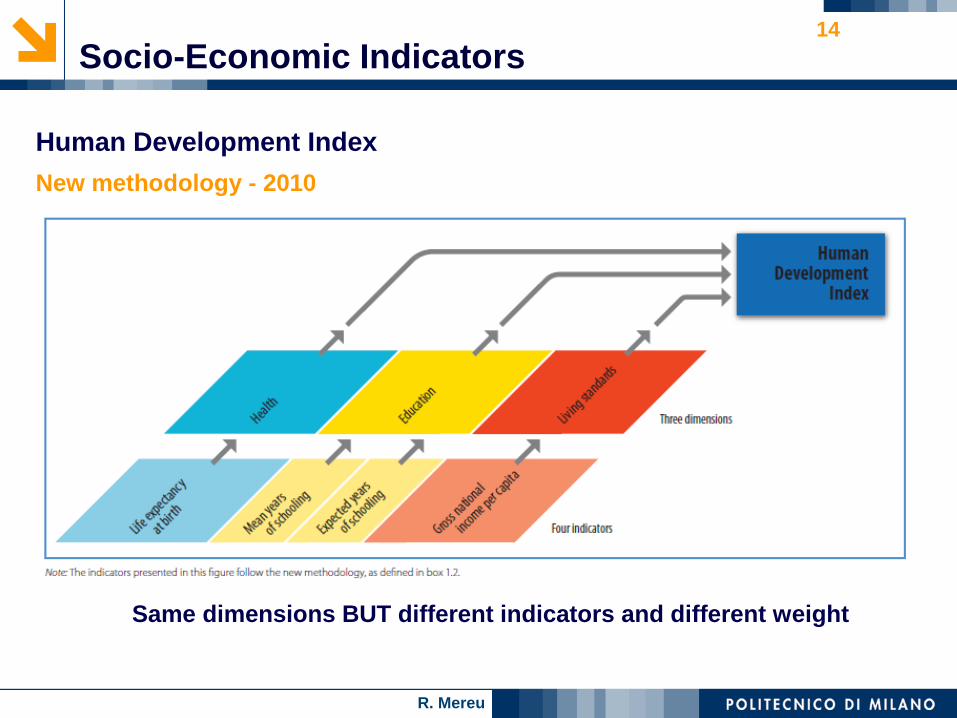
Human Development Index
New methodology - 2010
Same dimensions BUT different indicators and different weight
Socio-Economic Indicators
R. Mereu
15
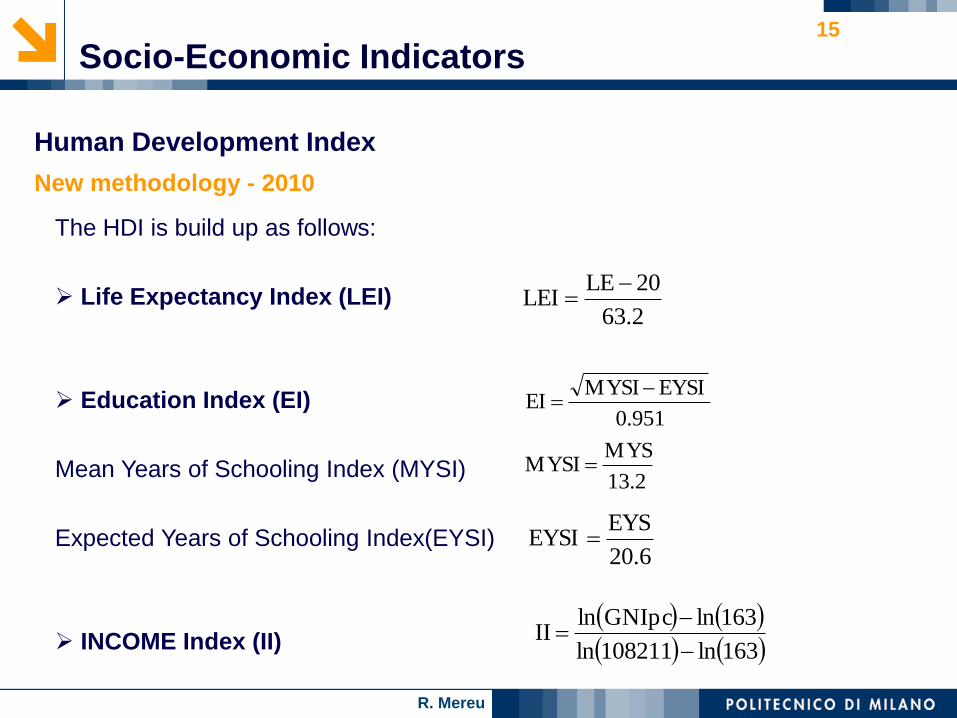
The HDI is build up as follows:
Life Expectancy Index (LEI)
Education Index (EI)
Mean Years of Schooling Index (MYSI)
Expected Years of Schooling Index(EYSI)
INCOME Index (II)
2.13
MYSMYSI
951.0
EYSIMYSI EI
2.63
20LELEI
6.20
EYSEYSI
163ln108211ln
163lnGNIpclnII
Socio-Economic Indicators
Human Development Index
New methodology - 2010

R. Mereu
16
The HDI is NOW built up as follows:
• Life Expectancy Index (LEI)
• Education Index (EI)
Mean years of schooling
Expected years of Schooling
• GNI Index (GNIindex)
Mean years of schooling is estimated more frequently for
more countries and can discriminate better among countries,
while expected years of schooling is consistent with the
reframing of this dimension in terms of years.
Issue of quality of education is still open
To measure the standard of living, gross national income
(GNI) per capita replaces gross domestic product (GDP) per
capita. In a globalized world differences are often large
between the income of a country’s residents and its domestic
production. Some of the income residents earn is sent
abroad, some residents receive international remittances
and some countries receive sizeable aid flows. GNI can also
account for the national debt.
GNIindexEILEIHDI
A key change was to shift to a geometric mean: thus in 2010
the HDI is the geometric mean of the three dimension indices.
This method captures how well rounded a country’s
performance is across the three dimensions.
Socio-Economic Indicators
Human Development index
New Methodology – 2010
R. Mereu
17
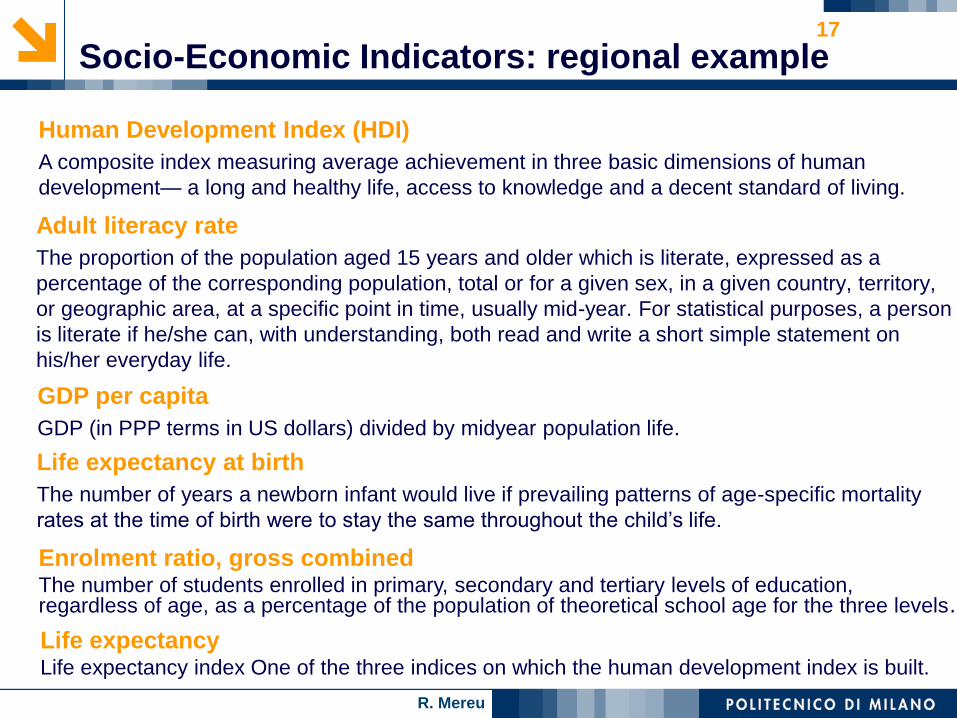
Adult literacy rate
The proportion of the population aged 15 years and older which is literate, expressed as a
percentage of the corresponding population, total or for a given sex, in a given country, territory,
or geographic area, at a specific point in time, usually mid-year. For statistical purposes, a person
is literate if he/she can, with understanding, both read and write a short simple statement on
his/her everyday life.
Life expectancy at birth
The number of years a newborn infant would live if prevailing patterns of age-specific mortality
rates at the time of birth were to stay the same throughout the child’s life.
GDP per capita
GDP (in PPP terms in US dollars) divided by midyear population life.
Enrolment ratio, gross combined The number of students enrolled in primary, secondary and tertiary levels of education, regardless of age, as a percentage of the population of theoretical school age for the three levels.
Human Development Index (HDI)
A composite index measuring average achievement in three basic dimensions of human
development— a long and healthy life, access to knowledge and a decent standard of living.
Life expectancy Life expectancy index One of the three indices on which the human development index is built.
Socio-Economic Indicators: regional example
R. Mereu
18
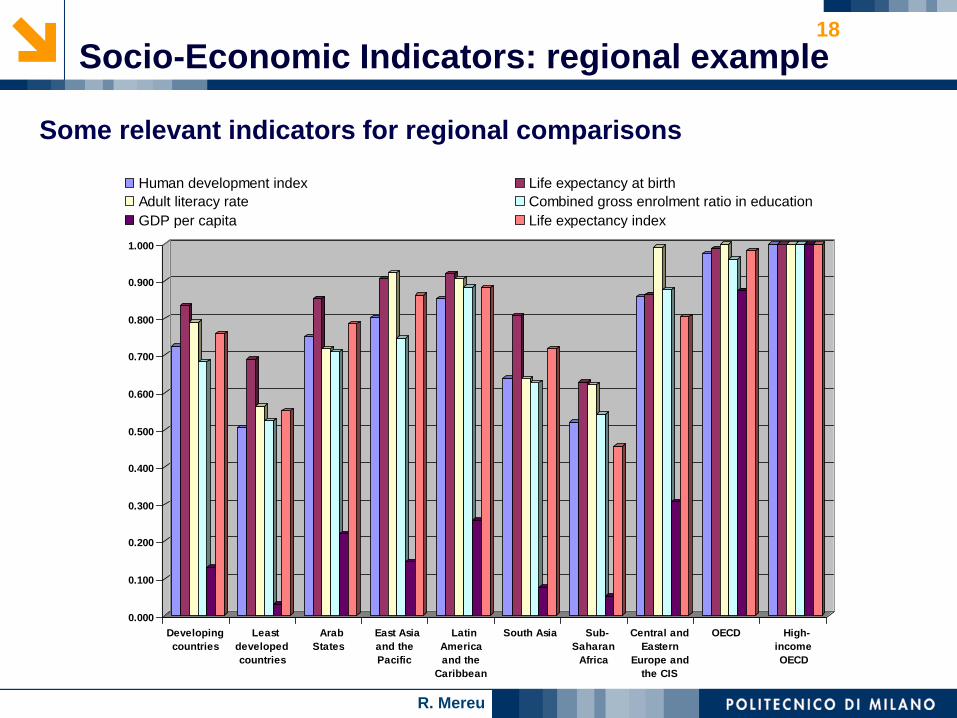
Some relevant indicators for regional comparisons
0.000
0.100
0.200
0.300
0.400
0.500
0.600
0.700
0.800
0.900
1.000
Developing
countries
Least
developed
countries
Arab
States
East Asia
and the
Pacific
Latin
America
and the
Caribbean
South Asia Sub-
Saharan
Africa
Central and
Eastern
Europe and
the CIS
OECD High-
income
OECD
Human development index Life expectancy at birth
Adult literacy rate Combined gross enrolment ratio in education
GDP per capita Life expectancy index
Socio-Economic Indicators: regional example
R. Mereu
19
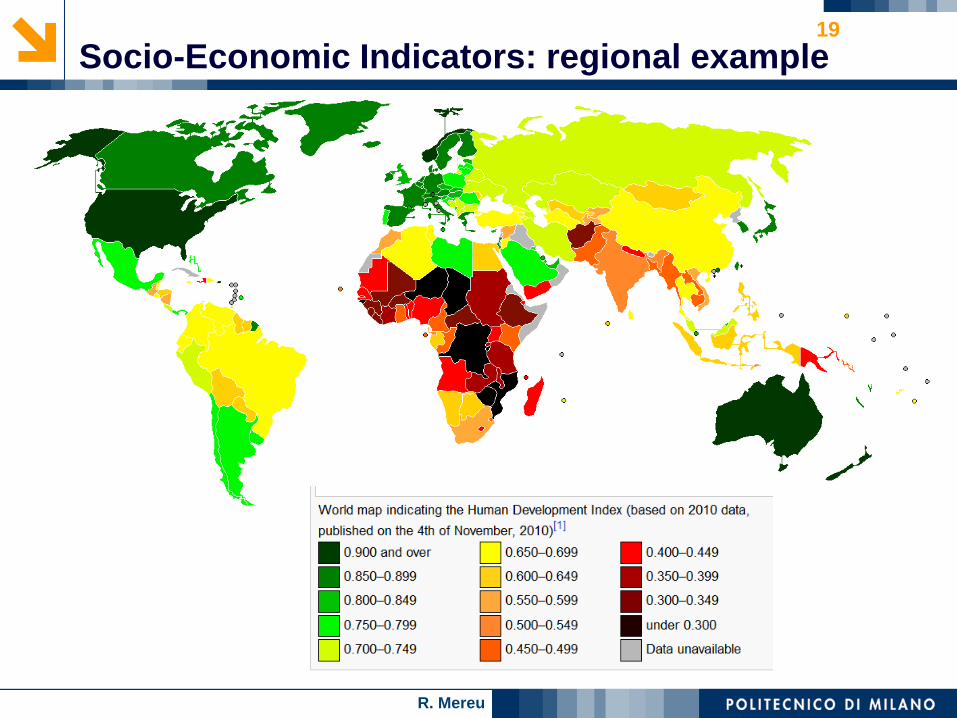
Socio-Economic Indicators: regional example

R. Mereu
20
Gender issue
Gender empowerment measure (GEM) A composite index measuring gender inequality in
three basic dimensions of empowerment—economic participation and decision-making, political
participation, and decision-making and power over economic resources.
Gender-related development index (GDI) A composite index measuring average achievement
in the three basic dimensions captured in the human development index—a long and healthy life,
access to knowledge and a decent standard of living—adjusted to account for inequalities
between men and women.
Level of development, poverty and gender
Five human development indexes are nowadays commonly used for any development
study, less related to energy
Poverty issue
Human poverty index for developing countries (HPI-1) A composite index measuring
deprivations in the three basic dimensions captured in the human development index—a long
and healthy life, access to knowledge and a decent standard of living.
Human poverty index for selected high income OECD countries (HPI-2). A composite index
measuring deprivations in the three basic dimensions captured in the human development
index—a long and healthy life, access to knowledge and a decent standard of living—and also
capturing social exclusion.
HDI
Socio-Economic Indicators
R. Mereu
21
Energy Indicators Adequate and affordable energy services have been relevant in the economic
development and the transition from subsistence agricultural economies to modern
industrial and service-oriented societies.
Energy is a central issue to improve social and economic well-being, and is
indispensable for industrial and commercial wealth generation.
However it is important to note that energy is only a means. The final goals are:
a sustainable economy
a clean environment
appropriate living standards
prosperity
good health
that are shared theme with the Unite Nations Millennium Development Goals.
In 1999 the International Atomic Energy Agency (IAEA) introduced a set of specific
energy indicator to monitor the development of a country.
Energy Indicators

R. Mereu
22
Energy Indicators The original name was “Indicators for Sustainable Energy Development (ISED)” but in 2002
IAEA decided to modify it in “Energy Indicators for Sustainable Development (EISD)” to
avoid misunderstanding.
Besides, in the common view, “sustainable energy development” tends to refer only to
renewable energy, rather than the broader spectrum of energy choices.
The Energy Indicators for Sustainable Development (EISD) is a set of 30 indicators,
classified into 3 dimensions (social, economic and environmental) with further classification
into 7 themes and 19 sub-themes.
A fourth dimension is currently in course of evaluation by IAEA: the institutional area.
Each dimension represents a fundamental element of sustainability.
Energy Indicators

R. Mereu
23
Energy Indicators Indicators are meaningful when are used to define comparisons. It is possible to compare
indicators by two ways:
Spatial (among different countries)
to create a ranking among the countries.
Temporal (along years)
to compare the impact of different policies and internal/external events. Moreover, with the
time comparison it is possible to extrapolate some values and to create projections.
Energy Indicators

R. Mereu
24
Spatial comparisons
First level of comparisons
The first level is internal comparison among similar countries
Second level of comparisons
The second level is a world wide positioning of the country
Temporal comparisons
Punctual data over one specific year
Last available data
Trend and time series comparisons
Generally Over decades
Energy Indicators

R. Mereu
25
Energy Indicators
There are 30 indicators, classified into three dimensions (social, economic
and environmental). These are further classified into 7 themes and 19 subthemes.
Social Dimension
EISD in the social dimension measure the impact that available energy services could
have on living standards. Availability of energy services has strong implications in terms
of poverty, employment opportunities, education, community development and culture,
demographic transition, indoor pollution and health, gender and children status and daily
activities. They describe issues related to accessibility, affordability and disparity in
energy supply and demand.
In rich countries, modern energy services (lighting, heating, cooking, etc.) are almost
universally available and in those contexts the energy is cleaner, safer, more reliable and
affordable with respect to the Developing Countries (DCs). In DCs, firewood and dung
collecting for cooking and heating could take up to six hours per day, especially for
women and children. Moreover, these fuels are employed inside the houses in inadequate
devices with low efficiency and heavy negative impact on human health through
contribution to disease (and even death) for air pollution and fires.
Energy Indicators

R. Mereu
26
Energy Indicators
Energy Indicators
Social dimension

R. Mereu
27
Energy Indicators
Energy Indicators
Economic dimension
Economic EISD measure the impact on economic sector of the kinds of available energy, in
term of source, quantity and reliability of providing. The focus is the long term sustainability
of the energy mix.

R. Mereu
28
Energy Indicators
Energy Indicators
Economic dimension
R. Mereu
29
Energy Indicators
Energy Indicators
Environmental dimension
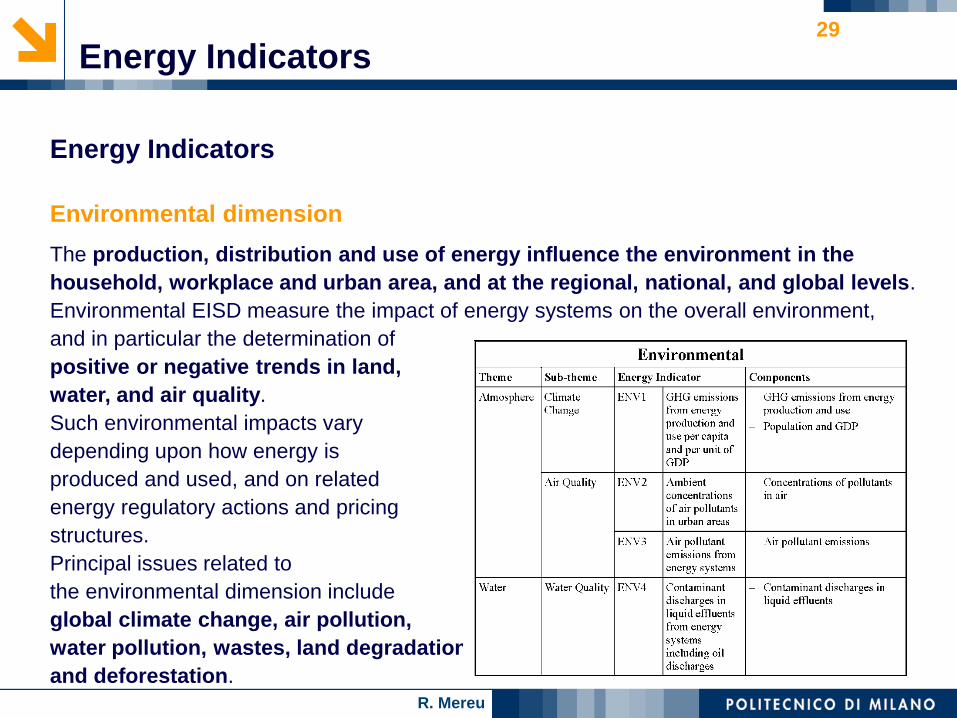
The production, distribution and use of energy influence the environment in the
household, workplace and urban area, and at the regional, national, and global levels.
Environmental EISD measure the impact of energy systems on the overall environment,
and in particular the determination of
positive or negative trends in land,
water, and air quality.
Such environmental impacts vary
depending upon how energy is
produced and used, and on related
energy regulatory actions and pricing
structures.
Principal issues related to
the environmental dimension include
global climate change, air pollution,
water pollution, wastes, land degradation
and deforestation.

R. Mereu
30
Energy Indicators
Environmental dimension
Energy Indicators

R. Mereu
31
Energy Development Index
It is the indicator compared to HDI and built up in the same way (4 dimensions, 4 indicators)
Per-capita commercial energy consumption Ec: an indicator of the overall economic
development of a country.
Per-capita electricity consumption in the residential sector EEc: an indicator of the
reliability of electricity services and consumer’s ability to pay for them.
Share of modern fuels in residential sector energy use ME%: an indicator of the level of
access to clean cooking facilities.
Share of population with access to electricity EE%
%EE4
1%ME
4
1EEc
4
1Ec
4
1EDI
Energy Indicators

R. Mereu
32
valueminvaluemax
valueminvalueIndicator
Energy Indicators
Energy Development Index
Indicators are calculated as follow

R. Mereu
33
Energy and Economic development
0
2
4
6
8
10
12
14
16
18
0 20'000 40'000 60'000 80'000 100'000
Ele
ctri
c e
ne
rgy
con
sum
pti
on
p
er
cap
ita
[MW
h]
GNI per capita, Atlas method [current USD]
Energy & Development: some examples
R. Mereu
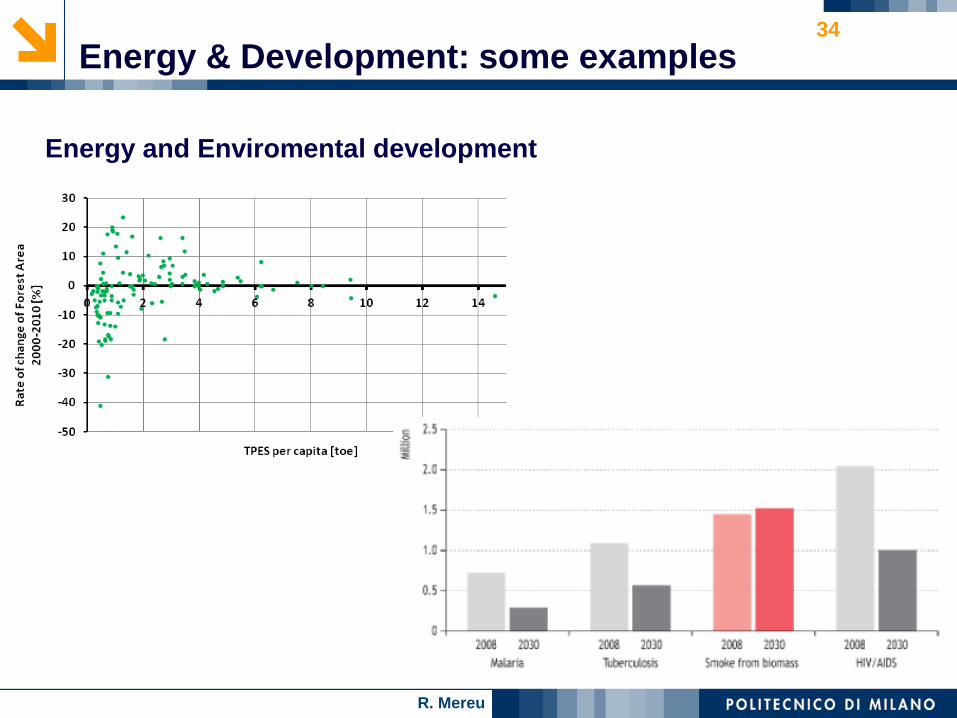
34
Energy and Enviromental development
Energy & Development: some examples

R. Mereu
35
Energy and Social development
Energy & Development: some examples
Top Related