


Languages
Pages
Legal


RUHRECONOMIC PAPERS
Social Norms and Energy Conservation Beyond the US
#714
Mark Andor
Andreas Gerster
Jörg Peters
Christoph M. Schmidt

Imprint
Ruhr Economic Papers
Published by
RWI Leibniz-Institut für Wirtschaftsforschung Hohenzollernstr. 1-3, 45128 Essen, Germany
Ruhr-Universität Bochum (RUB), Department of Economics Universitätsstr. 150, 44801 Bochum, Germany
Technische Universität Dortmund, Department of Economic and Social Sciences Vogelpothsweg 87, 44227 Dortmund, Germany
Universität Duisburg-Essen, Department of Economics Universitätsstr. 12, 45117 Essen, Germany
Editors
Prof. Dr. Thomas K. Bauer RUB, Department of Economics, Empirical Economics Phone: +49 (0) 234/3 22 83 41, e-mail: [email protected]
Prof. Dr. Wolfgang Leininger Technische Universität Dortmund, Department of Economic and Social Sciences Economics – Microeconomics Phone: +49 (0) 231/7 55-3297, e-mail: [email protected]
Prof. Dr. Volker Clausen University of Duisburg-Essen, Department of Economics International Economics Phone: +49 (0) 201/1 83-3655, e-mail: [email protected]
Prof. Dr. Roland Döhrn, Prof. Dr. Manuel Frondel, Prof. Dr. Jochen Kluve RWI, Phone: +49 (0) 201/81 49-213, e-mail: [email protected]
Editorial Office
Sabine Weiler RWI, Phone: +49 (0) 201/81 49-213, e-mail: [email protected]
Ruhr Economic Papers #714
Responsible Editor: Manuel Frondel
All rights reserved. Essen, Germany, 2017
ISSN 1864-4872 (online) – ISBN 978-3-86788-833-2The working papers published in the Series constitute work in progress circulated to stimulate discussion and critical comments. Views expressed represent exclusively the authors’ own opinions and do not necessarily reflect those of the editors.

Ruhr Economic Papers #714
Mark Andor, Andreas Gerster, Jörg Peters, and Christoph M. Schmidt
Social Norms and Energy Conservation Beyond the US

Bibliografische Informationen der Deutschen Nationalbibliothek
The Deutsche Nationalbibliothek lists this publication in the Deutsche National-bibliografie; detailed bibliographic data are available on the Internet at http://dnb.dnb.de
RWI is funded by the Federal Government and the federal state of North Rhine-Westphalia.
http://dx.doi.org/10.4419/86788833ISSN 1864-4872 (online)ISBN 978-3-86788-833-2

Mark Andor, Andreas Gerster, Jörg Peters, and Christoph M. Schmidt1
Social Norms and Energy Conservation Beyond the US
AbstractThe seminal studies by Allcott and Mullainathan (2010), Allcott (2011), and Allcott and Rogers (2014) suggest that social comparison-based home energy reports (HER) are a cost-effective non-price intervention to stimulate energy conservation. The present paper demonstrates the context-dependency of this result. We show that, outside the US, electricity consumption levels and carbon intensities are typically much lower and, hence, HER interventions can only become cost-effective when treatment effect sizes are substantially higher. Yet, our evidence from a large-scale randomized controlled trial in Germany suggests that effect sizes are actually much lower than in the US.
JEL Classification: D12, D83, L94, Q41.
Keywords: Social norms; energy demand; external validity; randomized field experiments; non-price interventions.
October 2017
1 Mark Andor, RWI; Andreas Gerster, RGS Econ and RWI; Jörg Peters, RWI and University of the Witwatersrand, Johannesburg; Christoph M. Schmidt, RUB and RWI. – We gratefully acknowledge financial support by the Stiftung Mercator, without which this project would not have been possible. Furthermore, this work has been partly supported by the Collaborative Research Center Statistical Modeling of Nonlinear Dynamic Processes (SFB 823) of the German Research Foundation (DFG), within Project A3, Dynamic Technology Modeling. Peters acknowledges the support of a special grant (Sondertatbestand) from the German Federal Ministry for Economic Affairs and Energy and the Ministry of Innovation, Science, and Research of the State of North Rhine-Westphalia. We are grateful for valuable comments and suggestions by Hunt Allcott, Stefano Carattini, Paul Ferraro, Manuel Frondel, Timo Goeschel, Lorenz Götte, Martin Kesternich, Andreas Lange, Grischa Perino, Stephan Sommer, and Colin Vance as well as participants of the 32nd Annual Congress of the European Economic Association, the Sixth Mannheim Energy Conference, the 23rd Annual Conference of the European Association of Environmental and Resource Economists, and the seminars at ZEW and University of Hamburg. We thank Lukas Tomberg for excellent research assistance.– All correspondence to: Mark Andor, RWI, Hohenzollernstr. 1/3, 45128 Essen, Germany, e-mail: [email protected]
1. Introduction
A large literature has shown that social norms can affect individual choices in a variety of
domains such as water use (Ferraro et al. 2011, Ferraro and Price 2013, Jaime Torres and Carls-
son 2016) and charitable giving (Frey and Meier 2004, Shang and Croson 2009). A prominent
example is the social comparison-based home energy report (HER) that the company Opower
mailed to millions of US households in order to reduce their electricity consumption. Evalu-
ations of Opower’s HER have documented considerable reductions in electricity consumption
of 1.4-3.3% that are also persistent over time (Allcott 2011, Allcott and Rogers 2014). Given
the low intervention costs of HER, this finding suggests that HER are a cost-effective policy
instrument to combat climate change (Allcott and Mullainathan 2010, Allcott 2011).
In this paper, we assess the cost-effectiveness of HER interventions in industrialized coun-
tries other than the US. While our paper does not question the internal validity of the Allcott
(2011) and Allcott and Rogers (2014) findings, we complement their work by testing the exter-
nal validity and transferability to other contexts. We thereby also contribute to the growing
literature on the context-dependency of causal effects measured in a particular policy popula-
tion (e.g. Allcott 2015, Dehejia et al. 2015, Gechter 2016, Vivalt 2015).
Our analysis proceeds in three steps. In Section 2, we first show that US electricity consump-
tion and carbon intensity levels exceed those in virtually all other industrialized countries. We
demonstrate that this particular context decisively co-determines the cost-effectiveness of HER
in the US. In other countries, treatment effects would have to be substantially larger to make
HER a cost-effective climate policy intervention.
In a second step, we test for the effectiveness of HER in Germany, a country with electricity
consumption levels that better match the OECD average (Section 3). Based on data from a ran-
domized controlled trial among 11,630 households, we estimate the average treatment effect
of HER on electricity consumption. We find that HER reduce the electricity consumption of
German households by 0.7%, less than half of the average reductions observed in the Opower
studies. While this treatment effect estimate is certainly context-specific itself, it complements
our descriptive analysis and reinforces the view that HER are most likely not a cost-effective
climate policy instrument in many industrialized countries beyond the US.
In a third step, Section 4 tests the sensitivity of our cost-effectiveness assessments to the re-
laxation of two assumptions. We allow for time-persistent treatment effects beyond the year
4

of the treatment (as observed in Allcott and Rogers 2014) and, following Allcott and Kessler
(2015), we expand the cost-effectiveness analysis to a welfare analysis. The conclusion in Sec-
tion 5 summarizes our findings and discusses policy implications.
2. Context-Dependency of HER Interventions
The cost-effectiveness of HER as a climate policy intervention crucially depends on three
factors. First, it is strongly influenced by the treatment effect of HER on recipients’ electricity
consumption. Since no empirical estimates exist for countries beyond the US, we simply take
the full range of treatment effects observed in the Opower studies (1.4-3.3%, see Allcott 2011).
A second factor is the average electricity consumption level. On the one hand, higher average
electricity consumption levels translate a given effect size (in relative terms) into higher abso-
lute electricity savings in terms of kilowatt-hours (kWh). On the other hand, households with
higher consumption levels tend to exhibit higher behavioral and technical savings potentials
and thus can realize higher effect sizes (Allcott 2011). As a third factor, the carbon intensity of
electricity generation determines the extent to which electricity savings translate into mitiga-
tion of carbon dioxide (CO2) emissions. Power sectors with large shares of lignite- and hard
coal-fired power plants, for example, are much more carbon-intense than those relying on hy-
dropower and nuclear energy. As a result, even similar absolute electricity savings can yield
widely diverging CO2 abatement effects in different countries.1
For our descriptive analysis, we consider the ten OECD countries with the largest total resi-
dential electricity consumption (WEC 2016). In addition, we include Poland, an OECD country
with low average electricity consumption, but very carbon-intense electricity generation, and
Sweden, a country with high average consumption, but low carbon intensity. Our projections
bound the cost-effectiveness of HER in these countries, assuming treatment effects of 1.4-3.3%
(Allcott 2011). Average electricity consumption levels and carbon intensities are drawn from
official data sets (WEC 2016 and IEA 2016). For simplicity, we assume printing and mailing
cost of 1 US$ per letter in all countries (as in Allcott 2011), and neglect any administrative cost.
As quarterly reports have achieved the highest cost-effectiveness in previous studies (Allcott
1There is a literature that discusses whether cap-and-trade schemes, such as the European Union Emissions Trad-ing System, and energy saving policies, like HER, are complements (e.g. Dietz et al. 2009) or rather substitutes(e.g. Goulder 2013). Some even argue that energy saving policies that shift demand away from sectors subjectto a cap increase aggregate emissions (Perino 2015). We take the most favorable stance for HER and treat themas complements to cap-and-trade schemes in our cost-effectiveness calculations.
5

Table 1: International Cost-Effectiveness Comparison of HER Interventions
(1) (2) (3) (4) (5)
Country
AverageElectricity
Consumptionin kWh
CO2Emissions in
g / kWh
Cost in Cent/ kWh Saved
AbatementCost in $ / t
CO2
CO2Abatement
CostRelative to
US
Canada 11,379 158 1.1 – 2.6 67 – 162 3.3United States 12,293 489 1.0 – 2.4 20 – 49 1.0
France 5,859 64 2.1 – 5.0 323 – 779 16.0Germany 3,304 486 3.7 – 8.8 75 – 182 3.7Italy 2,542 343 4.8 – 11.5 139 – 335 6.9Poland 1,935 769 6.3 – 15.1 81 – 196 4.0Spain 4,040 247 3.0 – 7.2 121 – 293 6.0Sweden 8,025 13 1.5 – 3.6 1,162 – 2,799 57.6UnitedKingdom
4,145 459 2.9 – 7.0 64 – 153 3.2
Japan 5,434 572 2.2 – 5.4 39 – 94 1.9South Korea 3,489 536 3.5 – 8.4 65 – 156 3.2
Australia 6,959 798 1.7 – 4.2 22 – 53 1.1
Notes: Our calculations assume printing and mailing cost of 1 US$ per report, four reports per year andaverage electricity reductions of 1.37-3.30%. Average electricity consumption and CO2 intensities ofelectricity generation correspond to the most recently available data (for 2013), as documented in WEC(2016) and IEA (2015), respectively.
2011), we presume that four reports are sent within one year.
We then compare the HER abatement cost to the avoided social cost of carbon, the usual
yardstick to assess the cost-effectiveness of climate change mitigation policies (Greenstone
et al. 2013, Nordhaus 2014). Nordhaus (2014) estimates that the social cost of carbon in 2015 are
at 19 US$ per ton, while US IAWG (2013) provide an estimate of 38 US$. For our assessments,
we use the larger estimate of 38$, which is more favorable to the cost-effectiveness of HER.
Table 1 summarizes the descriptive statistics and our cost-effectiveness indicators. Average
electricity consumption levels and carbon intensities are depicted in Column (1) and (2). By
contrasting the cost of HER with the electricity savings for the range of effect sizes, we obtain
a range of cost per kWh saved, which can be found in Column (3).
Column (4) of Table 1 depicts the resulting abatement cost ranges. It shows that HER are
considerably less cost-effective in most countries other than the US. This finding demonstrates
6
that the potential of HER as a cost-effective climate policy instrument hinges strongly upon
both average electricity consumption levels and carbon intensities. In fact, our projections
suggest that no country except the US and Australia reaches abatement cost levels that would
justify the use of HER as a policy instrument to combat climate change when using social cost
of carbon of 38 US$ as a yardstick.
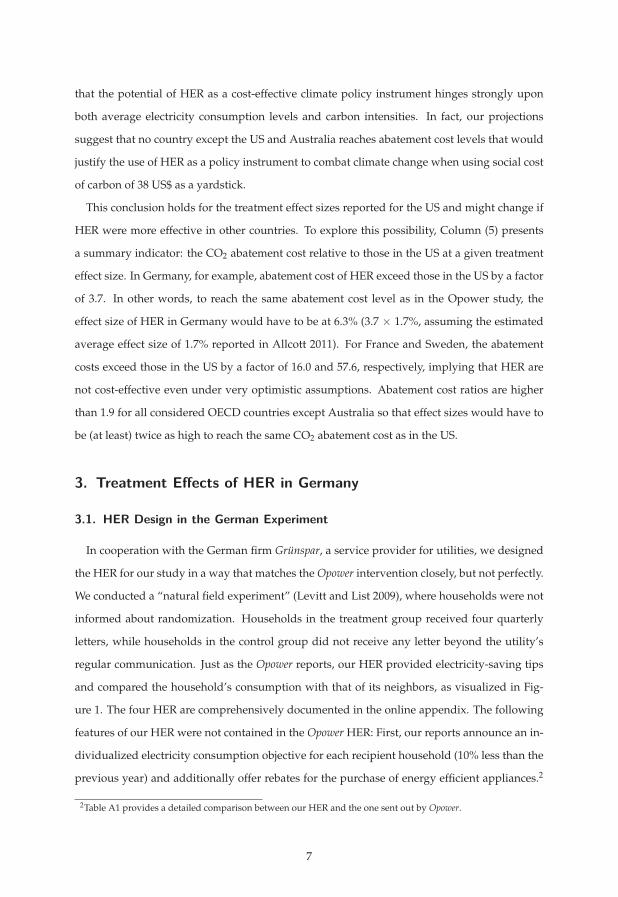
This conclusion holds for the treatment effect sizes reported for the US and might change if
HER were more effective in other countries. To explore this possibility, Column (5) presents
a summary indicator: the CO2 abatement cost relative to those in the US at a given treatment
effect size. In Germany, for example, abatement cost of HER exceed those in the US by a factor
of 3.7. In other words, to reach the same abatement cost level as in the Opower study, the
effect size of HER in Germany would have to be at 6.3% (3.7 × 1.7%, assuming the estimated
average effect size of 1.7% reported in Allcott 2011). For France and Sweden, the abatement
costs exceed those in the US by a factor of 16.0 and 57.6, respectively, implying that HER are
not cost-effective even under very optimistic assumptions. Abatement cost ratios are higher
than 1.9 for all considered OECD countries except Australia so that effect sizes would have to
be (at least) twice as high to reach the same CO2 abatement cost as in the US.
3. Treatment Effects of HER in Germany
3.1. HER Design in the German Experiment
In cooperation with the German firm Grunspar, a service provider for utilities, we designed
the HER for our study in a way that matches the Opower intervention closely, but not perfectly.
We conducted a “natural field experiment” (Levitt and List 2009), where households were not
informed about randomization. Households in the treatment group received four quarterly
letters, while households in the control group did not receive any letter beyond the utility’s
regular communication. Just as the Opower reports, our HER provided electricity-saving tips
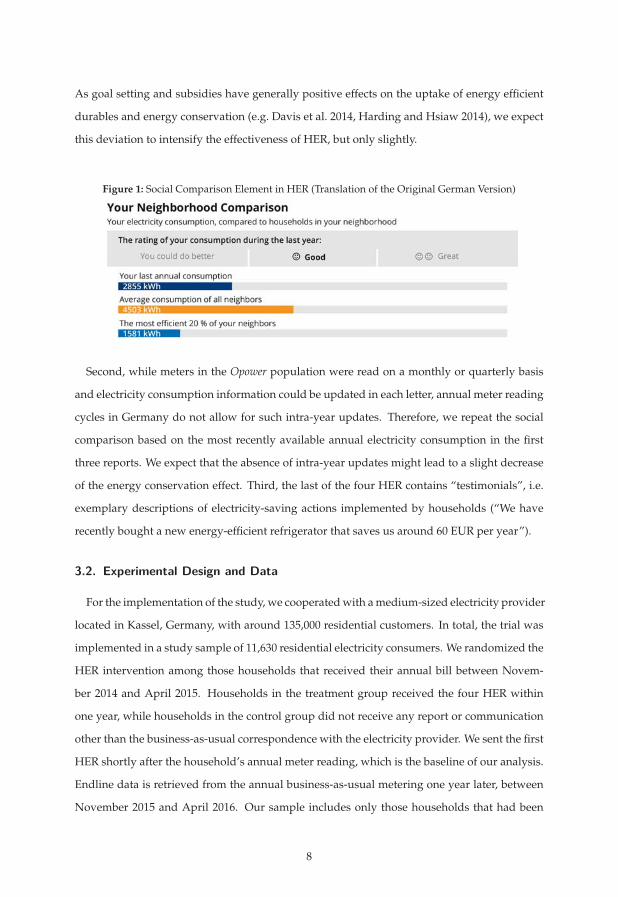
and compared the household’s consumption with that of its neighbors, as visualized in Fig-
ure 1. The four HER are comprehensively documented in the online appendix. The following
features of our HER were not contained in the Opower HER: First, our reports announce an in-
dividualized electricity consumption objective for each recipient household (10% less than the
previous year) and additionally offer rebates for the purchase of energy efficient appliances.2
2Table A1 provides a detailed comparison between our HER and the one sent out by Opower.
7
As goal setting and subsidies have generally positive effects on the uptake of energy efficient
durables and energy conservation (e.g. Davis et al. 2014, Harding and Hsiaw 2014), we expect
this deviation to intensify the effectiveness of HER, but only slightly.
Figure 1: Social Comparison Element in HER (Translation of the Original German Version)
Second, while meters in the Opower population were read on a monthly or quarterly basis
and electricity consumption information could be updated in each letter, annual meter reading
cycles in Germany do not allow for such intra-year updates. Therefore, we repeat the social
comparison based on the most recently available annual electricity consumption in the first
three reports. We expect that the absence of intra-year updates might lead to a slight decrease
of the energy conservation effect. Third, the last of the four HER contains “testimonials”, i.e.
exemplary descriptions of electricity-saving actions implemented by households (“We have
recently bought a new energy-efficient refrigerator that saves us around 60 EUR per year”).
3.2. Experimental Design and Data
For the implementation of the study, we cooperated with a medium-sized electricity provider
located in Kassel, Germany, with around 135,000 residential customers. In total, the trial was
implemented in a study sample of 11,630 residential electricity consumers. We randomized the
HER intervention among those households that received their annual bill between Novem-
ber 2014 and April 2015. Households in the treatment group received the four HER within
one year, while households in the control group did not receive any report or communication
other than the business-as-usual correspondence with the electricity provider. We sent the first
HER shortly after the household’s annual meter reading, which is the baseline of our analysis.
Endline data is retrieved from the annual business-as-usual metering one year later, between
November 2015 and April 2016. Our sample includes only those households that had been
8

Table 2: Balance of Baseline Characteristics Between Treatment and Control Group
Treatment Group Control Group Difference(Std. Error; p-Value)
Baseline Consumption 2,281.3 2,279.3 2.0(2014), in kWh (29.62; 0.95)Baseline Billing Period 362.7 362.6 0.1Length, in Days (0.12; 0.47)
Number of Households 5,808 5,812
with the electricity provider for at least one year, so we can make use of baseline consumption
data. In addition, as in the Opower programs, households with more than one meter were ex-
cluded from the sample. The randomization was stratified by households’ baseline electricity
use and billing month.
Table 2 illustrates that baseline electricity consumption and billing period length are per-
fectly balanced across treatment and control group. Furthermore, the table shows that house-
holds in our sample consume on average 2,300 kWh per year and hence far less than the 12,000
kWh consumed by the average US household, but also less than the German average of around
3,300 kWh per year (depicted in Table 1). The reason for this is that our study’s target area,
Kassel and its surrounding suburbs, is an urban area where households are typically smaller
than the average German household. We examine the representativeness of our study region
compared to the rest of Germany, using the microm dataset that offers socio-demographic vari-
ables at the regional zip code level. Beyond the lower electricity consumption, we find that our
sample provides a fair representation in terms of key socio-demographic variables, such as per-
centage of retirees, unemployment rate, purchasing power, and non-German citizenship (see
Table A2 in the appendix).
4. Results
To determine the Average Treatment Effect (ATE) of the HER on electricity consumption, we
estimate the following differences-in-differences regression model:
ΔYi = α + δTi + εi (1)
9
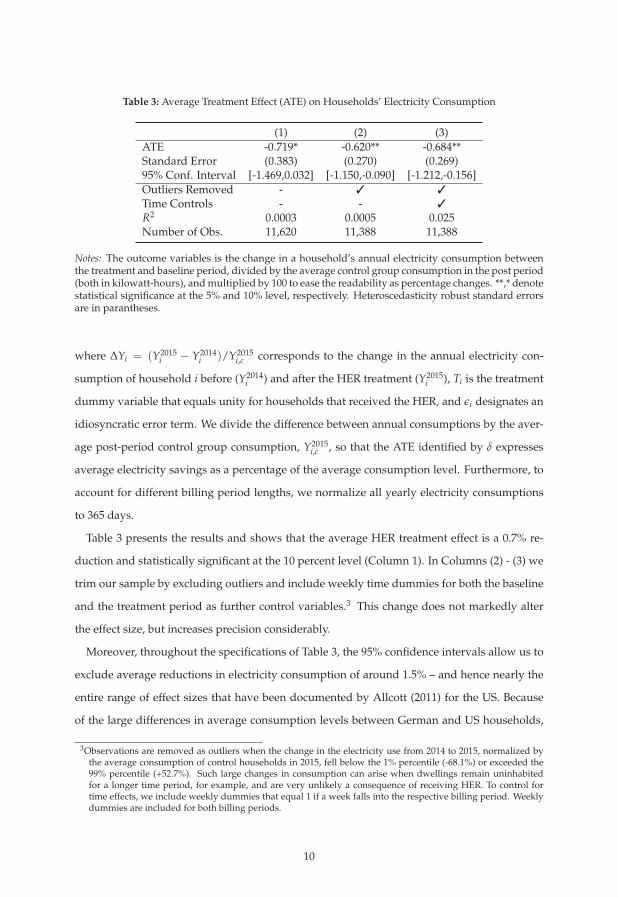
Table 3: Average Treatment Effect (ATE) on Households’ Electricity Consumption
(1) (2) (3)ATE -0.719* -0.620** -0.684**Standard Error (0.383) (0.270) (0.269)95% Conf. Interval [-1.469,0.032] [-1.150,-0.090] [-1.212,-0.156]Outliers Removed - � �
Time Controls - - �
R2 0.0003 0.0005 0.025Number of Obs. 11,620 11,388 11,388
Notes: The outcome variables is the change in a household’s annual electricity consumption betweenthe treatment and baseline period, divided by the average control group consumption in the post period(both in kilowatt-hours), and multiplied by 100 to ease the readability as percentage changes. **,* denotestatistical significance at the 5% and 10% level, respectively. Heteroscedasticity robust standard errorsare in parantheses.
where ΔYi = (Y2015i − Y2014
i )/Y2015i,c corresponds to the change in the annual electricity con-
sumption of household i before (Y2014i ) and after the HER treatment (Y2015
i ), Ti is the treatment
dummy variable that equals unity for households that received the HER, and εi designates an
idiosyncratic error term. We divide the difference between annual consumptions by the aver-
age post-period control group consumption, Y2015i,c , so that the ATE identified by δ expresses
average electricity savings as a percentage of the average consumption level. Furthermore, to
account for different billing period lengths, we normalize all yearly electricity consumptions
to 365 days.
Table 3 presents the results and shows that the average HER treatment effect is a 0.7% re-
duction and statistically significant at the 10 percent level (Column 1). In Columns (2) - (3) we
trim our sample by excluding outliers and include weekly time dummies for both the baseline
and the treatment period as further control variables.3 This change does not markedly alter
the effect size, but increases precision considerably.
Moreover, throughout the specifications of Table 3, the 95% confidence intervals allow us to
exclude average reductions in electricity consumption of around 1.5% – and hence nearly the
entire range of effect sizes that have been documented by Allcott (2011) for the US. Because
of the large differences in average consumption levels between German and US households,
3Observations are removed as outliers when the change in the electricity use from 2014 to 2015, normalized bythe average consumption of control households in 2015, fell below the 1% percentile (-68.1%) or exceeded the99% percentile (+52.7%). Such large changes in consumption can arise when dwellings remain uninhabitedfor a longer time period, for example, and are very unlikely a consequence of receiving HER. To control fortime effects, we include weekly dummies that equal 1 if a week falls into the respective billing period. Weeklydummies are included for both billing periods.
10
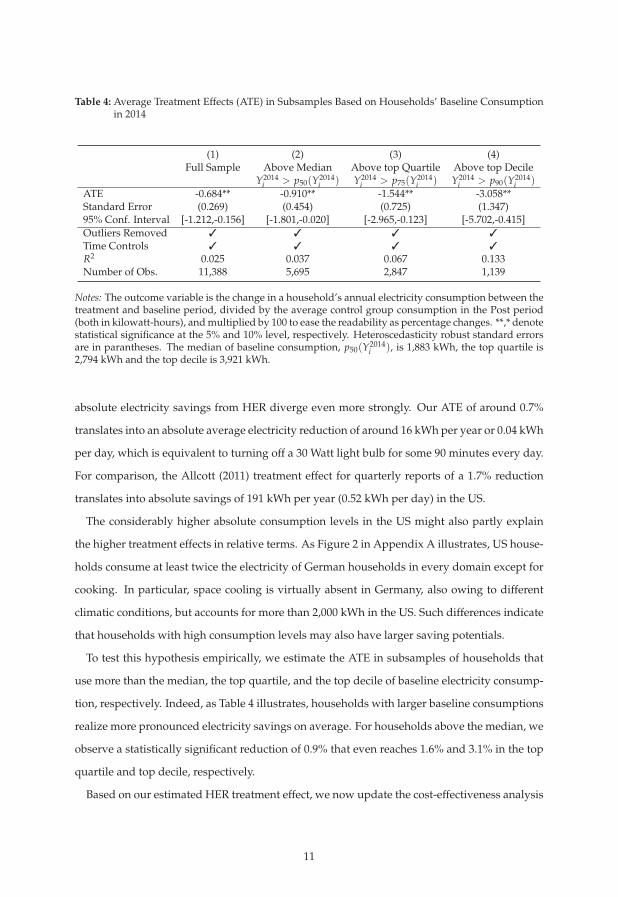
Table 4: Average Treatment Effects (ATE) in Subsamples Based on Households’ Baseline Consumptionin 2014
(1) (2) (3) (4)Full Sample Above Median Above top Quartile Above top Decile
Y2014i > p50(Y2014
i ) Y2014i > p75(Y2014
i ) Y2014i > p90(Y2014
i )ATE -0.684** -0.910** -1.544** -3.058**Standard Error (0.269) (0.454) (0.725) (1.347)95% Conf. Interval [-1.212,-0.156] [-1.801,-0.020] [-2.965,-0.123] [-5.702,-0.415]Outliers Removed � � � �
Time Controls � � � �
R2 0.025 0.037 0.067 0.133Number of Obs. 11,388 5,695 2,847 1,139
Notes: The outcome variable is the change in a household’s annual electricity consumption between thetreatment and baseline period, divided by the average control group consumption in the Post period(both in kilowatt-hours), and multiplied by 100 to ease the readability as percentage changes. **,* denotestatistical significance at the 5% and 10% level, respectively. Heteroscedasticity robust standard errorsare in parantheses. The median of baseline consumption, p50(Y2014
i ), is 1,883 kWh, the top quartile is2,794 kWh and the top decile is 3,921 kWh.
absolute electricity savings from HER diverge even more strongly. Our ATE of around 0.7%
translates into an absolute average electricity reduction of around 16 kWh per year or 0.04 kWh
per day, which is equivalent to turning off a 30 Watt light bulb for some 90 minutes every day.
For comparison, the Allcott (2011) treatment effect for quarterly reports of a 1.7% reduction
translates into absolute savings of 191 kWh per year (0.52 kWh per day) in the US.
The considerably higher absolute consumption levels in the US might also partly explain
the higher treatment effects in relative terms. As Figure 2 in Appendix A illustrates, US house-
holds consume at least twice the electricity of German households in every domain except for
cooking. In particular, space cooling is virtually absent in Germany, also owing to different
climatic conditions, but accounts for more than 2,000 kWh in the US. Such differences indicate
that households with high consumption levels may also have larger saving potentials.
To test this hypothesis empirically, we estimate the ATE in subsamples of households that
use more than the median, the top quartile, and the top decile of baseline electricity consump-
tion, respectively. Indeed, as Table 4 illustrates, households with larger baseline consumptions
realize more pronounced electricity savings on average. For households above the median, we
observe a statistically significant reduction of 0.9% that even reaches 1.6% and 3.1% in the top
quartile and top decile, respectively.
Based on our estimated HER treatment effect, we now update the cost-effectiveness analysis
11

presented in Table 1 for Germany. We divide the annualized cost of the reports by the aver-
age amount of kilowatt-hours saved per year, again assuming printing and mailing cost of 1
US$ per report. Our estimates imply intervention costs per saved kWh of around 0.25 US$
(4 US$/16 kWh), compared to only around 0.01-0.05 US$ in the US Opower samples (Allcott
2011). Dividing the cost estimates by the carbon intensity – which is virtually on a par for the
US and Germany – yields the cost per mitigated ton of CO2 of 505 US$ in Germany, compared
to 25-105 US$ in the US Opower samples. This finding reinforces our assessment from Section
3 that HER are not a cost-effective climate policy instrument in Germany.
5. Sensitivity Analysis
Our cost-effectiveness projections in Section 2 rely on a set of assumptions, most of which
are conservative in the sense of favoring the cost-effectiveness of HER. For example, we ignore
administrative cost and consider the maximum effect size found in the literature. In this sec-
tion, we test the sensitivity of our conclusion concerning two aspects where our calculations
might be overly pessimistic: persistency in electricity savings beyond the treatment year (All-
cott and Rogers 2014) and the consideration of a broader set of benefits and cost for welfare
analysis (Allcott and Kessler 2015).
First, we have only considered electricity savings and thus CO2 mitigation in the year of the
treatment. To calculate the HER abatement costs under an optimistic persistency scenario, we
assume that HER do not only decrease electricity consumption in the year of the treatment, but
persist over the following years (as reported for the US Opower sample in Allcott and Rogers
2014 and Brandon et al. 2017). In line with the upper persistency bound observed by Allcott
and Rogers (2014), we assume that effect sizes attenuate linearly by 15 percentage points per
annum and set discount rates to zero. Electricity savings then increase by a factor of 3.85 and
the abatement costs decrease accordingly.4 Even under such favorable assumptions about the
persistency of electricity savings, HER would never be cost-effective in France and Sweden,
as we document in Appendix A3. For the remaining European countries, as well as Canada,
Japan and South Korea, only effect sizes in the first year close to the maximum of 3.3% can
bring down CO2 abatement cost below the 38 US$ yardstick.
4In the absence of discounting and with effect sizes that attenuate linearly by 15 percentage points per annum,the total amount of saved electricity is (1 + 0.85 + 0.70 + 0.55 + 0.40 + 0.25 + 0.1) ∗ ATE1, where ATE1 is theaverage electricity saving in the first year.
12

Second, our analysis has focused on CO2 abatement costs and only incorporated the imme-
diate costs of HER (postage and printing) as well as the climate relevant benefits, i.e. mitigated
CO2. Allcott and Kessler (2015) suggest considering not only climate policy externalities but all
costs and benefits on the supply and demand side when assessing climate policy instruments
(see Ito 2015, for a similar discussion). On the demand side, for example, consumers benefit
from electricity savings in form of reduced energy costs, but bear adjustment costs such as
investments for more efficient appliances and loss of utility from forgone energy services. On
the supply side, electricity savings can influence the size of a potential dead-weight loss from
taxes and other mark-ups.
In the following, we test the sensitivity of our cost-effectiveness calculations to the incor-
poration of this broader welfare perspective. The calculation is presented in more detail in
Appendix B. For the supply side, we retrieve country-specific electricity prices, as well as
production costs, and use their difference to approximate the dead-weight loss. On the de-
mand side, the costs and benefits are typically unobservable. We therefore refer to Allcott
and Kessler (2015), who estimate the net welfare effect on consumers by eliciting the recipi-
ents’ willingness-to-pay for a continued delivery of HER. They find that recipients’ average
willingness-to-pay amounts to 54% of the electricity cost savings from receiving HER. Accord-
ingly, the remaining 46% reflect the consumers’ costs from HER.
As can be seen in Table A4 in the appendix, this extended welfare perspective improves the
cost-effectiveness of HER for all countries. The underlying reason is that HER reduce demand-
and supply-side imperfections beyond carbon externalities. Nevertheless, even under gener-
ous assumptions, we find that HER induce negative welfare effects for all included European
countries. In Australia, Canada, Japan, the US, and South Korea welfare effects can become
positive in favorable effect size scenarios.
6. Conclusion
This paper has examined whether the core result from the Opower experiments in the US,
the cost-effectiveness of social comparison-based home energy reports (HER) as a climate pol-
icy instrument, is transferable to other contexts. In a descriptive analysis, we show that lower
electricity consumption levels and carbon intensities of electricity generation make HER a cost-
ineffective climate policy instrument in the majority of industrialized countries beyond the US.
13

In particular, they can barely become cost-effective in European countries. This finding holds
even under very optimistic time-persistency assumptions and when a broader cost-benefit per-
spective is applied – unless HER treatment effects become very large.
We estimate the average treatment effect of HER in Germany by means of a large-scale ran-
domized controlled trial, in which we evaluate a HER intervention similar to the US-Opower
experiments. Our estimates imply only modest average reductions in electricity consumption
of 0.7%, less than half of what was observed in the US. In addition, we show that relative elec-
tricity savings are much larger for households with higher electricity consumption levels. This
finding indicates that higher electricity consumption levels are associated with larger saving
potentials – a mechanism that also can explain why effect sizes are lower in Germany, com-
pared to the US.
From a policy perspective, our results cast doubt on the potentials of HER as a climate pol-
icy instrument to curb residential electricity consumption in many industrialized countries
beyond the US. Moreover, the context variables we have presented in this paper – electric-
ity consumption levels and carbon intensities – are also relevant for the assessment of many
other climate policy instruments targeting the electricity sector. For example, behavioral in-
struments other than HER, but also price-based approaches, such as subsidies, will most likely
be considerably less cost-effective in industrialized countries other than the US.
On a more general note, our paper contributes to the emerging literature on the transferabil-
ity of causal effects across settings (Allcott 2015, Deaton and Cartwright 2016, Gechter 2016,
Hotz et al. 2005, Leviton 2017, Muller 2015, Peters et al. 2016, Pritchett et al. 2015, Vivalt 2015).
Even if a proof-of-concept is furnished with high internal validity for one policy population
– as it was done in different evaluations of the Opower case for the US – the transferability to
other policy populations can prove difficult. In particular, we show that not only the average
treatment effect is heavily context-dependent, but also other components of a cost-effectiveness
analysis. In particular, low electricity consumption levels and carbon intensities can preclude
the cost-effectiveness of HER as a climate policy instrument already a priori in many countries.
Yet, prudence in terms of external validity also applies to this present paper: Digitalization of
daily routines through smart metering and digital information gadgets might alter both the
costs and the effectiveness of information campaigns for energy conservation (see Tiefenbeck
et al. 2016, for example).
14

A. Appendix
Table A1: Comparison of HER Elements
Our reportOpower(Allcott
2011)
Would we expect thedifferences to increase the
effectiveness of our report?
Common Elements
Social (neighborhood)comparison
x x ·
Electricity consumptionfeedback
x x ·
Electricity saving tips x x ·Diverging Elements
Possibility to get updatedsocial comparisons and moreenergy saving tips via an app
x+ (can trigger continuous
engagement with theinformation from the letters)
Price discounts for energyefficient products in theonline shop of the electricityprovider
x + (Davis et al. 2014)
Frequency of letters quarterlymonthly -quarterly
- (Allcott 2011)
Update of information(comparison electricityconsumption feedback)
yearlymonthly -quarterly
-
Calculation of typicalhousehold sizes associatedwith electricity consumption
x+ (additional intuitive
comparison)
Testimonials (electricitysaving actions that otherhouseholds haveimplemented)
x +
Communication of a 10%electricity saving goal withinone year
x + (Harding and Hsiaw 2014)
Visualization of monthlyelectricity uses andcomparison to last year’sconsumption
x -
15
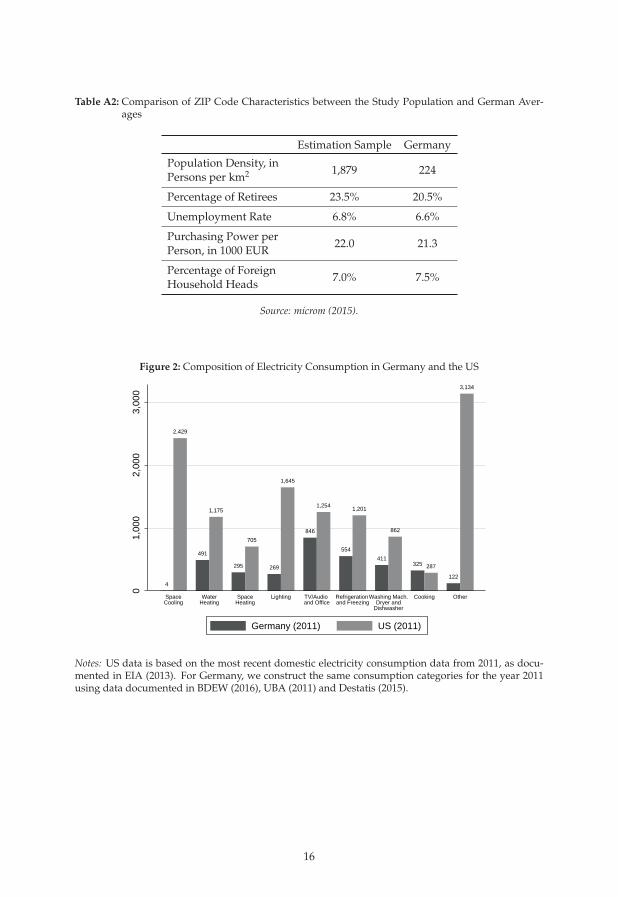
Table A2: Comparison of ZIP Code Characteristics between the Study Population and German Aver-ages
Estimation Sample Germany
Population Density, inPersons per km2 1,879 224
Percentage of Retirees 23.5% 20.5%
Unemployment Rate 6.8% 6.6%
Purchasing Power perPerson, in 1000 EUR
22.0 21.3
Percentage of ForeignHousehold Heads
7.0% 7.5%
Source: microm (2015).
Figure 2: Composition of Electricity Consumption in Germany and the US
4
2,429
491
1,175
295
705
269
1,645
846
1,254
554
1,201
411
862
325 287
122
3,134
01,
000
2,00
03,
000
SpaceCooling
WaterHeating
SpaceHeating
Lighting TV/Audio and Office
Refrigeration and Freezing
Washing Mach.Dryer and
Dishwasher
Cooking Other
Germany (2011) US (2011)
Notes: US data is based on the most recent domestic electricity consumption data from 2011, as docu-mented in EIA (2013). For Germany, we construct the same consumption categories for the year 2011using data documented in BDEW (2016), UBA (2011) and Destatis (2015).
16

Table A3: Abatement Cost under Different Scenarios on the Persistency of Treatment Effects
No Persistence 15 Perc. Points Reduction in Effect Size per Year
Country Abatement Cost in $ / t CO2 Abatement Cost in $ / t CO2
Canada 67 – 162 17 – 42United States 20 – 49 5 – 12
France 323 – 779 84 – 202Germany 75 – 182 20 – 47Italy 139 – 335 36 – 87Poland 81 – 196 21 – 51Spain 121 – 293 32 – 76Sweden 1,162 – 2,799 302 – 727United Kingdom 64 – 153 17 – 40
Japan 39 – 94 10 – 24South Korea 65 – 156 17 – 41
Australia 22 – 53 6 – 14
Notes: Following Allcott and Rogers (2014), the calculations in the table assume linear attenuation ratesof 15%. The cost-effectiveness calculations extrapolate electricity reductions until linear decay rateslead to zero reductions. Assumptions about annual electricity uses, carbon intensities of electricitygeneration and the range of effect sizes are as in Table 1.
B. Welfare Calculations
We follow Allcott and Kessler (2015) and calculate the welfare implications of home energy
reports by the following expression:
ΔW = ΔV − Cn + (πe − φe)Δe,
where:
• ΔW: welfare change per participant induced by the intervention.
• ΔV: private welfare gain from receiving HER. We approximate it by the WTP measure
from Allcott and Kessler (2015) that reflects all costs and benefits as perceived by the
recipient households. More specifically, households value HER by 54% of the realized
electricity cost savings, so that the consumer welfare gain of HER is ΔV = Δe · 0.54 · pe.
• Cn: annual cost of the HER per participant. We assume the cost per quarterly letter to be
at 1 US$ per letter, so that the annual cost are Cn = 4$.
17

• πe = pe − cc: mark-up of electricity retail prices pe over production cost cc.
• pe: electricity retail prices that are taken from Eurostat (2016) and the IEA (2016).
• cc: electricity generation cost. As electricity generation cost depends on the time-of-use
of electricity and the time horizon of the analysis, finding a precise measure of genera-
tion cost cc in electricity markets is inherently difficult. We do not want to take a stance
on the question of whether levelized generation cost or spot prices are the more suitable
electricity generation cost measure and thus present results for both approaches to ap-
proximate cc. First, following Allcott and Kessler (2015) we use levelized generation cost
and, second, annual spot price averages. A complete description of all data sources for
spot prices and levelized cost is given in the notes to Table A4.
• φe captures the environmental externalities from electricity generation. We approximate
φe by the social cost of carbon, estimated at around 38 US$ in 2015 IAWG (2013).
• Δe denotes the average treatment effects of HER on electricity consumption (in kWh). To
account for the different effect sizes in the Opower studies (e.g. Allcott 2011) and in this
paper, we use the range of 0.7-3.3%.
As a reference point, Column 6 of Table A4 displays the welfare estimate when we only ac-
count for direct cost and climate benefits of HER. This is the welfare analysis that is commonly
implemented in classical program evaluations of climate policy interventions and corresponds
to our analysis in Section 2. The results show that – under these assumptions – welfare effects
of HER are negative in all countries except for the US and Australia, where abatement cost of
HER are lower than 38 US$ (Table 1).
Columns 7 and 8 show results for the expanded scope of the welfare analysis as suggested
by Allcott and Kessler (2015) for spot prices and levelized cost, respectively. It shows that in a
majority of countries HER are not welfare improving, even under optimistic assumptions on
effect sizes. Only in South Korea can HER reach positive welfare changes, albeit only when the
effectiveness of HER comes close to the upper bound of 3.3%. Using levelized cost in Column
8, the welfare implications of HER improve. Positive welfare effects are possible in Australia,
Canada, the US, Japan, and South Korea. In all European countries, welfare effects are still
negative, except for Sweden.
18

Tabl
eA
4:In
tern
atio
nalC
ompa
riso
nof
Wel
fare
Effe
cts
ofH
ERIn
terv
enti
ons
(1)
(2)
(3)
(4)
(5)
(6)
(7)
(8)
Cou
ntry
Ave
rage
Elec
tric
ity
Con
sum
p-ti
onin
kWh
Ret
ail
Pric
ein
$/
kWh
Spot
Pric
ein
$
Leve
lized
Cos
tof
Mar
gina
lPl
anti
n$
/kW
h
CO
2Em
issi
ons
ing
per
kWh
from
Elec
tric
ity
Gen
erat
ion
Wel
fare
Cha
nge,
Con
side
ring
only
Envi
ronm
enta
lEx
tern
alit
ies
(as
inth
eM
ain
Text
),in
$
Wel
fare
Cha
nge
usin
gSp
otPr
ice,
in$
Wel
fare
Cha
nge
usin
gLe
veliz
edC
ost,
in$
Can
ada
11,3
790.
107
0.02
20.
071
158
−3.1
–−1
.7−1
1.9
–−7
.30.
3–
6.4
Uni
ted
Stat
es12
,293
0.12
70.
035
0.07
148
9−0
.9–
3.5
−5.9
–−4
.81.
2–
8.5
Fran
ce5,
859
0.18
60.
043
0.10
164
−3.8
–−3
.5−1
1.8
–−7
.2−2
.5–−0
.5G
erm
any
3,30
40.
327
0.03
50.
106
486
−3.2
–−2
.0−1
4.6
–−8
.4−6
.8–−5
.2It
aly
2,54
20.
269
0.05
80.
099
343
−3.5
–−2
.9−8
.5–−5
.9−5
.0–−4
.4Po
land
1,93
50.
157
0.04
00.
083
769
−3.2
–−2
.1−4
.2–−4
.1−2
.9–−1
.4Sp
ain
4,04
00.
263
0.05
60.
083
247
−3.5
–−2
.7−1
1.4
–−7
.1−7
.8–−5
.6Sw
eden
8,02
50.
208
0.02
40.
114
13−3
.9–−3
.9−2
2.8
–−1
1.8
−1.9
–0.
9U
nite
dK
ingd
om4,
145
0.24
20.
062
0.10
845
9−3
.0–−1
.6−8
.4–−5
.8−3
.2–−2
.1
Japa
n5,
434
0.22
50.
081
0.14
357
2−2
.4–−0
.1−4
.2–−4
.10.
6–
7.0
Sout
hK
orea
3,48
90.
103
0.09
00.
130
536
−3.0
–−1
.7−1
.0–
3.3
0.9
–7.
9
Aus
tral
ia6,
959
0.21
60.
082
0.10
879
8−1
.1–
3.0
−2.7
–−0
.9−0
.3–
5.0
Not
es:O
urca
lcul
atio
nsas
sum
epr
inti
ngan
dm
ailin
gco
stof
one
dolla
rpe
rre
port
,fou
rre
port
spe
rye
aran
dav
erag
eel
ectr
icit
yre
duct
ions
of0.
7-3.
3%.A
vera
geel
ectr
icit
yco
nsum
ptio
nan
dC
O2
inte
nsit
ies
ofel
ectr
icit
yge
nera
tion
corr
espo
ndto
2013
,the
mos
trec
entl
yav
aila
ble
year
docu
men
ted
inW
EC(2
016)
and
IEA
(201
5),r
espe
ctiv
ely.
Ret
aile
lect
rici
typr
ices
for
2015
are
draw
nfr
omEu
rost
at(2
016)
for
EU-c
ount
ries
and
from
IEA
(201
6)fo
rth
ere
mai
ning
coun
trie
s.Sp
otpr
ices
for
elec
tric
ity
are
annu
alsp
otpr
ice
aver
ages
from
the
follo
win
gso
urce
s:U
SA(u
nwei
ghte
dm
ean
of8
pric
ehu
bsfr
omEI
A(2
017)
);Fr
ance
,Ger
man
yan
dU
K(E
PEX
2016
);It
aly
(GM
E20
17);
Pola
nd(P
SE20
17);
Spai
n(O
MIE
2016
);Sw
eden
and
Nor
way
(unw
eigh
ted
mea
nof
regi
onal
pric
esfr
omN
ord
Pool
(201
7));
Japa
n(J
EPX
2017
);So
uth
Kor
ea(K
PX20
17);
Aus
tral
ia(u
nwei
ghte
dm
ean
ofre
gion
alpr
ices
from
AEM
C(2
016)
);C
anad
a(u
nwei
ghte
dm
ean
ofth
eH
ourl
yO
ntar
ioEn
ergy
Pric
e(C
lass
Bfo
rre
side
ntia
lCon
sum
ers)
IESO
(201
5),a
ndth
eA
lber
taA
vera
gePo
olPr
ice,
AES
O(2
016)
).Th
ele
veliz
edco
stof
ener
gy(L
CO
E)ar
eta
ken
from
OEC
D(2
015)
.W
eas
sum
eco
mbi
ned
cycl
ega
stu
rbin
e(C
CG
T)as
mar
gina
lpow
erpl
ant
inth
ere
spec
tive
coun
try,
asfo
rex
ampl
eA
llcot
tan
dR
oger
s(2
014)
and
Allc
ott
and
Mul
lain
atha
n(2
010)
.N
ote
that
com
bine
dcy
cle
gas
turb
ine
(CC
GT
)te
ndto
have
larg
erpr
oduc
tion
cost
for
elec
tric
ity
soth
atw
ete
ndto
over
esti
mat
eth
ew
elfa
reim
pact
sof
HER
.Fur
ther
mor
e,w
eta
keth
ela
rges
tava
ilabl
epr
oduc
tion
cost
esti
mat
es,
assu
min
ga
disc
ount
rate
of10
%,w
hich
incr
ease
sw
elfa
refu
rthe
r.O
nly
inPo
land
,whe
rena
tura
lgas
pow
erpl
ants
are
virt
ually
abse
ntan
dco
alpo
wer
plan
tsar
epr
edom
inan
t,w
eem
ploy
leve
lized
cost
ofa
hard
coal
plan
t(as
we
lack
LCO
Eda
tafo
rPo
land
,we
appr
oxim
ate
itby
the
LCO
Eof
aha
rdco
alpo
wer
plan
tin
Ger
man
yO
ECD
(201
5),w
here
fuel
cost
for
hard
coal
are
very
sim
ilar)
.In
case
sw
here
esti
mat
esfo
r20
15ar
eav
aila
ble,
we
use
the
late
stav
aila
ble
esti
mat
efr
omO
ECD
(201
5):S
wed
en(v
alue
from
2010
),Sp
ain
(val
uefr
om19
98)a
ndIt
aly
(val
uefr
om20
10).
As
LCO
Ear
eun
avai
labl
efo
rA
ustr
alia
inO
ECD
(201
5),w
eta
keth
eup
per
boun
dof
the
rang
epr
ovid
edin
WEC
(201
3)),
and
appr
oxim
ate
the
LCO
Ein
Can
ada
byth
eLC
OE
inth
eU
S,w
hich
has
been
very
sim
ilar
inth
epa
stO
ECD
(201
5).W
here
appl
icab
le,w
eus
eav
erag
eex
chan
gera
tes
for
2015
,as
prov
ided
byFE
D(2
016)
.The
2015
aver
age
annu
alex
chan
gera
tefo
rPo
land
(PLN
)is
prov
ided
byN
BP(2
017)
.
19

ReferencesAEMC, 2016. Residential Electricity Price Trends, Final Report. Australian En-
ergy Market Commission. URL: http://www.aemc.gov.au/getattachment/be91ba47-45df-48ee-9dde-e67d68d2e4d4/2016-Electricity-Price-Trends-Report.aspx (accessed February 23, 2017).
AESO, 2016. AESO 2015 Annual Market Statistics. Alberta Electric System Operator.URL: https://www.aeso.ca/assets/listedfiles/2015-Annual-Market-Stats-WEB.pdf(accessed February 24, 2017).
Allcott, H., 2011. Social Norms and Energy Conservation. Journal of Public Economics 95 (9),1082–1095.
Allcott, H., 2015. Site Selection Bias in Program Evaluation. The Quarterly Journal of Eco-nomics 130 (3), 1117–1165.
Allcott, H., Kessler, J. B., 2015. The Welfare Effects of Nudges: A Case Study of Energy UseSocial Comparisons. National Bureau of Economic Research (NBER) Working Paper No.21671 (October).
Allcott, H., Mullainathan, S., 2010. Behavior and Energy Policy. Science 327 (5970), 1204–1205.
Allcott, H., Rogers, T., 2014. The Short-Run and Long-Run Effects of Behavioral Interven-tions: Experimental Evidence from Energy Conservation. The American Economic Review104 (10), 3003–3037.
BDEW, 2016. Energie-Info: Stromverbrauch im Haushalt. Bundesverband derEnergie- und Wasserwirtschaft. URL: https://www.bdew.de/internet.nsf/id/0D6D0C20786B2929C1257FE90030A849/$file/BDEW_Stromverbrauch%20im%20Haushalt_Stand_Juli%202016.pdf (accessed October 28, 2016).
Brandon, A., Ferraro, P. J., List, J. A., Metcalfe, R. D., Price, M. K., Rundhammer, F., 2017. Do theEffects of Social Nudges Persist? Theory and Evidence from 38 Natural Field Experiments.National Bureau of Economic Research (NBER) Working Paper No. 23277 (March).
Davis, L. W., Fuchs, A., Gertler, P., 2014. Cash for Coolers: Evaluating a Large-Scale ApplianceReplacement Program in Mexico. American Economic Journal: Economic Policy 6 (4), 207–238.
Deaton, A., Cartwright, N., 2016. Understanding and Misunderstanding Randomized Con-trolled Trials. National Bureau of Economic Research (NBER) Working Paper No. 22595(September).
Dehejia, R., Pop-Eleches, C., Samii, C., 2015. From Local to Global: External Validity in a Fertil-ity Natural Experiment. National Bureau of Economic Research (NBER) Working Paper No.21459 (August).
Destatis, 2015. Umweltnutzung und Wirtschaft. Tabellen zu denUmweltokonomischen Gesamtrechnungen. URL: https://www.destatis.de/DE/Publikationen/Thematisch/UmweltoekonomischeGesamtrechnungen/Querschnitt/UmweltnutzungundWirtschaftTabelle5850007157006Teil_2.pdf?__blob=publicationFile (accessed October 28, 2016).
Dietz, T., Gardner, G. T., Gilligan, J., Stern, P. C., Vandenbergh, M. P., 2009. Household ActionsCan Provide a Behavioral Wedge to Rapidly Reduce US Carbon Emissions. Proceedings ofthe National Academy of Sciences 106 (44), 18452–18456.
20

EIA, 2013. Annual Energy Outlook 2013. U.S. Energy Information Administration. URL: http://www.eia.gov/outlooks/aeo/pdf/0383(2013).pdf (accessed October 28, 2016).
EIA, 2017. Wholesale Electricity and Natural Gas Market Data. U.S. Energy InformationAdministration. URL: https://www.eia.gov/electricity/wholesale/history (accessedMarch 2, 2017).
EPEX, 2016. EPEX SPOT Reaches in 2015 the Highest Spot Power Exchange Volume Ever.European Power Exchange - Press Release. URL: https://www.epexspot.com/document/34250/2016-01-08_EPEX%20SPOT_2015_Annual%20Press%20Release.pdf (accessed March2, 2017).
Eurostat, 2016. Electricity Price Statistics. URL: http://ec.europa.eu/eurostat/statistics-explained/index.php/Electricity_price_statistics (accessed Febru-ary 23, 2017).
FED, 2016. Foreign Exchange Rates - G.5A. Board of Governors of the Federal Reserve Sys-tem. Release Date: January 4, 2016. URL: https://www.federalreserve.gov/releases/g5a/20160104/ (accessed February 24, 2017).
Ferraro, P. J., Miranda, J. J., Price, M. K., 2011. The Persistence of Treatment Effects with Norm-Based Policy Instruments: Evidence from a Randomized Environmental Policy Experiment.The American Economic Review 101 (3), 318–322.
Ferraro, P. J., Price, M. K., 2013. Using Non-Pecuniary Strategies to Influence Behavior: Evi-dence from a Large Scale Field Experiment. Review of Economics and Statistics 95 (1), 64–73.
Frey, B. S., Meier, S., 2004. Social Comparisons and Pro-social Behavior: Testing “ConditionalCooperation” in a Field Experiment. The American Economic Review 94 (5), 1717–1722.
Gechter, M., 2016. Generalizing the Results from Social Experiments: Theory and Evi-dence from Mexico and India. URL: http://www.personal.psu.edu/mdg5396/Gechter_Generalizing_Social_Experiments.pdf (accessed June 6, 2017).
GME, 2017. Summary Data - MPE-MGP Overview . Gestore del Mercato Elettrico. URL: http://www.mercatoelettrico.org/En/Statistiche/ME/DatiSintesi.aspx (accessed March 2,2017).
Goulder, L. H., 2013. Markets for Pollution Allowances: What Are the (New) Lessons? TheJournal of Economic Perspectives 27 (1), 87–102.
Greenstone, M., Kopits, E., Wolverton, A., 2013. Developing a Social Cost of Carbon for USRegulatory Analysis: A Methodology and Interpretation. Review of Environmental Eco-nomics and Policy 7 (1), 23–46.
Harding, M., Hsiaw, A., 2014. Goal Setting and Energy Conservation. Journal of EconomicBehavior & Organization 107, 209–227.
Hotz, J. V., Imbens, G. W., Mortimer, J. H., 2005. Predicting the Efficacy of Future TrainingPrograms Using Past Experiences at Other Locations. Journal of Econometrics 125 (1-2), 241–270.
IAWG, 2013. Technical Support Document: Technical Update of the Social Cost of Carbon forRegulatory Impact Analysis. U.S. Interagency Working Group on the Social Cost of Car-bon for Regulatory Impact Analysis. URL: https://www.whitehouse.gov/sites/default/files/omb/inforeg/social_cost_of_carbon_for_ria_2013_update.pdf (accessed Octo-ber 28, 2016).
21

IEA, 2015. CO2 Emissions from Fuel Combustion - Highlights. International EnergyAgency. URL: https://www.iea.org/publications/freepublications/publication/CO2EmissionsFromFuelCombustionHighlights2015.pdf (accessed October 28, 2016).
IEA, 2016. Energy Prices and Taxes - Fourth Quarter 2016. International Energy Agency.URL: http://www.oecd.org/publications/energy-prices-and-taxes-16096835.htm(accessed February 23, 2017).
IESO, 2015. Ontario Energy Report Q4 2015. Independent Electricity System Operator. URL:https://www.ontarioenergyreport.ca/pdfs/5806_IESO_OntarioEnergyReportQ42016_Electricity_EN_FA.pdf (accessed February 23, 2017).
Ito, K., 2015. Asymmetric Incentives in Subsidies: Evidence from a Large-Scale Electricity Re-bate Program. American Economic Journal: Economic Policy 7 (3), 209–237.
Jaime Torres, M. M., Carlsson, F., 2016. Social Norms and Information Diffusion in Water-saving Programs: Evidence from a Randomized Field Experiment in Colombia. EfD Discus-sion Paper Series 16-05.
JEPX, 2017. Spot Market Indices - Fiscal Year 2015. Japan Electric Power Exchange. URL: http://www.jepx.org/market/excel/index_2015.csv (accessed February 24, 2017).
KPX, 2017. System Marginal Price 2015. Korea Power Exchange. URL: http://epsis.kpx.or.kr/epsis/ekmaStaticMain.do?cmd=004013&flag=&locale=EN (accessed February 5, 2017).
Leviton, L. C., 2017. Generalizing about Public Health Interventions: A Mixed-Methods Ap-proach to External Validity. Annual Review of Public Health 38, 371–91.
Levitt, S. D., List, J. A., 2009. Field Experiments in Economics: The Past, the Present, and theFuture. European Economic Review 53 (1), 1–18.
microm, 2015. Socioeconomic Regional Data. Version: 1. RWI – Rheinisch–Westfalisches In-stitut fur Wirtschaftsforschung e.V. DOI: 10.7807/microm:einwGeAl:V3,10.7807/microm:alq:V3,10.7807/microm:kaufkraft:V3.
Muller, S. M., 2015. Causal Interaction and External Validity: Obstacles to the Policy Relevanceof Randomized Evaluations. The World Bank Economic Review 29 (suppl 1), S217–S225.
NBP, 2017. Statistics - Exchange Rates. Narodowy Bank Polski. URL: http://www.nbp.pl/homen.aspx?f=/kursy/kursyen.htm (accessed March 3, 2017).
Nord Pool, 2017. Elspot Prices. Nord Pool. URL: http://www.nordpoolspot.com/Market-data1/Elspot/Area-Prices/ (accessed March 2, 2017).
Nordhaus, W., 2014. Estimates of the Social Cost of Carbon: Concepts and Results from theDICE-2013R Model and Alternative Approaches. Journal of the Association of Environmen-tal and Resource Economists 1 (1/2), 273–312.
OECD, 2015. Projected Costs of Generating Electricity - 2015 Edi-tion. Organisation for Economic Co-operation and Development. URL:https://www.iea.org/publications/freepublications/publication/projected-costs-of-generating-electricity-2015-edition.html (accessed February23, 2017).
OMIE, 2016. Price Report. Operador do Mercado Ibrico de Energia. URL: http://www.omie.es/files/informe_precios_ing_navegable.pdf (accessed March 2, 2017).
22

Perino, G., 2015. Climate Campaigns, Cap and Trade, and Carbon Leakage: Why Trying toReduce Your Carbon Footprint Can Harm the Climate. Journal of the Association of Envi-ronmental and Resource Economists 2 (3), 469–495.
Peters, J., Langbein, J., Roberts, G., 2016. Policy Evaluation, Randomized Controlled Trials, andExternal Validity A Systematic Review. Economics Letters 147, 51–54.
Pritchett, L., Sandefur, J., et al., 2015. Learning from Experiments when Context Matters. Amer-ican Economic Review 105 (5), 471–75.
PSE, 2017. Electricity Prices and Volumes on the Balancing Market. Polskie Sieci Elektroen-ergetyczne. URL: http://www.pse.pl/index.php?dzid=129&did=&lang_id=2 (accessedFebruary 24, 2017).
Shang, J., Croson, R., 2009. A Field Experiment in Charitable Contribution: The Impact ofSocial Information on the Voluntary Provision of Public Goods. The Economic Journal119 (540), 1422–1439.
Tiefenbeck, V., Goette, L., Degen, K., Tasic, V., Fleisch, E., Lalive, R., Staake, T., 2016. Overcom-ing Salience Bias: How Real-Time Feedback Fosters Resource Conservation. ManagementScience, forthcoming.
UBA, 2011. Klimaschutz durch Reduzierung des Energiebedarfs fur Gebaudekuhlung.Umweltbundesamt. URL: https://www.umweltbundesamt.de/sites/default/files/medien/461/publikationen/3979.pdf (accessed October 28, 2016).
Vivalt, E., 2015. Heterogeneous Treatment Effects in Impact Evaluation. American EconomicReview: Papers & Proceedings 105 (5), 467–70.
WEC, 2013. World Energy Perspective - Cost of Energy Technologies. World En-ergy Council. URL: https://www.worldenergy.org/wp-content/uploads/2013/09/WEC_J1143_CostofTECHNOLOGIES_021013_WEB_Final.pdf (accessed February 23, 2017).
WEC, 2016. Energy Efficiency Indicators via Enerdata, Average Electricity Consumptionper Electrified Household. World Energy Council. URL: https://www.wec-indicators.enerdata.eu/secteur.php/household-electricity-use.html (accessed October 28,2016).
23
Top Related