![SSRN-Id1300542[1].PDF Currency Imp](https://static.fdocuments.us/doc/165x107/547ab754b4af9fa0158b4bf2/ssrn-id13005421pdf-currency-imp.jpg)


Languages
Pages
Legal


Semiparametric pricing of multivariate contingent claims
August 1999
Joshua V. RosenbergDepartment of Finance
NYU - Stern School of Business44 West 4th Street, Suite 9-190
New York, New York 10012-1126(212) 998-0311

2
Abstract
This paper develops and implements a methodology for pricing multivariate contingent claims
(MVCC’s) based on semiparametric estimation of the multivariate risk-neutral density function.
This methodology generates MVCC prices which are consistent with current market prices of
univariate contingent claims.
This method allows for completely general marginal risk-neutral densities and is compatible
with all univariate risk-neutral density estimation techniques. The univariate risk-neutral densities
are related by their risk-neutral correlation, which is estimated using time-series data on asset
returns and an empirical pricing kernel (Rosenberg and Engle, 1999). This permits the multivariate
risk-neutral density to be identified without requiring observation of multivariate contingent claims
prices.
The semiparametric MVCC pricing technique is used for valuation of one-month options on the
better of two equity index returns. Option contracts with payoffs dependent on are four equity index
pairs are considered: S&P500 - CAC40, S&P500 - NK225, S&P500 - FTSE100, and S&P500 -
DAX30.
Five marginal risk-neutral densities (S&P500, CAC40, NK225, FTSE100, and DAX30) are
estimated semiparametrically using a cross-section of contemporaneously measured equity index
option prices in each market. A bivariate risk-neutral Plackett (1965) density is constructed using
the given marginals and risk-neutral correlation derived using an empirical pricing kernel and the
historical joint density of the index returns. Price differences from a lognormal pricing formula
using historical and risk-neutral return moments are found to be significant.
___________________
This paper has benefited from the suggestions of David Bates, Stephen Blyth, Frank Diebold, as well as
participants at the Risk 99 conference and the 1999 Derivatives Research Project Research Retreat. The
most recent version of this paper is available at http://www.stern.nyu.edu/~jrosenb0/J_wpaper.htm. ©1999

3
I. Introduction
Recently, the literature in univariate contingent claims valuation has focused on pricing by
interpolation. A wide variety of estimation techniques have been developed — including
parametric, semiparametric, and nonparametric — which rationalize an observed set of option
prices, and may then be used to interpolate prices of unobserved assets.
Most of these techniques are based on estimation of a univariate risk-neutral (or state price)
density which is fitted to a set of observed option prices for a particular underlying asset. The risk-
neutral density may then be used to price other derivatives which are based on the same underlying
asset. Related papers include Sherrick, Irwin, and Foster (1990, 1992), Shimko (1993), Derman
and Kani (1994), Rubinstein (1994a), Longstaff (1995), and Ait-Sahalia and Lo (1998).
None of these techniques may be directly applied to the pricing of multivariate contingent
claims (MVCC’s) because knowledge of the marginal risk-neutral densities is not sufficient to
identify the multivariate risk-neutral density which is necessary for pricing. In general, there are an
infinite number of multivariate densities consistent with given marginals.
The majority of previous MVCC pricing papers have used generalizations of the Black-and
Scholes (1973) continuous-time brownian motion framework or the Cox, Ross, Rubinstein (1979)
discrete-time binomial framework. Examples of the first type include Margrabe (1978), Stulz
(1982), Johnson (1987), Reiner (1992), and Shimko (1994). Examples of the second type include
Stapleton and Subrahmanyam (1984a, 1984b), Boyle (1988), Boyle, Evnine, and Gibbs (1989), and
Rubinstein (1992, 1994b).
A drawback of these approaches is the restrictive nature of the assumptions on the underlying
price processes. These techniques do not usually replicate the prices of traded univariate options,
and result in MVCC prices which are not reflective of current market conditions.
Rosenberg (1998) provides a methodology for MVCC valuation using a general parametric
multivariate risk-neutral density function — the multivariate flexible density function — and the
prices of options on individual assets and the prices of options on multiple assets. This technique is
well-suited to pricing multivariate currency options for which there are traded options on
individual currencies and traded cross-currency options. Ho, Stapleton, Subrahmanyam (1995)
provide a binomial approximation technique for MVCC pricing.

4
This paper generalizes univariate interpolation-based pricing methods to the multivariate case
by developing a multivariate contingent claims pricing technique based on semiparametric
estimation of a multivariate risk-neutral Plackett (1965) density. This method allows for completely
general marginal risk-neutral densities and is compatible with all univariate risk-neutral density
estimation techniques. MVCC prices using this method are consistent with current market prices of
univariate contingent claims.
This technique has several advantages over existing techniques. First, any desired method may
be used to estimate the marginal densities including non-parametric, semiparametric, or fully
parametric techniques, depending on the quantity and quality of observed prices of options traded
on individual assets.
Second, prices of options whose payoff depends on multiple assets do not need to be observed.
A technique is introduced to estimate the risk-neutral correlation using time-series individual asset
returns and an empirical pricing kernel (Rosenberg and Engle, 1999). This means that prices of
multivariate contingent claims may be estimated as long as there are options traded on the
individual assets.
The semiparametric MVCC pricing technique is used for valuation of one-month options on the
better of two equity index returns. Option contracts with payoffs dependent on are four equity index
pairs are considered: S&P500 - CAC40, S&P500 - NK225, S&P500 - FTSE100, and S&P500 -
DAX30.
Five marginal risk-neutral densities (S&P500, CAC40, NK225, FTSE100, and DAX30) are
estimated semiparametrically using a cross-section of contemporaneously measured equity index
option prices in each market. A bivariate risk-neutral Plackett (1965) density is constructed using
the given marginals and an estimated risk-neutral correlation based on an empirical pricing kernel
and the historical joint density of the index returns. Price differences from a lognormal pricing
formula using historical and risk-neutral return moments are found to be significant.
The remainder of the paper is structured as follows. Section II describes the semiparametric
multivariate risk-neutral density estimation technique. Section III presents an application of this
technique for the pricing of options on the better of two equity index returns. Section IV concludes
the paper.
II. Semiparametric pricing of MVCCs

5
Univariate interpolative pricing techniques are designed to provide the price of a contingent claim
on a particular underlying asset, which is consistent with the observed prices of contingent claims
on the same underlying asset. These techniques identify a pricing function based on the condition
that the pricing function should reprice existing assets accurately.
The “risk-neutral density” representation of the asset pricing problem has been found to be a
convenient framework for univariate interpolative pricing. This is because a “risk-neutral density”
representation is guaranteed to exist in the absence of arbitrage, the same risk-neutral density may
be used to price all claims dependent on the same underlying asset, and interpolated prices using
this representation do not generate arbitrage opportunities.
Equation (1) presents “risk-neutral density” representation of the asset pricing problem which
prices all contingent claims dependent on an underlying asset with price XT. Any contingent claim
which has its date T payoff entirely determined by the date T underlying asset price may be priced
using this equation. Let the payoff function be written as gX(XT) and the univariate risk-neutral
density function be written as fX,t*(XT).
(1) D e g X f X dXX tr T t
X T X t T T,( )
,*( ) ( )= − − ∫
From a standard asset pricing perspective, equation (1) is a pricing formula which generates the
price of a contingent claim (DX,t), given its payoff function and an estimated risk-neutral density.
Equation (1) also implicitly provides the estimation strategy for obtaining the risk-neutral density
fX,t*(XT). If there are traded contingent claims dependent an underlying asset with price XT, the
observed prices of these assets (DX,t,1, DX,t,2, …, DX,t,N) transform equation (1) into an identifying
condition for the risk-neutral density. Estimation of the risk-neutral density entails solution of the
inverse asset pricing problem: finding a risk-neutral density which is consistent with observed
prices.
The multivariate contingent claim pricing problem may be viewed in terms of finding a
multivariate risk-neutral density f*X,Y,…,t (XT,YT,ZT, …) which is consistent with observed option
prices for several different underlying assets. Equation (2) provides the special case of a bivariate
pricing equation which depends on a bivariate risk-neutral density fX,Y,t*(XT,YT).

6
(2) D e g X Y f X Y dX dYX Y tr T t
X Y T T X Y t T T T T, ,( )
, , ,*( , ) ( , )= − − ∫∫
If there are traded contingent claims dependent on an underlying asset with price YT, then the
univariate risk-neutral density fY,t*(YT) may be obtained by an of the existing univariate risk-neutral
density estimation techniques.
However, it is clear that knowledge of two marginals is not sufficient to uniquely determine
their joint density. For example, in the bivariate normal case, knowledge that both XT and YT have
standard normal densities (µX=0, σX=1, µY=0, σY=1) does not uniquely determine their joint
density. In particular, the correlation coefficient (ρ) is unknown.
The estimation problem in this paper is to find a multivariate risk-neutral density which has
given marginal risk-neutral densities. For simplicity, the bivariate case is discussed in the
remainder of the paper. Thus, the estimation problem is to determine fX,Y,t*(XT,YT) given fX,t
*(XT)
and fY,t*(YT).
There are two facets to this problem. First, an technique is required to construct a bivariate
density given two previously estimated marginal densities. This paper utilizes the multivariate
density due to Plackett (1965). Second, a technique is required to describe the relationship between
the marginal densities. This paper estimates the risk-neutral correlation using a time-series of asset
returns and an estimated pricing kernel.
II.i. Estimation of a multivariate risk-neutral densities with given marginals
While several approaches have been proposed to construct multivariate densities with completely
general marginals, this paper utilizes the bivariate density due to Plackett (1965), which is further
developed by Mardia (1967), and generalized to higher orders by Molenberghs and LeSaffre
(1994) as well as Chakak and Koehler (1995).
There are several advantages to the multivariate Plackett density family. First, this density
family is compatible with completely general marginals. Second, this family allows for correlations
spanning the range of -1 to 1 and includes a member corresponding to independence. Third,
7
association between pairs of random variables is measured using a single parameter. This is ideal
for modeling situations in which data on the cross-moments of the multivariate density is limited.
Alternative density families which allow completely general marginals include that of
Morgenstern (1956), Farlie (1960), and Gumbel (1960). Unfortunately, this density family severely
restricts the degree of allowable correlation — typically, to less than 1/3 in absolute value —
limiting its usefulness in practice. The technique of copulas (see, e.g. ) is another possible
methodology for combining specified marginals into a joint distribution. Copulas require an inverse
probability transformation and are typically used when the marginals are specified in closed form;
however, extension to the semi-parametric and non-parametric case is possible.
The bivariate Plackett density is defined as follows. Given univariate densities fX,t*(XT) and
fY,t*(YT) with cumulative density functions FX,t
*(XT) and FY,t*(YT), the cumulative Plackett joint
density function FX,Y,t*(XT,YT) is given by:
(3) [ ]
F X Y S F X F Y S
S F X F Y
F X Y F X F Y
X Y t T T X t T Y t T
X t T Y t T
X Y t T T X t T Y t T
, , , ,
, ,
, , , ,
( , ) { ( ) ( ) ( )} / { ( )}
( ) ( ) ( )
( , ) ( ) ( )
= + − −
− ≠
= − + −
=
2124 1 2 1
1 1
ψ ψ ψ ψ
ψ
ψ
1
with
= 1
The degree of association between XT and YT is determined by the parameter ψ , which is non-
negative. When ψ is zero, the correlation is -1; when ψ is one, the correlation is 0; and as ψ
approaches positive infinity, the correlation approaches 1. In the continuous case, the bivariate
density function is obtained by taking the second cross-partial derivative with respect to XT and YT.
The discrete density function is obtained in the usual manner.
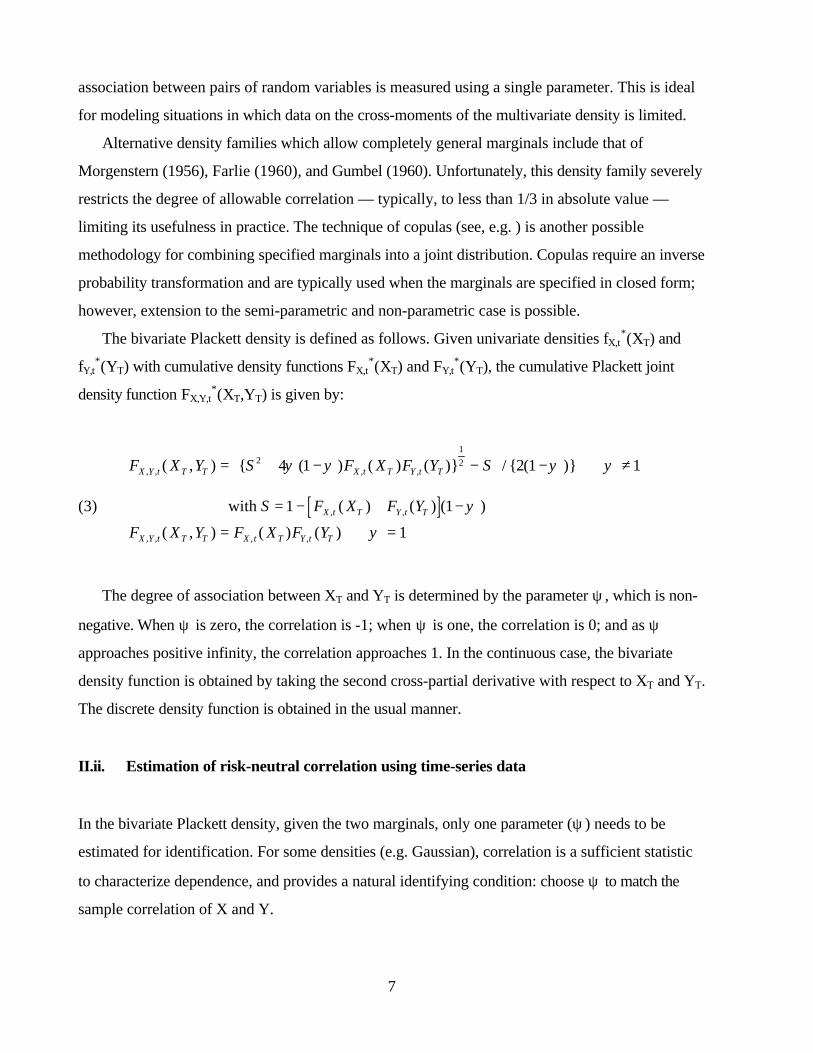
II.ii. Estimation of risk-neutral correlation using time-series data
In the bivariate Plackett density, given the two marginals, only one parameter (ψ ) needs to be
estimated for identification. For some densities (e.g. Gaussian), correlation is a sufficient statistic
to characterize dependence, and provides a natural identifying condition: choose ψ to match the
sample correlation of X and Y.

8
However, the joint densities of some financial time series exhibit asymmetric correlation
(different correlations in up and down markets) suggesting that another criterion (e.g. semi-
correlation) should be used. See, e.g., Erb, Harvey, Viskanta (1994), Longin and Solnik (1995), and
De Santis and Gerard (1997). For the purposes of multivariate contingent claim pricing, only the
dependence structure over in-the-money states is relevant. Hence, the suggested criterion would be
a truncated correlation measure (e.g. semi-correlation in the case of a standard bivariate at-the-
money option) over these states.
This paper develops an estimator based on risk-neutral correlation; the extension to risk-neutral
semi-correlation or truncated correlation is straightforward. In particular, the time-series
correlation between the asset returns and an empirical pricing kernel to estimate the risk-neutral
correlation. Then, an optimization procedure is used to select the value of ψ which replicates the
estimated risk-neutral correlation in the bivariate risk-neutral density with the given marginals.
The objective and risk-neutral densities are linked to each other through the risk-neutral pricing
equation. This relationship is used to transform data on underlying asset density into data on the
risk-neutral density.
Consider the ratio of the discounted risk-neutral density and the original density, which is
referred to as the pricing kernel. The pricing kernel measures investor risk aversion by defining the
probability normalized value of the payoff in each state, i.e. the state price per unit probability.
Notice that the discounted risk-neutral density is the state price density.
(4)
Objective density:
Pricing kernel:
Risk - neutral density:
f X Y
K X Y e f X Y f X Y
f X Y e f X Y K X Y
X Y t T T
t T T Tr T t
X Y t T T X Y t T T
X Y t T Tr T t
X Y t T T t T T T
, ,
,( )
, ,*
, ,
, ,* ( )
, , ,
( , )
( , ) ( , ) / ( , )
( , ) ( , ) ( , )
=
=
− −
−
It is clear that knowledge of the pricing kernel and objective density fully determines the risk-
neutral density. A more limited goal is to determine the risk-neutral correlation, given data on the
objective density and the pricing kernel.
Consider the risk-neutral correlation between XT and YT, where E*[•] denotes the expectation
taken under the risk-neutral measure fX,Y,t*(XT,YT) and σ*[XT] and σ*[YT] are the risk-neutral
standard deviations of XT and YT.

9
(4) ( ) ( )ρ σ σX Y T T T T T TE X Y E X E Y X Y,* * * * *[ ] [ ] [ ] / [ ] [ ]= −
There are five risk-neutral moments to be estimated to evaluate equation (4). The following
describes the estimator for risk-neutral expectation of the product of XT and YT: E*[XTYT]. The
remaining moments estimators are determined in an analogous manner. Using equation (4) to
rewrite the moment condition in terms of the objective density and the pricing kernel:
(5) E X Y X Y f X Y dX dY e X Y f X Y K X Y dX dYT T T T X Y t T T Tr T t
T T X Y t T T t T T T T T*
, ,* ( )
, , ,[ ] ( , ) ( , ) ( , )= = − ∫∫∫∫
Equation (5) states that the risk-neutral moment may also be interpreted as a scaled pricing-
kernel weighted objective moment. If the objective density fX,Y,t(XT,YT) is known in closed form,
the double integral may be evaluated analytically or numerically to obtain the desired moment. If the
objective density is obtainable by simulation conditional on the current state variables, then
equation (5) may be evaluated by replacing the integral with a sample average over simulated
realizations of the random variables. If the objective density is time-invariant, then equation (5)
may be evaluated by replacing the integral with an average over observed realizations using time-
series data on the asset prices (or returns). Equation (6) provides the estimator applicable to the
second and third cases.
(6) $ [ ] ( , )* ( ), , , , ,E X Y e
NX Y K X YT T
r T ti T i T t T i T i T
i
N
= −
=∑1
1
The third case is compatible with stochastic volatility models in which the correlation is
constant but the individual variances are time varying. See, for example, Bollerslev (1990). In this
case, the returns should be normalized by their conditional variances prior to calculating the sample
averages.
III. Semiparametric pricing of options on the better of two equity index returns

10
To illustrate the use of this estimation and pricing technique, it is applied to the case of pricing one-
month options on the better of two equity index returns. In this case, XT and YT represent one-month
fully-hedged returns on one of five equity index portfolios: the S&P500 (U.S), the CAC40 (France),
the Nikkei 225 (Japan), the FTSE 100 (England), and the DAX30 (Germany).
III.i. Estimation of marginal equity index risk-neutral densities
The marginal equity index risk-neutral densities are estimated semiparametrically using the method
of Rosenberg and Engle (1999) which is closely related to the semi-parametric technique of Ait-
Sahalia and Lo (1998) and Shimko (1993). For this purpose, a general pricing formula is proposed
which is fit to a cross-section of option prices by allowing a different implied volatility (σt(K)) for
each option contract.
(7) C BS X K T t r Kt t f t= −( , , , , ( ))σ
It is well known — see, e.g. Breeden and Litzenberger (1978) —that the first derivative of the
call price formula with respect to the exercise price provides an estimate of the cumulative state
price density (and cumulative risk-neutral density). Let n(•) be the standard normal density function,
let N(•) be the cumulative standard normal density function, and let d2 = [ln(Xt/K) + ½(r - σ2(T-t))]
/ σ√T-t, and let σK,t(K) be the first derivative of the implied volatility function with respect to the
option exercise price.
(8) e X K e K n d K N dr T tT
r T tK t
− − − −≤ = + −( ) * ( ),( ) [ * ( )* ( ) ( )]Prob 1 2 2σ
A discrete risk-neutral marginal density is defined over 1000 states corresponding to asset
returns (XT/Xt - 1) between -30% and 30%. The cumulative risk-neutral density function is
evaluated using equation (8) with the first derivative numerically evaluated based on a B-spline fit
of the implied volatility function. For additional details, see Rosenberg and Engle (1999).
This procedure is applied to estimate marginal risk-neutral densities defined over equity index
returns for the S&P500 index (United States), the CAC40 index (France), the Nikkei 225 index

11
(Japan), the FTSE 100 index (England), and the DAX30 index (Germany). For the estimation, end-
of-day prices of April European index put option contracts are collected on March 19, 1999.
Implied volatilities for each contract are calculated by numerically inverting the Black-Scholes
(1973) formula adjusted for dividends.
For the implied volatility estimation, the dividend yield used is the implied dividend yield
based on the put-call parity relationship and the prices of at-the-money put and call index options in
each market. The underlying price used is the closing price of the index, and the riskless interest
rate is the continuously compounded yield to maturity of the national treasury bill contract with
expiration closest to the option expiration. The time until expiration used is the number of calendar
days until the option expiration.
Ideally, the option expiration dates would be identical across markets, so that the implied
volatilities reflect the same time-span. In practice, there are some differences in option expiration
dates, e.g. the S&P500, FTSE100, and NK225 option expire mid-month, while the DAX30 and
CAC40 options expire at the end of the month. For simplicity, it is assumed that option implied
volatilities across maturities are equal (i.e. the implied volatility term structure is flat), so that the
calculated implied volatility is a proxy for the implied volatility for an option with one-month until
expiration.
The first panel of Table 1 describes the data used to estimate the implied volatilities, and
Figure 1 plots the annualized implied volatilities for each of the option classes against option
moneyness (K/St - 1). The implied volatility skew, i.e. the downward sloping curve of implied
volatility against option moneyness, is present in all of the markets. This has been attributed to
crash fears — Bates (1991) — as well as portfolio insurance demand — Rosenberg and Engle
(1999).
Figure 2 plots the one-month marginal risk-neutral densities defined over local equity index
returns. While the densities are drawn as if they were continuous, the actual densities are discrete
with a support defined over 1000 one-month returns ranging from -30% to 30%. The second panel
of Table 1 presents estimates of risk-neutral standard deviation, skewness, and kurtosis for these
densities. All of the risk-neutral densities exhibit negative skewness except for the NK225, and all
of the densities exhibit positive excess kurtosis. Negative skewness and positive excess kurtosis in
the S&P500 risk-neutral density have been also been found by Rubinstein (1994), Ait-Sahalia and
Lo (1998), and Rosenberg and Engle (1999).

12
III.ii. Estimation of the empirical pricing kernel
The transformation of time-series data on asset returns into an estimate of risk-neutral correlation
requires a pricing kernel. In its most general form, the pricing kernel — Kt,T(XT,YT) — depends on
both asset price outcomes. This paper uses the special case of a univariate pricing kernel which
only depends on S&P500 index return states: Kt,T(XT).
In this paper, the pricing kernel is estimated using the empirical pricing kernel (EPK) technique
of Rosenberg and Engle (1999). A short summary of this technique is presented below. For
additional details, see the previously mentioned paper.
The pricing kernel, which measures the state price per unit probability across states, is naturally
estimated by separately obtaining the state price density and the state probability density and taking
their ratio. An innovation of the EPK technique is that the state price density is estimated using a
current cross-section of option prices so that it reflects current investor risk aversion and
probability beliefs. This is paired with a conditional state probability density function which is
time-varying reflecting current market conditions.
The state price density is estimated using the risk-neutral density estimation technique described
in section III.i. using the S&P500 index option data on March 19, 1999. Note that the state price
density is the discounted risk-neutral density. One minor difference from section III.i. is that the
state space is discretized into 100 discrete return states ranging from -10% to 5%.
The state probability density is estimated by monte-carlo simulation (200,000 replications) of
an estimated dynamic state probability model. The state probability model used is a GJR-GARCH
model (Engle and Ng, 1993) estimated over the period from January 1, 1994 through March 18,
1999. Standardized residuals from the model are saved and used as an empirical innovation
density.
Figure 3 graphs the empirical pricing kernel which provides a measure of investor risk aversion
over S&P500 return states. The EPK has a downward slope and is steeply rising for large negative
return states. This indicates that investors are willing to pay more for a probability normalized
dollar payoff when the S&P500 returns are large and negative, i.e. crash states, than for positive
return states. In other words, investors are willing to pay up (probability normalized) for hedging
assets which payoff in bad states of the world.

13
III.iii. Estimation of the bivariate risk-neutral densities
The risk-neutral correlations for the equity index return pairs (S&P500 - CAC40, S&P500 -
NK225, S&P500 - FTSE100, and S&P500 - DAX30) are obtained using the methodology
described in section II.ii. Equation (6) and its analogs are calculated using historical data on the
asset returns and the empirical pricing kernel described in section III.ii.
For the risk-neutral correlation estimation, monthly local currency (i.e. fully-hedged) returns
for each of the equity indices are obtained for the period from January 1994 - February 1999. The
first panel of Table 2 describes this data. Four of five return series exhibit positive skewness and
positive excess kurtosis.
The second panel of Table 2 presents the objective correlations and the risk-neutral
correlations. The risk-neutral correlations range from .07 to .21 higher than the objective
correlations. This indicates a serious potential problem using objective correlations instead of risk-
neutral correlations for MVCC pricing.
The estimated association parameters (ψ ) are reported in the third panel of Table 2. These are
calculated by an optimization which matches the risk-neutral correlation of the estimated bivariate
density to the risk-neutral correlation estimated above. As noted previously, ψ is monotonically
increasing in correlation. The equity index pair with the lowest risk-neutral correlation S&P500-
NK225 (.617) has the lowest ψ (11.33); the equity index pair with the highest risk-neutral
correlation S&P500 - FTSE100 (.833) has the highest ψ (52.09).
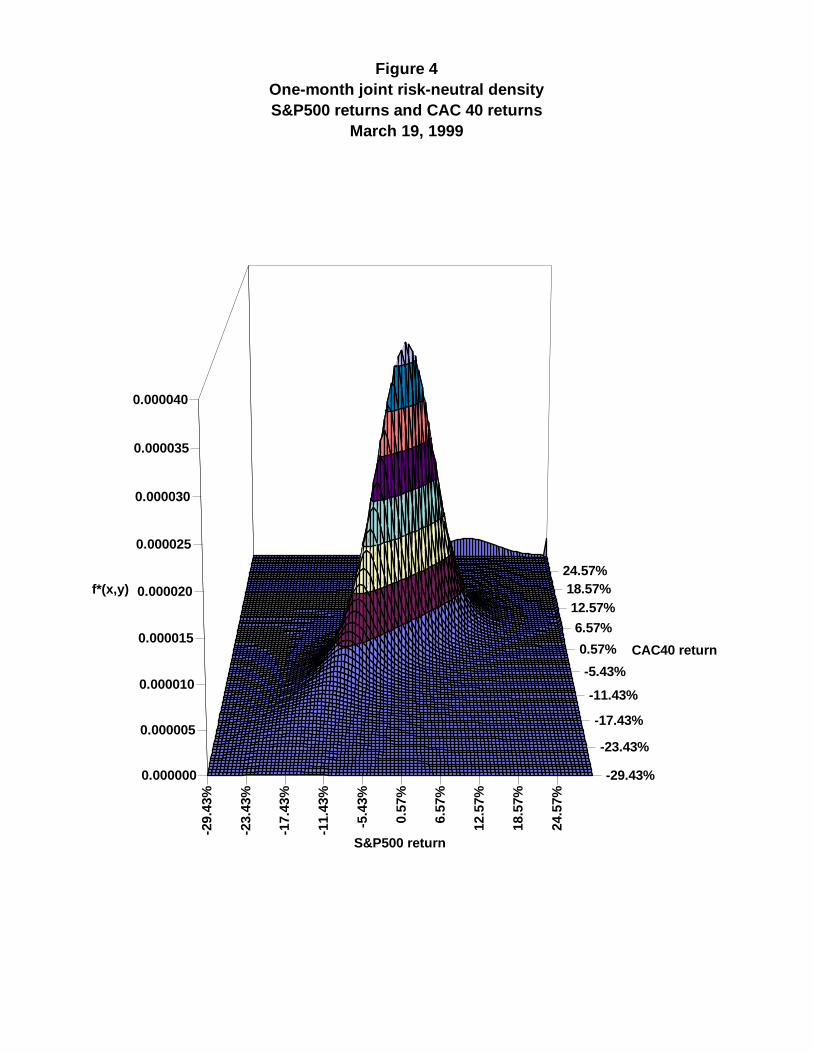
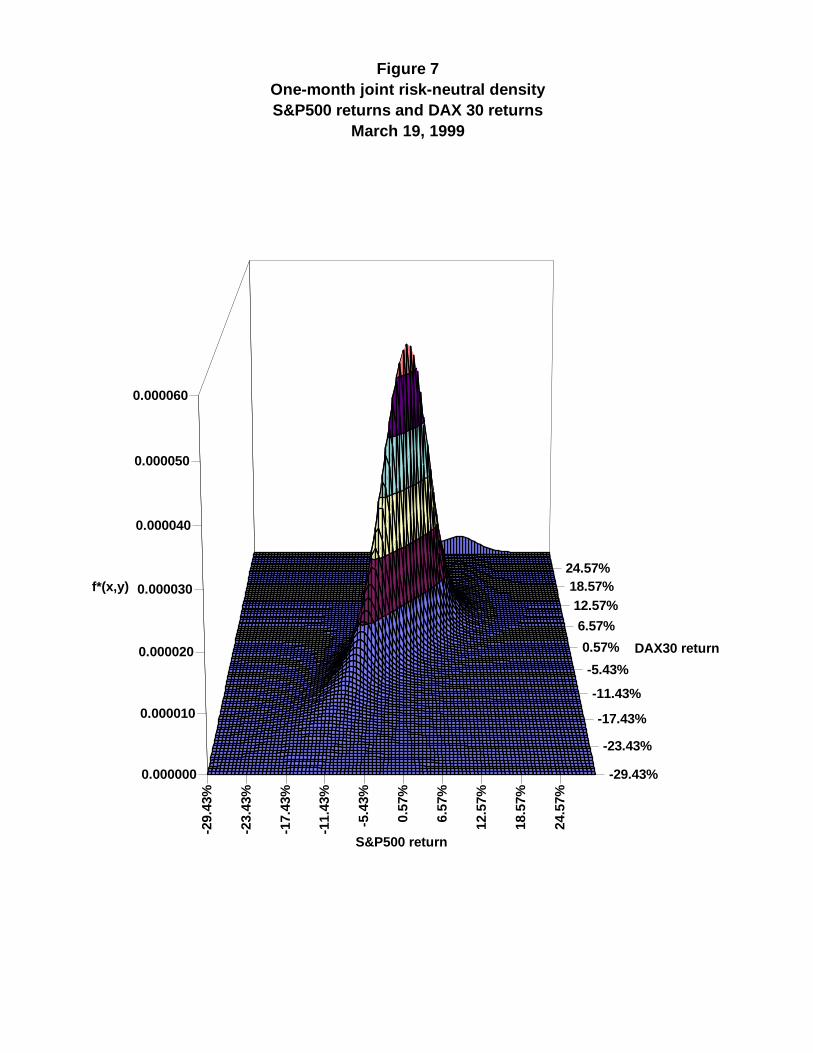
Figures 4-7 plot the estimated joint risk-neutral density functions. The characteristics of these
joint densities which are most easily identified are: (1) strong positive correlations for all return
pairs as indicated by the narrow right-facing diagonal hump in each graph (2) different risk-neutral
marginal standard deviations reflected in the length and width of the hump in each graph.
III.iv. Pricing options on the better of two equity index returns
MVCC pricing using equation (2) is straightforward given an estimated bivariate risk-neutral
density and a known payoff function. This paper is concerned with the pricing of equity index
options on the better of two equity index returns.
14
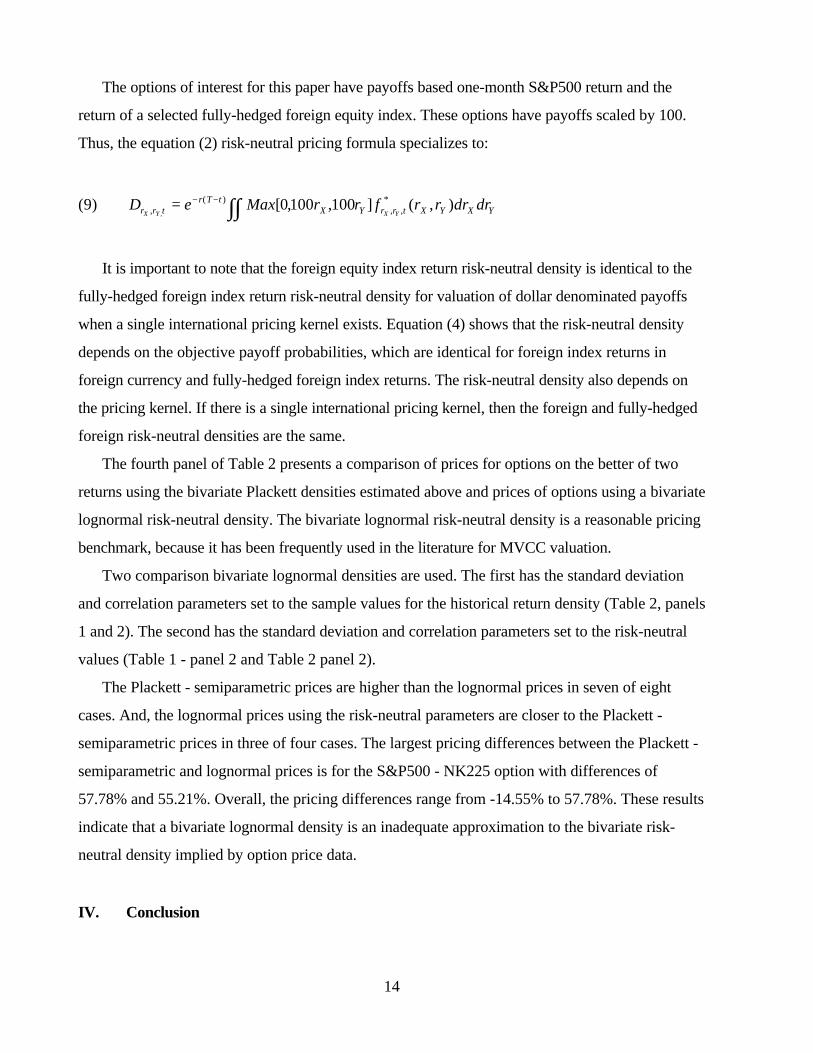
The options of interest for this paper have payoffs based one-month S&P500 return and the
return of a selected fully-hedged foreign equity index. These options have payoffs scaled by 100.
Thus, the equation (2) risk-neutral pricing formula specializes to:
(9) D e Max r r f r r dr drr r tr T t
X Y r r t X Y X YX Y X Y,( )
, ,*
,[ , , ] ( , )= − − ∫∫ 0100 100
It is important to note that the foreign equity index return risk-neutral density is identical to the
fully-hedged foreign index return risk-neutral density for valuation of dollar denominated payoffs
when a single international pricing kernel exists. Equation (4) shows that the risk-neutral density
depends on the objective payoff probabilities, which are identical for foreign index returns in
foreign currency and fully-hedged foreign index returns. The risk-neutral density also depends on
the pricing kernel. If there is a single international pricing kernel, then the foreign and fully-hedged
foreign risk-neutral densities are the same.
The fourth panel of Table 2 presents a comparison of prices for options on the better of two
returns using the bivariate Plackett densities estimated above and prices of options using a bivariate
lognormal risk-neutral density. The bivariate lognormal risk-neutral density is a reasonable pricing
benchmark, because it has been frequently used in the literature for MVCC valuation.
Two comparison bivariate lognormal densities are used. The first has the standard deviation
and correlation parameters set to the sample values for the historical return density (Table 2, panels
1 and 2). The second has the standard deviation and correlation parameters set to the risk-neutral
values (Table 1 - panel 2 and Table 2 panel 2).
The Plackett - semiparametric prices are higher than the lognormal prices in seven of eight
cases. And, the lognormal prices using the risk-neutral parameters are closer to the Plackett -
semiparametric prices in three of four cases. The largest pricing differences between the Plackett -
semiparametric and lognormal prices is for the S&P500 - NK225 option with differences of
57.78% and 55.21%. Overall, the pricing differences range from -14.55% to 57.78%. These results
indicate that a bivariate lognormal density is an inadequate approximation to the bivariate risk-
neutral density implied by option price data.
IV. Conclusion

15
This paper has developed a semiparametric technique for multivariate contingent claim valuation.
A multivariate risk-neutral density function estimated using market data on the prices of options on
individual assets and a risk-neutral correlation estimated using the time-series of asset returns and
an empirical pricing kernel. The estimated risk-neutral density is used to infer prices of additional
MVCC’s.
This technique has several attractive features. First, the MVCC prices obtained using this
procedure are consistent with the market prices of existing options; and, the marginal risk-neutral
densities are identical to the marginals used for risk-neutral univariate contingent claim pricing.
Second, the estimation methodology is compatible with existing nonparametric, semiparametric,
and parametric techniques for univariate risk-neutral density estimation. Third, estimation is
possible without observed prices for related multivariate contingent claims.
This pricing technique is used for valuation of options on the better of two equity index returns.
These prices are compared to those generated by bivariate lognormal risk-neutral density, which is
often used in this context. The results of the pricing comparisons indicate that a bivariate lognormal
density is an inadequate approximation to the bivariate risk-neutral density implied by option price
data.

16
Bibliography
Ait-Sahalia, Y. and A. W. Lo, 1998, “Nonparametric Estimation of State-Price Densities Implicit inFinancial Asset Prices,” Journal of Finance, 53, 499-547.
Bates, D. S., 1991, “The Crash of 87 - Was It Expected? - the Evidence from Options Markets,”Journal of Finance, 46, 1009-1044.
Black, F. and M. Scholes, 1973, “The Pricing of Options and Corporate Liabilities,” Journal ofPolitical Economy, 81, 637-654.
Bollerslev, T., 1990, “Modelling the Coherence in Short-Run Nominal Exchange Rates - aMultivariate Generalized ARCH Model,” Review of Economics and Statistics, 72, 498-505.
Boyle, P. P., 1988, “A Lattice Framework for Option Pricing with Two State Variables,” Journalof Financial and Quantitative Analysis, 23, 1-12.
Boyle, P. P., J. Evnine and S. Gibbs, 1989, “Numerical Evaluation of Multivariate ContingentClaims,” Review of Financial Studies, 2, 241-250.
Breeden, D. T. and R. H. Litzenberger, 1978, “Prices of State-Contingent Claims Implicit in OptionPrices,” Journal of Business, 51, 621-651.
Chakak, A. and K. J. Koehler, 1995, “A Strategy for Constructing Multivariate Distributions,”Communications in Statistics - Simulation and Computation, 24, 537-550.
Cox, J. C., S. A. Ross and M. Rubinstein, 1979, “Option Pricing: A Simplified Approach,” Journalof Financial Economics, 7, 229-263.
De Santis, G. and B. Gerard, 1997, “International Asset Pricing and Portfolio Diversification withTime-Varying Risk,” Journal of Finance, 52, 1881-1912.
Derman, E. and I. Kani, 1994, “Riding on a Smile,” Risk, 7, 32-38.
Engle, R. F. and V. K. Ng, 1993, “Measuring and Testing the Impact of News on Volatility,”Journal of Finance, 48, 1749-1778.
Erb, C. B., C. R. Harvey and T. E. Viskanta, 1994, “Forecasting International Correlation,”Financial Analysts Journal, 50, 32-45.
Farlie, D. J. G., 1960, “The Performance of Some Correlation Coefficients for a General BivariateDistribution,” Biometrika, 47, 307-322.
Gumbel, E. J., 1960, “Bivariate Exponential Distributions,” Journal of the American StatisticalAssociation, 55, 698-707.

17
Ho, T., R. Stapleton and M. Subrahmanyam, 1995, “Multivariate Binomial Approximations forAsset Prices with Nonstationary Variance and Covariance Characteristics,” Review ofFinancial Studies, 8, 1125-1152.
Johnson, H., 1987, “Options on the Maximum or Minimum of Several Assets,” Journal ofFinancial and Quantitative Analysis, 22, 277-283.
Longin, F. and B. Solnik, 1995, “Is the Correlation in International Equity Returns Constant: 1960-1990?,” Journal of International Money and Finance, 14, 3-26.
Longstaff, F. A., 1995, “Option Pricing and the Martingale Restriction,” Review of FinancialStudies, 8, 1091-1124.
Mardia, K. V., 1967, “Some Contributions to Contingency-type Bivariate Distributions,”Biometrika, 54, 239-249.
Margrabe, W., 1978, “The Value of an Option to Exchange One Asset for Another,” Journal ofFinance, 33, 177-186.
Molenberghs, G. and E. Lesaffre, 1994, “Marginal Modelling of Correlated Ordinal Data using aMultivariate Plackett Distribution,” Journal of the American Statistical Association, 89, 633-644.
Morgenstern, D., 1956, “Einfache Beispiele Zweidimesnsionaler Verteilungen,” Mitteilingsblattfur Mathematische Statistik, 8, 234-235.
Nelsen, R. B. “An Introduction to Copulas.” . New York: Springer-Verlag, 1999.
Plackett, R. L., 1965, “A Class of Bivariate Distributions,” Journal of the American StatisticalAssociation, 60, 516-522.
Reiner, E. “Quanto Mechanics.” In From Black-Scholes to Black-Holes: New Frontiers in OptionPricing, 147-154. London: Risk Magazine/FINEX, 1992.
Rosenberg, J., 1998, “Pricing Multivariate Contingent Claims using Estimated Risk-Neutral DensityFunctions,” Journal of International Money and Finance, 17, 229-247.
Rosenberg, J. and R. F. Engle, 1999, “Empirical Pricing Kernels,” Manuscript.
Rubinstein, M., 1991, “Somewhere Over the Rainbow,” Risk, 63-66.
Rubinstein, M. “One for Another.” In From Black-Scholes to Black-Holes: New Frontiers inOption Pricing, 147-154. London: Risk Magazine/FINEX, 1992.
Rubinstein, M., 1994, “Implied Binomial Trees,” Journal of Finance, 49, 771-818.
Rubinstein, M., 1994, “Return to Oz,” Risk, 7, 67-71.

18
Sherrick, B. J., S. H. Irwin and D. L. Forster, 1990, “Expected Soybean Futures PriceDistributions: Option-based Assessments,” Review of Futures Markets, 12, 275-290.
Sherrick, B. J., S. H. Irwin and D. L. Forster, 1992, “Option-Based Evidence of the Nonstationarityof Expected S&P 500 Futures Price Distributions,” Journal of Futures Markets, 12, 275-290.
Shimko, D. C., 1993, “Bounds of Probability,” Risk, 6, 33-37.
Shimko, D. C., 1994, “Options on Futures Spreads - Hedging, Speculation, and Valuation,” Journalof Futures Markets, 14, 183-213.
Stapleton, R. C. and M. G. Subrahmanyam, 1984, “The Valuation of Multivariate Contingent Claimsin Discrete Time Models,” Journal of Finance, 39, 207-228.
Stapleton, R. C. and M. G. Subrahmanyam, 1984, “The Valuation of Options when Asset Returnsare Generated by a Binomial Process,” Journal of Finance, 39, 1525-1539.
Stulz, R. M., 1982, “Options on the Minimum or the Maximum of Two Risky Assets: Analysis andApplications,” Journal of Financial Economics, 10, 161-185.

Table 1Analysis of marginal risk neutral densitiesDefined over equity index returns
Option data used to estimate marginal risk-neutral densitiesApril European equity index puts on March 19, 1999
S&P500 CAC40 NK225 FTSE100 DAX30Num. of obs. 24 19 11 22 22Minimum moneyness -30.73% -26.53% -26.73% -21.71% -25.48%Maximum moneyness 15.45% 0.72% 6.85% 5.87% 1.97%Minimum implied standard deviation (annualized) 15.86% 21.73% 23.75% 12.18% 15.15%Maximum implied standard deviation (annualized) 39.07% 33.66% 44.45% 33.37% 29.33%Days until expiration 28 42 21 28 42
Properties of the risk-neutral marginal densitiesS&P500 CAC40 NK225 FTSE100 DAX30
Risk-neutral standard deviation (annualized) 23.03% 24.55% 33.71% 19.88% 19.36%Risk-neutral skewness -0.29 -0.25 0.48 -1.07 -0.42Risk-neutral excess kurtosis 1.65 0.41 0.35 1.88 0.79

Table 2Analysis of joint risk neutral densitiesDefined over equity index returns
Objective return moments (monthly returns: Jan. 1994 - Feb. 1999)S&P500 CAC40 NK225 FTSE100 DAX30
Num. obs. 62 62 62 62 62Mean (annualized) 21.82% 14.20% -1.55% 12.80% 17.94%Standard dev. (annualized) 13.14% 21.92% 22.00% 13.95% 20.39%Skewness -0.02 -0.12 -0.31 0.39 -0.64Excess kurtosis 0.13 0.42 1.61 -0.35 0.93
Correlation with S&P500 returnsS&P500 CAC40 NK225 FTSE100 DAX30
Objective 1.000 0.699 0.406 0.722 0.682Risk-neutral 1.000 0.770 0.617 0.833 0.806
Estimation of joint risk-neutral densityS&P500 - CAC40
S&P500 - NK225
S&P500 - FTSE100
S&P500 - DAX30
ψ 26.76 11.13 52.09 36.38
Estimated outperformance option prices
Bivariate risk-neutral densityS&P500 - CAC40
S&P500 - NK225
S&P500 - FTSE100
S&P500 - DAX30
Plackett - semiparametric 3.68 5.43 3.00 3.18Lognormal (historical moments) 3.24 3.44 2.46 3.09Lognormal (risk-neutral moments) 3.50 3.50 2.88 3.72Percent price difference (Plackett vs. lognormal-historical) 13.86% 57.78% 21.65% 2.79%Percent price difference (Plackett vs. lognormal-risk-neutral) 5.19% 55.21% 4.08% -14.55%


Figure 2 One-month marginal risk-neutral densities
Defined over equity index returnsMarch 19, 1999
0.0000
0.0005
0.0010
0.0015
0.0020
0.0025
0.0030
0.0035
0.0040
0.0045
0.0050
-26.
97%
-23.
97%
-20.
97%
-17.
97%
-14.
97%
-11.
97%
-8.9
7%
-5.9
7%
-2.9
7%
0.03
%
3.03
%
6.03
%
9.03
%
12.0
3%
15.0
3%
18.0
3%
21.0
3%
24.0
3%
27.0
3%
Equity index return (one month)
f*(x)
S&P500 index (US) CAC40 index (France) Nikkei 225 index (Japan)FTSE100 index (UK) DAX30 index (Germany)

Figure 3S&P500 empirical pricing kernel
March 19, 1999
0.00
1.00
2.00
3.00
4.00
5.00
6.00
7.00-1
0.00
%
-9.1
8%
-8.4
3%
-7.6
8%
-6.9
3%
-6.1
8%
-5.4
3%
-4.6
8%
-3.9
3%
-3.1
8%
-2.4
3%
-1.6
8%
-0.9
3%
-0.1
8%
0.58
%
1.33
%
2.08
%
2.83
%
3.58
%
4.33
%
S&P500 return state
EP
K (s
tate
pri
ce p
er u
nit p
roba
bilit
y)
-29.
43%
-23.
43%
-17.
43%
-11.
43%
-5.4
3%
0.57
%
6.57
%
12.5
7%
18.5
7%
24.5
7%
-29.43%
-23.43%
-17.43%
-11.43%
-5.43%
0.57%
6.57%12.57%
18.57%24.57%
0.000000
0.000005
0.000010
0.000015
0.000020
0.000025
0.000030
0.000035
0.000040
f*(x,y)
S&P500 return
CAC40 return
Figure 4One-month joint risk-neutral densityS&P500 returns and CAC 40 returns
March 19, 1999

-29.
43%
-23.
43%
-17.
43%
-11.
43%
-5.4
3%
0.57
%
6.57
%
12.5
7%
18.5
7%
24.5
7%
-29.43%
-23.43%
-17.43%
-11.43%
-5.43%
0.57%
6.57%12.57%
18.57%24.57%
0.000000
0.000005
0.000010
0.000015
0.000020
f*(x,y)
S&P500 return
NK225 return
Figure 5One-month joint risk-neutral densityS&P500 returns and NK 225 returns
March 19, 1999

-29.
43%
-23.
43%
-17.
43%
-11.
43%
-5.4
3%
0.57
%
6.57
%
12.5
7%
18.5
7%
24.5
7%
-29.43%
-23.43%
-17.43%
-11.43%
-5.43%
0.57%6.57%
12.57%18.57%24.57%
0.000000
0.000010
0.000020
0.000030
0.000040
0.000050
0.000060
0.000070
0.000080
0.000090
f*(x,y)
S&P500 return
FTSE100 return
Figure 6One-month joint risk-neutral densityS&P500 returns and FTSE100 returns
March 19, 1999
-29.
43%
-23.
43%
-17.
43%
-11.
43%
-5.4
3%
0.57
%
6.57
%
12.5
7%
18.5
7%
24.5
7%
-29.43%
-23.43%
-17.43%
-11.43%
-5.43%
0.57%
6.57%12.57%
18.57%24.57%
0.000000
0.000010
0.000020
0.000030
0.000040
0.000050
0.000060
f*(x,y)
S&P500 return
DAX30 return
Figure 7One-month joint risk-neutral densityS&P500 returns and DAX 30 returns
March 19, 1999