


Languages
Pages
Legal

SMMT MOTOR INDUSTRY FACTS 2018

WHAT IS SMMT?
The Society of Motor Manufacturers and
Traders (SMMT) is one of the largest and most
influential trade associations in the UK. Its
resources, reputation and unrivalled automotive
data place it at the heart of the UK automotive
industry. It undertakes a variety of activities
to support and represent the interests of the
industry and has a long history of achievement.
Working closely with member companies,
SMMT acts as the voice of the UK motor
industry, supporting and promoting its
interests, at home and abroad, to government,
stakeholders and the media.
SMMT represents more than 800 automotive
companies in the UK, providing them with a
forum to voice their views on issues affecting the
automotive sector, helping to guide strategies
and build positive relationships with government
and regulatory authorities.
To find out how to join SMMT
and for more information, visit www.smmt.co.uk/memberservices or email [email protected]
For media enquires please visit www.smmt.co.uk/contact/media-team or email [email protected]
WH
AT IS SMM
T?
02

CONTENTS
UK AUTOMOTIVE AT A GLANCE 4-5
UK AUTOMOTIVE INDUSTRY 6UK automotive employment 6UK automotive: background 7
MANUFACTURING 8UK automotive manufacturing 8UK car manufacturing 9UK car exports 10Global automotive manufacturing 11Map: UK automotive manufacturing sites 12-14Commercial vehicle manufacturing 15Engine manufacturing 16Digitalisation of automotive manufacturing 17
UK AUTOMOTIVE SUPPLY CHAIN 18UK AUTOMOTIVE AND THE EU 19A DAY IN UK AUTOMOTIVE 20
REGISTRATIONS 21New car registrations 21Changing consumer tastes 22Registrations by sales type 23Registrations by segment 24-26Commercial vehicle registrations 27
VEHICLES ON THE ROAD 28-29
UK automotive aftermarket 30
ENVIRONMENT AND AIR QUALITY 31-33Environment – CO2 31Environment – Air Quality 32Environment – WLTP and RDE 33
CONNECTED CARS 34-35SMMT GROUP 37
CON
TENTS
03

UK AUTOMOTIVE AT A GLANCEU
K AUTO
MO
TIVE AT A GLAN
CE
Specialist car manufacturers 60+
Suppliers2,500
Commercial vehicle manufacturers
Cars built in 2017
1,671,166
Engines built in 2017
2,722,325
Commercial vehicles built in 2017
78,219
People employed across UK Auto
856,000
UK automotive turnover
£82 billion
Cars currently on UK roads
34.7 million
Cars exported in 2017
1,334,538
New cars registered in 2017
2,540,617
Countries importing UK-built vehicles
160+
Engine manufacturers
869 9
5
20
6
05
04

UK AUTOMOTIVE EMPLOYMENTU
K AU
TOM
OTIV
E EMPLO
YMEN
T
25,000new jobs to be
created in automotive manufacturing
41,000 people employed
in UK motorsport – 25,000 are engineers
(Motorsport Industry
Association)
186,000people directly
employed in manufacturing
856,000 people employed
across UK automotive
78,480 young people
began engineering and manufacturing
apprenticeships in 2016/7
(Semta)
06
UK A
UTO
MO
TIVE: B
ACKGR
OU
ND
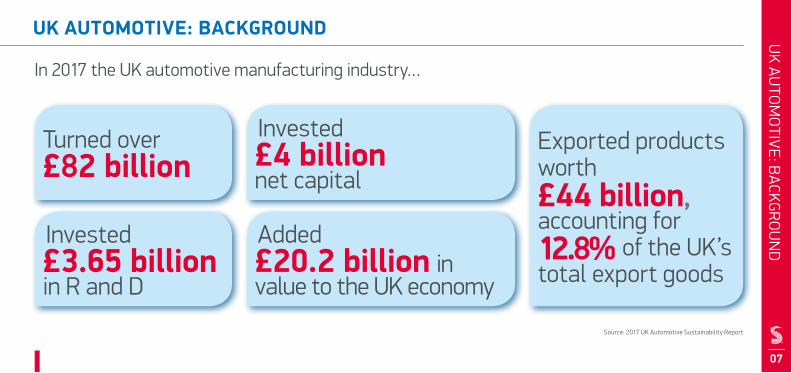
UK AUTOMOTIVE: BACKGROUND
In 2017 the UK automotive manufacturing industry…
Turned over £82 billion
Invested £3.65 billion in R and D
Exported products worth £44 billion, accounting for 12.8% of the UK’s total export goods
Invested £4 billion net capital
Added £20.2 billion in value to the UK economy
07
Source: 2017 UK Automotive Sustainability Report

UK A
UTO
MO
TIVE M
AN
UFA
CTURIN
GUK AUTOMOTIVE MANUFACTURING
Commercial vehicles by brandMake Volume
Vauxhall 59,795
Leyland Trucks 15,323
Alexander Dennis 1,734
Dennis Eagle 890
Wrightbus 303
Cars by brandMake Volume
Jaguar Land Rover 532,107
Nissan 495,206
BMW 218,885
Honda 164,160
Toyota 144,077
Cars by modelModel Volume
Nissan Qashqai 346,771
MINI 218,885
Honda Civic 122,885
Toyota Auris 119,020
Nissan Juke 104,770
Top fives in production – 2017
08

UK CA
R MA
NU
FACTU
RING
UK CAR MANUFACTURING
09
UK car manufacturing
UK car manufacturing – 2017 vs 2016YTD 2016 YTD 2017 % Change
Total 1,722,698 1,671,166 -3.0%
Home 373,255 336,628 -9.8%
Export 1,349,443 1,334,538 -1.1%
% export 78.3% 79.9%
2,000,000
1972 2009 2013 2014 2015 2016 20170
1,000,000
500,000
1,500,000
RECO
RD H
IGH
1,671,166
1.67M cars built in the UK in 2017, the
SECOND BIGGEST OUTPUT since the turn of the century

UK CA
R EXPORTS
UK CAR EXPORTS
1.33m cars manufactured for export in 2017
8 out of 10 cars made in the UK are exported
The UK exports to over 160 markets worldwide
10
TOP EXPORT DESTINATIONS FOR UK CARS
EU 53.9%
US 15.7%
CHINA 7.5%
AUSTRALIA 2.9%
TURKEY 2.6%
JAPAN 2.4%
CANADA 2.1%
SOUTH KOREA 1.6%
RUSSIA 1.2%
ISRAEL 0.9%
Germany
Italy
France
Belgium
Spain
Worldwide EU
THE UK EXPORTS TO 160 COUNTRIES WORLDWIDE

GLOB
AL A
UTO
MO
TIVE M
AN
UFA
CTURIN
GGLOBAL AUTOMOTIVE MANUFACTURING
Top 10 European automotive manufacturers in 2017Rank Country Cars Commercial
Vehicles Total % change
1 Germany 5,645,581 0 5,645,581 -1.76%
2 Spain 2,291,492 556,843 2,848,335 -1.30%
3 France 1,748,000 479,000 2,227,000 6.54%
4 UK 1,671,166 78,219 1,749,385 -3.70%
5 Czech Rep. 1,413,881 6,112 1,419,993 0.00%
6 Italy 742,642 399,568 1,142,210 3.53%
7 Slovakia 1,001,520 0 1,001,520 -3.70%
8 Poland 514,700 175,029 689,729 1.16%
9 Hungary 502,000 3,400 505,400 -4.01%
10 Belgium 336,000 43,140 379,140 -5.08%
Top 15 global automotive manufacturers in 2017Rank Country Cars Commercial
vehicles Total % change
1 China 24,806,687 4,208,747 29,015,434 3.19%
2 USA 3,033,216 8,156,769 11,189,985 -8.13%
3 Japan 8,347,836 1,345,910 9,693,746 5.31%
4 Germany 5,645,581 0 5,645,581 -1.76%
5 India 3,952,550 830,346 4,782,896 5.83%
6 South Korea 3,735,399 379,514 4,114,913 -2.69%
7 Mexico 1,900,029 2,168,386 4,068,415 13.00%
8 Spain 2,291,492 556,843 2,848,335 -1.30%
9 Brazil 2,269,468 430,204 2,699,672 25.20%
10 France 1,748,000 479,000 2,227,000 6.54%
11 Canada 749,458 1,450,331 2,199,789 -7.21%
12 Thailand 818,440 1,170,383 1,988,823 2.28%
13 UK 1,671,166 78,219 1,749,385 -3.70%14 Turkey 1,142,906 552,825 1,695,731 14.12%
15 Russia 1,348,029 203,264 1,551,293 19.01%
11
1
2 30 31
7
12
22
8
99 10
20
5
4
3
14
26
12
13
27
32
2928
15
2311
6
24
25
21
1617
1
18
11
19
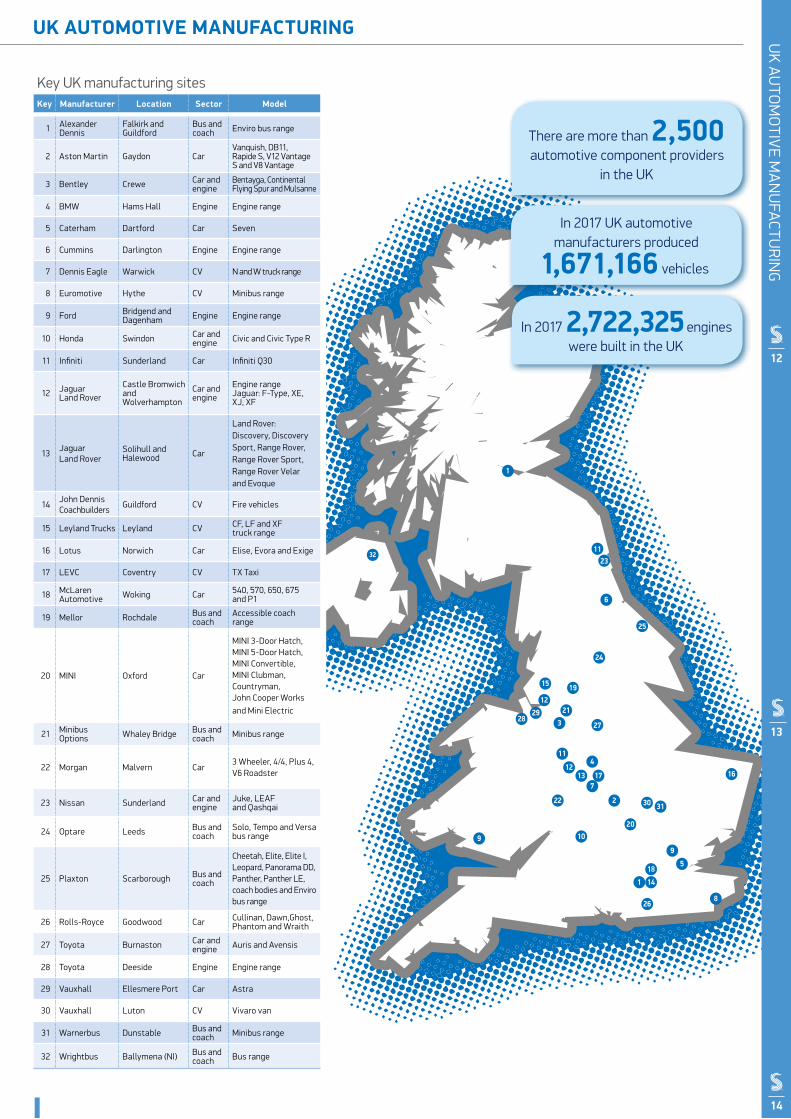
In 2017 UK automotive manufacturers produced
1,671,166 vehicles
In 2017 2,722,325 engines were built in the UK
There are more than 2,500 automotive component providers
in the UK
Key UK manufacturing sitesKey Manufacturer Location Sector Model
1 Alexander Dennis
Falkirk and Guildford
Bus and coach Enviro bus range
2 Aston Martin Gaydon CarVanquish, DB11, Rapide S, V12 Vantage S and V8 Vantage
3 Bentley Crewe Car and engine
Bentayga, Continental Flying Spur and Mulsanne
4 BMW Hams Hall Engine Engine range
5 Caterham Dartford Car Seven
6 Cummins Darlington Engine Engine range
7 Dennis Eagle Warwick CV N and W truck range
8 Euromotive Hythe CV Minibus range
9 Ford Bridgend and Dagenham Engine Engine range
10 Honda Swindon Car and engine Civic and Civic Type R
11 Infiniti Sunderland Car Infiniti Q30
12 Jaguar Land Rover
Castle Bromwich and Wolver hampton
Car and engine
Engine range Jaguar: F-Type, XE, XJ, XF
13Jaguar Land Rover
Solihull and Halewood Car
Land Rover: Discovery, Discovery Sport, Range Rover, Range Rover Sport, Range Rover Velar and Evoque
14John Dennis Coachbuilders
Guildford CV Fire vehicles
15 Leyland Trucks Leyland CV CF, LF and XF truck range
16 Lotus Norwich Car Elise, Evora and Exige
17 LEVC Coventry CV TX Taxi
18 McLaren Automotive Woking Car 540, 570, 650, 675
and P1
19 Mellor Rochdale Bus and coach
Accessible coach range
20 MINI Oxford Car
MINI 3-Door Hatch, MINI 5-Door Hatch, MINI Convertible, MINI Clubman, Countryman, John Cooper Works and Mini Electric
21 Minibus Options Whaley Bridge Bus and
coach Minibus range
22 Morgan Malvern Car3 Wheeler, 4/4, Plus 4, V6 Roadster
23 Nissan Sunderland Car and engine
Juke, LEAF and Qashqai
24 Optare Leeds Bus and coach
Solo, Tempo and Versa bus range
25 Plaxton Scarborough Bus and coach
Cheetah, Elite, Elite I, Leopard, Panorama DD, Panther, Panther LE, coach bodies and Enviro bus range
26 Rolls-Royce Goodwood Car Cullinan, Dawn,Ghost, Phantom and Wraith
27 Toyota Burnaston Car and engine Auris and Avensis
28 Toyota Deeside Engine Engine range
29 Vauxhall Ellesmere Port Car Astra
30 Vauxhall Luton CV Vivaro van
31 Warnerbus Dunstable Bus and coach Minibus range
32 Wrightbus Ballymena (NI) Bus and coach Bus range
UK AUTOMOTIVE MANUFACTURINGU
K AU
TOM
OTIV
E MA
NU
FACTU
RING
14
13
12

2016 2017 % Change
Total 93,924 78,219 -16.7%
Home 39,102 29,320 -25.0%
Export 54,842 48,899 -10.8%
% export 58.4% 62.5%
201470,869
201594,479
201693,924
201778,219
COM
MERCIA
L VEHICLE M
AN
UFACTU
RING
COMMERCIAL VEHICLE MANUFACTURING
UK Commercial Vehicle manufacturing volumes:2014 to 2017
UK Commercial Vehicle manufacturing – 2016 vs 2017
15
Proportion of British-built CVs exported to global markets rose to
62.5% in 2017 – the largest proportion in eight years
94.1% of CVs produced for international
markets, the majority bound for the EU
16
UK EN
GINE PR
OD
UCTIO
NUK ENGINE PRODUCTION
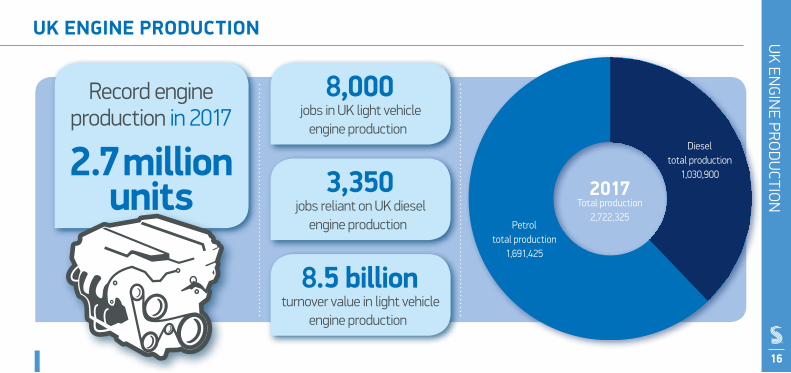
2017
Record engine production in 2017
2.7 million units
8,000jobs in UK light vehicle
engine production
3,350jobs reliant on UK diesel
engine production
8.5 billionturnover value in light vehicle
engine production
16
Total production2,722,325
Dieseltotal production
1,030,900
Petroltotal production
1,691,425

DIGITA
LISATION
OF M
AN
UFA
CTURIN
GDIGITALISATION OF AUTOMOTIVE MANUFACTURING
17
MACHINE DOWNTIMEREDUCED BY UP TO
40%
TIME TO MARKETREDUCED BY UP TO
25%
REDUCED PARTS INVENTORY BY UP TO
20%
INCREASED PRODUCTIVITY BY UP TO
5%
TOTAL CUMULATIVE ECONOMIC BENEFIT BY 2035
£74 billion
BENEFIT TO WIDER ECONOMY
£1.7 billion
BENEFIT TO VEHICLE MANUFACTURERS
£4.3 billion
BENEFIT TO SUPPLIERS
£2.6 billion
Source: SMMT and KPMG report The Digitalisation of the UK Automotive Industry (2016)
The digital revolution of the automotive industry is already underway. Vehicle manufacturers and suppliers are benefitting from increased productivity, greater flexibility and shorter times to market.
UK A
UTO
MO
TIVE SU
PPLY CHA
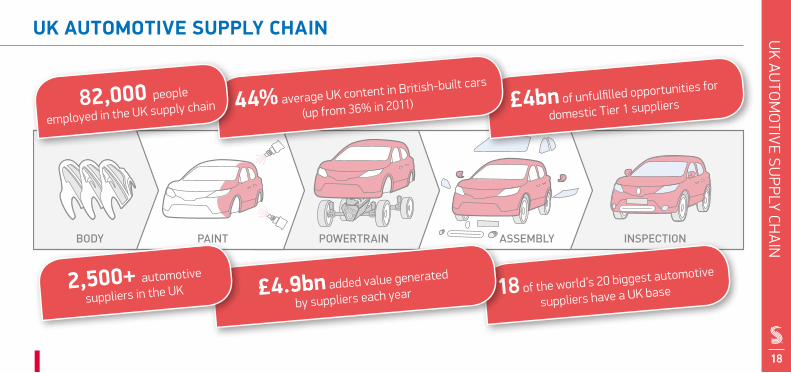
INUK AUTOMOTIVE SUPPLY CHAIN
BODY PAINT POWERTRAIN ASSEMBLY INSPECTION
£4bn of unfulfilled opportunities for
domestic Tier 1 suppliers
18 of the world’s 20 biggest automotive
suppliers have a UK base
44% average UK content in British-built cars
(up from 36% in 2011) 82,000 people
employed in the UK supply chain
£4.9bn added value generated
by suppliers each year
18
2,500+ automotive
suppliers in the UK
UK AUTOMOTIVE AND THE EUU
K AU
TOM
OTIV
E AN
D TH
E EU
19
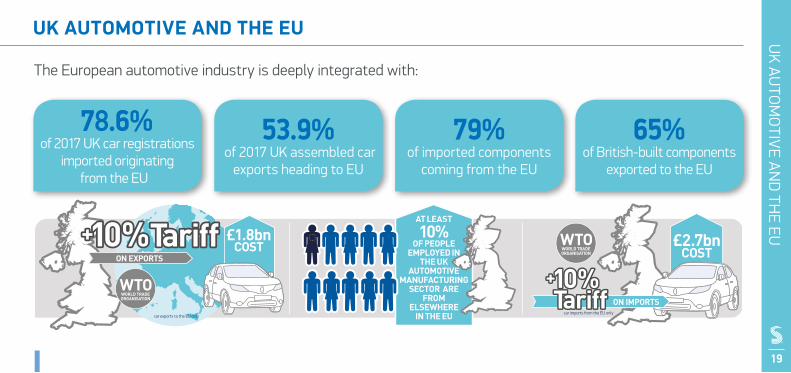
AT LEAST
10% OF PEOPLE
EMPLOYED IN THE UK
AUTOMOTIVE MANUFACTURING
SECTOR ARE FROM
ELSEWHERE IN THE EU
£2.7bnCOST
ON IMPORTScar imports from the EU only
WTOWORLD TRADE ORGANISATION
ON EXPORTS
£1.8bnCOST
car exports to the EU only
WTOWORLD TRADE ORGANISATION
The European automotive industry is deeply integrated with:
78.6% of 2017 UK car registrations
imported originating from the EU
53.9% of 2017 UK assembled car
exports heading to EU
79% of imported components
coming from the EU
65% of British-built components
exported to the EU

1100 EU TRUCKS
deliver to UK car and engine
plants
6400 CARS
manufactured
10500 ENGINES manufactured
1300 CARS
distributed to UK dealers
4700 ENGINES
delivered to UKfactories
5100 CARS
exported worldwide
5700 ENGINES
exported worldwide
Import figures based on SMMT estimates;
output figures: SMMT from production
and export international exchange data
ComponentsWORTH£35m
delivered just in time
from EU
A D
AY IN U
K AU
TOM
OTIV
E
20
A DAY IN UK AUTOMOTIVE

REGISTRATIO
NS
NEW CAR REGISTRATIONS
Model Volume
1 Ford Fiesta 94,533
2 Volkswagen Golf 74,605
3 Ford Focus 69,903
4 Nissan Qashqai 64,216
5 Vauxhall Corsa 52,772
6 Vauxhall Astra 49,370
7 Volkswagen Polo 47,855
8 MINI 47,669
9 Mercedes-Benz C Class 45,912
10 Mercedes-Benz A Class 43,717
3,000,000
’01 ’02 ’03 ’04 ’05 ’06 ’07 ’08 ’09 ’10 ’11 ’12 ’13 ’14 ’150
2,000,000
1,500,000
1,000,000
500,000
2,500,000
’16 ’17
2,540,617
Annual New Car Registrations – 2001 to 2017
Top 10 UK sellers in 2017
21
New car registrations by fuel type – 2017 vs 2007
2007
2017
1,065,879
1,354,917
119,821
16,641
DIES
ELPE
TROL
AFV
DIES
ELPE
TROL
AFV
967,413
1,419,953
CHA
NGIN
G CON
SUM
ER TASTES
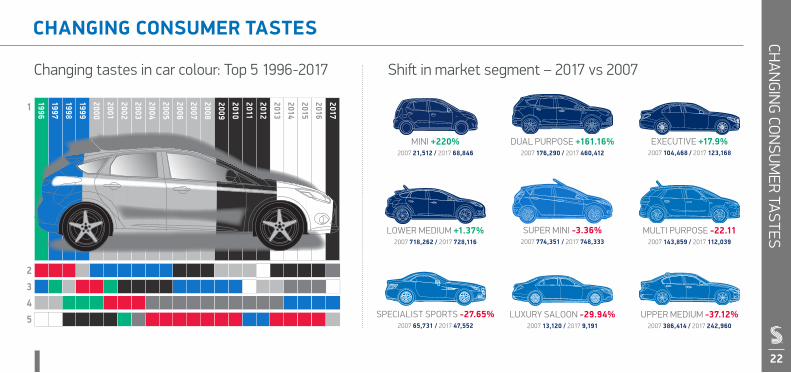
CHANGING CONSUMER TASTES
Changing tastes in car colour: Top 5 1996-2017
22
Shift in market segment – 2017 vs 2007
MINI +220%2007 21,512 / 2017 68,846
SPECIALIST SPORTS -27.65%2007 65,731 / 2017 47,552
LOWER MEDIUM +1.37%2007 718,262 / 2017 728,116
SUPER MINI -3.36%2007 774,351 / 2017 748,333
DUAL PURPOSE +161.16%2007 176,290 / 2017 460,412
LUXURY SALOON -29.94%2007 13,120 / 2017 9,191
UPPER MEDIUM -37.12%2007 386,414 / 2017 242,960
EXECUTIVE +17.9%2007 104,468 / 2017 123,168
MULTI PURPOSE -22.112007 143,859 / 2017 112,039
1
2
34
5
1996
1997
1998
1999
2000
2001
2002
2003
2004
2005
2006
2007
2008
2009
2010
2011
2012
2013
2014
2015
2016
2017

REGISTR
ATION
S BY SA
LES TYPEREGISTRATIONS BY SALES TYPE
FleetModel Volume
Volkswagen Golf 47,865
Ford Focus 42,130
Nissan Qashqai 41,685
Ford Fiesta 38,132
Vauxhall Astra 37,510
PrivateModel Volume
Ford Fiesta 56,400
Volkswagen Polo 30,487
MINI 28,188
Ford Focus 27,771
Volkswagen Golf 25,380
Top five new car registrations in 2017 by sales type
BusinessModel Volume
Vauxhall Corsa 13,857
Vauxhall Viva 6,940
Vauxhall Astra 3,615
Vauxhall Mokka X 3,436
Mitsubishi Outlander 2,901Business
3.8%
51.9%
44.2%
2017 registrations by sales type
Business If the vehicle is being registered by a company that operates up to 24 vehicles, it is designated a business sale. This includes dealer demonstrators.
Fleet If the vehicle is being registered by a company that operates a fleet of 25 or more vehicles, it is designated a fleet sale. This includes dealer demonstrators and Motability-leased vehicles. Private If the vehicle is being registered primarily for the personal use of a private individual, it is designated a private sale.
23
Fleet
Private
REGISTR
ATION
S BY SEGM
ENT
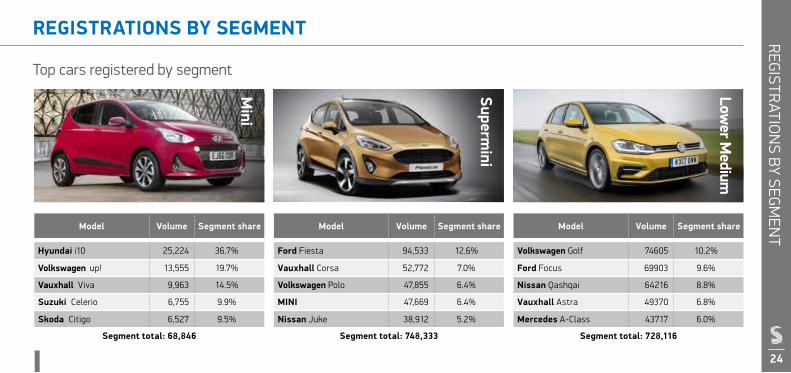
REGISTRATIONS BY SEGMENT
Supermini
Lower M
edium
Model Volume Segment share
Hyundai i10 25,224 36.7%
Volkswagen up! 13,555 19.7%
Vauxhall Viva 9,963 14.5%
Suzuki Celerio 6,755 9.9%
Skoda Citigo 6,527 9.5%
Segment total: 68,846
Model Volume Segment share
Ford Fiesta 94,533 12.6%
Vauxhall Corsa 52,772 7.0%
Volkswagen Polo 47,855 6.4%
MINI 47,669 6.4%
Nissan Juke 38,912 5.2%
Segment total: 748,333
Model Volume Segment share
Volkswagen Golf 74605 10.2%
Ford Focus 69903 9.6%
Nissan Qashqai 64216 8.8%
Vauxhall Astra 49370 6.8%
Mercedes A-Class 43717 6.0%
Segment total: 728,116
Mini
Top cars registered by segment
24

REGISTRATIONS BY SEGMENTR
EGISTRATIO
NS B
Y SEGMEN
T
Top cars registered by segment
Model Volume Segment share
Mercedes-Benz C Class 45,912 10.4%
Mercedes-Benz E Class 26,733 21.7%
BMW 5 Series 19,477 15.8%
Audi A6 12,768 10.4%
Jaguar XF 7,710 6.3%
Segment total: 123,168
Executive
Model Volume Segment share
BMW 3 Series 35,904 14.8%
Audi A4 25,294 10.4%
BMW 4 Series 22,050 9.0%
Skoda Octavia 20,493 8.4%
Vauxhall Insignia 16,884 6.9%
Segment total: 242,960
Upper M
edium
Model Volume Segment share
Mercedes-Benz S Class 2,939 32.0%
BMW 7 Series 2,274 24.7%
Jaguar XJ 970 10.6%
Bentley Continental 770 8.4%
Audi A8 749 8.2%
Segment total: 9,191
Luxury
25

REGISTR
ATION
S BY SEGM
ENT
REGISTRATIONS BY SEGMENT
Top cars registered by segment
Specialist Sports
Dual Purpose
MPV
26
Model Volume Segment share
Audi TT 7,762 16.3%
Volkswagen Scirocco 4,935 10.4%
Mazda MX-5 4,698 9.9%
Mercedes SLC 3,664 7.7%
Porsche 718 2,556 5.4%
Segment total: 47,552
Model Volume Segment share
Kia Sportage 39,683 8.6%
Ford Kuga 39,212 8.5%
Hyundai Tucson 29,430 6.4%
Volkswagen Tiguan 29,121 6.3%
Range Rover Evoque 24,906 5.4%
Segment total: 460,412
Model Volume Segment share
Ford C-MAX 12,655 11.3%
Vauxhall Zafira Tourer 12,219 10.9%
Citroen C4 Picasso 11,017 9.8%
Ford S-MAX 5,977 5.3%
Ford B-MAX 5,930 5.3%
Segment total: 112,039
COM
MER
CIAL V
EHICLE R
EGISTRATIO
NS
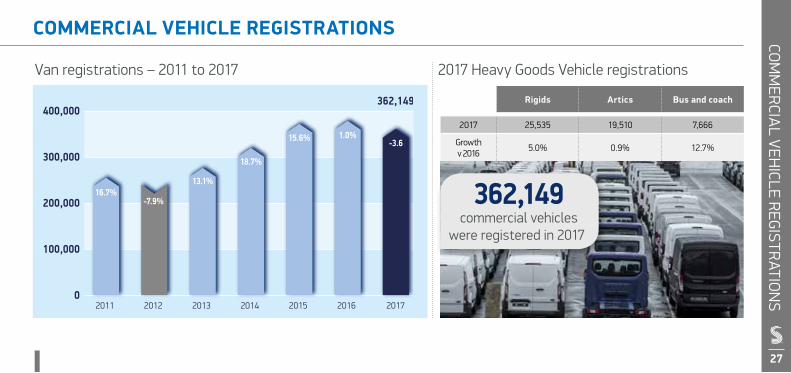
COMMERCIAL VEHICLE REGISTRATIONS
Van registrations – 2011 to 2017
Rigids Artics Bus and coach
2017 25,535 19,510 7,666
Growth v 2016
5.0% 0.9% 12.7%
0
100,000
200,000
300,000
400,000362,149
2014201320122011 20172015 2016
16.7%-7.9%
13.1%
18.7%
15.6% 1.0%-3.6
362,149 commercial vehicles
were registered in 2017
27
2017 Heavy Goods Vehicle registrations
VEHICLES ON THE ROADV
EHICLES O
N TH
E RO
AD
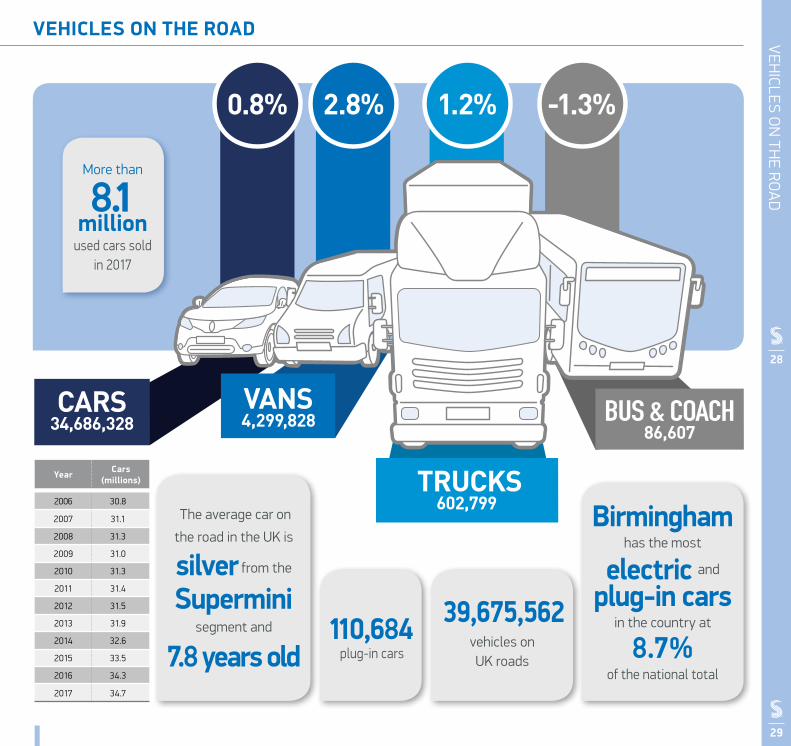
0.8% 2.8% -1.3%1.2%
VANS4,299,828 BUS & COACH
86,607
TRUCKS602,799
CARS34,686,328
Year Cars (millions)
2006 30.8
2007 31.1
2008 31.3
2009 31.0
2010 31.3
2011 31.4
2012 31.5
2013 31.9
2014 32.6
2015 33.5
2016 34.3
2017 34.7
28
29
39,675,562 vehicles on UK roads
110,684 plug-in cars
More than
8.1 million
used cars sold in 2017
Birmingham has the most
electric and
plug-in cars in the country at
8.7% of the national total
The average car on
the road in the UK is
silver from the
Supermini segment and
7.8 years old

UK A
UTO
MO
TIVE A
FTERM
AR
KE
TUK AUTOMOTIVE AFTERMARKET
£12.2 billion contribution to UK economy
345,600 jobs supported
£695.39average annual spend per car
£21.1 billion revenue of UK a�ermarket
Services more than
30 millionvehicles a year
The Importance of the Aftermarket to the UK Economy
30Source: SMMT and Frost & Sullivan Reports: The Importance of the UK Aftermarket to the UK Economy (2017)
ENVIRONMENT – CO2EN
VIRO
NM
ENT
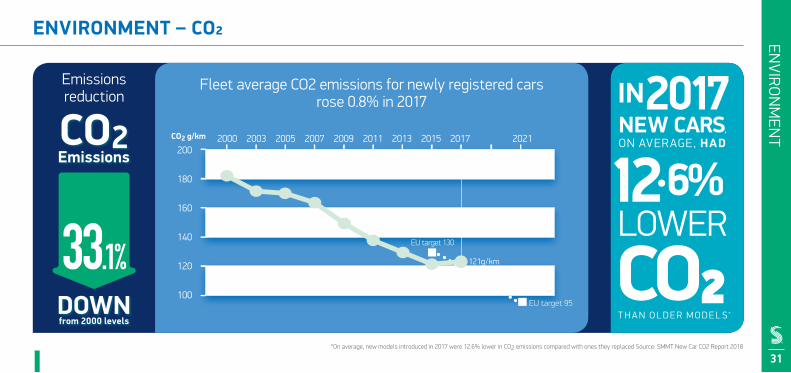
Emissions reduction
31
CO2 g/km
EU target 95
EU target 130
UK
140
120
100
160
180
200 2011 2009 2007 2005 2003 2000 2013 2015 2017 2021
121g/km
Fleet average CO2 emissions for newly registered cars rose 0.8% in 2017
*On average, new models introduced in 2017 were 12.6% lower in CO2 emissions compared with ones they replaced Source: SMMT New Car CO2 Report 2018
ENVIR
ON
MEN
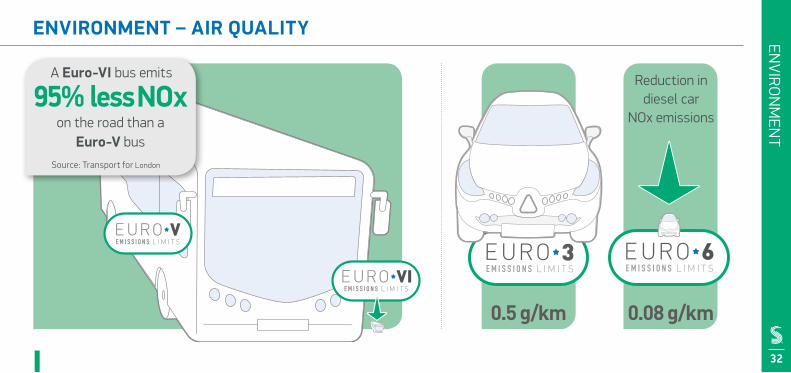
TENVIRONMENT – AIR QUALITY
A Euro-VI bus emits
95% less NOx on the road than a
Euro-V busSource: Transport for London
0.5 g/km 0.08 g/km
Reduction in diesel car
NOx emissions
32

ENVIR
ON
MEN
T – WLTP
33
CAR EMISSIONS TESTING
Introduced in 2017, the WLTP (Worldwide Harmonised Light Vehicle Test Procedure) was introduced to replace the old NEDC lab test.
A lab test to measure fuel consumption, CO2 and pollutant emissions from cars:
■ Test cycle data based on real-driving data ■ Variety of driving phases tested■ Powertrain configuration of each car tested for the car’s lightest and heaviest version
New WLTP test from September 2017 RDEThe Real Driving Emissions (RDE) test measures pollutants while a car is driven on public roads, complementing the WLTP lab test.
Portable Emission Measuring System (PEMS) measures data collected while car is driven in a variety of conditions:
Low speed (urban roads)Medium speed (rural roads)High speed (motorways)Low and high altitudesYear-round temperaturesAdditional vehicle payloadDifferent gradients
RDE provides a snapshot of a vehicle’s performance on the road
Why do we still need a lab test?The new WLTP test is much more representative and lab tests allow for a standardised, repeatable testing model which enables comparisons of one car’s emissions to the next.

6/10 people*with limited mobility will have
an improved quality of life
£51 BillionValue added annually by 2030
(at 2014 prices)
Top 5 benefits of CAVs
• Reduced stress of driving• Ability to rest on longer journeys• Fewer accidents• Lower insurance costs• Ability to travel at preferred times
320,000Additional jobs created,
25,000Jobs in automotive
manufacturing created by 2030
*when surveyed
CAVs could give
1 million UK people better access
to higher education
CONNECTED AND AUTONOMOUS VEHICLESCON
NECTED A
ND AU
TON
OM
OU
S VEHICLES
UK social and economic impact of connected and autonomous vehicles
34Sources:SMMT and KPMG report, 2014: Connected and Autonomous Vehicles: The UK Economic Opportunity and SMMT and PwC report, 2017: CAVs: Revolutionising Mobility in Society
CONN
ECTED AN
D AUTO
NO
MO
US VEH
ICLES
35
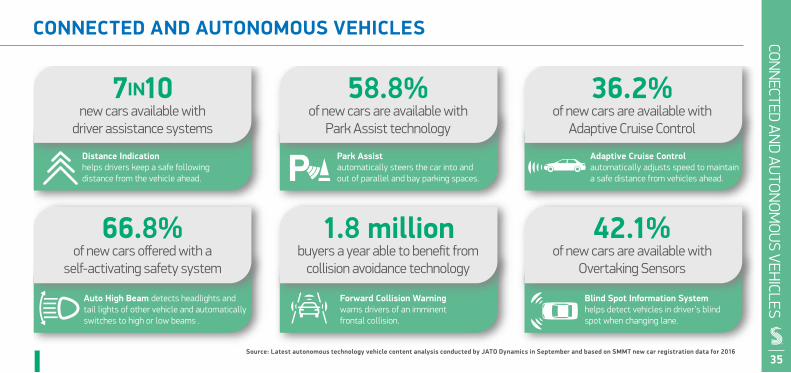
CONNECTED AND AUTONOMOUS VEHICLES
Forward Collision Warningwarns drivers of an imminent frontal collision.
Auto High Beam detects headlights and tail lights of other vehicle and automatically switches to high or low beams .
Blind Spot Information Systemhelps detect vehicles in driver’s blind spot when changing lane.
Park Assistautomatically steers the car into and out of parallel and bay parking spaces.
Adaptive Cruise Controlautomatically adjusts speed to maintain a safe distance from vehicles ahead.
7IN10 new cars available with
driver assistance systems
58.8% of new cars are available with
Park Assist technology
36.2% of new cars are available with
Adaptive Cruise Control
66.8% of new cars offered with a
self-activating safety system
1.8 million buyers a year able to benefit from
collision avoidance technology
42.1% of new cars are available with
Overtaking Sensors
Distance Indicationhelps drivers keep a safe following distance from the vehicle ahead.
Source: Latest autonomous technology vehicle content analysis conducted by JATO Dynamics in September and based on SMMT new car registration data for 2016


SMMT Industry ForumIndustry Forum was formed
in 1994, initially as a unique
collaboration between leading
vehicle manufacturers, SMMT
and government to improve the
performance and competitiveness of
the UK’s automotive supply chain.
Continued measurable success has led to
sustained growth into many other sectors including
aerospace, construction, domestic appliances,
electronics and food. Industry Forum now provides
support to blue chip organisations in more than 30
countries across five continents.
www.industryforum.co.uk
The Motor OmbudsmanThe Motor Ombudsman is the
automotive dispute resolution
body. Fully-impartial, it is the
first ombudsman to be focused
solely on the automotive
sector, and self-regulates
the UK’s motor industry through its comprehensive
Motor Industry Codes of Practice which have each
been approved by the Chartered Trading Standards
Institute’s Consumer Codes Approval Scheme (CCAS).
www.themotorombudsman.org
SMM
T GROU
PSMMT GROUP
37
DIS C L A IM E R
This publication contains general in for mat ion
a n d , a lt h o u g h S M M T endeavours to ensure
that the content is accurate and up-to-date
at the date of publication, no representation
or warranty, express or implied, is made as to
its accuracy or completeness and therefore
the infor mat ion in th is publ icat ion should
not be rel ied upon. Readers should always
s eek a p pr opr iate a d v ice f r o m a s u i t a bly
qualif ied expert before taking, or refraining
f rom tak ing, any ac t ion . T he content s of
th is publ icat ion should not be constr ued
as advice or guidance and SMMT disclaims
l iabil i t y for any loss, howsoever caused,
ar is ing d irec tly or indirec tly f rom rel iance
on the infor mat ion in th is publ icat ion. Any
use of data should be credited to SMMT.

THE SOCIETY OF MOTOR MANUFACTURERS AND TRADERS LIMITED71 Great Peter Street, London, SW1P 2BNTel: +44 (0)20 7235 7000E-mail: [email protected]
:@SMMT :SMMT
www.smmt.co.uk
May 2018
Top Related