


Languages
Pages
Legal


Smarter Information for Your HR organization
Faster Insight: Smarter DecisionsKaushik Raghunandan, Senior Solutions Architect,
Business Analytics Software, IBM India/SA

2
Agenda
Introduction
Today’s HR Information Challenges
Types of HR Information demands
HR Information Strategy – a key stepping stone
The business imperative for Workforce Analytics
IBM’s offering on Workforce Analytics

3
… Business Change in the Midst of an Info Explosion
1 in 31 in 3spent by knowledge workers each
week just searching for and understanding information
managers frequently make critical decisions without the
information they need
19+ Hours19+ Hours
3 in 43 in 4
“…40 exabytes of data created in 2008…more than created in the previous 5,000 years combined…”
business leaders say more predictive information
would drive better decisions
Source: Various Industry Studies

Growing focus on business outcomes
30% of all project costs are associated with rework. Requirements mistakes
account for up to 70% of this cost
“CIOs are under pressure to enable their teams to become catalysts for change. However, change is outpacing their ability to deliver.
They are reorienting their teams to focus on ROI & quantified business outcomes and to mitigate risk and reduce costs”
– IBM CIO Survey, 2008
“Only 22% of executives felt that their IT and business strategy were tightly
integrated”
“49% of budgets suffer overruns and 62% fail to meet their scheduled”
Managing the Information ExplosionA history of cost overruns, schedule slips and quality issues
“50% of data warehouse projects fail and can take 16-18 months to complete.”
“Requirements activities impact up to 35% of a project effort, and can cause waiting time, and redundant activities that eat up to 10% of your budget”

The Implications for Rework – Poor TCODelays & poor quality
Lost Opportunity
• Late to market by 6 months or more will cost organizations 33% of the 5-year ROI
• 41% of projects fail to deliver expected business ROI
• 49% of projects overrun original estimates
-Standish Group
20
200Re
lati
veCo
st to
Rep
air
AcceptanceQA TestCodingDesignAnalysis
0
Maintenance
105
50
1-2
Cost
• 70-80% of development costs are spent identifying and correcting defects
• More than 40% of IT development budget will be consumed by poor requirements

+
• Packaged Business IntelligenceSelf-serve, ready made reports that reduce ad hoc custom reporting
• Highly AdaptableConfigurable drag-and-drop interface that reduces re-work, ensures continuously relevant content and speeds time to insight
• ExtensibilitySeamless integration with Cognos 8 to gain additional insight using different BI components
Faster Insight: Smarter Decisions

Business Areas
What’s Included?What’s Included?
Over 43,000 Objects including
250+ Dimensions
850+ Metrics
230+ Defined Calculations
Over 43,000 Objects including
250+ Dimensions
850+ Metrics
230+ Defined Calculations
1000+ Report Configurations1000+ Report Configurations
Embedded Data WarehouseEmbedded Data Warehouse Financial AnalyticsFinancial Analytics
Ledger PayablesReceivablesCash ManagementCustomer/Vendor Risk
Workforce AnalyticsWorkforce AnalyticsTalent DevelopmentTalent ManagementTalent RetentionWorkforce StrengthCompensation
Common Decision-Making ModelCommon Decision-Making Model ERP AgnosticERP AgnosticUnified PlatformUnified Platform
Analytics Drill ThroughAnalytics Drill Through Packaged Reporting & AnalysisPackaged Reporting & AnalysisDatabase Agnostic Database Agnostic
What’s in the Box …
7
Adaptive Framework
Unlimited Extensions
Delivered ERP extraction
Unlimited Data Sources
Adaptive Framework
Unlimited Extensions
Delivered ERP extraction
Unlimited Data Sources
Procurement AnalyticsProcurement Analytics
Spend AnalysisVendor AnalysisContract ManagementOperational Efficiency
Sales AnalyticsSales AnalyticsPipeline PerformanceSales force PerformanceSales SegmentationCustomer RelationsPricing and Program Analytics

The Difference – Time to Value
Other Analytic Applications IBM Cognos Analytic Applications

Why We’re Different – Adaptability
Buy Option
Requirements = Rigid
Custom business logic = Hard
Extensibility = Low
Lots of stair climbing
Build Option
Time to insight = Long
Requirements = Outdated
Cost of Maintenance = High
Lots of stair climbing
Our Approach
Business-centric v.s. data centric
Highly configurable drag-and-drop interface for the modifications to reports and addition of new ones
Automated synchronization of core components that eliminates manual work
Seamless extensibility to Cognos BI components

The Benefit for Your Team
Authored BI(Reports, Analysis, Metrics)
Semantic Layer
Data Warehouse
ETL Code
Other Analytic ApplicationsINDIVIDUAL STEPS TO MAKE
CHANGES = COSTLY AND COMPLEX
ERP CustomSource
IBM Cognos Analytic Applications
Authored BI(Reports, Analysis, Metrics)
Semantic Layer
Datamart
ETL Code
CHANGES WITH YOUR BUSINESS = FASTER VALUE
ERP CustomSource

Effectively Manage the Information Explosion
Your Pains Our Approach
• Deliver cross-functional insight on performance that evolves with changes to your business
• Improve your team’s productivity by automating labor-intensive processes – eg. estimated process-led automation yields savings of 4700 hours per project
• Make confident decisions faster to proactively address ever-changing inputs with greater visibility to metrics and dimensions
• Extend the value and lifecycle of your application with continuously relevant content
• Gain better total cost of ownership with automatic upgradeability and manageability
• High project costs: Poor requirements gathering contributes 70% of rework costs, or $1,300 per defect
• Disconnect between business goals and requirements solution: Disconnect results in too much rework, high costs, and poor quality.
• Delays in time to market: Lost cycles and time, arising from lack of collaboration and challenges in coordinating plans, process and resources across teams
• Labour intensive to meet LOB needs: Resource constrained IT departments not meeting simply requests in a timely manner.
Bottom Line
Less Work Better Manageability Faster Time to Value

12
Agenda
Introduction
Today’s HR Information Challenges
Types of HR Information demands
HR Information Strategy – a key stepping stone
The business imperative for Workforce Analytics
IBM’s offering on Workforce Analytics

Business Challenges with HR Reporting & Analytics Solutions
• Delayed decision making – Collecting and relating to fragmented information in
order to form conclusions and drive decisions is labor-intensive
• Complex data administration– Administration of data is people- and time-intensive
– Information analysis requires manual collection and subjective interpretation
• Large number of non-standard reports– Many of these reports have the same purpose, but
different users execute them in different ways
– Reports are transactional and operational in nature (i.e., don’t provide decision-making capability)
– Lack of standardized requirements

Business Expectations from a HR Reporting & Analytics Solution
• Minimize manual effort – No re-entering data to generate reports
• Confidence in the data quality
• Reduce to one point of generation – Eliminate multiple users executing reports
• Allow users to pull their own reports through integrated tools
– Maintaining security policies in a controlled environment (e.g., reporting through the portal)
• Allow users to access reports based on their rolesand authorizations

15
Agenda
Introduction
Today’s HR Information Challenges
Types of HR Information demands
HR Information Strategy – a key stepping stone
The business imperative for Workforce Analytics
IBM’s offering on Workforce Analytics

Tactical/Operational
Detail data that show results of current operations (e.g. employee lists)Information usually required frequently (e.g. daily)Raw data that may be used as a basis for summary analysis and/or to compile metricsData usually real-time coming from the HR transactional system
Analytical
Information analysis over time in comparison to a goal, measurement, or benchmark with decision making capability
Information normally in summary format and may be accompanied by charts and graphs
Data may not be real time
Source for the data maybe from multiple systems
Tactical/Operational vs. Analytical Reporting

17
Agenda
Introduction
Today’s HR Information Challenges
Types of HR Information demands
HR Information Strategy – a key stepping stone
The business imperative for Workforce Analytics
IBM’s offering on Workforce Analytics

HR Information Strategy — A Key Stepping Stone
Information Analysis
Framework
Functionality
HR Information
Strategy
RequirementsanalysisUsability
Technology

Five-Step Process to Create a HR Information Strategy
• Create an aim for your strategy and outline the reporting vision
• Identify the reporting stakeholders (people whom the reporting process affects)
• Identify the reporting tools
• Analyze requirements and map to the reporting tools
• Map tools to the reporting stakeholders
20
Agenda
Introduction
Today’s HR Information Challenges
Types of HR Information demands
HR Information Strategy – a key stepping stone
The business imperative for Workforce Analytics
IBM’s offering on Workforce Analytics

Better Capacity to Manage Your Workforce
Where do you see the greatest potential benefits of workforce analytics?
32%
51%
61%
67%
69%
76%
Higher level of compliance
Improved cost management
Greater ability to justify humancapital investments
Greater return on investmentsin talent management
Improved levels of workforceproductivity
Better capacity tomanage the workforce
0% 10% 20% 30% 40% 50% 60% 70% 80%
APQC Survey, February 2009* Percentages responding ‘4’ and ‘5’ with ‘1’ being “not a challenge” and ‘5’ being a “significant challenge”

Proactive HR Nearly Twice as Likely to Use Analytics
What are your current plans for developing and deploying a workforce analytics capability?
28%
11%
19%
15%
27%
7%
29%
22%22%20%
Currently have asystem in place
Planned in less thatone year
Planned in the next1-2 years
Planned in the next3-5 years
Not planned
HR proactively contributes to strategy All other organizations
0%
5%
10%
15%
20%
25%
30%
35%
APQC Survey, February 2009

23
Agenda
Introduction
Today’s HR Information Challenges
Types of HR Information demands
HR Information Strategy – a key stepping stone
The business imperative for Workforce Analytics
IBM’s offering on Workforce Analytics

WORKFORCE ANALYTICS
IBM Cognos 8 Workforce Performance
Top performers at risk of voluntary
termination
Determine alignment of
employees across divisions
INSIGHT
ManagerExecutive
• Total Head Count• Annualized Turn Over• Total Employee Salary• Workforce Demographics• Head Count Ratios
• Total Head Count• Annualized Turn Over• Total Employee Salary• Workforce Demographics• Head Count Ratios
• Workforce Strength• Talent Acquisition• Talent Development• Talent Retention
• Workforce Strength• Talent Acquisition• Talent Development• Talent Retention
ANALYTICAREA
ROLE
KPI
Offer incentiveto at risk top performers
Alignemployee
activities to contributeto strategy
ACTION
Retain top performers.
Reduce loss of productivity.
Retain top performers.
Reduce loss of productivity.
Increase organizational effectiveness
Increase organizational effectiveness
BENEFIT
SAP
Applications& Blueprints
Access & Interactivity
Universal Capabilities
Business Modeling
PerformanceManagement
Platform
Information Infrastructure

25
Faster Insights; Smarter Decisions
Packaged Business Intelligence
• Standard reports and analysis in minutes
• Self-serve reporting for a broad range of users
Adaptability
• Changes as fast as your business does
• Automates report changes
• Provides continuously relevant content
• Better TCO
Industry-leading BI (IBM Cognos 8)
• Open, enterprise class platform

Insight into Business Drivers
Human Capital Capabilities
WORKFORCE STRENGTHWORKFORCE STRENGTH TALENT ACQUISITION
TALENT ACQUISITION
TALENT DEVELOPMENTTALENT DEVELOPMENT
TALENTRETENTION
TALENTRETENTION
WORKFORCE COMPENSATION
WORKFORCE COMPENSATION
Business Drivers
Analysis DimensionsAnalysis Dimensions
DEMOGRAPHICSDEMOGRAPHICS
DIVERSITYDIVERSITY
EXPERIENCEEXPERIENCE
TOP TALENTTOP TALENT
KEY TALENTKEY TALENT
MANAGEMENT LEVELMANAGEMENT LEVEL
GLOBAL VISIBILITYGLOBAL VISIBILITY
Aging WorkforceAging Workforce Multi-Generational WFMulti-Generational WFWorkforce VisibilityWorkforce Visibility
Strategic DiversityStrategic Diversity And More……And More……Top Talent RetentionTop Talent Retention
Global CompensationDemographic CompensationDiversity CompensationPay for Performance
Global HiringDemographic HiringDiversity Hiring
Global StrengthDemographic StrengthDiversity StrengthTop Talent Strength
Global ProgressionDemographic ProgressionDiversity ProgressionTop Talent ProgressionDiversity Performance
Global TurnoverDemographic TurnoverDiversity TurnoverTop Talent Turnover
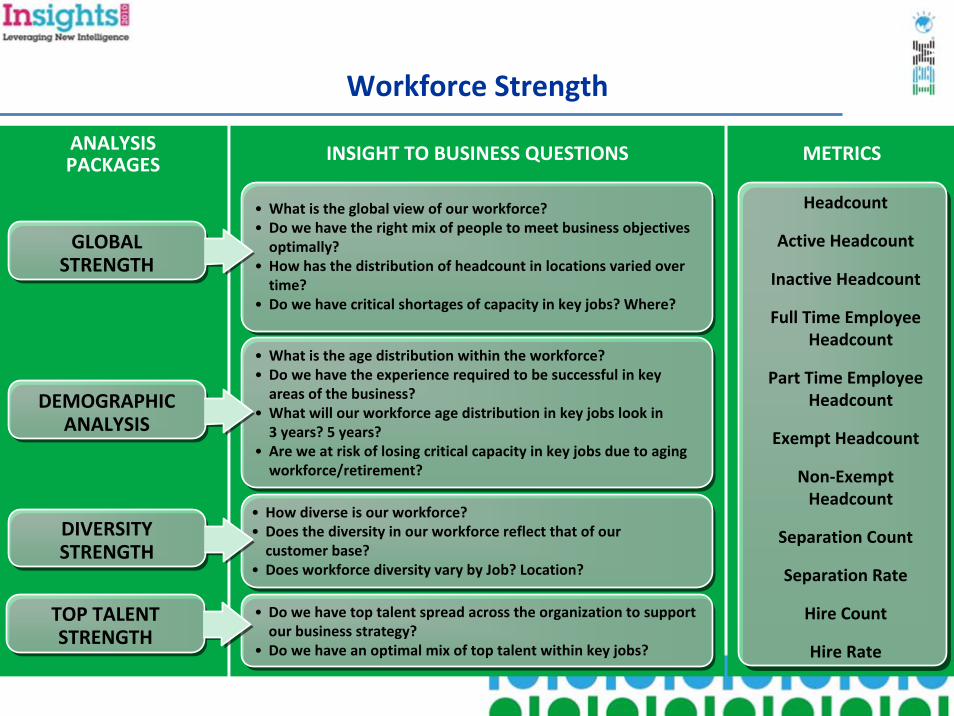
Workforce Strength
ANALYSIS PACKAGES INSIGHT TO BUSINESS QUESTIONS METRICS
• What is the global view of our workforce?• Do we have the right mix of people to meet business objectives
optimally?• How has the distribution of headcount in locations varied over
time?• Do we have critical shortages of capacity in key jobs? Where?
Headcount
Active Headcount
Inactive Headcount
Full Time Employee Headcount
Part Time Employee Headcount
Exempt Headcount
Non-Exempt Headcount
Separation Count
Separation Rate
Hire Count
Hire Rate
GLOBALSTRENGTH
• How diverse is our workforce?• Does the diversity in our workforce reflect that of our
customer base?• Does workforce diversity vary by Job? Location?
DIVERSITYSTRENGTH
• What is the age distribution within the workforce?• Do we have the experience required to be successful in key
areas of the business?• What will our workforce age distribution in key jobs look in
3 years? 5 years?• Are we at risk of losing critical capacity in key jobs due to aging
workforce/retirement?
DEMOGRAPHICANALYSIS
• Do we have top talent spread across the organization to support our business strategy?
• Do we have an optimal mix of top talent within key jobs?
TOP TALENTSTRENGTH
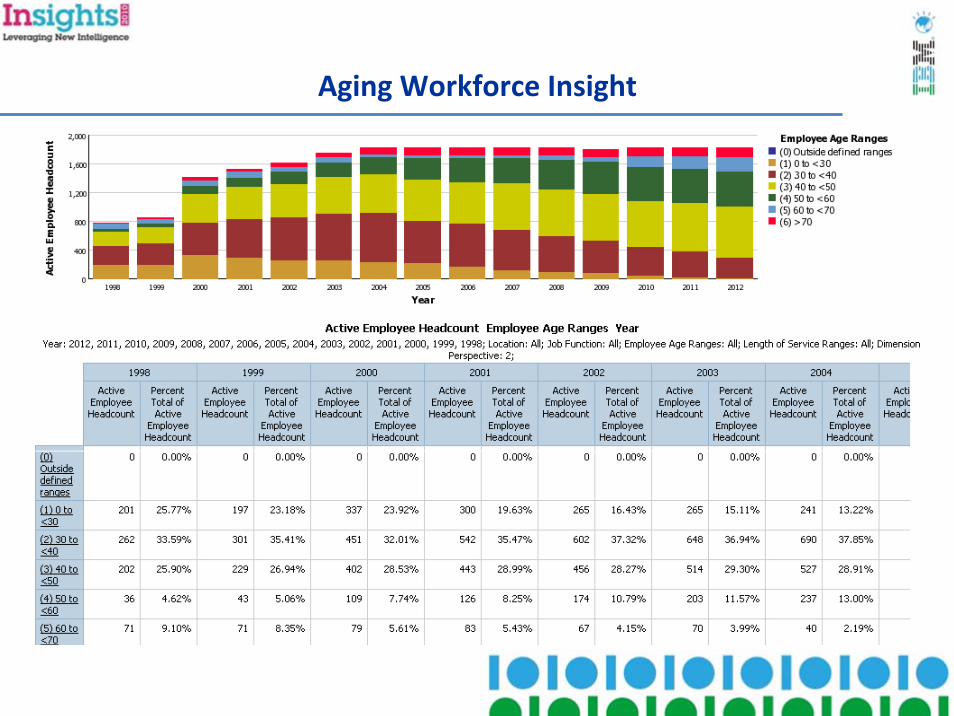
Aging Workforce Insight

ANALYSIS PACKAGES INSIGHT TO BUSINESS QUESTIONS METRICS
Talent Acquisition
• Do our hiring practices match our strategy for workforce composition and mix of employment types?
• Are we hiring a significant number of former employees?• How are we doing at hiring new talent for key jobs?• What Employee Level is New Talent coming into
the organization?• Have I increased or decreased my hiring based on
workforce demands?
Hire Count
New Hire Count
Re-Hire Count
Hire Rate
New Hire Rate
Re-Hire Rate
Headcount
Separation Count
Separation Rate
GLOBALHIRING
• How do recent hires impact workforce diversity?• What is our new talent diversity breakdown by age group?• How has our ability to attract a diverse workforce changed over
time?
DIVERSEHIRING
• Are we hiring Talent with the right experience levels?• What is the generation make-up of our new talent?• How has the demographic mix of our talent changed
over time?
DEMOGRAPHICHIRING

Talent Acquisition: Example Insight
How are we doing at Acquiring Key Talent ?

ANALYSIS PACKAGES INSIGHT TO BUSINESS QUESTIONS METRICS
Talent Development
• How are we doing at Promoting Talent throughout the organization?
• How are we doing at promoting talent into key jobs to fill talent gaps? Promotion Count
Promotion Rate
Performance Rating
High Performer Count
Steady Performer Count
Low Performer Count
• Are we promoting talent throughout experience levels?• Are we promoting our new hires?• How have we been increasing or decreasing our progression
based on tenure?
• How are we doing at promoting our diverse workforce?
• What percentage of top performers receive a promotion?
• How do performance ratings vary by location, organization, and jobs?
• How does performance vary over time?
GLOBALPROGRESSION
DEMOGRAPHICPROGRESSION
DIVERSITYPROGRESSION
TOP TALENTPROGRESSION
GLOBAL PERFORMANCE

Talent Development: Example Insight
How are we doing at Promoting Talent?

Talent RetentionANALYSIS PACKAGES
INSIGHT TO BUSINESS QUESTIONS METRICS
Separation Count
Separation Rate
VoluntarySeparation Count
VoluntarySeparation Rate
InvoluntarySeparation Count
InvoluntarySeparation Rate
Headcount
• What is our global workforce turnover?• Are there certain jobs where we have a turnover problem?• Are there certain locations/organizations where we have a
turnover problem?• Have our separations been increasing or decreasing?• Is turnover increasing or decreasing in key jobs?• What is the impact of involuntary terminations on follow-on
termination rates?
GLOBALTURNOVER
• How does our workforce turnover vary by age range? Has our turnover been increasing or decreasing?
• Are there tenure points when talent leaves the Organization? How does this vary by job?
• How are we doing at Retaining New Talent?• What is the reason our talent is leaving? Are we terminating
New Talent or is our New Talent choosing to leave?
DEMOGRAPHICTURNOVER
• How are we doing at retaining our diverse workforce?• Is our ability to retain our diverse workforce getting
better or worse?
DIVERSITYTURNOVER
• How are we doing at retaining Top Talent? How are we doing at retaining Talent at all Performance Levels?
• How are we doing at retaining Top Talent across different Jobs, Locations, and Organizations?
• Why are we losing Top Talent?• Are we retaining Top Talent with experience?• Are we getting better or worse at retaining top talent?
TOP TALENTTURNOVER

Talent Retention: Example Insight
How are we doing at Retaining Key Talent ?
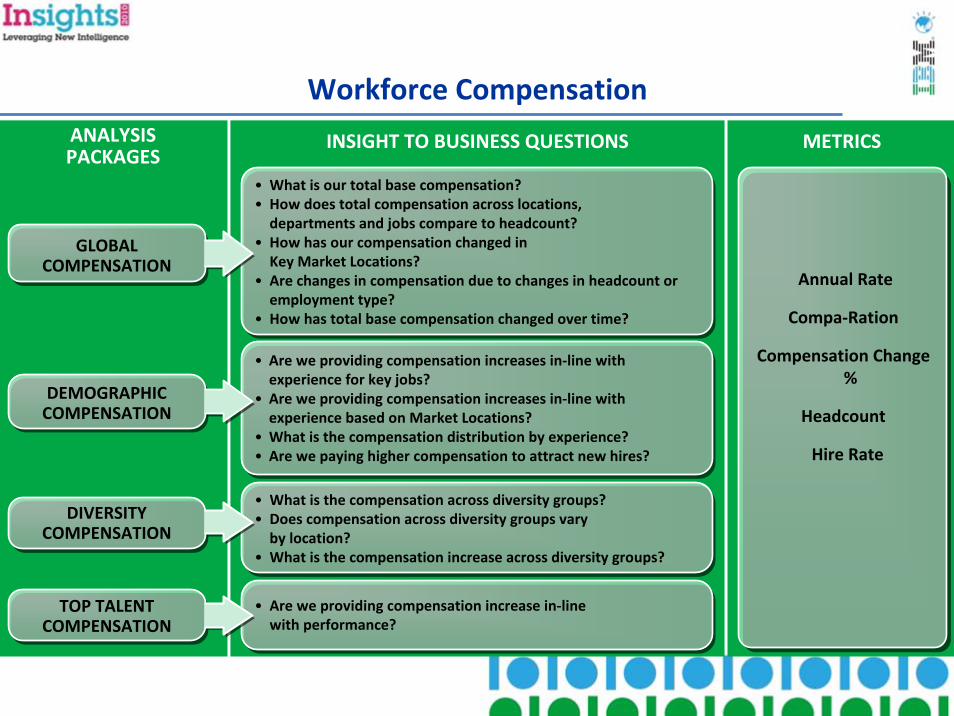
ANALYSIS PACKAGES
INSIGHT TO BUSINESS QUESTIONS METRICS
Workforce Compensation
• What is our total base compensation?• How does total compensation across locations,
departments and jobs compare to headcount?• How has our compensation changed in
Key Market Locations?• Are changes in compensation due to changes in headcount or
employment type?• How has total base compensation changed over time?
Annual Rate
Compa-Ration
Compensation Change %
Headcount
Hire Rate
GLOBALCOMPENSATION
• Are we providing compensation increases in-line with experience for key jobs?
• Are we providing compensation increases in-line with experience based on Market Locations?
• What is the compensation distribution by experience?• Are we paying higher compensation to attract new hires?
DEMOGRAPHICCOMPENSATION
• Are we providing compensation increase in-linewith performance?
• What is the compensation across diversity groups?• Does compensation across diversity groups vary
by location?• What is the compensation increase across diversity groups?
TOP TALENTCOMPENSATION
DIVERSITYCOMPENSATION

Workforce Compensation: Example Insight
How has our compensation changed in Key Market Locations?

Workforce Performance - Talent Analytics
Business Drivers
Analysis DimensionsAnalysis Dimensions
LEARNING TYPELEARNING TYPE
KEY POSITIONSKEY POSITIONS
SKILL CATEGORYSKILL CATEGORY
LOCATIONSLOCATIONS
ORGANIZATIONORGANIZATION
SOURCE & CHANNELSOURCE & CHANNEL
Acquiring Top TalentAcquiring Top Talent Learning and GrowthLearning and GrowthRetaining Key TalentRetaining Key Talent
Talent Pool ReadinessTalent Pool Readiness ……
SUCCESSIONSUCCESSION
Key Position Analysis
Succession Pipeline
Succession Readiness
TALENT DEVELOPMENTTALENT DEVELOPMENT
Global LearningDevelopment ProgramsLearning CostLearning EffectivenessSkills and Competencies
TALENT ACQUISITIONTALENT ACQUISITION
Talent SourcingTalent Pool AvailabilityCost to AcquireTime to AcquireAcquisition Effectiveness
TALENT RETENTIONTALENT RETENTION
Source & Channel TurnoverSkills & Competency Turnover

Talent Acquisition – Expanding InsightANALYSIS PACKAGES
INSIGHT TO BUSINESS QUESTIONS METRICS
Global Talent Sourcing
Time to Acquire Talent
Talent Pool Availability
Cost to Acquire Talent
• What is the pipeline for hard to fill positions?• What does my applicant pipeline look like?• How many qualified candidates are available? • Do we have the diversity required to ensure diversity in our hires
and overall workforce?
• What is our recruiting channel & source distribution? How does this vary by Job? By Location?
• How is the mix of recruiting channel & source changing over time?• What is our referral rate? How has this changed over time?• What is the mix of internal vs. external sources for talent?
• Which jobs are taking the longest time to fill?• What is the average time to fill by channel, source and market
location?
Acquisition Effectiveness
• What is our cost per hire?• How does our cost vary by channel and source?• How does this vary by Job and Location?
Acquisition Efficiency
• What is our Conversion Rate by Channel and Source? How does thisvary by Job and Location? Employee Referrals?
• What % of offers are accepted? What are the rejection reasons?• Are we able to hire our first choice candidates?
• What is the average number of requisitions handled by our recruiters?
• Where are the bottlenecks in the requisition process?
Hire Count
Hire Rate
Time to Fill
Time to Start
Open Position Count
Cost per Hire
Conversion Ratio
Offer Acceptance Rate
Requisition Count
Applicant Count
Candidate Count

Time to Acquire TalentWhat’s My Top Ten Recruiting Channels By Time?
Drill down and drill through by channel
and time
Gap analysis of recruiting channels – time to fill and time to start
Compare years and channels
Learn what’s working and what’s not
Email report to LOB or other HR professionals
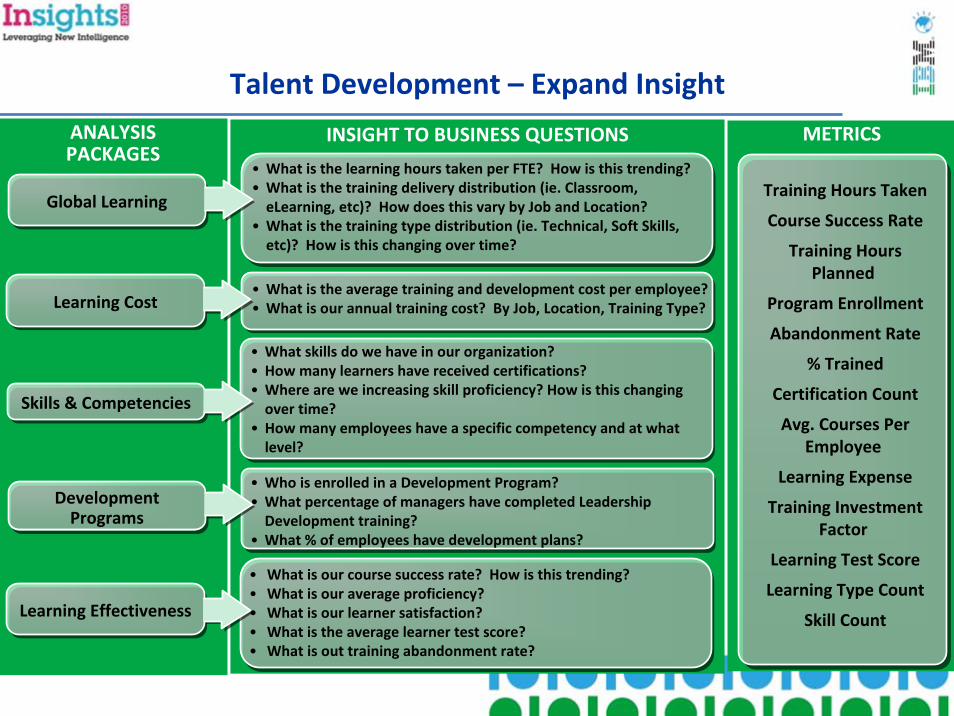
Talent Development – Expand InsightANALYSIS PACKAGES
INSIGHT TO BUSINESS QUESTIONS METRICS
Global Learning
Learning Cost
40
• What is the average training and development cost per employee?• What is our annual training cost? By Job, Location, Training Type?
• What is the learning hours taken per FTE? How is this trending?• What is the training delivery distribution (ie. Classroom,
eLearning, etc)? How does this vary by Job and Location?• What is the training type distribution (ie. Technical, Soft Skills,
etc)? How is this changing over time?
Training Hours Taken
Course Success Rate
Training Hours Planned
Program Enrollment
Abandonment Rate
% Trained
Certification Count
Avg. Courses Per Employee
Learning Expense
Training Investment Factor
Learning Test Score
Learning Type Count
Skill CountLearning Effectiveness
Skills & Competencies
Development Programs
• Who is enrolled in a Development Program?• What percentage of managers have completed Leadership
Development training? • What % of employees have development plans?
• What skills do we have in our organization?• How many learners have received certifications? • Where are we increasing skill proficiency? How is this changing
over time?• How many employees have a specific competency and at what
level?
• What is our course success rate? How is this trending?• What is our average proficiency?• What is our learner satisfaction?• What is the average learner test score?• What is out training abandonment rate?

Learning CostsWhat Are My Top Ten Job Positions for Training Costs?
Easy to use prompt process
Drill down into functional areas or provide a corporate view
What are my training costs by department
Easy to use prompt process
Export to different formats – PDF, Excel and more

Talent Development – Expand Insight
ANALYSIS PACKAGES
INSIGHT TO BUSINESS QUESTIONS METRICS
Performance Impact -Learning
• What are the performance ratings per learner? • Does Learning Impact employee performance
Performance Impact -Recruiting
Progression Impact -Learning • How does training affect employee promotions?
Progression Impact -Recruiting
• What recruiting sources provide the highest performing employees?
• What is the average performance at specific tenure periods (6 months, 1 year) by Recruiting Channel and Source.
• Do Referred Hires perform better, worse or the same as non-referred Hires?
• What Channels and Sources provide talent that progresses quickly in the organization?
• How has the progression changed over time?• How does progression vary by location and job?
Training Hours Taken
Course Success Rate
Training Hours Planned
Program Enrollment
Abandonment Rate
% Trained
Certification Count
Avg. Courses Per Employee
Learning Expense
Training Investment Factor
Learning Test Score
Learning Type Count
Skill Count

Promotions by JobWhat Are the Top Ten Promotion Counts by Department?
Variance analysis by time and department
Time variance by actuals and percentage
Insight into different promotions within departments
Drill down into specific departments
Email report to LOB

Succession – Expand Insight
ANALYSIS PACKAGES
INSIGHT TO BUSINESS QUESTIONS METRICS
Key Position Analysis
Succession Pipeline • What % of key positions have successors identified?• How many successors have multiple successors?
• What are our key positions?
• What % of key positions are currently filled
Succession Readiness • How much training have identified successors taken?• Have successors completed required development programs?
Key Position Count
Successor Count
Headcount
Course Completion Count
Development Program Completion
Count
Training Hours Taken
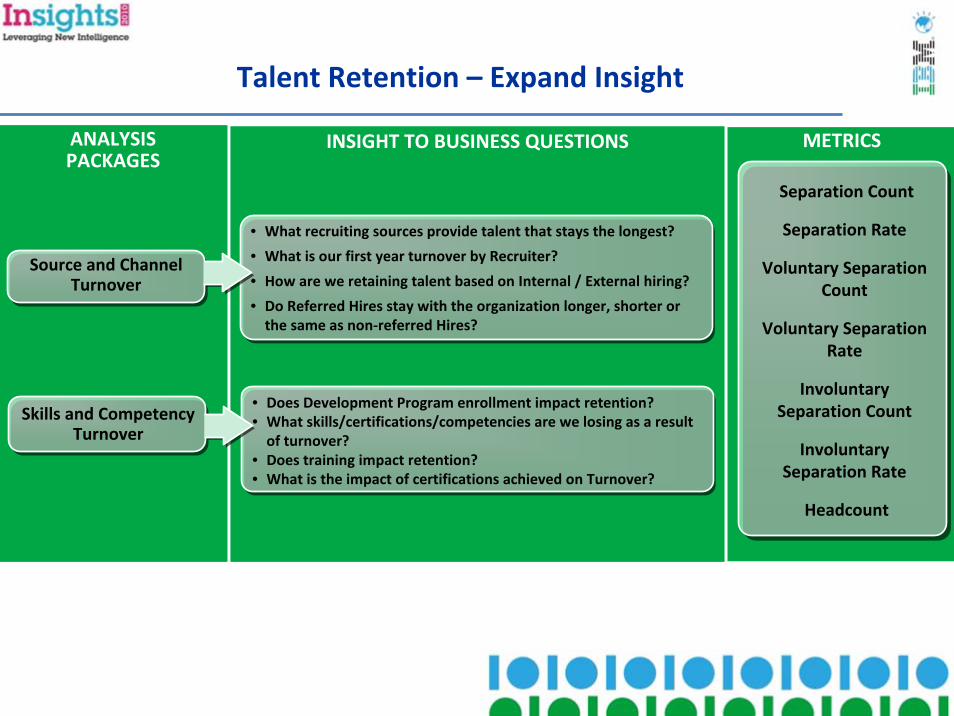
Talent Retention – Expand Insight
ANALYSIS PACKAGES
INSIGHT TO BUSINESS QUESTIONS METRICS
Source and Channel Turnover
Skills and Competency Turnover
• Does Development Program enrollment impact retention?• What skills/certifications/competencies are we losing as a result
of turnover?• Does training impact retention?• What is the impact of certifications achieved on Turnover?
• What recruiting sources provide talent that stays the longest?
• What is our first year turnover by Recruiter?
• How are we retaining talent based on Internal / External hiring?
• Do Referred Hires stay with the organization longer, shorter or the same as non-referred Hires?
Separation Count
Separation Rate
Voluntary Separation Count
Voluntary Separation Rate
Involuntary Separation Count
Involuntary Separation Rate
Headcount
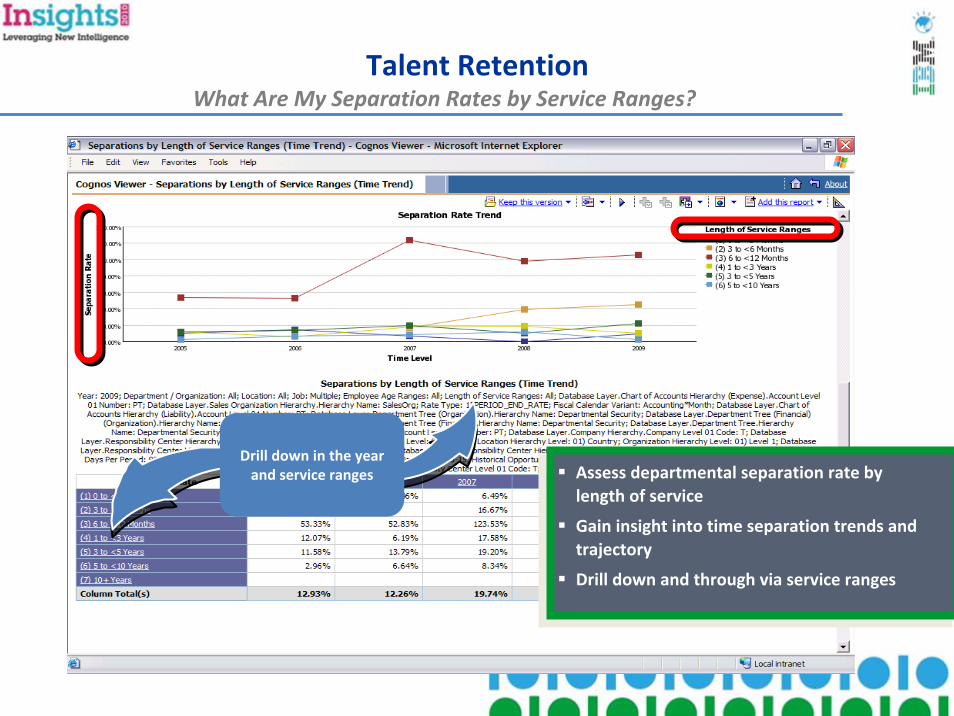
Talent RetentionWhat Are My Separation Rates by Service Ranges?
Drill down in the year and service ranges Assess departmental separation rate by
length of service
Gain insight into time separation trends and trajectory
Drill down and through via service ranges
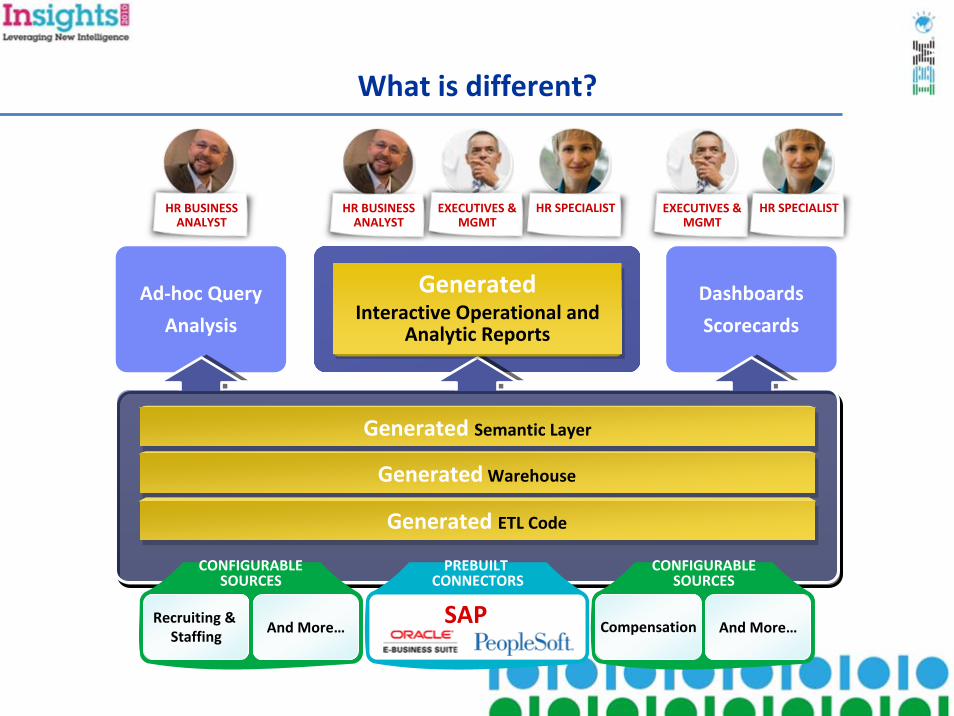
What is different?
Ad-hoc Query
Analysis
Dashboards
Scorecards
GeneratedInteractive Operational and
Analytic Reports
Generated Warehouse
Generated ETL Code
HR BUSINESS ANALYST
HR BUSINESS ANALYST
EXECUTIVES & MGMT
HR SPECIALIST EXECUTIVES & MGMT
HR SPECIALIST
PREBUILT CONNECTORS
CONFIGURABLESOURCES
CONFIGURABLESOURCES
And More…CompensationAnd More…Recruiting &
StaffingSAP
Generated Semantic Layer
Thank You
Top Related