


Languages
Pages
Legal


IR Presentation
Quarter III - 2015
Improving the values of life

Table of contents1. General information
2. Investment highlights
3. Performance

1. General information Important Milestones Corporate Vision & Strategic Objectives Organization Structure Awards

VietinBank Overview
Vietnam Joint Stock Commercial Bank for Industry and Trade (VietinBank) is a leading financial and banking group, plays a key role in Vietnamese financial-banking system.
1988 Established upon the separation from The State Bank of Vietnam (SBV).
2008 Went public through IPO and listed on Hochiminh Stock Exchange (HOSE) one year later
2009 Officially renamed into Vietnam Joint Stock Commercial Bank for Industry and Trade (or VietinBank in short)
2011 IFC officially became the foreign strategic shareholder of VietinBank with 10% stake ownership
2012
Became the first bank in Vietnam to successfully issue USD250mil international bond listed on Singapore Exchange
Sold 19.73% stake to Bank of Tokyo-Mitsubishi UFJ (BTMU) as a second foreign strategic shareholder.

Corporate Vision & Strategic Objectives
Continue to complete the organizational structure vertically, increase business network1
Improve service quality2
Enhance risk management capabilities in line with international practice, apply Basel II standards3
Strengthen corporate governance, efficient governance in accordance with international practice4
Accelerate the modernization of the Bank’s IT system5
Create added value for stakeholders, employees and customers6
Vision Striving to become the leading financial group in Vietnam and high ranking bank in the international market
Strategic Objectives
Motto Growing prudentially, efficiently and sustainably
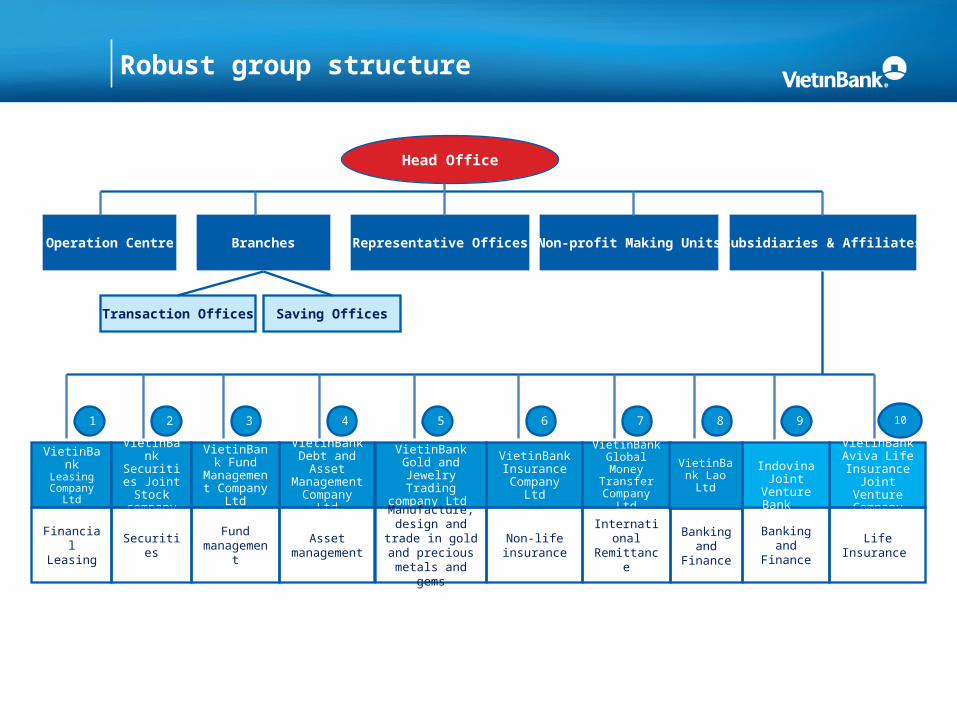
Robust group structure
Head Office
Operation Centre Branches Representative Offices Non-profit Making Units Subsidiaries & Affiliates
Transaction Offices
VietinBank Leasing
Company Ltd
VietinBank Securities Joint Stock company
VietinBank Debt and
Asset Management Company Ltd
VietinBank Insurance
Company Ltd
VietinBank Aviva Life
Insurance Joint Venture
Company
VietinBank Fund
Management Company
Ltd
Financial Leasing
Asset management
Non-life insurance Life Insurance Fund
managementBanking and
Finance
VietinBank Gold and Jewelry
Trading company Ltd
Securities
Indovina Joint Venture
Bank
Manufacture, design and trade
in gold and precious metals
and gems
1 2 3 4 5 6
Saving Offices
VietinBank Global Money
Transfer Company Ltd
International Remittance
7 8 10
VietinBank Lao Ltd
Banking and
Finance
9

Solid management structure and governance
Supervisory Board
Board of Directors
Board of Management
Internal Audit Department
Committees
Secretariat to Board
Risk Management Committee
HR and Remuneration
Committee
Policy Committee
Assets and Liabilities
Management Committee
Head OfficeTrade Finance
Center and Branches
Non-profit Making Units
Representative offices
Transaction Offices and
Savings Offices
Credit CommitteeFinancial Institutions Committee
Divisions and Departments
General Shareholder s’ Meeting

Awards
According to Brand Finance, VietinBank brand name is grade A and worth 197 million USD, ranked the 437 th in the world. This is the 3rd time VietinBank was selected and shortlisted into Top 500 financial institutions with strong brand name – the most valuable awards for the banks in the world.
According to Vietnam Report và Vietnamnet E-Newspaper, VietinBank ranked the 20 th among Top 500 big corporations in Viet Nam (VNR500). At the same time, VietinBank was honored to be shortlisted into best enterprises in Viet Nam.
VietinBank was also named the 3rd consecutive times and ranked the 1.854th in 2014 by the Forbes Global 2.000 awards.
• Ranked the 437th, 328th and 434th for 2014, 2013 and 2012 respectively.
• Ranked the 20th in the Top 500 Vietnam Group
• The best awards in Viet Nam
• Awarded by the Ministry of Industry and Trade
• Awarded the 11th consecutive time in 2014
• Being honored as a leading business in the financial sector to pay corporate income tax.
• Ranked the 5th and in five consecutive years, VietinBank in the Top 10 Business
• Awarded the organizations that providing the best financial services in Vietnam
• Ranked the 1.854th in 2014• Awarded the 3rd consecutive years.

2. Investment highlights Chartered Capital, Total Equity and Total Asset Market Share Network Brand name & Client base Shareholder support Corporate governance and HR Operating results vs. other listed banks

Strong abilities
23
4
56
7
8
1
Top financial institution in Vietnam with dominant market share: • Loans (12.6%)• Mobilized fund (9.7%)• Investment Banking (16.5%)• Remittance (15%)• International payment (12.9%)• Leading position in cards services (21%)
Highest operational efficiency and most remarkable business performance in Vietnamese banking system
World-wide and Nation-wide network
Largest scale in Charter Capital and Total Equity
Experienced management team and effective human resources
A strong brand name with a diversified client base
Strong shareholder support
Solid infrastructure with modern technology system
Investment Highlights

Large scale & dominant market share
Assets (USD, Bil)
Equity (USD, Mil)
Chartered Capital (USD, Mil)
Networks(units)
Stat
e-ow
ned
cred
it in
stitu
tions
Join
t-sto
ck c
omm
erci
al b
anks
8
10
10
6
9
28
36
32
506
1,012
891
665
576
2,018
1,814
2,554
433
731
568
564
428
1,217
1,562
1,701
408
417
318
346
328
725
1,131
Note: Data as of 30/09/2015Updated network data for VietinBank only

Network Overview
Presence across the nation:• 01 Head Office in Hanoi• 01 Trade Finance Center in Hanoi• 149 Local branches, 982 transaction offices and
savings offices in all cities and provinces• 02 Representative offices in Da Nang and Ho Chi
Minh City• 03 Functional units• 07 Subsidiaries (insurance, securities, financial
leasing, fund management, assets management, gold and jewelry, global money transfer)
• 02 Joint-venture companies (Indovina Bank & VietinBank Aviva Insurance Company)
• Nearly 2000 ATMs
Foreign expansion:• 01 Branch in Frankfurt, Germany• 01 Branch in Berlin, Germany• 01 Subsidiary in Laos (VietinBank Lao Ltd)• 01 Representative office in Myanmar
VietinBank has established banking relationships with 1000 banks in 90 countries and territories all over the world
1 Trade Finance Center in Ha Noi
151 branches, 982 transaction
offices and savings counters
3 Representative offices
2 Joint-Venture Companies
8 Subsidiaries
3 non-profit making units
North
71 Branches +01 Trade Finance
Center
Central
27 Branches
South
51 Branches

Global Reach Plan
1 Trade Finance Center in Ha Noi
151 branches,982 transaction
offices and savings counters
3Representative
offices
2 Joint-Venture Companies 8 Subsidiaries 3 non-profit making
units
Our current position We are also proud of having correspondences
with more than 1,000 banks in 90 countries
Opened branches: Frankfurt: Sep 2011 Laos : Feb 2012 Berlin : May 2012
Open representative office in Myanmar in 2013
For the period from 2014-2015: Upgrading VietinBank
Laos Branch into VietinBank Lao Ltd.,
Establishing VietinBank’s subsidiaries in Cambodia and the Republic of the Union of Myanmar

Reputable & Diversified Corporate Customer
VietinBank has fostered strong banking relationships with some of the most well-established corporates in Vietnam

Structure of ownership
Major Shareholders’ stakes
Shareholder
VietnameseGovernment
IFC
BTMU
Support
Government owns 64.46% of VietinBank’s Charter Capital. Government ownership ratio will not fall below 51% at any time.
The majority of Board of Director’s members are appointed by the Government.
Cooperation Agreement with IFC covers: Risk management Banking services for SMEs Energy Efficiency Project Information technology
Technical Assistance & Business Collaboration Agreement with BTMU covers: Risk management & Basel II Implementation Information technology Investment banking Retail and SMEs banking Cash collection and settlement service
64.46%8.03%
19.73%
7.78%
State Bank of Vietnam IFC
BTMU Others
Major shareholders’ supports

VietinBank vs. other banks – QIII/2015
Unit: USD Million CTG BIDV VCB ACB STB EIB MBB SHB Average
Total Assets 32,466 35,914 28,121 8,817 9,734 5,801 9,501 8,374 17,341 Chartered capital 1,701 1,562 1,217 428 568 564 731 433 901 Balance sheet
Placements with and loans to other banks 2,605 2,986 6,570 368 213 192 1,379 1,053 1,921
Loans and advances to customers 22,822 25,139 16,281 5,985 6,659 3,889 5,194 5,599 11,446 Trading and investment securities 4,836 5,396 4,051 1,609 1,531 1,009 2,347 654 2,679 Trading securities 35 371 232 20 238 0 486 1 173 Investment securities 4,801 5,025 3,819 1,589 1,293 1,009 1,861 653 2,506 Long-term investments 178 244 164 33 15 88 71 14 101 Other assets 1,286 973 416 412 429 156 379 793 606 Liabilities Deposits and borrowings from other banks 4,181 3,711 2,551 204 169 332 177 857 1,523 Customer deposits 21,418 24,811 22,280 7,732 8,402 4,570 7,973 6,588 12,972 Financing funds, entrusted funds 2,391 1,516 0 8 86 0 13 17 504 Other liabilities 1,179 857 740 160 184 97 184 150 444 Owner's equity and Funds 2,554 1,814 2,018 576 891 665 1,012 506 1,254 Income statement (accummulated) Net interest and similar income 664 627 503 193 260 112 250 101 339 Net profit from services 49 74 64 24 37 10 20 5 35 Other income 60 76 133 20 12 6 31 10 43 Total income 773 776 700 238 310 128 301 115 417 Operating expenses 336 342 272 150 166 73 107 64 189 Provision for credit losses 175 181 216 37 46 23 78 18 97 Profit before tax 262 253 212 50 98 31 117 33 132 Profit after tax 204 206 166 39 76 24 92 26 104

3. Performance Stable deposits growth & high liquidity High credit growth, well controlled NPL ratio Safe & diversified securities portfolio Strong financial results Contribution in subsidiaries CTG Stock Performance
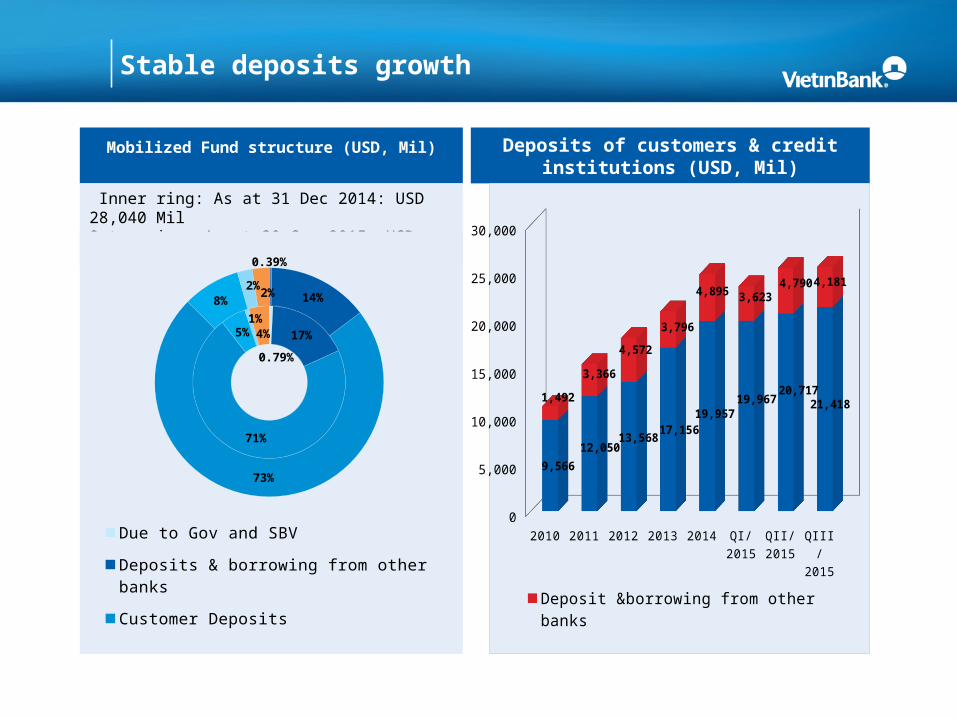
Stable deposits growth
Mobilized Fund structure (USD, Mil) Deposits of customers & credit institutions (USD, Mil)
Inner ring: As at 31 Dec 2014: USD 28,040 MilOuter ring: As at 30 Sep 2015: USD 29,432 Mil
0.79%
17%
71%
5%1%
4%
0.39%
14%
73%
8%2%2%
Due to Gov and SBVDeposits & borrowing from other banksCustomer DepositsSponsor capital, Entrusted InvestmentValue paper issuedOther mobilized funds
2010 2011 2012 2013 2014 QI/2015
QII/2015
QIII/2015
0
5,000
10,000
15,000
20,000
25,000
30,000
9,56612,050
13,56817,156
19,95719,967
20,71721,4181,492
3,366
4,572
3,796
4,895 3,6234,790 4,181
Deposit &borrowing from other banksCustomer Deposits

High liquidity
Customer Deposit Breakdown by Type of business (30.06.2015)
Customer Deposit Breakdown by by Tenor (30.09.2015)
CAR ratio
13.79%
82.78%
0.73%
2.69%Demand deposits
Term deposits
Deposits for specific purpose
Margin deposit 2010 2011 2012 2013 2014 QI/2015
QII/2015
QIII/2015
0%
2%
4%
6%
8%
10%
12%
14%
8.02%
10.57%10.33%
13.17%
10.40%
11.46%10.92%
10.45%
24.32%
5.10%6.87%57.74%
5.98%
SOEs
FDI
Other business entities
Individuals
Others

High credit growth, sustainable LAR ratio
Total loans and advances to customer (USD, Mil)
Loan Breakdown by Type of business (30.06.2015)
Loan to Total assets ratio
Loan Breakdown by Tenor (30.09.2015)
2010 2011 2012 2013 2014 QI/2015 QII/2015 QIII/2015
0
5,000
10,000
15,000
20,000
25,000
11,018
13,81115,690
17,711
20,704 20,97422,174 22,822
2010 2011 2012 2013 2014 1Q2015 2Q2015
63.69% 63.71%
66.20%65.28%
66.53%
69.69% 70.08%
56.13%
10.94%
32.94%Short term
Medium term
Long term
30.02%
4.62%46.48%
18.24%
0.64%
SOEs
FDI
Other business entities
Individuals
Others
2010 2011 2012 2013 2014 QI/2015 QII/2015 QIII/2015
63.69% 63.71%
66.20%65.28%
66.53%
69.69% 70.08% 70.30%

NPL ratio is well controlled
Group
QIII/2015 QII/2015 QI/2015 2014 2013 2012
Value
(USD, mil)
%Value
(USD, mil)
%Value
(USD, mil)
%Value
(USD, mil)
%Value
(USD, mil)
%Value
(USD, mil)
%
Group 1
Current22,427 98.27 21,676 97.75 20,312 96.84 20,295 98.03 17,404 98.27 15,394 98.11
Group 2
Special mention
178 0.78 176 0.79 285 1.36 177 0.86 129 0.73 66 0.42
NPLs 217 0.95 322 1.45 377 1.80 231 1.12 177 1.00 230 1.47
Total 22,822 100 22,174 100 20,974 100 20,704 100 17,711 100 15,690 100
2008 2009 2010 2011 2012 2013 2014 QI/2015 QII/2015 QIII/20150.0%0.5%1.0%1.5%2.0%2.5%3.0%3.5%4.0%4.5%
1.81% 0.61% 0.66% 0.75%
1.47%1.00% 1.12%
1.80%1.45%
0.95%
2.10%2.50% 2.40%
3.47%
4.09%3.79%
3.25%3.81% 3.72%
2.90%
VietinBank Banking average

• VietinBank has a robust credit systems, clearly defining relevant exposure limits and credit risk appetite
• Such systems are enhanced by a strong credit culture, benefiting from well-defined delegations of authority and reporting lines
Robust Credit Systems
• Loans and advances are relatively well allocated according to business entities & industry sectors, ensuring a high degree of diversification of potential risks
• The credit policy has put in place strict exposure credit limits
Well Defined Sectoral, Single Party and Group Exposure
Credit Limits
• Comprehensive and detailed loan classification and provisioning requirements and policies are in place, in consistent with regulatory norms and guidelines
• Existence of robust procedures have resulted in positive developments in non-performing asset measures in recent times
Comprehensive Loan Classification and Provisioning
Requirements
• Strong Credit risk management system is in place which has ensured improvement in the asset quality in this growing economic environment
Strong Credit Risk Management System
Asset Quality Management

Safe & diversified securities portfolio
Components of Investment portfolioInvestment portfolio (USD, Mil)
2010 2011 2012 2013 2014 QI/2015
QII/2015
QIII/2015
0%
5%
10%
15%
20%
25%
30%
35%
0
1,000
2,000
3,000
4,000
5,000
6,000
7,000
8,000
9,000
5,420
6,4336,332
7,539
8,327
7,108 7,3037,699
31.1%29.7%
26.7% 27.8%26.8%
23.6% 24.5%
24.6%
Total investment Investment to total asset ratio
43%
55%
0.06%
2%34%
64%
0.12%
2%
Interbank Debt securities Equity securities
Long-term investments
Inner ring: As at 31 Dec 2014Outer ring: As at 30 Sep 2015

Strong financial results
Profit results (USD, Mil)
Financial ratios
Operating Income Breakdown
Cost to income ratio
2010 2011 2012 2013 2014 QI/2015 QII/2015 QIII/20150
100
200
300
400
500
600
700
361
625590 559 527
143
296
436
164
296 295 273 270
58140
204
Profit before provisions for credit losses Profit after tax
2010 2011 2012 2013 2014 QI/2015 QII/2015 QIII/2015
0%
1%
2%
3%
0%
5%
10%
15%
20%
25%
30%
1.5%
2.0%1.7%
1.4%1.2%
1.0%1.2% 1.1%
22.1%
26.7%
19.9%
13.7%10.5% 9.0% 11.1% 10.7%
ROA ROE
2010 2011 2012 2013 2014 QI/2015 QII/2015 QIII/2015
0%
20%
40%
60%
80%
100%
82% 90% 84% 84% 84% 89% 87% 86%
10%5%
6% 7% 7% 5% 6% 6%
9% 5% 10% 9%9% 6%
6%8%
Other operating income Fees and commission income Net interest income
2010 2011 2012 2013 2014 QI/2015 QII/2015 QIII/201536%
38%
40%
42%
44%
46%
48%
50%48.57%
40.57%
42.96%
45.49%46.72%
41.50% 41.68%
43.55%

Contribution in subsidiaries
SubsidiariesTotal
contributed capital
(USD, mil)
Percentage of contribution
(%)
Charted capital as at 30.09.2015
(USD, mil)
Profit before tax as at
30.09.2015 (USD, mil)
VietinBank Lao Limited(*) 51.45 100% 51.45 0.74
VietinBank Leasing Company Ltd 45.68 100% 45.68 (**) 3.54
VietinBank Fund Management Company Ltd 43.4 100% 43.4 1.83
VietinBank Securities Joint Stock Company 27.27 75,61% 38.25 (***) 2.30
VietinBank Insurance Company Ltd 22.84 100% 22.84 1.49
VietinBank Gold and Jewelry Trading Company Ltd 13.7 100% 13.7 0.29
VietinBank Debt Management and Asset Exploitation Company Ltd
5.48 100% 5.48 (.04)
Global Money Transfer Company Ltd 2.28 100% 2.28 0.29
Improving the value of life
(*): Offcially come into operation since 31/07/2015(**): Capital increase from $36.55 million to $45.68 million according to VietinBank’s Board Resolution. (***): Capital increase from $36.09 million to $38.25 million thanks to stock dividend of 6%Exchane rate: Average interbank rate of 21,890 VND/USD

CTG Stock Performance – QIII/2015
Value
The closing price on 05th Jan 2015 18,800 VND/share
The closing price on 30th September 2015 19,600 VND/share
The highest prices in 9M2015 17,500 - 23,000 VND/share
Volume 190,447,216 share
Trading value 3,971 Billion VND
Foreign owned 29.5%
Current room of foreign investors 0.5%
EPS 2,397 VND/share
P/E (30th Sep 2015) 8.11x
BVPS 13,898 VND/share
P/B (30th Sep 2015) 1.41x
05/01/201511/02/2015 30/3/2015 12/5/2015 18/06/201527/07/201503/09/201580%
100%
120%
140%
160%
180%
200%
220%
240%Growth of VN-Index and Bank Stock –QIII/2015
CTG VCB BID MBB STB ACBVNIndex
05/01/2015 13/02/2015 03/04/2015 20/05/2015 30/06/2015 10/08/2015 21/09/20150
5
10
15
20
25
01,0002,0003,0004,0005,0006,0007,0008,0009,00010,000
CTG Stock Performance – QIII/2015
Volumn (Thousands of share) CTG price
Thou
sand
s do
ng

Website for investorshttp://investor.vietinbank.vn
For further information, please contact:
Investor Relations - Board of Director SecretariatsVietinBankAddress: 108 Tran Hung Dao street, Hanoi, Vietnam. Email: [email protected] Tel: 84-4-3 941 3622

Thank you!
Disclaimer : This presentation is prepared by using financial reports and other reliable sources with the aims to provide
information only. Readers should use this presentation as a reference source. The information might be updated from time to time and we have no responsibility to notify about that change.
Top Related