


Languages
Pages
Legal

1
1 . COMMON INSTRUCTIONAL FRAMEWORKSIX INSTRUCTIONAL STRATEGIES FOR THE GED AND ASSOCIATED LESSON PLANS
WWW.JFF.ORG
INTRODUCTION
Most traditional GED programming is focused on preparing students to acquire enough skills to pass the test. Thus, the majority of GED
holders find themselves inadequately prepared both for social and emotional as well as academic demands of postsecondary education.
Preparing students especially those with lower skills to pass the GED test and acquire the broad range of skills and competencies needed for
postsecondary success requires effective teaching practices premised on a powerful instructional framework that integrates foundational
skills in literacy and numeracy. One such framework is JFF’s Curriculum and Instructional Framework. This tool lays out the six instructional
strategies that constitute JFF’s Curriculum and Instructional Framework and provides sample GED to College lesson plans that the stratregies.
Teachers are encouraged to adapt these lesson plans and activities for their own classroom.
Collaborative Group Work: Collaborative group work involves bringing students
together in small groups for the common purpose of engaging in learning. Effective
group work is well planned and strategic. Students are grouped intentionally with
each student held accountable for contributing to the group work. Activities are
designed so that students with diverse skill levels are supported as well as challenged
by their peers. Collaborative group work uses questioning, scaffolding and classroom
talk and centers literacy groups.
Writing to Learn: Writing to learn is a strategy through which students can develop their ideas, their critical thinking ability and their
writing skills. Writing to learn enables students to experiment every day with written language and increase their fluency and mastery
of written conventions. Writing to learn can also be used as formative assessment and as a way to scaffold mid- and high-stakes writing
assignments and tests.
Literacy Groups: Literacy groups provide students with a collaborative structure for understanding a variety of texts and engaging in a
higher level of discourse. Group roles traditionally drive literacy groups by giving each student a role to play and a defined purpose within
the group. The specific roles or discussion guidelines may vary for different content areas, lengths of texts, or student level of sophistication
using this strategy, but the purpose of literacy groups is to raise student engagement with texts by creating a structure within which they may
do so.
Questioning: Questioning challenges students and teachers to use good questions as a way to open conversations and further intellectual
inquiry. Effective questioning (by the teacher and by students) deepens classroom conversations and the level of discourse students apply to
their work. Teachers use this strategy to create opportunities for students to investigate and analyze their thinking as well as the thinking of
their peers and the authors that they read in each of their classes.
JFF’s instructional coaching package helps schools build college readiness by implementing these six strategies in every
classroom in a school and creating consistency of language and practices across all subject areas.
Scaffolding: Scaffolding helps students to connect prior knowledge and experience with new information. Teachers use this strategy to
connect students with previous learning in a content area as well as with previous learning in an earlier grade. Scaffolding also helps facilitate
thinking about a text by asking students to draw on their subjective experience and prior learning to make connections to new materials and
ideas.
Classroom Talk: Classroom talk creates the space for students to articulate their thinking and strengthen their voice. Classroom talk
takes place in pairs, in collaborative group work and as a whole class. As students become accustomed to talking in class, the teacher serves
as a facilitator to engage students in higher levels of discourse. Classroom talk opens the space for questioning, effective scaffolding and
successful collaborative group work and literacy groups.
JFF’s Curriculum and Instructional Framework
consists of six instructional strategies drawn from
University Park Campus School in Worcester MA
and are being used in Early College High Schools
around the country and in Back on Track schools
in Philadelphia, PA and Portland, OR.

2
2. LESSON: INTRODUCTION TO THE GED ESSAY
WWW.JFF.ORG
SUBJECT/GRADE LEVEL:GED
LESSON T IME: 90 minutes
LESSON SYNOPSIS:Students will determine criteria for a “good” GED essay and then use that list to write an essay.
NB: this lesson makes the assumption that the best way to teach any genre of writing is to provide students
with an example or anchor paper and them let them deconstruct it to form a list of “rules” for that genre. I have
taught different kinds of poetry like this, as well as essays, outlines, book and movie reviews, business letters, and
characterization. If teachers can ask good questions, students can read and notice the conventions of any genre. This
lesson assumes that students have probably done this kind of exercise before. This kind of student-generated work
scaffolds easily to research papers, note-taking, and other college-ready skills.
LEARNING OUTCOMES - STUDENTS WILL BE ABLE TO:>> Analyze writing for conventions and patterns
>> Write a GED-style 5-paragraph essay
MATERIALS NEEDED:Sample GED (or other kinds) essay(s), overhead projector and essay on a transparency. This can also be done by
handing out copies of the essay and making lists on a board if an overhead projector isn’t available.
TE ACHER NAME:
NAME OF LESSON:

3
STEP 2 INVESTIGATE ESSAYS
Instructional Strategy
Teacher Activity Student Activity Time (min)
Collaborative Group
Work
Classroom Talk
Questioning
Hand out the sample GED essay. Explain
that this essay would receive a top
score. Ask what they notice about it, and
annotate as they observe different parts.
Make sure to ask about the function of
each of the sentences/paragraphs.
After they have listed a few, have them
work in pairs to find some more.
The key ideas to get at here are: topic
sentence introduces the subject of the
essay, the writer’s argument or position
is stated in the intro paragraph, the
body paragraph topics are mentioned in
order in the introduction, the essay has
5 paragraphs (intro, 3 body, conclusion),
each body paragraph discusses only
one topic, the conclusion summarizes
everything and/or adds closing thoughts
but uses different wording than the
introduction. Students will notice other
things as well.
Ask students a quick reflection question: is
the list of what you think an essay has to
have now different from before you read
the essay? How is it different?
Students share out what they are seeing.
Students work in pairs to make a common
list of noticings about essay structure and
“do’s” for the GED essay. They are working
to answer the question “What is it about
this essay that makes it a high-scorer?”
Students share out their list while the
teacher annotates the essay with their
ideas.
As a whole class, students take a minute
to answer the reflection question.
25 minutes
5 for share out, 10
for group work, 5
for share out of
pair work, 5 for
reflection
LESSON ACTIVITIES
STEP 1 BUILD BACKGROUND
Instructional Strategy
Teacher Activity Student Activity Time (min)
Questioning
Classroom Talk
Writing to Learn
Scaffolding
Ask students what they already know
about the GED essay.
What does it have to have? What should
it not have? What do you need to do to
get a good score? This will activate prior
knowledge as well as allow the teacher to
address any student misconceptions.
Think-pair-share:
Students read the questions, take a minute
to jot down some ideas, share those ideas
with a partner to make a longer list, then
share out the list so that there is a whole-
class-generated list.
A student or the teacher can record while
students share out.
15 min.
(2 writing,
3 talking, 10
sharing)

4
LESSON CLOSING SYNTHESIZE NEW LEARNING
Instructional Strategy
Closing Teacher Activity Closing Student Activity Time (min)
Questioning Ask the class the following questions:
What did you learn about the GED essay
that was new for you?
What, if anything, was challenging about
writing the essay?
What are you still confused about?
Give sufficient wait time, then have
students talk about their answers to these
questions
5-10 minutes
ASSESSMENTS OF LEARNING OUTCOMESAssessment 1: Use their draft essays to determine what they still need to learn about/where they are struggling
(grammar, structure, sequencing, etc.) Prepare subsequent lessons based on student needs.
Assessment 2: Responses during lesson closing should be noted as formative assessments.
STEP 3 APPLICATION
Instructional Strategy
Teacher Activity Student Activity Time (min)
Writing to learn Have students use the class-generated
list and the sample essay to guide them
through the writing of their own essay.
Hand out a sample essay topics and
paper and let students construct their
essays. When students finish before other
students, allow them to proofread using
the list.
If more scaffolding is needed before
students write their own essays, have
students write an essay from just an
introduction, or have them write the
introduction to a given essay using the
“rules” they came up with before.
Students can choose one of the essay
topics and write a draft essay.
30 min.

5
3. LESSON: POLITICAL CARTOONS
WWW.JFF.ORG
SUBJECT/GRADE LEVEL:GED to College
LESSON T IME: 90 minutes
LESSON SYNOPSIS:Students move from common symbols that they know and articulating relationships to applying those skills to political
cartoons.
NB: this lesson expects that students will have learned about making inferences
LEARNING OUTCOMES - STUDENTS WILL BE ABLE TO:>> Explain what symbols are as well as how and why they are used
>> Articulate visual relationships between symbols
>> Apply these concepts to interpreting political cartoons
MATERIALS NEEDED:Collection of common informational, religious, political symbols—these can be pulled easily from the internet
Collection of political cartoons from the GED, newspapers, internet, etc.
Chart paper and markers
QAR sheet
GED political cartoon practice questions
Paper and pencils for those who wish to make their own political cartoons
TE ACHER NAME:
NAME OF LESSON:

6
STEP 2 BUILD BACKGROUND/INVESTIGATE CARTOONS
Instructional Strategy
Teacher Activity Student Activity Time (min)
Scaffolding
Writing to learn
Collaborative group
work
Classroom talk
Review with students what inferences are
and how they are made: combing prior
knowledge with new information to make
an educated guess about something that’s
not stated directly.
Model for students how to interpret
symbols and relationships with political
cartoons by doing a think-aloud where you
identify symbols, describe what’s
happening in the carton, and then make
inferences about what it means, what the
author’s opinion is, and what makes you
think that. Also model what you can do
when you come across symbols you don’t
understand.
Ask students to work in their groups and
to each choose a task for the cartoon
they are given, then switch tasks for
subsequent cartoons. Make sure each
group gets at least three different
cartoons, but have extras on hand in case
a group finishes quickly with those three.
Decide whether all groups are working on
the same cartoons or not.
Walk around and conference with students
as they work, asking clarifying questions
where necessary.
Students give some examples of
inferences they make on a day-to-day
basis by way of reviewing the concept.
Students can watch, listen, and ask
clarifying questions.
Students each choose a task/role: symbol
decoding, visual description, making
inferences about the picture and the
author. In their groups, they should make
sure that each person gets at least one
chance to do each o the three tasks.
Students record work on chart paper and
can use the internet for assistance.
If there is time, students can share out
their work.
45 minutes:
15 to review and
model, 30 for
students to work
in groups on their
cartoons
LESSON ACTIVITIES
STEP 1 ACTIVATING PRIOR KNOWLEDGE
Instructional Strategy
Teacher Activity Student Activity Time (min)
Scaffolding
Collaborative group
work
Ask students what a symbol is, take
answers and see if students can develop a
class definition.
Post common symbols around the room
on chart paper and have students decide
on and write their meaning, their usage,
their associations.
Quick share out of ideas
Students rotate around the room in pairs
to identify what the posted symbols
mean and make comments about other
students’ answers.
15 minutes

7
ASSESSMENTS OF LEARNING OUTCOMESAssessment 1: Think-pair-share lesson closing
Assessment 2: Completed individual work
LESSON CLOSING
Instructional Strategy
Closing Teacher Activity Closing Student Activity Time (min)
Classroom talk Give pairs of students each a different
political cartoon. Ask them to work with
their partner and come up with a quick
interpretation: how would they explain this
cartoon to someone?
Think-pair-share: students talk to their
partner, then share their cartoon and
analysis with the entire class
15 min:
5 minutes for
pairs, 10 for report
outs
STEP 3 PRACTICE AND APPLICATION
Instructional Strategy
Teacher Activity Student Activity Time (min)
Writing to learn
Questioning
Give students a choice of activity here:
1. Generating their own political cartoon
2. Answering GED practice questions with political cartoons.
3. Using QAR to develop questions about political cartoons
Students work individually on their choice
of activity. If they do not complete it, have
them complete it for homework or let it be
part of the next lesson.
15 minutes

8
4. LESSON: GRAPHS, CHARTS, AND TABLES
WWW.JFF.ORG
SUBJECT/GRADE LEVEL:GED to College
LESSON T IME: 60-90 minutes, depending
LESSON SYNOPSIS:Students will use literacy group roles to analyze graphs, tables, and charts; then develop a method for “attacking” any
graph or chart they see.
NB: this lesson requires that students be taught some reading strategies/lit group roles beforehand. I recommend
teaching them one by one and letting the class practice with the role, then starting to mix them together and letting
students choose which ones they like to use and which ones best suit their learning styles.
LEARNING OUTCOMES - STUDENTS WILL BE ABLE TO:>> Review what they know about graphs, tables, and charts
>> Employ different strategies for interpreting and analyzing graphs, tables, and charts
>> Formulate a “plan of attack” so that they will feel confident reading any new data visual that they encounter
MATERIALS NEEDED:Lit group role cards, 5-6 different graphs, 5-6 different charts and tables (these can be right off the GED science, social
studies, or math practice exams, or they can be from the internet, newspapers, etc.—they can also be subject-specific
so that this lesson can connect with whatever the class is studying), model or exemplar of finished product so students
know what it should look like, group work rubric (optional)
TE ACHER NAME:
NAME OF LESSON:

9
STEP 2 INVESTIGATE GRAPHS, CHARTS, TABLES
Instructional Strategy
Teacher Activity Student Activity Time (min)
Literacy Groups
Classroom Talk
Writing to Learn
Split students into groups of three. Give
each group the roles and have them read
through them and ask any clarifying
questions they may have. You may have
to ask some check-for-understanding
questions to make sure students are clear
on the tasks the roles are asking of them.
Explain to students that they will be
creating three visual displays about
graphs tables and charts. Let them know
that they can pick any of the roles to use
but they cannot have the same role at
any given time as another member of the
group. Let them know also that after they
finish compiling their information about
the first graph/table/chart that they have
to switch to a different role for the next
one.
Show them a model that you have created
beforehand: a piece of chart paper with a
graph, table, or chart taped to it and the
products of three different roles written
underneath. If you’ve done the lesson
before, use prior student work as the
exemplar.
Hand out a selection of graphs, tables, and
charts to each group for them to choose
from, or strategically pick items you want
that group to work on.
Walk around and conference with students
as they work.
You may want to ask each group to share
out one of their pieces.
Students read through the six possible
roles and ask any questions they may
have.
Make sure students are clear about the
group tasks and responsibilities by asking
them questions about the exemplar and
the directions.
Students choose a role and begin working
on one of the graphs, tables, or charts.
When they are finished they should pick a
new role and do the same thing with a new
graph/table/chart. In order to get enough
practice with these, each group should
complete at least three different ones.
Students should also take turns doing the
writing—one group member should not be
making every visual display of work.
30-45 minutes
LESSON ACTIVITIES
STEP 1 BUILD BACKGROUND/ACTIVATE PRIOR KNOWLEDGE
Instructional Strategy
Teacher Activity Student Activity Time (min)
Scaffolding
Writing to Learn
Classroom Talk
Ask students to work with a partner and
write down everything they know about
graphs, tables, and charts—why they are
used, what are the different types, what
kinds of components they have.
1 student from each pair shares out, only
adding what has not already been said.
Record their answers as a mind-map,
T-chart, or Venn Diagram on the board.
Think-pair-share:
What is a graph? What is a chart or
table? Where do you see them? What are
different types? Why and when are they
used?
15-20 minutes
10
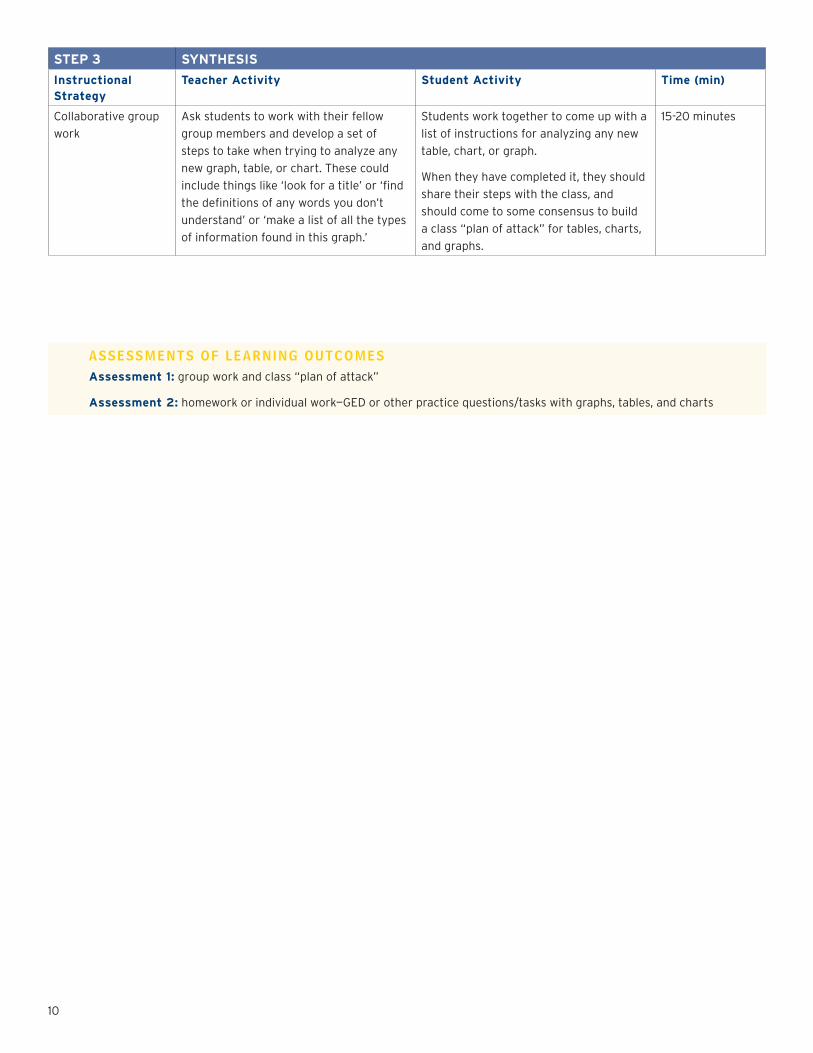
ASSESSMENTS OF LEARNING OUTCOMESAssessment 1: group work and class “plan of attack”
Assessment 2: homework or individual work—GED or other practice questions/tasks with graphs, tables, and charts
STEP 3 SYNTHESIS
Instructional Strategy
Teacher Activity Student Activity Time (min)
Collaborative group
work
Ask students to work with their fellow
group members and develop a set of
steps to take when trying to analyze any
new graph, table, or chart. These could
include things like ‘look for a title’ or ‘find
the definitions of any words you don’t
understand’ or ‘make a list of all the types
of information found in this graph.’
Students work together to come up with a
list of instructions for analyzing any new
table, chart, or graph.
When they have completed it, they should
share their steps with the class, and
should come to some consensus to build
a class “plan of attack” for tables, charts,
and graphs.
15-20 minutes

11
5. LESSON: MEAN, MEDIAN, MODE
WWW.JFF.ORG
SUBJECT/GRADE LEVEL:GED to College
LESSON T IME: 120 minutes minimum
LESSON SYNOPSIS:Students explore that how’s, why’s and when’s of using mean, median and mode to summarize data, as well as solving
algebraic problems with mean, median, and mode.
NB: students need to have experience with balancing and solving basic algebraic equations. This is likely a two-day
lesson, where on the first day students discover the differences and procedures behind mean median, and mode and
on the second day they apply basic knowledge of algebra to solving mean, median, and mode problems.
LEARNING OUTCOMES - STUDENTS WILL BE ABLE TO:>> Complete operations and equations using mean, median, and mode
>> Articulate the differences between mean, median, and mode
>> Choose whether to use mean, median, or mode depending on a given situation
MATERIALS NEEDED:Mean, median, mode group and pair work packet, dictionaries, internet access (optional) chart paper so groups can
present their work (optional)
TE ACHER NAME:
NAME OF LESSON:

12
STEP 2 INTRODUCE NEW LEARNING
Instructional Strategy
Teacher Activity Student Activity Time (min)
Collaborative Group
Work
Writing to Learn
Divide students into hetrogenously skilled
groups of three. Explain that each person
will have a task and have them read the
directions on the first page of the packet.
Circulate/conference with groups as they
are working.
Record their definitions and see if you can
come to a class consensus for each one.
Students should work in groups of three
to find the definitions of the words, then
share out what they have found.
15 minutes
STEP 3 INVESTIGATE PROCEDURES
Instructional Strategy
Teacher Activity Student Activity Time (min)
Collaborative group
work
Writing to learn
Classroom talk
Now that students have definitions for
the words, have them work in their groups
and use the examples to try and figure out
how each one is found.
Note: if students get frustrated, see if they
can explain the methods in words, then
have another group member write down
what they say.
After they share out, have them discuss
what to do with data sets where there
are multiple entries for a value, as in the
outlier example.
Students should use the definitions and
the examples to help them develop written
procedures for finding mean, median,
and mode. They will answer the three
questions that come after the examples.
Have them share out what they have come
up with.
Students then work together to solve the
outlier problem and record their ideas.
They then continue to work on the
application and critical thinking problem:
deciding when and why to use one method
over another. If there isn’t time, have them
complete this for homework or as the
warm-up for the next class.
20 minutes
20 minutes
LESSON ACTIVITIES
PART I
STEP 1 BUILD BACKGROUND/ACTIVATE PRIOR KNOWLEDGE
Instructional Strategy
Teacher Activity Student Activity Time (min)
Questioning
Scaffolding
Elicit from sts. What is an average?
How do we calculate average? What are
situations where we need to find average?
(Allow any and all student answers, record
these.)
Students contribute answers and explain
their schema.
5 minutes
13
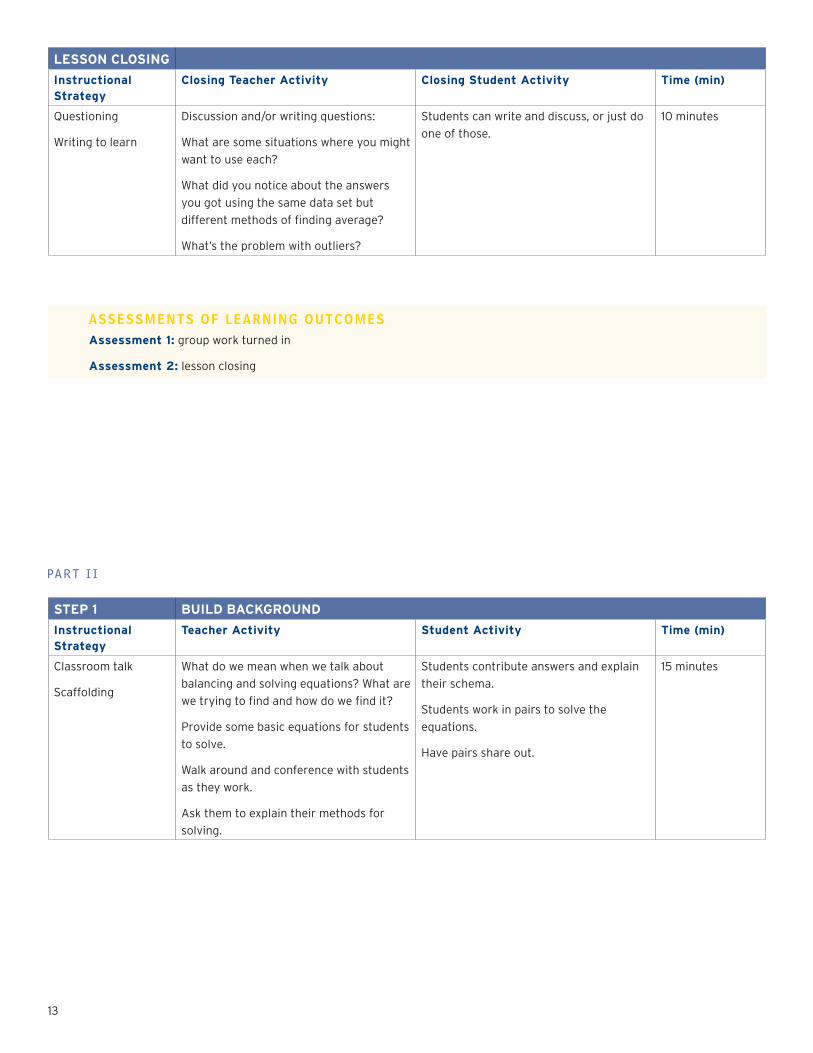
ASSESSMENTS OF LEARNING OUTCOMESAssessment 1: group work turned in
Assessment 2: lesson closing
LESSON CLOSING
Instructional Strategy
Closing Teacher Activity Closing Student Activity Time (min)
Questioning
Writing to learn
Discussion and/or writing questions:
What are some situations where you might
want to use each?
What did you notice about the answers
you got using the same data set but
different methods of finding average?
What’s the problem with outliers?
Students can write and discuss, or just do
one of those.
10 minutes
PART I I
STEP 1 BUILD BACKGROUND
Instructional Strategy
Teacher Activity Student Activity Time (min)
Classroom talk
Scaffolding
What do we mean when we talk about
balancing and solving equations? What are
we trying to find and how do we find it?
Provide some basic equations for students
to solve.
Walk around and conference with students
as they work.
Ask them to explain their methods for
solving.
Students contribute answers and explain
their schema.
Students work in pairs to solve the
equations.
Have pairs share out.
15 minutes

14
LESSON CLOSING
Instructional Strategy
Closing Teacher Activity Closing Student Activity Time (min)
Classroom talk
Questioning
Conference with groups/pairs as they
work. Ask questions to prompt thinking if
students get stuck.
Groups must solve each others’ problems
on chart paper and explain what they did.
15 minutes
STEP 2 INVESTIGATE EQUATIONS
Instructional Strategy
Teacher Activity Student Activity Time (min)
Collaborative Group
Work
Writing to Learn
Divide students into hetrogenously
skilled groups/pairs. Have them work on
completing the mean median and mode
packet they began yesterday—today they
are solving algebraic problems using
mean, median, and mode.
Circulate/conference with groups/pairs as
they are working.
Have them share out as they complete
each part, or have them check with other
groups/pairs to see if they got the same
answers.
Students work together on writing
equations, then writing equations and
solving them, and finally designing
problems for other groups to solve.
30 minutes

15
6. MEAN, MEDIAN, MODE
WWW.JFF.ORG
Mean median, and mode are also called “measures of central tendency.” They are three different ways of generalizing (or calculating
a representative number) from a group of numbers.
In your group, please answer the following questions. One person should look up each word and write the definition, as well as
explaining to the other two group members. You may use a dictionary or the internet.
1. What is the definition of mean?
2. What is the definition of mode?
3. What is the definition of median?
Now that you have some idea what these three terms mean, let’s figure out how to find each one using a set of data. Read the
examples below and see if you can figure out how I found each one, and what the differences are between mean, median, and mode.
Example 1:
I sell candy bars for a local fundraiser.
These were my sales totals for this week:
Day # sold
Monday 3
Tuesday 12
Wednesday 8
Thursday 4
Friday 8
The mean # of candy bars I sold for the
week was 7.
The median was 8.
The mode was 8.
Example 2:
These were home sales on Baker Street
for the month of June:
Home 1 sold for $112,000
Home 2 sold for $135,000
Home 3 sold for $98,000
Home 4 sold for $128,000
The mean price of homes sold on Baker
Street in June was $118,250.
There was no mode.
The median price was $120,000.
Example 3:
Marta is the clumsiest server ever. She has
been breaking glasses every week since
she started.
Week 1 she broke 11 glasses, Week 2 she
broke 3 glasses, Week 3 she broke 5
glasses, Week 4 she broke 8 glasses, and
Week 5 she broke 3 glasses.
The mean number of broken glasses
was 6.
The mode was 3.
The median was 5.

16
Using the definitions and the examples above, what is MEAN and how do you find the mean of a group of numbers? Write out the
steps as if you were explaining to someone else how to do it.
Using the definitions and the examples above, what is MODE and how do you find the mode of a group of numbers? Write out the
steps as if you were explaining to someone else how to do it.
Using the definitions and the examples above, what is MEDIAN and how do you find the median of a group of numbers? Write out the
steps as if you were explaining to someone else how to do it. (Hint: there is something tricky you have to do if there is an even number
of values in your data set.)
The Influence of Outliers: an outlier is a number that doesn’t seem to fit with the rest of the numbers. What is the outlier in this set
of data?
Value per House Number of Houses
$100,000 2
$175,000 5
$200,000 6
$800,000 1
Find the mean and median with the outlier. (Hint: how many houses sold at each price and how do you work with this data set?)
How did the outlier change the mean? How did the outlier change the median?
With the new set of data, which measure of central tendency would best represent the data?

17
APPLIC ATION AND CRITIC AL THINKING:
There are 11 streets in the Borough Hill Neighborhood. The average income level for a family of 4 on each of those 11 streets is as
follows:
$15,000, $12,000, $10,000, $28, 000, $20,000, $10,000, $19,000, $18,000, $17,000, $75,000, and $23,000 per year.
Find the mean, median, and mode of this data set.
The neighborhood association is trying to convince Smith Bank to open a branch in Borough Hill. Which way of summarizing the
income level data should they use to make a convincing argument to the bank’s president? Why should they use that method over the
other two methods?
The neighborhood association is also working with a local developer and the city to try and get more affordable housing built in
Borough Hill. Which number should they present to the developer to make the case that affordable housing is crucial for their
neighborhood? Why?
WRITING EQ UATIONS :
Given what you now know, please work in your group to develop equations for the following:
Mean of:, , , ,,
Median of: 4x, 2x, 4x+3, 8x, 7x, 5x

18
FINDING THE MISSING VALUE WITH ME AN:1. Suppose your grades on three history exams are 80, 93, and 91.What grade do you need on your next exam to have a 90 average
on the four exams? (Hint: write the equation first, then use your knowledge of balancing equations to solve.)
If 100 is the highest possible score on the fourth exam, is it possible to raise your average to 92? Explain.
2. Suppose your grades on four health exams are 99, 86, 76 and 95.What grade do you need on your next exam to have a 91 average on the four exams?
3. You have a mean score of 84 after taking five 100-point tests. What do you need to score on the sixth 100-point test to have a mean score of 85?
Top Related