


Languages
Pages
Legal


Six essays on patenting and coordination in ICT standardization:
Empirical analyses of essential patents, patent pools, and standards
consortia
vorgelegt von Dipl-. Kaufmann
Tim Pohlmann
von der Fakultät VII – Wirtschaft und Management der Technischen Universität Berlin
zur Erlangung des akademischen Grades
Doktor der Wirtschaftswissenschaften
- Dr. rer. oec. -
genehmigte Dissertation
Promotionsausschuss:
Vorsitzender: Prof. Dr. Stefan Müller, Technische Universität Berlin
Berichter: Prof. Dr. Knut Blind, Technische Universität Berlin
Berichter: Prof. Dr. Tobias Kretschmer, Ludwig-Maximilians-Universität München
Berichter: Prof. Dr. Yann Ménière, Cerna, Center of Industrial Economics MINES ParisTech
Tag der wissenschaftlichen Aussprache: 30. August 2012
Berlin 2012
D 83

i
Acknowledgements
This dissertation was only possible due to the help of several people that supported me during
my PhD. In this section I would like to thank them.
First of all I have to thank my supervisor Knut Blind. Knut inspired and supported my work
over the last three years. He was there when I needed new ideas and advice for my research.
He guided me through the world of research introducing me to his academic network. He was
patient and always trusted in my skills. Knut has established a great atmosphere in our
research department. He sets an example for an easy but respectful way of managing our
team.
I would like to thank the whole team of the Chair of Innovation Economics at the TU Berlin.
My colleagues and student assistants supported me, commented on my research, were there
when I needed someone to talk to and helped me to clear my mind when playing at the ping
pong table. You are a great team and I had a wonderful time with you. I want to say thanks to:
Stephan Gauch, Kerstin Goluchowicz, Annika Lorenz, Sören S. Petersen, Jan Peuckert, Julius
Rauber, Theresa Veer, Paul Wakke, Simone Wurster, Florian Berger, Alexander Cuntz, Helge
Dauchert, Andre Hermanns, Katja Hillmann, Axel Mangelsdorf, Petra Meurer, Bent Nowack,
Jorge F. Dias Braganca de Goncalves, Annika Philipps, Gero Stenke, Birgit Trogisch, Mike
Weber, Eva Wachsen, Arfan Bakhtiar, Mirko Böhm, Damiano Albrecht, Benjamin Brand,
Achim Brose, Christian Burmann, Lennart Döring, Jonas Gößling, Jacob Müller, Carla Pilz,
Dominik Grony ,Maciej Paluszynski, Hyae Ryung Kim, Till Thaler, Tobias Büttner, Anja
Tewes, Susanne Wollin-Giering, Falk Mazelis, Marius Renz and Karina Zittel
I am also grateful for the hospitality of the Parisian team at Cerna, Center of industrial
economics MINES ParisTech. I spend several research visits at Cerna, working and
discussing with the research team in Paris. In particular, I would like to thank my co-author
Justus Baron. Working with him was always enriching in many ways. Our cooperation on
several topics enhanced my skills and understanding of different research methods. He further
supported my stays in Paris and helped me with all the arrangements. We made a very good
team for many research projects. I would also highlight the support of Yann Ménière, who
supervised me during my stays at Cerna. Yann gave me advice and suggestions on my

ii
research. He further encouraged and supported me to cooperate with Cerna on many topics.
Furthermore I would like to thank the whole Cerna staff and especially: Henry Delcamp,
Gabrielle Moineville, Michel Berthélemy, Arnaud de la Tour and Lina Escobar Rangel as
well as the faculty members Matthieu Glachant, François Lévêque and Sesaria Ferreira.
I also would like to thank Peter Neuhäusler for the cooperation on a research project. Working
with him was always enriching. Thanks for the good cooperation and a good time in
Washington DC and Berlin.
I have to say thanks to Jeffrey Nickerson and Michael zur Muehlen who supervised me during
my stay as a visiting scholar at the Stevens Institute of Technology NJ, USA. Both supported
my stay and gave me advice for my research. I also thank Yegin Genc for the cooperation on
our research at the SIT.
Many thanks go to my friends who were always interested in my work and motivated me
during the last years. I would also like to thank my parents Bettina and Norbert as well as my
sister Luisa. You always listened when I was talking about my research topics. You
encouraged me when I was down and supported me in many ways. You raised and guided me
to make my way. Further thanks go to my girlfriend Rosann. You cheered me up when my
motivation was down, you gave me advice for many decisions, you showed interest in my
work and commented on it, you got me back on track when my mind was puzzled and you
were always there when I needed someone.

iii
Publication and Submission Record
The essay Essential Patents and Standard Dynamics is coauthored by Justus Baron and Knut
Blind and was presented at the 5th INTERTIC Conference on Innovation and Competition in
Venice, November 2011, at the Telecom ParisTech Conference on the Economics of
Information and Communication Technologies in Paris, September 2011, at the 7th
International Conference on Standardization and Innovation in Information Technologies in
Berlin, September 2011, at the sixth 6th Annual Conference of the EPIP Association: Fine-
Tuning IPR Debates and at the 10th ZEW Conference on the Economics of Information and
Communication Technologies in Mannheim, June 2012.
The essay Patent Pools and Patent Inflation is coauthored by Justus Baron and was presented
at the 4th INTERTIC Conference on Competition in High Tech Markets, Innovation,
Networks and Multi-sided Markets in Milan, October 2010, at the Conference on ICT and
Economic Growth, Strategy in ICT Markets in Munich 2010 and at the 4th ZEW Conference
on the Economics of Innovation and Patenting in Mannheim, May 2011. The essay is further
accepted for presentation at the European Association for Research in Industrial Economics
(EARIE) Conference which will be held in Rome, September 2012.
The essay Attributes and Dynamic Development Phases of ICT Standards Consortia was
presented at the IADIS International Conference, Telecommunications, Networks and
Systems in Freiburg, August 2010.
The essay Joint Innovation in ICT Standards: How Consortia Drive the Volume of Patent
Filings is coauthored by Justus Baron and Yann Ménière and was presented at the 2nd Asia
Pacific Innovation Conference in Singapore, 2011, at the 7th International Conference on
Standardization and Innovation in Information Technology SIIT in Berlin 2011, at the 6th
Annual Conference of the EPIP Association: Fine-Tuning IPR Debates in Brussels 2011, at
the Conference on the Economics of Information and Communication Technologies in Paris
2011 and at the 4th ICTNET Conference – ICT, R&D, Intangibles and ICT Diffusion in
London, April 2012.

iv
The essay Cooperate to Declare, Firms’ cooperatives activities as driving factors for patent
declaration on technology standards is coauthored by Knut Blind and was presented at the
DRUID-DIME Academy Winter Conference on Economics and Management of Innovation,
Technology and Organizations in Aalborg, January 2011, at the International EMAEE
Conference (European Meeting on Applied Evolutionary Economics) in Pisa, March 2011
and at the 7th International Conference on Standardization and Innovation in Information
Technology SIIT in Berlin, September 2011.
The essay Standard Essential Patents to Boost Financial Returns is coauthored by Knut Blind
and Peter Neuhäusler and was presented at the 6th EPIP Conference Fine-tuning IPR Debates
in Brussels, September 2011.
Summary
v
Summary
Information and communication technology (ICT) markets are subject to short product
lifecycles and a rapid technology evolution. Competition takes place on several market levels
where firms compete on products, on services and on platforms. ICT products are often
interdependent and in some cases indispensably work together. E.g. applications are
dependent on the underlying operating system which is again designed for computers that rely
on the functioning of their computer chips. Firms thus compete on different market levels
pursuing different business models to sponsor their proprietary technologies and to maintain
market share for their products and services. However, interoperability of products is a crucial
factor for market success and firms evermore have to coordinate their innovation activities
with other, often competing market participants.
Technology standards specify a common language for technologies to communicate
and interact. This ensures compatibility and functionality of complex technology systems.
Standards evolve in markets where returns increase when a large number of firms rely on the
same technology (Arthur, 1988). In markets where network effects are dominant, consumers
not only benefit from the consumption of a product but also from the number of other users of
the same product. As to Katz and Shapiro (1985) network effects are the primary reason for
the existence of compatibility standards. The success of a standard thus always depends on the
installed base of consumers (David and Greenstein, 1990). A strand of literature discusses
several effects of network externalities which are subject to standards. Bandwagon effects in
early technology cycles can yield lock-in. Competing standard solutions may further create
technological uncertainty which often results in waiting games, penguin effects and stranding
on unsuccessful specifications (Farrell and Saloner, 1985, 1986; Besen and Farrell, 1994;
Choi, 1997; Clements, 2004).
In the field of ICT, standard setting is no longer a sheer specification of compatibility
standards, but in fact a joint development of sophisticated technologies. Thus, standards often
frame a large number of innovative technologies (GSM, UMTS, WiFi, DVD, Blue-Ray,
MPEG, etc.). GSM and UMTS ensure communication of mobile phones and smart phones.
The Wi-Fi standard provides wireless connection to local internet hosts. CD, DVD or Blue-
Ray guarantee that decoders or players read discs to watch movies on TV or computer screens
and the MP3 standard allows listening to high quality music in compressed data formats on
multiple devices. The increasing need for interoperability comes along with a rising
sophistication of technology standards. In this context, standard setting is much more

Summary
vi
demanding in terms of R&D. Most consumers are not aware that these standards may
incorporate hundreds of patents from multiple companies (Simcoe, 2007).
Market accepted “standards” may be developed by a single firm, while “standard
agreements” are results of market coordination and consensus decisions (David and
Greenstein, 1990). Standards are described as de facto standards when they are subject to
proprietary technologies sponsored by a single firm or industry alliance. In comparison,
standards are described as de jure standards when they are specified by formal standard
setting organizations (SSOs). SSOs are voluntary and non-profit organizations which
coordinate the specification of commonly accepted standards. These organizations are
inclusive and attempt to gather all markets participants to reach consensus on technology
specifications (Bekkers et al., 2011). While de facto standards may also compete, de jure
standards seek to only foster one market accepted technology to ensure sustainable
compatibility (Farrell et al., 2007). Farrell and Saloner (1988) model coordination benefits
when standard solutions are set by committees instead of markets and show that SSOs
increase a standard’s value even though negotiation may take longer. Especially in recent
years SSOs increasingly gained importance. In markets with complex technologies, firms rely
on stable and interoperable solutions that require coordination of all market participants
(Lemley, 2002). SSO’s outcomes are market accepted standards that determine technology
trajectories for future generations. Standards may thus influence the value of a whole
technology (Rysman and Simcoe, 2008). Firms that provide proprietary technologies are
increasingly joining SSOs to value their often patented technology by having it approved as
part of an industry-wide standard. Competition also takes place within SSOs, since
technology selection in SSOs can be crucial for a firm’s future market position (Bekkers et al.,
2002). Although the need for interoperability is not recent, the last two decades have seen
standard setting in ICT evolve from mere coordination on common specifications to the joint
development of complex technology platforms. New generations of standards tend to embody
more components and functionalities. Consequently, the number of patents claimed on ICT
standards has been increasing since the early nineties (Simcoe, 2007).
Even though SSOs seek to align interests of all interested stakeholders, coordination
also takes place outside SSOs. Market participants may coordinate in rather loose ad hoc
meetings (Kerstan et al., 2012) or in more explicit alliances. Firms join informal industry
alliances to better influence and control technology development within standard setting.
Members of these coalitions are often likeminded peers with the common interest to support
and sponsor a certain technology (Weiss and Sibru, 1990; Axelrod et al., 1995). These
Summary
vii
consortia may help standard setting participants to improve their positions in negotiation for
technology selection (Leiponen, 2008, Rosenkopf et al., 2001). Lerner and Tirole (2006)
make the case of forum shopping where firms choose the appropriate standard setting venue
for including their proprietary technology. The forum choice especially depends on the value
of the technology and on expected revenue incomes. However, Blind and Gauch (2008) show
that standards consortia and formal SSOs rather co-exist than compete.
While the complexity of standardized technologies is growing, technology providers
which participate in standard setting, increasingly pursue very different business models
(Simcoe et al., 2009). This may upsurge the cost of coordination or even lead to coordination
failures. Especially when firms have commercial stakes in standards, vested interests may
delay standard setting processes or even yield a war of attrition (Farrell and Saloner, 1988;
Farrell and Simcoe, 2012). Conflicts and discrepancies in SSOs are often connected to a
firm’s preference of its own patented technology solution. Patents are essential to a standard
when any adoption or implementation would necessarily infringe the patent claims. Even
though some patents only contribute minor innovations to a standard, holders of essential
patents can hold-up the use of a whole technology (Lemley and Shapiro, 2006; Farrell et al.,
2007). In recent years famous litigation cases (Qualcomm v. Broadcom; Infineon v. Rambus;
IP COM v. Nokia; Apple v. Samsung; etc.) raised attention to often complex legal questions
concerning standard setting and the role of essential IPR.
Farrell and Simcoe (2012) have shown that IP rules may decrease firms’ vested
interests. In practice, bylaws of SSOs provide a legal framework for the general treatment of
patents that are relevant for standardization. SSOs often mandatorily require firms
participating in standardization to disclose any patent that might turn out to be essential for
the standard in question. Furthermore holders of such patents have to submit a declaration
whether they accept to commit on fair, reasonable and non-discriminatory licensing terms
(FRAND). If a firm discloses a patent and refuses to commit on such licensing terms, the SSO
will usually set the standard excluding the protected technology (Lemley and Shapiro, 2006).

Summary
viii
Even though standardization may be accompanied by complex licensing agreements,
the rules for licensing essential patents are far from conclusive and can be subject to complex
discussions or even legal and political investigations.1 Nevertheless, FRAND commitments
are commonly seen as an important instrument to curb anticompetitive and abusive behavior.
Antitrust authorities have referred to FRAND commitments as a remedy to the potential
competitive risks of standardization (Layne-Farrar et al., 2007; Farrell et al., 2007;
Schmalensee, 2009).
In conclusion, firms in ICT standardization are confronted with particularly two
major challenges. First, coordination is much more demanding and often results in
cooperation of competing firms jointly developing complex and sophisticated technologies.
Second, standardized technologies in ICT are in many cases protected by patents. Standard
essential patents are subject to a new and different legal framework which goes beyond the
rights of regular patent law. Both challenges influence incentives to develop and specify ICT
standards, incentives to invest in R&D or incentives to file patents. The six essays of this
dissertation build upon existing literature findings and theoretical implications to shed light on
the interaction of essential patents and standard dynamics. The essays furthermore investigate
different coordination mechanisms around standardization and measure the effect on firms’
R&D investments and patenting behavior.
Essential patents may increase incentives for firms to invest in standards, since future
licensing revenue pays back earlier investments. However, vested interest may delay
standardization or yield lock-in of outdated standards. SSOs coordinate the transition of
technology generations. Standard makers confronted with technological change can often
choose between replacing old by new standards and upgrading existing standards. The first
essay Standard Dynamics and Essential Patents investigates how this trade-off is affected by
the introduction of essential patents on standard components. Using a database of over 3,500
different ICT standards, the essay shows that essential patents reduce the likelihood of
standard replacement, but increase the rate at which standards are upgraded. The increase in
the number of upgrades may reflect an increase of firms’ investment in improving existing
standards. More frequent upgrades can only partly explain the effect of the delayed rate of
1 On January 31st, 2012 the European Commission announced to open a formal investigation on Samsung’s filed injunctions on standard essential patents. Samsung made injunctions against a number of competitors, among others Apple Inc. The Commission now turns the antitrust lens on Samsung to analyze whether these injunctions themselves are in breach of competition law. In particular it has to be investigated if Samsung has failed to honor its irrevocable commitment to license any standard essential patent under fair, reasonable and non-discriminatory (FRAND) terms. It has to be examined if Samsung’s behavior is an abuse of a dominant position prohibited by Article 102 of the Treaty on the Functioning of the EU (TFEU).
Summary
ix
replacement when essential patents are declared. Other explanations for this effect could be
frictions and vested interests among standard setting firms.
Patent pools are one of the most important mechanisms to coordinate complex
licensing of standard essential patents. Pools combine IPR to be licensed under a single
contract. This may increase transparency, reduce transaction costs, avoid costly infringement
litigation and furthermore may even reduce royalty rates by eliminating wasteful multiple
marginalization. The second essay Patent Pools and Patent Inflation investigates patenting
around technology standards when patent pools exist. Data from a rich sample of firms active
in ICT standardization is used to empirically test patent behavior around pool formation in a
time span of 1992-2009. The essay makes use of the information on the general clearance of
patent pools in 1997-1999 to conduct a quasi-experimental test on firms’ reaction to pool
creation. Results indicate that firms show an immediate positive response to a pool creation in
years before 1999 and in comparison show positive anticipating reactions if a pool is launched
after 1999. These findings suggest that legal certainty in periods after the pool clearance leads
to anticipating effects, while situations of legal uncertainty triggers a prompt effect after pool
launch. Furthermore tests provide evidence for a patent shift within the timing of
standardization when pools exist. While this evidence indicates a positive effect of patent
pools on the incentives to file and declare essential patents, the overall effect of pools on the
inflation of essential patents around standards seems to be limited.
The third essay Attributes and Dynamic Development Phases of ICT Standards
Consortia investigates the evolution of standards consortia in the field of ICT. The essay
provides a broad and comprehensive picture of standards consortia and their dynamic
development in the past ten years. Analyses show that consortia have distinct characteristics
which help to explain and justify their existence in the standard setting context. Observing
consortia evolution over the last 10 years identifies relationships between formation,
termination and merger of consortia with respect to market and technology development.
Results of a consortia performance analysis reveals that the probability of consortia success is
especially connected to the scope and focus on markets and technology and further depends
on structures that determine coordination among members.
The fourth essay Joint Innovation in ICT Standards: How Consortia Drive the
Volume of Patent Filings investigates the effect of R&D investments into standards when
firms join standards consortia accompanying formal standardization. The essay aims to assess
how such consortia influence the volume of R&D investments around standards, and whether
this is efficient. The essay shows that the effect depends on the strength of firms’ incentives to

Summary
x
develop the standard. Consortium membership triggers a higher number of R&D investments
when insufficient rewards for essential patents induce underinvestment in the standard. This
effect is necessarily pro-efficient. In situations where excessive rewards induce patent races,
consortium membership only moderately increases or even reduces R&D investments.
The fifth essay Cooperate to Declare investigates direct ties of firms that co-declare
essential patents for the same standards and measures different types of consortia
participation. The essay empirically tests whether participation in standards consortia
increases a firm’s ability to introduce patented proposals to formal standards. Results indicate
that memberships in technically related standards consortia help firms to influence
standardization by channels of partner control and mutual trust. Thus firms find it easier to
introduce patented components into formal standards when they are consortia members.
However, consortia connections in technically unrelated standards consortia show no
significant effects. The empirical analysis further provides evidence that consortia size
positively influences the likelihood of member firms to introduce patents into standards.
The sixth essay Essential Patents to Boost Financial Returns measures whether the
value of standards increases firms’ return on investments. In particular the influence of
declaring a patent to a standard on financial performance of firms active in ICT standard
setting is tested. Results indicate a curvilinear (inverse U-shaped) relationship of patent
declarations on firms’ return on assets (ROA). This effect lasts for one year, while the
incremental effect is higher for patents declared to standards consortia when comparing
declarations to formal SSOs. The optimal number of patent declarations is further measured
and shows a higher optimal level of financial return for declaring patents to formal standards.
The curvilinear relationship suggests firms to balance their patent portfolio by introducing a
share of patents into standards and by holding a share of patents on standard constructive
technologies.
Results of the six essays show that essential patents constitute a special case for the
dynamics of innovation. Essential patents influence the generational change of standards and
contribute to standard improvements. The coordination of licensing essential patents in a
patent pool alters incentives to patent in terms of timing and volume. Consortia are subject to
R&D coordination and strategic partnering to influence the outcome of standardization.
Participation in consortia indicates to affect standard specific patent behavior and the ability
integrate essential patents in standards. Essential patents further influence the value of a
standard and thus affect the structure of financial returns.

Zusammenfassung
xi
Zusammenfassung
Informations-und Kommunikationstechnologie (IKT) Märkte sind gekennzeichnet durch
kurze Produktlebenszyklen und eine schnelle Technologieentwicklung. Dabei konkurrieren
Firmen auf mehreren Marktebenen über ihre Produkte, Dienstleistungen und auf Plattformen.
IKT-Produkte sind oft technisch voneinander abhängig oder funktionieren unabdingbar
zusammen. Beispielsweise sind Anwendungen abhängig von dem zugrunde liegenden
Betriebssystem, welches wiederum für Computer entwickelt wurde, die auf Computer-Chips
aufbauen. Unternehmen können auf verschiedenen Ebenen im Markt unterschiedliche
Geschäftsmodelle verfolgen, um ihre proprietären Technologien zu fördern und Marktanteile
für ihre Produkte und Dienstleistungen zu sichern. Ein entscheidender Faktor für den
Markterfolg ist die Interoperabilität von Produkten. Daher müssen Unternehmen ihre
Innovationsaktivitäten mit anderen, oft konkurrierenden Marktteilnehmern koordinieren, um
wettbewerbsfähig zu bleiben.
Technologie-Standards spezifizieren eine gemeinsame Sprache, damit Technologien
kommunizieren und interagieren können. Standards sorgen damit für Kompatibilität und
ermöglichen das Funktionieren komplexer IT-Systeme. Standards sind besonders wichtig für
Märkte, in denen Erträge steigen, wenn eine große Anzahl von Unternehmen die gleiche
Technologie unterstützt (Arthur, 1988). In Märkten, in denen Netzwerkeffekte dominieren,
profitieren Verbraucher nicht nur von dem Konsum eines Produktes, sondern auch von der
Anzahl anderer Nutzer des gleichen Produktes. Für Katz und Shapiro (1985) sind Netzwerk-
Effekte der Hauptgrund für die Existenz von Kompatibilitäts-Standards. Der Erfolg eines
Standards ist somit immer abhängig von der so gennannte “installed base“ von Verbrauchern
(David und Greenstein, 1990). Ein wesentlicher Literaturstrang befasst sich mit den
verschiedenen Wirkungen von Netzwerk-Externalitäten, die in Verbindung mit Standards
stehen. Bandwagon-Effekte in frühen Technologie-Zyklen können zu Lock-in Situationen
führen. Weiterhin können konkurrierende Standards technologische Unsicherheit erzeugen,
die Anreiz zu Warte-Spielen oder Pinguin-Effekten geben, wie auch zu Strandung auf
erfolglosen Standards führen können (Farrell und Saloner, 1985, 1986; Besen und Farrell,
1994; Choi, 1997; Clements, 2004).
Im Bereich der IKT spezifizieren Standards eine große Anzahl von innovativen
Technologien (GSM, UMTS, WLAN, DVD, Blue-Ray, MPEG, etc.). GSM und UMTS
sorgen für die Kommunikation von Mobiltelefonen und Smartphones. Der Wi-Fi-Standard
Zusammenfassung
xii
ermöglicht die drahtlose Verbindung zu mobilen Endgeraeten. CD, DVD oder Blue-Ray
sorgen dafür, dass Decoder Discs lesen, um Filme auf TV- und Computerbildschirmen sehen
zu können. Der MP3-Standard ermöglicht das Hören von Musik in komprimierten
Datenformaten auf unterschiedlichen Geräten. Der steigende Bedarf an Interoperabilität geht
einher mit einer steigenden Komplexität von Technologie-Standards. In diesem
Zusammenhang hat sich die Entwicklung von Standards in den letzten Jahren als wesentlich
anspruchsvoller in Bezug auf Forschung und Entwicklung (F&E) erwiesen. Die meisten
Verbraucher sind sich nicht bewusst, dass diese Standards Hunderte von Patenten aus einer
Vielzahl an Unternehmen (Simcoe, 2007) integrieren.
Im Markt akzeptierte "Standards" werden von einer einzelnen Firma entwickelt,
während "Standard-Vereinbarungen" das Ergebnis von Markt Koordination und Konsens
Entscheidungen sind (David und Greenstein, 1990). Standards werden als de-facto-Standards
bezeichnet, wenn proprietäre Technologien von einer einzigen Firma oder Industrie-Allianz
etabliert werden. Im Vergleich werden Standards als de-jure-Standards beschrieben, wenn sie
durch formale Standard-Organisationen (SSO) spezifiziert sind. SSOs sind freiwillige Non-
Profit-Organisationen, die die Spezifikation von gemeinsamen Standards koordinieren. Diese
Organisationen versuchen alle Marktteilnehmer einzubeziehen, um einen Konsens über
Technologie-Spezifikationen zu erreichen (Shapiro, 2001). Während de-facto-Standards auch
konkurrieren können, werden de-jure-Standards spezifiziert, um lediglich eine vom Markt
akzeptierte Technologie nachhaltig zu etablieren (Farrell et al., 2007). Farrell und Saloner
(1988) modellieren Koordinationsvorteile, wenn Standards in SSOs statt in Märkte etabliert
werden und zeigen, dass SSOs den Wert eines Standards erhöhen, auch wenn Verhandlungen
in SSOs die Standardisierung verlängern können. Besonders in den letzten Jahren haben SSOs
zunehmend an Bedeutung gewonnen. In Märkten mit komplexen Technologien, müssen
Unternehmen auf stabile und interoperable Lösungen vertrauen, was die Koordination aller
Marktteilnehmer erfordert (Lemley, 2002). SSOs spezifizieren Standards, die die Technologie
Felder für zukünftige Generationen bestimmen. Standards können damit Einfluss auf den
Wert einer ganzen Technologie haben (Rysman und Simcoe, 2008). Firmen, die proprietäre
Technologien anbieten, treten zunehmend SSOs bei, um ihre oft patentierten Technologien in
branchenweit akzeptierte Standards einfließen zu lassen. Der Wettbewerb findet somit auch
innerhalb von SSOs statt, da die Auswahl von Technologien in SSOs die zukünftige
Marktposition von Unternehmen entscheidend beeinflussen kann (Bekkers et al., 2002).
Obwohl die Notwendigkeit der Interoperabilität nicht neu ist, haben die letzten zwei
Jahrzehnte der IKT-Standardisierung gezeigt, dass sich das Spezifizieren von Standards von

Zusammenfassung
xiii
einer anfänglichen Koordination zu einer gemeinsamen Entwicklung von komplexen
Technologie-Plattformen ausgeweitet hat. Neue Generationen von Standards neigen dazu,
mehr Komponenten und Funktionalitäten zu integrieren. Folglich ist die Zahl der
wesentlichen Patente, die auf IKT-Standards beansprucht werden, seit den frühen neunziger
Jahren gestiegen (Simcoe, 2007).
Auch wenn SSOs versuchen die Interessen aller Marktteilnehmer zu vertreten, findet
Koordination auch außerhalb der formellen Standardisierung statt. Dabei können sich Firmen
bei sporadischen Treffen (Kerstan et al., 2012), oder in eher verbindlichen Allianzen
koordinieren. Im Rahmen der IKT Standardisierung treten Firmen zunehmend informellen
Industrie Allianzen oder Konsortien bei, die den formellen SSOs zuarbeiten. Dabei sollen
besonders der Einfluss und die Kontrolle über die Entwicklung von Standard Spezifikationen
erhöht werden. In Standard Konsortien treffen sich Firmen die ein gemeinsames Interesse an
der Unterstützung und Weiterentwicklung bestimmter Technologien haben (Axelrod et al.,
1995; Weiss und Sibru, 1990). Ziel ist es die Verhandlungspositionen, bei der Auswahl von
Technologie Komponenten in der formellen Standardisierung, zu stärken. (Leiponen, 2008;
Rosenkopf et al., 2001). Lerner und Tirole (2006) beschreiben so genannte „forum shopping“
Aktivitäten, bei denen Firmen wählen, in welches Standardisierungs-Forum sie ihre
proprietäre Technologie einführen. Diese Wahl hängt von dem Wert der Technologie, sowie
von den erwarteten Einnahmen ab. Blind und Gauch (2008) zeigen jedoch, dass Standard
Konsortien und formelle SSOs eher koexistieren und weniger konkurrieren.
Während die Komplexität der standardisierten Technologien wächst, ist die Anzahl
der sich beteiligenden Technologie-Anbieter ebenfalls angestiegen. Diese verfolgen oft sehr
unterschiedliche Geschäftsmodelle (Simcoe et al., 2009). Dies kann die Kosten von
Koordination steigern oder sogar zu Koordinierungsausfällen führen. Vor allem, wenn
Unternehmen kommerzielle Anteile an Standards haben, können Interessenunterschiede
Standardsetzungsverfahren verzögern oder sogar zu einem Zermürbungskrieg führen (Farrell
und Saloner, 1988; Farrell und Simcoe, 2012). Konflikte und Unstimmigkeiten in SSOs sind
oft damit verbunden, dass Unternehmen ihre eigenen patentierten technologischen Lösungen
präferieren. Patente sind wesentlich für einen Standard, wenn eine Implementierung bzw.
Durchführung notwendigerweise Patentansprüche verletzt. Auch wenn Patente nur für einen
kleinen Teil des Standards verantwortlich sind, können die Inhaber von wesentlichen Patenten
mit so genannten Hold-up Strategien den Einsatz einer ganzen Technologie blockieren
(Lemley und Shapiro, 2006;. Farrell et al., 2007). Besonders in den letzten Jahren hat der
unabdingliche Charakter von wesentlichen Patenten zu vielen Rechtsstreitigkeiten geführt

Zusammenfassung
xiv
(Qualcomm v. Broadcom, Infineon v. Rambus; IP-COM v. Nokia, Apple v. Samsung, etc.).
Dies hat die Aufmerksamkeit auf oft komplexe rechtlichen Fragen gelenkt, die sich mit
Standardisierung und den grundlegenden Rechten des geistigen Eigentums befassen.
Farrell und Simcoe (2012) haben gezeigt, dass ein geeignetes IP-Regelwerk das
eigeninteressierte Verhalten von Firmen verringern kann. In der Praxis formulieren SSOs
Satzungen, um einen rechtlichen Rahmen zu schaffen, der den allgemeinen Umgang mit
Patenten, die für die Standardisierung wesentlich sind, regelt. Dabei fordern SSOs ihre
Mitglieder dazu auf, Patente, die sich möglicherweise als für die betreffenden Standards
wesentlich erweisen, offen zu legen. Darüber hinaus müssen Inhaber dieser Patente eine
Erklärung unterschreiben, dass diese Patente zu fairen, angemessenen und nicht
diskriminierenden Bedingungen lizensiert werden (FRAND). Wenn eine Firma ein Patent
offenbart und sich weigert, entsprechende Lizenzbedingungen zu unterzeichnen, wird die
SSO in der Regel den Standard unter Ausschluss der geschützten Technologie spezifizieren
(Lemley und Shapiro, 2006). Obwohl die Standardisierung oft in Zusammenhang mit
komplexen Lizenzvereinbarungen steht, sind die Regeln für die Lizenzierung wesentlicher
Patente nicht immer eindeutig. Dies führt nicht selten zu komplexen Diskussionen oder in
Härtefällen sogar zu rechtlichen und politischen Untersuchungen.2 Dennoch werden FRAND
Verpflichtungen häufig als ein wichtiges Instrument gesehen, um wettbewerbswidrigem
Verhalten Einhalt zu gebieten. Kartellbehörden bezeichnen FRAND Verpflichtungen als
Heilmittel, um den Risiken potenzieller Wettbewerbsvorteile in der Standardisierung
entgegenzutreten (Layne-Farrar et al., 2007; Farrell et al., 2007; Schmalensee, 2009).
Zusammenfassend lässt sich hervorheben, dass Unternehmen in der IKT-
Standardisierung mit zwei entscheidenden Herausforderungen konfrontiert werden. Zum
einen entwickelt sich die Koordinierung zwischen den Firmen als wesentlich anspruchsvoller
und führt nicht selten zu einer Zusammenarbeit von konkurrierenden Marktteilnehmern, die
gemeinschaftlich komplexe und anspruchsvolle Technologien entwickeln müssen. Zum
anderen sind diese Technologien in vielen Fällen durch Patente geschützt. Standard
wesentliche Patente sind Gegenstand eines neuen und anderen gesetzlichen Rahmens, der
2 Am 31. Januar 2012 kündigte die Europäische Kommission an, ein förmliches Prüfungsverfahren über Unterlassungsklagen von Samsung auf Standard wesentliche Patente zu eröffnen. Samsung hat in diesem Zusammenhang einstweilige Verfügungen gegen eine Reihe von Konkurrenten, unter anderem Apple, eingeklagt. Die Kommission untersucht nun den Fall darauf, ob die Anordnungen von Samsung selbst eine Verletzung des Wettbewerbsrechts darstellt. Insbesondere soll untersucht werden, ob Samsung gegen die unwiderrufliche Verpflichtung, jedes wesentliche Patent unter fairen, zumutbaren und diskriminierungsfreien (FRAND) Bedingungen zu lizenzieren, verstoßen hat. Es ist zu prüfen, ob das Verhalten von Samsung einen Missbrauch einer marktbeherrschenden Stellung durch Artikel 102 des Vertrags über die Arbeitsweise der EU (AEUV) darstellt.

Zusammenfassung
xv
über die Regeln des geltenden Patentrechts hinausgeht. Diese Herausforderungen können die
Anreize zur Entwicklung von IKT-Standards, sowie das Investieren in F&E oder das
Anmelden von Patenten beeinflussen. Die sechs Aufsätze der Dissertation bauen auf
bestehenden Literatur Befunden und theoretischen Implikationen auf. Das Ziel der Arbeit ist
es, die Standard Dynamiken sowie Standard Generationswechsel in Interaktion mit
wesentlichen Patenten zu analysieren. Weiterhin werden verschiedene Koordinations-
Mechanismen rund um die Standardisierung betrachtet und der Einfluss auf Patentierung und
F&E-Investitionen analysiert.
Wesentliche Patente können Anreize generieren, in Standards zu investieren, da
zukünftige Lizenzeinnahmen Rückflüsse aus vorherigen Investitionen erzeugen. Jedoch kann
erhöhtes Eigeninteresse Standardisierung verzögern oder zu einem Lock-in Effekt auf
veraltete Standards beitragen. Die Rolle von SSOs ist es, den Übergang von Technologie-
Generationen zu koordinieren. Teilnehmer der Standardisierung sind immer mit einem
technologischen Wandel konfrontiert. In der Standardisierung wird somit regelmäßig
zwischen dem Ersatz alter durch neue Standards und der Modernisierung bestehender
Standards entschieden. Der erste Aufsatz Essential Patents and Standard Dynamics
untersucht, wie diese Entscheidung durch die Einführung wesentliche Patente auf Standards
beeinflusst wird. Mit einer Datenbank von über 3.500 verschiedenen IKT-Standards zeigt der
Aufsatz, dass wesentliche Patente die Wahrscheinlichkeit für den Ersatz alter Standards
reduzieren, jedoch die Geschwindigkeit, mit der Standards aktualisiert werden, erhöhen. Der
Anstieg der Aktualisierung von Standard Versionen kann auf einen Anstieg der Investitionen
von Unternehmen in die Verbesserung bestehender Standards zurückgeführt werden. Eine
erhöhte Aktualisierung des Standards kann jedoch nur zum Teil die niedrigere Rate der
Standard-Ersetzung erklären wenn wesentliche Patente den Standard betreffen. Andere
Gründe für diesen Effekt könnten Konflikte und Eigeninteressen sein, die auf Grund von
Standard wesentlichen Patenten entstehen.
Patent-Pools sind eine der wichtigsten Mechanismen, um die komplexe Lizenzierung
von wesentlichen Patenten zu koordinieren. Pools kombinieren Patente, die unter einem
einzigen Vertrag lizenziert werden. Dies kann die Transparenz erhöhen, die
Transaktionskosten verringern, kostspielige Verletzungsklagen vermeiden und darüber
hinaus, durch den Wegfall mehrerer Marginalisierungen, Vergütungssätze in Form von
Lizenzen reduzieren. Der zweite Aufsatz Patent Pools and Patent Inflation untersucht das
Patentierungsverhalten für Technologie-Standards, bei denen es Patent-Pools gibt. Es werden
Daten von Unternehmen, die in der IKT-Standardisierung aktiv sind, verwendet, um das
Zusammenfassung
xvi
Patent Verhalten rund um die Bildung von Patent-Pools zwischen 1992-2010 zu analysieren.
Der Aufsatz nutzt dabei Informationen über die allgemein rechtliche Freigabe von Patent-
Pools im Zeitraum 1997-1999, um in einen quasi experimentellen Test, die Reaktionen von
Firmen auf das Entstehen von Patent Pools zu messen. Die Ergebnisse zeigen, dass
Unternehmen eine direkte und positive Reaktion auf eine Pool-Entstehung aufzeigen, wenn
der Pool vor 1999 gegründet wurde. Im Gegensatz dazu antizipieren Firmen die Entstehung
eines Pools für die Jahre nach 1999. Diese Ergebnisse legen nahe, dass die rechtliche
Sicherheit in den Jahren nach der Pool-Freigabe zu antizipierenden Effekten führt, während in
Situationen juristischer Unsicherheit ein Patent-Pool einen prompten und direkten Effekt hat.
Außerdem haben Tests den Nachweis erbracht, dass sich die Patentierung für Standards, die
einen Pool haben in frühere Perioden verschiebt.
Der dritte Aufsatz Attributes and Dynamic Development Phases of ICT Standards
Consortia untersucht die Entwicklung von Standard Konsortien im Bereich IKT. Der Aufsatz
zeigt ein breites und umfassendes Bild der Standard Konsortien und untersucht ihre
dynamische Entwicklung in den vergangenen zehn Jahren. Analysen zeigen, dass Konsortien
spezifische Merkmale haben, die ihr Bestehen in der Standardisierungslandschaft
rechtfertigen. Zusätzlich wurde die Evolution von Konsortien in den letzten Jahren
beobachtet. Die Analyse zeigt Zusammenhänge zwischen der Bildung, Auflösung und Fusion
von Konsortien mit Markt-und Technologieentwicklungen auf. Ergebnisse einer Performance-
Analyse von Konsortien zeigen, dass die Wahrscheinlichkeit eines erfolgreichen Konsortiums
vor allem auf Strukturen, die die Koordination zwischen den Mitgliedern bestimmen, zurück
zu führen ist.
Der vierte Aufsatz Joint Innovation in ICT Standards: How Consortia Drive the
Volume of Patent Filings untersucht den Einfluss von F&E-Investitionen in die
Standardisierung, wenn Firmen Standard Konsortien beitreten. Der Aufsatz versucht
aufzuzeigen, wie Konsortien das Volumen der F&E-Investitionen beeinflussen und ob dies
effizient ist. Der Aufsatz zeigt, dass die Wirkung von der Stärke der Anreize von
Unternehmen, den Standard zu entwickeln, abhängt. Konsortien Mitgliedschaft erzeugt
höhere F&E-Investitionen, wenn ein zu niedriger Ertrag für wesentliche Patente eine
Unterfinanzierung von Standards bewirkt. Diese Wirkung ist zwangsläufig pro-effizient. In
Situationen, in denen ein zu hoher Ertrag aus wesentlichen Patenten erzeugt werden kann,
haben Konsortien einen moderat steigenden oder sogar reduzierenden Einfluss auf F&E-
Investitionen.

Zusammenfassung
xvii
Der fünfte Aufsatz Cooperate to Declare analysiert die direkte Verbindungen von
Unternehmen, die beide wesentliche Patente für einen Standard besitzen, und misst den
Einfluss einer Ko-Mitgliedschaft in technisch verwandten und technisch weniger verwandten
Standard Konsortien. Der Aufsatz überprüft empirisch, ob die Teilnahme an Konsortien die
Fähigkeit eines Unternehmens erhöht, patentierte Komponenten in formale Standards zu
integrieren. Die Ergebnisse zeigen, dass Mitgliedschaften in technisch verwandten Konsortien
einen positiven Einfluss auf die Fähigkeit eines Unternehmens haben, patentierte
Komponenten in formale Standards zu integrieren. Konsortien, die technisch weniger
verwandt sind, zeigen keinen signifikanten Effekt. Die empirische Analyse zeigt außerdem,
dass die Größe eines Konsortiums den Einfluss eines Unternehmens auf die formelle
Standardisierung erhöht.
Der sechste Aufsatz Essential Patents to Boost Financial Returns untersucht, ob der
Wert eines Standards den Return on Investment eines Unternehmens erhöht. Insbesondere
wird untersucht, ob die Deklaration eines wesentlichen Patents Einfluss auf die finanzielle
Performance von Unternehmen hat. Die Ergebnisse zeigen, dass das Verhältnis von Patent-
Anmeldungen auf den 'Return on Assets (ROA) von Unternehmen krummlinig (umgekehrt U-
förmig) ist. Dieser Effekt hält für ein Jahr und ist stärker für Deklarationen wesentlicher
Patente aus Standard Konsortien. Des Weiteren wird das optimale Niveau von wesentlichen
Patenten gemessen. Ergebnisse zeigen ein höheres Optimum für Deklarationen in formellen
Standards. Die krummlinige (umgekehrt U förmige) Beziehung legt nahe, dass Unternehmen
ihr Patent-Portfolio diversifizieren sollten um einen Teil der Patente in die Standardisierung
eizuführen und einen anderen Teil in Technologien und Produkte zu integrieren, die außerhalb
des Standards liegen.
Die Ergebnisse der sechs Aufsätze zeigen, dass wesentlichen Patenten eine
besondere Rolle in der Dynamik von Innovationen zukommt. Wesentliche Patente
beeinflussen den Generationswechsel von Standards und tragen zu Standard-Verbesserungen
bei. Die Koordinierung der Lizenzierung von wesentlichen Patenten in einem Patent-Pool,
ändert die Anreize zu Patententieren in Bezug auf Zeitpunkt und Volumen. Konsortien
unterstützen F&E-Koordination und strategische Partnerschaften, die das Ergebnis der
Standardisierung beeinflussen können. Somit wird gezeigt, dass Unterschiedliche
Koordinierungsmechanismen im Kontext der Standardisierung, Standard-spezifisches Patent
Verhalten beeinflusst. Wesentliche Patente beeinflussen außerdem den Wert eines Standards
und damit die Struktur der finanziellen Erträge.

Literaturverzeichnis (References)
xviii
Literaturverzeichnis (References)
Arthur, W. B. (1988): Competing Technologies: An Overview, in Technical Change and Economic, Theory, Dosi, et al. (eds.). London: Pinter Publishers.
Axelrod, R., S. Bennett, E. Bruderer, W. Mitchell, R. Thomas. (1995): Coalition formation in standard-setting alliances. Management Science 41, 1493–1508.
Bekkers, R., Duysters, G., Verspagen, B. (2002): Intellectual property rights, strategic technology agreements and market structure: The case of GSM. Research Policy 31, 1141–1161.
Bekkers, R., Iversen, E., Blind K. (2011): Emerging ways to address the reemerging conflict between patenting and technological standardization, Industrial and Corporate Change, 10, 2011.
Besen, S.M., Farrell, J. (1994): Choosing how to compete: strategies and tactics in standardization. Journal of Economic Perspectives 8, 117–131.
Blind, K., Gauch, S. (2008): Trends in ICT standards: The relationship between European standardization bodies and standards consortia. Telecommunications Policy 32, 503-513.
Choi, P. J. (1997): Herd Behavior, the "Penguin Effect," and the Suppression of Informational Diffusion: An Analysis of Informational Externalities and Payoff Interdependency, The RAND Journal of Economics 28-3, 407-425.
Clements, M.T. (2004): Direct and indirect network effects: are they equivalent? International Journal of Industrial Organization 22, 633–645.
David, P. A., Greenstein, S. (1990): The economics of compatibility standards: An introduction to recent research. Economics of Innovation and New Technology 1, 3-42.
Farrell, J., Saloner, G. (1985) Standardization, Compatibility and Innovation, RAND Journal of Economics 16, 70-83.
Farrell, J., Saloner, G. (1986): Installed Base and Compatibility: Innovation, Product Preannouncements, and Predation, American Economic Review 76-5, 940-955.
Farrell, J., Saloner, G. (1988): Coordination through Committees and Marekts, RAND Journal of Economics 19-2, 235-252.
Farrell, J., Hayes, J., Shapiro, C., Sullivan, T. (2007): Standard setting, patents, and hold-up. Antitrust Law Journal 3, 603-670.
Farrell J., Simcoe, T. (2012): Choosing the Rules for Consensus Standardization. RAND Journal of Economics, forthcoming.
Katz, M., Shapiro, C. (1985): Network externalities, competition, and compatibility. American Economic Review 75, 424–440.
Kerstan, S., Kretschmer, T., Muehlfeld, K. (2012): The dynamics of pre-market standardization. Information Economics and Policy 24, 105–119.
Layne-Farrar, Anne; Padilla, A. Jorge; Schmalensee, Richard (2007): Pricing Patents for Licensing in Standard-Setting Organizations: Making Sense of Fraud Commitments; 74 Antitrust Law Journal 671.

Literaturverzeichnis (References)
xix
Leiponen, A. (2008): Competing Through Cooperation: The Organization of Standard Setting in Wireless Telecommunications. Management Science 54-11,1904-1919.
Lemley, M. A. (2002) Intellectual Property Rights and Standard-Setting Organizations. California Law Review 90, 1889-1980.
Lemley, M. A., Shapiro, C. (2006): Patent Holdup and Royalty Stacking; Texas Law Review 85, 1991.
Lerner, J., Tirole, J. (2006): A model of forum shopping. American Economic Review 96, 1091-1113.
Rosenkopf, L., Metiu A. and George, V. (2001): From the Bottom Up? Technical Committee Activity and Alliance Formation. Administrative Science Quarterly 46, 748-772
Rysman, M., Simcoe. T. (2008): Patents and the Performance of Voluntary Standard Setting Organizations, Management Science 54-11, 1920-1934.
Schmalensee, R. (2009): Standard-Setting, Innovation Specialists and Competition Policy.The Journal of Industrial Economics, 57: 526–552.
Shapiro, C. (2001) Navigating the Patent Thicket: Cross Licenses, Patents Pools, and Standard Setting. In: A Jaffe, J Lerner et S, Stern (Eds), Innovation Policy and the Economy, vol. 1. MIT Press.
Simcoe T. (2007): Explaining the Increase in Intellectual Property Disclosure. In: Sheri Bolin (Eds), The Standards Edge: Golden Mean. Ann Arbor: Bolin Communications.
Simcoe, T. S., Graham, S. J. H. & Feldman, M. P. (2009): Competing on Standards? Entrepreneurship, Intellectual Property, and Platform Technologies. Journal of Economics & Management Strategy, 18, 775-816.
Simcoe, T. (2012): Standard Setting Committees: Consensus Governance for Shared Technology Platforms, American Economic Review 102-1, 305-336.
Weiss, M. B. H., Sirbu M. (1990): Technological Choice in Voluntary Standards Committees: An Empirical Analysis, Economics of Innovation and New Technology, 111-133.
xx
Contents
Standard Dynamics and Essential Patents……………………….......1
Patent Pools and Patent Inflation…………………………………...35
Attributes and Dynamic Development Phases of ICT Standards
Consortia…………………………………………………………….71
Joint Innovation in ICT Standards: How Consortia Drive the Volume
of Patent Filings…………………………………………………......91
Cooperate to Declare. Firms’ Cooperative Activities as Driving
Factors of Patent Declaration on Technological Standards………126
Essential Patents to Boost Financial Returns……………………...157

1
Essential Patents and Standard
Dynamics
Abstract
Information and Communication Technology (ICT) standards need to keep up with
technological progress, while providing a stable basis for investment building upon the
standard. Standard makers confronted with technological change can often choose
between replacing old by new standards and upgrading existing standards. Studying the
case of formal Standard Development Organizations (SDO), we investigate how this
trade-off is affected by patents on standard components. Using a database of over 3,500
different ICT standards, we find that essential patents reduce the likelihood of standard
replacement, but increase the rate at which standards are upgraded. We argue that the
increase in the number of upgrades reflects an increase of firms’ investment in
improving existing standards. More frequent upgrades can only partly explain the effect
of patents on the rate of replacement. Other explanations for this effect could be
frictions and vested interests among standard setting firms.

2
Contents
1. Introduction ......................................................................................................... 3
2. Analytical Framework ......................................................................................... 5
2.1 Inertia and momentum in the innovation of network technologies ................. 5
2.2 Formal standardization as coordination device ................................................ 6
2.3 The role of essential patents ............................................................................. 8
3. Empirical Methodology .................................................................................... 10
3.1 Identifying standard upgrades and replacements ........................................... 10
3.2 Explanatory variables ..................................................................................... 12
3.3 Sampling ......................................................................................................... 14
4. Comparative Analysis ....................................................................................... 15
4.1 Robustness analysis ........................................................................................ 18
5. Multivariate Panel Analysis .............................................................................. 19
5.1 Estimation....................................................................................................... 19
5.2 Results ............................................................................................................ 23
5.3 Discussion ...................................................................................................... 24
6. Conclusion......................................................................................................... 25
References ............................................................................................................... 27
Appendix 1 .............................................................................................................. 31
Appendix 2 .............................................................................................................. 32
Appendix 3 .............................................................................................................. 33
Introduction
3
1. Introduction
Technological standards include an increasing number of standard-essential patented
technologies (Bekkers et al., 2012). A patent is called essential if it is necessarily infringed by
any implementation of the standard. Recent contributions show that the inclusion of patented
technology into a standard increases the value of the patent (Rysman and Simcoe, 2008). This
increased value is an incentive for companies to adjust their patent filing strategies to ongoing
standardization (Berger et al., 2012), and to build up strategic alliances in order to influence
the selection process in standardization (Leiponen, 2008). The positioning of the firm even
has a stronger impact on the inclusion of patented technology into a standard than the
technological merit of the patent itself (Bekkers et al., 2011).
While these advances have improved our understanding of the incentives and
strategies of firms contributing patented technologies to a standard, we know little about the
consequences of essential patents for standardization and standard users. Essential patents can
discourage standard adoption, because standard adopters fear to be held up by owners of
essential patents and to be faced with exorbitant requests for royalties (Lemley and Shapiro,
2006). There is also the concern that a high number of patents leads to patent thickets
(Shapiro, 2001) which hamper and slow down standardization processes. Standard setting
involving proprietary technologies is often subject to tensions and diverging interest between
participating firms (Garud et al., 2002). Vested interests in standardization due to increasing
commercial stakes reduce the speed at which new standards are developed (Simcoe, 2012).
Nevertheless, it is important to also see the potential benefits of essential patents for
standardization. Once their proprietary technology included, firms have a private interest in
improving the standard to protect it from being replaced by rival technologies. Holders of
essential patents thus become platform leaders for the standard (Cusumano and Gawer, 2002),
and have an incentive to sponsor standard adoption (Katz and Shapiro, 1986) and to promote
coordinated technological change (Bresnahan and Greenstein, 1999, Cusumano and Gawer,
2002). As a result, essential patents may actually accelerate the technological progress of
existing standards and encourage their implementation.
It is the aim of this article to have a more comprehensive understanding of the effect
of patents on the evolution of standards after their release. Standards need to respond
continuously to technological innovation, as outdated standards can become an impediment to
technological progress. In order to integrate new technology, standard setters can often choose

Introduction
4
between replacement and upgrade of the existing standard. While a standard upgrade only
incrementally improves upon an existing standard, standard replacement indicates a more
radical change in the underlying technology. On the one hand, in presence of fundamental
innovation, standard replacement may be necessary in order to fully integrate the advances in
the state of the art. On the other hand, standard replacement can induce loss of backward
compatibility and impose higher implementation costs upon standard users compared to
standard upgrades. Based upon these insights, we investigate the frequency of upgrade and
replacement of standards including essential patents, as compared to other standards.
We rely upon a comprehensive database of ICT standards released from 1988 to
2008. This dataset includes detailed information for over 3,500 de jure standards issued by
formal standardization bodies. We match the standards in our sample to a comprehensive
database of patents declared to be essential and furthermore inform for each standard class the
speed of technological progress, as measured by the number of patent files in the related
technological field.
Essential patents tend to concentrate on highly valuable, technology-intensive
standards (Rysman and Simcoe, 2008). In order to deal with this bias, we construct an
appropriate control sample based upon the characteristics of the standard and the
technological field. Second, we estimate the hazard rate of standard replacement over time,
controlling for relevant technological events. The results show that essential patents reduce
the likelihood of standard replacement, but increase the likelihood of upgrade. While standard
upgrades temporarily reduce the risk of standard replacement, the effect of essential patents
on standard lifetime cannot be fully explained by more frequent upgrades. This finding
provides support to the hypothesis that essential patents lock in existing ICT standards and
hamper discontinuous change. In contradiction with widespread concerns regarding the effect
of patent thickets on standardization, the effect of including essential patents is independent of
the number of patents.
Our findings have several managerial implications. For potential standard adopters,
essential patents can signal that the standards will be regularly improved and are less at risk of
an early replacement. Essential patents could thus reduce technological uncertainty, increase
standard related investments and encourage standard adoption. This positive effect of
essential patents on standard adoption could counterweigh the well-known negative effects
associated with the risk of patent holdup. For patent holders, this is an argument for
transparent disclosure of essential patents, weighing against the profitability of “patent
ambush” strategies and other incentives for late patent disclosure (Ganglmair and Tarantino,

Analytical Framework
5
2012). For standardizing firms, our findings have ambiguous implications on the costs and
benefits of selecting patented technology. On the one hand, inclusion of patented technology
provides the standard with sponsors who have incentives to invest in standard improvements.
On the other hand, the inclusion of essential patents may give rise to vested interest and
compromise future changes of the standard.
2. Analytical Framework
2.1 Inertia and momentum in the innovation of network technologies
Advanced ICT technologies often build upon thousands of complementary technological
ideas that are individually invented, but brought to the market in a discrete number of
“generations”.1 If a new, incompatible generation is brought to the market, users must decide
whether or not to incur the switching cost in order to benefit from the newer technology. The
value of the new technology to the users however crucially depends upon how many other
users decide to switch. Markets where adoption decisions are made independently can
therefore be subject to important coordination failures, such as lock-in of outdated
technologies, or stranding of adopters of a new technology that fails to attract further users
(Farrell and Saloner, 1986).
Adopters of a new technology require that the technology will be kept in place for a
sufficient time to justify the costs of adoption. These adoption costs are sunk, and some users
will not take the risk of adopting a new technology when there is uncertainty about future
technological progress (Balcer and Lippman, 1984). However, if a substantial number of users
switch to the new technology, users of the old technology are stranded and suffer from loss of
network effects (Farrell and Saloner, 1985). It is therefore crucial for a provider of a new
network technology that he can guarantee technological stability over some time. Too
frequent innovations in the network are socially detrimental. Nevertheless, network
technologies also exhibit a tendency to lock-in situations and excessive inertia. Once markets
widely adopt a technology; switching costs and the risks of lock-in increase (Arthur, 1989).
This lock-in can be the result of the installed base of the whole technology, but also of
specific network ties resulting from the adoption rate of specific components (Suarez, 2005).
New technologies may thus be introduced at a too low frequency, and the users and
1 Generations of mobile phone standards are good examples for this process. Since the release of its first specifications in 1990, the GSM standard has continued evolving in order to integrate new functionalities, for instance related to mobile internet connection. Nevertheless, in order to obtain more significant increases especially in data transmission rates, UMTS, a new standard building upon a very different coding technology, had to be developed (Bekkers, 2001, Bekkers and Martinelli, 2012)

Analytical Framework
6
implementers of the technology incur the opportunity cost of not using the best technology
available.
Lock-in of installed technologies does however not necessarily prohibit technological
progress. An installed dominant design can be subject to substantial and sustained incremental
progress (Abernathy and Utterback, 1978). This incremental progress follows trajectories
defined by the technological paradigms of the underlying technological basis (Dosi, 1982). In
contrast with these continuous technological changes along a given trajectory, a discontinuous
technological change is the shifting to a superior trajectory. Christensen and Bower (1996)
show that established market leaders tend to lose their leadership position when they face a
discontinuous technology change. Christensen et al. (1998) provide evidence that in the case
of continuous progress of a dominant design or standard, firms may retain their market
positions throughout the successive technological generations. Technological incumbents thus
have incentives to promote and favor continuous technological progress and to prevent
discontinuous changes (West and Dedrick, 2000). The lock-in of a dominant design may
however be socially detrimental, if it permanently prevents shifting to a different, more
promising technological trajectory.
The socially optimal rate of discontinuous technological change strikes a balance
between the discrete costs of developing and adopting new technologies on the one hand, and
the continuous opportunity cost of using an outdated technology or moving along an inferior
technological trajectory on the other hand. Uncoordinated deployment and adoption of new
network technologies can deviate from this socially optimal rate in both directions, yielding
either excessive inertia or excessive momentum (Farrell and Saloner, 1985). Liebowitz and
Margolis (1995) argue that excessive inertia or momentum can be avoided if technology is
proprietary. Katz and Shapiro (1986) show that the owner of a proprietary technology has an
incentive to sponsor adoption costs, thereby contributing to the efficiency of standard
adoption processes. Clements (2005) however finds that the incentives of an owner of a
proprietary technology to have a new standard adopted deviate from what would be socially
optimal and can induce excessive inertia or momentum.
2.2 Formal standardization as coordination device
Most inefficiencies in the rate of discontinuous technological change in network technologies
result from the lack of coordination between the users of the technology. Often, these
inefficiencies can be overcome if users can communicate and coordinate adoption decisions
(Weitzel et al., 2006). In practice, coordination on adoption decisions in network technologies

Analytical Framework
7
takes place inside more or less formal standard bodies. Participation in this collaborative
standard development is a crucial factor for the success of companies in technology intensive
industries (Fleming and Waguespack, 2008). Coordination on standards ensures compatibility
and substantially reduces the risk for the developers and adopters of new technology (Tassey,
2000, Aggarwal et al., 2011). The different generations of technology are embedded in
different generations of standards. The issuance and adoption of a new standard thus
determines the common adoption of thousands of complementary technological inventions
resulting in a new technological platform2 . This process can take place more or less
frequently, and the technological progress incorporated in a new standard can be more or less
important.
The economic literature has addressed the issue of inertia and momentum in standard
replacement mainly for the case of uncoordinated adoption decisions3. Timing is however a
crucial problem also for formal standardization. Formal standardization results in better
coordination on the best technology, but comes at the cost of decreased speed (Farrell and
Saloner, 1988). Formal standard setting bodies face an important tension between responding
to an advancing technological frontier and fixing a stable technological basis for creating
compatible products and investing in applications and implementation (Egyedi and Hejnen
2005, Blind and Egyedi, 2008). Technological change exerts a constant pressure on standard
setting bodies to revise existing standards. Consistently, an empirical analysis of factors
influencing the lifetime of national ICT standards (Blind, 2007) has revealed that standard
survival time decreases with the speed of innovation, as measured by patent files in ICT in the
respective country.
While standard bodies coordinate on adoption decisions, both advances in the
technological frontier resulting in opportunities for new standard generations and the
development of improvements and implementations of existing standards are subject to
independent investment decisions. Coordinated adoption decisions may be insufficient to
prevent excessive inertia or excessive momentum, if there is no coordination on the
complementary investment. Investment in R&D for new standards or applications of existing
standards is subject to competition, complex strategic alliances (Leiponen, 2008) and potential
coordination failures (Baron et al., 2011). The incentives of firms to invest in R&D and to
develop applications are shaped by the extent to which technology holders can use patents to
appropriate important parts of the value generated by the standard.
2 For recent case studies of the interplay between standardization and innovation, see Bekkers and Martinelli (2012) and Fontana et al. (2009). 3 Farrell and Saloner (1985, 1986), Katz and Shapiro, (1992), De Bijl and Goyal (1995), Kristiansen (1998)

Analytical Framework
8
2.3 The role of essential patents
Essential patents play an important role in standardization, as they provide incentives for
firms to develop technologies for standards and to contribute to the effort of standardization.
Standardization entails a costly private investment into a public good (Kindleberger, 1983).
Due to this externality, standard makers underinvest in developing and improving standards.
The prospect to include their proprietary technology into technological standards is an
important incentive for firms to increase their investment in standardization (Rysman and
Simcoe, 2008). Patent holders also have a stronger private interest to invest in improvements
of existing standards if they can recoup the costs through licensing fees. Standards are a good
illustration of the argument raised by Kitch (1977) that Intellectual Property Rights are
important for innovation not only as a reward for successful innovators, but also to ensure
incentives in continuous investment in improving the protected technology. Empirical
findings show that patents reduce uncertainty to incur investments that are complementary to
a specific technological choice (McGrath and Nerkar, 2004, Arora et al 2008). However, there
is so far no evidence for such effects of patents that are essential to standards. The incentive
for owners of essential patents to regularly upgrade a standard is expected to be particularly
strong when the technological evolution in the sector generates pressure for standard
replacement. Holders of essential patents have an incentive to develop and advocate
continuous marginal improvements that avoid challenges from incompatible rivaling
technologies. West and Dedrick (2000) and Dedrick (2003) show that IPRs are an important
tool for allowing the owner of a platform to control a coherent evolution of the platform
architecture. If the inclusion of essential patents signals that the standard will be regularly
improved, but faces less risk of replacement, essential patents could also be a valuable
commitment device that encourages standard implementation and reduces welfare losses from
under-investment in standard adoption.
In spite of these virtues, essential patents have also drawbacks for standardization.
For instance, patents on formal standards can generate conflicts among standard makers
regarding the shares of proprietary technology covered by the standard. Evidence for this
concern can for instance be found in the survey which is part of the “EU Study on The
Interplay of IPR and Standards”. Surveyed practitioners see consensus reaching and the speed
of standardization processes to be the most negatively affected fields when essential IPRs are
introduced to a standard (Blind et al., 2011). Essential patents can lead to a time-consuming
« war of attrition » in building consensus on a new standard (Farrell and Simcoe, 2012;
Simcoe 2012). Practitioners report cases in which holders of patented technology “would only
Analytical Framework
9
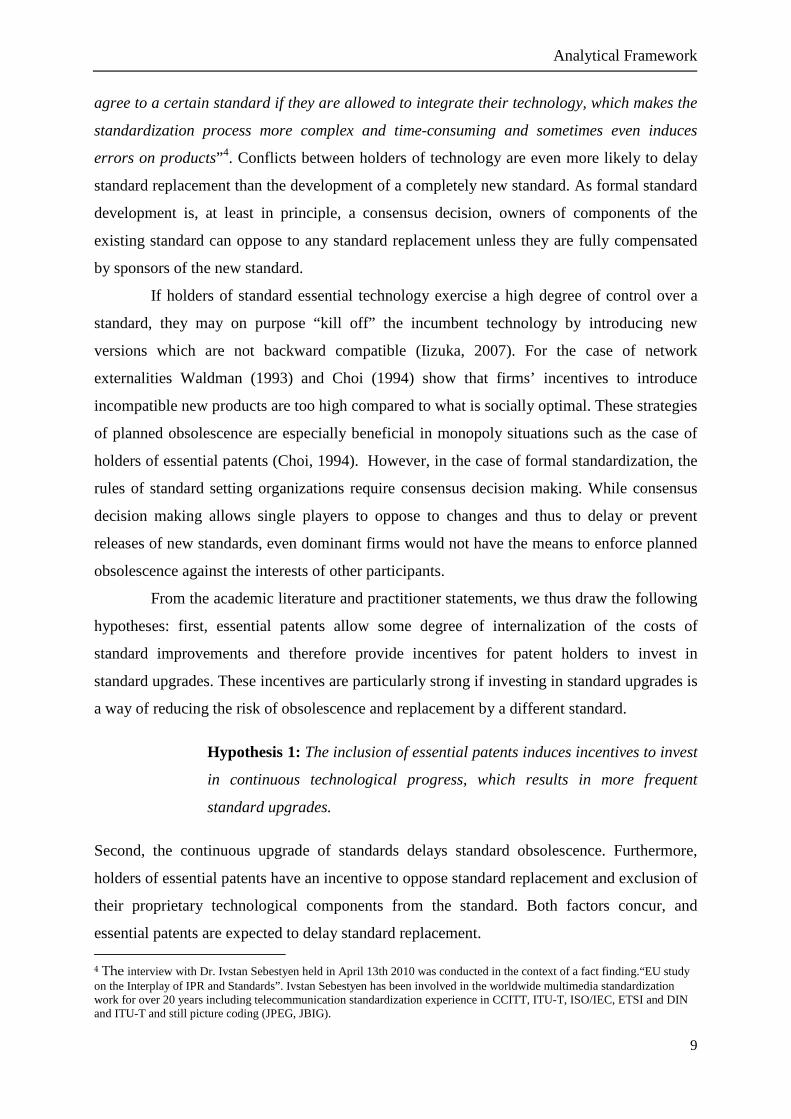
agree to a certain standard if they are allowed to integrate their technology, which makes the
standardization process more complex and time-consuming and sometimes even induces
errors on products” 4. Conflicts between holders of technology are even more likely to delay
standard replacement than the development of a completely new standard. As formal standard
development is, at least in principle, a consensus decision, owners of components of the
existing standard can oppose to any standard replacement unless they are fully compensated
by sponsors of the new standard.
If holders of standard essential technology exercise a high degree of control over a
standard, they may on purpose “kill off” the incumbent technology by introducing new
versions which are not backward compatible (Iizuka, 2007). For the case of network
externalities Waldman (1993) and Choi (1994) show that firms’ incentives to introduce
incompatible new products are too high compared to what is socially optimal. These strategies
of planned obsolescence are especially beneficial in monopoly situations such as the case of
holders of essential patents (Choi, 1994). However, in the case of formal standardization, the
rules of standard setting organizations require consensus decision making. While consensus
decision making allows single players to oppose to changes and thus to delay or prevent
releases of new standards, even dominant firms would not have the means to enforce planned
obsolescence against the interests of other participants.
From the academic literature and practitioner statements, we thus draw the following
hypotheses: first, essential patents allow some degree of internalization of the costs of
standard improvements and therefore provide incentives for patent holders to invest in
standard upgrades. These incentives are particularly strong if investing in standard upgrades is
a way of reducing the risk of obsolescence and replacement by a different standard.
Hypothesis 1: The inclusion of essential patents induces incentives to invest
in continuous technological progress, which results in more frequent
standard upgrades.
Second, the continuous upgrade of standards delays standard obsolescence. Furthermore,
holders of essential patents have an incentive to oppose standard replacement and exclusion of
their proprietary technological components from the standard. Both factors concur, and
essential patents are expected to delay standard replacement.
4 The interview with Dr. Ivstan Sebestyen held in April 13th 2010 was conducted in the context of a fact finding.“EU study on the Interplay of IPR and Standards”. Ivstan Sebestyen has been involved in the worldwide multimedia standardization work for over 20 years including telecommunication standardization experience in CCITT, ITU-T, ISO/IEC, ETSI and DIN and ITU-T and still picture coding (JPEG, JBIG).

Empirical Methodology
10
Hypothesis 2: The inclusion of essential patents increases the persistence of
existing standards and reduces the risk of standard replacement and
discontinuous technological change.
We will test these hypotheses empirically using comparative and econometric analysis.
3. Empirical Methodology
3.1 Identifying standard upgrades and replacements
We analyze the rate of standard upgrade and replacement using a comprehensive database of
international ICT standards drawn from PERINORM. PERINORM is the world’s biggest
standard database with bibliographic information on formal standards and is regularly updated
by the SDOs DIN, BSI and AFNOR. We include all ICT standards (ICS classes 33 and 35)
issued by the main formal international SDOs (ITU-R, ITU-T, IEEE, ISO, IEC, JTC1). We
restrict the analysis to de jure standards issued from 1988 to 2008, and we observe these
standards until 2010. We start in 1988, because the International Telecommunication
Regulations issued in 1988 constitute an important policy change, leading to changes in the
way standards are released. Draft standards, amendments and errata documents as well as
technical reports and other documents produced by SDOs that are not standards are screened
out using the document codes in the name of the document. This yields a sample of 7,625
standards. For the econometric analysis, we furthermore restrict the sample to technological
fields where there is a potential for essential patents (fields in which at least one standard
includes essential patents) and exclude standards with missing explanatory variables. This
sample comprises 3,551 standards, 4,671 standard versions and 36,179 standard-year
observations. 367 standards and 1,709 standard versions included in this sample have been
withdrawn during the observation period.
For every standard version, the database gives precise dates of release and
withdrawal. SDOs regularly revise their standards to keep up with technological progress.
During the revision, „a majority of the members of the TC (Technical Committee) decides
whether the standard should be confirmed, revised or withdrawn“ 5 . We can observe
withdrawal of standard versions in PERINORM, and identify new versions of the same
standard using PERINORM information on standard history. To give an example, the MPEG2
Video standard version ISO/IEC 13818.2(1996) was withdrawn in 2000 and replaced by
5 http://www.iso.org/iso/standards_development/processes_and_procedures/stages_description.htm

Empirical Methodology
11
ISO/IEC 13818.2(2000)6. This new version consolidates several corrigenda and amendments
made to the standard since the release of the first version in 1996. New encoders or decoders
produced according to the new standard are fully compatible with media or devices produced
according to the previous version. We consider that in such a case where a standard version is
replaced by a more recent version, the standard is revised and simply upgraded. These
upgrades reflect continuous technological change along the technological trajectory defined
by the standard and the embodied technological basis.
If a standard version is withdrawn without a direct successor, we consider that the
standard is replaced. In practice a standard is generally not withdrawn immediately when a
new generation of standards is released. For example, several generations of mobile phone
standards (GSM and UMTS) and audio and video coding standards (MPEG2 and MPEG4)
currently coexist. Nevertheless, evolution and deployment of new generations eventually lead
to the earlier standard being withdrawn. The SDOs point to technological progress of as a
main reason for withdrawing standards: “Several factors combine to render a standard out of
date: technological evolution, new methods and materials, new quality and safety
requirements7”. Earlier research (Blind, 2007) and our own empirical analysis confirm the
direct link between standard withdrawal and related technological innovation. We therefore
use the withdrawal of a standard version without direct successor to indicate standard
replacement, a discontinuous technical change that renders the standard obsolete.
We can thus differentiate between standard upgrade and standard replacement and
calculate the survival rate of standards and standard versions. The survival time of standard
versions is hereby defined as the time from version release to version withdrawal, and the
survival time of standards is the time elapsed between release of the first standard version and
standard replacement. We investigate the effects of our explanatory variables on these rates
using duration analysis.
In the case of our example, the standard ISO/IEC 13818.2 is part of a group of
standards that are closely related. Indeed, this standard defines the video coding technology of
MPEG2, which also includes other components dealing e.g. with audio coding. These
connections between standards lead us to worry that the survival rates of the different
observations in the sample are not determined independently, and that failure to account for
6 MPEG2 is a widely used coding technology for video and audio content. For an overview of the second edition, see http://webstore.iec.ch/preview/info_isoiec13818-2%7Bed2.0%7Den.pdf 7 http://www.iso.org/iso/standards_development/processes_and_procedures/how_are_standards_developed.

Empirical Methodology
12
this could overstate the significance of the results. In order to account for this, we define
clusters of standards that can be identified as belonging to a common family of standards8.
3.2 Explanatory variables
We match the standards in our sample to a database of declared essential patents. Declarations
of essential patents have been downloaded from the websites of the SDOs in March 2010. The
declaration of patent essentiality is made by holders of the patents, and no external validation
of this essentiality claims is made. There is furthermore no guarantee that all essential patents
are accurately declared. The existing literature has nevertheless found that declared essential
patents are a reasonable proxy for essential patents, and that the date of declaration proxies
the date of inclusion into a standard (Rysman and Simcoe, 2008). In the following we will
speak of essential patents, empirically approximated by our database of patent declarations.
We identified more than 8,000 patent declarations for 700 formal standards included in our
sample. In order to analyze the effect of essential patents on the rates of standard upgrades
and replacements, we can then compare the respective survival rates of standards and standard
versions including essential patents with standards in the remainder of the sample. This
comparison is however subject to several potential biases. Essential patents could indicate that
a standard has a stronger focus on innovative technology, and is thus subject to faster changes
in the state of the art. On the other hand, patent holders may prefer declaring essential patents
on standards with a long expected lifetime. Finally, declarations of essential patents could also
signal the importance, technological complexity or commercial relevance of a technological
standard. All these factors are likely to have an impact upon the survival rate of standards and
standard versions.
We therefore make use of a broad range of technological indicators including the
issuing SDO, the ICS (International Classification of Standards), the breadth of the
technological scope (approximated through the number of ICS classifications, which we will
refer to as “ICS width”), the number of pages, standard modifications, and references to prior
standards (backward references). We also count accreditations of the standard that have taken
place before the standard release at the body in our sample (prior accreditations). This
happens when the standard has not been first issued by one of the SDOs we observe (for
example if a national standard is accredited on international level). These standard
characteristics are time-invariant, and are therefore particularly suitable for the construction of
8 We identify clusters using the number until the dots in the case of ISO, IEC, and JTC1, until the slash for ITU-T and ITU-R, and using only the numbers and not the letters in case of IEEE (e.g. IEEE802.11n is identified as belonging to IEEE802.11)

Empirical Methodology
13
a control group of standards whose evolution over time can be compared with standards
including essential patents.
However, this sampling approach is not effective to control for time-variant factors
and to analyze the interplay between essential patents and standardization dynamics. In a
second step we will therefore propose a multivariate panel analysis, where explanatory
variables are allowed to vary over time. In the majority of cases, the patent declaration
database informs the date of declaration, so that we can match each of these essential patents
to its relevant standard at any time from the year of declaration.
We approximate the evolution of the state of the art using information drawn from
essential patents. Building upon Baron et al. (2011), we use the technological classification of
declared essential patents to match patent and standard classes in the field of ICT. We can
thus identify how many patents are filed in fields that are potentially relevant for the standards
in the different ICS classes. Thus we can inform for each standard class on a relatively
disaggregate level the speed at which the state of the art evolves (in the following, we refer to
this variable as “innovation intensity”). Blind (2007) has shown that the replacement rate of
national ICT standards increases with the number of ICT patent files in the respective country.
In our data, we can identify innovation rates that are more closely related to specific
standards. The yearly patent files in the related field indicate the flow of standard-related
inventions. Following Hall et al. (2000) and Bessen (2009)9, we accumulate these yearly flow
data to a standard-related knowledge stock which depreciates at 15% per year. This
knowledge stock approximates the “technology gap” or distance of the standard to the
technological frontier. We assume that a new standard release fully integrates the advances in
the state of the art, so that the technology gap is set back to zero.
It is also important to control for standardization activities related to the standard that
are likely to have an impact on the probability of standard replacement. We build a variable
indicating changes to referenced standards upon which the standard is built (change of
referenced standard). Changes upstream in the technological architecture are a decisive factor
of changes of depending downstream standards. For the same reason, we include references
from other standards (forward references) and accreditations by other SDOs (ulterior
accreditations). As these downstream standards need to be replaced when the standard itself
is replaced, forward references and accreditations increase the social cost of standard
9 Park and Park (2006) provide a list of industries and estimate the depreciation rate of related patents. ICT standards of our sample can be categorized to the industry code 17: Electrical machinery and apparatus n.e.c. (ca. 14%) as well as the industry code 18: Radio, TV and communication equipment and apparatus (ca. 16%).

Empirical Methodology
14
replacement. These variables are likely to capture up to some extent downstream investment
building upon the standard. A full list of variable definitions is provided in Appendix 1.
3.3 Sampling
It is the objective of our analysis to compare standards including essential patents with other
standards. However, essential patents are not randomly distributed over the standards in ICT.
Many of the factors affecting the likelihood of including essential patents are also likely to
have an impact on the duration until standard upgrade and replacement.
We therefore build an appropriate control group in order to be able to present
meaningful descriptive statistics. First, we eliminate standards issued before 1988. We then
carry through a propensity score matching based upon a broad range of observable fixed
standard characteristics. The determinants of the inclusion of essential patents can be
classified into three groups: first, several technological variables can be used as indicators of
complexity or value. For instance, the number of standard pages is an indicator of the size of
the standard, and the technological complexity of the issues that it addresses. Being
referenced by other standards in the first years of standard life is an indicator of the relevance
of the standard for further technological applications. We use a reference window of four
years, by analogy to the common practice of citation windows as indicators of patent
significance (Trajtenberg, 1990). Second, technological classes of standards capture whether a
standard is in an innovative and patent-intensive field, or rather in less innovative fields,
where essential patents are less likely to occur. Third, the issuing SDO has a statistically
significant impact upon the likelihood that the standard includes essential patents. This could
be due to more or less stringent rules regarding the declaration of IPR, but it could also reflect
the fact that standardizing firms target patent-friendlier standard bodies as a forum for a
standards project when they own proprietary technology that they wish to have included
(Chiao et al., 2007). Appendix 1 presents the results of the regressions through which the
propensity scores were calculated, and depicts the repartition of the propensity scores over
standards including essential patents and other standards.

Comparative Analysis
15
Building upon this propensity analysis, we eliminate the observations that have a
lower propensity score than the treated observation (standard including essential patents) with
the lowest propensity score. We then group the remaining observations into six strata of equal
size10. Appendix 1 provides details of the calculation of propensity scores and gives an
overview how standards are distributed over the different strata. The propensity scores
increase with ascending strata numbers. The share of standards including patents increases
from strata to strata, reflecting that the model is somehow successful in identifying the factors
explaining inclusion of essential patents.
4. Comparative Analysis
In this section, we will present results of a comparative statistical analysis. We first compare
the survival rates of standard versions including essential patents with other standard versions.
Figure 2a shows the Kaplan-Meier estimates of the likelihood that a standard version has not
been withdrawn by a certain time (indicated in years after release). Survival rates of standard
versions including essential patents decrease more rapidly than those of other standard
versions (Figure 3a). This figure does however not indicate whether the observed difference is
a causal effect of essential patents, or whether essential patents are more likely to be declared
for standard versions that would have had lower survival rates anyway. For instance, we could
expect that patents are more likely to be declared on more important standards or on standards
that are more responsive to technological change. Figure 2b corroborates this concern.
Comparing the survival estimates of the different strata (strata 1 with the lowest likelihood of
essential patents, strata 6 with the highest), we observe that standards a priori most likely to
include essential patents are upgraded more often.
10 According to Caliendo and Kopeinig (2008), five strata are often enough to remove the bias from the data. As our propensity score is very skewed, five strata are not enough to equalize all important variables among control and treated within the strata, but more than six strata would leave us with very small numbers of treated standards in the lower strata

Comparative Analysis
16
Figure 2a: Survival estimates of standard versions, including and not including patents
Figure 2b: Survival estimates of standard versions, by strata
In order to control for this selection effect, we have to make the comparisons within the strata.
Table 1 displays results of a log-rank test of equality of survivor functions of standard
versions. We observe the withdrawal of 391 standard versions including essential patents. If
essential patents had no effect on standard version survival, we would expect only 225
versions to be withdrawn during the observation period. Carrying through the analysis by
strata of propensity scores even exacerbates the difference between the observed and expected
standard version survival rates11. Significant differences are observed within all the strata,
except for strata 1 and 2, where numbers of standards including essential patents are very low.
Table 1: Log-rank tests of equality of version survival functions Standards including and not including patents, by strata, within strata
We have discussed that standard versions can be withdrawn in cases of either standard
upgrade or standard replacement. We will therefore compare the survival rates of standards.
The survival time of a standard is defined as the time elapsed between release of the first
version and withdrawal of the last version of the standard (standard replacement).
11 Some observations are excluded because of missing values. Notice also that we excluded all standards with a propensity score that was lower than the lowest score of a standard including patents.
Version Upgrade
Stratified by SDO and ICS
Stratified by 6 PSM strata
Within Strata 1
Within Strata 2
Within Strata 3
Within Strata 4
Within Strata 5
Within Strata 6
Events Patented
Obs: Exp:
391 225.50
350 192.20
3 3.20
14 9.55
47 17.16
57 21.25
79 39.07
150 101,98
Non-patented
Obs: Exp:
5147 5312.50
2131 2288.80
421 420.80
473 477.45
392 421.84
349 384.75
250 289.93
246 294,02
Chi2 Pr>chi2
140,75 167.29 0.01 2.29 58.30 67.73 48.91 32.70 0,0000 0.0000 0.9076 0.1304 0.0000 0.0000 0.0000 0.0000

Comparative Analysis
17
Figure 3a: Survival estimates of standards, including and not including patents
Figure 3b: Survival estimates of standards, by strata
We can see on Figure 3a that the survival estimates of standards including patents decrease
slower than what can be observed for other standards. On figure 3b, we see the survival
estimates by strata. Standards that are – based upon their observable characteristics – least
likely to include essential patents (Strata 1 and 2) have significantly lower survival estimates.
Patents are thus more likely to be declared on standards with a longer expected lifetime. To
account for this selection effect, we once again carry through the comparison by strata. We
observe 22 replacements of standards including essential patents. Had these standards the
same survival functions as other standards, we would expect 67 standard replacements. If we
carry out the comparisons by strata, we remove the selection bias based upon observables.
The number of expected replacements decreases to 42, which is still much higher than the
observed 21. There is thus strong evidence for inequality of survivor functions. Differences
are statistically significant within strata 5 or 6. The numbers of standards including patents are
probably too small in the other strata to yield reliable results.
Table 2: Log-rank tests of equality of standard survival functions Standards including and not including patents, by strata, within strata
Standard Replacement
Stratified by SDO and ICS
Stratified by 6 PSM strata
Within Strata 1
Within Strata 2
Within Strata 3
Within Strata 4
Within Strata 5
Within Strata 6
Events Patented
Obs: Exp:
22 66.92
21 41.89
2 1.17
0 2.61
2 3.25
5 4.73
3 9.93
9 20.21
Non-patented
Obs: Exp:
1864 1819.08
714 693.11
201 201.83
150 147.39
108 106.75
99 99.27
85 78.07
71 59,79
Chi2 Pr>chi2
32.87 12.41 0.61 2.67 0.49 0.02 5.48 8.34 0.0000 0.0004 0.4349 0.1021 0.4818 0.8985 0.0193 0.0039

Comparative Analysis
18
The comparative analysis thus indicates that standard versions including essential patents
have a shorter expected lifetime, while standards including essential patents have a longer
expected lifetime than comparable standards. These findings are consistent with our two
hypotheses: essential patents induce more frequent standard upgrades, while reducing the
likelihood of standard replacement.
Standards including essential patents have significantly higher survival rates in all
SDOs except IEC. The number of IEC standards including essential patents is very low, and
only two IEC standards including essential patents have been withdrawn in the observation
period. Also the difference regarding standard versions does not seem to depend upon the
identity of the issuing SDO. The survival rate of standard versions including essential patents
is significantly lower for all standard bodies with a large number of standards including
essential patents. There are no significant differences only in the groups of standards issued
by ITU-R and ISO.
4.1 Robustness analysis
The stratified analysis removes the bias based upon observable standard characteristics. We
might worry that the remaining, unobservable explanatory factors of patent declaration could
also have an influence on standard upgrades and replacements. Our matching of standards
based upon the technological class or the issuing SDO, while ruling out that these observable
factors affect the comparability of standards, could actually have increased the difference
between standards in terms of unobservable characteristics. If standards in patent-intensive
technologies and issued by patent-friendly SDOs nevertheless do not include any essential
patents, they are likely to be different in some other, unobservable respect from standards
actually including patents. For instance, we risk comparing important standards with less
important standards. If our control variables are unable to control for these factors, it might be
preferable to compare standards including essential patents with other standards that do not
include essential patents because of observable characteristics, such as the technological field
or the issuing SDO.
Based upon this reasoning, we can construct three different control groups. The first
group includes the standards in the same technological field (ICS) as standards including
essential patents (list in Appendix 2), but issued by SDOs having few declarations of patents
(ITU-R, ISO and IEC, see Appendix 2). The second group includes standards in ICS with few
patents, but issued by SDOs issuing many standards including patents (ITU-T, JTC1 and
IEEE). The third group consists of standards in patent-intensive ICS issued by SDOs with

Multivariate Panel Analysis
19
many essential patents. The latter group is over-represented in the upper strata of the
comparative analysis, but might be a bad control group based upon unobservable standard
importance or commercial relevance. No control group is perfect. But each control group is
different from the standards including essential patents for a different reason, and having
several control groups allows us analyzing whether our control variables account for the
unobserved biases (Rosenbaum, 1987).
Comparing survival estimates between the group of standards including patents and
the three control groups, we find very significant differences not only between our standards
of interest and the controls, but also among control groups. If however we stratify by the
technological indicators used in the propensity score estimation (including the share of IT and
Telecom standards and the years of standard release) statistically significant differences
among control groups disappear (see Appendix 2). This indicates that these variables can
account for the relevant bias in the data (Rosenbaum, 1987). Even accounting for the
technological characteristics of standards, differences between standards including essential
patents and the controls remain strongly significant12.
5. Multivariate Panel Analysis
5.1 Estimation
The comparative analysis has revealed that standards including essential patents are less likely
to be replaced, but more frequently upgraded. We will next proceed to an econometric
analysis. This research framework allows us analyzing the effects of essential patents on
standard upgrades and standard replacement, as well as the interactions between the rates of
standard upgrades and standard replacements. First, on the version level, we estimate the risk
of the version to be withdrawn (model 1). Analysis time in this setting is time elapsed since
version release, and the estimated failure of the observation is withdrawal of the standard
version. The withdrawal of a standard version can be explained either by standard upgrade or
standard replacement. We can then differentiate between the effects of essential patents on the
competing risks of standard upgrade and standard replacement (model 2). The two events
exclude each other, and we speak of competing risks. SDOs face a choice between upgrade
and replacement. We will analyze separately this choice using a logit model (model 3):
12 Applying the analysis to standard upgrade, we find that the bias is X-adjustable between the samples of standards issued by the same SDOs (in patent-intensive or other technological fields). Other SDOs upgrade their standards less often, even accounting for technological characteristics. This leaves us with two valid control groups, displaying very significant differences with the standards including patents (Appendix 3, Table 13).

Multivariate Panel Analysis
20
conditional upon a version being replaced, we analyze how essential patents affect the
likelihood of standard replacement rather than upgrade.
The effects of patents on standard replacement can then be studied on the standard
level (model 4). In contrast to the previous analysis, the unit of observation is the standard,
and observation time is from the release of the first until withdrawal of the last version. In
model 5, we take into account releases of the different versions as events affecting the
survival rate of the standard. It is possible to analyze the risk of standard replacement using
two different ways of controlling for upgrades: first, we introduce a variable counting the
number of upgrades. Second, we include a variable indicating the time elapsed since the last
upgrade. As the time elapsed since first release of the standard is used for the baseline hazard,
this version age variable indicates the effect of failure to upgrade on the risk of standard
replacement. The comparison between Models 4 and 5 allows estimating whether controlling
for upgrades captures the effect of essential patents on standard replacement.
The effect of the variables is tested using a Cox model, a semi-parametric survival
analysis. In the Cox model, the likelihood of withdrawal (hazard) is estimated year by year,
conditional upon the fact that the version or standard has not already been withdrawn. The
estimated hazard is a multiplicative of a baseline hazard ℎ�(�), varying over time, and the
covariates multiplied by constant coefficients:
ℎ(���,�� = ℎ�(�) × exp(�,���)
ℎ�(�) and covariates �,� are allowed to vary over time, but estimated coefficients �� are
constant over the time of observation. The Cox model therefore rests upon the Proportional
Hazard (ph) assumption that the real effect of the covariates is independent of the observation
time. We are unwilling to make this assumption for several factors expected to have important
and not necessarily linear effects on the timing of standard withdrawal. This is the case for the
issuing SDO, the technological field, and the period of standard release. In order to control for
these factors, we use stratified survival analysis. In stratified survival analysis, the observed
individuals j are classified into strata j. The baseline hazard rate is allowed to vary between
the strata, but the effect of the explanatory variables is jointly estimated in all strata. We
stratify jointly by SDO, ICS class and cohorts of standards released before and after 2001.
ℎ(�, �, �,�) = ℎ�(�|�) × exp(�,���)
The remainder of the variables is included as covariates �,� in the Cox model. We test for the
functional form of the variables using the residuals of a stratified null model. It results that the
count of forward and backward references has non-linear effects on withdrawal rates, and we

Multivariate Panel Analysis
21
transform these variables in log. For the remaining variables, we see no indication of non-
linear effects. We then estimate Cox models including all variables and interaction terms
between variables and observation time. Insignificant interaction terms and variables are
progressively dropped. Finally we test the ph hypothesis for all the chosen models. Even
including interaction terms, these tests reject the ph hypothesis unless we further stratify the
sample. We therefore stratify standards by ranges of standard size (number of pages), and
standard versions by their position in the series of successive versions (e.g. first version,
second version, and so on).
The effect of patents can be estimated in various ways. First, we test for the effect of
including essential patents or not. This is done via a dummy variable which is one if at least
one essential patent has been declared (“Patented”). Second, we count the number of patents
declared over time, and include this count as a second explanatory variable
(“Patents_cumulative”). The results are presented in Table 313. We report hazard rates, which
can be obtained from the estimated coefficients as ℎ�� = exp(��). The hazard rate of patented
can then be interpreted as the factor by which the hazard of version withdraw or replacement
is multiplied if a standard includes essential patents, all other variables being held constant:
ℎ��������� =ℎ�(�|�) × exp(�,��� + ���������)
ℎ�(�|�) × exp(�,���)
13 The number of subjects at risk reported by the competing risk model is twice the number of standard versions, as each version faces two different risks. In the logit model, SDO and technology fixed effects are controlled for using dummy variables (coefficients not reported)
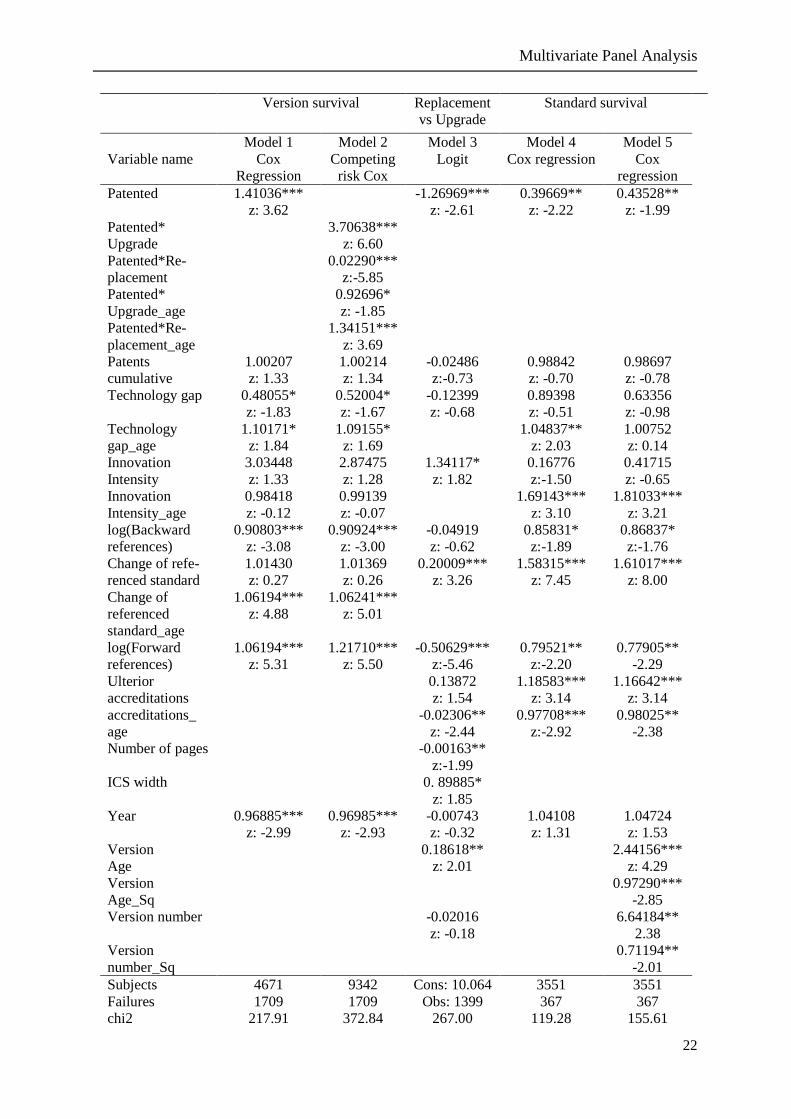
Multivariate Panel Analysis
22
Version survival Replacement vs Upgrade
Standard survival
Model 1 Model 2 Model 3 Model 4 Model 5
Variable name Cox Regression
Competing risk Cox
Logit Cox regression Cox regression
Patented
1.41036*** z: 3.62
-1.26969*** z: -2.61
0.39669** z: -2.22
0.43528** z: -1.99
Patented* Upgrade
3.70638*** z: 6.60
Patented*Re- placement
0.02290*** z:-5.85
Patented* Upgrade_age
0.92696* z: -1.85
Patented*Re- placement_age
1.34151*** z: 3.69
Patents cumulative
1.00207 z: 1.33
1.00214 z: 1.34
-0.02486 z:-0.73
0.98842 z: -0.70
0.98697 z: -0.78
Technology gap 0.48055* z: -1.83
0.52004* z: -1.67
-0.12399 z: -0.68
0.89398 z: -0.51
0.63356 z: -0.98
Technology gap_age
1.10171* z: 1.84
1.09155* z: 1.69
1.04837** z: 2.03
1.00752 z: 0.14
Innovation Intensity
3.03448 z: 1.33
2.87475 z: 1.28
1.34117* z: 1.82
0.16776 z:-1.50
0.41715 z: -0.65
Innovation Intensity_age
0.98418 z: -0.12
0.99139 z: -0.07
1.69143*** z: 3.10
1.81033*** z: 3.21
log(Backward references)
0.90803*** z: -3.08
0.90924*** z: -3.00
-0.04919 z: -0.62
0.85831* z:-1.89
0.86837* z:-1.76
Change of refe- renced standard
1.01430 z: 0.27
1.01369 z: 0.26
0.20009*** z: 3.26
1.58315*** z: 7.45
1.61017*** z: 8.00
Change of referenced standard_age
1.06194*** z: 4.88
1.06241*** z: 5.01
log(Forward references)
1.06194*** z: 5.31
1.21710*** z: 5.50
-0.50629*** z:-5.46
0.79521** z:-2.20
0.77905** -2.29
Ulterior accreditations
0.13872 z: 1.54
1.18583*** z: 3.14
1.16642*** z: 3.14
accreditations_ age
-0.02306** z: -2.44
0.97708*** z:-2.92
0.98025** -2.38
Number of pages -0.00163** z:-1.99
ICS width
0. 89885* z: 1.85
Year
0.96885*** z: -2.99
0.96985*** z: -2.93
-0.00743 z: -0.32
1.04108 z: 1.31
1.04724 z: 1.53
Version Age
0.18618** z: 2.01
2.44156*** z: 4.29
Version Age_Sq
0.97290*** -2.85
Version number -0.02016 z: -0.18
6.64184** 2.38
Version number_Sq
0.71194** -2.01
Subjects 4671 9342 Cons: 10.064 3551 3551 Failures 1709 1709 Obs: 1399 367 367 chi2 217.91 372.84 267.00 119.28 155.61

Multivariate Panel Analysis
23
Log-likelihood -5343.9173 -6422.0711 R2:0.3152 -1014.5515 -1005.7632 Proportional Hazard test
Chi2: 16.35 Pr:0.1285
Chi2: 13.76 Pr:0.4681
Chi2: 12.92 Pr:0.3751
Chi2: 19.20 Pr:0.2585
Table 3: Results of the multivariate panel analysis. Results of Models 1,2, 4 and 5 display hazard rates. Models 1 and 2 are stratified by SDO, ICS, cohort and version number, Models 4 and 5 by SDO, ICS, cohort and standard size range.
5.2 Results
The econometric results confirm our hypotheses and descriptive findings. First, we confirm
Hypothesis 1: the inclusion of essential patents reduces the survival rate of standard versions, meaning
that standards with patents are upgraded more frequently (model 1). This effect is significant and
sizeable: the inclusion of essential patents increases the rate at which standard versions are replaced by
more than 40%. We then analyze the survival rate of standard versions distinguishing between the two
competing risks of standard upgrade and replacement. We find that essential patents have very
different effects on the two different risks: the inclusion of essential patents strongly increases the
likelihood of upgrade, but strongly reduces the risk of standard replacement (model 2). Both of these
effects however decrease with the age of the standard version. We then directly model the choice
between upgrade and replacement (model 3). Conditional upon a standard version being withdrawn,
the inclusion of essential patents significantly increases the likelihood of the version being replaced by
a new version of the same standard.
Essential patents lead to withdrawing standard versions more often, but also increasing the
likelihood of choosing standard upgrade rather than replacement. The resulting net effect on the
survival rate of standards is unclear. We therefore estimate the effect of essential patents on the hazard
of standard replacement and confirm Hypothesis 2: Essential patents reduce the likelihood of standard
replacement (model 4). This effect as well is significant and sizeable: holding constant other variables,
the inclusion of essential patents reduces the rate of standard replacement by 60 %. As discussed, one
potential explanation for this finding is that more frequent upgrades delay the obsolescence of
standards and therefore reduce the risk of standard replacement. Models 1 and 2 have confirmed that
the inclusion of essential patents increases the rate of standard upgrades. Model 5 furthermore
confirms that a standard upgrade temporarily reduces the risk of standard replacement. This can be
seen from the fact that the risk of standard replacement increases with version age14, while controlling
for the baseline age effect. However, controlling for standard upgrades only slightly reduces the
magnitude and significance of the effect of essential patents on standard replacement (model 5).
14 The effect of version age is non linear, but the risk of standard replacement strictly increases with version age over the first 16 years of the version lifetime. The longest observed version lifetime in the sample is 19 years.
Multivariate Panel Analysis
24
5.3 Discussion
The results show that essential patents increase the rate of standard upgrades, but reduce the rate of
standard replacement. The inclusion of patented technology into a standard provides the holder of
essential patents with incentives to regularly invest in further improvements of the standard. Arguably,
one main incentive for the holder of essential patents to invest in improving the standard is to prevent
standard replacement by keeping the standard up to date. However, this mechanism only accounts for
a small part of the observable effect of essential patents on the rate of standard replacement.
These findings indicate that essential patents contribute to reduce the rate of standard
replacement also through other mechanisms. Earlier findings (Simcoe, 2012) show that higher
commercial stakes in standardization slow down the development of new standards. This effect is
arguably much stronger for the replacement of existing standards. We argue that essential patents on a
standard raise the standardizing firms’ resistance to radical changes of the standard excluding patented
technological components. This argument corroborates suspicions that essential patents increase
inertia of technological standards. In contradiction with widespread concerns about the negative
effects of patent thickets, we do however not find any evidence that the evolution of standards is
affected by the number of essential patents. Indeed, the only significant effect is the difference
between standards including at least one patent, and those not including any essential patents.
There are also other, complementary explanations for the effects of essential patents on the
rate of standard replacement. As has been argued by Liebowitz and Margolis (1995) and Katz and
Shapiro (1986), holders of proprietary standard components have an incentive to sponsor standard
adoption and complementary investments. If the installed base of a standard and the value of
complementary assets increase, the social costs of switching to a new standard also increase. We do
not directly observe standard adoption. However, we have proxies for technological investment
building upon the standard. If the technology building upon a standard is standardized itself, the more
recent standard references the standard it builds upon. Using forward references as a proxy, we find
that downstream investment building upon a standard reduces the risk of standard replacement. For
instance references by ulterior standards strongly increase the likelihood of choosing standard upgrade
rather than standard replacement. This finding corroborates our hypothesis that standard upgrades
generate less problems of backward compatibility. If the number of applications building upon a
standard increases, the cost of backward incompatibility increases, making standard replacement
increasingly unattractive.
The analysis of the other control variables reveals that our model is able to capture key
aspects of our analytical framework. We already confirmed in the comparative analysis that our
control variables capture a significant part of the heterogeneity between standards. The panel analysis
now also reveals that our variables capture well the time-varying effects on standard evolution. The
likelihood of standard replacement is strongly associated with the “technology gap”, the weighted
stock of patents filed in the broader field over the years since the last standard release. The

Conclusion
25
technological gap has no effect on very early standard replacement, but its effect strongly increases
over standard age, and the average sample effect is positive and significant. This indicates that
standard replacement indeed responds to progress in the field of science and technology. We also find
that strong related technological progress (“innovation intensity”) induces standardizing bodies to
choose standard replacement rather than upgrade. This finding could indicate that standard upgrades
are a less effective means of catching up with the technological frontier. The latter argument is
important, as we have seen that essential patents induce a substitution of standard upgrades for
standard replacement.
We also find strong evidence for significant interdependence of standards. Backward
references to other standards strongly reduce the risk of standard replacement. This indicates that a
standard building upon a more comprehensive architecture of other standards is less at risk of being
replaced. If a referenced standard is replaced or upgraded (“Change of referenced standard”), there is
however a very strong pressure to upgrade or replace the referencing standard as well.
6. Conclusion
We have presented empirical evidence that essential patents reduce the likelihood of standard
replacement. This finding could indicate that essential patents lead to frictions in standardization, for
instance because owners of essential patents oppose to changes in the standard that exclude their
patents from the standard. We also discussed extensively the hypothesis that essential patents lead to
more frequent upgrades of the standard, which would in turn delay standard obsolescence. While the
inclusion of essential patents indeed increases the rate of standard upgrades, this effect alone is not
sufficient to explain why standards including essential patents are less likely to be replaced. We
further show that the effect of essential patents, even controlling for the rate of standard upgrade, is
positively connected to a longer existence of standards.
Nevertheless, we would not argue based upon the presented evidence that essential patents
lead to an inefficient lock-in of outdated standards. Indeed, essential patents seem to have a positive
effect on the rate of standard upgrades. We have argued that these standard upgrades do not entail
replacement of standard components, explaining why essential patents could induce standardizing
firms to substitute standard upgrades for standard replacements. Essential patents do however not only
induce standardizing firms to substitute standard upgrades for replacements, but also to overall
increase the rate at which they revise standards (the sum of upgrades and replacements increases). The
latter part of the finding can be explained by the fact that essential patents provide incentives for at
least some standardizing firms to regularly invest into the standard in order to increase its value and
associated royalty revenue, and to shield the standard from technological rivalry and replacement.
These findings have important implications for management and policy. For standard
adopters, we argue that essential patents reduce the technological uncertainty associated with the

Conclusion
26
adoption of a new standard. Users of a standard including essential patent benefit from increasing
technological capacities through continuous improvements building upon a stable technological basis.
Patents may thus signal the commitment of standard setting firms to continuously advance the
standard. Furthermore, essential patents reduce the risk of standard replacement, thereby avoiding the
loss of sunk investment in standard implementation. These beneficial effects should be weighed
against the managerial risks arising from uncertainty about future levels of royalties.
For standard makers, the effects of essential patents can be controversially discussed based
upon the presented evidence. Essential patents induce more frequent standard upgrades, but also
inhibit standard replacement. On the one hand, standard upgrades do not seem to be as efficient as
standard replacements in catching up to the technological frontier. Selecting patented technology can
therefore inefficiently bind standard makers to a given technological trajectory, even when superior
alternatives are available. On the other hand, standards referenced by other standards are also more
likely to be upgraded rather than replaced. This could indicate that standard replacement entails
significant social costs, including for adjustment of downstream applications and technologies
building upon the standard. Essential patents, by substituting standard upgrades for replacements,
could therefore reduce the cost of standard momentum for applications building upon the standard.
The inclusion of essential patents thus reduces technological uncertainty and encourages users of the
technology to incur costly and risky investments in standard implementation and complementary
technology. These investments concur to the commercial and technological success of the standard.
Based upon this new analytical framework, we find a new justification for the argument that
sponsorship of standards by a technology owner can act as an encouragement of standard adoption,
and increase socially efficient investment building upon evolving standards. These effects of essential
patents on the technological evolution of standards deserve more attention by policy makers currently
working on a refinement of public rules for the treatment of patents in standardization in various
legislations.

References
27
References
Abernathy W. J.; Utterback, J. M. (1978): Patterns of industrial innovation, Technology Review, Vol. 80(7).
Aggarwal, N.; Dai, Q.; Walden, E. A. (2011): The More, the Merrier? How the Number of Partners in a Standard-Setting Initiative Affects Shareholder’s Risk and Return, MIS Quarterly, (35: 2) pp.445-462.
Arora, A., Ceccagnoli, M., Cohen, W. M. (2008): R&D and the patent premium, International Journal of Industrial Organization, Volume 26, Issue 5, 1153-1179.
Arthur, W.B. (1989): Competing Technologies, Increasing Returns, and Lock-In by Historical Events, Economic Journal 99, 116-131.
Balcer, Y., Lippman, S. (1984): Technological expectations and adoption of improved technology, Journal of Economic Theory, 34(2), pp. 292–318.
Baron, J., Ménière, Y., Pohlmann, T. (2011): R&D Coordination in Standard Setting Organizations: the Role of Consortia, Proceedings of the Standardization and Innovation in Information Technology Conference 2011.
Bekkers, R. (2001): Mobile Telecommunications Standards: GSM, UMTS, TETRA and ERMES. Boston, MA: Artech House.
Bekkers, R., Bongard, R., Nuvolari, A. (2011): An empirical study on the determinants of essential patent claims in compatibility standards, Research Policy, 40(7), pp. 1001–1015.
Bekkers, R., Catalini, C., Martinelli, A., Simcoe, T. (2012): Intellectual Property Disclosure in Standards Development, Conference Proceedings of the NBER conference on Standards, Patents & Innovation.
Bekkers, R., Martinelli, A. (2012): Knowledge positions in high-tech markets: Trajectories, standards, strategies and true innovators, Technol. Forecast. Soc. Change (in print).
Bessen, J. (2002): Estimates of patent rents from firm market value, Research Policy, 38, 1604–1616.
Blind, K. (2007): Factors Influencing the Lifetime of Telecommunication and Information Technology Standards, Journal of IT Standards & Standardization Research, 5(1), 1-24, January-June 2007 1.
Blind, K.; Bekkers, R.; Dietrich, Y.; Iversen, E.; Müller, B.; Pohlmann, T.; Verweijen, J. (2011): EU Study on the Interplay between Standards and Intellectual Property Rights (IPR), commissioned by the DG Enterprise and Industry.
Blind, K., Egyedi, T. (2008): The Dynamics of Standards, Edward Elgar Publishing.
Bresnahan, T., Greenstein, S. (1999). Technological Competition and the Structure of the Computer Industry, Journal of Industrial Economics, 47(1), pp. 1-40.

References
28
Caliendo, M., Kopeinig, S. (2008): Some Practical Guidance for the Implementation of Propensity Score Matching, Journal of Economic Surveys, Vol. 22, Issue 1, pp. 31-72.
Chiao, B., Lerner, J., Tirole, J. (2007): The Rules of Standard Setting Organizations: An Empirical Analysis, RAND Journal of Economics, 38(4), pp. 905–930.
Choi, J. P. (1994): Network Externality, Compatibility Choice, and Planned Obsolescence, The Journal of Industrial Economics, Vol. 42, No. 2 (Jun., 1994), pp. 167-182.
Christensen, C. M., Bower, J. L. (1996): Customer Power, Strategic Investment, and the Failure of Leading Firms, Strategic Management Journal, 17-3, 197-218.
Christensen, C. M., Suárez, F. F., Utterback, J. M. (1998): Strategies for Survival in Fast-Changing Industries, Management Science, 44-12, 207-220.
Clements, M. (2005): Inefficient Standard Adoption: Inertia and Momentum Revisited, Economic Inquiry, Vol. 43, July 2005, 507-518.
Cusumano, M., Gawer, A. (2002): The elements of platform leadership, MIT Sloan Management Review, Vol. 43, pp. 51-58.
De Bijl, P., Goyal, S. (1995): Technological change in market with network externalities, International Journal of Industrial Organization, Vol. 12, Issue 3, pp. 307-325.
Dosi, G. (1982): Technological paradigms and technological trajectories: A suggested interpretation of the determinants and directions of technical change, Research Policy, Volume 11-3, 147–162.
Egyedi, T.; Heijnen, P. (2005): Scale of Standards Dynamics: Change in formal, international IT standards – The Standards Edge: Future Generation, Bolin, S. (ed.): Bolin Communications.
Farrell, J., Klemperer, P. (2007): Coordination and Lock-In: Competition with Switching Costs and Network Effects, Handbook of Industrial Organization, 3, pp. 1967–2072.
Farrell, J., Saloner, G. (1985): Standardization, Compatibility and Innovation, RAND Journal of Economics, 16(1), pp. 70-83.
Farrell, J., Saloner, G. (1986): Installed Base and Compatibility: Innovation, Product Preannouncements, and Predation, American Economic Review, 76(5), pp. 940-955.
Farrell, J., Saloner, G. (1988): Coordination through Committees and Marekts, RAND Journal of Economics, 19(2), pp. 235-252.
Farrell J., Simcoe, T. (2012): Choosing the Rules for Consensus Standardization. RAND Journal of Economics, forthcoming
Fleming, L., Waguespack, D. (2008): Scanning the Commons? Evidence on the Benefits to Startups Participating in Open Standards Development, Management Science, 55(2)
Fontana, R., Nuvolari, A,, Verspagen, B. (2009): Mapping Technological Trajectories as Patent Citation Networks. An Application to Data Communication Standards. Economics of Innovation and New Technology, 18, pp. 311-336.

References
29
Garud, R., Jain, S., Kumaraswamy, A. (2002): Institutional Entrepreneurship in the Sponsorship of Common Technological Standards: The Case of Sun Microsystems and Java, The Academy of Management Journal, 45- 1, 196-214.
Ganglmair, B., Tarantino, E. (2012): Patent Disclosure in Standard Setting, Conference Proceedings of the NBER conference on Standards, Patents & Innovation.
Hall, B. H., Jaffe, A. B., Trajtenberg, M. (2000): Market Value and Patent Citations: A First Look, NBER Working Paper No. 7741.
Iizuka, T. (2007): An Empirical Analysis of Planned Obsolescence, Journal of Economics & Management Strategy, 16- 1, 1530-9134
Katz, M., Shapiro, C. (1986): Technology Adoption in the Presence of Network Externalities, Journal of Political Economy , 94(4), pp. 822-841.
Katz, M., Shapiro, C. (1992): Product Introduction with Network Externalities, Journal of Industrial Economics, 40(1), pp. 55-84.
Kindleberger, C. P. (1983): Standards as public, collective, and private goods, Kyklos Vol. 36, pp. 377-397.
Kitch, E. (1977), The Nature and Function of the Patent System, Journal of Law and Economics, 20(2), pp. 265-290 .
Kristiansen, E (1998): R&D in the presence of network externalities: timing and compatibility, RAND Journal of Economics, 29, pp. 531-547.
Leiponen, A., (2008): Competing Through Cooperation: The Organization of Standard Setting in Wireless Telecommunications, Management Science, 54(11), pp. 1904-1919.
Lemley, M., Shapiro, C. (2006): Patent Holdup and Royalty Stacking, Texas Law Review 81, pp. 1991-2044.
Liebowitz, S., Margolis, S. (2005): Path Dependence, Lock-In and History, Journal of Law, Economics and Organization, 11(1), pp. 205-26
McGrath, G., Nerkar, A. (2004): Real options reasoning and a new look at the R&D investment strategies of pharmaceutical firms, Strategic Management Journal, 25: 1–21.
Park, G., Park, Y. (2006): On the measurement of patent stock as knowledge indicators, Technological Forecasting and Social Change, 73, pp. 793-812.
Rosenbaum, P. (1987): The Role of a Second Control Group in an Observational Study, Statistical Science , 2(3), pp. 292-306.
Rysman, M., Simcoe. T. (2008): Patents and the Performance of Voluntary Standard Setting Organizations, Management Science, 54(11), pp. 1920-1934.
Shapiro, C. (2001): Navigating the Patent Thicket: Cross Licenses, Patents Pools, and Standard Setting. In: A Jaffe, J Lerner et S, Stern (Eds), Innovation Policy and the Economy, vol. 1. MIT Press.
Simcoe, T. (2012): Standard Setting Committees: Consensus Governance for Shared Technology Platforms, American Economic Review, 102(1), pp. 305-336.

References
30
Suarez, F. (2005): Network Effects Revisited: The Role of Strong Ties in Technology Selection, The Academy of Management Journal, Vol. 48, No. 4 (Aug., 2005), pp. 710-720.
Tassey, G. (2000): Standardization in technology-based markets, Research Policy, 29(4-5), pp. 587-602
Trajtenberg, M. (1990): A penny for your quotes: patent citations and the value of innovations, RAND Journal of Economics, 21(1), pp. 171-187.
Waldman, M. (1993): A new perspective on planned obsolescence. Quarterly Journal of Economics, 108, 273–84.
Weitzel, T., Beimborn, D., König, W. (2006): A unified economic model of standard diffusion: The impact of standardization cost, network effects and network topology, MIS Quarterly, 30, Special Issue, pp. 489-514
West, J. (2003): How Open is Open Enough? Melding Proprietary and Open Source Platform Strategies, Research Policy, 32(7), pp. 1259-1285.
West, J., Dedrick, J. (2000): Innovation and Control in Standards Architectures: The Rise and Fall of Japan's PC-98, Information Systems Research, 11(2), pp. 197-216.

Appendix 1
31
Appendix 1
Patented_dummy Indicates that a standard observation includes essential patents Time invariant
Patented Indicates a standard has received at least one patent declaration by this year Time-variant
Patented_upgrade Interaction term between patented and event-type upgrade Time invariant
Patented_replacement Interaction term between patented and event-type replacement Time invariant
Patents_cumulative Cumulative count of patents declared over time Time-variant
Innovation intensity Number of patents filed per year in the technological field, normalized by year; indicates strong innovative activity Time-variant
Technology gap
Cumulative count of patent intensity scores since standard release, discount factor 15%; indicates distance of the standard to the technological frontier Time-variant
Backward references Number of standards referenced by the standard Time-invariant*
Change of referenced Counts the number of referenced standards that are replaced or upgraded per year Time-variant
Forward references Cumulative count of the references made to the standard by ulterior standards in the PERINORM database Time-variant
Referencesafter4 Number of references received during the first four years after first standard release Time invariant
atleastonereference Referencesafter4 is bigger than 0 Time invariant
Ulterior accreditations Cumulative count of the number of accreditations by other SDOs after release of the standard at the sample SDO Time-variant
Prior accreditations Count of the accreditations by other SDOs before the release of the standard at the sample SDO Time-invariant*
National Standard Indicates that the standard was not first developed at the sample SDO (Prior accreditations is higher than 0) Time-invariant*
Number of pages The number of pages of the standard Time-invariant*
ICS width The number of ICS classes in which the standard is classified Time-invariant*
Year Calendar Year Time-variant
* Number pages, backward references, ICS width and prior accreditations can change with a new version
Table 4: Definition of variables

Appendix 2
32
Appendix 2
Calculation of the propensity score
Probit regression Number of observations: 6531
LR chi2(55): 646,62
Prob >chi2: 0,0000
Log Likelihood: -992,116 Pseudo R2: 0,2458
Variable Coef. Std. Error Z Pr>|z| 95% Confidence Interval
number_pages 0,00257 0.00030 8,46 0,000 0,0019 0,0032
at_least_one_reference 0,27398 0.07319 3,74 0,000 0.1305 0.4174 references_after_4years 0.00406 0.00321 1,26 0,206 -0.0022 0,0103
nationalstandard -0.57748 0,26795 -2.16 0.031 -1.1027 -0.0523
prior_accreditations 0.41569 0,18716 2.22 0.026 0.0489 0.7825
ics_width 0.26732 0,20240 1,32 0,187 -0.1294 0.6640
It -0.15721 0.21168 -0.74 0.458 -0.5721 0.2576
Telecom 0.64812 0,19895 3.26 0.001 0,2581 1.0381
Ieee 1.64179 0,38053 4.31 0.000 0.8959 2.3876
Iso 0,92272 0,40467 2.28 0.023 0.1296 1.7159
jtc1 1.30466 0.37165 3.51 0.000 0.5762 2.0331
itu-t 1.83084 0.35116 5.21 0.000 1.1426 2.5191
Constant -3.80847 0.51554 -7.39 0.000 -4.8189 -2.7980
Year dummies and ICS-class dummies not reported
There are observations with identical propensity scores.
Table 5: Probit regression model used for calculating the propensity scores
patented_dummy Total Pstrata
0 1 1 734 7 741 2 730 11 741 3 719 21 740 4 707 34 741 5 662 78 740 6 562 180 742
Total 4.114 331 4.445
Table 6: Standards with and without essential patents, by strata

Appendix 3
33
Appendix 3
Sensitivity analysis to unobserved biases using multiple control groups
SDO Number of Standards in ICT from 1988 to 2008
% of these standards including patents
Classified as SDO with patents
ISO 1169 2,10 % No
IEC 1348 0,59 % No
JTC1 1704 5,81 % Yes
ITU-T 3874 6,43 % Yes
ITU-R 1217 0,41 % No
IEEE 477 8,59 % Yes
Table 7: SDOs classified as with or without patents
ICS “with” patents ICS “without” patents ICS Standards % patents ICS Standards % patents
33040 1792 6,25 33020 659 0,30 33160 589 10,88 33030 62 0,00 35040 473 17,55 33050 138 2,89 35110 409 11,25 33060 970 0,93 35180 98 10,20 33070 53 0,00 Others 65 25,76 33080 510 4,90
33100 193 0,00 33120 234 0,00 33140 19 5,20 33170 516 2,52 33200 51 1,96 35020 57 0,00 35060 229 2,18 35080 257 0,80 35140 74 2,70 35160 97 3,10 35200 309 5,82 35240 1606 4,73 37040 16 0,00 37060 21 0,00 Others 1419 0,85
Table 8: ICS classes classified as with or without patents

Appendix 3
34
Table 9: Log rank test of equality of standard survival with multiple control groups
Table 10: Log rank test of equality of version survival with multiple control groups
Standard replacement
Test without strata
Test without strata,
controls
Test with strata
Test with
strata, controls
Events Treated
Obs: Exp:
20 49,46
20 54.91
Control 1 Obs: Exp:
50 56,88
50 58,74
50 59.37
50 61,11
Control 2 Obs: Exp:
674 549,00
674 565,65
674 626.80
674 652,41
Control 3 Obs: Exp:
270 358,66
270 369,61
270 272.93
270 280,48
Chi2 Pr>chi2
69,29 49.16 30.16 3,91 0,0000 0,0000 0,0000 0,1419
Standard upgrade
Test without strata
Test without strata,
controls
Test without strata, 2 controls
Test with strata
Test with
strata, controls
Test with strata, 2 controls
Events Treated
Obs: Exp:
267 153,69
267 171,03
Control 1 Obs: Exp:
41 94,77
41 89,35
41 88,78
41 81,43
Control 2 Obs: Exp:
1064 992,61
1064 936,02
1064 960,53
1064 1064,75
1064 1023,19
1064 1045,69
Control 3 Obs: Exp:
838 972,93
838 917,63
838 941,47
838 889,44
838 838,38
838 856,31
Chi2 Pr>chi2
146,29 53,07 23,67 101,77 27,82 1,09 0,0000 0,0000 0,0000 0,0000 0,0000 0,2962

35
Patent Pools and Patent Inflation An empirical analysis of contemporary patent pools
Abstract
Patent pools combine patents to be licensed out under a single contract. This may increase
transparency, reduce transaction costs, avoid costly infringement litigation and reduce
royalty rates. For this reason, an increasing number of patent pools have been created for
patents that are essential to technological standards. Little is known however on the effects of
patent pools on the incentives to file and declare essential patents. We investigate how
patenting around technological standards and the number of patents declared essential has
been affected by the increasing number of patent pools since 1997. Using data from a
comprehensive sample of ICT standards released between 1992 and 2009, we show that
periods around pool creation are characterized by exceptionally high levels of patenting and
high declaration rates. In the case of standards released after 1999, when the possibility of
pool creation was already established, patenting peaks prior to pool creation, and takes place
earlier than for comparable standards. These findings are consistent with the theoretical
analysis of the effects of expected pool creation on patenting incentives. In the case of earlier
standards, patenting peaks immediately after pool creation, highlighting a reaction to the
exogenous policy change establishing a more permissive approach towards pools. While this
evidence indicates a positive effect of patent pools on the incentives to file and declare
essential patents, the overall effect of pools on the inflation of essential patents around
standards seems to have been limited.
36
Contents
1. Introduction ....................................................................................................................... 37
2. Review of the Literature ................................................................................................... 39
3. Descriptive analysis .......................................................................................................... 41
3.1 Patent declarations and standards ................................................................................... 41
3.2 The policy change ........................................................................................................... 41
3. 3 Patent pools and declarations of essential patents 1992 to 2010 ................................... 42
4. Patent pools and dynamics of patenting ............................................................................ 46
4.1 Methodological Approach .............................................................................................. 46
4.2 The counterfactual .......................................................................................................... 48
4.3 Patent declarations and standard dynamics .................................................................... 49
4.4 Patent pools and the timing of patenting ........................................................................ 52
4.5 Patent pools and time shifts ............................................................................................ 54
4.6 Anticipation and reaction to pool creation ..................................................................... 55
4.7 Robustness ...................................................................................................................... 58
4.8 Discussion ....................................................................................................................... 60
5. Conclusion ........................................................................................................................ 61
References ................................................................................................................................ 63
Appendix .................................................................................................................................. 65
Appendix 1 Patent Pools Standard Match and Timing ......................................................... 65
Appendix 2 Timing of patent declaration as to pool launch ................................................. 66
Appendix 3 T-Test analysis t-tests of explanatory variables by standard with and without patent pools ........................................................................................................................... 67
Appendix 4 PSM Sampling for comparable standards ......................................................... 68
Appendix 5 Time shift analysis ............................................................................................ 70
Introduction
37
1. Introduction
Over the last ten years, the increasing number of patents declared essential to technological
standards has attracted wide attention in the academic literature and among policy makers. A
patent is called essential for a standard when it is necessarily infringed by any implementation
of the standard. Obtaining such a blocking power over a standard may increase the
commercial value of a patent for its holder (Rysman and Simcoe, 2009, Bekkers et al., 2002).
Standardization thus generates additional incentives for firms to file more patents (Layne-
Farrar, 2008, Bekkers et al., 2012), or to adjust their patent files to ongoing standardization
(Berger et al., 2012). The increasing number of patents around standardization thereby
evolves to become a challenge for standard development and implementation (Shapiro, 2001).
In order to deal with these challenges, standardizing firms have come up with
mechanisms to coordinate their strategies with respect to Intellectual Property Rights (IPRs).
Patent pools are the most important of these mechanisms (Shapiro, 2001). Pools combine IPR
to be licensed under a single contract. This increases transparency, reduces coordination costs
and avoids costly infringement litigation. As long as pools only include patents that are
complementary and necessary for implementing a standard, they furthermore reduce royalty
rates for users of the standard by eliminating wasteful multiple marginalization (Lerner &
Tirole, 2004). Based upon these arguments, patent pools are generally believed to increase ex
post economic efficiency, and antitrust guidelines have adopted a permissive policy stance
towards patent pools including only complementary patents.
The effect of patent pools on the incentives to innovate is however subject to debate.
Simcoe (2005) argues that the spreading practice to create patent pools for technological
standards is one of the driving factors of the increasing number of essential patents. This
claim is supported both by the theoretical literature, predicting a positive effect of pools on
innovation incentives, as well as by practitioner reports (Peters, 2012) and case studies
evidencing the importance of opportunistic patenting in view of patent pools (Nagaoka et al.,
2009, Baron and Delcamp, 2012). Recent empirical research (Lampe and Moser, 2012; Joshi
and Nerkar, 2011) however suggests that patent pool creation was followed by a decline in
related patenting. These findings however only describe a decline in follow-on innovation,
once a number of existing patents were bundled into a pool (the ex post innovation effects).

Introduction
38
The effect of patent pools on the incentives to file patents to be included into this pool (the ex
ante innovation effects) have so far not been subject to a thorough empirical analysis.
We will investigate ex ante effects of patent pools on innovation and evaluate
whether policy changes facilitating the creation of more than 50 ICT patent pools have
increased incentives to file standard-essential patents. We collect data on 60,000 declarations
of essential patents to more than 700 ICT standards. We will describe the growth in the
number of patent declarations over the past twenty years, and discuss to what extent the
increasing number of patent pools is likely to have contributed to this evolution.
We then analyze on the standard and firm level whether the creation of the individual
patent pools can be related to unusual peaks in the levels of patent declaration and patent files.
We build up a comprehensive database of 7 million patents that are technologically close to
declared essential patents, filed by over 150 companies contributing proprietary technology to
the specific standard. We relate patenting and patent declarations to 700 standards and
technical specification and 28 patent pools. We especially describe the baseline timing of
patenting and declaration with respect to the development of technology standards. We can
then analyze whether there is an unusual change in the extent of patenting before or after the
launch of patent pools. We distinguish between expected and unexpected patent pools using
the favorable business review of patent pools from 1997 to 1999 as an exogenous policy
change. Firms investing in R&D related to standards released after this policy change were
able to integrate the new policy environment in their expectations of the returns on essential
patents. We will analyze how the timing of patenting and patent declaration around pools
differs for pools created before and after policy change. Furthermore, we describe how the
timing of patenting differs from standards related to a (foreseeable) patent pool with respect to
other standards which are otherwise comparable but not subject to patent pools.
We find evidence for a positive effect of patent pools on patenting and the number of
patent declarations. The effect of patent pools depends upon whether the pool creation was
expected or came as a surprise to innovating firms. For instance, the periods before pool
creation are characterized by high numbers of patent files in the subsample of standards
released later than 1999. There is no such relationship in the sample of standards released
earlier then 2000. Furthermore, we find that companies entering a patent pool increase their
level of patenting with respect to companies contributing to the same standard, but staying
outside the pool. The overall effect of patent pools on the number of essential patents seems

Review of the Literature
39
however to be limited. The recent surge in the number of essential patents was mainly driven
by standards for which pools were not an option.
2. Review of the Literature
The theoretical literature on patent pools generally predicts a positive effect on the incentives
to invest in related R&D (Lerner and Tirole, 2004; Aoki and Schiff, 2007). Dequiedt and
Versaevel (2012) analyze the dynamic incentives for R&D in view of a patent pool. In their
model, patent pools increase innovation incentives, and especially induce patent races
preceding the launch of the pool. Llanes and Trento (2009) analyze the impact of patent pools
on follow up innovation. Patent pools efficiently reduce the royalty stacking problem, thus
reducing the negative effect of patent protection on follow-up innovation.
Recent empirical advances however rather point to a negative effect of patent pools
on innovation and patenting. In a study of the sewing machine patent pool in the 19th century,
Lampe and Moser (2010) find that this pool had a positive effect on the number of subsequent
patent files by insiders and outsiders. Nevertheless, the authors show that the effect on
innovation is negative, as measured by indicators of real technical progress. There is thus
apparently evidence of an increased patent propensity which does not translate into an
increased innovation effort. In a more recent study of patent pools in the 1930s, Lampe and
Moser (2012) find that most of these pools had a negative effect on subsequent patenting in
the field. In the only existing study of the effects of contemporary ICT patent pools, Joshi and
Nerkar (2011) find that the creation of the DVD patent pools was followed by a decline in
patenting in related technical fields by pool licensors and licensees.
It is difficult to confront the empirical evidence with empirical predictions from the
recent theoretical literature because of the heterogeneity of research settings. The expected
effects depend upon whether the pools are allowed to include substitutable patents or not.
Evidence on historical patent pools is thus only in a very limited sense applicable to
contemporary patent pools.
The empirical papers measure the effects of patent pools upon measures of
technological progress (Lampe and Moser, 2010) or patenting (Lampe and Moser, 2012; Joshi
and Nerkar, 2011), while the theoretical papers typically focus upon related R&D efforts
(Lerner and Tirole, 2004; Dequiedt and Versaevel, 2012; Llanes and Trento, 2009). Several of
the empirical papers use patents to indicate R&D efforts or innovation. The number of patents
Review of the Literature
40
however indicates innovation or R&D effort only under the condition that the pool has no
effect on patent propensity and on the efficiency of R&D investment. Given the impact of
patent pools on the return structure of patents, particularly the first assumption seems overly
strong. Layne-Farrar and Lerner (2011) for instance highlight that holders of the most
valuable patents often refrain from joining patent pools, because large numbers of
insignificant patents included in pools water down the return on significant inventions.
Evidence on effects of patent pools on patent counts should therefore only cautiously be
interpreted as indicating an effect on innovation.
Furthermore, the empirical papers either measure the effects on patenting by pool
members and licensees (Joshi and Nerkar, 2011), or on all firms in the field (Lampe and
Moser, 2010, 2012). On theory side, some papers focus upon the incentives of potential pool
members (Lerner and Tirole, 2004; Dequiedt and Versaevel, 2012), others concentrate on
outside innovators using the technology licensed out through the pool as input (Llanes and
Trento, 2009). While the comparison between pool members and outsiders is informative, it
would be mistaken to interpret changes in the extent of patenting by members relative to
outsiders as a measure of the overall effect of patent pools. Theoretical work clearly indicates
that pool outsiders’ innovation incentives are affected by patent pools (Llanes and Trento,
2009). Aoki and Nagaoka (2004) even stress that pool outsiders are the ones to benefit most
from pool creation.1 Furthermore, participation in a patent pool is endogenous to various
factors that are likely to also have a direct influence on future R&D in the specific technology,
such as vertical integration or R&D capacities.
Finally, most theoretical models consider the effects of expected pool creation, and
even explicitly address effects on the level of innovation preceding the pool creation
(Dequiedt and Versaevel, 2012). In contrast, all of the existing empirical work measures
effects of patent pools in the time period following patent pool creation. This research setting
requires that pool creation comes as a surprise to at least some firms. While arguably some
pools have indeed been created in response to an exogenous policy change, it is implausible
that significant effects on the incentives to file patents to be included into the pool can be
measured with data from periods after pool creation. Indeed, contemporary ICT patent pools
are restricted to include patents that are essential to precisely defined standards which are
generally released several years before pool launch. An empirical researcher interested in the
1 Lampe and Moser (2010) furthermore argue that pool outsiders reacted to the creation of a sewing machines patent pool by increased strategic patenting in order to counteract to the increased litigation capacity of pool members.

Descriptive Analysis
41
effects of contemporary patent pools on the incentives to file standard-essential patents needs
to take into account the periods preceding the foreseeable creation of a patent pool, thereby
testing empirical predictions of models of ex ante effects of pools, such as Lerner and Tirole
(2004) and Dequiedt and Versaevel (2012).
3. Descriptive Analysis
3.1 Patent declarations and standards
The aim of our analysis is to assess whether patent pools have contributed to the increasing
number of essential patents for technological standards. In a first step, we identify the totality
of declarations2 of essential patents made from 1992 to 2010 to the main formal standard
setting organizations (SSO) which operate on an international level: ISO, IEC, JTC1 – a joint
committee of ISO and IEC – CEN/CENELEC, ITU-T, ITU-R, ETSI, and IEEE3. We identify
64,000 declarations of essential patents made by 150 companies. Our measure is based upon a
count of declarations, and not a count of essential patents. The number of declarations is
higher than the number of patents, because we also include so-called blanket declarations (a
generic declaration that a company owns essential patents without specifying the patent
number), and we count patents declared essential to various standards as multiple
declarations.
These declarations are related to more than 700 standards and technical
specifications. The PERINORM4 database provides detailed bibliographic information on
formal standards such as standard version updates, standard amendments, the number of
pages, the technical classification and the year of release.
3.2 The policy change
While there have been many patent pools in very different technological areas until World
War II (Lampe and Moser, 2012), stricter enforcement of competition law impeded any pool
creation from the end of World War II until the 1990s (Gilbert, 2004). In 1997 and 1999, the
European and American antitrust authorities however authorized a new model of patent
2 A patent declaration is a public statement by a patent holder declaring that his patent is essential to a specific standard. These declarations are made publicly available on the website of the SSO. 3 These SSOs account for a large part of the essential patents identified by Bekkers et al. (2011). The sample is however restricted to formal SSOs operating with comparable rules on Intellectual Property Rights, thus excluding important SSOs and consortia, such as the IETF. 4 PERINORM is the world’s biggest database with bibliographic information on formal standards and is regularly updated by the SDOs DIN, BSI and AFNOR.

Descriptive Analysis
42
pooling for two important standards5, including several important safeguards against anti-
competitive abuses. This major policy change significantly altered the expectations of
standardizing firms regarding the likelihood of successful patent pool creation.
Since this favorable business review, many other patent pools including very similar
safeguards have been launched without meeting any resistance from antitrust authorities.
“The DOJ business review letters provide a template for patent pooling arrangements that
should not run afoul of the antitrust laws. The letters embody a new thinking in economics
and law and contrast sharply with early judicial opinions about the legality of patent pooling
arrangements.” (Gilbert, 2004). It is thus reasonable to assume that companies working on a
standard after the issuance of the business review letters had different expectations of the
likelihood of pool creation than companies working on a standard before this policy change.
These expectations in turn are likely to affect their patenting behavior. Simcoe (2005) notes
that the policy change with respect to patent pools could be one of the explanatory factors of
the increasing number of patents declared essential for technology standards.
3. 3 Patent pools and declarations of essential patents 1992 to 2010
We will first use our comprehensive database to describe the historical evolution of patent
pools and the rate of patent declarations over the past 18 years. The most immediate effect of
the policy change with respect to patent pools can be seen from figure 1: the rate at which
new successful pool projects are created is steadily increasing. The increasing experience of
companies with pools, the emergence of companies specializing in the administration of
patent pools, initiatives by SSOs and standards consortia encouraging pool creation as well as
the further clarification of the legal environment contributed to an increasing ease of pool
creation.
Furthermore, we can compare the number of companies having joined the patent pool during
the first four years after launch. We can see an increasing number of pools attracting a
relatively large number of members. Nowadays, companies deciding upon the level of R&D
investment for a future standard can integrate a non-negligible probability of successful pool
creation into their calculations of the expected return on essential patents.
5 MPEG2 and DVD, see the business review letters: http://www.justice.gov/atr/public/busreview/2485.pdf, http://www.justice.gov/atr/public/busreview/215742.pdf.

Descriptive Analysis
43
Figure 1 Pool creation and number of members after 4 years
In the following, we can use our declaration database, matched to individual standards, in
order to analyze whether the increasingly widespread practice of pooling patents has affected
the number of essential patents on new standards. First, our own data confirms a remarkable
increase in the number of patent declarations beginning at the end of the 1990s (figure 2).
These figures are however to a very large extent driven by declarations made to ETSI, and in
particular related to 3G mobile communication standards (indeed, UMTS alone accounts for
11,000 declarations, 3GPP receives 15,000 declarations and AMR-WB 1,500 declarations). It
can only be speculated to what extent the various attempts to create a large patent pool on 3G
technology have fuelled this unprecedented level of patent declaration. It seems that the role
of the (eventually failed) attempts to create important 3G patent pools have not been decisive
for the huge number of essential patents on 3G standards6. Several of the most important
holders of 3G patents have never aimed at joining a patent pool. Furthermore, patenting in this
industry seems to be strongly driven by portfolio races between litigious rivals and by the
presence of innovation specialists patenting aggressively, notably Qualcomm and InterDigital.
6 As to practitioners and experts in the telecommunication industry only 8-9% of the GSM standard essential patents are pooled. Attempts by Sisvel and Via Licensing to form pools for LTE have yet not been successful even though there have been meetings to pool LTE patents since more than 2 years.
18
97 6
85 4
26
8
22
14
8
36
8
4710
7
18
4
8
0
5
10
15
20
25
30
01.
06
.19
97
01.
06
.19
98
01.
06
.19
99
01.
06
.20
00
01.
06
.20
01
01.
06
.20
02
01.
06
.20
03
01.
06
.20
04
01.
06
.20
05
01.
06
.20
06
01.
06
.20
07

Descriptive Analysis
44
Figure 2 Declarations per year (whole sample left graph) Declarations per year and per year of release (excluding ETSI right graph)
Setting aside ETSI and the 3G mobile phone standards, we focus the analysis on ISO, IEC,
ISO/IEC (JTC1), CENELEC, ITU and IEEE. These are standard bodies that, even though
they account only for limited numbers of essential patents (compared to ETSI and IETF), are
related to 24 out of the 48 pools in our database, including many of the most important ones.
Concentrating on these standards, we can still see an increase in the number of declarations at
the end of the 1990s (dark grey line in the right graph of Figure 2). The graph also exhibits a
spike in the number of patent declarations in 1998. Possibly, this spike includes several
declarations of essential patents made as an immediate reaction to the contemporaneous
policy change. In order to analyze whether there was a lasting change in the levels of
patenting related to new standards after this year, it is important to relate the number of
declarations to the year of standard release. By comparing how many patent declarations
standards receive in the first four years after release, we can see that standards issued after
1997 indeed include a higher number of essential patents, even though there is no obvious
trend, and the numbers are in decline since 2003 (light grey line in the right graph of Figure 2)
We can go further in the analysis of these trends by comparing different types of
standards in our sample. For instance, patent pools are a solution tailored to single large
standards including many patents held by many different owners. In the following figure 3,
we can however see that the increasing number of patent declarations on new standards is
mainly driven by an increasing number of standards including patents.
02000400060008000
10000120001400016000
199
2
199
4
199
6
199
8
200
0
200
2
200
4
200
6
200
8
Declarations per year, overall
0
200
400
600
800
199
2
199
4
199
6
199
8
200
0
200
2
200
4
200
6
200
8
Declarations per year - excludingETSInumber of declarations onstandards released this year

Descriptive Analysis
45
Figure 3 Number of declaring firms per standard and standards including essential patents released per year (excluding ETSI), the percentage of ICT standards with essential IPR (right graph)
The right graph reveals that an increasing share of the standards released by the SSOs in our
sample receive at least one declaration of essential patents. At the same time, the average
number of declaring firms per standard has decreased over this period.
This finding could indicate that the increasing number of patent declarations is
driven by many small standards, for which pools are not really an option. We thus concentrate
our analysis on standards including declarations by more than 4 firms. Analyzing this
restricted sample, we find important numbers of patent declarations on standards released
from 1997 to 2003, but no steady increase neither in the overall number of declarations on
such standards, nor in the average number of declarations for each of these standards (figure
4).
Figure 4 Number of patent declarations to standards receiving declarations from more than 4 firms, and average number of declarations for each of these standards (excluding ETSI)
The analysis of the trends in the number of patent declarations over the past twenty years
indicates that the increasing number of patent declarations is on the one hand accountable to
05
101520253035404550
199
21
993
199
41
995
199
61
997
199
81
999
200
02
001
200
22
003
200
42
005
200
6
declaring firmsper standardcount ofstandards
0.21% 2.25% 4.42% 6.17%0%
10%20%30%40%50%60%70%80%90%
100%
199
2
199
4
199
6
199
8
200
0
200
2
200
4
200
6
200
8
201
0
0
50
100
150
200
250
300
350
199219931994199519961997199819992000200120022003200420052006
number of patents declared for standardswith >4 firmsaverage per standard

Patent Pools and Dynamics of Patenting
46
3G mobile communication standards and on the other hand to a high number of standards
including few essential patents. While this analysis suggests that patent pools have not been a
main driver of the recent increase in the number of essential patents on standards, the analysis
of the time trends does not allow concluding on the effect of patent pools on the incentives to
file and declare essential patents. Indeed, the aggregate figures are affected not only by the
policy change with respect to patent pools, but also by a strong variability in the rate of
technological progress, by other policy changes with respect to disclosure obligations and
reasonable royalty rates, and by a strong heterogeneity between standards released in different
periods. In order to analyze the effect of patent pools on declarations and patenting, we will
therefore proceed to an analysis on standard level, analyzing how patent pools affect the level
and timing of patenting and declarations for each company and standard.
4. Patent Pools and Dynamics of Patenting
4.1 Methodological Approach
We will next analyze how the rate of patenting and declaring patents relevant for specific
standards is affected by patent pools. The patents that are declared essential only constitute a
share of the patents filed in view of technological standards. Indeed, very often rivaling firms
develop competing technological solutions for the same problem of a standard. If only one of
the proposed solutions is chosen for inclusion into the standard, the patents protecting the
competing technologies are not essential patents, even though they have been filed as part of
the technological development of the standard. In order to identify standard related patent
files, we use the 7-digit IPC classification of the declared essential patents, and count the
number of patents filed per year in the respective IPC classes. We use all ICT patents filed at
the three major patent offices (USPTO, JPO and EPO) from 1992 to 2009 by the firms
declaring at least one essential patent for the respective standard, using the PatStat database
and the merging methods of Thoma et al. (2010). This merging yields 7 million patents filed
by over 150 firms. To create our explained variable, we computed for each company-standard
pair and year the number of priority patents filed in the relevant IPC classes for the standard
of observation.7
7 We further conduct tests of the technological position of standards as well as size measures to prove that our matching method reliably identifies standard-related patents. The method and the various tests have been presented at the Patent Statistics for Decision Makers Conference 2011 at the USPTO.

Patent Pools and Dynamics of Patenting
47
In a next step we identify 28 patent pools (including failed attempts to create a patent
pool) and match these pools to the standards in our sample8. Matching pools with standards is
straightforward, as pool administrators clearly display the technological standards that are
covered by the patent pool license. The date of launch is defined as the date at which a patent
pool administrator publishes a call for patents to gather holders of patents that are essential to
a technological standard (Baron and Delcamp, 2012). Such a call, often made upon the
initiative of a group of patent holders wishing to create a pool, seeks to identify and federate
the remaining patent holders and to steer negotiations on licensing provisions. The call for
patents thus indicates the time where the prospective pool creation becomes common
knowledge. In the period preceding the call for patents, several companies can already
negotiate on eventual pool creation, but at this stage there is still uncertainty on whether a
patent pool will be launched. In addition to the launch of the pool, we identify the dates at
which the companies joined the pools using internet archives and the history of news releases
of the pool administrators (Baron and Delcamp, 2012).
We further create control variables such as a yearly count of all patent declarations
on formal standards9 and a patent count of all patents per year in the IPC classes “G” and
“H” 10. The latter two variables should account for technology shocks in the technical field and
organizational changes in the SSOs. We also control for informal industry alliances arising
around standardization. Consortia are matched to formal standards using liaison statements11.
If an official liaison statement was not given, we conducted a more detailed analysis in order
to identify the related standard. In total 21 different informal consortia could be related to 63
formal standards including essential patents.
All information is given in longitudinal data over 18 years. This broad database
allows testing the impact of patent pools on the number and timing of patenting controlling
for fixed effects of company-standard pairs, activities in standardization and exogenous
technological shocks.
8 The list of pools, the date of pool launch and the match of relevant standards is provided in Appendix 1. 9 We labeled each patent declared essential to each standard as one declaration. For example a patent declaration for two patents declared essential to two different standards is counted as four declarations. Empty or so-called blanket patent statements - i.e. statements of ownership of essential IPR that do not provide patent numbers - were also counted as one declaration. 10 “G” and “H” IPCs are technologies that can be connected to information and communication technologies. In our database of standard essential patents 95% of all patents are classified in in both or at least one of these IPC. 11 A liaison implies an accreditation and a cooperative standardization development between the formal and informal standards bodies.

Patent Pools and Dynamics of Patenting
48
4.2 The counterfactual
In order to analyze the effects of patent pools, we need to compare the empirically observed
patenting and declaration rate with the counterfactual rate that would have been observed for
the same standard, the same company and the same year in the absence of a pool. The existing
empirical literature on patent pools compares the levels observed after pool creation with the
levels before pool creation, or with the hypothetical values which would be observed if these
rates had continued to follow a general trend pre-existing to pool creation (Lampe and Moser,
2012), or if the patenting of pool members had evolved in a manner similar to the patenting of
other firms (Lampe and Moser, 2012; Joshi and Nerkar, 2011).
We opt for a similar approach, especially tailored to the analysis of patent pools
related to technological standards. The development of the essential technology for a standard
does not follow a general trend, nor do patent files and patent declarations for different
standards increase or decrease at the same time. Rather, we will show that the patenting and
declaration rates follow an inverted U-shape over the development of the specific standard:
the number of patent files related to technological standards increases up to the year of
standard release and eventually declines, while the number of declarations culminates three
years later. We will control for this baseline timing of patenting and declaration with respect
to standardization by including a full set of standard age dummies. We furthermore control for
different levels of investment in different standards with company-standard pair fixed effects.
In order to accurately estimate the baseline timing for standards related to patent
pools, we estimate the baseline timing only over the subsample of standards for which at least
some firms license out their patents through pools. This approach is warranted, if the
standards licensed out through patent pools substantially differ from other standards. For
instance, we expect that patent pools are concentrated on standards including many patents by
many different firms, and that the development of these standards is more complex.
Nevertheless, the estimated baseline timing is not completely unaffected by the creation of
patent pools, even though different standards are affected by pool creation at different
moments.
In a first robustness check, we thus estimate the baseline timing over the whole
sample of standards including at least one declared essential patent. This yields a baseline
timing which is unaffected by patent pools, but which is more prone to heterogeneity among
standards. We therefore conduct a second robustness check on a sample of standards which
are similar to standards licensed out through pools based upon observable characteristics. As

Patent Pools and Dynamics of Patenting
49
can be seen in appendix 3, standards related to pools are updated more often and are
significantly larger in terms of pages. These standards are much more often developed in
connection with informal consortia, and they receive declarations of essential patents from a
much higher number of firms. All these differences reflect the higher technological
complexity and more important commercial stakes involved in these standards. Using these
observable standard characteristics, we can construct a control sample of standards of
comparable technological complexity and commercial importance (a detailed account of the
sampling method based upon a PSM analysis is provided in appendix 4).
4.3 Patent declarations and standard dynamics
We wish to analyze how the pooling of patents affects the rates at which companies file and
declare essential patents. Therefore we compare the level and timing of patenting and patent
declarations between standards related to a patent pool and standards licensed out
individually. We furthermore distinguish between standards released before and after the
policy change with respect to patent pools.
As discussed, we have constructed two counts of standard-related patents: patent
declarations and patent files in standard relevant IPC classes. We first analyze the timing of
patenting and declaration with respect to standard development. Figure 5 compares the timing
of our two measures around a standard release. In standardization, the release of the first
standard version represents an important event. The first standard version specifies the core
technological components that determine imminent standardization. Even though standards
are regularly updated and may consequently progress in their technological scope beyond
release, the first version often specifies a technical trajectory for ongoing development phases.
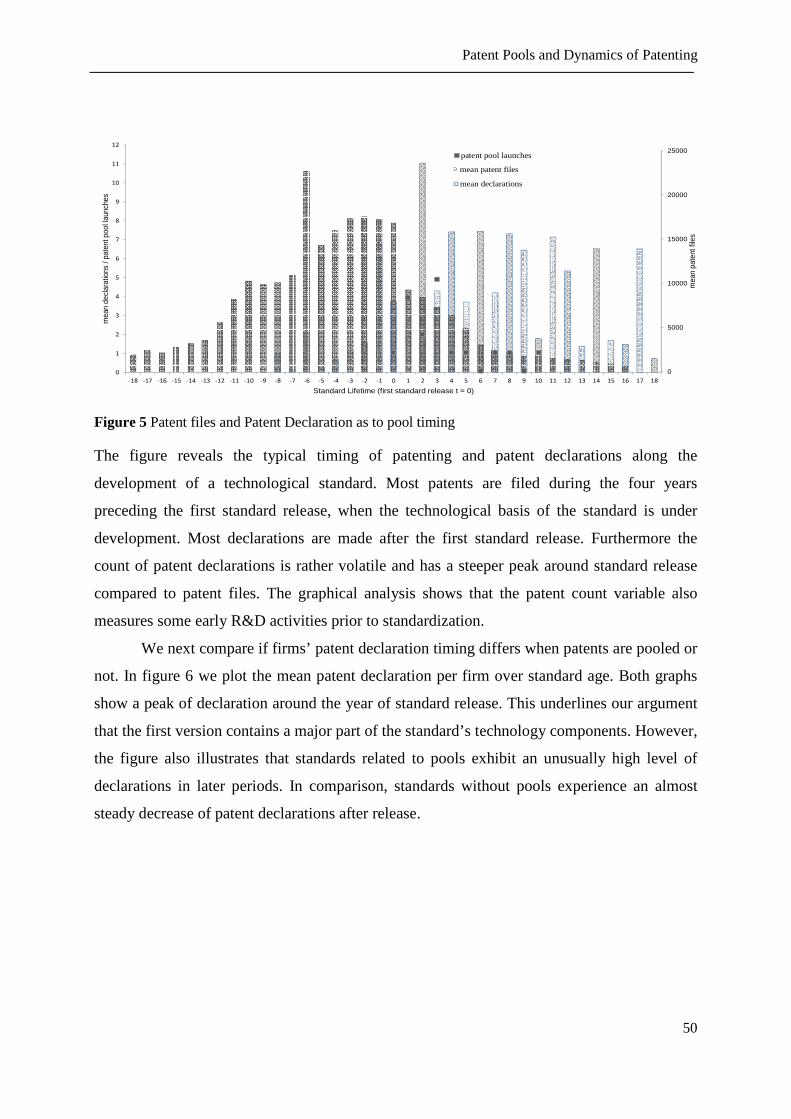
Patent Pools and Dynamics of Patenting
50
Figure 5 Patent files and Patent Declaration as to pool timing
The figure reveals the typical timing of patenting and patent declarations along the
development of a technological standard. Most patents are filed during the four years
preceding the first standard release, when the technological basis of the standard is under
development. Most declarations are made after the first standard release. Furthermore the
count of patent declarations is rather volatile and has a steeper peak around standard release
compared to patent files. The graphical analysis shows that the patent count variable also
measures some early R&D activities prior to standardization.
We next compare if firms’ patent declaration timing differs when patents are pooled or
not. In figure 6 we plot the mean patent declaration per firm over standard age. Both graphs
show a peak of declaration around the year of standard release. This underlines our argument
that the first version contains a major part of the standard’s technology components. However,
the figure also illustrates that standards related to pools exhibit an unusually high level of
declarations in later periods. In comparison, standards without pools experience an almost
steady decrease of patent declarations after release.
0
1
2
3
4
5
6
7
8
9
10
11
12
-18 -17 -16 -15 -14 -13 -12 -11 -10 -9 -8 -7 -6 -5 -4 -3 -2 -1 0 1 2 3 4 5 6 7 8 9 10 11 12 13 14 15 16 17 18
mea
n de
clar
atio
ns /
pate
nt p
ool l
aunc
hes
Standard Lifetime (first standard release t = 0)
mean declarations
0
5000
10000
15000
20000
25000
mea
n pa
tent
file
s
mean patent files
patent pool launches

Patent Pools and Dynamics of Patenting
51
Standards with Pools Standards without Pools
Figure 6 Patent declaration as to standardization timing if patents are pooled or not
In order to analyze whether the unusual peak in declarations well after standardization is
related to pool creation, we turn to a panel data analysis. The unit of observation is a one year
time span for each standard. We control for standard fixed effects, the baseline timing of
declaration along standard development, for exogenous technology shocks and for
standardization events (such as modifications or releases of new versions). We can then test
whether the creation of a patent pool is related to an otherwise unexplained high level of
patent declarations by introducing dummies for two-year periods around pool creation. We
thus estimate the following poisson regression:
��,� � exp�� ��,��� � ��� ��,��� � ���� ��,��� � ��� ��,��� � ��� � ��� � ���,� � ���,�
� ��,��
Where ��,�is the number of declarations per standard per year, ��,��� to ��,���are dummy
variables for the timing with respect to pool creation, �� and �� are time-invariant standard and
technology characteristics, ��,� and ��,� are time variant standard and technology characteristics, and
ε is an idiosyncratic error term. In the fixed effect specification, �� and ��are replaced by a standard
fixed effect.
The full regression results can be consulted in appendix 2. The following figure 7 plots the
estimated coefficients for the periods around pool creation. We can see that these periods
exhibit significantly positive coefficients. The estimated coefficients are at the highest for the
periods immediately preceding pool creation; and significantly decrease thereafter. This
finding could indicate that preparations for pool creation trigger unusually high levels of the
declaration rate well after standard release (indeed patent pools are usually launched several

Patent Pools and Dynamics of Patenting
52
years after standard release). Alternatively, it could also indicate that patent pool creation is a
reaction to periods of an unusual intensity of patent declarations.
Figure 7 Coefficients on timing with respect to pool launch12
4.4 Patent pools and the timing of patenting
In a next step, we plot the evolution of our count of standard related patent files per firm
standard pair over standard age. The timing of patenting refers to the date of patent
publication. Again the two graphs in figure 8 illustrate that the timing of patenting differs
when patent pools exist. Compared to the bell shaped distribution of patent files around the
release of standards without pools, we observe an increase of patenting several years after the
first release when the standard is related to a pool. Indeed most patent pools are formed
several years after standard release. However, we have to be cautious in interpreting these
shifts of patenting or patent declaration. On the one hand, we could argue that patent pool
formation increases incentives to invest in R&D, leading to a peak in patent files that deviates
from the normal timing of patenting around standard development. On the other hand, we
could argue that patent pools are particularly formed for standards that are subject to ongoing
technology development beyond standard release.
12 ∗∗∗, ∗∗,and ∗ imply significance at the 99%, 95%, and 90% levels of confidence, respectively
1.230*** 1.245***
0.598** 0.611**
0.278
0
0.2
0.4
0.6
0.8
1
1.2
1.4
before pool 3-4 before pool 1-2 after pool 1-2 after pool 3-4 after pool 5-6
coef
ficie
nt a
s to
gre
gres
sion
of p
aten
t de
clar
atio
nPool Launch

Patent Pools and Dynamics of Patenting
53
Standards with Pools Standards without Pools
Figure 8 Patent files as to standardization timing if patents are pooled or not
Once again, we analyze whether the unusually high level of late patenting on standards related
to patent pools can be connected to the timing of pool creation. We therefore graph patent
files per company over time with respect to pool creation. We distinguish between pools for
standards released before and after 1999.
Pools for standards released before 1999 Pools for standards released after 1999
Figure 9 Patent files as to pool timing, standards released before and after 1999
Figure 9 illustrates patent files per firm as to pool timing for standards released before and
after 1999. The graph for standards released after 1999 does not show clear evidence for a
specific timing of patenting as to the creation of patent pools. We have discussed earlier that
the business review of antitrust authorities ensured a legal certainty in periods after 1999. We
have argued that for standards released after this date, the possibility of an eventual pool
creation can be taken into account by the companies while investing in standard related R&D
during the standard development phase. In comparison, for standards released before 1999,
there is a strong peak in patent files well after the initial launch of a patent pool. These

Patent Pools and Dynamics of Patenting
54
differences support our approach to distinguish between pools created for standards released
before and after policy change. However, difference in the timing of patenting around pool
creation between earlier and later standards could also be due to changes in the general
dynamics of standardization, rather than the effects of a policy change on the expectations of
pool creation. We therefore carry through a further analysis where we include a group of
comparable control standards to account for generic changes in standard dynamics.
4.5 Patent pools and time shifts
We apply an additional analysis in order to examine the effects of expected pool creation. As
we want to analyze the effect of a prospective pool launch on the overall timing of standard-
related patenting, we need a counterfactual group of standards that are closely comparable
with the analyzed standards in terms of technological complexity and commercial relevance,
but are not licensed through a patent pool. As discussed, we have built up a control group of
standards similar to standards related to pools based upon observable characteristics. These
characteristics for instance account for the technological complexity and commercial stakes
involved in the different standards (see appendix 4 for details).
We then compare the timing of patenting around standard development between the
different groups of standards. We estimate the number of standard-related patent files by firm
standard pair and year, controlling for fixed effects, persistent effects of transitory shocks,
standard age dummies, and events affecting the standard and exogenous factors in the field.
We test for the time-shifting effect of patent pools by including a linear standard age variable,
which we interact with the dummy variable indicating that the standard is related to a pool. As
in the previous analysis, we estimate this effect separately for standards issued before and
after the policy shock13 (results can be consulted in the appendix 5).
We estimate coefficients on the whole sample from 1992 to 2009. In order to avoid
truncation of the observation period, we include for all standards only observations for the
four years preceding and the four years following to standard release and restrict the sample to
standards issued from 1995 to 2005 (results are robust to estimating the model over the full
sample and the full observation period). We find that patent pools for standards released after
13 As we are now interested in effects of patent pools on R&D investment made early in the standard life time, we decided to divide the sample at a later date. For instance, we cannot expect that the policy change from 1997 to 1999 led to an earlier start of R&D investment for standards released in 2000. We somehow arbitrarily chose the release date of 2002 as a separating line, but within reasonable bounds the results are not sensitive to the precise date separating the samples.

Patent Pools and Dynamics of Patenting
55
the policy change are connected with patenting taking place earlier in the standard life-time.
We further conduct test of statistical differences for periods before and after the policy shock.
The results reveal significant differences, ensuring that the time shift of patenting is specific
to later standards.
4.6 Anticipation and reaction to pool creation
In order to confirm these descriptive findings, we apply econometric analysis to control for
heterogeneity and isolate the pool timing effect. We use our panel of firm standard pairs over
the timespan of 1992-2009. Thus we are able to make use of the baseline timing of
standardization while testing for specific effects around the time when a pool is launched. All
firms are observed over the whole period of time. Following our discussion of the importance
of expectations, we distinguish between standards released before and after the policy change.
We interact the pool dummies with a variable indicating whether the standard was released
before or after 1999. We test the following specification:
�� !�"����#$= exp ( ���� !�"����#$�� + β�&"'()" ((*!+�,-"#$./��/1 *
2"!)�*!�")1999# + β5&"'()" ((*!+�,-"#$./��/5 *
2"!)�*!�")1999# + β�!'�") ((*!+�,-"#$./��/5 *
2"!)�*!�")1999# + β1!'�") ((*!+�,-"#$./��/1 *
2"!)�*!�")1999# + β6&"'()" ((*!+�,-"#$./��/1 *
2"!)�"!)*,")2000# + β9&"'()" ((*!+�,-"#$./��/5 *
2"!)�"!)*,")2000# + β:!'�") ((*!+�,-"#$./��/5 *
2"!)�"!)*,")2000# + β;!'�") ((*!+�,-"#$./��/1 *
2"!)�"!)*,")2000# + β< �� !�"��+(=��$+ β�>
��!�?!)?!+�,-,�2#$��+ +$ + � )
Where we count st !�"����#$ filed by firm i that are relevant to standard j per year t,
&"'()" ((*!+�,-"#$./��/1equals one 3 to 4 years before the pool launch PL for standard
j in year t,&"'()" ((*!+�,-"#$./��/5 equals one 1 to 2 years before the pool launch PL for
standard j in year t, !'�") ((*!+�,-"#$./��/5 equals one 1 to 2 years after the pool launch
PL for standard j in year t, !'�") ((*!+�,-"#$./��/1 equals one 3 to 4 years after the pool
launch PL for standard j in year t, 2"!)�*!�")1999# is a dummy variable that equals one if
a standard j is released later than 1999, 2"!)�"!)*,")2000# is a dummy variable that
equals one if a standard j is released earlier then 2000, �� !�"��+(=��$ denotes all
worldwide ICT patent files for each year t, ��!�?!)?!+�,-,�2�#$�� denotes version releases
and amendments to standard j in year t-1, +$ are year dummies and � is an idiosyncratic
error term.

Patent Pools and Dynamics of Patenting
56
We restrict our standard firm pair panel to standards for which a pool has been created at
some time, and further control for unobserved heterogeneity using fixed effects. Thus we rely
on a sample of standards that is subject to a comparable pattern. Rather than accounting for
pre-existing trends or supposing linear evolutions, we include a full set of standard age
dummies to control for the bell shaped baseline pattern of patenting around standardization
observed in the descriptive analysis. We furthermore control for particular events affecting the
standard in question (including variables for standard upgrades) and for technological shocks
in the wider technological field (including the overall number of ICT patents files in the
categories G and H per year). We furthermore control for persistent effects including the
lagged dependent variable as control variable. We use a poisson estimator with robust
standard errors, and furthermore cluster standard errors by firms (clustering standard errors by
standards instead does not alter the results). In models M1a-M1c we sequentially include our
control variables of standard updates and lagged patent files to ensure independency from our
main explanatory variables. In M2 we only use observations of member companies and thus
reduce our sample from 242 to 93 group observations. In M3 we also include variables
accounting for the timing of pool member entrance. This is due to the possibility that firms
which are prospective pool members might react on both, the time when the pool is created
and the time when they actually join the pool. All models show robust results for our main
explanatory variables.
The results corroborate our methodology to distinguish between standards released
before and after the policy change with respect to patent pools. Indeed, the link between
patent pools and patenting is very different in the two different samples. For standards
released earlier than 2000, we can observe that the creation of a patent pool is immediately
followed by an unusually high level of patenting. This group of standards has been released at
a time when the prospect of pool creation was still very uncertain. Pool creation became
common practice after 1999, when these standards were already released. In comparison, we
do not evidence any significant reaction to the creation of patent pools in the sample of
standards issued later than 1999. However, our results indicate an anticipatory effect. Periods
up to 4 years before pool launch have a significant positive effect for observations of
contemporary pools later than 1999.
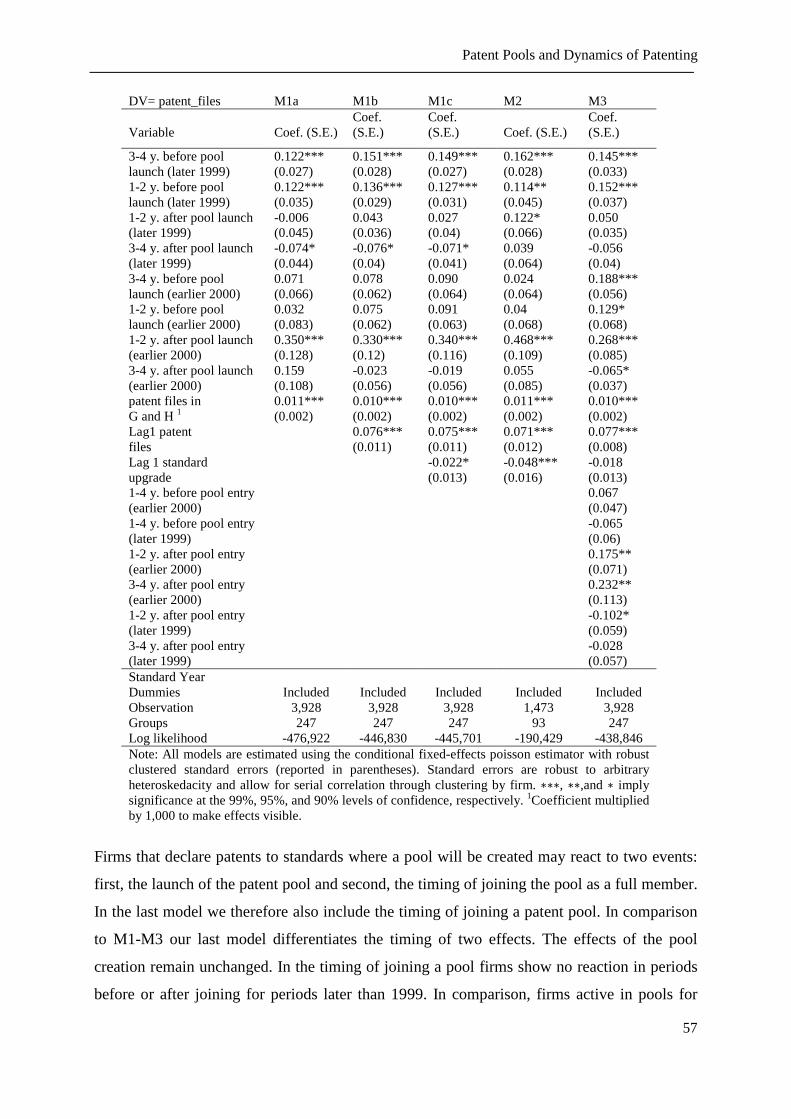
Patent Pools and Dynamics of Patenting
57
DV= patent_files M1a M1b M1c M2 M3
Variable Coef. (S.E.) Coef. (S.E.)
Coef. (S.E.) Coef. (S.E.)
Coef. (S.E.)
3-4 y. before pool launch (later 1999)
0.122*** (0.027)
0.151*** (0.028)
0.149*** (0.027)
0.162*** (0.028)
0.145*** (0.033)
1-2 y. before pool launch (later 1999)
0.122*** (0.035)
0.136*** (0.029)
0.127*** (0.031)
0.114** (0.045)
0.152*** (0.037)
1-2 y. after pool launch (later 1999)
-0.006 (0.045)
0.043 (0.036)
0.027 (0.04)
0.122* (0.066)
0.050 (0.035)
3-4 y. after pool launch (later 1999)
-0.074* (0.044)
-0.076* (0.04)
-0.071* (0.041)
0.039 (0.064)
-0.056 (0.04)
3-4 y. before pool launch (earlier 2000)
0.071 (0.066)
0.078 (0.062)
0.090 (0.064)
0.024 (0.064)
0.188*** (0.056)
1-2 y. before pool launch (earlier 2000)
0.032 (0.083)
0.075 (0.062)
0.091 (0.063)
0.04 (0.068)
0.129* (0.068)
1-2 y. after pool launch (earlier 2000)
0.350*** (0.128)
0.330*** (0.12)
0.340*** (0.116)
0.468*** (0.109)
0.268*** (0.085)
3-4 y. after pool launch (earlier 2000)
0.159 (0.108)
-0.023 (0.056)
-0.019 (0.056)
0.055 (0.085)
-0.065* (0.037)
patent files in G and H 1
0.011*** (0.002)
0.010*** (0.002)
0.010*** (0.002)
0.011*** (0.002)
0.010*** (0.002)
Lag1 patent files
0.076*** (0.011)
0.075*** (0.011)
0.071*** (0.012)
0.077*** (0.008)
Lag 1 standard upgrade
-0.022* (0.013)
-0.048*** (0.016)
-0.018 (0.013)
1-4 y. before pool entry (earlier 2000)
0.067 (0.047)
1-4 y. before pool entry (later 1999)
-0.065 (0.06)
1-2 y. after pool entry (earlier 2000)
0.175** (0.071)
3-4 y. after pool entry (earlier 2000)
0.232** (0.113)
1-2 y. after pool entry (later 1999)
-0.102* (0.059)
3-4 y. after pool entry (later 1999)
-0.028 (0.057)
Standard Year Dummies
Included
Included Included Included Included
Observation 3,928 3,928 3,928 1,473 3,928 Groups 247 247 247 93 247 Log likelihood -476,922 -446,830 -445,701 -190,429 -438,846 Note: All models are estimated using the conditional fixed-effects poisson estimator with robust clustered standard errors (reported in parentheses). Standard errors are robust to arbitrary heteroskedacity and allow for serial correlation through clustering by firm. ∗∗∗, ∗∗,and ∗ imply significance at the 99%, 95%, and 90% levels of confidence, respectively. 1Coefficient multiplied by 1,000 to make effects visible.
Firms that declare patents to standards where a pool will be created may react to two events:
first, the launch of the patent pool and second, the timing of joining the pool as a full member.
In the last model we therefore also include the timing of joining a patent pool. In comparison
to M1-M3 our last model differentiates the timing of two effects. The effects of the pool
creation remain unchanged. In the timing of joining a pool firms show no reaction in periods
before or after joining for periods later than 1999. In comparison, firms active in pools for

Patent Pools and Dynamics of Patenting
58
standards released before 1999 show an incremental positive reaction immediately after
joining the pool. This effect last for up to 4 years. However, for the latter sample of firm-
standard pairs, the positive effect of pool creation is still slightly stronger compared to the
effect of actually joining the pool.
4.7 Robustness
In our first models (M1-M3), we compared the observed rate of patenting with the baseline
evolution of patenting over standard age estimated exclusively for standards which are
licensed through patent pools. This makes sure that we work with a sample of comparable
standards and reduces heterogeneity. However, the estimated baseline timing of patenting
with respect to standard development is not unaffected by patent pools. In a first robustness
check, we thus compare the timing of patenting for standards related to pools with the timing
around standards where pools do not exists. We therefore make use of our whole sample of
standards where at least one patent has been declared essential, consisting in 1,704 firm
standard pairs. We estimate our third model (M1c) over the expanded sample (M4-1).
As discussed, standards where patent pools exist differ from other standards in technological
characteristics and in the characteristics of the contributing firms. We gradually reduce our
sample to better account for these differences. To account for differences in contributing
firms, we identify firms which are technological outsiders with respect to other firms also
contributing to the same standard. Indeed, firms may have a different patenting timing when
they specialize on different technologies relevant for the standard. In order to limit this firm
specific heterogeneity, we measure the technological difference between the essential patents
declared by different firms using the overlap of IPC classes. In model M4-2, firms are
dropped if their technological focus differs strongly from the average focus of other firms.
Another source of heterogeneity between firms is that different firms can be differently
affected by specific technology or business cycles. Our sample covers 18 years during which
markets and technology have changed in a volatile manner, with many technology-intensive
firms disappearing during the internet crisis and new actors appearing. In order to obtain a
sample of firms with a comparable overall evolution, we identify positive or negative shocks
to the number of employees of firms (M4-3). We observe differences in one year periods,
indicating mergers, acquisitions, restructuring etc. If this shock takes place after 2000, all
observations after the shock are dropped for this firm, if the shock takes place earlier, we drop
all previous observations. Firms with more than one shock are dropped altogether.

Patent Pools and Dynamics of Patenting
59
DV= patent_files M4-1 M4-2 M4-3 M4-4 M4-5
Variable Coef. (S.E.)
Coef. (S.E.)
Coef. (S.E.)
Coef. (S.E.)
Coef. (S.E.)
3-4 y. before pool launch (later 1999)
0.177***
(0.064)
0.177**
(0.084)
0.159*
(0.096)
0.057
(0.05)
0.166***
(0.045)
1-2 y. before pool launch (later 1999)
0.220***
(0.061)
0.209***
(0.076)
0.197**
(0.092)
0.116*
(0.065)
0.095**
(0.046)
1-2 y. after pool launch (later 1999)
0.071
(0.052)
0.037
(0.061)
0.043
(0.078)
0.069
(0.074)
0.027
(0.041)
3-4 y. after pool launch (later 1999)
-0.186
(0.127)
-0.244**
(0.119)
-0.233*
(0.123)
-0.006
(0.087)
-0.061
(0.041)
3-4 y. before pool launch (earlier 2000)
-0.115**
(0.055)
-0.084
(0.079)
-0.043
(0.067)
0.035
(0.077)
0.199***
(0.069)
1-2 y. before pool launch (earlier 2000)
-0.112*
(0.067)
-0.047
(0.089)
-0.009
(0.085)
0.026
(0.1)
0.133
(0.081)
1-2 y. after pool launch (earlier 2000)
0.347*
(0.184)
0.428**
(0.185)
0.446***
(0.172)
0.452***
(0.148)
0.413***
(0.103)
3-4 y. after pool launch (earlier 2000)
-0.014 (0.055)
0.025 (0.074)
0.103 (0.102)
0.106* (0.063)
0.098 (0.104)
patent files in G and H 1
0.009*** (0.001)
0.009*** (0.001)
0.008*** (0.001)
0.004*** (0.001)
0.008*** (0.001)
Lag 1 standard upgrade
-0.020 (0.013)
-0.031** (0.015)
-0.028** (0.011)
-0.042*** (0.01)
-0.033** (0.013)
Lag1 patent files
0.007*** (0.001)
0.006*** (0.001)
0.004*** (0.001)
0.007*** (0.001)
0.005*** (0.001)
Standard Age Dummy earlier 2000
0.001 (0.001)
0.001 (0.002)
0.002* (0.001)
0.005*** (0.002)
0.003* (0.001)
Sample restrictions
None Tech outsider
Employee shock
PSM
Pool Exists
Standard Year Dummies
Included
Included Included Included Included
Observation 27,147 19,560 13,197 6,675 2,521 Groups 1,704 1,227 972 482 171 Log likelihood2 - 25,596 - 13,682 - 7,310 - 2,185 -288 Note: All models are estimated using the conditional fixed-effects poisson estimator with robust clustered standard errors (reported in parentheses). Standard errors are robust to arbitrary heteroskedacity and allow for serial correlation through clustering by firm. ∗∗∗, ∗∗,and ∗ imply significance at the 99%, 95%, and 90% levels of confidence, respectively. 1Coefficient multiplied by 1,000 to make effects visible. 2 values in thousand.
Heterogeneity among standards is also an important source of concern. We therefore make
use of our database of comparable control standards (the sampling method is discussed in
appendix 4). As to our sampling method, we exclude firm standard pairs that were not
matched and estimate another model (M4-4). In our last model we again restrict our sample to
standards where pools exists, retaining the restrictions with respect to technical outsiders and
employee shocks. All models show robust results for both the anticipation effect before pool
launch for standards released later than 1999, and the prompt reaction in periods after pool
launch for standards released before 2000.

Patent Pools and Dynamics of Patenting
60
4.8 Discussion
We have highlighted unusually high levels of patent declaration and patenting around the time
when a patent pool is launched. For instance, we have shown that standards related to a patent
pool exhibit a peak in patent declarations well after standard release. The rate of patent
declaration is especially high in the two years preceding pool launch. When changing our
level of analysis to the firm standard level, we have furthermore shown that there is an
unusually high level of standard related patenting in the periods around pool creation. In the
case of standards released after the policy change with respect to patent pools, patenting takes
place before pool creation, whereas in the case of standards released before the policy change,
the unusually high level of patenting takes place in the periods immediately after the creation
of a pool. Furthermore, companies increase their level of standard-related patenting after
joining the pool. As compared with other standards, early standards related to a patent pool
are characterized by a peak in patenting occurring several years after standard release. Later
standards related to patent pools do not exhibit unusual peaks of late patenting and overall
patenting takes place in earlier periods than for standards not related to a pool or for standards
before the policy shock related to a pool.
In principle, finding a correlation between pool creation and periods of strong
patenting and high rates of patent declaration is not necessarily evidence for a causal effect of
patent pools. As patent pools are conceived a solution to the problems of large numbers of
complementary patents, it is plausible that periods of unusually strong patenting or high
declaration rates lead to launches of patent pools. This argumentation does however not
explain why the creation of patent pools for standards released before the policy change is
followed by an increase in patenting. In the case of these standards, pool creation can be
considered as an unexpected response to a relatively exogenous policy change. While several
companies initiated the project to create a pool before 1997, the favorable business review
revealed new information on a more permissive policy stance. The direct increase in patenting
as a reaction to pool creation, especially but not only by pool members, can therefore be
interpreted as an immediate reaction to newly revealed information. The distinction between
standards released before and after the policy change is indeed a crucial condition for
interpreting our findings as evidence of causal effects of patent pools.
We have argued that the favorable business review of patent pools in 1997 and 1999
created a template for viable pool licensing schemes. Companies investing in R&D related to
standards released after this policy change could take the creation of a possible patent pool

Conclusion
61
into account. Due to the benefits of patent pools for holders of essential patents, the
prospective creation of a patent pool is expected to induce companies to increase their efforts
to obtain essential patents (Lerner and Tirole, 2004, Aoki and Schiff, 2008). Dequiedt and
Versaevel (2012) expect that this induced effect takes place before the pool is actually
created, and culminates in the periods immediately preceding the launch of the pool. This
expectation is based upon the assumption that patent holders would prefer being among the
founding members of a pool, rather than having to negotiate entry with incumbent members.
This assumption finds empirical support in Baron and Delcamp (2012). Based upon this
hypothesis, Dequiedt and Versaevel (2012) also predict that expected patent pool creation
induces companies to overall anticipate their investment in related R&D. Our empirical
findings are thus fully consistent with the predictions of the theoretical literature on the effects
of prospective pool creation on ex-ante incentives to invest in related R&D and patenting.
It should however be stressed that our findings are limited by the fact that we do not
directly observe firms’ expectations with respect to future pool creation. We only observe
actual pool creation on some standards, and assume that at least some firms expected pool
creation for these standards with a higher likelihood than for other standards released at the
same time. In future work, it should be analyzed whether our findings are robust if we
explicitly model expectations as a function of observable standard characteristics in
conjunction with learning about the conditions for successful pool creation.
5. Conclusion
In this article, we have analyzed whether the recent policy change with respect to patent pools
has contributed to the increasing number of declarations of essential patents in ICT
standardization. Indeed, we show that the policy change has altered expectations concerning
the creation of a patent pool. We provide evidence that patent declaration as well as firm
individual patenting show unusually high levels around the launch of a standard-related pool.
There is an important difference between standards released before and after the policy
change. While patenting is especially high before the pool is launched for the most recent
standards, we find a direct effect right after pool creation for standards released before 1999.
These findings indicate that companies were less able to anticipate pool formation before
1999, when patent pools were still subject to legal uncertainty. Today, patent pools are
commonly accepted by antitrust authorities and several successful pools set an example for

Conclusion
62
well-functioning mechanisms for pooling patents. Firms are thus able to include the
possibility of a pool formation in their expectations of future returns on patents.
Our findings overall support the argument that patent pools have a positive effect on
patenting. However, our analysis on the increasing number of patent declarations points out
that patent pools have contributed very little to this increase. Most patent declarations are
declared to standards that do not qualify for pooling patents. Still, policy makers should take
into account that firms’ incentives to patent may change due to a pool creation.
However, our analytical framework does not allow us to conclude whether this
incremental patenting reflects an increase in substantial innovation or opportunistic patenting.
The theoretical proposition that an increase in the expected value of patents leads to more
R&D investment rests upon the assumption that firms cannot easily adapt their patent
propensity. Given the importance of strategic patenting in the field of ICT standards, we
would not be confident to interpret increases in the number of patents as evidence of an
increase in substantial innovation. Further empirical research using outside measures of
technological progress is required to analyze this question.
Furthermore, our research has pointed out that innovation measures need to take into
account the role of expectations. We have made the case that in order to analyze substantial
effects on innovation, researchers should focus upon the R&D investment incurred preceding
expected or at least foreseeable patent pool creation. Our information on expectations
concerning pool creation is however limited to the policy change. A challenge for future
research is to better measure firms’ expectations concerning pool creation, which may also
depend upon pool experiences, market constellations, licensing strategies and implicit or
explicit agreements between firms.

References
63
References
Aoki, R., Nagaoka, S. (2004): The consortium standard and patent pools. The Economic Review 55-4, 346-356.
Aoki, R.; Schiff, A. (2008): Promoting access to intellectual property: patent pools, copyright collectives, and clearinghouses. R&D Management Journal 38-2, 1467-9310.
Baron, J., Delcamp, H. (2012): Strategic inputs into patent pools. Cerna working paper. under: SSRN: http://ssrn.com/abstract=1641265.
Bekkers R, Duysters G, Verspagen B. (2002): Intellectual property rights, strategic technology agreements and market structure. The case of GSM. Research Policy 2002 31, 1141–1161.
Bekkers, R., Bongard, R., Nuvolari, A. (2012): An empirical study on the determinants of essential patent claims in compatibility standards. Research Policy 40, 1001-1015.
Bekkers, R., Catalini, C., Martinelli, A., Simcoe, T. (2011): Standardizing Intellectual Property Disclosure Data, NBER Working Paper.
Berger, F., Blind, K., Thumm, N. (2012): Filing behaviour regarding essential patents in industry standards, Research Policy 41, 216–225.
Bryson, A., Dorsett, R. and Purdon, S. (2002): The use of propensity score matching in the evaluation of labour market policies. Working Paper No. 4, Department for Work and Pensions.
Dequiedt V, Versaevel B. (2012): Pools and the Dynamic Incentives to R&D. Working paper, under: http://ssrn.com/abstract=988303.
Gilbert R J. (2004): Anti-Trust for Patent Pools: A Century of Policy Evolution. Stanford Technology Law Review 3.
Heckman, J., Robert, J., LaLonde, J., Smith J. S. (1999): The Economics and Econometrics of Active Labour Market Programs, in O. Ashenfelter and D. Card (Eds.), The Handbook of Labour Economics, vol. Ill.
Heckman, J., Ichimura, H. and Todd, P. (1998): Matching as an econometric evaluation estimator, Review of Economic Studies 65-2, 261–294.
Joshi, A. M., Nerkar, A. (2011): When do strategic alliances inhibit innovation by firms? Evidence from patent pools in the global optical disc industry. Strategic Management Journal 32-11, 1097-0266
Llanes, G., Trento, S. (2007): Anticommons and Optimal Patent Policy in a Model of Sequential Innovation,” mimeo, Harvard Business School and Universitat Autonoma Barcelona.
Lampe R, Moser P. (2010): Do Patent Pools Encourage Innovation? Evidence from the 19th century Sewing Machine Industry. Journal of Economic History 70, 898-920.
Lampe R, Moser P. (2012): Do Patent Pools Encourage Innovation. Evidence from the eight industries in the 1930ies. NBER working paper.
Layne-Farrar A. (2008): Innovative or Indefensible? An Empirical Assessment of Patenting within Standard Setting. International Journal of IT Standards and Innovation 9-2, 1-18.

References
64
Layne-Farrar A, Lerner J. (2011): To Join or not to Join: Examining Patent Pool Participation and Rent Sharing Rules. International Journal of Industrial Organization 29-2, 294–303.
Lerner J, Tirole J. (2004): Efficient Patent Pools. American Economic Review 94, 691-711.
Nagaoka, S., Tsukada, N. and Shimbo, T. (2009): The structure and the emergence of essential patents for standards: Lessons from three IT standards, Schumpeterian perspectives on innovation, competition and growth 4, 435-450.
Peters, R. (2011): One-Blue: a blueprint for patent pools in high-tech, Intellectual Asset Management, September/October, 38-41.
Rysman M, Simcoe T. (2009): Patents and the Performance of Voluntary Standard Setting Organizations. Management Science 54, 1920-1934.
Shapiro C. (2001): Navigating the patent thicket: cross licenses, patent pools, and standard setting. Innovation Policy and the Economy 1, 119–150.
Smith, J. and Todd, P. (2005) Does matching overcome LaLonde’s critique of non-experimental estimators? Journal of Econometrics 125-2, 305–353.
Simcoe T. (2005): Explaining the Increase in Intellectual Property Disclosure. In: Sheri Bolin (Eds), The Standards Edge: Golden Mean. Ann Arbor: Bolin Communications.
Thoma G., S. Torrisi, Gambardella, A., Guellec, D., Hall, B. H., Harhoff ,D. (2010): Harmonizing and Combining Large Datasets. An Application to Firm-Level Patent and Accounting Data, NBER Working Paper No. 15851.

Appendix
65
Appendix
Appendix 1 Patent Pools Standard Match and Timing
Pool Pool Launch License Available Standard mp3 1992 1992 ISO/IEC11172-3
MPEG2 1997 during 1997 ISO/IEC13818-1/ITU-TH.220.0
DAB 1998 1998 ETS300401 G.729 1998 July 1999 G.729 G723.1 2000 from 2000 G.723.1 IEEE1394 2000 2000 IEEE1394
MPEG2AAC 2000 2000 ISO 13818-7 (MPEG2 AAC)
DVB-T 2001 during 2001 EN300744 MPEGAUDIO 2001 2001 ISO/IEC11172-3 MPEG4Audio 2002 2002 ISO/IEC14496-3 MPEG4Visual 2002 2002-11-25 ISO/IEC14496-2 MPEG4Systems 2003 2003-2-4 ISO/IEC 14496.1 AMR 2004 2004-2-24 AMR AMR-WB+ 2004 2004-10-4 AMR-WB+
AVC 2004 2004-7-15 ISO/IEC14496-10/ITUH.264
DRM 2005 2005-3-28
ETSI ES 201 980 V1.2.2 (2003-4); ETSI TS 101 968 V1.1.1 (2003-04); IEC 62272-1 Ed. 1
IEEE802.11 2005 2005-4-14 IEEE802.11/ISOIEC8802-11
UHFRFID 2005 2005 ISO/IEC18000-6 DVB-MHP 2006 2006-3-2 ETSI …
MPEG2Systems 2006 2006-4-16 ISO/IEC13818-1/ITU-TH.220.0
OCAP 2006 2007-6-5 . NFC 2007 2007-6-5 ISO/IEC18092 VC1 2007 2007-3-14 . G729.1 2008 2009-1-12 G.729.1 AGORA-C 2009 2009-8-5 ISO 17572-3 AMR-WB/G.722.2 2009 3Q 2009 G.722.2
CDMA-2000 2009 2009-6-10
CDMA Family: CDMA2000 1X, CDMA2000 1xEV-DO and Ultra Mobile Broadband (“UMB”)
G711.1 2009 beginning 2009 G.711.1

Appendix
66
Appendix 2 Timing of patent declaration as to pool launch
DV = patent declaration Vaiable Coef. (S.E.) 3-4 y. before pool launch 1.230*** (0.290) 1-2 y. before pool launch 1.245*** (0.276) 1-2 y. after pool launch 0.598** (0.300) 3-4 y. after pool launch 0.611** (0.293) 5-6 y. after pool launch 0.278 (0.332) Version Release 0.090*** (0.140) Amendment 0.220*** (0.042) Standard Age 0.161*** (0.008) Standard Age Square1 -0.001*** (0.001) Standard Year Dummies included Observation 8,730 Groups 485 Log likelihood -5,805 Notes: All models are estimated using the conditional fixed-effects poisson estimator, standard errors (reported in parentheses). ∗∗∗, ∗∗,and ∗ imply significance at the 99%, 95%, and 90% levels of confidence, respectively. 1Coefficient multiplied by 100 to make effects visible.

Appendix
67
Appendix 3 T-Test analysis t-tests of explanatory variables by standard with and without patent pools
Standard Updates Group Obs Mean Std. Err. Std. Dev. [95% Conf. Interval] St. without Pool 567 0.360 0.057 1.361 0.248 0.472 St. with Pool 17 3.647 0.818 3.372 1.914 5.381 t = -9.1848 Pr(|T| > |t|) = 0.0000 Number Pages Group Obs Mean Std. Err. Std. Dev. [95% Conf. Interval] St. without Pool 567 89.280 7.504 178.681 74.541 104.019 St. with Pool 17 159.882 37.181 153.301 81.061 238.703 t = -1.6111 Pr(|T| > |t|) = 0.1077 Accompanying Standards Consortia Group Obs Mean Std. Err. Std. Dev. [95% Conf. Interval] St. without Pool 568 0.132 0.022 0.526 0.089 0.175 St. with Pool 17 1.941 0.466 1.919 0.954 2.928 t = -12.0743 Pr(|T| > |t|) = 0.0000 Declaring Companies Group Obs Mean Std. Err. Std. Dev. [95 %ConfInterval] St. without Pool 568 7.273 0.652 15.527 45.99 8.553 St. with Pool 17 55.882 18.521 76.366 16.61 95.146 t = -9.9426 Pr(|T| > |t|) = 0.0000 NPE on Standard Dummy Group Obs Mean Std. Err. Std. Dev. [95% Conf. Interval] St. without Pool 568 0.276 0.019 0.448 0.240 0.313 St. with Pool 17 0.824 0.095 0.393 0.621 1.026 t = -4.9816 Pr(|T| > |t|) = 0.0000 NPE Share (for Standards with NPEs) Group Obs Mean Std. Err. Std. Dev. [95% Conf. Interval] St. without Pool 157 0.296 0.019 .235 .259 0.334 St. with Pool 14 0.147 0.021 .077 .102 0.191 t = 2.3571 Pr(|T| > |t|) = 0.0196 Gini Coefficient of Essential Patent Dispersion Group Obs Mean Std. Err. Std. Dev. [95% Conf. Interval] St. without Pool 511 0.175 0.010 0.228 0.155 0.195 St. with Pool 17 0.267 0.048 0.199 0.165 0.369 t = -1.6484 Pr(|T| > |t|) = 0.0999
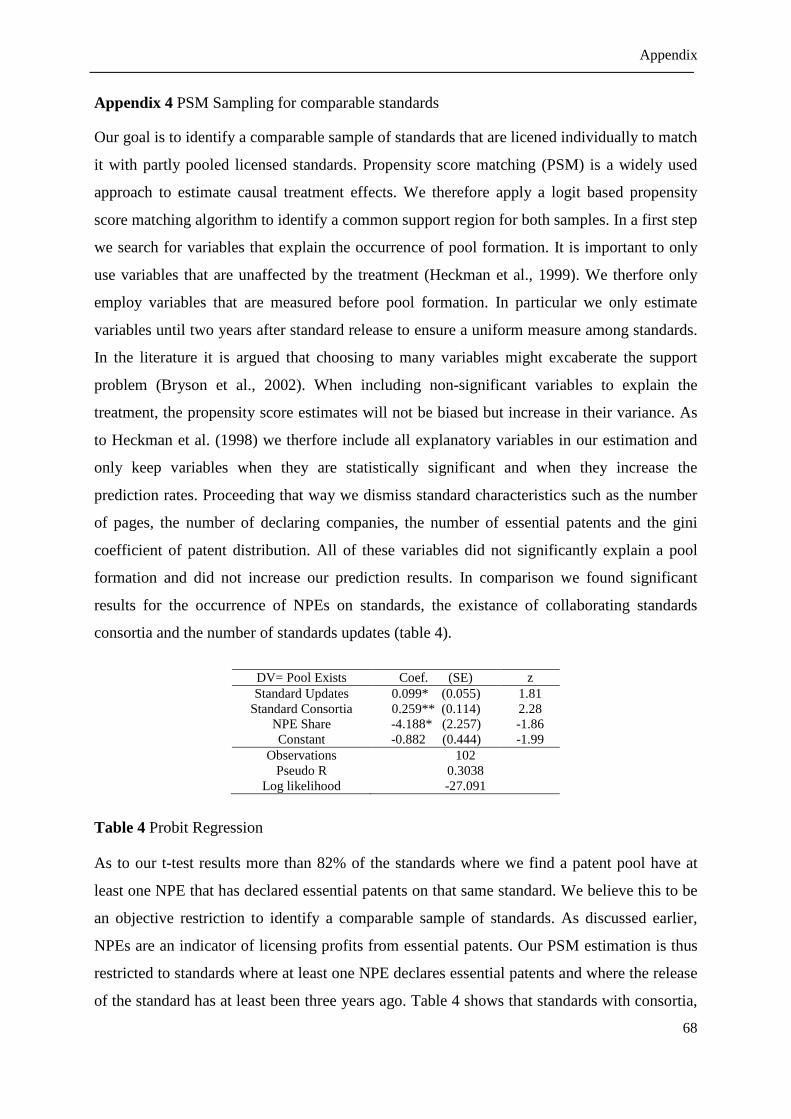
Appendix
68
Appendix 4 PSM Sampling for comparable standards
Our goal is to identify a comparable sample of standards that are licened individually to match
it with partly pooled licensed standards. Propensity score matching (PSM) is a widely used
approach to estimate causal treatment effects. We therefore apply a logit based propensity
score matching algorithm to identify a common support region for both samples. In a first step
we search for variables that explain the occurrence of pool formation. It is important to only
use variables that are unaffected by the treatment (Heckman et al., 1999). We therfore only
employ variables that are measured before pool formation. In particular we only estimate
variables until two years after standard release to ensure a uniform measure among standards.
In the literature it is argued that choosing to many variables might excaberate the support
problem (Bryson et al., 2002). When including non-significant variables to explain the
treatment, the propensity score estimates will not be biased but increase in their variance. As
to Heckman et al. (1998) we therfore include all explanatory variables in our estimation and
only keep variables when they are statistically significant and when they increase the
prediction rates. Proceeding that way we dismiss standard characteristics such as the number
of pages, the number of declaring companies, the number of essential patents and the gini
coefficient of patent distribution. All of these variables did not significantly explain a pool
formation and did not increase our prediction results. In comparison we found significant
results for the occurrence of NPEs on standards, the existance of collaborating standards
consortia and the number of standards updates (table 4).
DV= Pool Exists Coef. (SE) z Standard Updates 0.099* (0.055) 1.81
Standard Consortia 0.259** (0.114) 2.28 NPE Share -4.188* (2.257) -1.86 Constant -0.882 (0.444) -1.99
Observations 102 Pseudo R 0.3038
Log likelihood -27.091
Table 4 Probit Regression
As to our t-test results more than 82% of the standards where we find a patent pool have at
least one NPE that has declared essential patents on that same standard. We believe this to be
an objective restriction to identify a comparable sample of standards. As discussed earlier,
NPEs are an indicator of licensing profits from essential patents. Our PSM estimation is thus
restricted to standards where at least one NPE declares essential patents and where the release
of the standard has at least been three years ago. Table 4 shows that standards with consortia,

Appendix
69
with more updates but a lower NPE share explain the formation of pools. The latter results
shows that the occurrence of NPEs is positivley connected while a higher share is negativly
connected. Our former conducted t-test proved these results.
Figure 10 shows results of our PSM graph of treated (strandards with pools) and
untreated (individually licensed standards) goups. We apply the nearest neighbor matching
method where we identify matching partners of treated and untreated standards. We use a
matching with replacement, where we allow matching an untreated standard observation more
than once. This method is especially efficient when we have very different propensity scores
as evidence in figure 10. Matching high with low values would result in bad matches. We
overcome this problem by allowing replacement which on the other hand increases the
variance of the estimator (Smith and Todd, 2005).
Figure 10 psm matching results
We also apply a maximum propensity score distance (caliper) but our neighbor matches
remain the same. We conduct a sample statistic test after our propensity score matching.
Table 5 shows that there is no remaining significant differences between characteristics of the
standards in the two samples.
Mean % bias % reduct
bias t-test
Variable Sample Treated Control t p>t Standard Updates
Unmatched 4.384 1.303 101 7.6
3.68 0.000 Matched 4.384 7.230 -93.3 -1.59 0.124
Standard Consortia
Unmatched 2.231 0.404 113.5 45.2
5.03 0.000 Matched 2.231 1.231 62.1 1.23 0.230
NPE Share
Unmatched 0.139 0.271 -85.3 91.4
-2.28 0.025 Matched 0.139 0.127 7.4 0.47 0.642
Table 5 Sample statistics, matched and unmatched samples

Appendix
70
Appendix 5 Time shift analysis
DV= patent files M5 M5-1 M5-2
Variable Coef. (S.E.) Coef. (S.E.) Coef. (S.E.)
standard age before 2002 -0.009*** (0.001)
0.004* (0.002)
0.005** (0.002)
standard age * pool exists before 2002
-0.001*** (0.001)
-0.001 (0.001)
-0.001 (0.001)
standard age after 2002 -0.006*** (0.001)
-0.006*** (0.001)
-0.005*** (0.001)
standard age* pool exists after 2002 -0.004*** (0.001)
-0.003* (0.002)
-0.003* (0.002)
patent files in G and H 1 0.011*** (0.001)
0.002 (0.001)
0.001 (0.001)
Lag 1 standard Upgrade -0.016 (0.01)
-0.006 (0.008)
-0.002 (0.005)
Lag1 patent Files 0.001** (0.001)
0.002*** (0.001)
0.001*** (0.001)
Standard Year Dummies Included Included Included Added Restriction standard time and years
No restrictions
4 years bef. & aft. standard
release
M5 restriction + 1995-2005
Observation 10,228 4,232 3,259 Groups 640 640 466 Log likelihood -9,044,428 -2,107,350 -1,688,240
Note: All models are estimated using the conditional fixed-effects poisson estimator with robust clustered standard errors (reported in parentheses). Standard errors are robust to arbitrary heteroskedacity and allow for serial correlation through clustering by firm. ∗∗∗, ∗∗,and ∗ imply significance at the 99%, 95%, and 90% levels of confidence, respectively. 1Coefficient multiplied by 1,000 to make effects visible.

71
Attributes and Dynamic Development Phases of ICT Standards Consortia
Abstract
Standards consortia are private industry alliances that serve a certain purpose and gather
likeminded companies that share the same interest to sponsor and develop technologies for
standardization. Compared to formal standard setting, participation in consortia is less
bureaucratic, more efficient in reacting to market needs and allows, in respect to the tiered
membership structures, a strategic influence of standard setting outcomes. Formal
standardization is in contrast an often protracted process of development and negotiation.
This paper tries to provide a broad and comprehensive picture of standards consortia and
their dynamic development in the past ten years. Analyses show that consortia have distinct
characteristics which help to explain and justify their presence in the standard setting context.
The observation of consortia existence over time identifies relationships between the
formation, termination and merger of consortia with respect to market and technology
development. Furthermore the paper seeks to measure consortia performance with respect to
organizational structures and market position. Therefore we test the likelihood of consortia
termination. Results of a survival analysis reveal that the probability of consortia success is
especially connected to structures that determine coordination among members. Additionally
the scope and focus on technology and markets also influences if consortia remain in business
over time.

72
Contents
1. Introduction ................................................................................................... 73
2. Theoretical Considerations ........................................................................... 75
3. Methodology ................................................................................................. 76
4. Empirical Analysis ........................................................................................ 77
4.1 Consortia Characteristics and Attributes ................................................... 77
4.2 Consortia Development Phases .................................................................. 81
4.3 Consortia Performance ............................................................................... 83
5. Conclusion and Discussion ........................................................................... 87
References ........................................................................................................... 88

Introduction
73
1. Introduction
In the past years the complexity and speed of technological development has constantly been
increasing. Especially in the field of information and communication technologies (ICT),
markets show evidence of a higher variety of products and solutions in a more frequent
manner (David, 1996). The need for technological standardization is growing (Blind et al.,
2010), but the complexity and speed challenge companies in their coordination activities.
Standard setting is a complex process, which is dependent on consensus agreements between
often competing organizations. These processes can take several years. Especially formal
standard bodies are sometimes not able to keep up with the market pace (Cargill, 2002). Since
fast changing markets required more flexible solutions to set standards, the standardization
landscape has changed over the past twenty years (Updegrove, 2008). Today not only formal
standard developing organizations (SDOs), but also informal industry driven standard setting
organizations such as consortia, produce widely adopted and important standard solutions.
Other than formal organizations, which produce so called “de jure standards”, informal
consortia create and promote mostly “de facto standards” (Jakobs, 2004). For the latter we can
further distinguish between a “de facto standard” developed by a single firm and a “consortia
standard”, where the standard is set by a group of firms (Bunduchi et al., 2008).
Formal standardization is often time consuming and can take several years, whereas
informal consortia are more flexible and able to anticipate technological development and
thus set the standard right in time (Cargill, 2002). Even though informal standard
specifications are agreed on without a formal accreditation, they can still be widely accepted
and of great importance or even follow up a certain formal standard (Blind et al., 2010). Yet,
there is no common definition for a standards consortia and the consortia landscape has
developed to be very heterogeneous in characteristics such as technical issues, structure,
members, transparency or IP policies (Hawkins, 1999). Updegrove (2008) defines consortia
as being “anything from a loose, unincorporated affiliation of companies, to an incorporated
entity with offices, marketing, technical and administrative staff and a multi-million dollar
budget”. He distinguishes between specification groups which agree to promote an industry
standard, research consortia with the main intent of creating and developing a technologic
solution and strategic consortia which focus on the adoption of a technology or the
formulization of a yet informal common practice (Updegrove, 1995).
In this article we consider standards consortia which meet the criteria set by the ISSS
CEN Survey:

Introduction
74
- The organization must be international in outlook and scope, not simply an instrument
of single-nation policy,
- must have an active and international membership,
- must not be set-up specifically as a single vendor, government, or proprietary
technology advocacy group,
- must be of importance to the areas of standardization or its processes (CEN/ISSS,
2009).
In Europe (Council of the European Union, 2000) and in the US (Center for Regulatory
Effectiveness, 2000) standards consortia are recognized as being organizations that influence
standard setting processes, but which are not officially recognized (Egyedi, 2001). So far
there has not been much empirical work on the role of consortia. Earlier work mostly focuses
on theoretical explanations for the existence of consortia (Cargill, Weiss 1992: Updegrove
1995; Axelrod et al., 1995; Hawkins, 1999; Bunduchi et al., 2008). More current research
uses a case study approach and characterizes and compares the processes of informal
consortia such as Updegrove (1995): X Consortium and Open GIS Consortia, Egyedi (2001):
W3C and ECMA, Coulon (2004): Symbian Alliance, Anderson (2008): ECMA, IETF, OASIS,
OMG and W3C, Koenig (2008): FlexRay, Autosar and Jaspar, Grotnes (2009): Open Mobile
Alliance (OMA). A first comprehensive analysis on the evolution of standards consortia was
done by Blind & Gauch (2008). They accessed a dataset of more than 250 consortia to map
the change of consortia between 2000 & 2004 and found evidence for a complimentary
relationship of formal and informal standard setting activities. Other empirical contributions
rather focus on the effects of consortia in terms of coordination outcomes and efficiency
(Leiponen, 2008; Delcamp and Leiponen; 2012; Baron et. al., 2012).
This paper presents a unique dataset of over 400 standards consortia. Consortia are
analyzed by characteristics, attributes, membership, active markets and industries as well as
by the dynamics of consortia evolution over the last 10 years. The article uses 14 editions of
the ISSS CEN survey on ICT standards consortia. Further information was added exploiting
the consortia database of Andrew Updegrove (http://www.consortiuminfo.org/). To retrieve
historical membership information on consortia activity as well as memberships, the paper
further makes use of the internet archive waybackmachine (http://archive.org).

Theoretical Considerations
75
2. Theoretical Considerations
In many literature sources, standards consortia are described as explicit alliances or groups,
which are especially formed when the fast evolution of technology requires coordination
mechanisms (Axelrod et al., 1995). Such alliances are further defined as groups of companies
where the benefits of the collective activity arise from a commonly produced public good
(Olson, 1971; Cargill and Weiß, 1992). Irrespective of the costs of producing the public good,
the good is equally available to all members. However, members’ benefits and incentives to
invest may differ (Kindleberger, 1983). Groups emerge when a single firm is incapable of
producing a certain good itself. Firms thus join groups when the collective activity is
beneficial and exceeds the costs of membership. Incentives to join or leave the group are
simply related to a cost-benefit analysis, though groups may scale costs to counteract
defection (McGuire, 1972). The size of the group matters as a factor of effective coordination.
As to Olson (1971), coordination failures such as “cheating” or “free-riding” diminish when
the group is held respectively small. Furthermore, the costs of coordination increase with the
size of the group. Groups are characterized as “exclusive” groups when the collective good
increases by excluding others. In comparison “inclusive” groups are these, where it is more
beneficial to include as many market participants as possible.
Group formation in standard setting postulates a special case of coordination and
collective benefits. Standards are subject to network externalities since users of a standard
obtain benefits not only from the technology itself but furthermore depend on the share of
users in the market. Thus, the success of a standard always depends on the installed base of
users (David and Greenstein 1990). When network externalities are significant, firms have to
coordinate in product development processes. This coordination can be reached by standard-
writing committees such as standard consortia (Weiss, Sibru, 1990). Besen and Johnson
(1986) list several conditions for successful coordination in standard setting. In this sense, the
consortia should gather a certain market share of the industry, the group should not be subject
to antitrust objections and members should reduce the number of technological alternatives to
reach consensus while further eliminating subjective disputes.
In conclusion, standards consortia are subject to network externalities, while also
inhibiting coordination failures of a group. Oslen (1971) argued that small groups benefit
from coordination efficiencies. In comparison Axelrod (1995) states that consortia are
especially successful when they gather most market players. The latter argument is further
connected to the installed base of a standard, which increases with the number of participants

Methodology
76
sponsoring the standard (David and Greenstein, (1990). To a certain extent standards
consortia are inclusive, since a common standardization project is only reasonable when a
sufficient number of market players participate. However, standards consortia pursue a
particular approach to standardization compared to formal standard bodies. While formal
standardization seeks consensus decisions and is open to all market participants, standards
consortia are more closed in their membership rules. Membership fees, more regular meetings
and a certain interest to influence technologies in early stages differentiate consortia from
formal bodies. A consortium can thus be seen as an exclusive group of firms that are more
committed to standardization or have a particular interest in a technology. However, consortia
are inclusive to the limits of likeminded companies that share the same interests.
3. Methodology
This paper uses a broad approach to illustrate the dynamic landscape of ICT consortia over
the past ten years. The research is based on the use of two data bases that have assembled
more than 700 informal standards consortia since 1998. The CEN survey provides
information on 435 informal ICT standardization consortia. These consortia have been
selected based on transparent and objective selection criteria, which are stated above. The
survey by Andrew Updegrove1 provides information on 555 consortia, 276 of which are not
covered by the CEN survey. Both data sources indicate the tiering of membership, the
consortium scope, technical categories, industry sectors, IP policies and years of existence.
The number and identification of consortium members (including 20,000 independent entities
in more than 35,000 consortium memberships), was retrieved by an internet search using data
from historic homepages from the internet archive waybackmachine (http://archive.org). To
get a complete picture of the informal standard setting landscape, information from all
databases were matched. However, to guarantee database compliance, time series analysis
only uses information from fifteen editions of the ISSS CEN survey from 1998 until 2009.
Furthermore, not all consortia could be classified in their respective attributes, since some
consortia do not provide distinct information. Attributes such as industry sector, technical
category, business spectrum and IP policy were only assessed from the CEN survey data.
Finally, we build up a data panel over the time span of 1998-2009 to better assess
organizational effects on consortia survival. We apply one year periods and use consortia
termination as our event of failure.
1 http://www.consortiuminfo.org/

Empirical Analysis
77
4. Empirical Analysis
4.1 Consortia Characteristics and Attributes
In contrast to formal standard bodies where structures are fixed and default, the formation
process of informal consortia allows a variety of organizational choices. The four charts in
figure 1 give a vivid picture of informal ICT consortia characterized by member quantity,
membership levels, business spectrum and industry sector. The two former attributes reveal
information on specific member information such as quantity and member levels. The latter
two charts illustrate the sector and the scope of involvement.
Figure 1 Characteristics and attributes of informal ICT standards consortia
Membership Levels (n=267) Consortia Member Quantity (n= 278)
Business Spectrum (n=227) Industry Category / Sector (n=146)
16.3%
83.7%
Broad (16.3%)
Narrow (83.7%)
37.67%
17.12%
15.75%
8.22%
8.22% 6.85%
6.16%
Telecom (37.67%)
e-Commerce (17.12%)
Electronics (15.75%)
Advocacy (8.22%)
Multi-Industry (8.22%)
Life Science / Health (6.85%)
Manufactoring / Automotive
(6.16%)
40.6%
37.1%
20.1%
2.2%
<50 (40.6%)
50-100 (37.1%)
100-300 (20.1%)
300 + (2.2%)
23.6%
3.7%
2.6%
69.3%
0.7%
Flat (23.6%)
Individual (3.7%)
Revenue Based (2.6%)
Tiered (69.3%)
Employee Based
(0.7%)

Empirical Analysis
78
Most consortia have a considerably low amount of members, since 77.7% have less than 100
participants, 20.1% have 100-300 members and only 2.2% list more than 300 members. To
illustrate the scope of involvement in standard setting among consortia, the business spectrum
was classified into broad and narrow. Only 16.3% of the consortia follow a broad spectrum of
standardization, which is comparable to structures in formal standard bodies. The so called
“one purpose consortia” usually pursue only one standard or specification and their business
can therefore be classified as narrow (83.7%). These findings can be related to the quantity of
memberships. The data shows that most narrow consortia tend to have a lower amount of
members. A possible assumption is that this leads to more effective and flexible decision
making processes within consortia. Both attributes are distinct characteristics to differentiate
consortia from formal standard bodies, since the latter mostly follow a broad business
spectrum and tend to have a higher number of members. The evaluation of the CEN survey
further provides information on the primary and secondary industry sector where a particular
consortium is active in. These findings indicate a very heterogeneous picture of the consortia
landscape. In order to better frame these results, data was aggregated into seven categories.
Over a third of the consortia produce standards for the telecommunication industry (37.67%).
E-Commerce (17.2%) and electronics (15.75%) also make up one third of the consortia target
industry. Less ICT related industries such as advocacy, life-science, manufacturing and multi-
industry summarize the last third of consortia target industries. These results are in line with
most researchers’ assumptions that especially ICT industries rely on more flexible and quick
standard solutions developed by informal consortia.
The chart of membership levels illustrates the hierarchical structures of consortia. A
flat membership structure can only be found in 23.6% of the regarded consortia. The findings
indicate that informal standard setting is in many cases strategically dominated by market
power and revenue of commercial entities and vendors. Organization types and shares per
member level can be consulted in figure 2. The graph shows that 93.56% of the members are
vendors and other commercial entities, whereas universities and colleges account for only
2.52%, governmental entities for 0.17% and consumer groups for a stake of 3.75%.
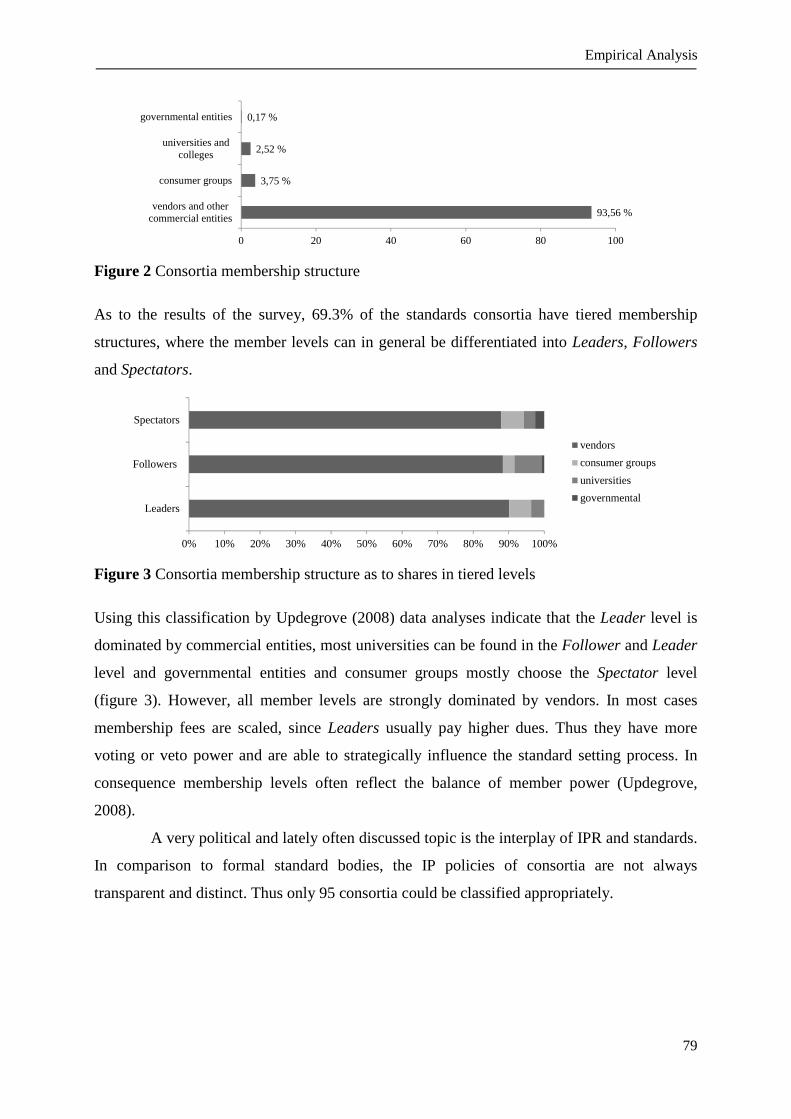
Empirical Analysis
79
Figure 2 Consortia membership structure
As to the results of the survey, 69.3% of the standards consortia have tiered membership
structures, where the member levels can in general be differentiated into Leaders, Followers
and Spectators.
Figure 3 Consortia membership structure as to shares in tiered levels
Using this classification by Updegrove (2008) data analyses indicate that the Leader level is
dominated by commercial entities, most universities can be found in the Follower and Leader
level and governmental entities and consumer groups mostly choose the Spectator level
(figure 3). However, all member levels are strongly dominated by vendors. In most cases
membership fees are scaled, since Leaders usually pay higher dues. Thus they have more
voting or veto power and are able to strategically influence the standard setting process. In
consequence membership levels often reflect the balance of member power (Updegrove,
2008).
A very political and lately often discussed topic is the interplay of IPR and standards.
In comparison to formal standard bodies, the IP policies of consortia are not always
transparent and distinct. Thus only 95 consortia could be classified appropriately.
93,56 %
3,75 %
2,52 %
0,17 %
0 20 40 60 80 100
vendors and othercommercial entities
consumer groups
universities andcolleges
governmental entities
0% 10% 20% 30% 40% 50% 60% 70% 80% 90% 100%
Leaders
Followers
Spectators
vendors
consumer groups
universities
governmental
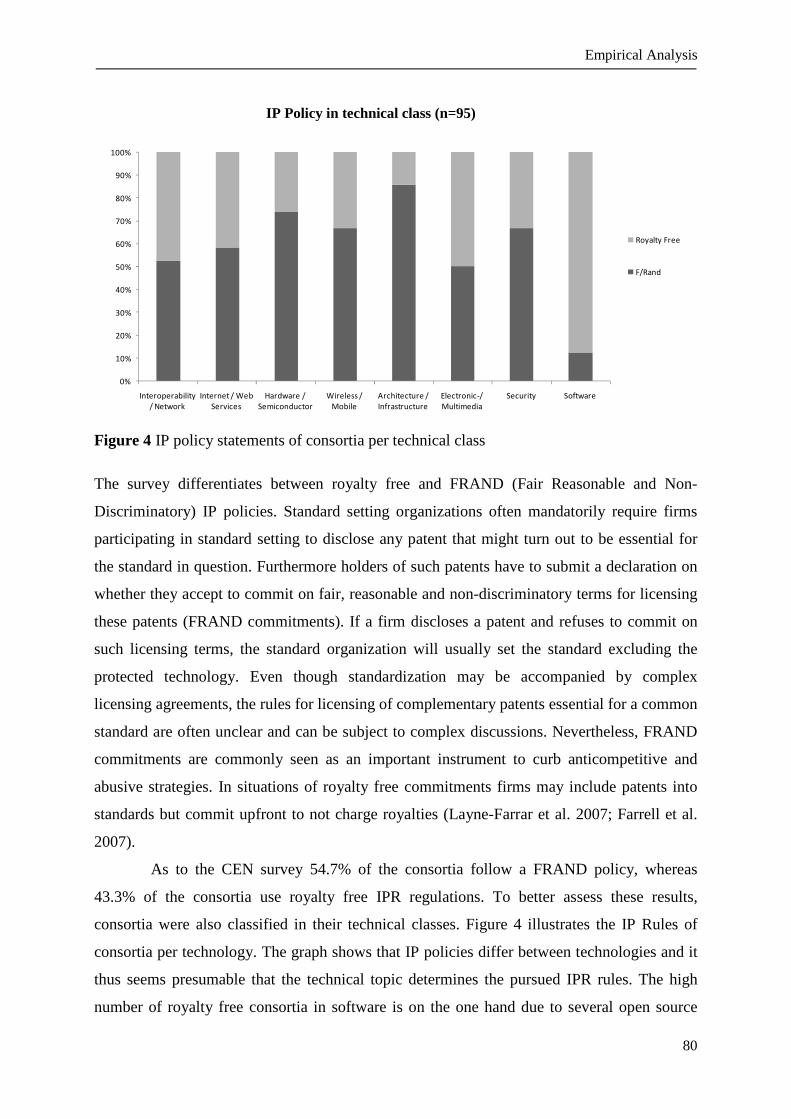
Empirical Analysis
80
Figure 4 IP policy statements of consortia per technical class
The survey differentiates between royalty free and FRAND (Fair Reasonable and Non-
Discriminatory) IP policies. Standard setting organizations often mandatorily require firms
participating in standard setting to disclose any patent that might turn out to be essential for
the standard in question. Furthermore holders of such patents have to submit a declaration on
whether they accept to commit on fair, reasonable and non-discriminatory terms for licensing
these patents (FRAND commitments). If a firm discloses a patent and refuses to commit on
such licensing terms, the standard organization will usually set the standard excluding the
protected technology. Even though standardization may be accompanied by complex
licensing agreements, the rules for licensing of complementary patents essential for a common
standard are often unclear and can be subject to complex discussions. Nevertheless, FRAND
commitments are commonly seen as an important instrument to curb anticompetitive and
abusive strategies. In situations of royalty free commitments firms may include patents into
standards but commit upfront to not charge royalties (Layne-Farrar et al. 2007; Farrell et al.
2007).
As to the CEN survey 54.7% of the consortia follow a FRAND policy, whereas
43.3% of the consortia use royalty free IPR regulations. To better assess these results,
consortia were also classified in their technical classes. Figure 4 illustrates the IP Rules of
consortia per technology. The graph shows that IP policies differ between technologies and it
thus seems presumable that the technical topic determines the pursued IPR rules. The high
number of royalty free consortia in software is on the one hand due to several open source
0%
10%
20%
30%
40%
50%
60%
70%
80%
90%
100%
Interoperability
/ Network
Internet / Web
Services
Hardware /
Semiconductor
Wireless /
Mobile
Architecture /
Infrastructure
Electronic-/
Multimedia
Security Software
Royalty Free
F/Rand
IP Policy in technical class (n=95)

Empirical Analysis
81
consortia which can be found within this class and can on the other hand be explained by the
fact that IPR on software is restricted in several countries. Explanations of other technological
classes are not always obvious and have to be assessed on a lower level of aggregation, since
IPR rules differ between specific products and companies involved. However, one has to
consider that F/RAND policies may also allow to license essential patents royalty free.
4.2 Consortia Development Phases
There are several articles that describe the development of standardization with respect to the
formation and evolution of informal consortia (Hawkins, 1999; Cargill 2002; Jakobs, 2003;
Updegrove 2008). However, there is yet no comprehensive quantitative approach to examine
the survival of standards consortia over time. Using the CEN survey editions between 1998
and 2009 the data assembles a current list of ICT consortia for every year and even twice a
year in 2001 and 2006. Figure 5 shows the quantity of consortia at the respective point of
time, also indicating the fluctuation rate, which is the sum of new and terminating consortia.
To consider consortia evolution with respect to the standardized technologies, figure 6
illustrates the consortia development assigned to the respective technology class.
Figure 5 Evolution of ICT standards consortia 1998-2009
Since the mid-1990ies the increasing formation of consortia can be explained by the rise of
the internet market, where the first peak of development is in June 2000, counting 123 new
consortia compared to July 1999. This period is characterized by strong standard battles
(Microsoft Explorer vs. Netscape Navigator) and the rise of future influential consortia in the
internet infrastructure such as the Internet Engineering Task Force (IETF) or the World Wide
0
50
100
150
200
250
300
350
1998
Oct
1999
Jul
2000
June
2001
May
2001
Sep
2002
Oct
2003
Nov
2004
Oct
2005
Jul
2006
Apr
2006
Nov
2007
Sep
2008
Sep
2009
Sep
Consortia Quantity (n= 435)
Quantity
Fluctuation
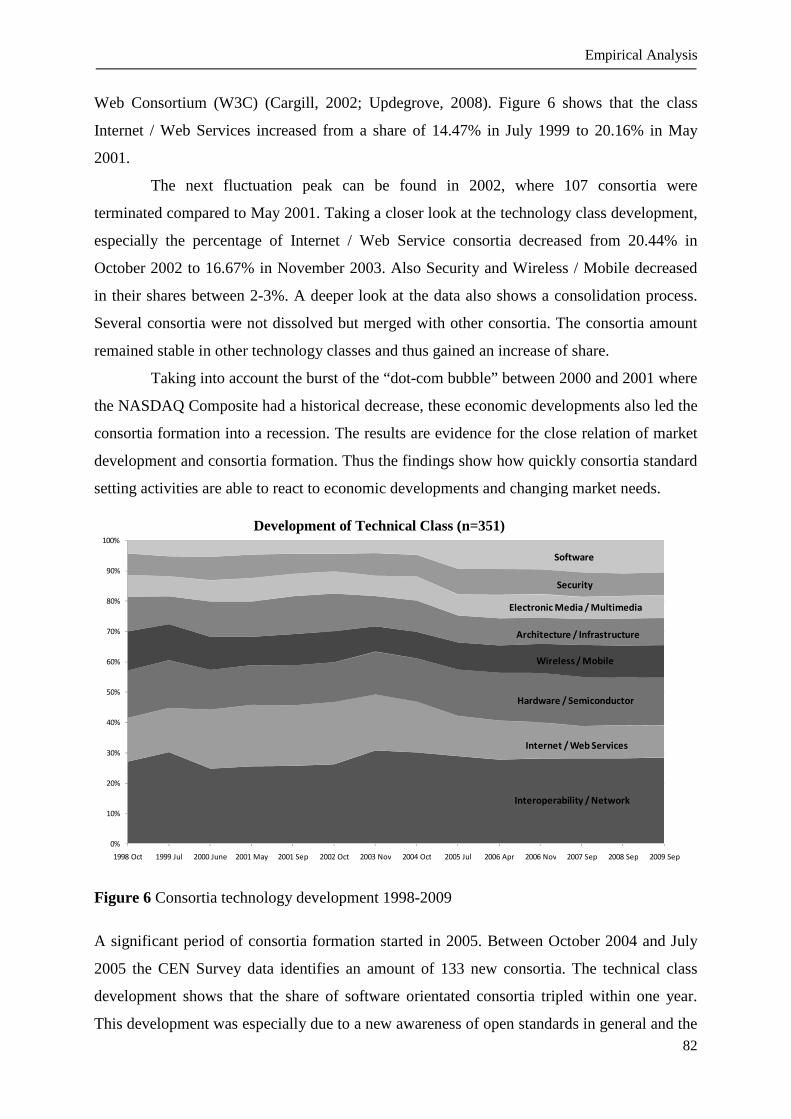
Empirical Analysis
82
Web Consortium (W3C) (Cargill, 2002; Updegrove, 2008). Figure 6 shows that the class
Internet / Web Services increased from a share of 14.47% in July 1999 to 20.16% in May
2001.
The next fluctuation peak can be found in 2002, where 107 consortia were
terminated compared to May 2001. Taking a closer look at the technology class development,
especially the percentage of Internet / Web Service consortia decreased from 20.44% in
October 2002 to 16.67% in November 2003. Also Security and Wireless / Mobile decreased
in their shares between 2-3%. A deeper look at the data also shows a consolidation process.
Several consortia were not dissolved but merged with other consortia. The consortia amount
remained stable in other technology classes and thus gained an increase of share.
Taking into account the burst of the “dot-com bubble” between 2000 and 2001 where
the NASDAQ Composite had a historical decrease, these economic developments also led the
consortia formation into a recession. The results are evidence for the close relation of market
development and consortia formation. Thus the findings show how quickly consortia standard
setting activities are able to react to economic developments and changing market needs.
Figure 6 Consortia technology development 1998-2009
A significant period of consortia formation started in 2005. Between October 2004 and July
2005 the CEN Survey data identifies an amount of 133 new consortia. The technical class
development shows that the share of software orientated consortia tripled within one year.
This development was especially due to a new awareness of open standards in general and the
Software
Interoperability / Network
Internet / Web Services
Hardware / Semiconductor
Wireless / Mobile
Architecture / Infrastructure
Electronic Media / Multimedia
Security
0%
10%
20%
30%
40%
50%
60%
70%
80%
90%
100%
1998 Oct 1999 Jul 2000 June 2001 May 2001 Sep 2002 Oct 2003 Nov 2004 Oct 2005 Jul 2006 Apr 2006 Nov 2007 Sep 2008 Sep 2009 Sep
Development of Technical Class (n=351)

Empirical Analysis
83
rise of the open source consortia in particular. One third of the software consortia can be
distinctly identified as open source projects. Except for Internet / Web Services a new
formation of consortia in all technical classes has taken place. This gives evidence for an
increasing broader appreciation of standard setting consortia.
Since the highest peak level in 2006, counting a quantity of 304 consortia, the
formation of new consortia remained on a constantly low level in the years to come. In
contrast between September 2006 and 2007 the second highest peak of consortia termination
took place, as 50 consortia ended their business or merged with others. Again these findings
can be linked to economic events, as the US subprime mortgage crises took place in 2007,
which later triggered the worldwide financial crises starting in 2008. The findings are able to
reflect the close connection of consortia development and industry performance. The timing
of consortia formation and termination again indicates that consortia formation is more
flexible and dynamic and thus able to react immediately to ups and downs of market
development.
4.3 Consortia Performance
In order to measure the performance of standards consortia we apply a survival analysis over
the whole sample of our survey. The survival or termination of consortia may be subject to
multiple occurrences. In our preceding section we have discussed consortia termination as a
result of technology or market shocks. Consortia termination may consequently be the
implication of technology obsolescence or economic recession. However, reasons for
dissolving a consortium may also be connected to organizational structures or performance.
In some cases the purpose to form a consortium is to standardize a specific
technology without the intention to continue development once the project is finalized.
Consortia termination would thus be the consequence of previous decisions. Furthermore,
consortia often operate similar to commercial corporations with permanent employees, a
budget, income streams and customers. If business goals cannot be achieved anymore
consortia may dissolve and go bankrupt. Since the purpose of standardization is always
connected to coordination of firms, disputes and discrepancies may be another reason why a
consortium is dissolved. We have discussed that consortia are special interest groups that
pursue a common goal. If these interests and goals diverge, collective activities may be ended.
In the following we seek to measure which consortia structures would survive longer
in technology and market conjunctures. We therefore calculate the Kaplan-Meier estimates of
the probability that a consortium terminates. Survival estimates are the likelihood that an

Empirical Analysis
84
observation will “survive” for a specific time. At each time in our analysis, only consortia that
have been observed are taken into account. The following statistics are therefore not subject to
truncation problems. Downward steps of the survival function represent failures. The y axis
denotes the percentage of consortia that survive over time as to years on the x axis.
Figure 7 Kaplan-Meier survival estimates of consortia termination by consortia focus and IP
policy
Results from figure 7 represent the survival functions of consortia as to consortia focus and IP
policy. The left graph shows that standards consortia which pursue a broad focus in their
standards projects survive respectively longer compared to narrow purpose consortia. Results
indicate that after 10 years almost 50% of narrow focused consortia are terminated. This
finding may confirm the notion that consortia are in some cases formed to solve a very
specific problem over a limited period of time. Survival of these so called “one purpose
consortia” would thus be subject to planned termination. However one could also argue that
consortia which are able to extend their business focus to additional standards projects are
more successful and thus survive respectively longer.
In the right graph in figure 7, we estimate whether the differences of IP polices have
an influence on consortia survival. To make results of the Kaplan-Meier survival test visible
we changed the scale of our y axis. However, survival developments seem to show no
significant differences between the two licensing schemes. Only in periods after seven years
consortia with a royalty free policy seem to survive longer, while the survival rate decreases
after ten years to the same level as FRAND policy consortia. These developments may
furthermore be connected to the technology that is developed (figure 4). We argued earlier
that FRAND commitments also include royalty free agreements. Yet analysis is far from
conclusive to explain the effects of IP policies on the survival of consortia.

Empirical Analysis
85
Consortia size is a crucial factor that influences both; consortia coordination among
members and market power. The costs of coordination increase with the number of members.
Large groups may inhibit coordination failures such as “free riding” or “war of attrition”
(Olson, 1971; Farrell and Simcoe, 2012). This may result in disputes and in cases of hardship
lead to consortia termination. In comparison, we argued that the success of a standard is
connected to a large group of companies that sponsor the standardized technology (David and
Greenstein, 1990; Axelrod et al., 1995). Figure 8 compares five categories of consortia
membership quantity and observes the survival curve over time. Again we adjusted the scale
of survival rates in our y axis to make results visible. Large consortia with 200-300 and 300-
1000 members survive the longest over the years. Rather small consortia in comparison <50
and 100-200 terminate in earlier periods. These results support the argument that consortia
which gather a larger number of industry players are more successful and seem to operate
significantly longer than small consortia. However, we have to keep in mind that narrow “one
purpose consortia” with a planned termination are considerably smaller than others.
Figure 8 Kaplan-Meier survival estimates of consortia termination by membership size
Consortia membership may influence termination not only by size but also by membership
structures. We conduct another survival analysis and estimate if different membership
arrangements influence survival rates. Figure 9 illustrates that for consortia with individual
membership structures termination is more likely compared to others. Individual members
participate not as a corporation but as individual persons. Members may still serve the interest
of a group or company but participate in meetings and conferences individually. These
consortia are often very technical and seek to solve specific problems which may not be
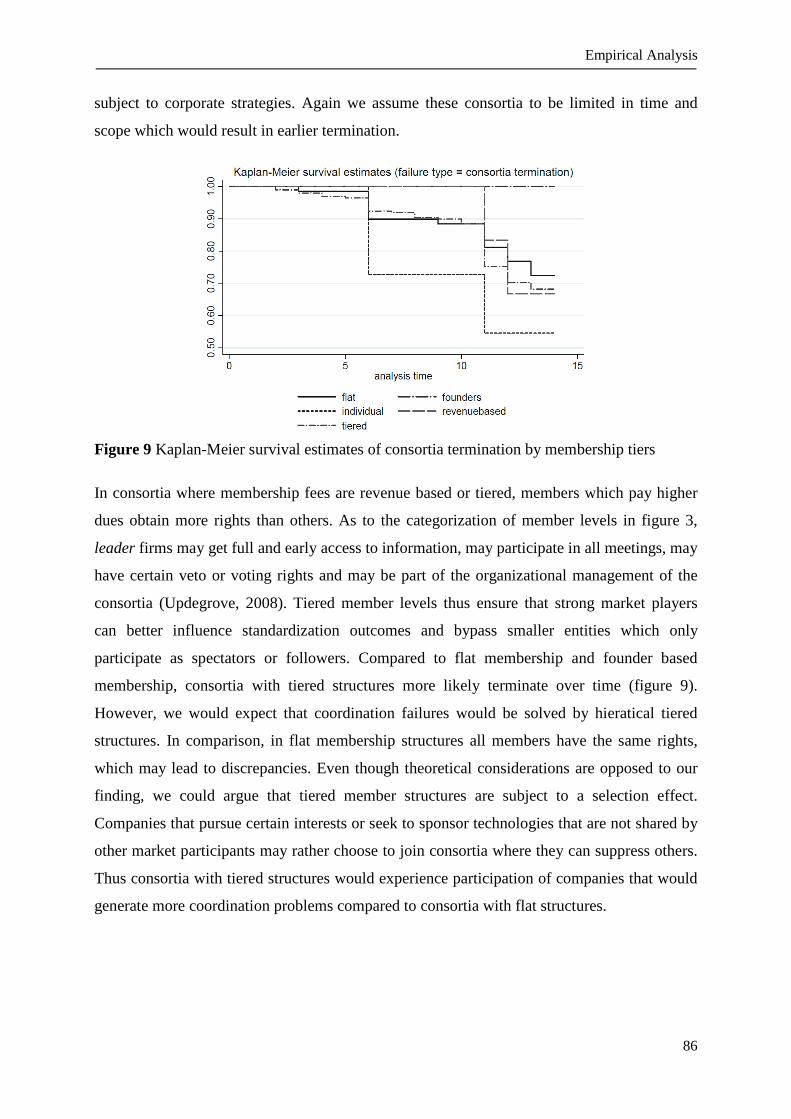
Empirical Analysis
86
subject to corporate strategies. Again we assume these consortia to be limited in time and
scope which would result in earlier termination.
Figure 9 Kaplan-Meier survival estimates of consortia termination by membership tiers
In consortia where membership fees are revenue based or tiered, members which pay higher
dues obtain more rights than others. As to the categorization of member levels in figure 3,
leader firms may get full and early access to information, may participate in all meetings, may
have certain veto or voting rights and may be part of the organizational management of the
consortia (Updegrove, 2008). Tiered member levels thus ensure that strong market players
can better influence standardization outcomes and bypass smaller entities which only
participate as spectators or followers. Compared to flat membership and founder based
membership, consortia with tiered structures more likely terminate over time (figure 9).
However, we would expect that coordination failures would be solved by hieratical tiered
structures. In comparison, in flat membership structures all members have the same rights,
which may lead to discrepancies. Even though theoretical considerations are opposed to our
finding, we could argue that tiered member structures are subject to a selection effect.
Companies that pursue certain interests or seek to sponsor technologies that are not shared by
other market participants may rather choose to join consortia where they can suppress others.
Thus consortia with tiered structures would experience participation of companies that would
generate more coordination problems compared to consortia with flat structures.

Conclusion and Discussion
87
5. Conclusion and Discussion
This paper intends to give a broad overview of standards consortia, its characteristics,
organizational structures, policies and developments in the past ten years. Even though
empirical analysis is rather descriptive, results already introduce coherences in terms of the
consortia features and survival. Several characteristics differentiate the consortia phenomenon
from other standard setting activities. By combining the assessed consortia information,
relationships are revealed to deliver a more transparent picture of the consortia landscape. The
stereotypical consortium could hence be described as having usually less than 100 members,
following only one purpose of business, being hierarchical in its decision making structures
and due to tiered membership fees, is often dominated by vendors and commercial entities.
The stated IP policy is strongly connected to the produced technology. In contrast to formal
standard bodies, consortia are very flexible and react to market developments. This either
results in a formation as well as termination of businesses or mergers with other consortia.
Involvement in consortia standard setting enables members to gain quick and flexible
participation to influence the standardization process. Especially solvent vendors and
commercial entities can use their strong membership positions to strategically direct a certain
standard or specification.
This article further estimates survival rates to assess which consortia are successful
and stable and how consortia features correlate with termination and continuity of business. In
consideration of theoretical implications we show that especially structures of member
coordination as well as focus and positioning on markets determines consortia survival over
time. While termination may be planned for some consortia, others may close their business
due to problems that can be connected to a consortium’s organizational approach. We show
that larger consortia survive significantly longer compared to smaller consortia. However,
when membership levels are tiered termination is more likely. Furthermore a narrow focus on
certain technologies also leads to earlier termination, while the adopted IP policy seems to
have no effect.

References
88
References
Anderson, P. (2008). Evaluation of Ten Standard Setting Organizations with Regard to Open
Standards, Prepared for I T - o g Telestyrelsen, IDC Special Study.
Axelrod, R., S. Bennett, E. Bruderer, W. Mitchell, R. Thomas. 1995. Coalition formation in
standard-setting alliances. Management Sci. 41(9) 1493–1508.
Baron, J., Ménière Y., Pohlmann, T. (2011) "R&D Coordination for Standardization: the Role
of Consortia", Cerna Working Paper.
Blind, K.; Gauch, S. (2008).Trends in ICT standards in European standardization bodies and
standards consortia. Telecommunication Policy, 32, 503–513.
Blind, K.; Gauch, S.; Hawkins, R. (2010): How stakeholders view the impacts of international
ICT standards, Telecommunications Policy, 34, No.3, 162-174.
Bunduchi, R.; Graham, I.; Smart, A.; Williams, R. (2008). Homogeneity and heterogeneity in
information technology private standard settings – the institutional account, Technology
Analysis & Strategic Management Vol. 20, No. 4, July 2008, 389–407.
Cargill, C.; Weiss, M. (1992). Consortia in the Standards Development Process, Journal of the
American Society for Information Science, Volume 43 Issue 8, 559 – 565.
Cargill, C. (2002). Intellectual Property Rights and Standards Setting Organizations: An
Overview of failed evolution, A Report Issued By the U.S. Department of Justice and the
Federal Trade Commission, March 2002.
CEN/ISSS (2009). CEN/ISSS survey of standards-related fora and consortia, 15th edition,
Brussels, October 2009.
Coulon, F. (2004). Proprietary standardisation in consortia –the case of the Symbian alliance,
Research Design 9th EURAS Workshop on Standardisation, May 13-14th, 2004.
David, P. A., Greenstein, S., 1990. The economics of compatibility standards: An introduction to recent research. Economics of Innovation and New Technology 1, 3-42.
David, P. A. (1996). Formal standard-setting for global telecommunications and information
services. Telecommunications Policy, 20, 789–815.
Delcamp, H., Leiponen, A., 2012. Innovating Standards Through Informal Consortia: The
Case of Wireless Telecommunications. NBERWorking Paper Series.

References
89
Egyedi, T.M. (2001), Beyond Consortia, Beyond Standardisation? New Case Material and
Policy Threads. Final Report for the European Commission. Delft. The Netherlands.
Farrell, Joseph; Hayes, John; Shapiro, Carl; Sullivan, Theresa (2007): Standard Setting,
Patents, and Hold-Up; 74 Antitrust L.J. 603.
Farrell J., Simcoe, T., 2012. Choosing the Rules for Consensus Standardization. Unpublished
manuscript. Electronic copy available at: http://ssrn.com/abstract=1396330.
Grotnes, E. (2009). Standardization as open innovation: two cases from the mobile industry,
Information Technology & People, Volume 22, Number 4, 367-381.
Hawkins, R. (1999). The rise of consortia in the information and communication industries:
emerging implications for policy. Telecommunication Policy, 23, 159–173.
Jakobs, K. (2003). Information Technology Standards, Standards Setting and Standards
Research. Presented at: Stanhope Centers Roundtable on systematic barriers to the
inclusion of a public interest voice in the design of ICT, Cotswolds Conference, December
2003.
Jakobs, K. (2004). ICT Standards Development — Finding the Best Platform, Enterprise
Interoperability, Springer London, 543-552.
Kindleberger, C. P. (1983). Standards as public, collective, and private goods. Kyklos, 36, 377-397.
Koenig, R. (2008). New ways of standard-setting in technology-driven industries: the case of
automotive electronics in Japan and Germany, DRUID-DIME Academy Winter 2008 PhD
Conference.
Layne-Farrar, Anne; Padilla, A. Jorge; Schmalensee, Richard (2007): Pricing Patents for
Licensing in Standard-Setting Organizations: Making Sense of Fraud Commitments; 74
Antitrust Law Journal 671.
Leiponen, A., .2008. Competing Through Cooperation: The Organization of Standard Setting
in Wireless Telecommunications. Management Science 54-11,1904-1919.
McGuire, M.. 1972. Private Good Clubs and Public Good Clubs: Economic Models of Group
Formation. The Swedish Journal of Economics. Vol. 74, No. 1, Economics of Location:
Theory and Policy Aspects, pp. 84-99.
Olson, M. (1971). The logic of collective action: Public goods and the theory of groups.
Cambridge, MA: Harvard University Press.
References
90
Updegrove, A. (1995). Consortia and the Role of the Government in Standard Setting, in B.
Kahin & J. Abbate (Eds.). Standards Policy for Information Infrastructure, Cambridge:
MIT Press, 321-348.
Updegrove, A. (2008). The Essential Guide to Standards, Handbook of Consortium Info in:
[http://www.consortiuminfo.org].
91
Joint innovation in ICT standards: How consortia drive the volume of patent filings
Abstract
The development of formal ICT standards is a loose form of collaborative innovation: firms
first develop rival technologies, some of which are then eventually selected in the standard.
Against this background, firms often use informal consortia to define a clearer technology
roadmap ahead of the formal standard setting process. The paper aims to assess how such
consortia influence the volume of patents filed around standards, and whether this is efficient.
We show that their effect actually depends on the strength of firms’ incentives to develop the
standard. Consortium membership triggers a higher number of patent files when insufficient
rewards for essential patents induce underinvestment in the standard. This effect is
necessarily pro-efficient. In situations where excessive rewards induce patent races,
consortium membership only moderately increases or even reduces their volume of patents. At
least in the latter case, the effect of consortia membership is also pro-efficient.

92
Contents
1. Introduction ....................................................................................................................... 93
2. Theoretical Framework ...................................................................................................... 95
2.1 Value of the standard ...................................................................................................... 95
2.2 R&D investments ............................................................................................................ 96
2.3 Public good or patent race ............................................................................................... 97
2.4 Efficiency of consortium membership ............................................................................ 99
3. Empirical Analysis .......................................................................................................... 101
3.1 Data and indicators ....................................................................................................... 102
3.1.1 Mathcing between informal consortia and formal standards .................................. 103
3.1.2 Standard specific patents ........................................................................................ 103
3.1.3 Public goods and patent race patterns ..................................................................... 104
3.1 Descriptive Statistics ..................................................................................................... 104
3.1.1 Pairwise correlations ............................................................................................... 104
3.1.2 Difference in means ................................................................................................ 105
3.3 Multivareat Analysis ..................................................................................................... 106
3.3.1 Estimation methodology ......................................................................................... 106
3.3.2 Estimation model 1-4 .............................................................................................. 107
3.3.3 Robustness .............................................................................................................. 109
3.3.4 Effect of consortium member share model 6-8 ...................................................... 110
3.3.5 Net effects ............................................................................................................... 112
4. Conclusion ....................................................................................................................... 112
References .............................................................................................................................. 114
APPENDIX ............................................................................................................................ 116
Appendix 1 Summary of relevant variables ........................................................................ 119
Appendix 2 Linkages between standards and informal consortia ...................................... 120
Appendix 3 Empirical Methodology for measuring standard-related R&D ....................... 122
Appendix 4 Empirical Methodology for sorting standards into cases of over- and underinvestment .................................................................................................................. 123
Appendix 5 Robustness check substituting pre-sample means for fixed effects ................ 124

Introduction
93
1. Introduction
Over the past twenty years, the number of essential patents claimed on ICT standards has
strongly increased (Simcoe, 2007). This evolution firstly denotes the importance of these
patents for firms: they can generate substantial licensing revenues, and can be used as
bargaining chips to obtain freedom to operate on rivals’ patent portfolios (Rysman & Simcoe,
2008). Another explanation lies in the growing complexity of ICT standards. As compared
with other sectors, standardization in ICT has indeed evolved from the definition of mere
specifications enabling interoperability to the joint development of large technology platforms
including critical technologies. Consequently, they tend to embody a growing number of
patented components.
While the conditions for licensing essential patents have been widely discussed (see
e.g., Shapiro, 2001; Lerner & Tirole, 2004; Layne-Farrar & Lerner, 2011), the peculiar type of
collaborative innovation they proceed from has received less attention so far. Formal ICT
standards are developed in standard setting organizations (SSOs)–such as ETSI
(telecommunications) or IEEE (electronics)–that are open to a broad range of stakeholders.
Besides the large number of participants, the originality of this process is that it does not
involve any ex ante contracting between the firms preparing to develop a standard (Ganglmair
& Tarentino, 2011). The choice of standard specifications rather takes place ex post in ad hoc
working groups, based on the merit of rival technologies available to solve a given technical
problem. Firms thus compete in R&D ahead of the working group meetings, thereby
generating a large volume of patented innovations of which only a fraction will eventually
become essential.
This formal process generates costly R&D cost duplications and delays due to vested
interests (Farrell & Simcoe, 2012; Simcoe, 2012). Firms therefore increasingly rely on
informal consortia to take the lead in the standard setting process (Cargill, 2001; Lerner &
Tirole, 2006). Such consortia are fora wherein a group of firms seek to agree on a common
design that they will jointly push as a standard. While some of them substitute for the lack of
formal SDOs and issue their own standards (e.g., Blu-Ray alliance or W3C for web
protocols), most consortia actually accompany formal standardization . They are then a means
for members to better focus their R&D investments on a common roadmap (Delcamp &
Leiponen, 2012), thereby saving useless development costs while enhancing their chances to
obtain essential patents (Pohlmann and Blind, 2012). Leiponen (2008) furthermore shows that
participation in a consortium improves the capacity of firms to influence the technological

Introduction
94
decisions taken at the formal SSO.
This paper aims to assess how such consortia influence the volume of patents filed
around formal standards, and whether this is efficient. We show that their effect actually
depends on the strength of firms’ incentives to develop the standard. Consortium membership
induces a higher number of patent files in situations where insufficient rewards for essential
patents induce underinvestment in the standard. This effect is necessarily pro-efficient. In
situations where excessive rewards induce patent races, consortium membership only
moderately increases or even reduces their volume of patents. At least in the latter case, the
effect of consortia membership is also pro-efficient.
The implications of these results are twofold. They first highlight the cost entailed by
the loose coordination of R&D investments in formal SSOs. In this context, they also suggest
that the creation of informal consortia can be an efficient way to supplement formal SSOs.
Consortia are indeed an effective means to unlock the development of standards when firms
have insufficient incentives to contribute technology, while they do not significantly amplify
the race for essential patents when these incentives are strong.
The paper proceeds in two steps. We first develop a theoretical model to analyze the
efficiency of distributed innovation into a standard. We then assess empirically the actual
impact of consortia over a large panel of ICT standards.
Our model allows for some degree of rivalry between the firms’ innovations, so that
only a fraction of their patents eventually become essential. We firstly establish that the level
and efficiency of firms’ investments depends on the share of the standard’s value that accrues
to owners of essential patents. A public good pattern involving sub-optimal investment
prevails in equilibrium when the licensing revenue of essential patents holders is not sufficient
to cover their R&D costs. Conversely, firms engage in a wasteful patent race when licensing
profits exceed total R&D costs.
Against this background, we introduce consortia as a means to mitigate technology
rivalry between member firms. By joining a consortium, a firm may thus deflate its volume of
patents by cutting irrelevant R&D investments, or inflating it by seeking to develop more
relevant innovations. We show that consortium membership is always pro-efficient if the first
effect dominates. A patent-inflating consortium is also pro-efficient in a public good
equilibrium, but it may actually harm efficiency in a patent race equilibrium if it induces an
excessive inflation of patents around the standard.
Drawing on this framework, we use a large panel of ICT standards to assess the actual
effect of consortia empirically, respectively for standards entailing over- and

Theoretical Framework
95
underinvestment. For this purpose, we have developed an original dataset of standard-related
patent applications at firm level, which we use as a proxy for firms’ R&D investments. We
also use information on the participation of pure R&D firms in the standard development
process in order to identify over-investment patterns. We find that firms entering a consortium
strongly increase their patent files in most of the cases. This is however not true for standards
featuring an over-investment pattern: in these cases, consortia membership has a smaller, and
in some cases negative effect on firms’ patent applications. These results thus suggest that
consortia tend to enhance the efficiency of innovation in the development of standards.
The remainder of this article is organized as follows. We present the theoretical model
and its implications in Section 2. Section 3 discusses the empirical strategy, the database and
econometric results. We conclude in Section 4.
2. Theoretical Framework
2.1 Value of the standard
We consider a set N of n firms that take part in the development of a standard. The standard
embodies essential patents contributed by the firms, and its implementation is
expected to generate aggregate profits v ( )x in the industry. These profits increase with the
amount of embarked technology, but with decreasing returns: v' ( )x >0 and v'' ( )x <01.
There are two ways in which firms can derive revenues from the standard. Patent holders
firstly appropriate a share of the standard’s value through the royalties they charge
to implementers of the standards. Parameter r can thus be thought of as reflecting the IP
licensing policy of the standard setting organization (r=0 denoting a royalty free policy). In
line with common practices regarding ICT standard, we assume that the share of the licensing
revenues that accrues to firm i ∈ N is proportional to its share of the essential patents .
The remaining part of the revenues, ( )1−r v ( )x , accrue to the firms that implement
the standard in their products. Let si denote firm i’s share of these revenues, which can be
thought of as its share of the market for standard-compliant products. We assume that all
firms with si>0 are involved in the standard setting process (so that ). Other firms
(sj=0) may also contribute patented inventions provided they have appropriate R&D
1These assumptions account for various possible specifications. The standard’s value v ( ). can in particular reflect a dynamic innovation process, if we define it as the expected outcome λxπ/ ( )δ+λx of a Poisson process with hit rate λx, discount rate δ, and aggregate profits π.
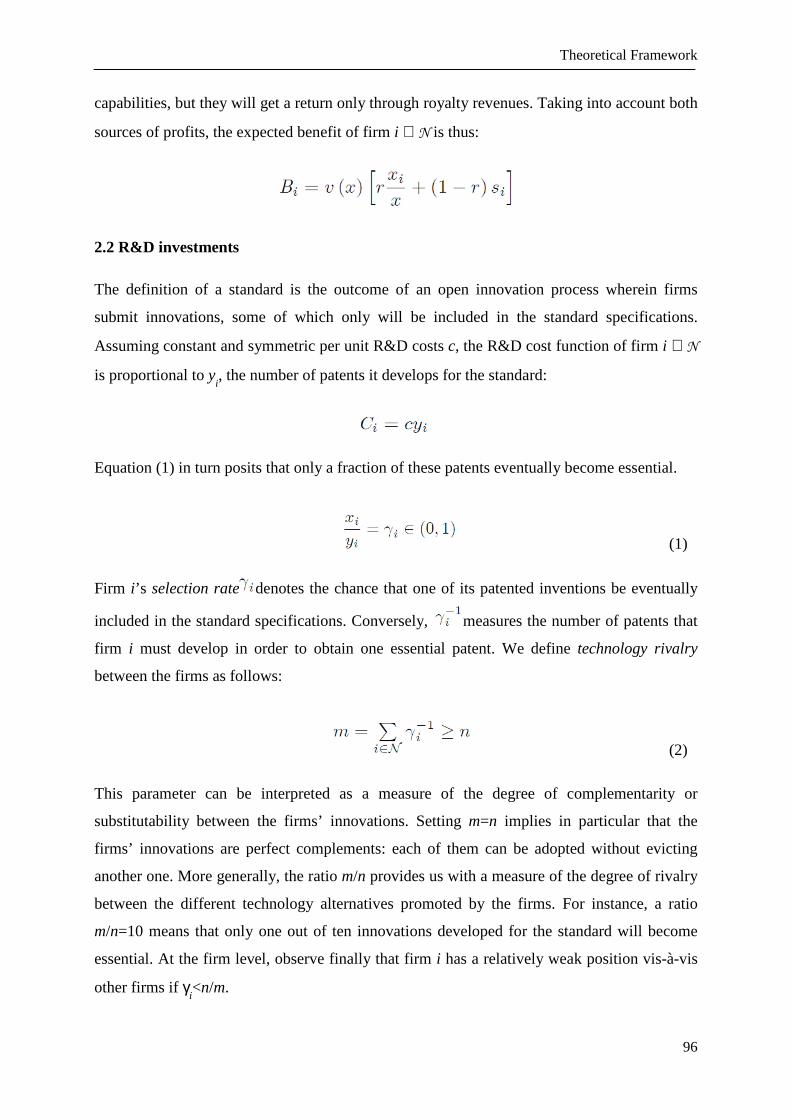
Theoretical Framework
96
capabilities, but they will get a return only through royalty revenues. Taking into account both
sources of profits, the expected benefit of firm i ∈ N is thus:
2.2 R&D investments
The definition of a standard is the outcome of an open innovation process wherein firms
submit innovations, some of which only will be included in the standard specifications.
Assuming constant and symmetric per unit R&D costs c, the R&D cost function of firm i ∈ N
is proportional to yi, the number of patents it develops for the standard:
Equation (1) in turn posits that only a fraction of these patents eventually become essential.
(1)
Firm i’s selection rate denotes the chance that one of its patented inventions be eventually
included in the standard specifications. Conversely, measures the number of patents that
firm i must develop in order to obtain one essential patent. We define technology rivalry
between the firms as follows:
(2)
This parameter can be interpreted as a measure of the degree of complementarity or
substitutability between the firms’ innovations. Setting m=n implies in particular that the
firms’ innovations are perfect complements: each of them can be adopted without evicting
another one. More generally, the ratio m/n provides us with a measure of the degree of rivalry
between the different technology alternatives promoted by the firms. For instance, a ratio
m/n=10 means that only one out of ten innovations developed for the standard will become
essential. At the firm level, observe finally that firm i has a relatively weak position vis-à-vis
other firms if γi<n/m.
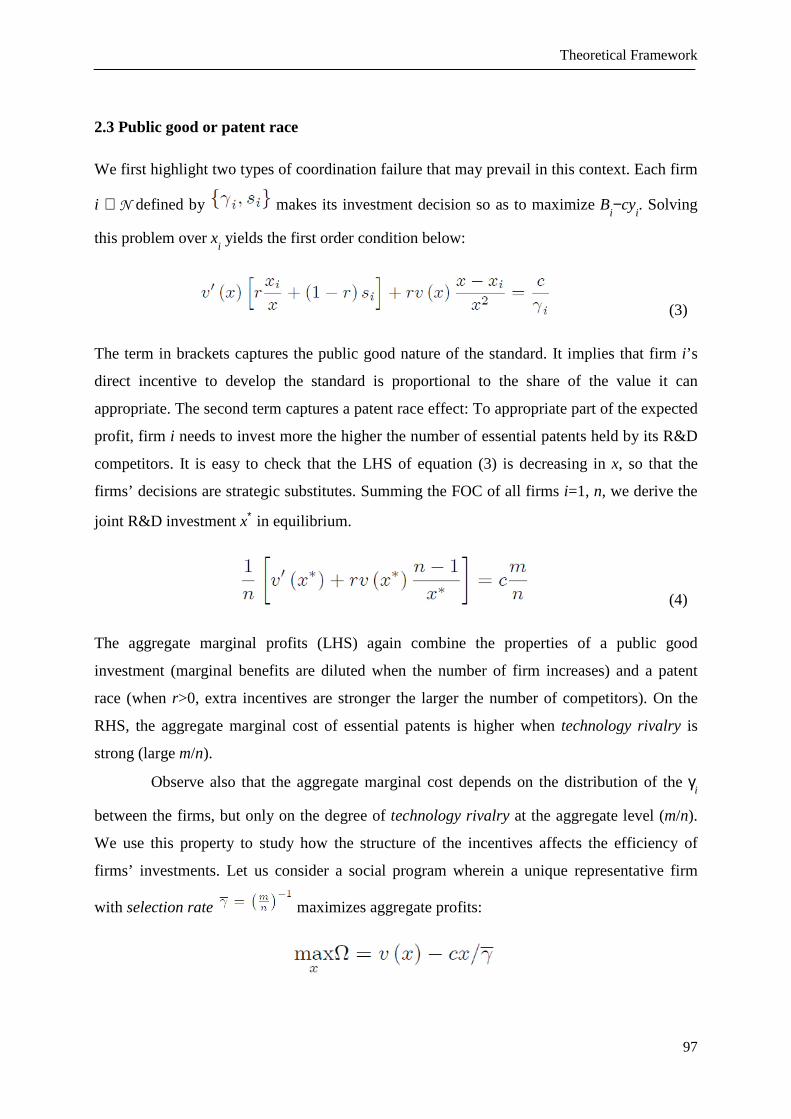
Theoretical Framework
97
2.3 Public good or patent race
We first highlight two types of coordination failure that may prevail in this context. Each firm
i ∈ N defined by makes its investment decision so as to maximize Bi−cy
i. Solving
this problem over xi yields the first order condition below:
(3)
The term in brackets captures the public good nature of the standard. It implies that firm i’s
direct incentive to develop the standard is proportional to the share of the value it can
appropriate. The second term captures a patent race effect: To appropriate part of the expected
profit, firm i needs to invest more the higher the number of essential patents held by its R&D
competitors. It is easy to check that the LHS of equation (3) is decreasing in x, so that the
firms’ decisions are strategic substitutes. Summing the FOC of all firms i=1, n, we derive the
joint R&D investment x∗ in equilibrium.
(4)
The aggregate marginal profits (LHS) again combine the properties of a public good
investment (marginal benefits are diluted when the number of firm increases) and a patent
race (when r>0, extra incentives are stronger the larger the number of competitors). On the
RHS, the aggregate marginal cost of essential patents is higher when technology rivalry is
strong (large m/n).
Observe also that the aggregate marginal cost depends on the distribution of the γi
between the firms, but only on the degree of technology rivalry at the aggregate level (m/n).
We use this property to study how the structure of the incentives affects the efficiency of
firms’ investments. Let us consider a social program wherein a unique representative firm
with selection rate maximizes aggregate profits:

Theoretical Framework
98
Comparing the outcome of this program with the equilibrium outcome, we can establish the
following result.
Proposition 1 Aggregate investment in equilibrium is efficient if the licensing revenues
rv ( )x∗ equals the total R&D cost . Firms invest in excess if licensing revenues exceed
total cost and they underinvest in the reverse case.
Firms’ incentives to innovate can induce either too much (patent race pattern) or too little
(public good pattern) investment. Which one prevails in equilibrium depends on the balance
between total licensing profit and the total R&D cost at equilibrium. Firms engage a patent
race if
(5)
Intuitively, a patent race takes place when licensing is profitable per se, so that firms will
compete in R&D in order to preempt the essential patents. Conversely, the public good
equilibrium emerges when firms’ incentives are primarily driven by the possibility to use the
standard. Observe that condition (5) also implies that the participation of a pure R&D firm
i (si=0) with average success rate is profitable only in a patent race equilibrium:
(6)
Corollary 2 The participation of pure R&D firms signals a patent race pattern in
equilibrium.
We will use this result in the empirical section to infer the existence of a patent race
equilibrium from the participation of pure R&D firms. We can finally observe that the number
of firms does not determine the type of equilibrium that prevails, but its magnitude. Hence
Proposition 1 and its corollary are robust to allowing free entry of firms in the standardization
game.
Corollary 3 The inefficiency pattern prevailing in equilibrium does not depend on the number
of firms, and is thus robust to free entry.

Theoretical Framework
99
2.4 Efficiency of consortium membership
Recall that the consortia we are interested in do not involve any formal contracting or joint
R&D decisions. They rather function as fora wherein participating firms seek to agree on a
mutually acceptable roadmap for specifications that they will jointly push in the SDO.
Accordingly, we posit that consortium members can better focus their R&D effort, thereby
saving useless investments and enhancing their chances of obtaining essential patents.
Assuming that a subset of firms K ⊂ N have created a consortium to support the standard
setting process, members thus benefit from a higher selection rate2:
where .
We focus on the consequences of firm k’s decision to join the consortium3. Formally,
this firstly translates into a positive shock on the new member’s selection rate (dγk>0). Since
firm k can better screen irrelevant innovation opportunities, this in turn induces a fall in the
degree technology rivalry at the aggregate level: . It thus follows directly
from (4) that the number of essential patents embodied in the standard increases in
equilibrium. Since the firm’s decisions are strategic substitutes, it is moreover clear from (3)
that firm k develops more essential patents while the other firms react by developing less of
them. Lemma 4 summarizes these results.
Lemma 4 Joining the consortium enables the new member to develop more essential patents
in equilibrium, while the other firms develop less essential patents. The net effect is positive,
and thus induces an increase of the equilibrium value of the standard v ( )x∗ .
This result does not necessarily imply that an enlarged consortium coalition is efficient, since
it does not take into account the induced variation of firms’ R&D costs. Indeed, deriving
firms’ aggregate profits with γk and rearranging makes it possible
to highlight the following three effects:
2We implicitely assume here that the size of the consortium coalition does not change the success rate of former members or consortium outsiders. In other words, the only effect of consortium membership is a better access to information of future specifications. The entry of a new member in the coalition nevertheless indirectly affects former members and outsiders through the new member’s stronger ability to preempt essential patents in the standard. 3In practice, firms have to pay significant membership fees to join consortia, and therefore decide to do so only if they have significant stakes in the standard. The benefits in terms of information and influence strongly depend on idiosyncratic factors such as the degree of compatibility between the firms’ technology profiles and strategic agenda.

Theoretical Framework
100
(7)
The first effect corresponds to R&D costs savings induced by firm k’s ability to reduce the
volume of non-essential patents (A). It is clearly positive. The second one is the net
(cost/benefit) value of adding new essential patents to the standard (B). It is clear from the
term in brackets that it is positive in a public good equilibrium. Indeed new patents can then
mitigate firms’ lack of investment in the standard. By contrast, developing more essential
patents reduces joint profits in a patent race equilibrium. Finally, the third effect captures the
cost or benefit of reallocating the development of essential patents between the firms (C). Its
sign may be positive or negative, depending on the selection rate of firm k as compared with
the other firms. Lemma 5 summarizes these findings.
Lemma 5 A firm’s entry in the consortium deflates the volume of non-essential patents, which
is clearly efficient. By contrast, the inflated volume of essential patents may be inefficient if i)
a patent race pattern prevails in equilibrium and/or ii) it entails a reallocation of R&D effort
from efficient to inefficient firms.
In order to carry further the analysis, we now focus on the direct effects of firm k’s patenting
strategy on joint profits, aside from the other firms’ reactions4. We are especially interested in
relating joint profits with the (empirically observable) total volume of patents filed by firm k.
Assuming that firm k has average selection rate , we can establish that
(8)
is the variation of the total number of patents filed by firm k (that is, the difference between
the volumes of spared patents and new essential patents) and . Since
∆ > 0, condition (8) clearly holds if the total volume of firm k’s patents is deflated. This is
4This can also be interpreted as an approximation of the full effects when the reactions of the other firms are negligible. We will see in the next section that this interpretation is actually supported by empirical evidence.

Empirical Analysis
101
quite intuitive, since firm k then develops more essential patents and saves at the same time
the R&D cost of an even larger volume of useless patents.
The effect of firm k’s move is more ambiguous if joining the standard has a patent
inflating effect. Indeed the benefit of enhancing the standard’s value must then be balanced
with the cost of a larger volume of patents. As stated in Proposition 6, the new member still
invests more efficiently provided the public good pattern prevails in equilibrium. Indeed, it
thereby provides more of the missing essential patents, and it does so at a lower cost thanks to
consortium membership. By contrast, inflated volume of patents filed by the new member
may harm efficiency in a patent race pattern, unless the volume of extra non-essential patents
remains sufficiently small to be compensated by the benefit of new essential patents.
Proposition 6 Assume that a firm with average success rate joins the consortium:
• A deflated volume of patents filed by the new member is efficient whatever the
inefficiency pattern prevailing in equilibrium.
• An inflated volume of patents filed by the new member is efficient in a public good
equilibrium. It becomes inefficient in a patent race equilibrium when it exceeds a
positive threshold .
Proof. Observe also that , which is the condition for the
public good pattern to prevail in equilibrium. Since , it directly follows that
condition (8) is also verified in a public good equilibrium when firm k inflates its volume of
patents. By contrast, the patent race pattern prevails when 0 < ∆ < 1. Hence joint profits can
increase only if the inflation of firm k’s patents remains moderate, that is if
. Otherwise, a strong inflating effect induces a fall of joint profits.
3. Empirical Analysis
This section in turn presents an empirical analysis of patent filings around a large panel of
ICT standards. Our purpose is to assess whether joining a consortium changes the volume of
patents filed by firms involved in standard development, and what is the direction of this
change. Drawing on the results of our theoretical analysis, we assess this effect separately for
standards corresponding respectively to a public good or patent race pattern.

Empirical Analysis
102
3.1 Data and indicators
Our empirical analysis draws on a comprehensive dataset of technological standards including
essential patents5. Our sample includes all ICT standards issued between 1992 and 2009 by
one of the major formal SSOs which operate on an international level6. Since we aim to focus
on the interaction between formal standardization and companion consortia, we exclude
standards that are exclusively developed by informal standards consortia (e.g. BluRay).
We furthermore restrict the analysis to standards including essential patents of at
least two different companies, thereby limiting the sample to 578 standards. Companies that
own IPRs which are essential to a standard provide this information to the respective SSO.
We downloaded these patent declarations at the websites of the above-mentioned SSOs in
March 2010. From the PERINORM7 database we retrieve information on the date of first
release, releases of further versions and amendments, number of pages from the standard
document such as the technical classification of the standard.
Our sample includes 242 different companies declaring essential patents, observed
over the whole period. For each firm, we collect yearly information on the amount of sales,
R&D expenditure, employees and market to book ratio (Tobin’s Q8). In addition we
distinguish between pure R&D firms, manufacturer and net provider9 and classify our sample
by main active industry using SIC codes.
We connect the firm level data to the specific standard information and build a panel
of 1,720 company-standard pairs observed over a time span of 18 years (1992-2009). For each
company-standard pair, we observe the amount of patents filed by the respective company in
the technological field for the respective standard, and include a dummy variable indicating
whether the company takes part in a consortium supporting the development of this standard.
Other time-variant control variables are either company- or standard-specific. Time-invariant
factors affecting the firm, the standard or the relationship between both are captured by
company-standard pair fixed effects.
5A summary of all relevant variables with description and sample statistics can be consulted in Appendix 1 6ISO, IEC, JTC1 - a joint committee of ISO and IEC -, CEN/CENELEC, ITU-T, ITU-R, ETSI, and IEEE. 7PERINORM is the world’s biggest standard database with bibliographic information on formal standards and is regularly updated by the SDOs DIN, BSI and AFNOR. 8We used the Thomson one Banker database to match the respective firm level data. 9We used the extended business model description in the Thomson One Banker database and compared our classification to the list of companies identified by Layne-Farrar and Lerner (2010).

Empirical Analysis
103
3.1.1 Mathcing between informal consortia and formal standards
To identify informal consortia accompanying the formal standardization process, we use data
from 15 editions of the CEN survey of ICT consortia and a list of consortia provided by
Andrew Updegrove. We identify approximately 250 active ICT consortia10. We categorize
these consortia as to industry, function (spec producer, promoter) and years of activity (see
Appendix 1). The connection to a standard in our sample is analyzed by using liaison
agreements and information from consortia and SSO web pages. For instance, a connection
was identified, when a consortium explicitly references a formal standard, or when a standard
has been submitted to the formal SSO by an informal consortium. We are conservative in
establishing the connections, resulting in a narrow list of 54 consortia. We use supplementary
information for the selected consortia and further restrict the list to 21 consortia that
technologically (spec producer) and significantly contribute to this specific standard
(excluding pure promoting consortia)11. Using information on the websites of the consortia as
well as internet archives (www.archive.org) and internet databases
(www.consortiuminfo.org), we inform consortium membership over time and connect this
information with the company standard pairs of our sample.
3.1.2 Standard specific patents
The most intuitive approach to track firms’ R&D investments in standards is to count the
patent declarations they state for these standards. However, former empirical analyses have
shown that the timing of declaration is not connected to the dynamics of standardization
(Baron and Pohlmann, 2010). Moreover essential patents only represent a very small amount
of patenting around standards (Bekkers et al., 2012). To avoid these shortcomings, we thus
build up a new measure of firms’ standard-specific R&D investment. In a first step we count
patents filed from 1992 to 2009 by the companies in our sample at the three major patent
offices (USPTO, JPO and EPO), using the PatStat database and the company assignee
merging methods of Thoma et al. (2010). We restrict the count of patent files to IPC classes in
the relevant technological field of each standard, identified by using the IPC classification of
declared essential patents12. We measure the dynamics of patenting over the standard lifecycle
10This is coherent with the identification of the CEN survey which reports approximately 250 standards consortia in ICT. 11Assisting this rather broad distinction we conduct a word count analysis on the consortia self-description abstracts, kindly provided by Andrew Updegrove. We use keywords such as “developing”, “creates”, “set standard” or “standardizes”. Appendix 1 provides a list of those consortia and standards for which a link could be established, as well as the narrower list of consortia contributing technologically. 12This method is a novel way of measuring standard-specific R&D investment. We apply tests of timing, estimate technological positions of standards as well several test of size measures to prove our proposed variable
Empirical Analysis
104
(details can be consulted in Appendix 3). Our mean value analysis shows a patenting increase
before standard release and a decrease thereafter. This finding reassures us that our variable
captures the innovation for a specific standard, which indeed is expected to culminate in the
period immediately preceding standard release.
3.1.3 Public goods and patent race patterns
One contribution of our analysis is the comparison of over- and under investment in
standardization. As shown in the theoretical model, the patent race pattern can be identified
when pure R&D firms take part in the standard development. We use this prediction as our
identification strategy for the empirical sampling of standards. By labeling over- and
underinvestment as to the classification above, we compare the residual results of a regression
of standard related patent files against technical characteristics of the standards (details can be
consulted in Appendix 4). A t-test analysis suggests that our classification of overinvestment
is an appropriate measure. Results show that residual values of the regression are in average
positive for standards where pure R&D firms participate to a standard and in average negative
for those where pure R&D firms are not involved.
3.1 Descriptive statistics
3.1.1 Pairwise correlations
In the following Table 1, we provide pairwise correlations of firm-specific, standard-specific
and firm-standard-specific variables at the company-standard-pair level. The volume of
patents around standards is negatively correlated with both consortium membership and the
existence of a consortium on the standard. This could indicate that consortia attract companies
with smaller standard-related patent portfolios. On the other hand, consortium membership is
positively correlated with the value of sales and the number of employees. The existence of
consortia is positively correlated with the number of firms per standard and with standard age.
As for the correlation analysis, effects are yet not strong enough to derive conclusive
interpretations.
to be a sufficient indicator of standard-related R&D investment. The methodology and the various tests have been presented at the Patent Statistics for Decision Makers Conference 2011 at the USPTO and can be reviewed in Appendix 3.

Empirical Analysis
105
Table 1: Pairwise correlations on the company-standard level
3.1.2 Difference in means
In the following Table 2, we present differences in the volume of patents, the number of
employees, the value of sales and the book-to-market ratio between consortia member
observations and the rest. Membership observation is associated with a lower volume of
standard-specific patents, but a higher number of employees and a higher value of sales.
t = 4.1256 Standard Specific Patent Files Group Obs Mean Std. Err. Std. Dev. [95% Conf. Interval] consortium members 261 2,238.6 190.8 3,081.9 1,862.9 2,614.2 not consortium members 1,571 12,092.8 972.8 38,559.2 10,184.6 14,001.0 t = -2.4585 Employees Group Obs Mean Std. Err. Std. Dev. [95% Conf. Interval] consortium members 272 125,635.0 6,929.8 114,289.8 111,991.9 139,278.2 not consortium members 1,645 106,528.7 2,945.1 119,448.5 100,752.2 112,305.2 t = -2.6035 Sales Group Obs Mean Std. Err. Std. Dev. [95% Conf. Interval] consortium members 272 40,119.1 1,774.0 29,257.4 36,626.5 43,611.6 not consortium members 1,644 35,211.2 708.4 28,721.6 33,821.8 36,600.6 t = -0.2502 Book-To-Market Ratio Group Obs Mean Std. Err. Std. Dev. [95% Conf. Interval] consortium members 243 1.7 0.1 1.5 1.5 1.9 not consortium members 1,240 1.7 0.0 1.4 1.6 1.8 Table 2: Differences in variable means between consortia members and others
1 2 3 4 5 6 7 8 9
1
St. R&D Invest.
1
2
Member
-0.10
1
3
Consortia Exists
-0.14
0.67
1
4
Standard Event
-0.07
0.39
0.58
1
5
Tobin's Q
0.02
0.01
-0.04
-0.05
1
6
Sales
0.11
0.06
0.01
-0.01
-0.25
1
7
Employees 0.10
0.06
0.01
0.02
-0.33
0.87
1
8
Number of Firms
0.05
0.34
0.60
0.62
-0.09
-0.02
0.00
1
9
Standard Age
-0.07
0.17
0.29
0.32
-0.20
0.00
0.05
0.25
1
N= 1,046, All correlation coefficients above |0.2| are significant at p < 0.05.

Empirical Analysis
106
3.3 Multivareat analysis
3.3.1 Estimation methodology
We use our panel dataset to estimate how consortium membership affects the volume of
patents filed around the related standard. Our dependent variable is the number of patent
priority filings by firm i for standard j in year t. Our first key explanatory variable, memberijt ,
is a dummy equal to one for years where the firm i participates in a consortium supporting
standard j. Following the theoretical model, we expect its effect to depend upon whether the
standard is initially characterized by over- or underinvestment. We therefore interact the
consortium membership dummy with the over_investmentj variable, denoting the share of
pure R&D firms involved in the development of standard j.
To account for unobserved heterogeneity of standards and companies, we
systematically include fixed effects for company-standard pairs. As our dependent variable is
a count variable with overdispersion with respect to a poisson distribution, we will use a
poisson estimator with robust standard errors unless explicitly stated otherwise13. We
furthermore cluster standard errors by companies in order to exclude that unobserved shocks
to a company’s patenting level bias the standard errors and lead to an insufficiently restrictive
confidence interval14. Unsurprisingly, we found strong evidence for persistent effects of
transitory shocks to our explained variable, as indicated by positive autocorrelation of
standard errors. We therefore include the lagged dependent variable as explanatory variable in
all models. Our basic regression model has the following specification:
where st_activityjt−1
counts version releases and amendments per year, Fit−1
is a vector of
firms specific change such as a measure of Sales and Tobins’s Q, Xjt−1
denotes other control
variables for time trends such as the overall ICT patent files and the count of patent declarations, c
jt are standard age dummies and ε
ijt is an idiosyncratic error term.
13We prefer the poisson estimator with robust standard errors over a negative binomial estimator with fixed effects, because the negative binomial estimator cannot totally control for fixed effects and thus account for unobserved heterogeneity. 14All presented results are robust to clustering standard errors by standard instead of by company.
Empirical Analysis
107
We use the standard age dummies, each indicating a one year period in the standard
lifetime, to control for the timing of standardization. Downstream innovation and patenting
(taking place after the first release of the standard) is indeed likely to peak around periodical
revisions of standards. The release of new standard versions or amendments to existing
versions is labeled as standard activity and included as a control variable. In order to exclude
immediate feedback (amendments or version releases explained by prior innovation), we
include this control variable with a one-year lag.
We furthermore wish to account for external shocks such as the business cycle or
technology-related policy. As we already control for standard fixed effects and standard age,
it is impossible to include year dummies as a further control because of a collinearity
problem. We therefore control for external shocks by including the overall number of triadic
patent priorities filed per year in the relevant technological category (respectively IPC class G
for telecom and IPC class H for IT standards) and the overall number of patent declarations
made to any formal ICT standard per year in order to capture policy shocks that are more
specifically relevant to essential patents.
3.3.2 Estimation model 1-4
Consortia are more likely to be created for important or technologically complex
standardization projects. Furthermore, the organization of R&D can be different if a
consortium is created for a standard. For these reasons, the timing of standardization is likely
to be affected by the existence of consortia. It is thus preferable to estimate all coefficients,
including controls for standard timing, only on the sample of standards related to an informal
consortium. This strategy could however bias downwards the estimated effects of consortia, if
some of these effects are systematically captured by control variables. We therefore present
results based upon the whole sample in model M1. As expected, the coefficients on consortia
variables are higher in the larger sample, but the fit of the model is much lower. This indicates
that heterogeneity between standards with consortia and other standards is large. We therefore
only estimate standards with accompanying consortia in all following models (M2-M4), while
acknowledging a potential downward bias on our consortia coefficients.
In our second model (M2), consortium membership has a significant positive effect
on the volume of standard-specific patents, but the level of this effect decreases with the level
of overinvestment. This result is however potentially subject to an endogeneity bias.
Unobservable variables, such as changes in the strategic importance of the standard for the
specific company may have an impact on both standard specific patents and consortium

Empirical Analysis
108
membership. External factors jointly affecting consortium membership and related patenting
are particularly likely to occur in periods of turmoil, like the internet bubble in 2001. While
desirable in order to reduce within-groups bias on weakly endogenous variables (Nickell,
1981; Bloom et al., 2005), the long period of observation (relatively to the fast-evolving world
of ICT standards) increases the vulnerability to this type of biases.
Unit of Observation = Company Standard Pair DV = Standard Specific R&D Investment
(Patent Files)
M1 M2 M3 M4 M5 Coef. Coef. Coef. Coef. Coef.
Member
0.470 (0.175)
***
0.208 (0.108)
**
0.188 (0.105)
*
0.193 (0.098)
**
0.194 (0.077)
**
Member * Over Investment
-1.746 (0.981)
*** -1.135 (0.636)
* -1.172 (0.705)
* -1.203 (0.685)
* -1.349 (0.506)
***
Lag1 Standard Activity
-0.061 (0.032)
*
-0.022 (0.008)
***
-0.022 (0.008)
** -0.021 (0.009)
**
Lag1 Patent Files1
0.002 (0.001)
***
0.072 (0.017)
***
0.044 (0.021)
**
0.04 (0.022)
*
0.022 (0.004)
**
ICT Patent Files1
0.003 (0.002)
**
0.007 (0.001)
***
0.006 (0.003)
**
0.007 (0.003)
**
0.008 (0.003)
***
Patent Declarations1
-0.001 (0.006)
-0.003 (0.006)
0.002 (0.009)
***
0.004 (0.01)
0.008 (0.009)
Lag1 Tobin's Q
0.088 (0.059)
Lag1 Sales1
-0.011
(0.003) ***
Standard Year Dummies
Incl. Incl. Incl. Incl. Incl.
Log Likelihood 2
-17,820
-490.82
-68.55 -59.35 -114.06
AIC 2 35,600 981 137 118 228 BIC 2 35,600 981 138 118 228 Observations 16,390 4,181 999 884 884 Groups 1,046 298 174 158 158 Note: All models are estimated with the conditional fixed-effects poisson estimator with robust clustered standard errors (reported in parentheses). Standard errors are robust to arbitrary heteroskedacity and allow for serial correlation through clustering by firm. Models 2-4 are restricted to a limited time period 2002-2009. ∗∗∗, ∗∗,and ∗ imply significance at the 99%, 95%, and 90% levels of confidence, respectively. 1Coefficient multiplied by 1,000 to make effects visible. 2 Values are reported in thousand.
Table 3: Results of the multivariate analysis – testing consortia membership (firm level)
In order to deal with these concerns we restrict the observation period to 8 years from 2002 to
2009. Furthermore, we also reduce the cross-section dimension of the panel, by restricting the

Empirical Analysis
109
sample to stock-market listed companies. These companies are more likely to react in a
similar fashion to external events. Finally, we identify positive or negative shocks to the
number of employees in a one year period15, indicating mergers, acquisitions, restructuring
etc. If this shock takes place after 2005, all observations after the shock are dropped for this
company, if the shock takes place earlier, we drop all previous observations. Companies with
more than one shock are dropped altogether for our third model (M3), reducing the sample to
174 groups and 999 observations.
In our last model M4 we furthermore tackle endogeneity more directly by including
time-varying firm characteristics as control variables. We choose to include the value of sales,
and Tobin’s Q as a measure of expected profits (both lagged by one year to exclude
immediate feedback). We opt for not including employees, which is highly correlated with
sales in the within dimension (both reflecting company growth). Furthermore, the number of
employees, with respect to the value of sales, is likely to be more important for determining
whether a company has the possibility to participate in a consortium, but less important in
independently determining the evolution of patenting16. By including the value of sales as a
control, we nevertheless face the risk to bias downwards the estimates of the consortia effects
for smaller companies refraining from joining an expensive consortium. We therefore divide
the level of consortia member fees17 by the value of sales of the company at the time of
consortium creation. The first percentile of observations according to this value (the
companies-standard pairs characterized by the highest consortia fees relative to the value of
sales) is most at risk to be affected by this effect. We therefore decide to exclude these
observations, leaving us with 158 company-standard pairs and 884 observations in model 4.
M1-M4 show robust results. The magnitude of the coefficients decreases but the effects are
yet more significant, and the signs of the coefficients are unchanged.
3.3.3 Robustness
We check for robustness of our results to a correlation of our main explanatory variables with
past outcomes of the dependent variable. It is plausible that a company’s decision to join a
consortium depends upon its stock of related patents. In this case, the regressors are
predetermined, and the poisson fixed effect estimator yields inconsistent results (Blundell et
al., 1999). In order to account for this problem, we take advantage of the fact that we have
information on pre-sample levels of our dependent variable and adopt the methodology 15distribution, the lower 5% are labeld as negative shocks. 16The primary cost of consortium participation is workload, while the cost of patenting is primarily financial 17Since our goal is to estimate the financial burden to join a consortium we use the low range of membership fees (find an overview of highest and lowest membership fees in the appendix 1).

Empirical Analysis
110
suggested in Blundell et al. (1999), substituting pre-sample means for fixed effects. The
results displayed in Appendix 5 are mainly consistent with the results from the fixed effect
analysis.
3.3.4 Effect of consortium member share model 6-8
So far we have estimated the effect of consortium membership on the volume of patents of the
respective company. In this section, we will estimate the effect of the consortium member
share (indicating how many of the firms contributing to the standard are a member of the
consortium) on the volume of patents filed by members and outsiders. Finally, by estimating
the effect of consortium member shares on patents filed by all companies, we obtain a
measure of the net effect of consortia. As compared to the previous analysis, this method is
less prone to endogeneity biases, as the decisions of other companies to join a consortium are
probably relatively unrelated to a firm’s own current or expected future R&D efforts. We are
therefore less restrictive regarding the sample, and only drop observations for 2001 or earlier
and of standards with no consortium within the observation period. On the other hand, the
member share is sensitive to the membership decision of the firm itself, especially if the
number of firms on the standard is low18. In order to check for robustness to this sensitivity,
we present all results for a narrower subsample of standards including at least 6 contributing
firms.
We estimate the effects of consortium member share separately for consortium
members and non-members and for both. For the purpose of this analysis, a firm is labeled as
a member over the whole period of observation, if it is consortium member at least once
within this period. It is labeled consortium outsider if it has never been consortium member
over the period of observation. We control for time-variant firm characteristics, standard-
company fixed effects, the lagged dependent variable and external shocks. Results are
displayed in Table 4.
18If we substracted the company itself from the consortium size variable, this count would be nevertheless sensitive to company membership, as we estimate the effects separately for consortium members and non-members.
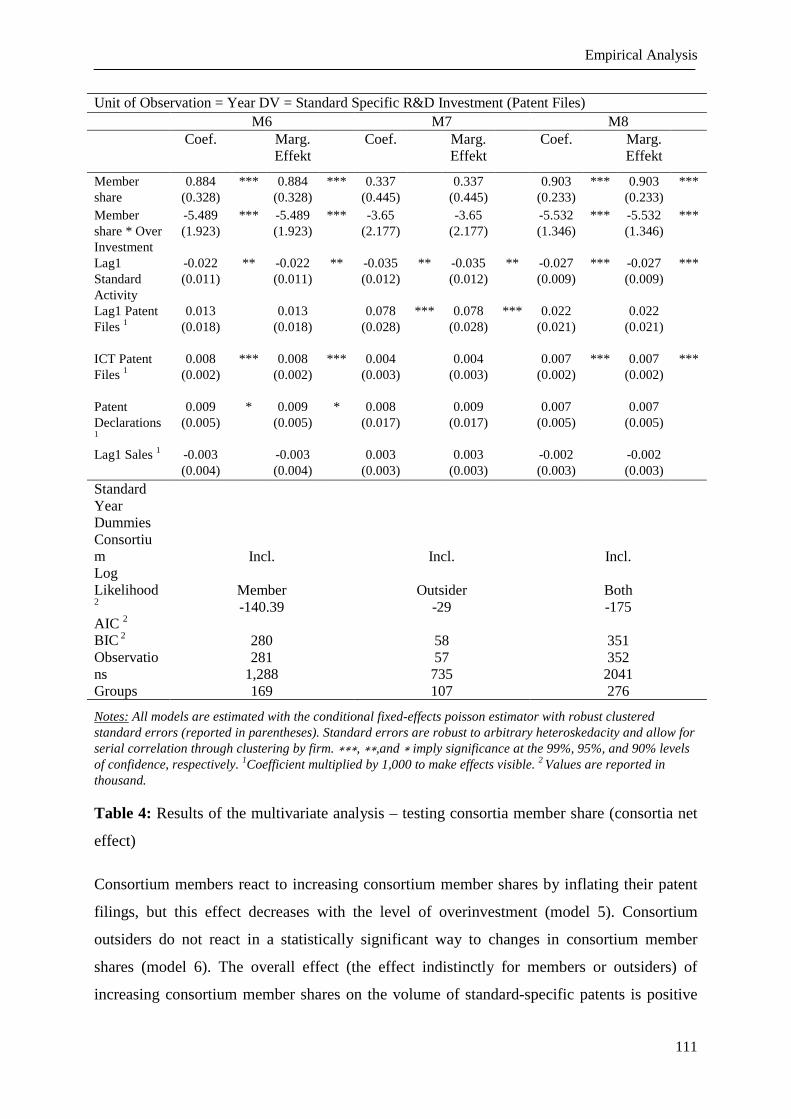
Empirical Analysis
111
Unit of Observation = Year DV = Standard Specific R&D Investment (Patent Files) M6 M7 M8 Coef. Marg.
Effekt Coef. Marg.
Effekt Coef. Marg.
Effekt
Member share
0.884 (0.328)
***
0.884 (0.328)
*** 0.337 (0.445)
0.337 (0.445)
0.903 (0.233)
*** 0.903 (0.233)
***
Member share * Over Investment
-5.489 (1.923)
***
-5.489 (1.923)
*** -3.65 (2.177)
-3.65 (2.177)
-5.532 (1.346)
*** -5.532 (1.346)
***
Lag1 Standard Activity
-0.022 (0.011)
**
-0.022 (0.011)
** -0.035 (0.012)
**
-0.035 (0.012)
** -0.027 (0.009)
*** -0.027 (0.009)
***
Lag1 Patent Files 1
0.013 (0.018)
0.013 (0.018)
0.078 (0.028)
***
0.078 (0.028)
*** 0.022 (0.021)
0.022 (0.021)
ICT Patent Files 1
0.008 (0.002)
***
0.008 (0.002)
*** 0.004 (0.003)
0.004 (0.003)
0.007 (0.002)
*** 0.007 (0.002)
***
Patent Declarations1
0.009 (0.005)
*
0.009 (0.005)
* 0.008 (0.017)
0.009 (0.017)
0.007 (0.005)
0.007 (0.005)
Lag1 Sales 1 -0.003 (0.004)
-0.003 (0.004)
0.003 (0.003)
0.003 (0.003)
-0.002 (0.003)
-0.002 (0.003)
Standard Year Dummies
Incl.
Member -140.39
280 281
1,288 169
Incl.
Outsider -29
58 57 735 107
Incl.
Both -175
351 352 2041 276
Consortium Log Likelihood 2 AIC 2 BIC 2 Observations Groups
Notes: All models are estimated with the conditional fixed-effects poisson estimator with robust clustered standard errors (reported in parentheses). Standard errors are robust to arbitrary heteroskedacity and allow for serial correlation through clustering by firm. ∗∗∗, ∗∗,and ∗ imply significance at the 99%, 95%, and 90% levels of confidence, respectively. 1Coefficient multiplied by 1,000 to make effects visible. 2 Values are reported in thousand.
Table 4: Results of the multivariate analysis – testing consortia member share (consortia net
effect)
Consortium members react to increasing consortium member shares by inflating their patent
filings, but this effect decreases with the level of overinvestment (model 5). Consortium
outsiders do not react in a statistically significant way to changes in consortium member
shares (model 6). The overall effect (the effect indistinctly for members or outsiders) of
increasing consortium member shares on the volume of standard-specific patents is positive

Conclusion
112
and significant, but this effect decreases significantly with the level of over-investment
(model 7).
3.3.5 Net effects
Our results suggest that nearly all effects of consortia depend upon the initial level of
overinvestment. In order to be able to discuss the effect of consortia on patenting, one should
therefore relate the estimated coefficients to the sample values of the overinvestment
indicator. We calculate the net effects from the results of model 5 (for the effect of consortium
membership) and model 7 (the overall effect of consortium member share in the whole
sample). We find that the effect of consortia membership is positive for any share of non-
practicing entities not exceeding 6 %. This is the case for 92,12% of the observations. The
effect of consortia member shares of overall volume of patents is positive for any share of
non-practicing entities below 9 %. This is the case for 94,13% of the observations. These
results indicate that the effects of consortia membership and consortia member shares on
standard-specific R&D are positive in a broad majority of standards19. However, they also
suggest that consortia can have a deflating effect in a minority of standards that are
characterized by a particularly strong patent race pattern.
4. Conclusion
The purpose of the paper is to assess how consortia influence the volume of patents filed
around formal standards, and whether this is efficient. In the first theory section, we defined
consortia as a means to reduce the degree of rivalry between the firms’ innovations.
Accordingly, consortium members can obtain essential patents at a lower average cost, by
better targeting R&D investments. The effect on the volume of patents filed around the
standard is however ambiguous. By joining a consortium, a firm may indeed file fewer
patents by cutting irrelevant R&D investments or more of them if it seeks to develop more
technology inputs for the standard. We have established that consortium membership is
always pro-efficient if the first effect dominates. A patent-inflating consortium is also pro-
efficient in a public good equilibrium, but it may actually harm efficiency in a patent race
equilibrium if it induces an excessive inflation of patents around the standard.
Our empirical analysis makes it possible to assess which effect actually dominates,
depending on the investment pattern – public good or patent race – prevailing for a given
19The negative effect of consortia membership and relative consortia size on R&D investment in situations of overinvestment is however stronger than this positive effect.
Conclusion
113
standard. When joint investments are suboptimal (public good pattern), the observed rise in
patent files indicates that consortium membership induces firms to develop more innovations,
rather than saving R&D costs. Since royalty-based incentives are weak in this case, this
suggests that their reaction is chiefly driven by the opportunity of enhancing the value of the
standard by developing more essential components. Consortia are thus an efficient way to
supplement the lack of R&D investments when incentives to develop the standards are not
sufficient.
Empirical results differ when the patent race pattern prevails. For most standards,
new consortium members still increase their patent applications, but in significantly lesser
proportions than in the public good cases. Since firms have strong strategic incentives to
develop essential patents, this suggests that there are few opportunities left for developing
innovations that are relevant to the standard. For some standards featuring strong
overinvestment, we even observe that consortium members reduce their investments –
consortia being then used to save R&D costs by eliminating irrelevant R&D investments.
These results thus indicate that the creation of consortia does not significantly accentuate
patent races, and rather has a pro-efficient deflating effect for at least a minority of standards
around which overinvestment is particularly strong.
References
114
References
Baron, J., Pohlmann, T. (2010) "Patent Pools and Patent Inflation – The effects of patent pools onthe number of essential patents in standards", Cerna working paper.
Bekkers,R., Catalini, C., Martinelli, A., Simcoe, T. (2012) "Standardizing Intellectual Property Disclosure Data", NBER Working Paper Series.
Benner, M., Waldfogel, J. (2008) "Close to you? Bias and precision in patent-based measures of technological position", Research Policy, 37: 1556-1567.
Blind, K., Gauch, S. (2008) "Trends in ICT standards: The relationship between European standardization bodies and standards consortia", Telecommunications Policy 32 (2008) 503– 513.
Bloom, N., Schankerman, M., Van Reenen, J. (2005) Identifying technology spillovers and product market rivalry, Proceedings, Federal Reserve Bank of San Francisco.
Blundell, R., Griffith, R., Windmeijer, F. (2002) Individual Effects and Dynamic Feedback in Count Data Models. Journal of Econometrics, 87, pp. 115-143.
Branstetter, L., Sakakibara, M. (2002) "When Do Research Consortia Work Well and Why? Evidence from Japanese Panel Data", American Economic Review, vol. 92, no. 1, March 2002, pp. 143-159.
Cargill, C., Weiss, M. (1992) "Consortia in the Standards Development Process", Journal of the American Society for Information Science, Volume 43 Issue 8, 559 – 565.
Cargill, C. (2002) "Intellectual Property Rights and Standards Setting Organizations: An Overview of failed evolution", A Report Issued By the U.S. Department of Justice and the Federal Trade Commission, March 2002.
Chiao, B., Lerner, J., Tirole, J. (2007) "The Rules of Standard Setting Organizations: an Empirical Analysis" RAND Journal of Economics, 38:4, pp. 905-930.
David, Paul A, Shurmer, Mark (1996) "Formal standards-setting for global telecommunications and information services. Towards an institutional regime transformation? ", Telecommunications Policy, Volume 20, Issue 10, December 1996, Pages 789-815.
Delcamp, H., Leiponen, A. (2012) "Innovating Standards Through Informal Consortia: The Case of Wireless Telecommunications" NBER Working Paper Series.
Egyedi, T.M. (2003) "Consortium Problem Redefined: Negotiating ’Democracy’ in the Actor Network on Standardization", International Journal of IT Standards & Standardization Research, 1(2), 22-38.
Farrell, J., Simcoe, T. (2012) "Choosing the Rules for Consensus Standardization" RAND Journal of Economics (forthcoming).
Fleming, L., Waguespack. D (2009) “Evidence on the Benefits to Startups Participating in Open Standards Development”. Management Science, 55(2), pp. 210-223.
Ganglmair, B., Tarentino, E. (2011) "Patent Disclosure in Standard Setting" NET Institute Working Paper #11-15.
Gauch, Stephan (2008) "Dynamics and effects of competing standards of recordable DVD-media Author(s)" Gauch, S. Source Egyedi, T.M. ; Blind, K.: The dynamics of standards Cheltenham: Elgar, 2008 ISBN: 978-1-84720-486-8 ISBN: 1-84720-486-4 pp.47-67.

References
115
Hawkins, Richard (1999) "The rise of consortia in the information and communication technology industries: emerging implications for policy" Telecommunications Policy, Volume 23, Issue 2, March 1999, Pages 159-173.
Layne-Farrar, A., Lerner, J. (2011) "To join or not to join: Examining patent pool participation and rent sharing rules," International Journal of Industrial Organization, 29:2, pp. 294-303.
Leiponen A. E. (2008) "Competing Through Cooperation: The Organization of Standard Setting in Wireless Telecommunications", Management Science Vol. 54, No. 11, November 2008, pp. 1904–1919.
Lerner, J, Tirole, J. (2004) "Efficient Patent Pools". American Economic Review, 94:3, pp. 691-711.
Lerner, J, Tirole, J. (2006) "A Model of Forum Shopping". American Economic Review, 96, pp. 1091-1113.
Pohlmann, T. (2010) "Attributes and Dynamic Development Phases of Informal ICT Standards Consortia", TUB Working Paper.
Pohlmann, T.; Blind, K. (2012): Cooperate to Decalre. Firms’ cooperative activities as driving factors of patent declaration on technological standards, TUB working paper.
Rysman, M., Simcoe, T. (2008) "Patents and the Performance of Voluntary Standard Setting Organizations", Management Science, 54:11, pp. 1920-1934.
Shapiro, C. (2001) "Navigating the Patent Thicket: Cross Licences, Patents Pools, and Standard Setting", in A. Jaffe, J. Lerner et S. Stern (Ed.), Innovation Policy and the Economy, Vol 1, MIT Press.
Simcoe, T. (2007) "Explaining the Increase in Intellectual Property Disclosure", Pages 260-295, in Standards Edge: The Golden Mean. Bolin Group, 2007.
Simcoe, T. (2012) "Standard Setting Committees: Consensus Governance for Shared Technology Platforms", American Economic Review, 102:1, pp. 305-336.
Thoma G., S. Torrisi, Gambardella, A., Guellec, D., Hall, B. H., Harhoff, D. (2010) "Harmonizing and Combining Large Datasets – An Application to Firm-Level Patent and Accounting Data", NBER Working Paper No. 15851, March 2010.
Updegrove, A. (1995) "Consortia and the Role of the Government in Standard Setting", in B. Kahin & J. Abbate (Eds.). Standards Policy for Information Infrastructure, Cambridge: MIT Press, 321-348.
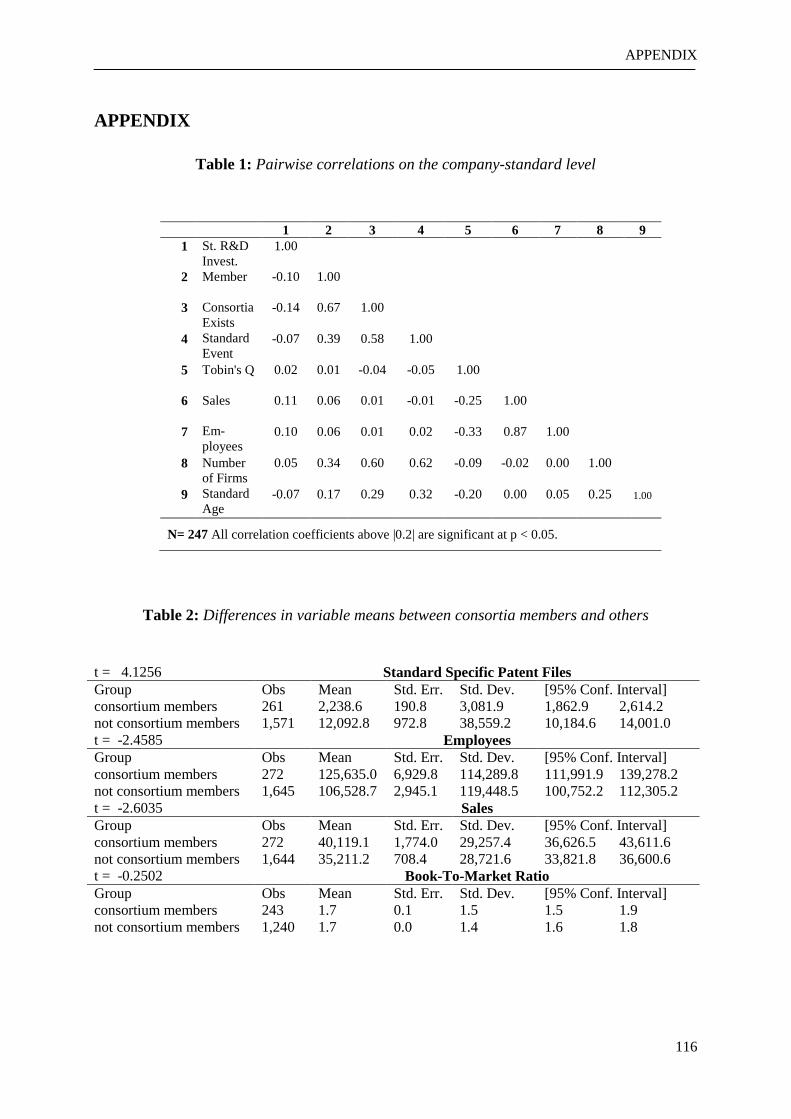
APPENDIX
116
APPENDIX
Table 1: Pairwise correlations on the company-standard level
1 2 3 4 5 6 7 8 9
1
St. R&D Invest.
1.00
2
Member
-0.10
1.00
3
Consortia Exists
-0.14
0.67
1.00
4
Standard Event
-0.07
0.39
0.58
1.00
5
Tobin's Q
0.02
0.01
-0.04
-0.05
1.00
6
Sales
0.11
0.06
0.01
-0.01
-0.25
1.00
7
Em-ployees
0.10
0.06
0.01
0.02
-0.33
0.87
1.00
8
Number of Firms
0.05
0.34
0.60
0.62
-0.09
-0.02
0.00
1.00
9
Standard Age
-0.07
0.17
0.29
0.32
-0.20
0.00
0.05
0.25
1.00
N= 247 All correlation coefficients above |0.2| are significant at p < 0.05.
Table 2: Differences in variable means between consortia members and others
t = 4.1256 Standard Specific Patent Files Group Obs Mean Std. Err. Std. Dev. [95% Conf. Interval] consortium members 261 2,238.6 190.8 3,081.9 1,862.9 2,614.2 not consortium members 1,571 12,092.8 972.8 38,559.2 10,184.6 14,001.0 t = -2.4585 Employees Group Obs Mean Std. Err. Std. Dev. [95% Conf. Interval] consortium members 272 125,635.0 6,929.8 114,289.8 111,991.9 139,278.2 not consortium members 1,645 106,528.7 2,945.1 119,448.5 100,752.2 112,305.2 t = -2.6035 Sales Group Obs Mean Std. Err. Std. Dev. [95% Conf. Interval] consortium members 272 40,119.1 1,774.0 29,257.4 36,626.5 43,611.6 not consortium members 1,644 35,211.2 708.4 28,721.6 33,821.8 36,600.6 t = -0.2502 Book-To-Market Ratio Group Obs Mean Std. Err. Std. Dev. [95% Conf. Interval] consortium members 243 1.7 0.1 1.5 1.5 1.9 not consortium members 1,240 1.7 0.0 1.4 1.6 1.8

APPENDIX
117
Unit of Observation = Company Standard Pair DV = Standard Specific R&D Investment (Patent Files)
M1 M2 M3 M4 M5 Coef. Coef. Coef. Coef. Coef.
Member
0.470 (0.175)
***
0.208 (0.108)
**
0.188 (0.105)
*
0.193 (0.098)
**
0.194 (0.077)
**
Member * Over Investment -1.746 (0.981)
*** -1.135 (0.636)
* -1.172 (0.705)
* -1.203 (0.685)
* -1.349 (0.506)
***
Lag1 Standard Activity
-0.061 (0.032)
*
-0.022 (0.008)
***
-0.022 (0.008) **
-0.021 (0.009)
**
Lag1 Patent Files1
0.002
(0.001) ***
0.072 (0.017)
***
0.044 (0.021)
**
0.04 (0.022)
*
0.022 (0.004)
**
ICT Patent Files1
0.003
(0.002) **
0.007 (0.001)
***
0.006 (0.003)
**
0.007 (0.003)
**
0.008 (0.003)
***
Patent Declarations1
-0.001 (0.006)
-0.003 (0.006)
0.002 (0.009)
***
0.004 (0.01)
0.008 (0.009)
Lag1 Tobin's Q
0.088 (0.059)
Lag1 Sales1
-0.011
(0.003) ***
Standard Year Dummies Incl. Incl. Incl. Incl. Incl. Log Likelihood 2 -17,820 -490.82 -68.55 -59.35 -114.06 AIC 2 35,600 981 137 118 228 BIC 2 35,600 981 138 118 228 Observations 16,390 4,181 999 884 884 Groups 1,046 298 174 158 158 Note: All models are estimated with the conditional fixed-effects poisson estimator with robust clustered standard errors (reported in parentheses). Standard errors are robust to arbitrary heteroskedacity and allow for serial correlation through clustering by firm. Model 2-4 are restricted to a limited time period 2002-2009. ∗∗∗, ∗∗,and ∗ imply significance at the 99%, 95%, and 90% levels of confidence, respectively. 1Coefficient multiplied by 1,000 to make effects visible. 2 Values are reported in thousand.
Table 3: Results of the multivariate analysis – testing consortia membership (firm level)
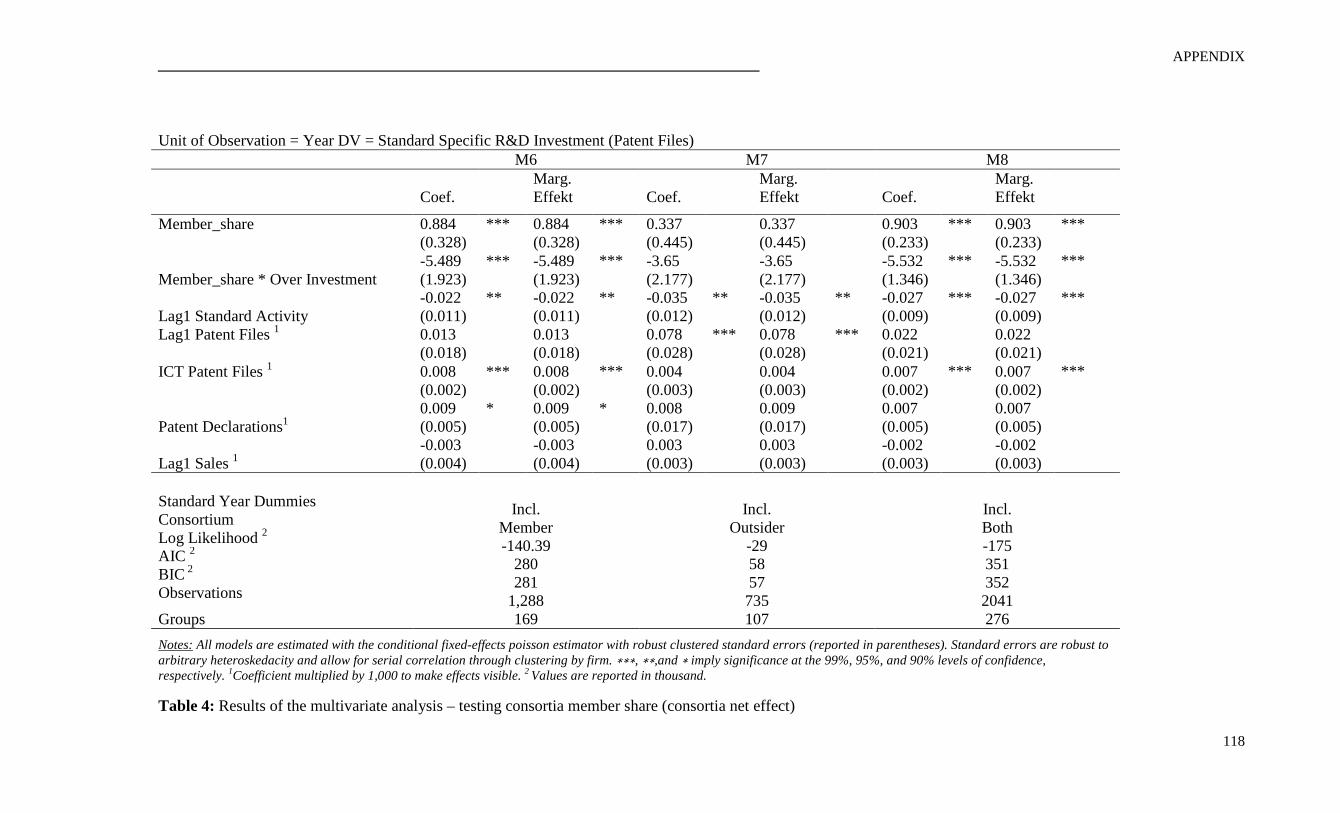
APPENDIX
118
Unit of Observation = Year DV = Standard Specific R&D Investment (Patent Files)
M6 M7 M8
Coef. Marg. Effekt
Coef.
Marg. Effekt
Coef.
Marg. Effekt
Member_share
0.884 (0.328)
***
0.884 (0.328)
*** 0.337 (0.445)
0.337 (0.445)
0.903 (0.233)
*** 0.903 (0.233)
***
Member_share * Over Investment -5.489 (1.923)
***
-5.489 (1.923)
*** -3.65 (2.177)
-3.65 (2.177)
-5.532 (1.346)
*** -5.532 (1.346)
***
Lag1 Standard Activity -0.022 (0.011)
**
-0.022 (0.011)
** -0.035 (0.012)
**
-0.035 (0.012)
** -0.027 (0.009)
*** -0.027 (0.009)
***
Lag1 Patent Files 1
0.013 (0.018)
0.013 (0.018)
0.078 (0.028)
***
0.078 (0.028)
*** 0.022 (0.021)
0.022 (0.021)
ICT Patent Files 1
0.008 (0.002)
***
0.008 (0.002)
*** 0.004 (0.003)
0.004 (0.003)
0.007 (0.002)
*** 0.007 (0.002)
***
Patent Declarations1 0.009 (0.005)
*
0.009 (0.005)
* 0.008 (0.017)
0.009 (0.017)
0.007 (0.005)
0.007 (0.005)
Lag1 Sales 1 -0.003 (0.004)
-0.003 (0.004)
0.003 (0.003)
0.003 (0.003)
-0.002 (0.003)
-0.002 (0.003)
Standard Year Dummies Incl. Member -140.39
280 281
1,288 169
Incl. Outsider
-29 58 57 735 107
Incl. Both -175 351 352 2041 276
Consortium Log Likelihood 2 AIC 2 BIC 2 Observations
Groups
Notes: All models are estimated with the conditional fixed-effects poisson estimator with robust clustered standard errors (reported in parentheses). Standard errors are robust to arbitrary heteroskedacity and allow for serial correlation through clustering by firm. ∗∗∗, ∗∗,and ∗ imply significance at the 99%, 95%, and 90% levels of confidence, respectively. 1Coefficient multiplied by 1,000 to make effects visible. 2 Values are reported in thousand.
Table 4: Results of the multivariate analysis – testing consortia member share (consortia net effect)

APPENDIX
119
Appendix 1 Summary of relevant variables
Variable Description Level of Obs.
Obs Mean Std. Dev. Min Max
Standard Specific R&D
Triadic Patent Priority Filings by this firm in the standard-related IPC classes
Firm-Standard-Year
31,020
1,072
4,022
0
91,121
Member Membership of this Company in the Consortium related to this standard
Firm-Standard-Year
39,816
0.058
0.234
0
1
Over Investment
The share of non-producing entities for this standard
Standard 31,312
0.120
0.138
0
1
Standard Event
Sum of Amendments and version Releases
Standard-Year
36,918
0.292
0.979
1
37
ICT Patent Files
Triadic patent priority filings by all firms in either Telecom or IT
Standard-Year
37,621
223,320
52,748
132,721
301,890
Patent Declarations
Number of patent declarations to all formal standards
Year 39,834
3,538
4,038
78
13,938
Tobin's Q Market-to-book ratio of the firm
Firm-Year 11,740
1.702
1.598
0.076
8.257
Sales Value of sales per year in Million USD
Firm-Year 17,780
35,694
30,172
895
199,925

APPENDIX
120
Appendix 2 Linkages between standards and informal consortia
Consortia Name
MatchStandard Incl Consortia Name MatchStandard Incl Consortia Name
MatchStandard Incl
EPCglobal EN300220 No WiMax IEEE802.16 Yes MPEGIF ISO/IEC14496-14 Yes
DVB EN300468 No Cable Laboratories IEEE802.1Q Yes MPEGIF
ISO/IEC14496-15 Yes
DVB EN301192 No
FCIA - Fibre Channel Industry Association IEEE802.1Q No MPEGIF
ISO/IEC14496-16 No
DVB EN301199 Yes MEF IEEE802.1X No MPEGIF ISO/IEC14496-18 Yes
DVB EN301790 No IETF IEEE802.21 Yes MPEGIF ISO/IEC14496-19 No
DVB EN301958 Yes (GEA IEEE802.3 No ISMA ISO/IEC14496-2 Yes
EPCglobal EN302208 No AUTOSAR IEEE802.3/ISOIEC8802-3 No MPEGIF
ISO/IEC14496-2 No
DVB EN302304 No FCIA IEEE802.3/ISOIEC8802-3 No MPEGIF
ISO/IEC14496-20 No
DVB EN302307 No HGI IEEE802.3/ISOIEC8802-3 No ISMA
ISO/IEC14496-3 Yes
DVB EN302583 No IETF IEEE802.3/ISOIEC8802-3 Yes MPEGIF
ISO/IEC14496-3 Yes
DVB EN302755 No MEF IEEE802.3/ISOIEC8802-3 No MPEGIF
ISO/IEC14496-4 Yes
DVB ES200800 Yes ODVA IEEE802.3/ISOIEC8802-3 No MPEGIF
ISO/IEC14496-5 Yes
IETF ES201108 Yes OIF IEEE802.3/ISOIEC8802-3 No MPEGIF
ISO/IEC14496-6 Yes
IETF ES202050 Yes Rapidio IEEE802.3/ISOIEC8802-3 No TAHI
ISO/IEC14543-2-1 No
IETF ES202212 Yes IETF IEEE802.5/ISOIEC8802-5 No IETF
ISO/IEC15444-1 No
WORLDDAB FORUM ETS300401 Yes INCITS
ISO/IEC10118-2 No IETF
ISO/IEC15444-12 No
DVB ETS300814 Yes INCITS ISO/IEC10118-3 Yes IETF
ISO/IEC15444-2 No
DVD ETSIEN300468 No INCITS
ISO/IEC10536-3 No IETF
ISO/IEC15444-3 Yes
IETF G.711 Yes INCITS ISO/IEC10918-1/ITU-TT.81 Yes IETF
ISO/IEC15444-5 No
IETF G.722 Yes TOG ISO/IEC10918-1/ITU-TT.81 No EPCglobal
ISO/IEC15693-2 No
IETF H.263 Yes INCITS ISO/IEC11172-1 No EPCglobal
ISO/IEC15693-3 No
IMTC H.323 Yes DVD ISO/IEC11172-2 No EPCglobal
ISO/IEC18000-1 No
IMTC H.324 No INCITS ISO/IEC11172-2 No EPCglobal
ISO/IEC18000-2 No
IETF IEC6183411 No DVD
ISO/IEC11172-3 No EPCglobal
ISO/IEC18000-3 No
TOG
IEEE1003.1/ISOIEC9945 Yes INCITS
ISO/IEC11172-3 Yes EPCglobal
ISO/IEC18000-4 No
PICMG IEEE1101.1 Yes INCITS ISO/IEC11693 No EPCglobal
ISO/IEC18000-6 Yes
OCP-IP IEEE1149.1 Yes INCITS
ISO/IEC11694-1 No AIM
ISO/IEC18000-6 No
BPMI IEEE1226.5 No INCITS
ISO/IEC11770-3 No AIM
ISO/IEC18000-7 No
OMG IEEE1226.5 No INCITS
ISO/IEC11889-1 Yes EPCglobal
ISO/IEC18000-7 Yes
PWG IEEE1284 Yes INCITS ISO/IEC11889-2 Yes ECMA
ISO/IEC18092 No
1355 Association IEEE1355 No INCITS ISO/IEC11889-3 Yes EUROSMART
ISO/IEC18092 No
1394TA IEEE1394 Yes INCITS ISO/IEC11889-4 Yes NFC Forum
ISO/IEC18092 Yes
AUTOSAR IEEE1394 No DMPF
ISO/IEC13818-1/ITU-TH.220.0 No INCITS
ISO/IEC19794-3 No

APPENDIX
121
DVD IEEE1394 No DVD
ISO/IEC13818-1/ITU-TH.220.0 No INCITS
ISO/IEC19794-6 Yes
HAVi IEEE1394 No INCITS
ISO/IEC13818-1/ITU-TH.220.0 Yes ECMA
ISO/IEC23651 No
PWG IEEE1394 No DVD ISO/IEC13818-2/ITU-TH.262 No
GS1 – (Formerly EAN)
ISO/IEC24730-2 No
ODVA IEEE1588/IEC61588 Yes INCITS
ISO/IEC13818-2/ITU-TH.262 Yes ECMA
ISO/IEC28361 No
ACCELLERA IEEE1800/IEC62530 No TOG
ISO/IEC13818-2/ITU-TH.262 No TAHI
ISO/IECDIS29341 No
ACCELLERA IEEE1801 Yes DVD ISO/IEC13818-3 No UPnP Forum
ISO/IECDIS29341 Yes
Homeplug IEEE1901 No INCITS ISO/IEC13818-3 Yes ECMA
ISO/IECDIS29500 No
IVI
IEEE488.1/IEC60488-1 No INCITS
ISO/IEC13818-7 No 3GPP2 Q.703 No
ASTM
IEEE802.11/ISOIEC8802-11 No EUROSMART
ISO/IEC14443-1 No DVB TS102474 No
Bluetooth
IEEE802.11/ISOIEC8802-11 No INCITS
ISO/IEC14443-1 No DECT Forum TS102527 No
DLNA
IEEE802.11/ISOIEC8802-11 No NFC Forum
ISO/IEC14443-1 No DVB TS102584 No
ewc
IEEE802.11/ISOIEC8802-11 No EUROSMART
ISO/IEC14443-2 No DVB TS102611 No
HGI
IEEE802.11/ISOIEC8802-11 No INCITS
ISO/IEC14443-2 Yes
TV Anytime Forum TS102822 No
IETF
IEEE802.11/ISOIEC8802-11 No NFC Forum
ISO/IEC14443-2 No DVB TS102825 No
Wi-Fi Alliance
IEEE802.11/ISOIEC8802-11 Yes EUROSMART
ISO/IEC14443-3 No IMS FORUM TS123002 No
100VG-Anylan Forum
IEEE802.12 No INCITS
ISO/IEC14443-3 Yes 3GPP2 TS123401 No
IETF
IEEE802.12/ISOIEC8802-12 No NFC Forum
ISO/IEC14443-3 No 3GPP2 TS123402 No
Bluetooth IEEE802.15.1 No EUROSMART
ISO/IEC14443-4 No 3GPP2 TS133402 No
WiMedia Alliance
IEEE802.15.3 Yes INCITS
ISO/IEC14443-4 Yes DRM TS201980 No
DISA IEEE802.15.4 No NFC Forum
ISO/IEC14443-4 No IETF V.44 No
IETF IEEE802.15.4 No ISMA
ISO/IEC14496-1 Yes 3GPP2 X.509 No
TAHI IEEE802.15.4 No MPEGIF
ISO/IEC14496-1 No ASTM X.509 No
ZigBee IEEE802.15.4 No ISMA
ISO/IEC14496-10 Yes
Cable Laboratories X.509 Yes
IETF IEEE802.16 No MPEGIF
ISO/IEC14496-10 No ISMA
ISO/IEC14496-10/ITUH.264 Yes
MPEGIF ISO/IEC14496-12 Yes

APPENDIX
122
Appendix 3 Empirical Methodology for measuring standard-related R&D
We identified the relevant technological field for each standard by using the 7-digit IPC20 classification of the
declared standard essential patents, to then count patents filed by each company in the identified IPC classes.
We counted all patents filed from 1992 to 2009 by the companies in our sample at the three major patent offices
(USPTO, JPO and EPO), using the PatStat database and company assignee merging methods of Thoma et al.
(2010). This merging yields 13 million patent files. We aggregated these patents to INPADOC patent families
and informed the IPC classification and the year of priority. To create our explained variable, we computed for
each company-standard pair and year the number of patents filed in the relevant IPC classes for the standard of
observation.
This method is a novel way of measuring standard-specific R&D investment, and we therefore have to
conduct a reliability analysis. We compute for each company-standard pair the mean number of patents filed in
one year periods before and after standard release (t=0) and report the standard derivation for high and low
values (figure1). The resulting pattern is a convincing description of the innovation process around
standardization: the number of patents filed is highest in the years immediately preceding standard release, and
sharply decreases after the release of the standard. The further we move away from the development phase of
the standard, the lower are the calculated numbers of relevant patents. We believe that these findings are
important arguments corroborating our methodology.
Figure1: mean number of patents filed in years before and after standard release
20 International Patent Classification

APPENDIX
123
Appendix 4 Empirical Methodology for sorting standards into cases of over- and underinvestment
Based upon the theoretical model, we use the contribution of pure R&D firms to indicate overinvestment in a
standard. We observe contribution of pure R&D firms in a standard using our database of companies that declare
patents. Only firms that declare at least one patent on a standard are considered as contributors. Firms are
classified as pure R&D firms using the business description database of Thomson One Banker and the
companies identified by Layne-Farrar and Lerner (2011).
Using this classification, we create two sub samples, one where pure R&D firms contribute to the
standard and one where pure R&D firms are not at place. We test over- and underinvestment by predicting the
residual values of our specification. We run a linear fixed effect regression of our firm-standard pairs explaining
patent files per year, controlling for standard dynamics and year trends and estimate the linear residual values21.
We then compare the means of our residual values in both subsamples (pure R&D firms participate or not)
conducting a t-test analysis.
The result of the t-test analysis in table 5 shows that in the case of overinvestment (pure R&D firms
contribute), the mean residual value is positive and significantly higher compared to the subsample of
underinvestment (pure R&D firms do not contribute). The estimated residual values indicate the level of
patenting predicted upon our estimation equation. The differences of residual values among our observations
thus reflect the heterogeneity of patent behavior among observations and help us to find proof for different
outcomes of patenting when pure R&D firms contribute to a standard or not. Our findings indicate to confirm
predictions from our theoretical model that pure R&D firms would only participate in standardization, when the
licensing of the standard is characterized by a situation of overinvestment (positive residual values).
T-test of linear residual values by pure R&D firms contribution
Group Obs Mean Std. Err.
Std. Dev.
[95% Conf. Interval]
pure R&D firms do not contribute 16,121
-0.2435 0.0193 2.4512 -0.2814 -0.2057
pure R&D firms contribute 11,441 0.1145 0.0237 2.5347 0.0680 0.1609
combined 27,562 -
0.0949 0.0150 2.4924 -0.1244 -0.0655
diff -
0.3580 0.0304 -0.4176 -0.2984 t = -11.7797 degrees of freedom = 27560 Ha: diff != 0 Pr(|T| > |t|) = 0.0000
Table5: T-test of residual values from a fixed effect regression on patent files controlled for standard dynamics and year trends
21 We change our poisson specification to a liner regression, since residual values of poisson estimators will not produce conclusive results. We log transform our count variable of patent files and run a linear OLS fixed effect regression model to then predict the linear residual values in a post estimation analysis.

APPENDIX
124
Appendix 5 Robustness check substituting pre-sample means for fixed effects
We apply the methodology developed by Blundell et al. (1999) to control for predetermined regressors. The
authors suggest substituting the pre-sample averages of the dependent variable for the group fixed effect. While
the fixed effects are estimated over the sample period, and are thus affected by the feedback of predetermined
regressors, the pre-sample means are exogenous to the sample period values of the regressors. Analogous to our
previous analysis, we set the period of observation from 2002 to 2009. In choosing the appropriate pre-sample
period (1982-1992 or 1992-2001), we have to trade off endogeneity (several consortia memberships observed in
the sample period have already existed in the period from 1992 to 2001) against heterogeneity (closer pre-
sample values are a better approximation of the sample fixed effect than more remote pre sample information).
As this model is intended to complement a fixed effect analysis, we choose the average of the period from 1982
to 1992 as pre-sample values22. We control for the same variables and operate the same sample restrictions as in
the main models of our empirical tests. As our dependent variable is over-dispersed with respect to a poisson
distribution and we no longer include group fixed effects, we now opt for a negative binomial regression. This
allows us to further add standard dummies. The results are displayed in table 6. The coefficients of the consortia
membership variables of models 11-1 and 11-2 as well as 12-1 and 12-2 are similar to our previous poisson
fixed effect analysis with clustered standard errors. Models 11-1 and 11-2 estimate the firm level membership
effect, while models 12-1 and 12-2 estimate the overall membership net effect. We run two models including
and excluding the lagged sales variable and restricting the observations to 2002-2009. Our estimations provide
significant results for the consortia variables in all models. Furthermore the coefficients of the pre-sample means
are positive and significant in all specifications, which indicates that controlling for unobserved heterogeneity of
the patent behavior is important.
22 Additionally including the closer pre-sample information (1992 to 2002) does not alter significantly the reported results.
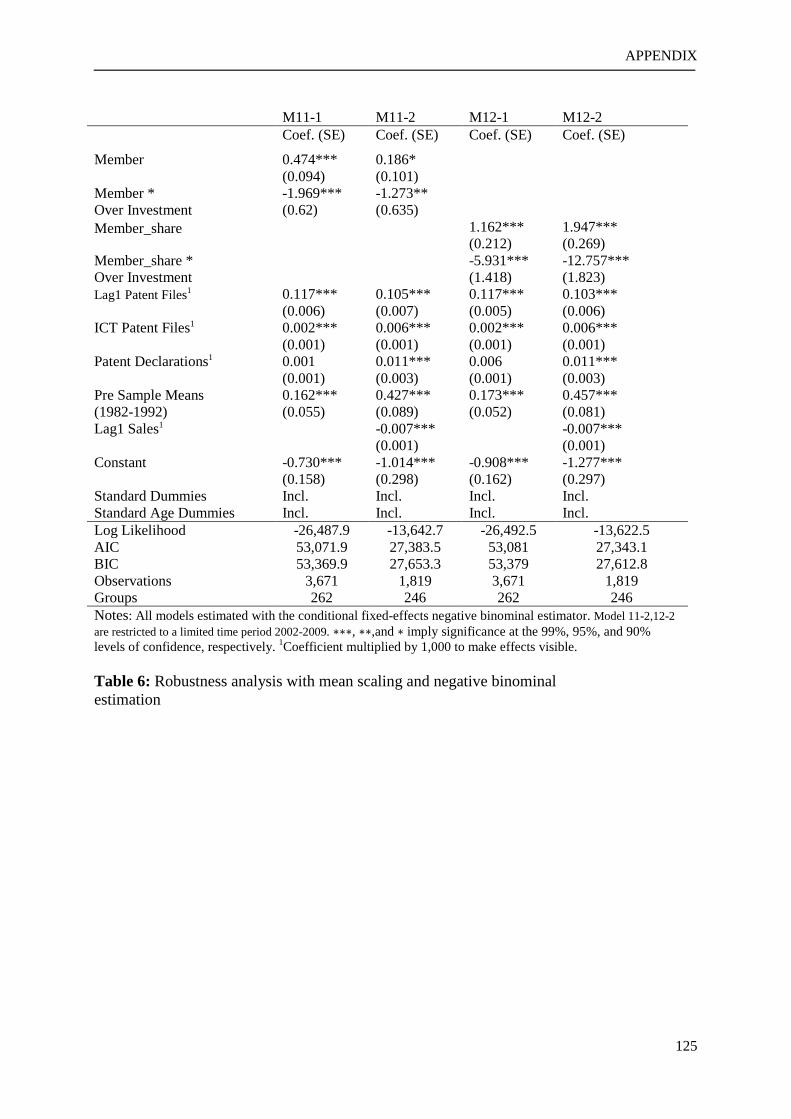
APPENDIX
125
M11-1 M11-2 M12-1 M12-2 Coef. (SE) Coef. (SE) Coef. (SE) Coef. (SE)
Member
0.474*** (0.094)
0.186* (0.101)
Member * Over Investment
-1.969*** (0.62)
-1.273** (0.635)
Member_share
1.162*** (0.212)
1.947*** (0.269)
Member_share * Over Investment
-5.931*** (1.418)
-12.757*** (1.823)
Lag1 Patent Files1
0.117*** (0.006)
0.105*** (0.007)
0.117*** (0.005)
0.103*** (0.006)
ICT Patent Files1
0.002*** (0.001)
0.006*** (0.001)
0.002*** (0.001)
0.006*** (0.001)
Patent Declarations1
0.001 (0.001)
0.011*** (0.003)
0.006 (0.001)
0.011*** (0.003)
Pre Sample Means (1982-1992)
0.162*** (0.055)
0.427*** (0.089)
0.173*** (0.052)
0.457*** (0.081)
Lag1 Sales1
-0.007*** (0.001)
-0.007*** (0.001)
Constant
-0.730*** (0.158)
-1.014*** (0.298)
-0.908*** (0.162)
-1.277*** (0.297)
Standard Dummies Incl. Incl. Incl. Incl. Standard Age Dummies Incl. Incl. Incl. Incl. Log Likelihood -26,487.9 -13,642.7 -26,492.5 -13,622.5 AIC 53,071.9 27,383.5 53,081 27,343.1 BIC 53,369.9 27,653.3 53,379 27,612.8 Observations 3,671 1,819 3,671 1,819 Groups 262 246 262 246 Notes: All models estimated with the conditional fixed-effects negative binominal estimator. Model 11-2,12-2 are restricted to a limited time period 2002-2009. ∗∗∗, ∗∗,and ∗ imply significance at the 99%, 95%, and 90% levels of confidence, respectively. 1Coefficient multiplied by 1,000 to make effects visible.
Table 6: Robustness analysis with mean scaling and negative binominal estimation

126
Cooperate to Declare Firms’ Cooperative Activities as Driving Factors of Patent Declaration on Technological Standards
Abstract
Cooperative activities are crucial to influence technology development in situations of divided
technical leadership. In standard setting, firms develop and agree on a common technology
platform. Voluntary Standard Setting Organizations (SSOs) coordinate the transition of
technology generations. Due to consensus decision making rules, firms have to commonly
agree on technology proposals. Standards consortia are informal venues were firms can pre
develop and sponsor technologies with likeminded peers. Within standards consortia firms
build up relationships to tighten partnerships through channels of control and trust. This
article empirically tests if participation in standards consortia increases a firm’s ability to
introduce patented proposals to formal standards. We exploit data on 250 companies which
participate in international SSOs declaring over 60,000 essential patents to technology
standards. We conduct panel analysis to test our research question. Regression results
indicate that memberships in technically related standards consortia increase a firm’s ability
to introduce patented components into formal standards. Consortia connections in technically
unrelated standard consortia show no significant effects. Our empirical analysis further
provides evidence that consortia size positively influences the likelihood of member firms to
introduce patents into standards.

127
Contents
1. Introduction ................................................................................................... 128
2. Theoretical Background and Hypothesis ...................................................... 130
2.1 Standard Setting in ICT Markets ............................................................. 130
2.2 Firm Alliances and R&D Consortia ......................................................... 131
2.3 ICT Standards Consortia .......................................................................... 131
3. Data and Variables ........................................................................................ 134
3.1 Sample ...................................................................................................... 134
3.2 Variables ................................................................................................... 136
4. Descriptive Results ........................................................................................ 140
5. Testing the Hypothesis .................................................................................. 143
6. Conclusion ..................................................................................................... 149
References ......................................................................................................... 151
Appendix ........................................................................................................... 154

Introduction
128
1. Introduction
In the past ten years theoretical and empirical research about the interplay of IPR and
technological standards has been increasing and as a consequence has revealed new
implications for microeconomic analysis. On the one hand this is due to the growing
importance of technological standards in our interconnected information and communication
society, where interoperability and common agreement on a technology is crucial to unlock
innovation (Blind and Gauch, 2008). On the other hand recent problems of IPR and standards
such as hold-up or patent ambush behavior have caused expensive litigation cases and raised
the question about the driving factors of patenting in standards (Shapiro, 2001; Simcoe, 2007;
Hovenkamp, 2008).
Especially in ICT (Information and Communication Technology) industries,
standards frame innovative technologies which are constantly updated in their scope and
complexity (e.g. GSM, Wi-Fi, RFID, MPEG). Therefore the number of patents essential to
commonly agreed standards has been increasing during the last decades (Bekkers et al., 2002;
Simcoe, 2007). In the context of patent thickets, which is a web of overlapping patents,
empirical studies evidence an excessive patent filing behavior. The assumption is that
companies try to protect their innovation preferably with a high number of patents. The
increasing number of patent files may cause coordination problems and in cases of hardship
even leads to litigation (Shapiro, 2001). When standardized technologies are patented, patent
holders may hold up whole technologies even if the patent only protects a minor part of the
standard. Patents that are essential to a standard are these that one would necessarily be
infringe when the standard is implemented (Lemley and Shapiro, 2006; Farrell et al., 2007).
Standard setting organizations are inclusive groups which are open to all interested
parties. This open character increases the need for coordination. Especially when IPR is
involved firms may have commercial stakes on standardized technologies. These situations
have raised the issue of coordination failures in standardization. Farrell and Simcoe (2007)
make the case of vested interest, where firms favor their own technological solutions over
others. Farrell and Saloner (1985) state that coordination failures in standard setting might
result in non-optimal adoption rates. Consensus on technology selection is only feasible when
all involved participants face the same benefits. However, goals to include patents into
standards are not necessarily connected to financial returns in terms of royalties (Shapiro &
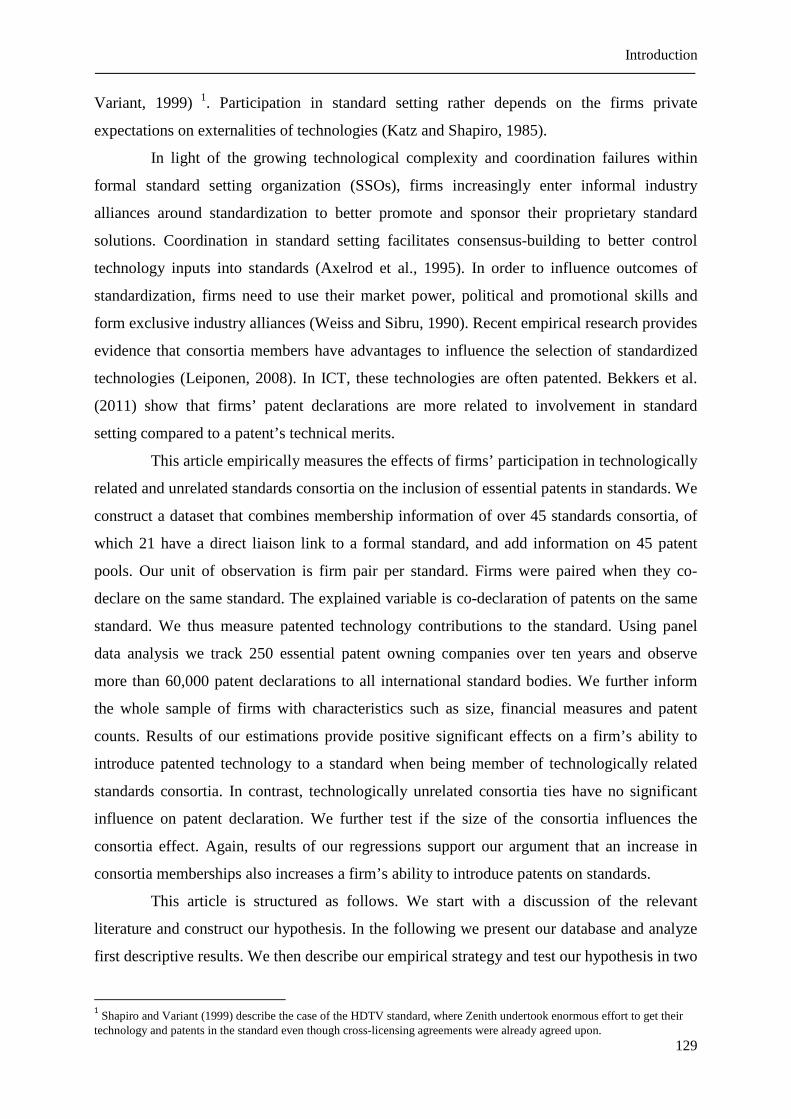
Introduction
129
Variant, 1999) 1. Participation in standard setting rather depends on the firms private
expectations on externalities of technologies (Katz and Shapiro, 1985).
In light of the growing technological complexity and coordination failures within
formal standard setting organization (SSOs), firms increasingly enter informal industry
alliances around standardization to better promote and sponsor their proprietary standard
solutions. Coordination in standard setting facilitates consensus-building to better control
technology inputs into standards (Axelrod et al., 1995). In order to influence outcomes of
standardization, firms need to use their market power, political and promotional skills and
form exclusive industry alliances (Weiss and Sibru, 1990). Recent empirical research provides
evidence that consortia members have advantages to influence the selection of standardized
technologies (Leiponen, 2008). In ICT, these technologies are often patented. Bekkers et al.
(2011) show that firms’ patent declarations are more related to involvement in standard
setting compared to a patent’s technical merits.
This article empirically measures the effects of firms’ participation in technologically
related and unrelated standards consortia on the inclusion of essential patents in standards. We
construct a dataset that combines membership information of over 45 standards consortia, of
which 21 have a direct liaison link to a formal standard, and add information on 45 patent
pools. Our unit of observation is firm pair per standard. Firms were paired when they co-
declare on the same standard. The explained variable is co-declaration of patents on the same
standard. We thus measure patented technology contributions to the standard. Using panel
data analysis we track 250 essential patent owning companies over ten years and observe
more than 60,000 patent declarations to all international standard bodies. We further inform
the whole sample of firms with characteristics such as size, financial measures and patent
counts. Results of our estimations provide positive significant effects on a firm’s ability to
introduce patented technology to a standard when being member of technologically related
standards consortia. In contrast, technologically unrelated consortia ties have no significant
influence on patent declaration. We further test if the size of the consortia influences the
consortia effect. Again, results of our regressions support our argument that an increase in
consortia memberships also increases a firm’s ability to introduce patents on standards.
This article is structured as follows. We start with a discussion of the relevant
literature and construct our hypothesis. In the following we present our database and analyze
first descriptive results. We then describe our empirical strategy and test our hypothesis in two
1 Shapiro and Variant (1999) describe the case of the HDTV standard, where Zenith undertook enormous effort to get their
technology and patents in the standard even though cross-licensing agreements were already agreed upon.

Theoretical Background and Hypothesis
130
specifications of a panel analysis. In conclusion, we review our previous hypothesis and
discuss our results.
2. Theoretical Background and Hypothesis
2.1 Standard Setting in ICT Markets
During the past decades, standard setting in ICT has emerged to be an important mechanism
of coordinating the transition of different technology generations (Besen and Farrell, 1994;
Simcoe 2012). Standards promote interoperability by ensuring a common language of
communication. This enables different technologies or products to work together. Standards
especially evolve in markets where returns increase when a large number of firms rely on the
same technology. This, the success of a standard depends on the installed base of consumers
(Arthur, 1988; David and Greenstein 1990). In general, standards are set as de facto or de jure
standards. De facto standards are often proprietary technologies promoted by dominant firms
or industry coalitions. If a de facto standard is supported by the market, bandwagon effects
might rule out competing technologies. A strand of theoretical literature discusses effects of
standards when network externalities are at place (Farrell and Saloner, 1986; Katz and
Shapiro, 1986).
In comparison, de jure standards are the results of a joint technology development
within a standard setting organization (SSO). SSOs help to overcome coordination problems
and ensure common agreement on standardized technologies. SSOs are non-profit
organizations, pursue consensus decisions and are voluntary and open to all interested
stakeholders (Farrell et al., 2007). Especially in ICT, SSOs have gained increasing
importance. Standards influence the value of technology or product markets that are created
upon a standardized platform (Simcoe, 2007). Owners of panted technologies often participate
in standard setting activities to influence the development of technology and promote their
own proprietary methods (Bessen and Maskin, 2009; Axelrod, 1995). This development has
increased competition within SSOs and fostered contributions of multiple participating firms.
Therefore standardized technologies are often subject to fragmented ownership of intellectual
property rights (IPRs) which have consequently raised issues of hold-up problems, ambush
strategies or royalty stacking (Shapiro, 2001).
Due to the rising number of patents that are declared to be essential to formal
standards (Simcoe, 2007) and the participation of firms that peruse a wide range of different
business models (Aoki and Nagoaka, 2004), achieving agreements in formal SSOs has

Theoretical Background and Hypothesis
131
become more difficult (Lamley, 2007). When firms prefer their own technology contribution
above others, vested interest may yield a war of attrition. This may slow down standardization
and delay consensus decision making processes (Farrell and Saloner, 1988; Farrell and
Simcoe, 2012). One the one hand participating in SSOs enables firms to receive network
effects benefits from common development and promotion of a standard. On the other hand
competition is more intense because technology specification in SSOs determines which firms
are able to compete in constructive product or technology markets (Katz and Shapiro, 1986;
Bekkers et al., 2002).
2.2 Firm Alliances and R&D Consortia
In order to overcome coordination problems in formal SSOs and to promote certain
technologies in more exclusive venues, firms increasingly form industry alliances to better
influence the evolution of technology standards (Leiponen, 2008, Rosenkopf et al., 2001).
Explicit industry alliances are formed to control technology inputs over the development of
standards. In such alliances firms divide R&D investments among members and exploit firm
specific specialties (David and Greenstein, 1990). R&D consortia are welfare enhancing when
supporting knowledge sharing opportunities and spill-over effects. Branstetter and Sakakibara
(1998) provide empirical evidence that consortia participation may increase R&D
investments. When firms sell substitute products, coordination in consortia might alleviate
wasteful duplication of R&D efforts to reduce investment costs (Katz, 1986; d'Aspremont and
Jacquemin, 1988).
In light of a strand of literature that discusses forum shopping activities of firms
choosing the best venue to introduce their technology contributions (Lerner and Tirole, 2006;
Chiao et al. 2007), firms may also participate in multiple standard setting organizations to
develop or promote the adoption of a particular standard (Axelrod et al., 1995). Especially in
ICT markets where technologies often indispensably work together, it is crucial to influence
the development of common standards in different alliances (Leiponen, 2009). Empirical
studies further support the argument that market power of coalitions, political skills or
promotional activities support technology selection in SSOs (Weiss and Sibru, 1990).
2.3 ICT Standards Consortia
In practice, consortia coexist with formal standardization rather than replacing it. In an
empirical analysis Blind and Gauch (2008) find a mostly complementary relationship between
standards consortia and formal standard bodies. Estimations claim that over 60% of all

Theoretical Background and Hypothesis
132
standards in the ICT sector are consortia standards. Albeit the discussions that standards
consortia are competing organizations to formal standard setting (Cargill, 2002), the current
standardization landscape tends to provide several forms of cooperation. There are formal
statements on direct ties between standards consortia and formal standards bodies, e.g. the
PAS (Publicly Available Specifications) fast track agreement or JTC1’s Approved References
Specifications (ARS) or the Partner Standards Development Organization (PSDO). Most
standards consortia also enter liaison agreements, which is a rather broad statement of
cooperation with formal standard bodies on specific topics.2 David and Shurmer (1996)
describe the case of the DVB (Digital Video Broadcasting) Group, a private industry
consortium which was responsible for drafting specifications that were later approved by
ETSI (European Telecommunications Standards Institute). Gauch (2008) shows how ECMA
(European Computer Manufacturers Association) specified DVD technologies that were later
approved at ISO (International Organization for Standardization).
Yet, there is no common definition for a standard consortia and the consortia
landscape has come to be very heterogeneous in characteristics such as technical issues,
structure, members, transparency and intellectual property policies (Hawkins, 1999).
However, some standards which were developed by consortia are widely accepted and of
great importance. When it comes to the question of IPR, voting procedures are not always
transparent. Standards consortia may thus function as a platform to lobby certain technologies
which are protected by patents (Lemley, 2002).
At firm level, membership in consortia and formal SSOs often overlap. Leiponen
(2008) finds that especially consortia with a close technical relationship to 3GPP tend to have
members that also participate in ETSI working groups. In this regard Hawkins (1999) names
different coordination benefits that arise from simultaneous participation in formal and
informal standard setting. From a firm’s perspective, a consortium is a forum to meet and
discuss technical contributions before introducing them to formal SSOs. Consortia members
jointly draft specifications to adjust them to market needs. However, standardizing firms
especially focus on promoting their own technology stakes (Simcoe, 2012). More predictable
outcomes in a cooperation help to control partners (Das and Teng, 2004). A consortium can
therefore also be an opportunity to better target the development of a firm’s own components.
This increases consensus with other members on technical issues that will later form the
standard.
2 The IETF (Internet Engineering Task Force) publishes all liaison agreements per specification
https://datatracker.ietf.org/liaison/ or the DVB liaison database in http://www.dvb.org/technology/standards/index.xml.

Theoretical Background and Hypothesis
133
As to the statement of a practitioner, firms especially support technologies of peers
they trust. Trust can be built by regular meetings and cooperation on related topics. As to Das
and Teng (1998) control and trust are the most important sources to support confidence in
partner cooperation. Trust is particularly important when firms have to rely on the
performance of their partners. Standard setting is a major example of partner reliability, since
standards determine constructive markets for technology and products. When a firm seeks to
promote its own technology input to formal SSOs, it would consequently get more support
from co-members trusting them. Trust is especially relevant when firms propose patented
solutions. Holders of essential patents can hold-up the use of a whole technology, even if the
patent only protects a minor component (Lemley and Shapiro, 2006; Farrell et al., 2007).
Empirical analyses have proven that companies that pre develop their contributions
in standards consortia find it easier to get a technology proposal accepted in a formal standard
body (Leiponen, 2008). Firms may thus especially promote solutions including their patented
technologies. Indeed, Bekkers et al. (2011) show that patent declarations are more related to
involvement in standard setting compared to a patent’s technical merits. Standard setting in
formal SSOs always is in need of consensus decisions. It is thus indispensable to cooperate
with other participating companies in order to influence technical trajectories in
standardizations. Delcamp and Leiponen (2012) provide evidence for an increasing R&D
cooperation between firms that enter standards consortia.
In conclusion, standards consortia are important for sharing knowledge, adjusting
and targeting technology development to better foster and promote own and preferred
patented technology solutions.
We thus derive our hypothesis that firms which participate in standards consortia
find it easier to introduce their patented solutions to formal standards. Firms may either have
direct or indirect consortia ties to co-members in SSOs. Indirect ties are ties where firms
cooperate on different technology topics in different standards consortia. Repeated meetings
to solve various technology problems might thus create trust and control in the partnership to
declare essential patents to standards:
H1: Participation in unrelated standards consortia increases firms’ ability to
integrate patented components to formal standards.
In comparison, firms can also cooperate in standards consortia that are technologically related
to the formal standard of observation. In liaison agreements, standards consortia directly
contribute to the development of the formal standard. Firms that are consortia members are

Data and Variables
134
thus able to pre-develop their patented solutions and introduce these to their co-members.
Again we hypnotize that consortia enable channels of control and trust to better declare
patents to formal standards:
H2: Participation in liaison standards consortia increases firms’ ability to integrate
patented components to formal standards.
As to Axelrod et al. (1995), firms prefer joining large standard alliances in order to have a
stronger sponsoring and a wider promotion of standards. Weiß and Sibru (1990) further
underline that consortia size is a significant determinant for supporting particular
technologies. We thus derive our third hypothesis:
H3: The size of standards consortia positively influences a firms’ ability to integrate
patented components to formal standards.
3. Data and Variables
3.1 Data
Our data sample consists of 250 companies that declared at least one essential patent to a
formal standard. To retrieve information on patent declarations, we exploited publicly
available data form all formal standard setting organizations (SSOs) such as ISO, IEC, JTC1 –
a joint committee of ISO and IEC – CEN/CENELEC, ITU-T, ITU-R, ETSI, and IEEE. All of
these SSOs have a formalized and comparable IP policy and require a declaration of essential
IPR. They further provide lists of patent declarations and give information on the declaring
firm, the date of declaration, the relevant standards and the patent number. In sum we
retrieved over 64,000 patent declarations, which represent all essential patents that have been
declared to formal SSOs (Blind et. al, 2011). Over 800 declaring entities could be distinctly
identified. We only used the top 250 corporations that are publicly traded for our analysis,
which together declared over 96% of all essential patents in our data.
SSOs suggest to firms to declare all IPR that is potentially essential to standards
(Lamley, 2009). According to ETSI’s IP policy all SSO members have to “disclose every
specific patent which might be essential to a specific specification before the specification is
adopted or amended”. Furthermore declaring firms have to “make a FRAND declaration

Data and Variables
135
(after the disclosure of the patent but in any event) before the specification is adopted or
amended”.3
Patent declarations differ in scope and quality depending on the provided information
of declaring firms. Some firms broadly state to have essential IPR for a standard project or a
bundle of standards, while others are very precise in indicating which patent they consider to
be essential to which standards, which standard versions or standard amendments. Some
patents are stated to be essential to several standards and some patents are only stated to be
essential to one or two standards. In our analysis we therefore treat every combination of
essential patents and standards as one declaration. If patents were declared to be essential to a
whole standard project we counted each standard patent pair within the bundle of standards.
SSO members are not impelled to declare essential IPR and SSOs have no means to
require a standardized form of declaration. However, the ETSI bylaws encourage participating
firms to “inform ETSI of essential IPRs in a timely fashion. In particular, a member
submitting a technical proposal for a standard or technical specification”.4 A formal proposal
thus always also requests a statement of possible essential IPR. All members contributing to
standardization therefore have to declare whether or not they own IPR that might be essential
to the proposal. As to the statement of a practitioner, members in SSOs very much rely on the
accuracy of each other’s declaration behavior. Participants would more likely agree to a
proposal of a firm that is trustworthy. Effective and credible patent declaration is thus a
matter of self-control. Furthermore SSOs require consensus reaching in all standardization
procedures. Firms might consequently veto against proposals that do not fulfill necessary
requirements of IPR declaration.5 SSOs are additionally able to adjust draft specifications in
light of changes in technology usage rights (Lamley, 2002). Thus there is a collective
incentive for all firms to disclose their standard essential IPRs. Due to consensus decision
making processes, misbehavior can be sanctioned in repeated games of proposal voting
procedures. However, coordination in standard setting might in cases of vested interests result
in a war of attrition (Farrell and Simcoe, 2012).
3 The ETSI Rules of Procedure (version of 30. November 2011) Annex 6: ETSI Intellectual Property Rights read in this respect on p. 34 and 35: 4Furthermore ETSI states “When an essential IPR relating to a particular standard or technical specification is brought to the attention of ETSI, the Director-General of ETSI shall immediately request the owner to give within three months an irrevocable undertaking in writing that it is prepared to grant irrevocable licences on fair, reasonable and nondiscriminatory terms and conditions..” The ETSI Rules of Procedure (version of 30. November 2011) Annex 6: ETSI Intellectual Property Rights read in this respect on p. 34 and 35: 5 “…general agreement, characterized by the absence of sustained opposition to substantial issues by any
important part of the concerned interests and by a process that involves seeking to take into account the views of all parties concerned and to reconcile any conicting arguments." (ISO/IEC Directives 2004, page 26)

Data and Variables
136
In recent years empirical research on evolutionary technology development (Bekkers
et al., 2011; Bekkers and Martinelli, 2012) as well as research on patent filing strategies
(Berger et al., 2012) or patent value analysis (Rysman and Simcoe, 2008) have proven that
data on patent declaration is a valuable indicator for a patent’s essentiality.
Table 1 gives a first overview of the industry sectors of essential patent owning
companies. Large companies usually do not only operate in a single sector; therefore data
analysis only includes primary sectors. Companies were informed by a four digit SIC code.
Table 1 solely displays two and three digit codes to gain a broader picture. The results display
a concentration on certain industries. Most companies (36.6%) operate in the electrical and
electronic equipment sector (SIC code 36). The concentration is even higher when the results
are weighted by the number of patent declarations per company and show a share of more
than 70% in the sectors of communication equipment (336) and electronic components (367).
SIC code: industry sector
number of companies
share
weighted by patent declaration
35: Industrial Machinery & Equipment 10 4.59% 3.08% 38: Instruments & Related Products 12 5.50% 3.30% 48: Communications 24 11.01% 5.22% 365: Household Audio & Video Equipment 17 7.80% 7.90% 366: Communication Equipment 31 14.22% 42.31% 367: Electronic Components and Accessories
34
15.60%
31.12%
737: Computer & Data Processing Services 28 12.84% 5.14% Others 62 28.44% 1.93% Table 1 Essential patent owning companies by industry SIC code
3.2 Variables
We use our sample of companies to build up a data panel for the periods of 2000-2009. Since
our goal is to measure inter firm behavior of co-declaration, we create a panel of firm pairs.
Firms are paired when they have both declared at least one patent to a formal standard. Our
unit of observation is firm pair per standard. Thus firms might be paired more than once when
they co-declared on more than one standard together.
The dependent variable of our analysis is patent declaration, which is a statement of a
company to own patents that are essential to a certain standard. We also create a variable that
counts patent declarations when both firms declare at the same time for the same standard of
observation.

Data and Variables
137
To gain information about standards consortia, we apply the CEN surveys of ICT
standards consortia from 2000 until 2009. We retrieved over 45 standards consortia and
matched them with formal standards where at least one patent was declared to be essential.
The matching was constructed by comparing the CEN survey’s technology classification of
consortia and the technical classification of standards’ ICS (International Classification of
Standards) classes provided by PERINORM6. In addition we tracked down all liaison
agreements of standards consortia to identify direct connections between standards consortia
and formal standards. A liaison agreement is an ad hoc statement between standards consortia
and formal SSOs to cooperate on a certain standard. ISO has a formal fast track agreement,
the PAS (Publicly Available Specifications), which allows sponsoring organizations to
receive formal accreditation of their specification within six to nine months7. JTC1 has a
similar policy of featuring Approved References Specifications (ARS).8 In total 45 different
informal consortia could be related to 115 formal standards including essential patents. Out of
the 45 consortia, 21 have a direct liaison link to the standards (a list of the consortia standard
match can be consulted in the appendix). An in-depth internet research revealed over 34,000
consortia memberships over ten years (2000-2009).9
We then identified 45 patent pools which can be related to formal standards10 and
discovered 84 pool licensors. To gather membership information of pools and consortia over
the past ten years, we used information of outdated webpages from the search engine of
www.archive.org.
Using the “Thomson One Banker” database, firms were informed by sales per year,
employees per year, R&D expenditure per year, such as industry SIC (Standard Industrial
Classification) codes. In addition we classify if firms are active on upstream or downstream
markets, using the business description database of “Thomson One Banker” and the
classification provided by Layne-Farrar and Lerner (2011). In addition we build variables that
compare differences within our firm-pair analysis. For example we relate for each year the
difference of the number of employees between two firms. Variables that compare the two
6 PERINORM is the world’s biggest standard database with bibliographic information on formal standards and is regularly updated by the SDOs DIN, BSI and AFNOR and includes all standards issued by the main formal international SSOs. 7 For further information please read the draft of the PAS approval cycle by ISO: http://www.bsigroup.com/upload/Standards%20&%20Publications/PSS/PSS_servicecycle.pdf 8 Examples of liaison agreements are the IETFs database in: https://datatracker.ietf.org/liaison or the DVB liaison database in http://www.dvb.org/technology/standards/index.xml. 9 Assisting this rather broad distinction we conduct a word count analysis on the consortia self-description abstracts, kindly provided by Andrew Updegrove. We use keywords such as “developing”, “creates”, “set standard” or “standardizes”. Appendix 1 provides a list of those consortia and standards for which a link could be established, as well as the narrower list of consortia contributing technologically. 10 All pools that exist around standardized technologies explicitly state the included patents and related standards.

Data and Variables
138
firms’ industry activity, market positions (upstream or downstream) as well as other firm
characteristics are created to control for firm size differences, industry differences as well as
market constellation differences within firm pairs.
Variable Description Obs Mean Std. Dev.
Min Max
Patent Declaration
Count of patent declarations per year
436,180 2 35 0 2,440
Both Firms Declare
Count of patent co-declarations of two firms per year
436,180 0 0 0 1
All Consortia Connections
Counts all ICT consortia connections of two firms
436,180 2 3 0 17
Liason Consortia Connections
Counts all consortia connections of two firms for a certain standard in liaison
436,180 0 0 0 1
Pool Member Connection
Counts all patent pool connections for two firms
436,180 0 1 0 9
Employees Counts employees per year 390,776 92,429 114,493 50 484,000 Sales Denotes sales per year 390,776 30,240 31,015 120 199,925 R&D Expenditure Denotes R&D expenditure per
year 390,776 1,881 1,981 454 9,010
Patent Files Counts patent files per year (only G & H)
206,550 3,611 4,746 100 21,376
St Patent Files Counts patent files per year (only standard specific IPCs)
206,550 193 370 88 5,274
Complement R&D Investment
Measures the relative difference of patent files in IPCs between two firms
163,566 0.018 0.045 0 1
Employee Difference
Counts the relative difference of employees between two firms
351,456 116,803 114,415 13 403,000
Sales Difference Denotes the relative difference of sales between two firms
351,456 32,972 27,558 688 109,925
R&D Expenditure Difference
Denotes the relative difference of R&D exp. between two firms
351,456 2,176 1,771 233 8,710
Patent Files Difference
Counts the relative difference of patent files between two firms
138,660 4,559 4,929 9 19,376
St Patent Files Difference
Counts the relative difference of standard specific patent files between two firms
138,660 236 427 7 4,803
Same Industry Counts one if two firms are active in the same industry (4-digit SIC code)
36,7880 0.093 0.291 0 1
Same Market Counts one if two firms are active on the same market level
41,6500 0.567 0.495 0 1
Table 2 Variables and Descriptive Statistics (250 Firms)

Data and Variables
139
To control for firms’ technological capabilities and opportunities, we created two measures of
patent files. Firstly a variable was constructed that counted all patent files per company and
year, using the patent database PatStat11 and the assignee firm matching methods of Thoma et
al. (2010). Secondly we conducted a patent file search that was restricted to certain IPC
(international patent classification) classes.
To distinctly reveal standard relevant IPC classes we used our data on patent
declarations, where firms state the patent numbers that are essential to the respective
standards. Firms’ patent files were then counted only for the identified standard relevant
IPCs.12 Patent files restricted to standard relevant IPCs should account for a firm’s technical
capabilities. To measure firms’ technological opportunities we created a second variable; a
broader count of patent files that counts all patent files in IPC classes G and H.13
We are able to measure precisely in which IPC classes firms of our sample file
patents. We furthermore know which of these IPC classes are relevant for which standards
(exploiting the info of essential patents). In order to compare the technical contributions of
two firms that have declared on the same standard, we relate the count of patent files per IPC
class within firm pairs. Thus we are able to measure if two firms patented in the same or in
different IPC classes that are relevant for the standard. In particular we proceeded as follows:
We aggregate IPC classes to the four digit level. First we calculate the relative patent files per
firm and per IPC class for the standard of observation. Secondly we compare ratios per IPC
class between the two firms in our observations. Thirdly we sum differences per year and per
firm pair connection. We are now able to compare the degree of complementary R&D
investments in standards in our firm-pair observation over time. The higher the difference of
our variable, the higher is the difference of technology development for the standard of
observation.
11 EPO Worldwide Patent Statistical Database. 12 The relevant technological field for each standard is identified using the 7-digit IPC classification of the declared essential patents. We thus revealed more than 1,400 relevant IPCs. We are thereby able to identify the relevant technological classes (IPC) that are relevant for each standard at a very precise level. This method is a novel way of measuring standard-specific R&D investment. We apply tests of timing, estimate technological positions of standards as well several tests of size measures to prove our proposed variable to be a sufficient indicator of standard-related R&D investment. The methodology and the various tests have been presented at the Patent Statistics for Decision Makers Conference 2011 at the USPTO 13 Over 95% of all essential patents are classified in the IPC G (Physics) and H (Electricity).

Descriptive Results
140
4. Descriptive Results
Over the past twenty years, numerous consortia were created in relation to standardization.14
Notwithstanding the notion that consortia compete with formal SSOs (Lerner and Tirol,
2006), in practice formal and informal standardization rather coexist (Blind and Gauch, 2008).
Hawkins (1999) further stresses that consortia may influence formal standardization both at
upstream and downstream levels and thus coordinate technological development. Figure 1
shows the development of consortia memberships in our sample between 2000 and 2009. We
counted periods of membership separately for each standard firm pair observation. In addition
we sum all patents as to the year of declaration. As to the limitations of our data, patent
declarations declined after 2002, while consortia memberships seemed to increase sharply
until 2004, but decreased after 2006.
Figure 1 Active consortia memberships and patent declarations per year (2000-2009)
In order to have a better understanding of the timing of patent declaration we connected the
patent data with bibliographic data on standard dynamics. We are thus able to compare the
timing of declaration as to the timing of standard development.
Figure 2 shows that most of the patents are declared right before or right after
standard release. However, we find observations where patents are declared up until 8 years
before standard release and up until 9 years thereafter. In comparison, firms rather begin to
join standards consortia in periods after standard release. The number of consortia
memberships peaks 6 years after the standard was already published. Both of these findings
14
Since 1995 the CEN survey provides a list of around 250 current ICT standards consortia, while Andrew
Updegrove lists over 700 consortia under less restrictive criteria. See Appendix 1 for a summary overview over
the Consortia listed in the surveys made by CEN and Andy Updegrove.
0
2000
4000
6000
8000
10000
12000
Pat
ent d
ecla
ratio
ns p
er s
tand
ardpat_dec_firm
0
50
100
150
200
250
2000 2001 2002 2003 2004 2005 2006 2007 2008 2009
Con
sort
ia M
embe
rshi
ps
Years
consortia memberships

Descriptive Results
141
indicate that standardization is an ongoing process that evolves over time and where a great
part of the innovation is still developed after the first version of the standard. Indeed
especially in ICT, generations of standards (MPEG1-MPEG4, GPRS-UMTS-LTE) are
constantly advanced to catch up with the pace of technology development (Bekkers et. al,
2002).
Figure 2 Active consortia memberships and patent declarations as to standard age
Companies that enter standards consortia have incentives that are connected to the
development or promotion of a standard. In our sample we identify firms’ consortia
connections in a broad sample of ICT standards consortia. Some of these consortia in fact
specify and develop technologies, while others rather promote the adoption or marketing of a
standardized technology. In comparison, standards consortia that have a liaison agreement to
cooperate on a specific standard project were only included in our sample when they
contributed to standardization on a technical level. Thus we are able to compare two levels of
consortia ties (direct and indirect). We seek to test whether the patent declaration behavior of
firms is connected to these different types of cooperation in our firm-pair sample. Therefore
we conduct a t-test analysis to compare if firms in our sample have a higher average number
of patent declarations when they are in firm connections throughout our measure of liaison
consortia, compared to no connections. We secondly conduct the same t-test for consortia
connections of our broad measure of all ICT consortia connections, compared to no
connections.
Results from table 3 show that firms that are members in consortia that are in liaison
with a formal standard seem to less likely declare patents on formal standards. In comparison,
firms that are connected throughout all ICT consortia declare on average significantly more
0
2000
4000
6000
8000
10000
12000
Sum
of P
aten
t Dec
lara
tions
pat_dec_firm
0
20
40
60
80
100
120
140
160
180
-17 -16 -15 -14 -13 -12 -11 -10 -9 -8 -7 -6 -5 -4 -3 -2 -1 0 1 2 3 4 5 6 7 8 9 10 11 12 13 14 15 16 17 18
Co
nso
rtia
Me
mb
ers
hip
Standard Life Time
consortia memberships

Descriptive Results
142
than firms which are not members. However, analysis is yet only able to reflect a broad
picture on the average number of patent declarations not differentiating among the sample of
standards. Furthermore, the t-test is yet not able to take into account other variables in our
sample that might explain the consortia membership effect. Differences of firm size, financial
resources or technology stock might influence both; the likelihood to join a standard consortia
and to declare patents on a formal standard.
Group Obs Mean Std. Err. Std. Dev. [95% Conf. Interval] not consortia member 40,486 18.039 0.828 166.653 16.416 19.663 consortia member 3,132 8.882 0.376 21.061 8.144 9.619 combined 43,618 17.382 0.769 160.674 15.874 18.890 diff 9.158 2.980 3.318 14.998 t = 3.073 degrees of freedom = 43,616 Pr(|T| > |t|) = 0.0021
t-test of the cumulative number of patent declarations by all ICT consortia co-membership Group Obs Mean Std. Err. Std. Dev. [95% Conf. Interval] not consortia member 12,908 9.717 1.098 124.695 7.566 11.868 consortia member 30,710 20.604 0.990 173.486 18.663 22.544 combined 43,618 17.382 0.769 160.674 15.874 18.890 diff -10.886 1.685 -14.188 -7.584 t = 3.073 degrees of freedom = 43,616 Pr(|T| > |t|) = 0.0021
Table 3 T-test of the cumulative number of patent declarations by liaison consortia co-memberships
Therefore we run a pair wise correlation analysis to test the coherence of patent declaration to
all variables of our sample (results can be consulted in the appendix). The analysis yet reveals
only weak correlations between firm pairs that both declare on the standard and direct liaison
consortia co-memberships. There are no significant correlations for patent declarations and
also no significant correlations for any of the two declaration counts. The strongest
correlations appear among co-memberships in patent pools, in standard consortia and also in
standards consortia that have a liaison with the standard of observation. These inter forum
correlations might be subject to size or a company specific effect. We further observe that
firms with high values in R&D expenditure, sales or employees tend to more often participate
in standards consortia. Interestingly, this effect diminishes for the direct liaison consortia tie.
R&D expenditure or patent files seem to have no correlation to patent declarations. Whereas
our measure of ICT patent files (G&H) as well as the count of standard specific patent files
shows strong correlations to size measures such as R&D expenditure, sales or employees.
Results are straight forward: big companies have more financial resources to enter alliances
and also to file more patents in standard related technologies. However, in order to better

Testing the Hypothesis
143
answer our hypothesis, we need to use a nonlinear regression estimator and control for firms
characteristics such as the size effect. All of the other correlation coefficients are in the
expected direction.
5. Testing the Hypothesis
We test our hypothesis of consortia firm tie effects using a poisson fixed effects estimation
with robust, clustered standard errors. To account for unobserved heterogeneity, we
systematically include fixed effects for our company-pair panel observations. As our
dependent variable is a count variable and overdispersed with respect to a poisson
distribution, we will use a poisson estimator with robust standard errors. We prefer the
poisson estimator with robust standard errors over a negative binomial estimator with fixed
effects, because the negative binomial estimator cannot totally control for fixed effects and
thus account for unobserved heterogeneity. Our basic regression model has the following
specification:
In our first model (M1) we estimate the influence of all ICT consortia connections for the firm
pairs in our panel. We control for firm characteristics such as R&D expenditure, employees
and our two counts of patent files per year. We lag all control variables by one year to control
for preceding changes. Unobserved heterogeneity between firms is controlled by using fixed

Testing the Hypothesis
144
effects for firm-pair standard observations. We furthermore wish to account for external
shocks such as the business cycle or technology-related policy changes. We therefore include
year dummies in all of our models. Our independent variable of consortia connections shows
no significant results. The estimated consortia member ties consider all connections between
two firms in the whole sample of 45 ICT standards consortia. Some of these consortia may
thus not be technically related to the observed standard for which firms declare patents. Our
results show that firm ties in unrelated standards consortia show no significant influence on
patent declaration to a specific standard. In model two (M2) we only measure firm ties in
standards consortia where we identified a liaison agreement between the observed standard
and the consortia. M2 confirms that co-membership in technically related standards consortia
positively influences the co-declaration of patents. When also including our broad measure of
overall consortia connections in model three (M3), the liaison consortia connection remains
positive and significant. The coefficient even increases. The correlation analysis has revealed
that firms which are members in standards consortia are more likely to also be a member in
patent pools, or vice versa. In model four (M4) we test for patent pool connections of our
firm-pair observation to control if the consortia ties are subject to a pool membership effect.
However, results again remain robust for our direct liaison consortia firm ties. Pool co-
memberships have no significant influence on patent declaration. To further control for effects
that accrue due to firm differences in size or technological stock (patent files) we include
variables that measure firm pair changes. As to M5, differences in employees have a positive
effect for co-declaration, while we find a negative correlation when firms differ in sales or
R&D expenditure. In M6 we further control for differences of patent files in ICT technologies
and standard specific technologies. Only ICT patent file differences show a significant
negative correlation with co-declaration of patents. In comparison to our count of standard
relevant patent files, where we measure firm capabilities, the ICT patent file variable reflects
technological opportunities. The result indicates that firms with diverging technology
opportunities find it harder to co-declare their patents. Our explanatory variable of direct
liaison consortia connections remains significant and positive in all models, while we find no
significant effects for technologically unrelated consortia. We thus reject H1 and confirm H2.
Participation in liaison standards consortia increases firms’ ability to declare patents on
formal standards, while participation in ICT consortia has no significant effect.

Testing the Hypothesis
145
DV=Patent Declaration
M1 M2 M3 M4 M5 M6
Variable Coef. (S.E.) Coef. (S.E.) Coef. (S.E.) Coef. (S.E.) Coef. (S.E.) Coef. (S.E.) All Consortia Connections
-0.064 (0.038)
-0.068 (0.037)
-0.068 (0.037)
-0.069 (0.038)
-0.068 (0.039)
Liaison Consortia Connections
0.600*** (0.21)
0.656*** (0.173)
0.656*** (0.173)
0.663*** (0.157)
0.657*** (0.156)
Pool Member Connection
0.484 (0.606)
0.487 (0.626)
0.497 (0.626)
Employee Difference1
0.002** (0.001)
0.002** (0.001)
Sales Difference1
-0.004* (0.003)
-0.004 (0.003)
R&D Expenditure Difference1
-0.063** (0.027)
-0.059** (0.025)
ICT Patent Files Difference1
-0.020* (0.012)
St Patent Files Difference1
-0.054 (0.152)
L1.Employees Firm1
0.007 (0.033)
0.0092 (0.034)
0.00828 (0.033)
0.00829 (0.033)
0.00446 (0.032)
0.004 (0.032)
L1.R&D Expenditure Firm1
-0.094 (0.121)
-0.112 (0.126)
-0.089 (0.122)
-0.089 (0.121)
-0.059 (0.122)
-0.061 (0.121)
L1. Patent Files Firm1
0.056 (0.042)
0.058 (0.045)
0.057 (0.041)
0.057 (0.041)
0.048 (0.038)
0.062 (0.040)
L1.ST Patent Files Firm1
-0.084 (0.617)
0.001 (0.667)
-0.126 (0.601)
-0.126 (0.601)
-0.057 (0.573)
-0.092 (0.536)
Year Dummies Included Included Included Included Included Included Log likelihood -256,139 -257,408 -254,625 -254,623 -252,072 -251,601 Observations 85,170 85,170 85,170 85,170 85,170 85,170 Groups 8,517 8,517 8,517 8,517 8,517 8,517 AIC 512,306 514,843 509,281 509,279 504,182 503,245 BIC 512,437 514,974 509,421 509,429 504,359 503,441 Notes: All models are estimated using the conditional fixed-effects poisson estimator with robust clustered standard errors (reported in parentheses). Standard errors are robust to arbitrary heteroskedacity and allow for serial correlation through clustering by firm. ∗∗∗ p < 0.001, ∗∗ p < 0.05, ∗ p < 0.1 implies significance levels respectively. 1 Coefficients multiplied by 1,000 to make effects visible.
Our main argument is that firms which are members in standards consortia have more explicit
knowledge on the standardized technologies, are more trustworthy for their consortia peers
and promote their technologies at earlier stages to become establish control over co-members
and become stronger in negotiating their patented technologies in formal standard setting
procedures. As to our panel analysis this argument is only true if we assume variation of
consortia memberships to be exogenous or constant over time. A firm might join a consortium
because it has technical stakes such as patented solutions that fit the standardized technology.

Testing the Hypothesis
146
Firms might further join consortia because they have enough employees, financial resources
or enter new markets. As long as we are able to control for variance such as firm size,
patenting or connections in other venues, we are able to isolate the effect of our consortia co-
membership variable. A causal relationship of consortia participation on patent declaration
can only be corroborated if unobserved effects do not change over time. Our results would
e.g. be biased in situations where unobserved events change both; firms’ incentives to join
standard consortia and incentives to declare patents on standards. We therefore introduce two
sources of exogenous variance that influence both, consortia participation and patent
declaration behavior.
We change our estimated specification and only focus on our variable of direct
liaison consortia ties, since we would like to exploit information on the direct connection
between standards and consortia. Furthermore we now observe if two firms in our observation
declare patents in parallel on the same standard in the same year. Simultaneous patent
declaration indicates a consensus decision on the same proposal or on time wise related
proposals. We therefore estimate the following equation:
We limit our observations to firm pairs on standards where we identified a liaison consortium.
This reduces our sample to 23,496 observations and 2,450 firm pair standard groups. Our

Testing the Hypothesis
147
explained variable is now connected to both firms in our firm pair specification. We thus
control for variances of firm characteristics for both firms in all models. Again we also
control for between firm differences over time. In model six (M6) we introduce our liaison
consortia tie variable to test if direct connections also have an effect when two firms declare
patents in parallel. Again we find a significant positive effect. As to our third hypothesis (H3)
we expected larger consortia to have a stronger effect on co-declaration behavior. In model
seven (M7) we introduce a consortia size variable that counts membership over time. Our
results confirm our H3 and reveal a positive effect of consortia size on a member’s ability to
introduce patents on standards. Our control variable of firm differences in sales now points to
a negative connection to co-declaration. We argued that financial resources could in fact
influence consortia participation due to membership fees or other expenses. Due to direct
connections of consortia and standard pairs we are now able to inform membership fees for
each consortium. These fees differ in prices depending on voting power and levels of
participation. When consortia offer different tiers of membership or connect their fees to the
participant’s amount of sales, the difference between the highest and lowest fee is
considerably large. We include a variable that measures the membership fee level differences
and interact it with the between firm sales difference. Our membership fee variable is time
invariant and thus not included in our fixed effect model separately. Results indicate that if
consortia have a high difference in their price structure, the negative effect of sales difference
decreases (M8). Tiered membership fees thus mitigate inequalities in the amount for sales. In
model nine (M9) we introduce a variable that measures the degree of complement R&D
investments in standards. This variable compares patent files in standard relevant IPC classes
between the firms of observation. Thus we do not compare the amount of R&D investment
but the technical direction of investment. Model nine shows a negative effect, meaning that in
situations where firms increasingly invest in different technologies we find fewer co-
declarations of patents.
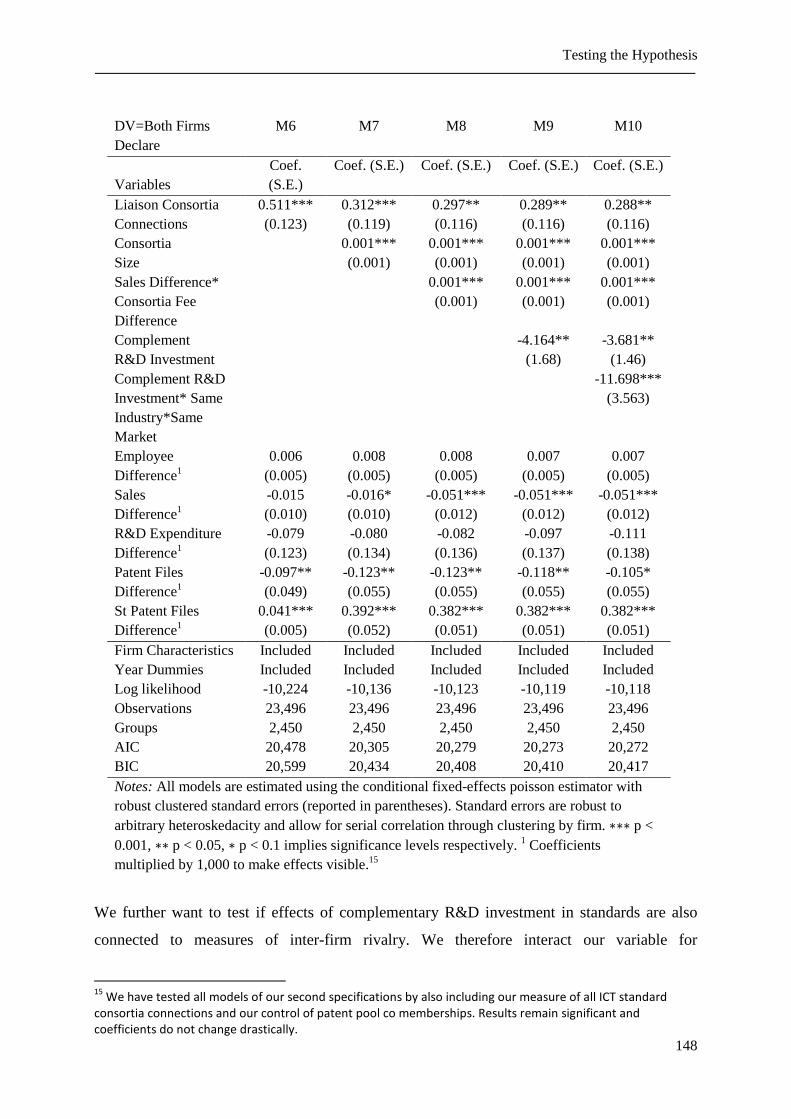
Testing the Hypothesis
148
DV=Both Firms Declare
M6 M7 M8 M9 M10
Variables Coef. (S.E.)
Coef. (S.E.) Coef. (S.E.) Coef. (S.E.) Coef. (S.E.)
Liaison Consortia Connections
0.511*** (0.123)
0.312*** (0.119)
0.297** (0.116)
0.289** (0.116)
0.288** (0.116)
Consortia Size
0.001*** (0.001)
0.001*** (0.001)
0.001*** (0.001)
0.001*** (0.001)
Sales Difference* Consortia Fee Difference
0.001*** (0.001)
0.001*** (0.001)
0.001*** (0.001)
Complement R&D Investment
-4.164** (1.68)
-3.681** (1.46)
Complement R&D Investment* Same Industry*Same Market
-11.698*** (3.563)
Employee Difference1
0.006 (0.005)
0.008 (0.005)
0.008 (0.005)
0.007 (0.005)
0.007 (0.005)
Sales Difference1
-0.015 (0.010)
-0.016* (0.010)
-0.051*** (0.012)
-0.051*** (0.012)
-0.051*** (0.012)
R&D Expenditure Difference1
-0.079 (0.123)
-0.080 (0.134)
-0.082 (0.136)
-0.097 (0.137)
-0.111 (0.138)
Patent Files Difference1
-0.097** (0.049)
-0.123** (0.055)
-0.123** (0.055)
-0.118** (0.055)
-0.105* (0.055)
St Patent Files Difference1
0.041*** (0.005)
0.392*** (0.052)
0.382*** (0.051)
0.382*** (0.051)
0.382*** (0.051)
Firm Characteristics Included Included Included Included Included Year Dummies Included Included Included Included Included Log likelihood -10,224 -10,136 -10,123 -10,119 -10,118 Observations 23,496 23,496 23,496 23,496 23,496 Groups 2,450 2,450 2,450 2,450 2,450 AIC 20,478 20,305 20,279 20,273 20,272 BIC 20,599 20,434 20,408 20,410 20,417 Notes: All models are estimated using the conditional fixed-effects poisson estimator with robust clustered standard errors (reported in parentheses). Standard errors are robust to arbitrary heteroskedacity and allow for serial correlation through clustering by firm. ∗∗∗ p < 0.001, ∗∗ p < 0.05, ∗ p < 0.1 implies significance levels respectively. 1 Coefficients multiplied by 1,000 to make effects visible.15
We further want to test if effects of complementary R&D investment in standards are also
connected to measures of inter-firm rivalry. We therefore interact our variable for
15
We have tested all models of our second specifications by also including our measure of all ICT standard
consortia connections and our control of patent pool co memberships. Results remain significant and
coefficients do not change drastically.

Conclusion
149
complement R&D investment with a dummy variable that equals one if firms are active in the
same industry (4 digit SIC code level) and further interact both variables with a variable that
equals one if both firms are active on the same market level (upstream or downstream
respectively). Our dummy variables are time invariant and thus not included in our fixed
effect model separately. Results indicate that firms with a high degree of rivalry are less likely
co-declare when they invest in technologically different standard components. Indeed as to
Axelrod, et al. (1995), rivalry increases when firms provide technologically different or
incompatible solutions to standard setting and when they are active in the same market
segment. Our results further confirm that these firms less likely co-declare and thus mutually
agree to integrate patented solutions into standards.
All of the models of our second specification show positive significant correlations
between liaison consortia firm ties and patent declaration. We introduced two variables of
exogenous variance to test if these events also influence our dependent variable and thus
indicate somewhat causal effects of consortia participation. Our first variable of consortia size
changes is, from the perspective of the participating firm, an exogenous event. The size of the
consortia is caused by other firms entering or leaving the consortia. These decisions are firm
individual and are usually not influenced by other consortia members. The second variable
that represents exogenous variation is our measure of complementary R&D investments. Even
though consortia co-members cooperate in standards consortia, R&D investments decisions
are still independent to a certain degree. Moreover we especially find significant negative
effects on co-declaration for rivalry firms of our sample. Independent investment decisions
are especially expected for rivalry firms. Changes in complementary R&D investments for
standards thus influence each firm’s ability to co-declare independently.
6. Conclusion
This article investigates cooperative activities of 250 firms that are active in formal ICT
standards setting. Our results suggest that participating firms in industry standards consortia
find it easier to introduce their patented technology components to formal standards,
compared to others. However, we only confirm the positive consortia member effect when
standards consortia have a liaison agreement with the standard of observation. We further
provide significant results for a positive size effect of standards consortia. The increase in
consortia memberships thus also increases a firm’s ability to introduce patented components
into standards.
Conclusion
150
In this article we identified constellations in which two firms mutually agree to have
patented components integrated into standards. Besides a firms’ human capital, financial
resources or technical capabilities, we investigated whether a firm’s cooperative activities
influences the technology selection processes. We especially highlight two channels of how
firms influence their peers: control and trust. Control over partners is an important
determinant to maintain negotiation power in promoting proprietary solutions. Standards
consortia are venues where members coordinate to better target technology development to be
introduced into the formal standard setting. More predictable outcomes in technology
development foster partner control. Trust is crucial since essential patents can block whole
technologies and enable firms to control whole markets. If a firm owns components of a
commonly agreed standard, partner firms have to trust their co-members not to exploit these
situations. In comparison to formal SSOs, standards consortia are industry alliances of
likeminded companies. Standards consortia meet on a more regularly basis and thus provide a
platform where firms can discuss and exchange ideas. Firms often pre disclose their
technologies and adjust them to better target technology needs. Increasing cooperation,
knowledge exchange and transparency help firms to build up trustworthy relationships among
peers.
In this article we provide evidence that competition on standardized platforms is
especially connected to firms’ cooperative activities around standardization. It is crucial to
coordinate with peers on technology development to better influence the technology selection
process. However, firms have to carefully choose their standards consortia in terms of
technical scope and focus. Membership in technically related consortia may increase the
ability to position patented technologies into formal SSOs, while participation in unrelated
consortia may have no effect. The results show that meeting peers in different venues for
different technology problems is no channel of influencing specific technology standards.
Furthermore firms should seek to enter consortia with a large member base. The more
members consortia gather, the more support can be expected in sponsoring and promoting a
standard. Especially when membership between standards consortia and SSOs overlaps,
firm’s ability to influence the outcome of standard setting is stronger when supported by more
consortia co-members.

References
151
References
Arthur, W. B. (1988): Competing Technologies: An Overview, in Technical Change and Economic, Theory, Dosi, et al. (eds.). London: Pinter Publishers.
Axelrod, R., S. Bennett, E. Bruderer, W. Mitchell, R. Thomas. (1995): Coalition formation in standard-setting alliances. Management Science 41(9) 1493–1508.
Aoki, R., Nagaoka, S. (2004): The Consortium Standard and Patent Pools. Hi-Stat Discussion Paper Series.
Bekkers R, Duysters G, Verspagen B. (2002): Intellectual property rights, strategic technology agreements and market structure. The case of GSM. Research Policy 31, 1141–1161.
Bekkers, R., Bongard, R., Nuvolari, A. (2011): An empirical study on the determinants of essential patent claims in compatibility standards. Research Policy 40, 1001-1015.
Bekkers, R., Martinelli, A. (2012): Knowledge positions in high-tech markets: Trajectories, standards, strategies and true innovators, Technological Forecasting Social Change (in print).
Berger, F., Blind, K., Thumm, N. (2012): Filing behaviour regarding essential patents in industry standards, Research Policy 41, 216–225.
Besen, S. M., Farrell, J. (1994): Choosing How to Compete: Strategies and Tactics in Standardization. Journal of Economic Perspectives 8-2, 117–31.
Bessen, J., Maskin, E. (2009): Sequential innovation, patents, and imitation. RAND Journal of Economics 40, 611-635.
Blind, K., Gauch, S. (2008): Trends in ICT standards: The relationship between European standardization bodies and standards consortia. Telecommunications Policy 32, 503-513.
Branstetter, L. and Sakakibara, M. (1998): Japanese Research Consortia: A microeconometric Analysis of Industrial Policy. The Journal of Industrial Economics 46, 207–233.
Cargill, C. (2002): Intellectual Property Rights and Standards Setting Organizations: An Overview of failed evolution. A Report Issued By the U.S. Department of Justice and the Federal Trade Commission.
Chiao, B., Lerner, J., Tirole, J. (2007): The Rules of Standard Setting Organizations: An Empirical Analysis. The RAND Journal of Economics 38, 905-930.
Cusumano, M., Gawer, A. (2002): The elements of platform leadership. MIT Sloan Management Review 43, 51-58.
D'Aspremont, C., and Jacquemin, A. (1988): Cooperative and Noncooperative R&D in Duopoly with Spillovers. American Economic Review 78-5, 1133-1137.
David, P. A., Shurmer, M. (1996): Formal standards-setting for global telecommunications and information services. Towards an institutional regime transformation. Telecommunications Policy 20, 789-815.
Das, T. K.; Teng, B.-S. (1998): Between Trust and Control: Developing Confidence in Partner Cooperation in Alliances. The Academy of Management Review 23-3, 491-512.
Das, T. K.; Teng, B.-S. (2001): Trust, Control, and Risk in Strategic Alliances: An Integrated Framework. Organization Studies 22, 2, 251-283.

References
152
David, P. A., Greenstein, S. (1990): The economics of compatibility standards: An introduction to recent research. Economics of Innovation and New Technology 1, 3-42.
Delcamp, H., Leiponen, A. (2012): Innovating Standards Through Informal Consortia: The Case of Wireless Telecommunications. NBERWorking Paper Series.
Farrell, J., Saloner, G. (1985) Standardization, Compatibility and Innovation, RAND Journal of Economics 16, 70-83.
Farrell, J., Saloner, G. (1986): Installed Base and Compatibility: Innovation, Product Preannouncements, and Predation, American Economic Review 76-5, 940-955.
Farrell, J., Saloner, G. (1988): Coordination through Committees and Marekts, RAND Journal of Economics 19-2, 235-252.
Farrell J., Simcoe, T. (2012): Choosing the Rules for Consensus Standardization. RAND Journal of Economics, forthcoming
Farrell, J., Hayes, J., Shapiro, C., Sullivan, T. (2007): Standard setting, patents, and hold-up. Antitrust Law Journal 3, 603-670.
Gauch, S. (2008): Dynamics and effects of competing standards of recordable DVD-media Author(s). Gauch, S. Source Egyedi, T.M.; Blind, K.: The dynamics of standards Cheltenham: Elgar, 2008. ISBN: 978-1-84720-486-8 ISBN: 1-84720-486-4,47-67.
Hawkins, R. (1999): The rise of consortia in the information and communication technology industries: emerging implications for policy. Telecommunications Policy 23, 159-173.
Hovenkamp, H. J. (2008): Patent Continuations, Patent Deception, and Standard Setting: the Rambus and Broadcom decisions, working paper.
Katz M., Shapiro C. (1985): Network externalities, competition, and compatibility. American Economic Review 75, 424–440.
Katz, M. (1986): An Analysis of Cooperative Research and Development. Rand Journal of Economics 17-4, 527-543.
Katz, M., Shapiro, C. (1986): Technology Adoption in the Presence of Network Externalities. Journal of Political Economy 94-4, 822-841.
Layne-Farrar A, Lerner J. (2010): To Join or not to Join: Examining Patent Pool Participation and Rent Sharing Rules. International Journal of Industrial Organization 29- 2, 294–303.
Leiponen, A. (2008): Competing Through Cooperation: The Organization of Standard Setting in Wireless Telecommunications. Management Science 54-11,1904-1919.
Lemley, M. A. (2002) Intellectual Property Rights and Standard-Setting Organizations. California Law Review 90, 1889-1980.
Lemley, M., Shapiro, C. (2006): Patent Holdup and Royalty Stacking, Texas Law Review 81, 1991-2044.
Lemley, M. A. (2007): Ten Things to do About Patent Holdup of Standards (And One Not To). Boston College Law Review.
Lerner, J., Tirole, J. (2006): A model of forum shopping. American Economic Review 96, 1091-1113.
Shapiro, C., Varian H. (1999): Information Rules: A Strategic Guide to Network to Network Economy, Harvard Business School Press, Boston MA.

References
153
Shapiro, C. (2001) Navigating the Patent Thicket: Cross Licenses, Patents Pools, and Standard Setting. In: A Jaffe, J Lerner et S, Stern (Eds), Innovation Policy and the Economy, vol. 1. MIT Press.
Simcoe T. (2007): Explaining the Increase in Intellectual Property Disclosure. In: Sheri Bolin (Eds), The Standards Edge: Golden Mean. Ann Arbor: Bolin Communications.
Simcoe, T. (2012): Standard Setting Committees: Consensus Governance for Shared Technology Platforms, American Economic Review 102-1, 305-336.
Thoma G., S. Torrisi, Gambardella, A., Guellec, D., Hall, B. H., Harhoff ,D. (2010): Harmonizing and Combining Large Datasets. An Application to Firm-Level Patent and Accounting Data, NBER Working Paper 15851.
Rosenkopf, L., Metiu A. and George, V. (2001): From the Bottom Up? Technical Committee Activity and Alliance Formation. Administrative Science Quarterly 46, 748-772
Rysman, M., Simcoe. T. (2008): Patents and the Performance of Voluntary Standard Setting Organizations, Management Science 54-11, 1920-1934.
Weiss, M. B. H., M. Sirbu. (1990): Technological choice in voluntary standards committees: An empirical analysis. Economic Innovation and New Technology 1, 111–133.

Appendix
154
Appendix
Consortium in Liaison Standard Average Fees
Fees High-Low Difference
Consortium in Liaison Standard Average Fees
Fees High-Low Difference
1394TA - The 1394 High Performance Serial Bus Trade Association
IEEE1394 5250 9500 INCITS ISO/IEC11889-3 22500 25000
ACCELLERA IEEE1800/IEC62530 10000 10000 INCITS ISO/IEC11889-4 22500 25000 Cable Laboratories IEEE802.1Q . . INCITS ISO/IEC13818-1/ITU-
TH.220.0 22500 25000
DVB – Digital Video Broadcasting Project
EN300468 10000 0 INCITS ISO/IEC13818-2/ITU-TH.262
22500 25000
DVB – Digital Video Broadcasting Project
EN301958 10000 0 INCITS ISO/IEC13818-3 22500 25000
DVB – Digital Video Broadcasting Project
EN302304 10000 0 INCITS ISO/IEC13818-7 22500 25000
DVB – Digital Video Broadcasting Project
EN302583 10000 0 INCITS ISO/IEC14443-2 22500 25000
EPCglobal ISO/IEC18000-6 . . INCITS ISO/IEC14443-3 22500 25000 Homeplug IEEE1901 6500 6000 INCITS ISO/IEC14443-4 22500 25000 IETF ES201108 0 0 ISMA ISO/IEC14496-1 3000 1000 IETF ES202050 0 0 ISMA ISO/IEC14496-10 3000 1000 IETF ES202212 0 0 ISMA ISO/IEC14496-
10/ITUH.264 3000 1000
IETF G.711 0 0 ISMA ISO/IEC14496-2 3000 1000 IETF G.722 0 0 ISMA ISO/IEC14496-3 3000 1000 IETF H.263 0 0 MEF IEEE802.1X 7500 15000 IETF IEEE802.21 0 0 MPEGIF ISO/IEC14496-12 1650 2700 IETF IEEE802.3/ISOIEC8802-3 0 0 MPEGIF ISO/IEC14496-15 1650 2700 IETF IEEE802.5/ISOIEC8802-5 0 0 MPEGIF ISO/IEC14496-18 1650 2700 IETF ISO/IEC15444-1 0 0 MPEGIF ISO/IEC14496-4 1650 2700 IETF ISO/IEC15444-12 0 0 MPEGIF ISO/IEC14496-5 1650 2700 IETF ISO/IEC15444-2 0 0 MPEGIF ISO/IEC14496-6 1650 2700 IETF ISO/IEC15444-3 0 0 NFC Forum ISO/IEC18092 25750 48500 IETF V.44 0 0 OCP-IP IEEE1149.1 12500 25000 IMTC H.323 4250 8500 ODVA IEEE1588/IEC61588 50500 99000

Appendix
155
INCITS ISO/IEC10918-1/ITU-TT.81
22500 25000 UPnP Forum ISO/IECDIS29341 2500 5000
INCITS ISO/IEC11172-1 22500 25000 Wi-Fi Alliance IEEE802.11/ISOIEC8802-11
10000 10000
INCITS ISO/IEC11172-2 22500 25000 WiMax IEEE802.16 22500 35000 INCITS ISO/IEC11172-3 22500 25000 WiMedia Alliance IEEE802.15.3 13750 22500 INCITS ISO/IEC11889-2 22500 25000 WORLDDAB FORUM ETS300401 12000 0 INCITS ISO/IEC11889-1 22500 25000 ZigBee IEEE802.15.4 26750 46500
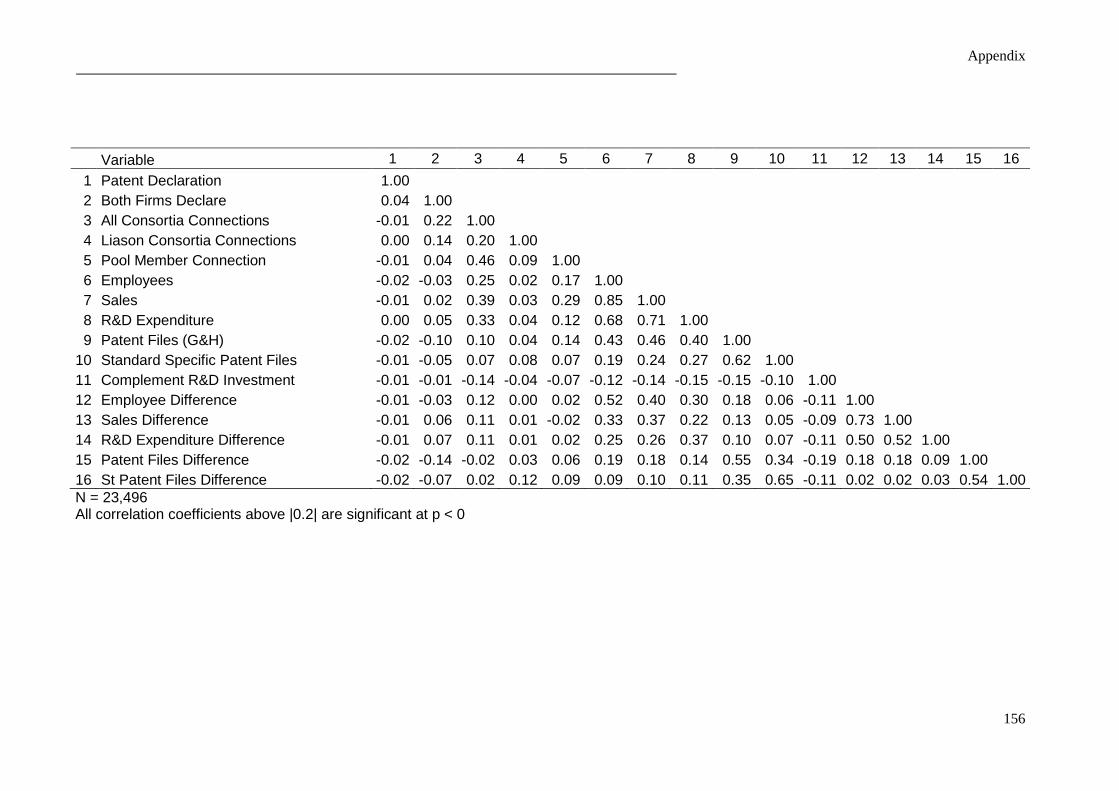
Appendix
156
Variable 1 2 3 4 5 6 7 8 9 10 11 12 13 14 15 16
1 Patent Declaration 1.00
2 Both Firms Declare 0.04 1.00
3 All Consortia Connections -0.01 0.22 1.00
4 Liason Consortia Connections 0.00 0.14 0.20 1.00
5 Pool Member Connection -0.01 0.04 0.46 0.09 1.00
6 Employees -0.02 -0.03 0.25 0.02 0.17 1.00
7 Sales -0.01 0.02 0.39 0.03 0.29 0.85 1.00
8 R&D Expenditure 0.00 0.05 0.33 0.04 0.12 0.68 0.71 1.00
9 Patent Files (G&H) -0.02 -0.10 0.10 0.04 0.14 0.43 0.46 0.40 1.00
10 Standard Specific Patent Files -0.01 -0.05 0.07 0.08 0.07 0.19 0.24 0.27 0.62 1.00
11 Complement R&D Investment -0.01 -0.01 -0.14 -0.04 -0.07 -0.12 -0.14 -0.15 -0.15 -0.10 1.00
12 Employee Difference -0.01 -0.03 0.12 0.00 0.02 0.52 0.40 0.30 0.18 0.06 -0.11 1.00
13 Sales Difference -0.01 0.06 0.11 0.01 -0.02 0.33 0.37 0.22 0.13 0.05 -0.09 0.73 1.00
14 R&D Expenditure Difference -0.01 0.07 0.11 0.01 0.02 0.25 0.26 0.37 0.10 0.07 -0.11 0.50 0.52 1.00
15 Patent Files Difference -0.02 -0.14 -0.02 0.03 0.06 0.19 0.18 0.14 0.55 0.34 -0.19 0.18 0.18 0.09 1.00
16 St Patent Files Difference -0.02 -0.07 0.02 0.12 0.09 0.09 0.10 0.11 0.35 0.65 -0.11 0.02 0.02 0.03 0.54 1.00 N = 23,496 All correlation coefficients above |0.2| are significant at p < 0

157
Standard essential patents to boost financial returns
Abstract
This article investigates how patents that are essential to a technology standard influence
firms’ financial performance. Standards enable interoperability and communication on a
technology platform. In practice, most innovative applications build upon interoperable
standardized technologies. In recent years, a large part of the competition on technology has
been moving upwards at the standard setting level. Especially in ICT (information and
communication technology) where innovation is often cumulative, it is crucial to own
essential patents to maintain market positions. We test the influence of declaring a patent to a
standard on financial performance using a rich dataset of firms active in ICT standard
setting. Our results indicate a curvilinear (inverse U-shaped) relationship of patent
declarations on firms’ return on assets (ROA). This effect lasts for one year, while the
incremental effect is higher for patents declared to informal SSOs (standard setting
organizations) when comparing declarations to formal SSOs. We further estimate the optimal
number of patent declarations and find a higher optimal level of financial return for declaring
patents to formal standards. The curvilinear relationship suggests that firms should balance
their patent portfolio by introducing a share of patents into standards and by holding a share
of patents on standard constructive technologies. Our results indicate that the effects of
patenting around standardization depend on the standardizing SSOs as well as the level of
patenting. In order to realize an optimal level of financial returns, we suggest firms evaluate
their patent portfolio before selecting a standard setting forum. Valuable patent portfolios
generate higher incremental returns in informal SSOs, while larger patent portfolios reach
higher optimal return levels in formal SSOs.
158
Contents
1. Introduction ............................................................................................................ 159
2. Literature and Theory ............................................................................................. 161
2.1 Patents and Patent Value Indicators ................................................................. 162
2.2 Essential Patents and Standard Setting............................................................. 163
2.3 The Return on Assets ....................................................................................... 165
2.4 Theory and Hypotheses .................................................................................... 165
3. Methodology .......................................................................................................... 170
3.1 Model Setup ..................................................................................................... 170
3.2 Definition of the hypothesized effect on ROA................................................. 171
3.3 Estimation Method ........................................................................................... 173
3.4 The Data ........................................................................................................... 174
3.5 Variables and Summary Statistics .................................................................... 176
4. Empirical Results ................................................................................................... 178
4.1 Bivariate Analyses............................................................................................ 178
4.2 Multivariate Analysis ....................................................................................... 180
4.3 Robustness Check ............................................................................................ 189
5. Discussion of the Results ....................................................................................... 192
References ..................................................................................................................... 195
Appendix: Robustness checks ....................................................................................... 199

Introduction
159
1. Introduction
A firm’s innovative capacity is crucial to maintaining competitive advantages in knowledge
resources, technology advances, price competitions and market positions. In recent years
scholars have increased their investigations of intellectual property rights (IPRs) and their
influence on firms’ financial performance (Hall et al., 2005; Reitzig and Puranam, 2009).
While most of the research examines different factors of patent value, only few analyses have
been conducted that shed light on the positioning of patents, such as a patent’s essentiality to a
technology standard. The commercialization of a technology in ICT (information and
communication technology) markets often requires licensing agreements among multiple
patentees (Shapiro, 2000; Graevenitz et al., 2011). In this context, ICT standardization has
developed to be much more demanding in terms of R&D and now represents a key strategic
stake for companies to foster the value of their (patented) technology by having it approved as
part of an industry-wide standard. Patents that would necessarily be infringed by any
implementation or adoption of a standard are called essential patents (Bekkers et al., 2001;
Simcoe, 2007). The essentiality of a patent has an indispensable character in the adoption of
standardized technologies. Patents incorporated into standards can hold-up the use of a whole
technology, even if the patent only protects a minor component (Farrell et al., 2007). The
empirical analyses of Bekkers et al. (2002,2011) have shown that standard essential patents
qualify firms to control market positions in network industries.
Yet, there is only little research that examines the impact of standard setting on a
company’s financial performance. Waguespack and Fleming (2009) show that participation in
SSOs increases the likelihood of a buy-out of start-ups, yet without analyzing performance
Introduction
160
measurements. Aggarwal et al. (2011) provide empirical evidence of a positive relationship of
a companies’ participation in standard setting and returns on stock markets.
The aim of this article is to extend the current analyses by examining the impact of
standard essential patents on a company’s financial performance measured by ROA. While
applying measurements of patent value, such as the average number of forward citations and
the average patent family size of a company's patent portfolio (Narin and Noma, 1987;
Trajtenberg, 1990), we focus on information of a patents’ declaration to a standard. We
therefore compiled over 65,000 patent declarations by formal SSOs1 (Standard Setting
Organizations) and informal SSOs2. Patent declaration statements provide information on the
patent number, the patent holder and the timing of declaration. To control for a company’s
licensing strategy we further added information on firms’ patent pool memberships connected
to essential patents. We created a data panel built upon company level and gathered
information on the total amount of sales, R&D expenditure, number of employees and return
on assets per year and per company between 2000 and 2007.
To assess the impact of essential patents on a company’s financial performance, we
conducted bivariate as well as multivariate analyses, using return on assets (ROA) as our
explained variable. Our results provide evidence that declaring essential patents to formal and
informal SSOs has a curvilinear (inverted U-shaped) effect on financial returns. When
comparing the coefficients of our explanatory variables, we further find the incremental
impact of essential patents declared to informal SSOs to be stronger compared to patents
declared to formal SSOs. We employed additional analyses to identify the optimal level of
patent declarations which is higher for formal standards. Patents declared to informal
1 ISO, IEC, JTC1-a joint committee of ISO and IEC, CEN/CENELEC, ITU-T, ITU-R, ETSI, and IEEE. 2 IETF, TIA, OASIS, OMA, the Broadband Forum and the MSF Forum.

Literature and Theory
161
standards in comparison may even have negative effects on ROA beyond an optimal level of
patent declaration. To also assess the lasting effects we further tested models with time lags.
The effect of patent declarations remains robust up to a time lag of one year. Essential patents
start to have no significant impact when lagged by two years or more.
The curvilinear relationship of a firm’s patent declaration and ROA suggests that
firms need to balance their patent portfolio by introducing patents into standards not beyond
an optimal level. Depending on the quality and size of a firm’s patent portfolio firms should
further select the most beneficial forum of standard setting. Our results show that incremental
returns are higher for declaring patents to informal SSOs, while the optimal level of patent
declaration that generates positive returns is higher for formal SSOs. We thus suggest firms
with large scale patent portfolios to declare to formal SSOs, while high quality patents should
be introduced to informal SSOs where patents gain higher returns.
The remainder of this paper is structured as follows. In our theoretical section we
discuss the measurement of patent value indicators as well as the role of patents in standard
setting and indicators of financial performance. We then motivate our hypothesis, describe
our database and define our methodological approach. Subsequently we run regression
models to test our hypothesis. We conduct further robustness tests and finally conclude in our
last section.
1. Literature and Theory
The influence of a company’s technology assets on its financial performance has been studied
extensively. Analyses by Griliches (1981) and Narin and Noma (1987) were among the first
to measure different indicators of patents to influence a company’s sales, profits or market
value. In the following we will discuss several indicators of patent value, patent essentiality to
standards as well as the measurement of financial performance.

Literature and Theory
162
2.1 Patents and Patent Value Indicators
Patent applications and patent grants are probably the most important indicators for the
technological output of innovation processes within companies. Especially in high-tech areas,
such as ICT and software, the number of patents can be assumed to exert a positive influence
on the financial performance of a company (e.g. Hall et al., 2007; Hall and MacGarvie, 2010).
Large patent portfolios reflect increased R&D efforts and thus greater innovative output,
which has been shown to influence a firm’s performance in various ways. A large patent
output can be seen as a positive market signal (e.g. Hall et al. 2005) also affecting firms'
profitability (Bloom and van Reenen, 2002, Ernst, 2001). Large patent portfolios are also
strategically useful, for example to block other market participants' innovative endeavors, to
displace smaller competitors in relevant markets, to increase the chances for license or
commercial agreements, ease the access to the capital market and increase a company's
reputation (Blind et al., 2006).
Since patents, however, differ from one another both in economic and technological value,
just counting patents could lead to a distorted picture of a company's technological base.
Therefore, some additional indicators have been proposed to correct for the quality or value of
patents. The most common and widely used indicator to determine patent quality is patent
forward citations (Narin and Noma, 1987; Trajtenberg, 1990). The number of forward
citations (citations a patent receives from subsequent patents) is assumed to measure the
degree to which a patent contributes to further developing advanced technology. Thus,
forward citations can be regarded as an indicator of the technological significance of a patent
(Albert et al., 1991; Blind et al., 2009; Hall and Ziedonis, 2001), although it has been
evaluated to be rather noisy indicator (Alcacer et al., 2009; Alcacer and Gittelman, 2006; Hall
and Ziedonis, 2001).

Literature and Theory
163
Another patent value indicator is family size. It is determined by the number of
countries or patent offices, where a patent has been filed (Putnam 1996), and can therefore be
seen as a measure of patented market coverage. This patented market coverage, however, is
associated with additional expenses for patent application, information search, translation,
examination etc., which are even amplified when patenting in foreign jurisdictions (Hanel
2006). Thus, it can be assumed that a patentee only files a patent abroad, if he expects a
corresponding return on the sale of the protected technology that outweighs the patenting
costs.
This article extends the analyses on patent counts and patent value indicators to the
measurement of the positioning of patents to be essential for standardized technologies. In
particular, we use information on the essentiality of a patent to ICT standards.
2.2 Essential Patents and Standard Setting
The goal of standard setting is to commonly agree on the specifications of a technology
(Lyytinen and King, 2006; Markus et al, 2006). This is often crucial to enabling
interoperability and to unlock innovation in complex technologies based on various
components provided by different suppliers. However, the process of setting a standard can be
very costly for participating firms, since standard development seizes employee workforce
and creates traveling expenses for regular meetings and presentations around the world.3
Firms’ benefits from standard setting are versatile, such as the facilitation of technology and
products (Weitzel et al., 2006; Peek, 2010), reinforcing user confidence and user acceptance
(Brynjolfsson and Kemerer, 1996; Blind et al., 2010) and consequently the emergence of new
3 Chiao et al. (2007) interviewed practitioners in standard setting and retrieved information on IBM which spent
more than 500 USD million on standard setting expenses, representing almost 8.5% of their R&D budget in 2005.
Literature and Theory
164
and the growth of already existing markets (Blind, 2004). Due to the public good character of
a standard, these benefits may accrue to all market participants. While some companies
provide their R&D outputs for standard setting, others do not. Introducing essential patents to
a standard is a practice to recoup a company’s investments in standards setting (Farrell and
Saloner, 1985).
Essential patents are those that a company would necessarily infringe when adopting
or implementing a technology standard. Especially in the field of ICT, standards may
incorporate technology components which are protected by a large number of patents (e.g.
GSM, UMTS, Wi-Fi, MPEG)4. While standards have to ensure interoperability and should be
open to all interested stakeholders, granted patents provide its holders with a temporally
limited monopoly right on a technology. In the field of standard setting, companies have to
declare patents that might affect the standardized technology and agree to license their rights
under fair, reasonable and non-discriminatory (F/RAND) conditions. These F/RAND
agreements are still far from conclusive and there is an ongoing discussion about what a
reasonable license for an essential patent should be (Layne-Farrar et. al, 2007). It is still a
common belief that essential patent owning companies are able to exploit their positions of
technology ownership, when standards are commercialized. The decision to include a patent
in a standard is a consensus decision and a validation of a patent’s technological merit. Recent
literature findings show that patents increase in value, when they are included in a standard
(Rysman and Simcoe, 2008; Layne-Farrar and Padilla, 2011). Bekkers et al. (2001) give
further evidence that a company’s position in a particular network market strongly depends on
the number of essential patents declared. Firms seem to have strong incentives to introduce
4 GSM (Global System for Mobile Communications), UMTS (Universal Mobile Telecommunications System),
Wi-Fi (The Standard for Wireless Fidelity), MPEG (Moving Picture Experts Group)

Literature and Theory
165
patents to standards, as an empirical study by Goodman and Myers (2005) illustrates over-
declaring of essential patents in the field of 3G technologies. Berger et al. (2012) show that
firms even apply strategic behaviors in the patent application process to adjust their patent
claims to the standardized technology.
2.3 The Return on Assets
To assess the value of a company, a large number of indicators have been used up to now.
Within this analysis we intend to focus on the return on assets (ROA) as a measure of the
financial performance of companies. ROA is a measure of contemporaneous profitability, or
in other words, present day profits. It is formally defined as earnings before interest and taxes
π divided by the total assets A of a company. Assuming that a company will live indefinitely
and there is no uncertainty, the following relationship is expected to hold for any companyi :
0 0 0/i i iROA Aπ=
ROA is one of the most widely used measures for the financial success of a company that is
subsumed under the expression return on investment (ROI) or rate of return (ROR).
2.4 Theory and Hypotheses
Previous studies have shown that owning patents in ICT markets (Hall. et al., 2007; Hall and
MacGarvie, 2010) and participating in standard setting (Aggarwal et al., 2011) may increase
the financial performance of firms. When declaring a patent as essential to a standard, patent
owning companies may be in the position to control whole markets that are based upon
standardized technology to thus increase their financial performance. However, including
patents in a standard is always a result of consensus agreements on a standardized technology.
Decision making is only feasible, when all involved participants face the same benefits. If
possible, side payments are solutions to reach common agreements. These payments might
resolve e.g. royalty fees from essential IPR (Farrell and Saloner, 1985). In consensus decision

Literature and Theory
166
making, it seems plausible that side payments increase with a higher number of essential
patents. This would in turn negatively affect firms’ financial performance. Bekkers et al.,
(2011) show that firms which declare too many patents seem to declare patents of lower
quality. If “over-declaring” increases side payments and is subject to a decreasing patent
quality, we predict that the effect on a firm’s financial performance also decreases with the
number of patents declared.
Aggarwal et al. (2011) state that coordination in standard setting leads to
homogeneity of knowledge distribution among participants and thus may reduce a firm’s
competitive advantage. When companies declare their patents to a standard, SSOs oblige the
patent holder to license the patented technology (Layne-Farrar et. al, 2007). This is different
for patents outside standardization where the patentee is able to block competitors by not
licensing out but enforcing the patent. In order to maintain competitive advantage it thus
appears to be advantageous for a company to balance their patent portfolio. We predict that it
is beneficial to introduce a certain share of patents into standards to guarantee freedom to
operate and increase bargaining positions in cross licensing agreements (Blind et al., 2011),
while the remaining share of a company’s patent portfolio should be placed to secure
differentiation of product designs and complementary applications. Over-declaring would
thus not only decrease marginal returns e.g. by side payments, but further decrease the
competitive advantage in a market. Firms’ R&D decisions are thus always subject to the
trade-off between investing in technologies for standard platforms and investing in
constructive components. Based on these considerations, we derive the hypothesis that there
is a positive incremental effect of essential patents on a firm’s ROA up to a certain level.
Beyond an optimal level of patent declaration we assume a decreasing effect. We thus derive
our first hypothesis:

Literature and Theory
167
Hypothesis 1:
The declaration of standard essential patents has a curvilinear effect on a
company’s financial performance, with a slope positive effect at low and
moderate levels and a negative incremental effect at high levels.
Patents may be essential to formal or informal standards. Lerner and Tirole (2006) first
introduced the option of SSO selection as a concession parameter in relation to technology
ownership. An owner of a strong technology will select an SSO aiming to capture much of
users’ welfare via collecting licensing revenues. In the case of a weak technology or the
existence of strong alternatives, the technology owner has to make concessions to users, e.g.
by signing a royalty free agreement for his patents included in a standard. Chiao et al. (2007)
provide empirical evidence for the hypotheses derived from the model on the decision
parameters of SSO selection. Companies may thus choose to introduce their technologies to
standards in formal or informal SSOs in view of the most beneficial financial returns.
The standard setting arena is divided into formal and informal SSOs that generally
work on complementary technologies (Blind & Gauch, 2008). Estimations claim that over
60% of all standards in the ICT sector are developed in informal SSOs (Tapia, 2010). Formal
and informal SSOs pursue different standardization processes but also differ in their IPR
rules. While technology selection in formal standardization is a result of consensus
agreement, informal SSOs mostly only demand majority voting. Formal standardization is
open to all interested stakeholders, while informal SSO membership is more exclusive (e.g.
by demanding rather high membership fees). Due to these differences, formal standardization
is often seen to be more bureaucratic and thus slower in the decision making processes, while
informal SSOs often face shorter standardization processes (Cargill, 2002). In formal SSOs,
licensing fees for essential patents are restricted by F/RAND commitments. Informal SSOs
allow less restrictive licensing agreements. When considering these differences and the

Literature and Theory
168
findings of Lerner and Tirole (2006), we conclude that companies with strong technologies
would rather choose informal SSOs, where majority voting might help to push technology
proposals without agreeing to concessions, e.g. resolving royalties. Furthermore, informal
SSOs’ less restrictive licensing cap might result in higher royalty fees. We thus predict that
the impact of essential patents on a firm’s financial performance is stronger in informal SSOs
compared to formal SSOs and derive our second hypothesis:
Hypothesis 2:
The declaration of essential patents to informal standards has a stronger
incremental effect on companies’ financial performance compared to patent
declarations to formal standards.
Patents in the field of ICT may have a strong effect on a company’s financial performance
(Hall et al., 2007; Hall and MacGarvie, 2010). Griliches (1990) also predicts a positive lagged
correlation of patents and firm performance. Bloom and Von Reenen (2002) provide further
evidence that effects of patents on financial performance may have immediate, but also
lagged effects. Furthermore, Ernst (2001) found that patents have a lasting effect on a
company's amount of sales for up to 3 years after priority year. We believe that declaring a
patent to be essential to a standard might also have a lasting effect on a firm’s financial
performance. However, we assume this effect decreases over time. This is due to the fact that
ICT markets are usually subject to short product lifecycles and the survival of technologies is
often at pace. Evidence for this fast pace can be found when analyzing patent data in ICT
sectors. In particular, the technology cycle time (TCT) can be used to measure the speed of
innovation (Deng et al., 1999; Narin 1993). It is calculated as the median age of cited patent
references in a company's patent portfolio. Companies with shorter cycle times than their

Literature and Theory
169
competitors advance more quickly from prior to current technology. The literature suggests
that the cycle time ranges from about three to five years in electronics (Narin, 1993).5 Since
technology life cycles are rather short in electronics and firms declare their patents in average
four to six years after priority date (Blind et al., 2011), we believe that declaring a patent to be
relevant to the standard is limited in time and has a yearly decreasing effect on a firm’s
performance. Thus, we derive our third hypothesis:
Hypothesis 3:
The effect of essential patents, declared to formal as well as informal standards, is
limited in time and has a yearly decreasing effect on companies’ financial
performance.
5 In order to get the most recent data on the TCT we calculated it again using the EPO Worldwide Patent Statistical Database (PATSTAT). It can be shown that the TCT ranges between four and five years in ICT sectors, such as computers and communication engineering, as well as in pharmaceuticals. On average, patents declared essential are between four to six years old (as to the application year).

Methodology
170
2. Methodology
3.1 Model Setup
In order to test our hypotheses we set up a mathematical model that we can estimate by
regression techniques. In particular, we regress a firm’s ROA on formal and informal patent
declarations, including its squared terms to test for non-linearity, the number of pool
membership seats, the number of patent filings and patent quality indictors as well as other
innovation and financial performance related control variables, i.e. sales per employee, R&D
intensity as well as company size. In addition, we include the one year lagged ROA into our
model to account for autocorrelation and endogeneity issues, since it can be assumed that the
ROA in a given year is influenced by the ROA in the previous year. By doing so, we seek to
isolate the causal effects of formal and informal patent declarations on a firm’s ROA. Our
benchmark model, which is suitable for H1 and H2, can be described as follows:
2 21 1 2 3 4 5
6 7 8 9 'tROA ROA PDC PDC CDC CDC
PLS PAT CIT FAM x c u
α α α α αα α α α β
−= + + + ++ + + + + + +
(1)
where ROAdenotes the Return on Assets, PDC and CDC are formal and informal patent
declarations, respectively,PLS is the number of pool membership seats, PAT is the total
number of patent applications, CIT and FAM are the average number of total forward
citations to a company's patent portfolio and the average family size of the respective patent
portfolio. Furthermore, x is a vector of control variables, c is a company-specific effect and
u idiosyncratic errors. We omitted time subscripts for the sake of simplicity. In our
multivariate analysis we estimate several models by including and excluding different control
variables. By doing this, we try to capture the influence of companies’ varying investments
(R&D expenditures), assets (patent applications, employees) or performance (sales).
Methodology
171
With respect to H3, we expand our model by including timely lagged effects of the
PDC and CDC variables, including the squared terms. The equation looks similar to
equation (1), with the extension of the lagged effects of PDC and CDC as well as the
lagged squared terms:
2 21 1 2 2' 3 3'
2 24 4' 5 5'
6 7 8 9
( )
( )
'
t t v t v
t v t v
ROA ROA PDC PDC PDC PDC
CDC CDC CDC CDC
PLS PAT CIT FAM
x c u
α α α α αα α α αα α α α
β
− − −
− −
= + + + +
+ + + ++ + + ++ + +
(2)
where t is a time subscript and v denotes the annual lag for each additional lagged variable
in the model for PDC and CDC starting at a value of 0v = , ranging from 0,...,v n= . We
include each of the lagged variables as well as the contemporaneous variable into one model
to calculate the yearly influence of informal and formal patent declarations controlling for the
influence of the other years' declarations respectively. This way we can model the
hypothesized yearly decreasing effect on ROA and are also able to make sure causality runs
from patent declarations to the ROA.
3.2 Definition of the hypothesized effect on ROA
Equation (1) shows that H1 is defined in terms of the signs associated with the baseline
coefficients2 5, ...,α α . These measure the impact of formal and informal patent declarations on
ROA. H1 predicts that patent declarations have a curvilinear (inverted u-shaped) effect on the
ROA. This implies that the coefficients of PDC as well asCDC , 2α and
4α , must have a
positive sign in order to support our hypothesis, whereas at the same time the coefficients of
the squared effects of both variables 3α and
5α are expected to have a negative sign. H2
postulates that the effect of informal declarations on ROA is higher than the impact of formal
declarations. This does not target the signs of the coefficients, but rather indicates that the

Methodology
172
value of coefficient 4α has to be higher than the value of coefficient2α in order to confirm
our H2.
H1 H2 H3
ROA
2
3
0
0
αα
><
4
5
0
0
αα
><
4 2α α>
2 2' 1
2' 1 2' 2
2' 2'
4 4' 1 3 3'
4' 1 4' 2 5 5'
4' 4'
,
... 0
... 0
t
t t
t p t v
t t v
t t t v
t p t v
and with p v
and
α αα α
α α
α α α αα α α α
α α
−
− −
− −
− −
− − −
− −
>>
>
<> <> <
>
M
M
Table 1: Summary of the hypotheses
Regarding H3, we need to look at Equation (2). We hypothesize that essential patents, formal
as well as informal, have a limited, lasting effect on the financial performance of companies
in terms ofROA, which decreases over time. This again targets the strength of the
coefficients compared to the coefficients of its lagged versions, implying that the
contemporaneous effect of the coefficients is larger than the effect with a one, two or three
year lag. In order to support H3 for formal patent declarations, 2α has to be larger than
2 ' 1tα − ,
2 ' 1tα − has to be larger than 2 ' 2tα − , etc. up to 2't pα − , which has to be larger than
2 't vα − . For
informal declarations, the same assumptions hold for 4α . Since we have no theoretical reason
to believe that the assumed decrease in the slope of PDC and CDC that we stated in H1, is
more or less strongly pronounced with additional time lags, we do not make any further
assumptions about the strength of the coefficients in the lagged specifications. However, as in
H1, we assume that they have a negative sign meaning that 3 3'... 0t vα α − < and 5 5'... 0t vα α − < .
In addition, as we do not know how long the effect of PDC and CDC on ROA might last,
Methodology
173
this approach remains exploratory and we will let the empirical model decide up to which
time lag significant results can be found. A summary of the formal modeling of our
hypotheses is shown in Table 1.
3.3 Estimation Method
Since the data used for our analysis is in the form of a company-level panel, the econometric
specifications have to take account of the peculiarities of this data structure. Our model can be
estimated by a fixed effects regression model, i.e. a within estimator, that eliminates the fixed
effects by centering each variable on its individual-specific mean, taking into account
potentially endogenous individual effects. In order to control for non-constancy in the residual
variance of the variables in our regression model, we employ cluster robust standard errors by
company, which are heteroscedasticity-consistent (White, 1980).
If models are subject to unobserved heterogeneity, which is correlated with the
explanatory variables, simple pooled OLS estimators are asymptotically biased. To account
for this problem, linear panel-data models are used in order to eliminate time constant
unobserved heterogeneity. To decide between fixed or random-effects, we additionally
employed a Hausman-Test, which showed that the random-effects assumption (that
explanatory variables are uncorrelated with company-specific effects) is violated. This would
lead to systematically biased coefficients as well as standard errors. Therefore, only a fixed-
effects estimator results in unbiased estimates. In particular, the linear panel-data model is as
follows:
it it i ity x c uβ= + +
1,..., 1,...i n t T= =
where ity is the explained variable of unit i in period t, itx is a vector of explanatory variables,
β is a coefficient vector, ic is a company-specific effect and itu idiosyncratic errors. In order

Methodology
174
to test the influence of each of the individual explanatory variables on ROA, we calculate
several models and add the respective variables gradually.
3.4 The Data
The construction of the dataset is based on the DTI-Scoreboard from the year 2001, in which
a total of 500 companies were listed. Data on previous and following years were added. If one
of the 500 companies was not listed in the DTI-Scoreboard in the years before or after 2001,
we treated the respective observations as missing. In the case that mergers or acquisitions
between the companies listed in the DTI-Scoreboard occurred in a given year, all data for the
respective companies was summarized. Thus, the companies were treated as if they were
already merged at the beginning of the observation period.6
In a second step, we added the relevant information on patenting behavior to this
database. Relevant patent data was extracted from the "EPO Worldwide Patent Statistical
Database" (PATSTAT). The annual sum of patent applications filed by each company in a
given year at the European Patent Office (EPO) was calculated. The same was done for the
patent value indicators, i.e. for patent forward citations and family size. All patent data from
the PATSTAT database are dated by their priorities, i.e. the year of world-wide first filing.
We believe that our restriction to analyze value indicators of EPO patents only is sufficient,
since over 90% of the essential patents are also filed at the EPO. The priority dates of our data
also take into account worldwide offices.
To identify the companies listed in the DTI-Scoreboard in PATSTAT, we employed
keyword searches. The keywords included not only the company names7 in different spellings
6 We chose this approach to preserve comparability over time, as the separation of the individual company information is no longer possible after a merger (compare Frietsch, 2006). 7 Information about the names of the relevant subsidiaries by company was added from the LexisNexis (lexisnexis.com) and Creditreform Amadeus (creditreform.com) databases.

Methodology
175
but also the names of the companies’ subsidiaries held by the parent company with a direct
share of at least 25%. This assures comparability of patent data with the financial data from
the companies’ balance sheets.
In a next step, we added financial data of the companies – such as total assets or
earnings before interest and tax – that are needed to calculate the company's ROA from
Standard & Poor’s COMPUSTAT Global and COMPUSTAT North America databases.
Then we added information about a patents’ inclusion in a standard. In total, we extracted
over 65,000 patent declarations by formal SSOs such as ISO, IEC, JTC1-a joint committee of
ISO and IEC, CEN/CENELEC, ITU-T, ITU-R, ETSI, IEEE. In addition, we added patent
declarations by informal SSOs such as IETF, TIA, OASIS, OMA, the Broadband Forum and
the MSF Forum. All of the listed SSOs provide public databases about patent number,
declaration date and company of declaration.8 To ensure that each company in our final
sample is active in standard setting and is thus able to include their patents in a standard, we
only included members of the above mentioned SSOs.9
We further added information on a company’s participation in a patent pool. This is
important to account for specific licensing strategies of firms. As to Layne-Farrar and Lerner
(2011) pool participation is not automatic and firms only join pools when it fits to their
specific licensing business model. Our data includes all pool memberships since 1999. Patent
pool administrators state which standards are affected by the patent pool. In combination to
our data on patent declarations we precisely differentiate between companies that license their
patents individually and companies that pool their patents. Patenting on standards increased in
the late nineties when the licensing of essential patents became a new challenge to standard
8 E.g.: www.iso.org/patents or: http://ipr.etsi.org/ or: https://datatracker.ietf.org/ipr/search/ 9 We employed membership information from the SSO’s web pages. If the membership information was not at hand, we added information of attendee lists of conferences organized by the respective SSOs.
Methodology
176
setting (Simcoe, 2005). Regarding this rather recent development and to ensure data
conformity in our sample we limited our observations to the years between 2000 and 2007.
Due to these limitations and the fact that we use an unbalanced panel, in which data for some
observations in the respective years may be missing, we calculate our models for 817
observations of 134 companies in total. All further analyses in the study are based on this final
sample.
3.5 Variables and Summary Statistics
In this section we briefly discuss the variables used in the following regression models. The
summary statistics of these variables are presented in Table 2. Following the theoretical
discussion from Section 2, we use the ROA as a measure of a firm’s financial performance,
which is also added as an explanatory variable with a lagged specification in our models to
minimize autocorrelation and account for endogeneity issues.
The number of formal and informal patent declarations per year (both in thousands),
as well as the respective squared terms, are our main explanatory variables. A patent
declaration is a statement by a company to own patents that are essential to a standard. This
statement is not mandatory and in some cases made after a standard has already been released.
In most cases the issue of essentiality is not tested by objective authorities (only in the case of
a patent pool). However, research on evolutionary technology development (Bekkers et al.,
2011; Bekkers and Martinelli, 2012) as well as research on patent filing (Berger et al., 2012)
or patent value (Rysman and Simcoe, 2008) have proven that data on patent declaration is a
valuable indicator for a patent’s essentiality. One patent can be declared to be essential to
several standards. The number of patent declarations is therefore by far higher than the
number of essential patents.
We further add data on patent pool memberships. In patent pools IPR owners pool their
patents to agree on a single license. Patents in patent pools have to pass a test of essentiality
Methodology
177
concerning a standardized technology. Since license agreements as well as patent declaration
behavior change when companies enter a patent pool (Simcoe, 2007), we matched the
membership data of 54 patent pools to the companies of our sample. Companies may be a
member of more than one pool depending on the standardized technology. Our patent pool
variable differentiates the company of observation into pool member and pool outsider.
The number of patent applications at the EPO (in thousands) is a count of a
company’s issued patents per year. The average number of forward citations is calculated as
the number of forward citations in a four year time window divided by the number of
applications with forward citations (also in a 4 year time window). The time window assures
that all patents have the same amount of time to be cited. The average family size is the
average number of distinct patent offices where a company's patents were filed.

Empirical Results
178
Variable Mean Std. Dev. Min Max # Obs. # Firms ROA 0.068 0.081 -0.520 0.387 817 134 # patent declarations (in thousands) 0.048 0.513 0.000 11.413 817 134 # consortia declarations (in thousands) 0.001 0.005 0.000 0.065 817 134 # pool licensor seats (in thousands) 0.001 0.002 0.000 0.018 817 134 # patent applications (in thousands) 0.224 0.373 0.001 3.084 817 134 R&D (in m)/sales (in m) 0.074 0.065 0.002 0.708 817 134 Sales (in m)/employees 0.189 0.108 0.042 0.974 817 134 # employees (in thousands) 78.912 88.616 1.030 484.000 817 134 Avg. # FW-Citations 2.391 1.223 1.000 14.861 817 134 Avg. Family Size 5.179 1.671 2.000 14.000 817 134
Note: The summary statistics are only reported for the number of cases that are used in the multivariate regressions.
Table 2: Summary statistics of sample variables
With respect to potentially confounding firm characteristics, we include further control
variables. We include the number of employees (in thousands) to control for size effects. The
share of sales (in millions) by employee is introduced as a proxy of how efficiently a firm
generates sales. In addition, we use R&D intensity (R&D expenditures (in millions) divided
by sales (in millions)) in our models, which can be regarded as a proxy of how well a firm
converts results of R&D processes into revenues. R&D intensity is supposed to affect firm
profitability, especially in our sample of relatively large, R&D performing firms. Finally, we
use time dummies to account for confounding level effects that occur over our panel period.
3. Empirical Results
4.1 Bivariate Analyses
As a first step to assess the influence of formal and informal patent declarations on a
company’s financial performance in terms of ROA, we run a pair wise correlation analysis,
which allows us to assess correlations among variables of our sample. As hypothesized, we
find no significant linear correlation between the ROA and formal and informal patent
declarations. Furthermore, no significant correlation of a company’s patent applications with

Empirical Results
179
the ROA can be observed, whereas the patent value indicators and ROA correlate. A
significantly positive correlation between the average family size and the ROA can be
observed, yet the average number of forward citations shows a rather small, but significantly
negative correlation with ROA. The number of employees is also negatively connected to
ROA, implying that smaller companies in terms of the number of employees have a lower
ROA compared to larger ones. Also our R&D intensity measure is negatively correlated to
ROA. This could be interpreted insofar, as R&D expenditures first of all are a significant cost
factor and therefore have a negative influence on ROA. The sales per employees measure on
the other hand shows a significant positive correlation with financial performance.
1 2 3 4 5 6 7 8 9 1 ROA 1 2 # formal declarations 0.05 1 3 # informal declarations 0.05
0.21*** 1
4 # pool licensor seats -0.01 0.02 0.03 1 5 # patent applications -0.03
0.11*** 0.09*** 0.41*** 1
6 R&D/sales -0.15*** 0.10*** 0.24*** -0.07* 0.05 1
7 Sales/ employees 0.09** 0.06* 0.14*** -0.01 -0.04 0.01 1 8 # employees -0.06* 0.00 -0.01 0.27***
0.53*** -0.25*** -0.09*** 1
9 Avg. # FW-Citations -0.06* -0.01 0.00 -0.12*** 0.01 0.04 0.02 -0.07** 1 10 Avg. family size 0.13*** 0.04 -0.03 -0.09** -0.04 -0.03 -0.01 -0.10***
0.35***
Significance Level: ***p<0.01, **p<0.05, *p<0.1 Note: The correlation analysis is based on the number of cases that are used in the multivariate regressions.
Table 3: Pair wise correlation matrix of sample variables
In order to extend the analysis of our bivariate effects and to model the hypothesized
curvilinear effect of patent declarations on ROA, we need to conduct a multivariate analysis
to obtain conclusive results.

Empirical Results
180
4.2 Multivariate Analysis
The results of our first multivariate analysis are presented in Table 4. As stated in Section 3,
we estimated several models and added the respective variables gradually up to our final
model that corresponds to Equation (1).
In all our models (M1-M6) we are able to show that patent declarations in formal and
informal SSOs, ceteris paribus, have a curvilinear relationship (inverted U-shape) with a
firm’s ROA. Therefore, we are able to confirm our first hypothesis H1: Companies’ patent
declarations significantly increase their ROA up to a certain point. We further confirm that
there is a maximum in this relation, which is modeled by the negative squared effects of
formal and informal declarations. From this maximum point onwards, the incremental effect
of declaring patents on ROA becomes negative. These results support the assumption of an
over-declaration effect, where declaring a too high number of standard essential patents
decreases firm performance.
Our empirical findings further confirm our second hypothesis H2. The incremental
impact of declaring essential patents related to informal standards has a stronger effect on
companies’ financial performance compared to patent declarations on formal standards.
Companies are able to choose to participate in different SSOs depending on the strength of
their technology and assumptions of technology returns (Lerner and Tirole, 2006). We argue
that the return on essential patents is higher for standards released by informal SSOs. Our
results indicate that a company with strong technology assets rather declares its patents to
informal SSOs.
The effects of our explanatory variables also hold when adding the number of pool licensor
seats of a company as a control variable to our models. Compared to other patent owning
firms, a firm that is a member of a patent pool does not individually license its patents. Patent
pool memberships indicate a certain licensing strategy of a firm (Layne-Farrar and Lerner,
Empirical Results
181
2011). However, our results show that different licensing strategies do not influence a firm’s
financial performance. Goals to include patents into standards are not necessarily connected to
revenues from licensing.10 Furthermore firms’ licensing strategies are also subject to different
IP policies of SSOs. Our differentiation into formal and informal patent declarations might
thus already capture the licensing effect. Similar assumptions can be derived for the rest of
our control variables, which are added in M5 and M6. When controlling for size effects,
increased R&D intensity, patent applications and the value of the patent portfolio, our results
remain consistently significant. However, it can be shown that the firm-specific as well as the
innovation related indicators strongly increase the R² of the models, implying that the chosen
indicators also affect firm performance. The statistical tests show that R&D intensity (R&D
expenditures/sales) has a significant negative influence on ROA. This negative effect can be
explained by the characteristics of our variable. R&D investments are costs which might pay
off several years later. For example, a company invests in new innovative processes or
technologies. Yet, it is unsure whether or not these investments are successful and contribute
to a company’s performance. Therefore, at least from a short-term point of view, R&D
investments are first of all costs which consequently have a negative effect on the ROA.
Our variable of labor productivity (sales by employees) does not show any
significant results in M5 and M6. The same holds for the number of patent applications, for
which we also do not find any significant effects. This result points once more to the fact that
it is not sufficient to account for a company’s technological performance by solely measuring
the number of patent filings. We therefore include patent value indicators in our final model
10 Shapiro and Variant (1999) describe the case of the HDTV standard, where Zenith spent enormous effort to
get their technology and patents in the standard even though cross-licensing agreement were already fixed before.

Empirical Results
182
(M6). However, in our estimation the patent family size has no effect on ROA and the number
of forward citations even shows a negative effect on our explained variable, although this
effect is rather small. There has been evidence in the literature stating that patents, which are
essential to a standard have a higher number of forward citations (Rysman and Simcoe 2008;
Layne-Farrar and Padilla, 2011). We thus believe that the patent value effects are captured by
our main explanatory variables: formal and informal patent declarations.

Empirical Results
183
dV: ROA M1 M2 M3 M4 M5 M6 Coef. S.E. Coef. S.E. Coef. S.E. Coef. S.E. Coef. S.E. Coef. S.E.
L1.ROA 0.322 *** 0.061 0.327 *** 0.061 0.326 *** 0.061 0.325 *** 0.061 0.216 *** 0.071 0.216 *** 0.071 # patent declarations 0.013 * 0.008 0.014 ** 0.006 0.014 ** 0.007 0.022 *** 0.007 0.023 *** 0.008 # patent declarations sq1
-0.001 0.001 -0.001 * 0.001 -0.001 * 0.001 -0.002 *** 0.001 -0.002 *** 0.001
# consortia declarations
2.355 * 1.343 2.360 * 1.334 2.253 1.366 2.816 ** 1.178 2.663 ** 1.110
# consortia declarations sq
-0.052 ** 0.021 -0.053 ** 0.020 -0.051 ** 0.020 -0.056 *** 0.019 -0.052 *** 0.018
# pool licensor seats 1.251 1.744 -0.320 1.891 -0.415 1.979 # patent applications1 1.617 13.195 -0.420 13.617
R&D/sales -0.610 *** 0.095 -0.614 *** 0.094 Sales/employees 0.106 0.074 0.109 0.072 # employees1 -0.043 0.186 -0.034 0.182
Avg. # FW-Citations -0.005 ** 0.002 Avg. Family Size 0.002 0.002 Constant 0.054 *** 0.008 0.052 *** 0.008 0.052 *** 0.008 0.051 *** 0.008 0.093 *** 0.032 0.088 *** 0.031
Time Dummies YES YES YES YES YES YES
Number of companies
134 134 134 134 134 134
Observations 817 817 817 817 817 817 R² within 0.259 0.262 0.263 0.263 0.357 0.363 F 13.667 14.436 12.404 11.888 12.604 12.135
Significance Level: ***p<0.01, **p<0.05, *p<0.1 Note: 1 Coefficient multiplied by 1,000 to make effects visible. L1. means that the variable is lagged by one year. The number of observations in each model was adjusted to the model with the fewest observations (M6) in order to conserve comparability of the effects over all models.
Table 4: Results of the fixed-effects panel regression models

Empirical Results
184
In our theoretical section we have also argued that owning essential patents may enable a
company to control markets. Thus, we expect the consequence of patent declarations to also
have a timely lasting effect on the financial performance of firms, which has been shown for
several other innovation related indicators in the literature (Bloom, Van Reenen, 2002; Ernst,
2001; Griliches, 1990). However, we assume that this effect would decrease over time, since
ICT markets in particular are subject to short product lifecycles (Narin, 1993). Consequently,
we stated in our H3 that essential patents declared in formal as well as informal standards
have a limited lasting and yearly decreasing effect on companies’ financial performance. The
formal modeling can be found in Equation (2).
In M6-1 we add the lagged number of formal and informal patent declarations as
well as squared effects to the model (Table 5) 11. By doing so, we regard the yearly effects of
patent declarations. From a four year time lag onwards we find no more significant effects of
our explanatory variables on ROA, which is why we added the variables in their lagged
specifications only up to four years.
11 We are aware of the fact that models including several lagged versions of one variable might become instable
and therefore difficult to interpret due to multicollinearity issues. Although this approach remains exploratory, we believe that the chosen specification including the lagged versions of the PDC and CDC variables - up to the time lag where the variables become insignificant - serves as an indication of the lasting effect of patent declarations on ROA.

Empirical Results
185
dV: ROA M6-1
Coef. S.E. L1.ROA 0.200 *** 0.075 # patent declarations
L0 0.032 ** 0.015 L1 0.027 ** 0.012 L2 -0.004 0.009 L3 -0.023 0.014 L4 -0.041 0.029
# patent declarations sq L01 -0.003 * 0.001 L11 -0.002 * 0.001 L21 0.001 0.001 L31 0.002 ** 0.001 L41 0.004 0.003
# consortia declarations L0 1.882 *** 0.655 L1 3.170 ** 1.275 L2 4.384 3.268 L3 3.140 * 1.805 L4 -0.656 1.100
# consortia declarations sq L0 -0.047 *** 0.014 L1 -0.078 *** 0.026 L2 -0.095 0.058 L3 -0.060 * 0.034 L4 0.022 0.017
# pool licensor seats -1.974 1.916 # patent applications -0.013 0.015 R&D/sales -0.595 *** 0.092 Sales/employees 0.125 * 0.067 # employees1 0.017 0.162 Avg. # FW-Citations -0.004 * 0.002 Avg. Family Size 0.003 0.003 Constant 0.081 *** 0.028 Time Dummies YES Number of companies 134 Observations 817 R² within 0.397 F 3272.027 Note: 1 Coefficient multiplied by 1,000 to make effects visible. L. stands for the lagged versions of the variables. L0 is the contemporaneous effect, L1 means that the variable is lagged by one year etc. Significance Level: ***p<0.01, **p<0.05, *p<0.
Table 5: Results of the fixed-effects panel regression models with lagged explanatory variables
Our results still show that the hypothesized curvilinear effect of patent declarations in formal
and informal SSOs on ROA holds. Results up to a significance level of 5% remain robust up
to a time lag of one year for both SSO types. However, in the dynamic comparison we can

Empirical Results
186
observe that the coefficient decreases in the case of formal SSOs and increases in the case of
informal SSOs up to a lag of one year. Therefore, we can only partly confirm our H3.
The hypothesized lasting, timely decreasing effect can only be observed for formal
declarations, while it is increasing in the case of informal declarations at least in the one year
time lag. This effect might occur because declarations related to formal standards generally
occur at a later point in time than declarations linked to informal standards. On average,
declared patents to standards released by formal SSOs are older (in average 6 years from the
priority year) than patent declarations to standards published by informal SSOs (on average 4
years from the priority year). These dynamic differences are connected to different
standardization processes, because informal SSOs are expected to standardize technology in
earlier stages (Cargill, 2011). Patents might thus still increase in their value while the
technology is yet emerging. Our results provide indications of such an effect related to the
influence on financial returns. In the case of declarations to formal standards, the effect
becomes insignificant from a two years time lag onwards (although the squared effect is still
significant in the two year lag specification).
In the case of declarations in informal SSOs, the effect becomes insignificant in a
two years lag, but again appears in the three years lag specification. At first sight, this is a
puzzling result. However, the timing of patent declaration is often very volatile and can also
be subject to policy shocks in the different SSOs.
Our multivariate results support our predictions related to the effect of essential
patents and illustrate a curvilinear correlation with a firm’s ROA. However, our analysis has
not yet provided specific information on an optimal level of declaration. We therefore
multiply the coefficients of our last model (M6-1) with patent declarations to formal and
informal SSOs and plot the distribution over the normalized number of total declarations per
firm. We graph the normalized number of total declarations and compare the optimal level of

Empirical Results
187
declaring to either a formal or informal SSO. Our empirical models have shown that the
incremental effect of one declaration is higher for informal SSOs compared to formal SSOs.
However, graph 1 illustrates that the optimal level of patent declaration is higher for formal
SSOs, meaning that firms are able to introduce a higher number of patents to formal standards
until the incremental effect on ROA turns negative. While the optimal level of patent
declarations to formal SSOs has a lower level after a lag of one year, it is reversed in the case
of informal SSOs. For both cases the correlation of patents and ROA shows a comparable
distribution for lagged periods. While in the case of formal SSOs the effect of patents on ROA
decreases, but stays positive after the optimum, patents introduced to informal standards may
also have a negative effect beyond the optimum.
The analysis of an optimal level of patent declarations should be interpreted
cautiously, indicating a general tendency rather than precise effects and benchmarks. Firms
participate in very specialized standard working groups, where they work on technical
problems that may differ strongly among SSOs. Since we plot aggregated results of our
sample of companies, graph 1 especially illustrates different effects depending on the SSOs
and the level of patenting.

Empirical Results
188
Graph 1 Coefficients of M6 multiplied by the normalized number of formal and informal
declarations
The reason why formal standardization allows a higher number of patented contributions in
general (Blind et al, 2011) and a higher optimal level in our estimation, can be explained by
the different technological specialization of SSOs. Informal SSOs mostly concentrate on IT
standardization, while formal SSOs specialize in telecommunication technologies. Standards
in the field of telecommunication (e.g. GSM, UMTS, WiFi, etc.) are subject to very complex
technologies that are often standardized on a specific physical layer. These standards have to
be very precise in e.g. specifying protocols for communication (Bekkers et al., 2001). In
comparison, IT standards are rather focused on application layers and standardized solutions
are rather generic. Our estimation results confirm these differences. Essential patents
0
0.0
27
0.0
54
0.0
81
0.1
08
0.1
35
0.1
63
0.1
9
0.2
17
0.2
44
0.2
71
0.2
98
0.3
25
0.3
52
0.3
79
0.4
06
0.4
33
0.4
6
0.4
87
0.5
15
0.5
42
0.5
69
0.5
96
0.6
23
0.6
5
0.6
77
0.7
04
0.7
31
0.7
58
0.7
85
0.8
12
0.8
39
0.8
66
0.8
94
0.9
21
0.9
48
0.9
75
L0 formal dec
L1 formal dec
-0.1
-0.09
-0.08
-0.07
-0.06
-0.05
-0.04
-0.03
-0.02
-0.01
0
0.01
0.02
0.03
0.04
0.05
0.06
0.07
0.08
0.09
0.1
RO
A (
Re
turn
on
Ass
ets
)
normalized level of declaration
L0 informal dec
L1 informal dec

Empirical Results
189
introduced to standards set by informal SSOs have a stronger incremental effect on a firm’s
ROA. This would confirm that informal standards concern a broader field of technology. In
comparison, rather specific formal telecommunication standards allow a higher number of
patents (reflected by the higher optimal level), while the incremental effect of each patent is
lower.
4.3 Robustness Check
We perform additional robustness checks to test if our results remain robust over different
model specifications. All of the robustness checks are performed on the basis of the final
model specification (M6), not including the lagged specifications of the explanatory variables.
Our first concern regarding our model is that the dependent variable ROA does not
hold the normality assumption. To stabilize the variance of our dependent variable we
perform a z-standardization, a log-transformation as well as a Cox-transformation of the ROA
variable and re-ran our model with each of the transformed variables. All three models with
standardized dependent variables show similar effects of the explanatory variables.
Coefficients for formal and informal declarations and the squared terms show slightly smaller
values when the Cox-standardized ROA was used. Yet, the coefficients did not change signs
and remain significant at the 5% level in the case of formal declarations. The number of
consortia declarations, however, is only significant at the 10% level and the squared number
of consortia declarations loses significance. In the case of the z-standardized ROA variable,
the strength of the effects even increases and all coefficients show the same significance
levels as in the original specification. For the log-transformed ROA, the coefficients become a
little stronger, but slightly less significant than in the original model. However, the
coefficients remain significant at the 5% level. Turning the argument the other way around,
we also z-standardized and log-transformed the declaration variables and used them as
explanatory variables in our models. As for the z-standardized explanatory variables, the

Empirical Results
190
values of the coefficients for formal and informal declarations become smaller but remain
significant. As for the log-transformed explanatory variables, we find increasing values of the
coefficients for each of the variables and also a slight decrease in significance. Yet, all
variables remain significant at least at the 10% level.
# patent declarations
# patent declarations
sq1
# consortia declarations
# consortia declaration
s sq dV: ROA (Original Model (M6))
0.023*** -0.002*** 2.663** -0.052***
dV: Cox-transformed ROA2 0.012** -0.001** 3.392* -0.076 dV: z-standardized ROA 0.259*** -0.022*** 29.924** -0.586*** dV: Log-transformed ROA 0.026** -0.002** 2.495** -0.044**
dV: ROA, z-standardized declaration variables
0.004*** -0.049*** 0.004** -0.0001***
dV: ROA, Log-transformed declaration variables
0.070** -24.153* 2.746** -53.662***
dV: ROA, EBITDA instead of EBIT used for ROA calculation
0.017** -0.001* 1.665 -0.04**
dV: ROIC 0.036** -0.003** 3.928** -0.072** dV: EBIT as a share of sales2 0.072*** -0.006*** 5.542** -0.09*
dV: ROA, Lagged control variables2 0.022*** -0.002** 2.721** -0.054***
dV: ROA, Declarations as shares on all patent applications
0.006** -0.173** 0.106 -0.05
Significance Level: ***p<0.01, **p<0.05, *p<0.1 Note: 1 Coefficient multiplied by 1,000 to make effects visible. 2 These measures could only be calculated with a reduced number of cases due to the construction of the dependent variable or the lagged specifications. Only the coefficients for the relevant explanatory variables are shown. The full results of the models can be consulted in the appendix.
Table 6: Coefficients of the explanatory variables for the modified models
A second approach to testing the robustness of our results is to replace our explained variable
ROA by different, yet similar, dependent variables that account for a firm’s financial
performance. In a first step, we replaced the earnings before interest and tax in the ROA
calculation by earnings before interest, taxes, depreciation and amortization (EBITDA). With
the help of this specification, we are able to test if potential effects of amortization or
depreciation, which are implicitly represented in our original ROA specification, are
responsible for the effects we find for formal and informal patent declarations. Second, we

Empirical Results
191
built a variable for the return on invested capital (ROIC), which is calculated as the share of
earnings before interest and tax divided by the invested capital of a company in a given year,
and used this as a dependent variable in our model. Third, we calculated earnings before
interest and tax divided by sales, which is closely related to the net margin of a firm per year.
As we can see in Table 6, the signs of the coefficients do not change in all of the three models
and the values of the coefficients are higher than in the original model. Yet, the significance
level drops slightly, but not below the 10% level. An exception is the ROA specification with
EBITDA, where the values of the coefficients are slightly smaller than in the original model
and the consortia declarations variable loses significance (p=0.117).
In a third approach, we specify the patent related control variables in the model –
namely the number of patent applications, the average number of forward citations and the
average family size – with a one year lag to account for a possible timely delayed effect on
ROA, which might mitigate the results found for our main explanatory variables. However,
this is not the case. The coefficients remain robust and significant at least at the 5% level.
Finally, in order to balance our declaration variables to the size of the patent portfolio
of a company, we calculate the share of formal as well as informal patent declarations to all
patent applications of a company (as well as squared effects) and replace them with our
original explanatory variables. As to the results in table 6, the coefficients still have the same
signs, but informal declarations do no longer show a significant effect. However, one has to
keep in mind that the specification of this share is rather vague, since the timing of patenting
and declaring a patent to SSOs might strongly differ.
All in all, we conclude that our model seems to deliver robust results over several
different specifications, ranging from the standardization and transformation of the dependent
and independent variables to changes in the dependent variable as well as changes in the
timing of the control variables.

Discussion of the Results
192
4. Discussion of the Results
Our results provide evidence that the financial performance of companies active in technology
markets is not only connected to their innovative capabilities and resources, but further
depends on the strategic management of their patent portfolio. Most companies own big
patent portfolios to protect their innovations and to block competitors. We show that firms
should strategically position their patent portfolios on standard platforms as well as on
complementary applications in order to generate optimal financial returns.
This article assesses firms’ patent portfolios on count and value measures and tests
the effect of a patent declaration to a standard on a company’s ROA. Our first hypothesis (H1)
suggests a curvilinear relationship between the declaration of essential patents and firm
performance. Indeed, empirical tests show that the declaration of patents has a positive
influence on a firm’s performance up to an optimal level and then decreases. From a
manager’s perspective it is important to influence technological development in SSOs and to
control standardized platform with patented components. However, in standard setting, firms
have to cooperate with competitors (Leiponen, 2008) and share their innovative knowledge
with rival market participants. A firm’s individual knowledge may thus become collective
knowledge and firms risk losing their differentiation advances (Aggarval et al., 2011). Our
findings of a curvilinear relationship of patent declarations and financial returns support this
argument and suggest that companies should diversify their patent portfolios. On the one
hand, firms need to declare a share of patents to SSOs to freely operate and control
standardized technology platforms. On the other hand, firms also have to maintain
competitive advantage by patenting their platform constructive innovations outside standard
setting. The curvilinear relationship of essential patent declarations illustrates this balancing
of a firm’s patent portfolio, which only has a positive influence on firm performance up to an
optimal level and then decreases.

Discussion of the Results
193
The results of our estimations also provide evidence to confirm our second
hypothesis (H2) suggesting the positive incremental effect of a patent declaration to be
stronger for informal SSOs compared to formal SSOs. Standard setting allows firms to freely
choose their preferred forum for standardization. Firms would thus always select SSOs where
technology contributions generate the highest returns (Lerner and Tirole, 2006). Formal SSOs
cap royalties of essential patents by demanding F/RAND commitments of participating firms.
We predict that patent declarations to informal SSOs might thus generate higher royalties.
Furthermore, formal SSOs are open to all stakeholders and seek consensus decisions when
selecting technology proposals. Firms may find it less risky to share their valuable
contributions in a more exclusive, informal forum. Our estimations confirm a stronger
incremental effect of patent declarations to informal SSOs; however, a more precise analysis
indicates a higher optimal level of patent declarations for formal SSOs. We argue that this is
due to the differing specialization in technology between formal and informal SSOs. Our
results suggest that firms carefully choose which SSOs to join, depending on their individual
portfolio of technologies. Even though declaring a patent to informal SSOs generates more
returns, our results show that patent declaration will decrease a firm’s performance at a lower
level. Additionally, we only find a possible negative effect of too many patent declarations
when declared to informal SSOs. This is different for formal SSOs where the positive
incremental effect is weaker, but the optimal level of declaration is higher. Companies with a
small but very valuable patent portfolio might thus prefer informal SSOs, while companies
with a large portfolio but rather incremental patents would prefer formal SSOs. These results
suggest that a firm’s patenting decision in the context of standardization should also consider
choosing the appropriate standard forum in order to generate higher financial returns.
In our last hypothesis (H3) we predicted that patent declarations also have a lasting
effect on a firm’s financial performance. Our estimations provide evidence that a company’s

Discussion of the Results
194
current and also near future financial performance is connected to patent declarations up to a
time lag of one year. We further predicted a decreasing effect, which can only be empirically
confirmed in the case of formal SSOs. The effect of patent declarations to informal SSOs
even increases in a lag of one year. Again, this suggests that firms with valuable patents may
find it more beneficial to declare their patents to informal SSOs. However, the lagged
negative effect of over-declaration is also stronger for informal SSOs.
Although prior research has provided evidence for the effects firms’ patent portfolios
on performance measures as well as effects of firms joining standard setting or contributing to
standard setting, this study is the first to acknowledge the case of patents in standardization.
We illustrate optimal levels of patent declaration and further show that these levels change
among standard settings SSOs. In particular we aggregate SSOs to formal and informal fora
and identify different effects for patents. Depending on a firm’s patent portfolio in terms of
quality and quantity, we are able to indicating which share of patents is financially beneficial
to be introduced to which SSOs. Furthermore, we are able to predict future benefits from
declaring essential patents.

References
195
References
Aggarwal, N.; Dai, Q.; Walden, E. A. (2011): The More, the Merrier? How the Number of Partners in a Standard-Setting Initiative Affects Shareholder’s Risk and Return, MIS Quarterly (35:2) pp.445-462.
Albert, M.B., Avery, D., Narin, F., McAllister, P. (1991): Direct validation of citation counts as indicators of industrially important patents, Research Policy (20:3), 251-259.
Alcacer, J., Gittelman, M. (2006): Patent citations as a measure of knowledge flows: The influence of examiner citations, Review of Economics and Statistics (88), 774-779.
Alcacer, J., Gittelman, M., Sampat, B. (2009): Applicant and examiner citations in U.S. patents: An overview and analysis, Research Policy (38), 415-427.
Bekkers R,. Duysters G., Verspagen B. (2002): Intellectual property rights, strategic technology agreements and market structure. The case of GSM, Research Policy (31), pp. 1141–1161.
Bekkers, R., Bongard, R., Nuvolari, A. (2011): An empirical study on the determinants of essential patent claims in compatibility standards, Research Policy (40:7), pp. 1001–1015.
Bekkers, R., Martinelli, A. (2012): Knowledge positions in high-tech markets: Trajectories, standards, strategies and true innovators, Technology Forecasting Social Change (in print).
Berger, F., Blind, K., Thumm, N. (2012): Filing behavior regarding essential patents in industry standards, Research Policy (41), pp. 216–225.
Blind, K. (2004): The Economics of Standards: Theory, Evidence, Policy.
Blind, K., Thumm, N. (2004): Interrelation between patenting and standardization strategies: empirical evidence and policy implications, Research Policy (33), pp. 1583–1598.
Blind, K., Edler, J., Frietsch, R., Schmoch, U. (2006): Motives to patent: Empirical evidence from Germany, Research Policy (35), pp. 655-672.
Blind, K., Gauch, S. (2008): Trends in ICT standards: The relationship between European standardization bodies and standards consortia, Telecommunications Policy (32), pp. 503– 513.
Blind, K., Cremers, K., Mueller, E. (2009): The Influence of Strategic Patenting on Companies' Patent Portfolios, Research Policy (38), pp. 428-436.
Blind, K., Gauch, S., Hawkins, R. (2010): How stakeholders view the impacts of international ICT standards, Telecommunications Policy (34), pp. 162-174.
Blind, K.; Bekkers, R.; Dietrich, Y.; Iversen, E.; Müller, B.; Köhler, F. Pohlmann, T.; Verweijen, J. (2011): EU Study on the Interplay between Standards and Intellectual

References
196
Property Rights (IPR), commissioned by the DG Enterprise and Industry, Tender No ENTR/09/015. OJEU S136 of 18/07/2009.
Bloom, N., Van Reenen, J. (2002): Patents Real Options and Firm performance, The Economic Journal (112:478), pp. C97–C116.
Brynjolfsson, E., and Kemerer, C. F. (1996): Network Externalities in Microcomputer Software: An Econometric Analysis of the Spreadsheet Market, Management Science, (42:12), pp. 1627-1647.
Cargill, C. (2002): Intellectual Property Rights and Standards Setting Organizations: An Overview of failed evolution, A Report Issued By the U.S. Department of Justice and the Federal Trade Commission, March 2002.
Chiao, B., J. Lerner, J. Tirole. (2007): The rules of standard setting organizations: An empirical analysis, The RAND Journal of Economics (38:4), pp. 905–930.
Deng, Z., Lev, B., Narin, F. (1999): Science and technology as predictors of stock performance, Financial Analysts Journal (55:3), pp. 20-32.
Ernst, H. (2001): Patent applications and subsequent changes of performance: evidence from time-series cross-section analyses on the firm level, Research Policy (30), pp. 143–157.
Griliches, Z. (1981): Market Value, R&D and Patents, Economics Letters, (7), pp. 187.
Farrell, J., and Saloner, G. (1988): Coordination Through Committees and Markets, The RAND Journal of Economics (19:2), pp. 235-252.
Farrell, J., & Saloner, G. (1985): Standardization, compatibility, and innovation, The RAND Journal of Economics, (16), pp. 70-83.
Farrell, J., J. Hayes, C. Shapiro, and T. Sullivan. (2007): Standard setting, patents and hold-up, Antitrust Law Journal (74), pp. 603-670.
Frietsch, R. (2006): Micro data for macro effects. In: Hingley, P./Nicolas, M. (eds.): Forecasting Innovations. Methods for Predicting Numbers of Patent Filings. Berlin: Springer, pp. 125-158.
Goodman, D.J.; Myers, R.A. (2005): 3G Cellular standards and patents’, Wireless Networks, Communications and Mobile Computing 2005 International Conference, pp. 415 – 420.
Graevenitz G., Wagner S., Harhoff D. (2011): How to measure patent thickets--A novel approach, Economics Letters (111-1), pp. 6-9.
Griliches, Z. (1990): Patent statistics as economic indicators: a survey, Journal of Economic Literature (18:4), pp. 1661–1707.
Hall, Bronwyn H, Ziedonis, R.H. (2001): The patent paradox revisited: an empirical study of patenting in the U.S. semiconductor industry 1979-1995, The RAND Journal of Economics (36:1), pp. 101-128.
Hall, Bronwyn H, Jaffe, Adam, Trajtenberg, Manuel. (2005): Market value and patent citations, The RAND Journal of Economics (36:1); pp. 16.
References
197
Hall, Bronwyn H, Grid Thoma, Salvatore Torrisi. (2007): The market value of patents and R&D: Evidence from European firms, NBER Working Paper No. 13426.
Hall, B.H., MacGarvie, M. (2010): The private value of software patents, Research Policy (39), pp. 994-1009.
Hanel, P. (2006) Intellectual property rights business management practices: A survey of the literature, Technovation (26), pp. 895-931.
Harhoff, D., Scherer, F.M., Vopel, K. (2003): Citations, Family Size, Opposition and the Value of Patent Rights, Research Policy (32), pp. 1343-1363.
Layne-Farrar, A., Padilla, A.J., and Schmalensee, R. (2007): Pricing Patents for Licensing in Standard-Setting Organizations: Making Sense of FRAND Commitments, Antitrust Law Journal (74), pp. pp. 603-706.
Layne-Farrar A., Lerner J. (2011): To Join or not to Join: Examining Patent Pool Participation and Rent Sharing Rules, International Journal of Industrial Organizations, (29:2), pp. 294-303.
Layne-Farrar, A., Padilla, A.J. (2011): Assessing the Link Between Standards and Patents, International Journal of IT Standards and Standardization Research (9:2), pp. 19-50.
Layne-Farrar, A. (2011): Innovative or Indefensible? An Empirical Assessment of Patenting Within Standard Setting, International Journal of IT Standards and Standardization Research (9:2), pp. 1-19.
Lerner, J, Tirole, J. (2006): A Model of Forum Shopping, The American Economic Review (96), pp. 1091-1113.
Lyytinen, K., and King, J. L. (2006): Standard Making: A Critical Research Frontier for Information Systems Research, MIS Quarterly (30:Special Issue), pp. 405-411.
Markus, M. L., Steinfield, C. W., Wigand, R. T., and Minton, G. (2006): Industry-Wide Information Systems Standardization as Collective Action: The Case of the U.S. Residential Mortgage Industry, MIS Quarterly (30:Special Issue), pp. 439-465.
Narin, F.; Noma, E. (1987): Patents as indicators of corporate technological strength, Research Policy (16), pp. 143-155.
Narin, F. (1993): Technology indicators and corporate strategy, Review of Business (14:3), pp. 19-25.
Peek, H. B. (2010): The Emergence of the Compact Disc, IEEE Communications Magazine (48:1), pp. 10-17.
Putnam, J. (1996): The value of international patent rights, Yale: Yale University.
Reitzig M, Puranam P. (2009): Value appropriation as an organizational capability: the case of IP protection through patents, Strategic Management Journal (30:7): pp. 765–789.
Rysman M., Simcoe T. (2008): Patents and the Performance of Voluntary Standard Setting Organizations, Management Science (54:11), pp. 1920-1934.

References
198
Shapiro C., Varian H. R. (1999): Information Rules: A Strategic Guide to Network Economy, Cambridge MA: Harvard Business School Press.
Shapiro C. (2001): Navigating the patent thicket: cross licenses, patent pools, and standard setting, In: Jaffe, A., Lerner, J., Stern, S. (Eds.), Innovation Policy and the Economy (1), pp. 119–150.
Trajtenberg M. (1990): A penny for your quotes: patent citations and the value of innovations, The RAND Journal of Economics (21:1), pp. 172–187.
Waguespack, D., L. Fleming. (2009): Scanning the commons? Evidence on the benefits to startups of participation in open standards development, Management Science (55), pp. 210-223.
Weitzel, T., Beimborn, D., König, W. (2006): A unified economic model of standard diffusion: The impact of standardization cost, network effects and network topology, MIS Quarterly (30:Special Issue), pp. 489-514.
White, H. (1980): A Heteroskedasticity-Consistent Covariance Matrix Estimator and a Direct Test for Heteroskedasticity, Econometrica (48:4), pp. 817-838.

Appendix: Robustness checks
199
Appendix: Robustness checks

Appendix: Robustness checks
200
dV: ROA
(Original Model (M6)) dV: Cox-
transformed ROA2 dV: z-standardized
ROA dV: Log-
transformed ROA
dV: ROA, z-standardized
declaration variables
dV: ROA, Log-transformed
declaration variables
Coef. Std. Err. Coef. Std. Err. Coef. Std. Err. Coef. Std. Err. Coef. Std. Err. Coef. Std. Err.
L1.dependent variable 0.216 *** 0.071 0.199 *** 0.056 0.216 *** 0.071 0.127 0.082 0.216 *** 0.071 0.215 *** 0.071
# patent declarations 0.023 *** 0.008 0.012 ** 0.005 0.259 *** 0.090 0.026 ** 0.010 0.004 *** 0.001 0.070 ** 0.030
# patent declarations sq1 -0.002 *** 0.001 -
0.001 ** 0.000 -0.022 *** 0.008 -0.002 ** 0.001 -0.049 *** 0.019 -24.153 * 13.234
# consortia declarations 2.663 ** 1.110 3.392 * 1.870 29.924 ** 12.470 2.495 ** 1.059 0.004 ** 0.002 2.746 ** 1.120 # consortia declarations sq -0.052 *** 0.018
-0.076 0.052 -0.586 *** 0.206 -0.044 ** 0.021 0.000 *** 0.000 -53.662 *** 20.010
# pool licensor seats -0.415 1.979 -
0.388 1.415 -4.665 22.234 -0.675 2.103 -0.415 1.979 -0.528 1.886
# patent applications1 -0.420 13.617 -
4.186 11.534 -4.724 153.002 0.256 14.225 -0.420 13.617 -1.679 13.687
R&D/sales -0.614 *** 0.094 -
0.370 *** 0.081 -6.899 `*** 1.059 -0.712 *** 0.093 -0.614 *** 0.094 -0.615 *** 0.095
Sales/employees 0.109 0.072 0.081 0.066 1.226 0.804 0.093 0.075 0.109 0.072 0.112 0.071
# employees1 -0.034 0.182 -
0.099 0.157 -0.377 2.049 -0.039 0.200 -0.034 0.182 -0.025 0.177
Avg. # FW-Citations -0.005 ** 0.002 0.001 0.003 -0.054 ** 0.026 -0.005 * 0.003 -0.005 ** 0.002 -0.005 ** 0.002
Avg. Family Size 0.002 0.002 0.001 0.002 0.027 0.027 0.003 0.003 0.002 0.002 0.002 0.002
Constant 0.088 *** 0.031 -
0.299 *** 0.036 0.272 0.349 0.101 *** 0.035 0.089 *** 0.031 0.087 *** 0.031
Time Dummies YES YES YES YES YES YES
Number of companies 134 665 134 134 134 134
Observations 817 125 817 817 817 817
R² within 0.363 0.368 0.363 0.311 0.363 0.364
F 12.135 9.410 12.140 10.850 12.140 12.040
Table 6: Coefficients of the explanatory variables for the modified models (part 1)

Appendix: Robustness checks
201
dV: ROA, EBITDA instead of EBIT used for ROA
calculation dV: ROIC dV: EBIT as a share of
sales2 dV: ROA, Lagged control variables2
dV: ROA, Declarations as shares on all patent applications
Coef. Std. Err. Coef. Std. Err. Coef. Std. Err. Coef. Std. Err. Coef. Std. Err.
L1.dependent variable 0.246 *** 0.064 0.124 0.104 -0.251 0.237 0.225 *** 0.074 0.208 *** 0.073
# patent declarations 0.017 ** 0.008 0.036 ** 0.016 0.072 *** 0.020 0.022 *** 0.008 0.006 ** 0.003 # patent declarations sq1 -0.001 * 0.001 -0.003 ** 0.002 -0.006 *** 0.002 -0.002 ** 0.001 -0.173 ** 0.087 # consortia declarations 1.665 1.056 3.928 ** 1.833 5.542 ** 2.404 2.721 ** 1.173 0.106 0.130 # consortia declarations sq -0.040 ** 0.016 -0.072 ** 0.036 -0.090 * 0.049 -0.054 *** 0.019 -0.050 0.105
# pool licensor seats -0.138 2.186 3.144 4.142 -5.126 4.307 -0.463 1.890 0.110 2.026
# patent applications1 6.133 13.806 18.067 26.557 40.519 * 24.289 -1.398 17.436 4.445 12.462
R&D/sales -0.565 *** 0.086 -0.875 *** 0.190 -2.685 *** 0.603 -0.605 *** 0.093 -0.620 *** 0.098
Sales/employees 0.140 ** 0.065 0.195 0.135 0.032 0.221 0.095 0.077 0.116 * 0.068
# employees1 0.121 0.153 -0.130 0.347 -0.053 0.392 -0.054 0.185 -0.043 0.176
Avg. # FW-Citations -0.005 ** 0.002 -0.008 ** 0.004 -0.003 0.004 -0.002 0.002 -0.005 ** 0.002
Avg. Family Size 0.002 0.002 0.005 0.004 -0.005 0.004 0.000 0.002 0.003 0.002
Constant 0.098 *** 0.026 0.156 *** 0.056 0.369 *** 0.090 0.104 *** 0.033 0.086 *** 0.030
Time Dummies YES YES YES YES YES
Number of companies 134 134 131 131 134
Observations 817 817 782 796 817
R² within 0.361 0.250 0.438 0.364 0.365
F 9.940 11.220 6.090 13.190 46.890 Significance Level: ***p<0.01, **p<0.05, *p<0.1 Note: 1 Coefficient multiplied by 1,000 to make effects visible. 2 These measures could only be calculated with a reduced number of cases due to the construction of the dependent variable or the lagged specifications of the explanatory variables. L1.dependent variable means that the respective dependent variable was used as a lagged explanatory variable in the models. Table 6 (continued): Coefficients of the explanatory variables for the modified models (part 2)
Top Related