
![OF SILICA TO PREDICT THE IN-RUBBER DISPERSIBILITY ... · [6] H.-D. Luginsland, A Review on the Chemistry and the Reinforcement of the Silica- Silane Filler System for Rubber Applications,](https://static.fdocuments.us/doc/165x107/5e73ab9b8f52353ce227f06c/of-silica-to-predict-the-in-rubber-dispersibility-6-h-d-luginsland-a-review.jpg)


Languages
Pages
Legal


SILICA-SILANE REINFORCED PASSENGER CAR TIRE TREADS
EFFECT OF SILICA MORPHOLOGY, SILICA-POLYMER
INTERFACE STRUCTURE AND RUBBER MATRIX NETWORK ON TIRE-PERFORMANCE INDICATORS

Silica-silane reinforced passenger car tire treads
Effect of silica morphology, silica-polymer interface structure and rubber matrix network
on tire-performance indicators
By Ernest Cichomski
Ph.D thesis, University of Twente, Enschede, the Netherlands, 2015.
With references – With summary in English and Dutch.
Copy right © Ernest Cichomski, 2015.
All right reserved.
Cover design by Ernest Cichomski
Printed by Print Partners Ipskamp, P.O. Box 333, 7500 AH Enschede, the
Netherlands.
ISBN: 978-90-365-3890-9

SILICA-SILANE REINFORCED PASSENGER CAR TIRE TREADS
EFFECT OF SILICA MORPHOLOGY, SILICA-POLYMER
INTERFACE STRUCTURE AND RUBBER MATRIX NETWORK ON TIRE-PERFORMANCE INDICATORS
DISSERTATION
to obtain
the degree of doctor at the University of Twente,
on the authority of the rector magnificus
Prof.dr. H. Brinksma
on account of the decision of the graduation committee,
to be publicly defended
on Friday 29th of May 2015 at 12:45
by
Ernest Michał Cichomski
born on 22nd of September 1981
in Łódź, Poland

This dissertation has been approved by:
Promotor: prof. dr. ir. J. W. M. Noordermeer
Co-promotor: Dr. Wilma K. Dierkes

Learn from yesterday, live for today, hope for tomorrow. The
important thing is not to stop questioning.
Albert Einstein
To Rima

SILICA-SILANE REINFORCED PASSENGER CAR TIRE TREADS
EFFECT OF SILICA MORPHOLOGY, SILICA-POLYMER
INTERFACE STRUCTURE AND RUBBER MATRIX NETWORK ON TIRE-PERFORMANCE INDICATORS
DISSERTATION
to obtain
the degree of doctor at the University of Twente,
on the authority of the rector magnificus
Prof.dr. H. Brinksma
on account of the decision of the graduation committee,
to be publicly defended
on Friday 29th of May 2015 at 12:45
by
Ernest Michał Cichomski
born on 22nd of September 1981
in Łódź, Poland
Table of contents
Chapter 1 Introduction ....................................................................................... 1
Chapter 2 Tire properties and performance and correlations with rubber properties ........................................................................ 7
Chapter 3 Influence of the silica specific surface area and structure on rolling and wet skid resistance of a passenger car tire tread compound ............................................................................... 63
Chapter 4 Influence of physical and chemical polymer-filler bonds on tire wet traction performance indicators for passenger car tire tread materials ..................................................................... 97
Chapter 5 Influence of modification of the silane coupling agent on wet-traction and rolling resistance performance indicators for passenger car tire tread materials: Influence of number of ethoxy groups ............................................................................ 117
Chapter 6 Modification of the silane coupling agent for improvement of wet traction and rolling resistance: Influence of the length of the aliphatic linker ...................................................................... 140
Chapter 7 Modification of the silane coupling agent for improvement of wet traction and rolling resistance: Influence of the type of alkoxy group ............................................................................... 159
Chapter 8 Effect of the crosslink density and sulfur-length on wet-traction and rolling resistance performance indicators for passenger car tire tread materials ................................................................... 180
Chapter 9 Summary ........................................................................................ 202
Samenvatting ................................................................................. 208
Annex 1 Publications and papers ................................................................. 215
Annex 2 Symbols and abbreviations ............................................................ 218
Curriculum vitae ....................................................................................................... 221
Acknowledgments ..................................................................................................... 222

1
Chapter 1
Introduction
Identifying the inventor of the vulcanization process is complex. Charles
Goodyear (1800–1860) is generally credited as the first to formulate the basic concept.
However, he never fully understood the process. On the other hand, Thomas Hancock
(1786–1865), a British scientist and engineer, was the first to patent vulcanization of
rubber and indeed, he understood vulcanization better than Goodyear and was likely
inspired by seeing Goodyear's earlier samples. Hancock was awarded a British patent
on May 21, 1844. Three weeks later, Goodyear was awarded a patent in the United
States 1
The history of synthetic rubber started with Michael Faraday who had shown in
1829 that rubber had the empirical formula C5H8. In 1860, Greville Williams obtained a
liquid with the same formula by dry distillation of natural rubber; he called it “isoprene”.
Synthetic rubber technology started further in 1879, when Gustave Bouchardat found
that heating isoprene with hydrochloric acid produced a rubberlike polymer. However,
Bouchardat had obtained isoprene from natural rubber; the first truly synthetic rubber
was made by William Tilden three years later. Tilden obtained isoprene by cracking
turpentine, but the process of converting it to rubber took several weeks. In 1911 Francis
Matthews and Carl Harries discovered, independently, that isoprene could be
polymerized more rapidly by sodium 2.
Through the 1920’s, synthetic rubber research was influenced by fluctuations of
the price of natural rubber. Prices were generally low, but export restrictions of natural
rubber from British Malaya introduced by the British in 1922, coupled with the resultant
price increase, sparked the establishment of modest synthetic rubber research programs
in the Soviet Union, Germany and the United States between 1925 and 1932.
Researchers at I. G. Farben, a German conglomerate that included Bayer, focused on
the sodium polymerization of the monomer butadiene to produce a synthetic rubber
called “Buna” (“bu” for butadiene and “na” for natrium, the chemical symbol for sodium).
2
The brake-trough came with the discovery in 1929 that Buna S (butadiene and styrene
randomly co-polymerized in emulsion), when compounded with carbon black, was
significantly more durable than natural rubber.
Carbon black can be considered as a one of the oldest manufactured products
and its usage as a pigment of India inks and mural paints can be traced back to the
ancient Chinese and Egyptians. The most important event which had the greatest
influence on the usage of carbon black occurred at the beginning of the former century
and involved the discovery of the reinforcing effect of carbon blacks when added to
natural rubber, a discovery that was to become one of the most significant milestones in
the rubber and automotive industry. By using carbon black as a reinforcing filler the
service life of a tire was greatly increased, ultimately making it possible to achieve a
range of several ten thousand kilometers.3
Since the early nineteen-forties, carbon blacks have been complemented by the
group of highly active silicas. Technological reasons have long prevented silicas from
being used in tire compounds. Conventionally, carbon black is considered to be a more
effective reinforcing filler for rubber tire treads than silica, if the silica is used without a
coupling agent. In comparison with carbon black there tends to be a lack of, or at least
an insufficient degree of physical and/or chemical bonding between the silica particles
and the rubber. This is necessary to enable the silica to become a reinforcing filler for
the rubber for most purposes, including tire treads. To overcome such deficiencies,
additives capable of reacting with both the silica surface and the rubber molecules,
generally known as coupling agents became a necessity during compounding 4. Silica
offers several advantages over carbon black. In tire treads, silica yields a comparable
wear resistance and better wet grip in combination with a lower rolling resistance than
carbon black when used in combination with a coupling agent 5,6.
Since rubber and carbon black are both hydrophobic substances, problems rarely
arise when the two are mixed. When silica is mixed however with the commonly used
non-polar, olefinic hydrocarbon rubbers, there will be a greater occurrence of hydrogen-
bond interactions between surface silanol groups in silica agglomerates than of
interactions between polar siloxane or silanol groups and the rubber, so mixing silica
with rubber involves major problems 7. For this reason there is great interest in the
3
possibility of enhancing the compatibility of hydrocarbon rubbers and precipitated silica
by modifying the surface of the silica. Bifunctional organosilanes are commonly used to
chemically modify the silica surface in order to promote interactions with hydrocarbon
rubbers. The most widely used organo-silane for tire applications nowadays is
bis(triethoxysilylpropyl) tetrasulfide (TESPT) 8. In the late 60’s of last century a silane
coupling agent such as 3-mercaptopropyltrimethoxyl silane was applied in silica filled
rubber to improve the reinforcing properties. This silane had a scorch problem: the
tendency to prematurely vulcanize during processing. Therefore, the new silane bis-(3-
triethoxysilylpropyl) tetrasulfide was introduced by Degussa in 1972 9,10,11. Michelin was
the pioneer in the silica technology and the partial substitution of carbon black by silica
in 1992 helped launch its first generation of low fuel consumption 'Green Tires'.
The use of silica can result in a reduction in rolling resistance of 20 % and more,
relative to carbon black. Assuming correct tire pressures are maintained and making
allowance for varying speeds and different driving characteristics, a 20 % reduction in
rolling resistance according to Michelin corresponds to appr. 5 % fuel savings 12.
Due to the increased use of silica for reinforcement in tire technology and its potential in
other rubber applications, it is generally felt that a further study of the mechanism of
silica adhesion, or compatibilization with the rubber matrix by coupling agents, is
appropriate.
1.2 AIM OF THIS THESIS
The aim of the investigations in the present thesis is to aid the understanding of
the underlying mechanisms involved in rubber-filler interactions for the wet skid and
rolling resistances of tires, a dynamic viscoelastic phenomenon. Despite many studies
on the performance of tire tread compounds, thorough knowledge of the influence of the
characteristics of silica reinforcing fillers on wet skid and rolling resistance is still limited.
Another important element is the chemical structure of the silane coupling agent which
determines the polymer-filler interactions and influences the wet skid and rolling
resistances. The chemical structure of the coupling agent determines the silanization
kinetics and reactivity towards the polymer. The use of silane coupling agents is related
4
with the application of chemistry in equipment which is designed for physical processes
only: the mixing of carbon black, and this causes limitations during processing. One of
the main obstacles is the generation of ethanol from the reaction of the silane with the
silanol moieties on the silica surface during the mixing process. Another problem is
related with the adsorption of byproducts of the silanization onto the silica surface and
their negative effects on the final properties.
1.3 STRUCTURE OF THIS THESIS
Chapter 2: briefly describes the influence of major compounding ingredients: diverse
filler systems, polymer functionalization and type of silane coupling agent on the
reinforcement mechanisms of rubbers with emphasis on tire wet skid and rolling
resistance related properties.
This thesis encompasses 6 experimental chapters:
Chapter 3: Is a comparative study of five different reinforcing silica types concerning
their influence on properties related to tire performance. The silicas are characterized by
different specific surface areas, aggregate sizes and structure, but with otherwise
comparable properties. The value of the dynamic loss tangent, tan δ at 60 °C is used to
assess the influence on rolling resistance, and a Laboratory Abrasion Tester (LAT 100)
is used to evaluate the wet skid resistance of the tested compounds
Chapter 4: In this chapter a series of compounds with two fundamentally different
polymer-filler interphases is examined: one with chemical bonds, another with physical
interaction. These interphases are obtained by two different silane coupling agents from
which one is unable to form chemical bonds between filler and polymer. This leads to
changes in macroscopic material properties including wet skid resistance.
Chapter 5: A study of the effect of the number of ethoxy-groups in the silane coupling
agent on the macroscopic dynamic compound properties as indicators for tire
performance. Silanes with just one ethoxy-group instead of three as commonly used, are

5
expected to decrease rolling resistance and to improve wet skid resistance, based on
the changes in hysteresis caused by the structural changes of the silane.
Chapter 6: Deals with the hydrocarbon-chain or simply the linker within the silane
coupling agent. In order to investigate the influence of the linker length on the wet skid
and rolling resistance indicators, a silane with a decyl-linker, bis-(triethoxysilyldecyl)-
tetrasulfide (TESDeT), is compared with bis-(triethoxysilylpropyl) tetrasulfide (TESPT) on
equimolar basis.
Chapter 7: The type of alkoxy-groups of the silane coupling agent determines the
silanization rate and the kind of alcohol evolved during the silanization reaction.
Therefore, independent of the reactivity of the silane towards the silica surface and of
the reactivity towards the polymer chain, the physical and chemical properties of
byproducts of the silanization reaction are of great importance for the material
performance. To investigate the influence of the alkoxy-group on the wet skid and rolling
resistance related properties, two silanes differing in type of alkoxy-group but with
otherwise comparable structures are synthetized. One silane with methoxy-groups, bis-
(dimethylmethoxysilylpropyl) tetrasulfide (MMeOS), was chosen due to its high
silanization rate, and bis-(dimethylmethoxyethoxysilylpropyl) tetrasulfide (MMeOEtOS)
for its increased affinity of the hydrolysable group towards the silica surface. Both
silanes are compared with the reference silane TESPT.
Chapter 8: The scope of this chapter is to study the influence of different sulfur
vulcanization systems for silica reinforced SBR/BR blends on the performance indicators
of tire treads made thereof. Three series of compounds are prepared: with conventional,
semi-efficient and efficient vulcanization systems. Each vulcanization system results in a
specific overall crosslink density and different sulfur rank distribution: mono-, di- and
polysulfidic of nature.
Chapter 9 contains the summary of this thesis.

6
REFERENCES
[1] 1493: Uncovering the New World Columbus Created. Random House Digital, Inc.,
Knopf (2013) 244.
[2] U.S. Synthetic Rubber Program, University of Akron, Ohio (1998).
[3] Carbon Black: Science and Technology, Second Edition, Jean-Baptiste Donnet,
CRC Press (1993).
[4] D. J. Zanzig, P. H. Sandstrom, M. J. Crawford, J. J. A. Verthe and C. A. Losey
(to The Goodyear Tire & Rubber Company), EP 0 638 610 A1 (27-07-1994).
[5] Degussa, Organosilanes for the rubber industry, technical inf. (1995).
[6] M. P. Wagner, Rubber Chem. Technol., 49 (1976) 703.
[7] R. W. Cruse et al., Rubber & Plastics News, (17 April 1997) 14.
[8] US. Pat. 3,768,537 PPG industries Inc., R.H. Hess et al. (1973).
[9] S. Wolff, Rubber Chem. Technol., 69 (1996) 325.
[10] S. Wolff, Kautsch. Gummi Kunstst., 34 (1981) 280.
[11] F. Thum, S. Wolff, Kautsch. Gummi Kunstst., 28 (1975) 733.
[12] Internet Page, www.tyres-online.co.uk/technology/silica.asp.

7
Chapter 2
Tire properties and performance and correlations with rubber properties
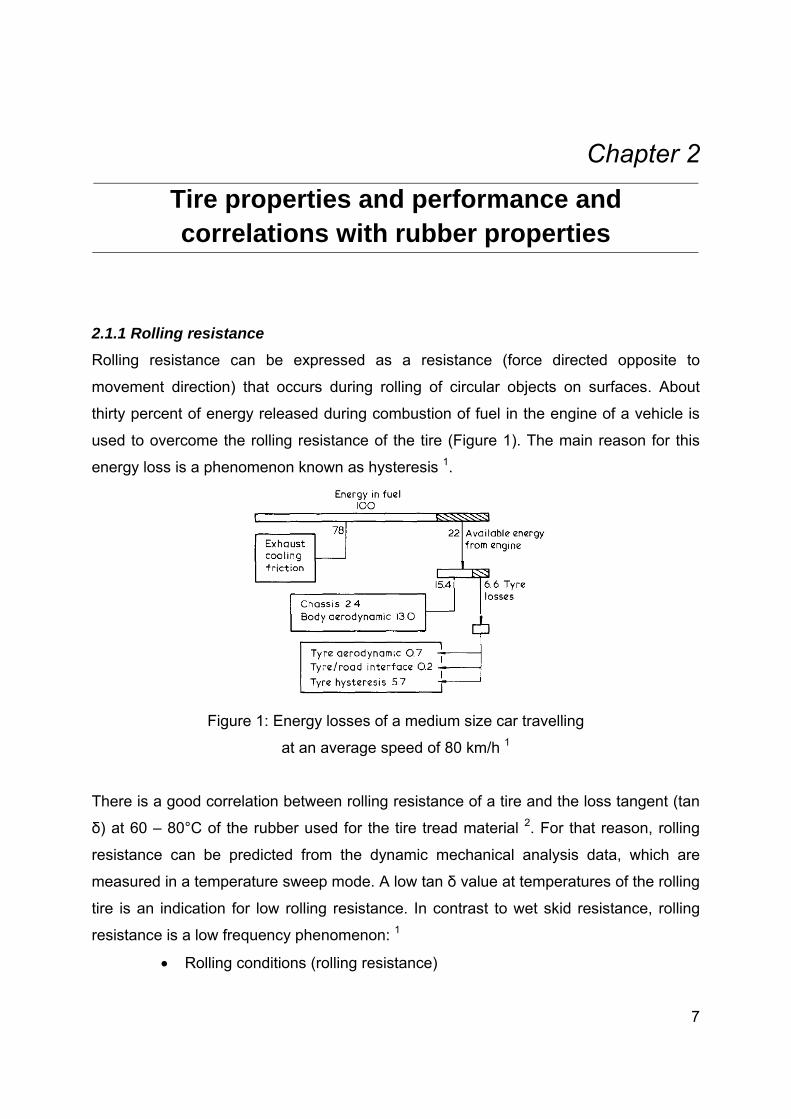
2.1.1 Rolling resistance
Rolling resistance can be expressed as a resistance (force directed opposite to
movement direction) that occurs during rolling of circular objects on surfaces. About
thirty percent of energy released during combustion of fuel in the engine of a vehicle is
used to overcome the rolling resistance of the tire (Figure 1). The main reason for this
energy loss is a phenomenon known as hysteresis 1.
Figure 1: Energy losses of a medium size car travelling
at an average speed of 80 km/h 1
There is a good correlation between rolling resistance of a tire and the loss tangent (tan
δ) at 60 – 80°C of the rubber used for the tire tread material 2. For that reason, rolling
resistance can be predicted from the dynamic mechanical analysis data, which are
measured in a temperature sweep mode. A low tan δ value at temperatures of the rolling
tire is an indication for low rolling resistance. In contrast to wet skid resistance, rolling
resistance is a low frequency phenomenon: 1
Rolling conditions (rolling resistance)

8
- relatively low frequency (up to 120 Hz)
- relatively low temperature (50°C for passenger tires)
Sliding conditions (wet skid)
- relatively high frequency (50 kHz – 1 MHz)
- relatively high temperature (100 – 150°C)
The rolling resistance of a tire depends on several parameters:
- Surface texture of the road
- Tire composition
- Tire service temperature
- Weather conditions
Surface roughness of the road on which the tire moves is an important factor. The
frequencies for rolling and sliding given above are the result of the speed of a vehicle
and texture roughness of the surface on which the tire is moving 3. Micro and macro
texture roughness act as contact points between the surface of the tire tread and the
road. There are two scales of road texture: 1
Macro-texture levels
- aggregate particle size 6 – 12 mm
- interparticle spacing 1 – 4 mm
- absolute texture depth 1 – 3 mm
Micro-texture levels
- 10 – 100 μm
From the material point of view, the hysteresis (H) is the most important characteristic
for the energetic balance. It is defined as energy loss divided by the total energy in a
kinematic deformation cycle (Equation 1).
Equation 1
energyTotal
lossEnergyH
9
During dynamic stress, a part of the energy applied to rubber is converted into heat
(heat buildup of a tire) as a result of internal friction between filler particles and filler and
polymer chains. Because of the heat buildup, the temperature of the moving tire rises
until it reaches equilibrium with a cooling medium (environmental conditions). In most of
the cases, the temperature of a moving tire is 60 – 80°C.
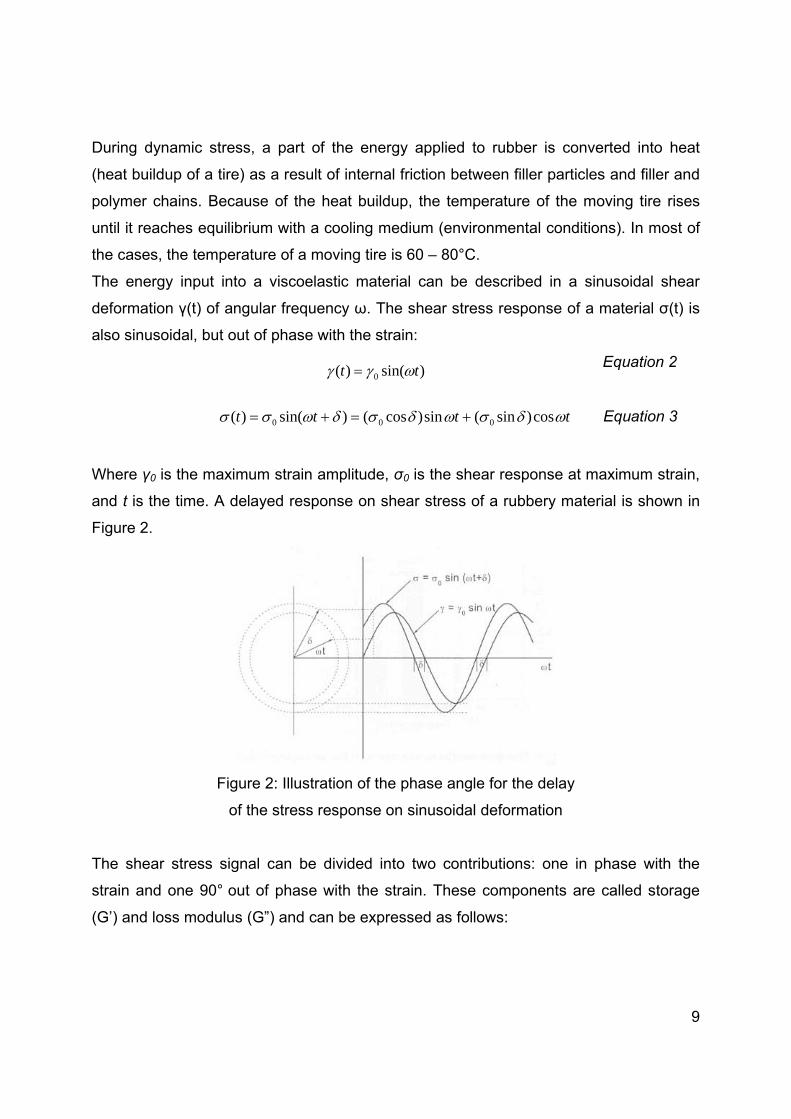
The energy input into a viscoelastic material can be described in a sinusoidal shear
deformation γ(t) of angular frequency ω. The shear stress response of a material σ(t) is
also sinusoidal, but out of phase with the strain:
Equation 2
tttt cos)sin(sin)cos()sin()( 000 Equation 3
Where γ0 is the maximum strain amplitude, σ0 is the shear response at maximum strain,
and t is the time. A delayed response on shear stress of a rubbery material is shown in
Figure 2.
Figure 2: Illustration of the phase angle for the delay
of the stress response on sinusoidal deformation
The shear stress signal can be divided into two contributions: one in phase with the
strain and one 90° out of phase with the strain. These components are called storage
(G’) and loss modulus (G”) and can be expressed as follows:
)sin()( 0 tt

10
cos'0
0G Equation 4
sin"0
0G Equation 5
The ratio of the above mentioned loss modulus and storage modulus is called the
mechanical loss tangent (Equation 6). This material parameter represents its ability for
energy storage or dissipation.
Equation 6
In a tan δ – temperature plot as shown in Figure 3, the maximum of the curve is easy to
detect; it represents the temperature at which the energy loss of a compound has a
maximum.
Figure 3: The loss tangent vs. temperature curve obtained for carbon black and silica
filled compounds 4.
For low rolling resistance, the tire tread material should have hysteretic energy
losses as low as possible. The main cause of hysteresis is breakdown and reformation
of the filler aggregates (the filler-filler network) under dynamic strain and sliding of
polymer chains along the filler surface due to weak interactions between filler and
elastomer. The filler-filler network is also relatively weak and breaks easily under the
influence of strain, causing energy losses. In order to decrease the tan δ value at higher
'
"
G
GTan

11
temperatures, the network between the filler agglomerates should be less developed
and the filler-elastomer interaction should be increased, preferably by a chemical
interaction. It must clearly be stated that these two conditions should be satisfied at
once. This means that for example for rubber, in which the filler is very well dispersed
but which has only physical interactions with the elastomer matrix, hysteresis still will be
high. This is the case for carbon black.
In rubber compounds, there are three parameters that can be varied in order to
change the dynamic properties of the material: the filler, the polymer and the crosslink
type and density. A lower hysteresis can be obtained by adjusting these parameters.
Concerning the filler, a good dispersion and filler-polymer interaction are required.
Decreased rolling resistance can be also obtained by using polymer blends.
Thanks to a low glass transition temperature of -90°C, butadiene rubber will reduce the
hysteresis when it is blended with SBR, resulting in lower rolling resistance. However,
unfortunately the wet skid resistance will also suffer. Polymers with a high primary chain
molecular weight also contribute to reduced hysteresis 4. High values of molecular
weight, meaning long polymer chains, result in a more restricted polymer chain
movement than in case of shorter and more plastic polymers.
2.1.2 Wet skid resistance
While rolling resistance is a very important property from an economical point of
view, the performance during breaking is a safety issue. Therefore, a shorter breaking
distance significantly improves the safety of traffic, on dry as well as on wet roads. There
is a fundamental difference between breaking on dry and breaking on wet surfaces: The
distance of breaking on wet surfaces is significantly longer than on dry surfaces. This is
the result of the lubrication influence of water. It has been widely accepted that the
dynamic properties of tread compounds, namely tan δ at low temperatures and high
frequencies, are an indicator of wet skid resistance due to the high frequency nature of
the dynamic strain involved 5.
When the green tire, a tire with a tread of a low hysteresis material, was commercialized,
it was found that besides low rolling resistance, this tire featured better wet skid
12
resistance 5. This was achieved by replacing carbon black by a silica-coupling agent
system. This improvement in tire performance can be explained in two ways:
(I) As a consequence of the dynamic properties of the silica filled tire tread
material;
(II) As a consequence of the hydrophilic surface properties of the tire tread
material filled with silica.
The first phenomenon is explained by the differences in dynamic properties of silica filled
and carbon black filled rubber. The main difference between these two materials lays in
a higher hysteresis at lower temperatures, and a lower hysteresis at higher temperatures
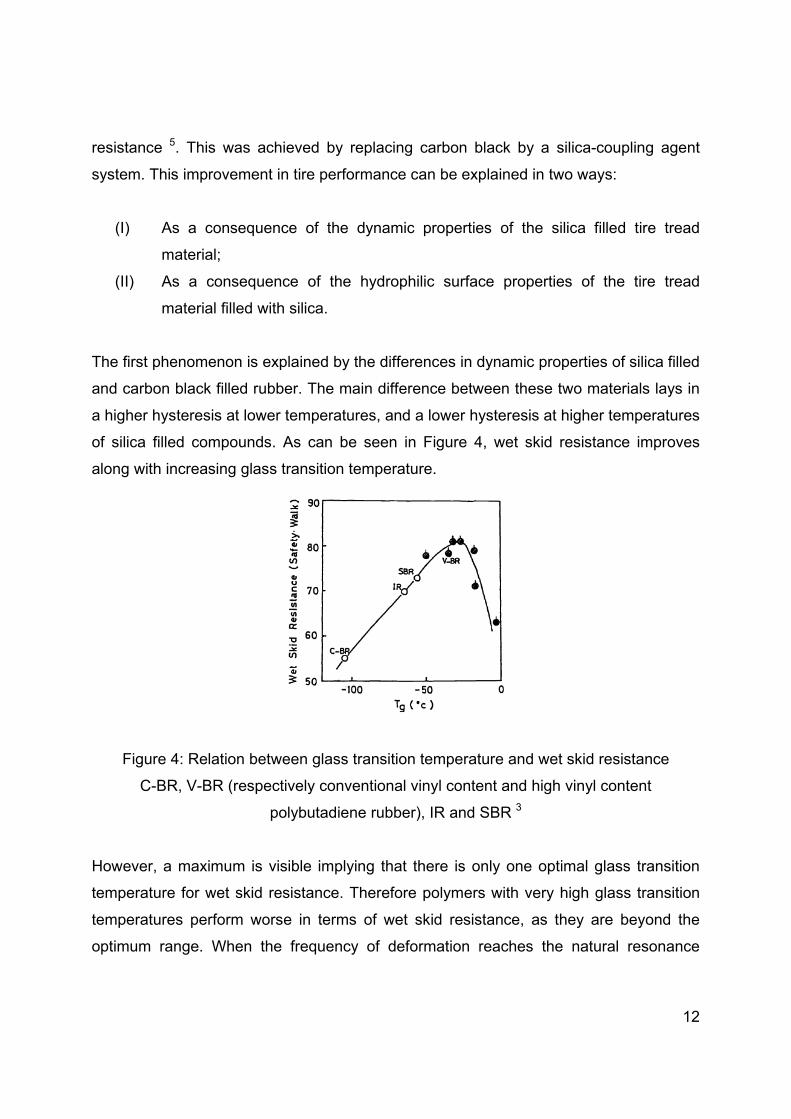
of silica filled compounds. As can be seen in Figure 4, wet skid resistance improves
along with increasing glass transition temperature.
Figure 4: Relation between glass transition temperature and wet skid resistance
C-BR, V-BR (respectively conventional vinyl content and high vinyl content
polybutadiene rubber), IR and SBR 3
However, a maximum is visible implying that there is only one optimal glass transition
temperature for wet skid resistance. Therefore polymers with very high glass transition
temperatures perform worse in terms of wet skid resistance, as they are beyond the
optimum range. When the frequency of deformation reaches the natural resonance
13
frequency of the polymer, energy dissipation shows maximum; this point is called the
glass transition. There is also a specific range which coincides with the frequency of the
tire under service conditions.
Considering the two facts that
(1) There is only one, more and less specific frequency and temperature of the tire
during wet skid, which is probably higher than the temperature of the rolling tire;
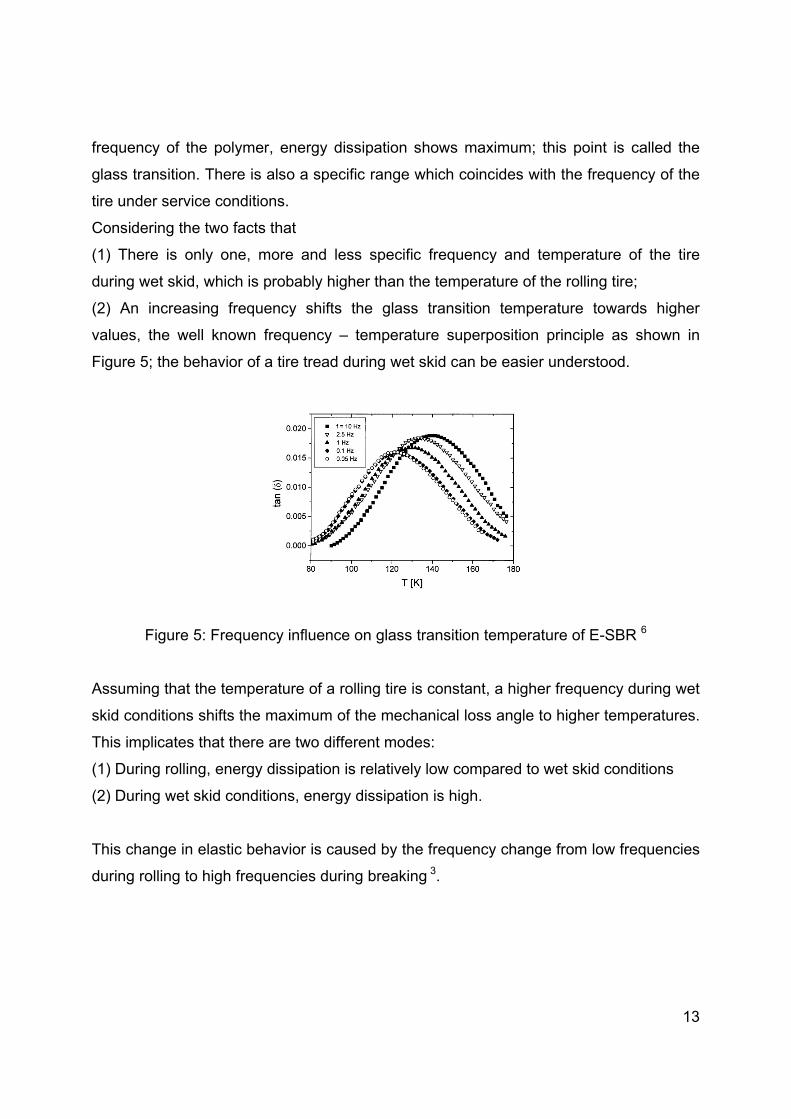
(2) An increasing frequency shifts the glass transition temperature towards higher
values, the well known frequency – temperature superposition principle as shown in
Figure 5; the behavior of a tire tread during wet skid can be easier understood.
Figure 5: Frequency influence on glass transition temperature of E-SBR 6
Assuming that the temperature of a rolling tire is constant, a higher frequency during wet
skid conditions shifts the maximum of the mechanical loss angle to higher temperatures.
This implicates that there are two different modes:
(1) During rolling, energy dissipation is relatively low compared to wet skid conditions
(2) During wet skid conditions, energy dissipation is high.
This change in elastic behavior is caused by the frequency change from low frequencies
during rolling to high frequencies during breaking 3.

14
Returning to the second phenomenon that is hydrophilic surface properties of the tire
tread, the three zone concept of wet skid (Figure 6) must be explained. The area under
a tire during wet skid can be divided into three zones 5,7:
Zone 1: Squeeze – film zone: In this region of contact area, a water wedge is
formed due to the displacement inertia of the intercepted water film.
Zone 2: Transition zone: This is the region in which partial breakdown of the water
film, now considerable reduced in thickness, is occurring. The friction coefficient
varies widely from a very low value of viscous hydroplaning at the leading edge of
this zone to almost dry friction at the end of the transition zone.
Zone 3: Traction zone: In this rear part of the contact area, the lubrication water
film has almost been removed and dry friction is dominant.
Figure 6: Three zone concept 7
The three zone concept gives also one of the explanations why tire treads containing
silica instead of carbon black as a filler show better wet skid performance: The silica
filled compound contains bare silica particles at the interface rubber – water film (Figure
7). Due to the polar silica surface, the water film breaks easier compared to a carbon
black containing surface, and the transition zone is reduced simultaneously increasing
the traction zone. Consequently, local dry patches are formed creating a much higher
friction coefficient and thus higher skid resistance between water and the rubber surface.
Another consequence of this phenomenon is that higher silica loadings lead to

15
improvements of the wet skid resistance, as a higher particle density at the interface
increases its polarity and hydrophilicity 5,8.
Figure 7: Partial penetration of a water film by silica particles in the material
surface 5.
2.1.3 Wear resistance
Wear is one of the consequences of the relative motion of two contacting surfaces under
conditions that produce frictional work or energy. It is defined as a loss of material from
one (or both) surfaces during the sliding contact that generates the frictional work 9.
Wear of materials can be divided into several types: adhesive, abrasive, erosive,
corrosive and fatigue. It is a very complex phenomenon in which pavement roughness,
temperature and interface contaminants (water, sand or mud) also play an important
role. However, the above mentioned factors can not easily be adjusted, so the only way
to improve wear resistance is to change the material properties.
The tire tread during rolling and especially during breaking is subjected to mainly
abrasive wear. Abrasive wear is governed by the abrasion of the surface layer of
materials by the sharp edges of hard projections from the rough surface of the abradant.
The ability of a tire to resist abrasive wear or abrasion resistance determines the tire life
time or mileage 9.
Glass transition temperature, reinforcing system and the cure system are factors
determining the absolute wear rate of the tread compound. Generally, wear resistance is
increasing with decreasing glass transition temperature, as shown in Figure 8 10. SBR is
blended with butadiene rubber (Tg= -90°C) to increase wear resistance and decrease
16
Figure 8: Glass transition temperature influence on abrasive wear 11
rolling resistance. Polymers with higher molecular weight and a narrow molecular weight
distribution have also higher wear resistance 4, 11, 12.
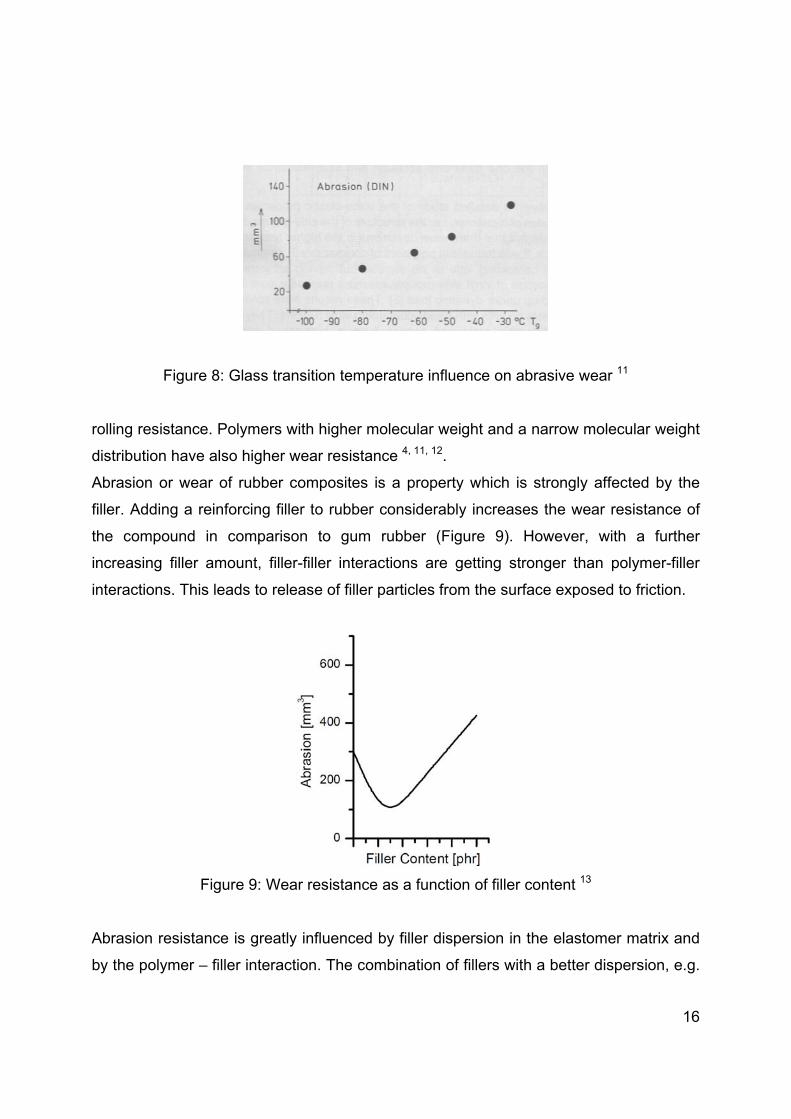
Abrasion or wear of rubber composites is a property which is strongly affected by the
filler. Adding a reinforcing filler to rubber considerably increases the wear resistance of
the compound in comparison to gum rubber (Figure 9). However, with a further
increasing filler amount, filler-filler interactions are getting stronger than polymer-filler
interactions. This leads to release of filler particles from the surface exposed to friction.
Figure 9: Wear resistance as a function of filler content 13
Abrasion resistance is greatly influenced by filler dispersion in the elastomer matrix and
by the polymer – filler interaction. The combination of fillers with a better dispersion, e.g.

17
carbon black, and non-polar rubbers such as SBR, give high abrasion resistance. Figure
10 compares the abrasion index of a carbon black compound with the abrasion index of
a silica compound with and without coupling agent in two slip modes (obtained on a
laboratory wear testing machine, LAT 100). From this figure, two conclusions can be
drawn:
First, the filler – polymer compatibility has a higher contribution to wear resistance than
the coupling phenomenon. The second conclusion is a low efficiency of silanisation,
which is confirmed by the calculations of the silanization yield: the silanization of 8 phr
coupling agent (triethoxysilylpropyl tetrasulfide, TESPT) with 80 phr silica with a specific
surface area of 170 m2/g leads to the reaction of only 1 Si-OH per nm2 out of 4 to 8
silanol groups per nm2 available on silica surface 5.
Figure 10: Abrasion resistance of carbon black (N234), silica and silica/TESPT
compounds in two slip angels – 14% and 21% 14
The specific surface area of a filler also has a contribution to wear resistance: along with
an increasing surface area, the polymer – filler interaction is also increasing, leading to
improved wear resistance. Unfortunately, with increasing specific surface area, the filler
– filler interactions rise more rapidly than the polymer – filler interactions, so during
mixing dispersion is more difficult, leading to inferior wear resistance (Figure 11).
18
Figure 11: Wear resistance as a function of surface area of carbon black 14
Because of the locally relatively high temperatures in places where friction occurs, wear
resistance of a tire tread also depends, to a large extent, on its resistance to high
temperatures.
Hardness is a factor as it makes cutting and ploughing processes more difficult. Wear of
polymers has been shown to depend on the surface roughness of the road, but poor
correlations exist between hardness and wear in polymers. Hutchins15 suggested that
this may be due to a significant elastic deformation during hardness testing in polymers.
Furthermore, the mechanisms of wear in polymers may involve fatigue crack growth
rather than the plastic deformation process common in metals.
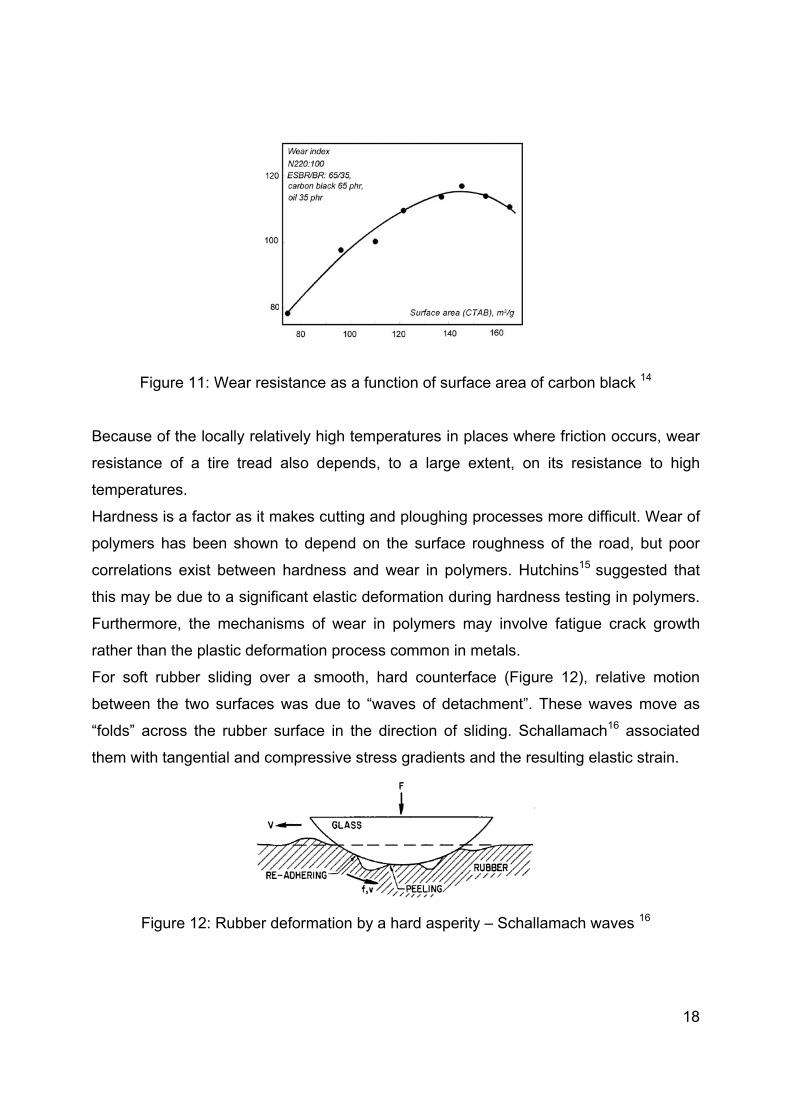
For soft rubber sliding over a smooth, hard counterface (Figure 12), relative motion
between the two surfaces was due to “waves of detachment”. These waves move as
“folds” across the rubber surface in the direction of sliding. Schallamach16 associated
them with tangential and compressive stress gradients and the resulting elastic strain.
Figure 12: Rubber deformation by a hard asperity – Schallamach waves 16
19
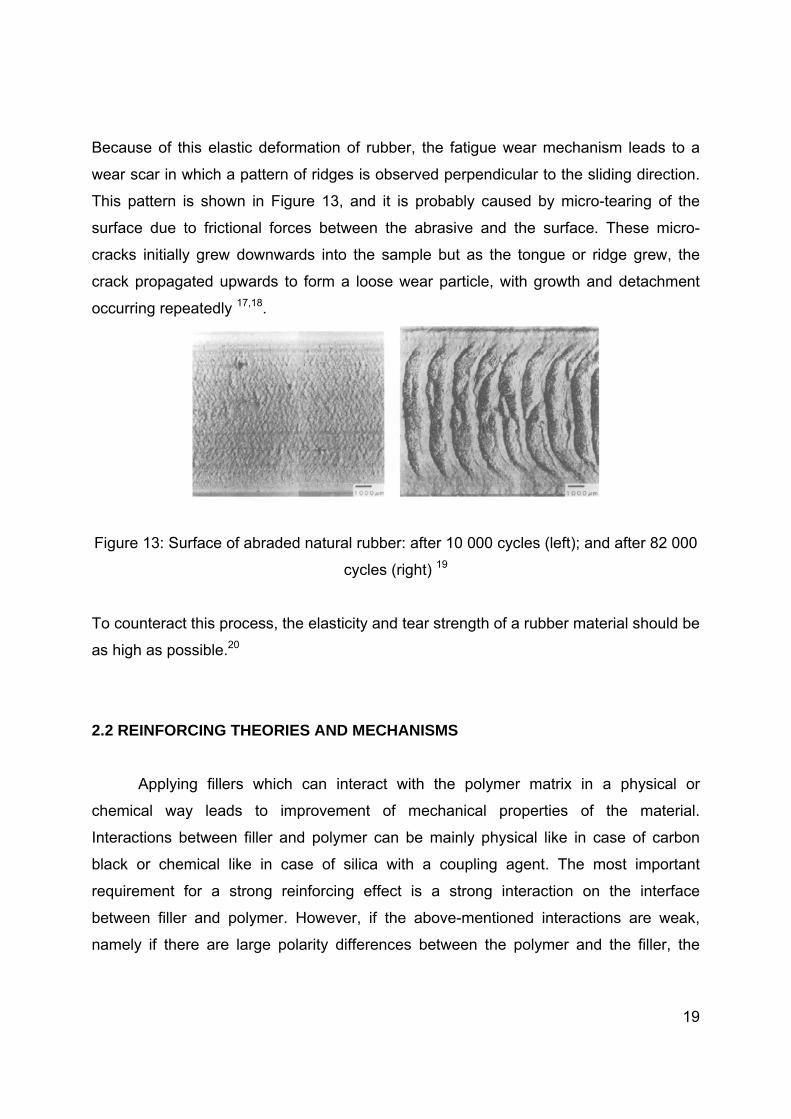
Because of this elastic deformation of rubber, the fatigue wear mechanism leads to a
wear scar in which a pattern of ridges is observed perpendicular to the sliding direction.
This pattern is shown in Figure 13, and it is probably caused by micro-tearing of the
surface due to frictional forces between the abrasive and the surface. These micro-
cracks initially grew downwards into the sample but as the tongue or ridge grew, the
crack propagated upwards to form a loose wear particle, with growth and detachment
occurring repeatedly 17,18.
Figure 13: Surface of abraded natural rubber: after 10 000 cycles (left); and after 82 000
cycles (right) 19
To counteract this process, the elasticity and tear strength of a rubber material should be
as high as possible.20
2.2 REINFORCING THEORIES AND MECHANISMS
Applying fillers which can interact with the polymer matrix in a physical or
chemical way leads to improvement of mechanical properties of the material.
Interactions between filler and polymer can be mainly physical like in case of carbon
black or chemical like in case of silica with a coupling agent. The most important
requirement for a strong reinforcing effect is a strong interaction on the interface
between filler and polymer. However, if the above-mentioned interactions are weak,
namely if there are large polarity differences between the polymer and the filler, the
20
polymer chains are easily sliding over the filler particles and the reinforcing effect is
limited to physically anchored polymer chains only. Mixing carbon black with a non-polar
rubber like SBR leads to strong physical interactions causing improvement of
mechanical properties. Silica interacts with above-mentioned non-polar rubbers only
weakly due to the high polarity of its surface. Therefore, reinforcing capabilities of pure
silica in non-polar elastomers are weak. This problem was solved by using coupling
agents that create a bond between a non-polar polymer and the high polar surface of
silica. Dispersion of fillers in a polymer matrix equally plays an important role in polymer
reinforcement.
2.2.1 Filler-filler interactions
When fillers are dispersed in a polymer matrix, they form aggregates which can
be connected in a filler-filler network. Between the adherent, not covalently connected
filler particles, there is a strong energy dissipation due to friction. Because of physical or
weak chemical interactions between the filler particles, the filler-filler network is rather
weak, which means that it can be broken under strain. This effect is called Payne effect,
and it is an indication of the degree of filler-filler interaction.
The Payne effect is observed in filled rubbers under low shear conditions. The
loss and storage modulus of filled rubbers are amplitude-dependent. There is a specific
value of shear amplitude at which the loss modulus reaches a maximum and the storage
modulus has an inflection point. This effect is independent of the type of polymer but is
dependent on the type of filler. Silica filled rubbers, in which the silane coupling agent
was not introduced, show a much stronger Payne effect than the rubbers filled with
carbon black 21.
2.2.2 Filler-polymer interactions
When elastomers and reinforcing fillers are mixed, interactions occur and polymer
chains are immobilized on the filler surface. This results in a thin layer of polymer (2 – 5
nm), which encapsulates filler particles and aggregates 22. These interactions can be so
strong that even a good solvent for the polymer can not extract it. The part of rubber that
can not be extracted is called bound rubber. According to Medalia 22, besides a
21
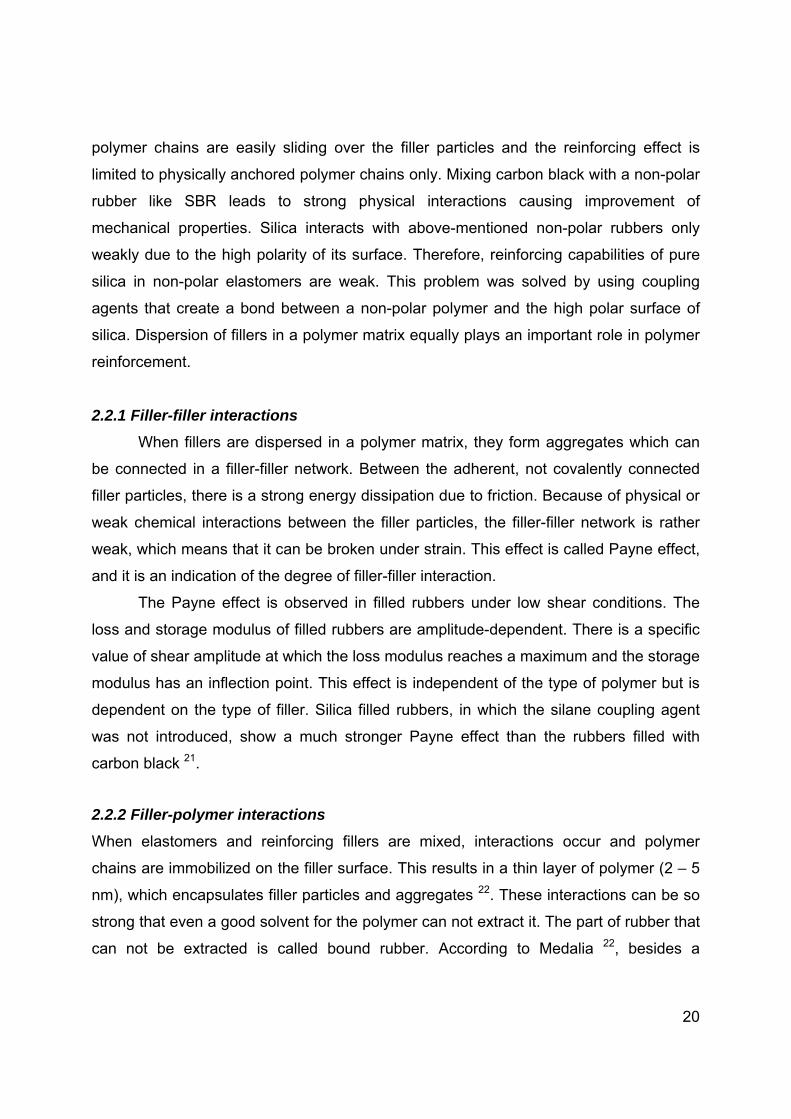
classification in chemically and physically bound rubber, there are two other types
(Figure 14): A part of the rubber is trapped in the cavities of the filler structure; this part
is called occluded rubber. The other part of the rubber, which is adsorbed onto the
external aggregate surface, is called shell rubber. Under increasing deformation, these
filler-polymer structures can successfully release the rubber which can further transfer
the applied load. The filler-polymer interaction depends on the filler particle size: smaller
filler particles have a higher contact surface with the polymer, and therefore a higher
amount of bound rubber. However, applying very high specific surface area fillers in
elastomers leads to difficulties during processing due to an increased blend viscosity. Error! Bookmark not defined.
Figure 14: Schematic view of bond rubber:
(a) – Occluded rubber model 23, (b) – Shell rubber model 24
2.2.3 Hydrodynamic effect
This effect explains the viscosity increase of a liquid by the addition of rigid particles. In
1906, Einstein proposed the first straight theoretical model for viscosity increase in
Newtonian flow (Equation 7) with the following assumptions:
Particles are dispersed perfectly
No interactions between particles
Particles are rigid
Particles are perfectly spherical
Particles are perfectly wetted by the liquid

22
In Equation 7, φ is the volumetric concentration of the particles and η0 and η are the
viscosity of the pure liquid and the suspension respectively 25.
Equation 7
In polymer technology, some of Einstein’s assumptions are rather unusual, in particular
that filler particles are perfect spheres and that there are strong filler-polymer
interactions. The latter deficiency was taken into account in the equation introduced by
Guth and Gold: 26
Equation 8
By changing the viscosity for the elastic modulus E, this equation can easily be
converted for elastic materials (Equation 9):
Equation 9
However, in actual practice different kind of fillers have different particle shapes. To take
different shapes into consideration, a form factor f was introduced. This factor is the ratio
of the longest dimension of the reinforcing particle to the shortest dimension. The
modernized version of the Guth and Gold equation becomes then:
Equation 10
Nevertheless, all published results indicate that the above-mentioned equations cannot
precisely predict the experimental values of the modulus when the filler concentration is
in the practical range unless empirical coefficients are used 20, 25.
2.2.4 Polymer network
The polymer network, especially crosslinks formed during vulcanization, has its own
contribution to the modulus of the material. According to Equation 11, the static modulus
of rubber is proportional to the concentration of elastically active network chains υ and
)5.21(0
)1.145.21( 20
)1.145.21( 20 EE
)62.167.01( 220 ffEE
23
the absolute temperature T, with the Boltzmann constant kB fulfilling the role of the
proportionality constant 27:
Equation 11
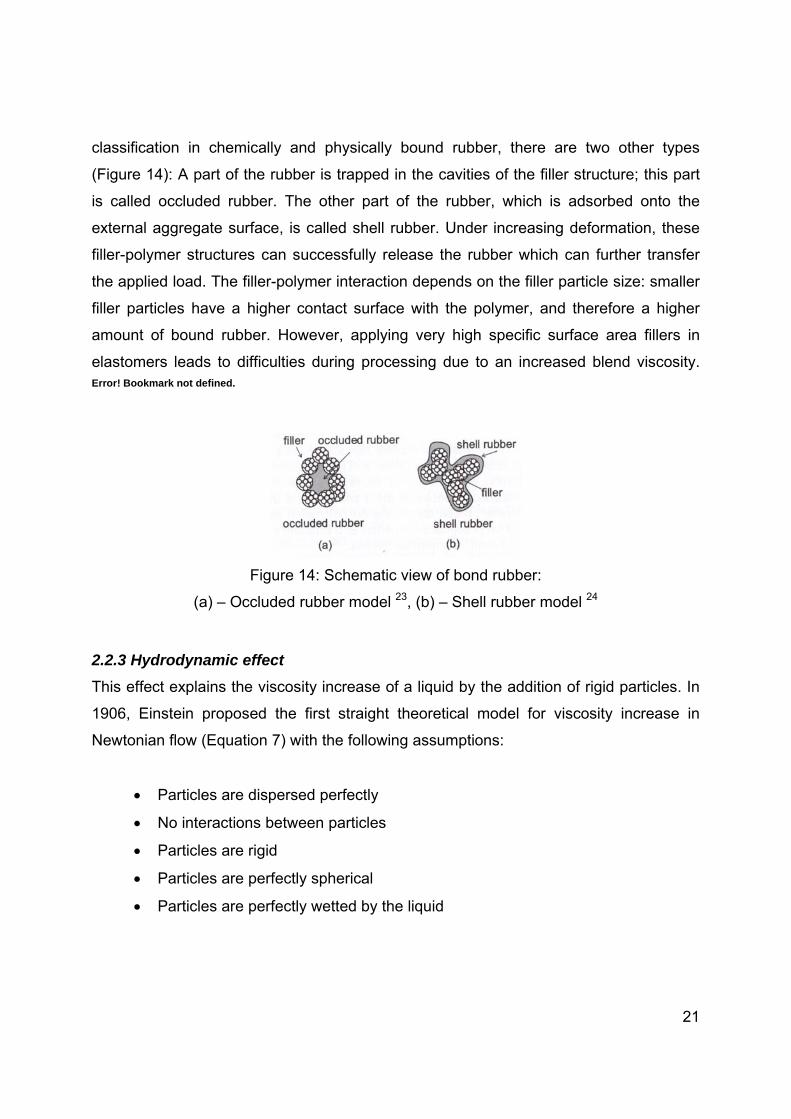
The crosslink density of the vulcanized rubber has a strong impact on the dynamic
properties of the material. Along with an increasing number of crosslinks in rubber, the
energy dissipation is decreasing, which can be easily noticed from the tangent δ –
crosslink density graph as shown in Figure 15.
Figure 15: Influence of crosslink density on the loss angle 23
Unfortunately, mechanical properties deteriorate when the crosslink density increases:
rubber starts to be more brittle and hard.
Another major factor that has a significant contribution on the rubber properties is the
type of the crosslink’s. Sulfidic crosslinks in rubber can be analyzed by the distribution of
polysulfidic, disulfidic and monosulfidic bonds. The crosslink distribution can be adjusted
by using different ratios of accelerator to sulfur. Three types of vulcanization systems are
to be distinguished 28:
TkE B 0

24
1. Conventional vulcanization (CV) with accelerator/sulfur ratio in range of 0.1-0.6:
In this system there is only approx. 5% of monosulfidic crosslinks
2. Semi-efficient vulcanization (S-EV) with accelerator/sulfur ratio in the range
of 0.7-2.5:
In this system there is approx. 50% of monosulfidic crosslinks
3. Efficient vulcanization (EV) with accelerator/sulfur ratio in range 2.5-12:
In this system, the content of monosulfidic crosslinks is increased to 80%
Rubber with a high content of monosulfidic crosslink’s is less elastic, but the energy
dissipation is also lower, which makes this type of crosslinks preferable for low rolling
resistance tire tread material. Unfortunately, rubber which has a high elastic modulus is
not desirable during wet skid, because less deformation means less grip. As a
consequence, semi-efficient vulcanization systems are chosen for tire tread material.
2.3 FILLERS
Except for natural rubber, which has the ability to strain-crystallize, other types of rubber
in most of the cases can not be used in pure form and need to be reinforced by fillers.
2.3.1 Conventional fillers
Fillers can be classified according to their reinforcing capabilities in reinforcing,
semi-reinforcing and non-reinforcing fillers, though the differences between these
classes cannot be sharply defined. A general rule is that the smaller the primary
particles are and the higher the aspect ratio of the aggregates, the greater the
reinforcing power of the filler. The term ‘reinforcing’ means ameliorating the mechanical
properties such as modulus, tensile strength, abrasion and tear strength. In the case of
elastomers, using reinforcing fillers leads simultaneously to an increase of the modulus
and strain at break. This phenomenon is not fully understood but explains the ability of
reinforced elastomers to provide distinctive material properties and justify their success

25
in different branches of the industry, especially in the tire industry where specific material
properties are necessary 29.
2.3.1.1 Carbon black
Historically, the first filler used in the rubber industry on large scale was carbon black.
Applying reinforcing types of carbon in rubber increses the following properties: tensile
strength, elasticity modulus, wear resistance and hysteresis. However, increasing the
latter property is not desired for tire tread applications, especially as it increases rolling
resistance.
Because of the high dispersive component of the surface energy, dispersibility of carbon
black in nonpolar rubbers is high compared to silica. Silica is an amorphous material and
the silanol groups are randomly located on its surface. Conversely, the aggregates of
carbon black consist four different energetic sites (Figure 16):
I: graphitic planes (16 kJ/mol),
II: amorphous carbon (20 kJ/mol),
III: crystallite edges (25 kJ/mol), and
IV slit shaped cavities (30 kJ/mol) 30.
Therefore distribution of functional groups on carbon black and silica are also different.
In the case of carbon black, the functional groups are located only on the edges of the
graphitic basal planes of the crystallites as shown in Figure 16.
Figure 16: Different energetic sites on the carbon black surface 31 (left) and surface
morphology of a single particle (right) 32

26
For typical furnace carbon blacks like N220, the concentration of the functional groups
on the surface would be 1 - 2 COOH groups per nm2 or 2 - 4 OH groups per nm2, which
is much lower than for silica. For most types of precipitated silica’s used in the tire
industry, the concentration of silanol groups varies from 4 – 7 per nm2 33.
Differences between silica and carbon black are not limited only to surface chemistry
and energy. The morphology of the particles of these two fillers have a strong impact on
the overall vulcanizate properties. Aggregates of carbon black are smaller than
aggregates of precipitated silica, probably because of lower interactions between
particles. Less aggregation means also a smaller surface to interact with.
Comparing the temperature dependence of tan δ of carbon black and silica (without
coupling agent) filled rubber compounds as illustrated in Figure 17, the difference
between these two fillers is easily noticeable. The hysteresis of a carbon black
reinforced material in the rubbery state is still higher than the hysteresis of silica filled
compounds. This is mainly due to energy dissipation during repeated destruction and
reconstruction of the filler network. However, along with increasing temperature, the
hysteresis becomes lower, just like in the case of polymer in the absence of fillers. This
is caused by relatively easy thermal destruction of the carbon black filler network.
Conversely, it is interesting to notice that the hysteresis of silica filled rubber increases
with increasing temperature. This behavior can be explained by weakening of the filler-
filler hydrogen bonding interactions and by increasing part of filler network that can be
broken and reformed.
Figure 17: Temperature dependence of tan δ for vulcanizates filled with carbon black
and silica without coupling agent 34

27
Applying a silane coupling agent that changes the surface properties of silica leads to a
drastic change of the dynamic properties. Strong polymer-filler interactions induced by
the coupling agent shifts the loss angle – temperature curve of silica filled rubber
towards the one of gum rubber.
The surface of carbon black can be also chemically modified. However, this modification
does not increase dynamic properties as distinctively as it does in the case of silica.
2.3.1.2 Silica production
Depending on the production method, two types of silica can be distinguished:
precipitated and fumed (pyrogenic) silica. Precipitated silica is produced by the
controlled neutralization of diluted sodium silicate (waterglass) by sulfuric, hydrochloric
or carbonic acid. The starting materials are sand and soda ash or caustic soda. The
silicate can be produced in a furnace or digester reactor. Dilution with water provides
relatively low silicate concentrations, which together with moderate acidification rates
produces precipitated particles rather than gels, but a minor amount of gel is usually
present. The reaction temperature is the major determinant factor of the primary particle
size.
To obtain reinforcing silica, much care must be taken in formulating the
precipitation recipes to guarantee small rigid particles, and also in the drying conditions
to avoid agglomeration and maintain high dispersibility. The temperature at which
neutralization is conducted correlates with the size of the silica particles; low
temperatures for instance produce small particles. A slow rate of neutralization reduces
gel formation, while high silicate and acid concentrations produce more gel 29,35.
2.3.1.2.1 Silica surface characteristics
The surface of silica is covered with silanol groups which are highly reactive. There are
three types of silanol groups as shown in Figure 18.
Isolated (free) silanol groups, where the surface silicon atom has three bonds into
the bulk structure and the fourth to a hydroxyl group.
28
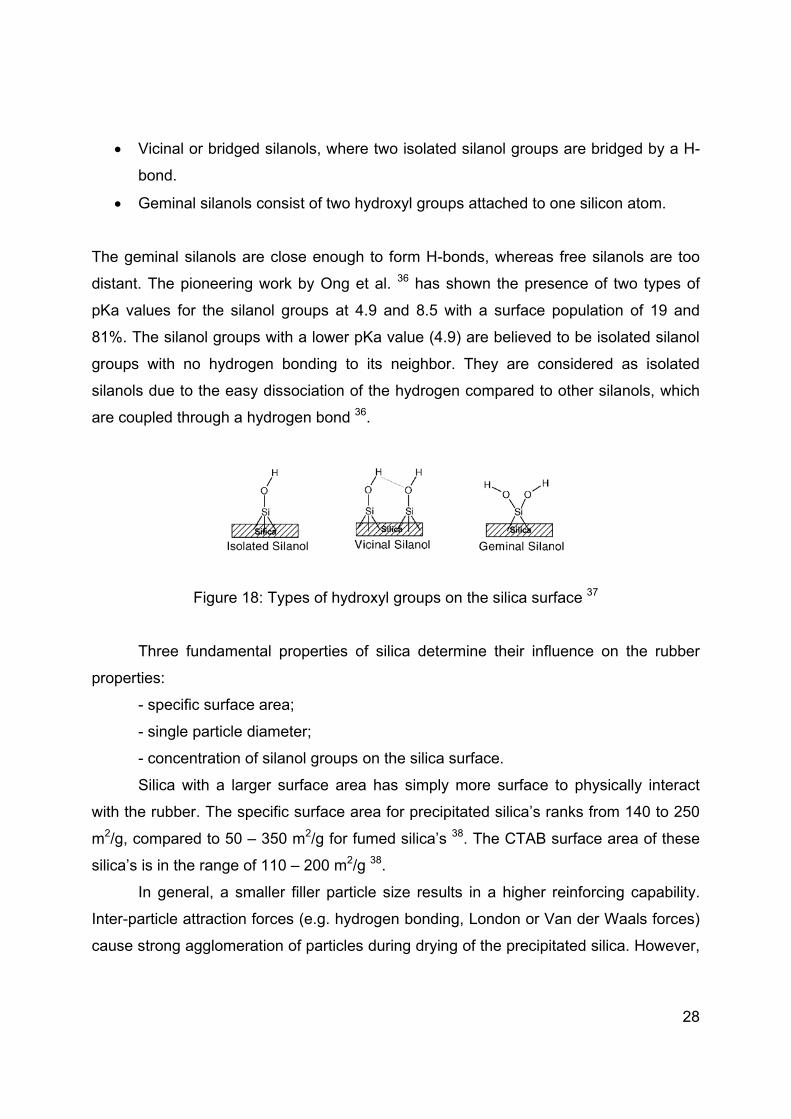
Vicinal or bridged silanols, where two isolated silanol groups are bridged by a H-
bond.
Geminal silanols consist of two hydroxyl groups attached to one silicon atom.
The geminal silanols are close enough to form H-bonds, whereas free silanols are too
distant. The pioneering work by Ong et al. 36 has shown the presence of two types of
pKa values for the silanol groups at 4.9 and 8.5 with a surface population of 19 and
81%. The silanol groups with a lower pKa value (4.9) are believed to be isolated silanol
groups with no hydrogen bonding to its neighbor. They are considered as isolated
silanols due to the easy dissociation of the hydrogen compared to other silanols, which
are coupled through a hydrogen bond 36.
Figure 18: Types of hydroxyl groups on the silica surface 37
Three fundamental properties of silica determine their influence on the rubber
properties:
- specific surface area;
- single particle diameter;
- concentration of silanol groups on the silica surface.
Silica with a larger surface area has simply more surface to physically interact
with the rubber. The specific surface area for precipitated silica’s ranks from 140 to 250
m2/g, compared to 50 – 350 m2/g for fumed silica’s 38. The CTAB surface area of these
silica’s is in the range of 110 – 200 m2/g 38.
In general, a smaller filler particle size results in a higher reinforcing capability.
Inter-particle attraction forces (e.g. hydrogen bonding, London or Van der Waals forces)
cause strong agglomeration of particles during drying of the precipitated silica. However,
29
when high shear forces are applied, the agglomerates break to form the reinforcing
species: aggregates. It must be stated that single colloidal particles with average
dimensions of 10 to 30 nm have no reinforcing capability (aspect ratio ~1). The
aggregate morphology determines the influence of the filler on the properties of rubber.
Typical dimensions of aggregates are ranging from 100 to 200 nm 38, 39, 40.
The concentration of the silanol groups on the silica surface plays an important
role during the silanisation process. Silanol groups act as reaction centers for a silane
coupling agent which finally results in covalent bonds between filler and polymer. The
estimated number of silanol groups accessible on the porous silica surface is between 4
and 8 Si-OH groups per nm2 37, 41. Because of the nature of the production process,
especially the high temperatures, fumed silica’s have a lower number of silanol groups.
Additionally, the local density of silanol groups in both cases varies from place to place 36, 39.
2.3.1.3 Surface energy
The compatibility and interaction of two physico-chemically different materials like
polymer and filler can be characterized by the surface energy. The surface energy of a
material, γs, is defined as the energy necessary to create one unit of new surface. This
energy is comprised of different types of cohesive forces, such as dispersive, dipole-
dipole, induced dipole-dipole, acid-base and hydrogen bonds 42. Therefore surface
energy can be expressed as the sum of all these components. However, for most
substances the surface energy is described as the sum of two components: the
dispersive γd and specific γsp energy (Equation 12).
spS
dSS Equation 12
The dispersive component γSd indicates the ability of filler adhesion to organic
matrices (such as a polymer), while the specific or polar component γSsp indicates filler-
filler interactions. To obtain a good filler dispersion in a polymer, the specific component
should be as low as possible to limit formation of a filler network. Practically this can be
realized by two different ways:
30
(1) Proper selection of the filler, for example carbon black, silica or dual
phase fillers;
(2) Change of the surface properties of the filler 41.
For non-silanised silica, the specific component is relatively high compared to
carbon black, due to the highly polar nature of the silica surface 37. The polar and
dispersive component of some carbon black types and silica are summarized in Table 1.
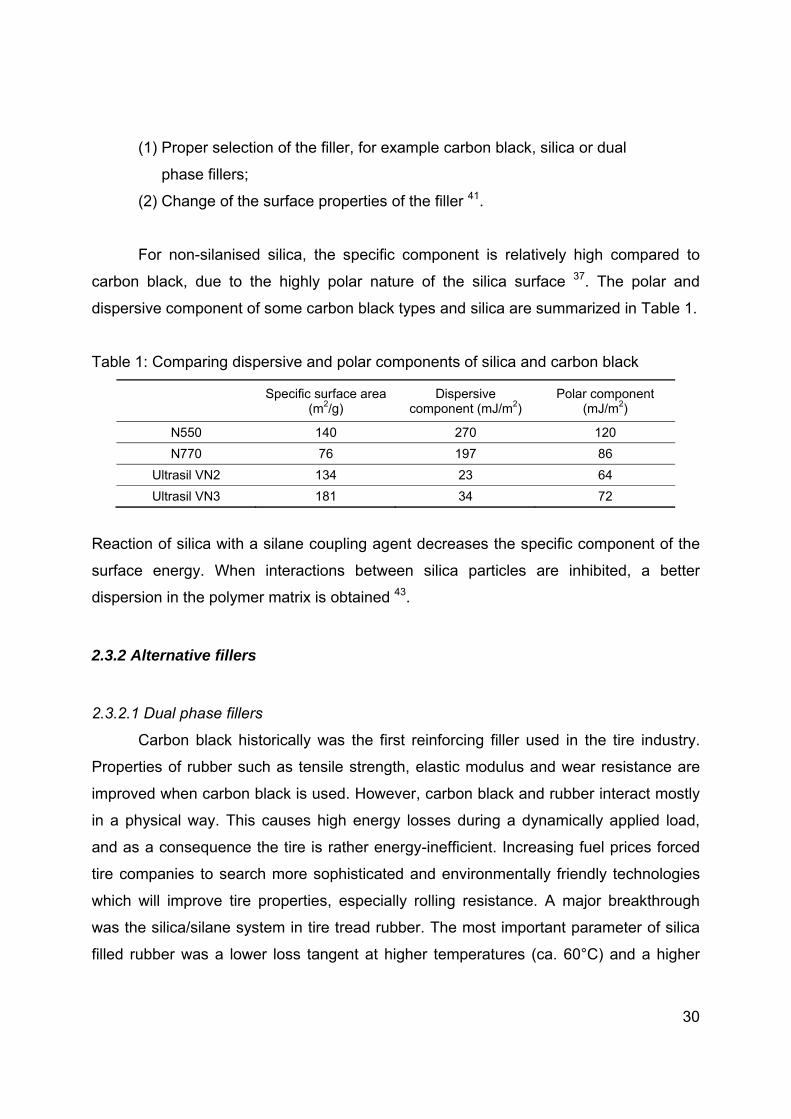
Table 1: Comparing dispersive and polar components of silica and carbon black
Specific surface area (m2/g)
Dispersive component (mJ/m2)
Polar component (mJ/m2)
N550 140 270 120
N770 76 197 86
Ultrasil VN2 134 23 64
Ultrasil VN3 181 34 72
Reaction of silica with a silane coupling agent decreases the specific component of the
surface energy. When interactions between silica particles are inhibited, a better
dispersion in the polymer matrix is obtained 43.
2.3.2 Alternative fillers
2.3.2.1 Dual phase fillers
Carbon black historically was the first reinforcing filler used in the tire industry.
Properties of rubber such as tensile strength, elastic modulus and wear resistance are
improved when carbon black is used. However, carbon black and rubber interact mostly
in a physical way. This causes high energy losses during a dynamically applied load,
and as a consequence the tire is rather energy-inefficient. Increasing fuel prices forced
tire companies to search more sophisticated and environmentally friendly technologies
which will improve tire properties, especially rolling resistance. A major breakthrough
was the silica/silane system in tire tread rubber. The most important parameter of silica
filled rubber was a lower loss tangent at higher temperatures (ca. 60°C) and a higher

31
loss tangent in lower temperatures (ca. 0°C). Such a correlation of the loss tangent with
temperature gives both, low rolling resistance and high skid resistance. But wear
resistance of silica filled rubber is lower compared to carbon black. This brings up an
obvious question: is it possible to combine the advantages of both fillers in one filler
material?
Carbon-silica dual phase fillers are a partial answer to this question. Carbon-silica
dual phase fillers can be characterized as carbon black having a surface modification of
a thin layer of silica. The modification of carbon black particles can be realized by
precipitation of silica from solution onto dispersed carbon black 44 or by a co-fuming
process 45 with gives better effects than the previous method. Depending on the
production process, there are two types of commercialized carbon-silica dual phase
fillers which differ in silica content and distribution, as shown in Figure 19. When a
silicon containing compound is introduced simultaneously with a carbon containing
compound into the precipitation process, the silica phase is distributed throughout the
particle. If the silicon containing compound is introduced behind the zone of carbon
black formation but before quenching, the silica layer is present mostly on the surface of
the carbon black aggregate 45.
Figure 19: General views of silica-carbon black dual phase fillers with silica throughout
the particle (top) and silica on the surface (bottom) 46.
In carbon silica dual phase fillers, the filler-filler interactions are substantially
reduced due to the carbon content in the surface, and the polymer-filler interactions are
32
improved by preserving the high dispersive component of the surface energy, which
originates from carbon domains. Covering the surface of carbon black by a silica layer
makes silanization useful. The carbon silica dual phase filler demands less than half of
the silane coupling agent loading that is typically used for silica-based passenger tread
compounds. Consequently, the tradeoff between rolling resistance and wear resistance
is greatly improved, significantly enhancing one without sacrificing another 46.
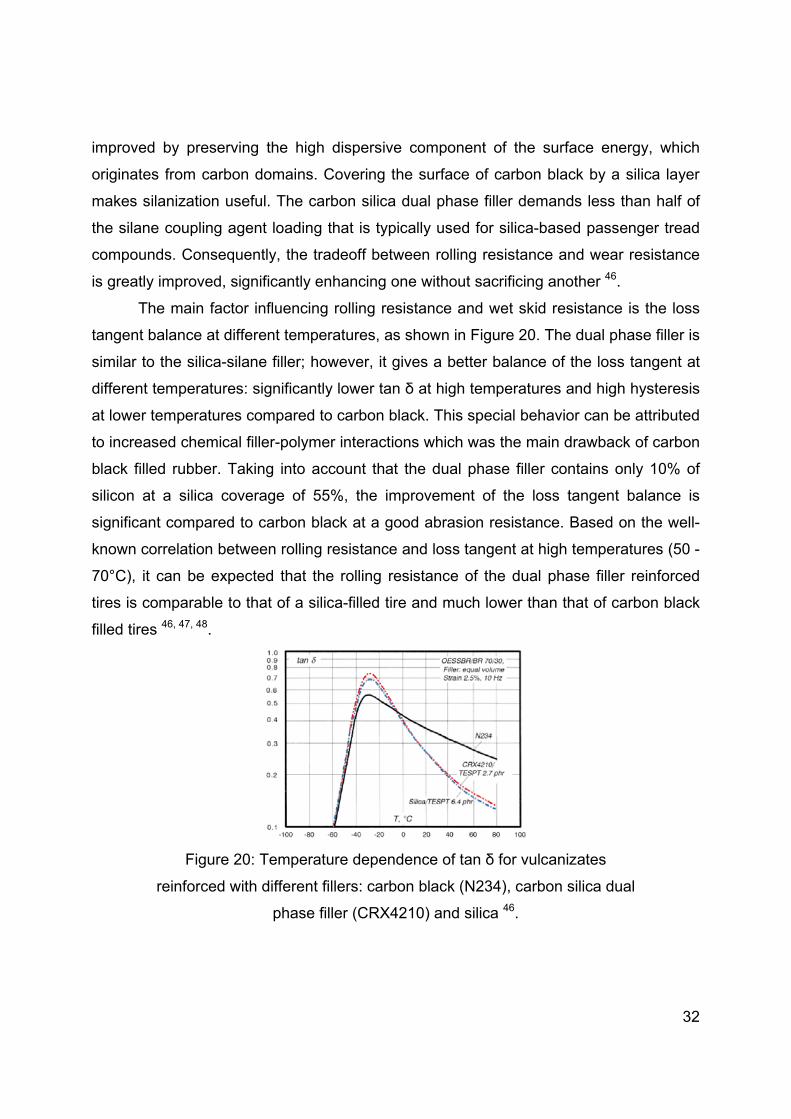
The main factor influencing rolling resistance and wet skid resistance is the loss
tangent balance at different temperatures, as shown in Figure 20. The dual phase filler is
similar to the silica-silane filler; however, it gives a better balance of the loss tangent at
different temperatures: significantly lower tan δ at high temperatures and high hysteresis
at lower temperatures compared to carbon black. This special behavior can be attributed
to increased chemical filler-polymer interactions which was the main drawback of carbon
black filled rubber. Taking into account that the dual phase filler contains only 10% of
silicon at a silica coverage of 55%, the improvement of the loss tangent balance is
significant compared to carbon black at a good abrasion resistance. Based on the well-
known correlation between rolling resistance and loss tangent at high temperatures (50 -
70°C), it can be expected that the rolling resistance of the dual phase filler reinforced
tires is comparable to that of a silica-filled tire and much lower than that of carbon black
filled tires 46, 47, 48.
Figure 20: Temperature dependence of tan δ for vulcanizates
reinforced with different fillers: carbon black (N234), carbon silica dual
phase filler (CRX4210) and silica 46.
33
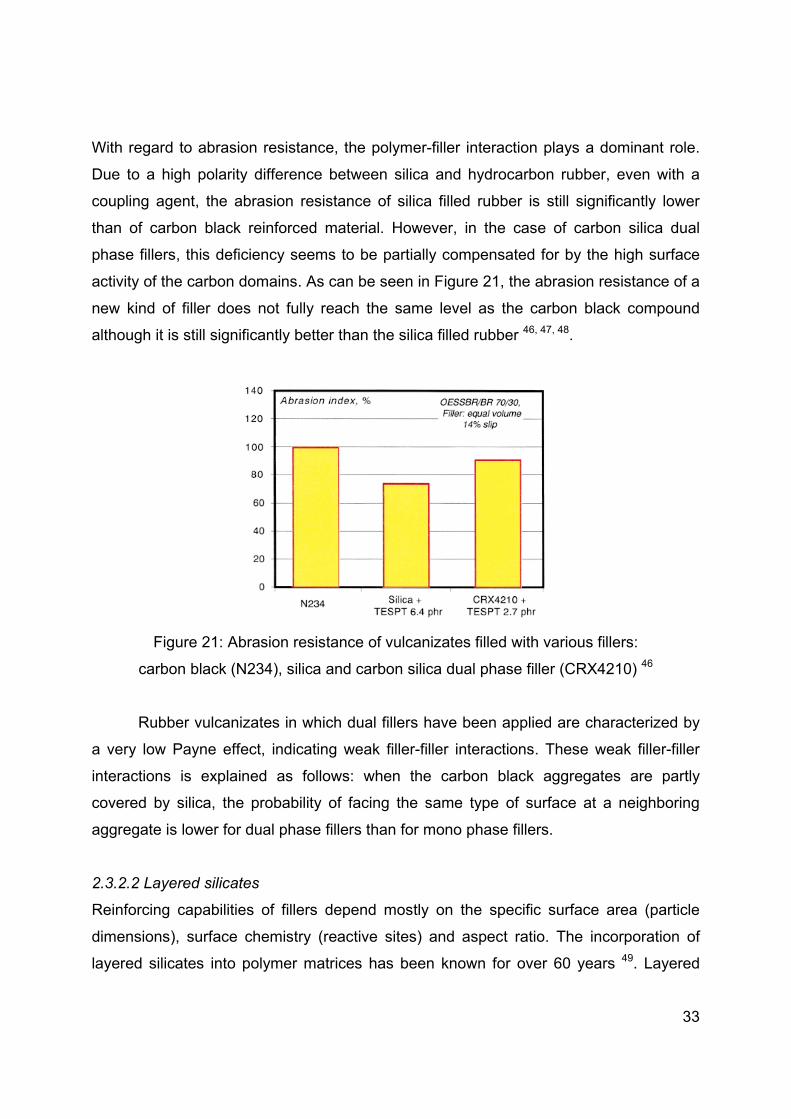
With regard to abrasion resistance, the polymer-filler interaction plays a dominant role.
Due to a high polarity difference between silica and hydrocarbon rubber, even with a
coupling agent, the abrasion resistance of silica filled rubber is still significantly lower
than of carbon black reinforced material. However, in the case of carbon silica dual
phase fillers, this deficiency seems to be partially compensated for by the high surface
activity of the carbon domains. As can be seen in Figure 21, the abrasion resistance of a
new kind of filler does not fully reach the same level as the carbon black compound
although it is still significantly better than the silica filled rubber 46, 47, 48.
Figure 21: Abrasion resistance of vulcanizates filled with various fillers:
carbon black (N234), silica and carbon silica dual phase filler (CRX4210) 46
Rubber vulcanizates in which dual fillers have been applied are characterized by
a very low Payne effect, indicating weak filler-filler interactions. These weak filler-filler
interactions is explained as follows: when the carbon black aggregates are partly
covered by silica, the probability of facing the same type of surface at a neighboring
aggregate is lower for dual phase fillers than for mono phase fillers.
2.3.2.2 Layered silicates
Reinforcing capabilities of fillers depend mostly on the specific surface area (particle
dimensions), surface chemistry (reactive sites) and aspect ratio. The incorporation of
layered silicates into polymer matrices has been known for over 60 years 49. Layered
34
silicates are a class of compounds that possesses a unique combination of particle
morphology (extraordinary high specific surface area in exfoliated state) and chemistry
(surface silanol groups). For instance, the specific surface area of exfoliated
montmorillonite is 700 – 760 m2/g. This filler is composed of individual clay sheets which
are only 1 nm thick, and display a perfect crystalline structure. However, the smaller the
reinforcing elements are, the larger is their specific surface and hence their tendency to
agglomerate rather than to disperse homogenously in the polymer matrix. Due to their
availability and relatively low price, layered alumo-silicate filled composites became
subject of many works in recent years 50, 51.
There are many types of layered silicates like: montmorillonite, hectorite, saponite,
fluoromica, fluorohectorite, vermiculite, kaolinite, and magadiite. Chemical formulas of
the three predominantly used layered silicates are depicted in Table 2.
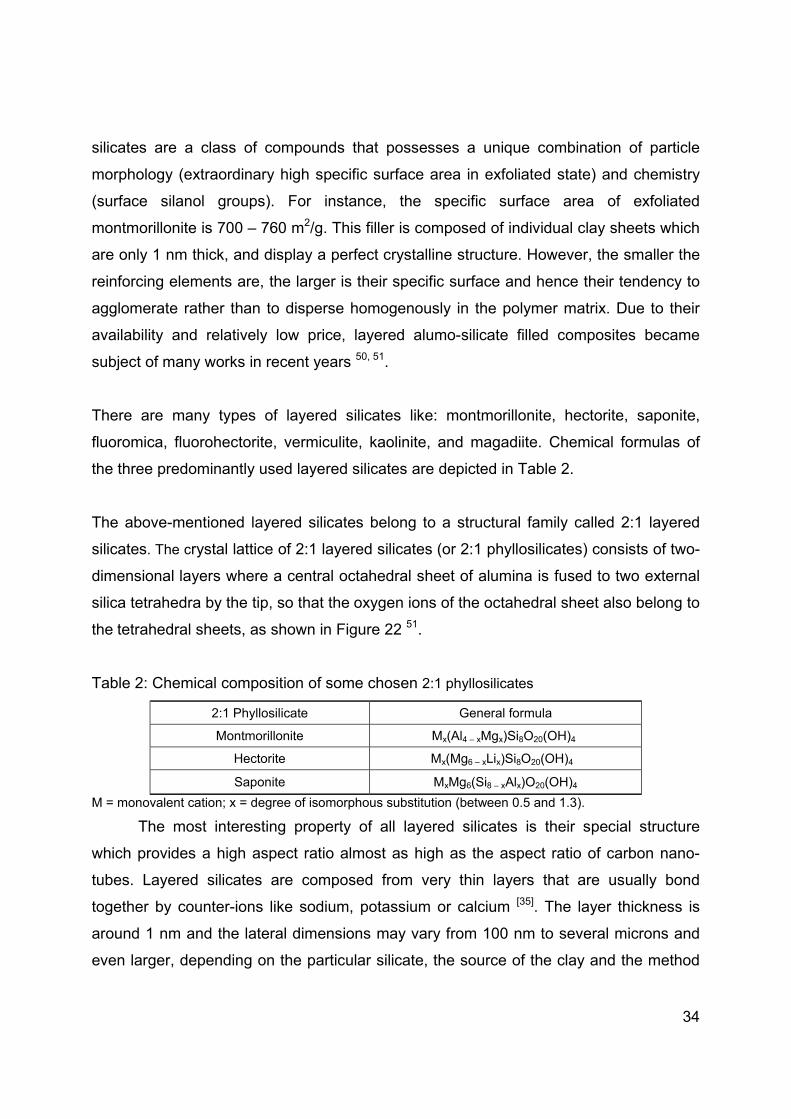
The above-mentioned layered silicates belong to a structural family called 2:1 layered
silicates. The crystal lattice of 2:1 layered silicates (or 2:1 phyllosilicates) consists of two-
dimensional layers where a central octahedral sheet of alumina is fused to two external
silica tetrahedra by the tip, so that the oxygen ions of the octahedral sheet also belong to
the tetrahedral sheets, as shown in Figure 22 51.
Table 2: Chemical composition of some chosen 2:1 phyllosilicates
2:1 Phyllosilicate General formula
Montmorillonite Mx(Al4 – xMgx)Si8O20(OH)4
Hectorite Mx(Mg6 – xLix)Si8O20(OH)4
Saponite MxMg6(Si8 – xAlx)O20(OH)4
M = monovalent cation; x = degree of isomorphous substitution (between 0.5 and 1.3).
The most interesting property of all layered silicates is their special structure
which provides a high aspect ratio almost as high as the aspect ratio of carbon nano-
tubes. Layered silicates are composed from very thin layers that are usually bond
together by counter-ions like sodium, potassium or calcium [35]. The layer thickness is
around 1 nm and the lateral dimensions may vary from 100 nm to several microns and
even larger, depending on the particular silicate, the source of the clay and the method

35
of preparation. Clays prepared by milling typically have lateral platelet dimensions of
approximately 0.1–1.0 μm. Therefore, the aspect ratio of these layers, the ratio of length
to thickness, is particularly high with values of 500 – 1000. In case of montmorillonite,
the primary particle is composed from five to ten parallel layers with an overall thickness
of 7 – 12 nm 51, 52, 53.
Figure 22: Structure of 2:1 phyllosilicates.
Silicate layers organize themselves to form stacks with regular gaps in-between
them called interlayer or gallery. Usually the width of this gap is 0.3 nm. As the forces
that hold the stacks together are relatively weak, the intercalation of small molecules
between the layers is easy. The ion exchange capability of layered silicates is based on
a moderate negative surface charge known as the cation exchange capacity, CEC, and
expressed in meq/100 g. Only a small part of the charge balancing cations is located on
the external crystallite surface; the majority of these exchangeable cations are located
inside the galleries.
Changing clay into a reinforcing filler can be achieved through ion-exchange
reactions. The previously mentioned counter-ions that bond galleries together can
relatively easy be exchanged for organic ions. For this purpose, long chain
alkylammonium ions are mostly used, although other “onium” salts can also be used,
such as sulfonium and phosphonium. Using bulky “onium” salts results in a larger
interlayer spacing reaching distances of up to 2.9 nm 54. Figure 23 schematically
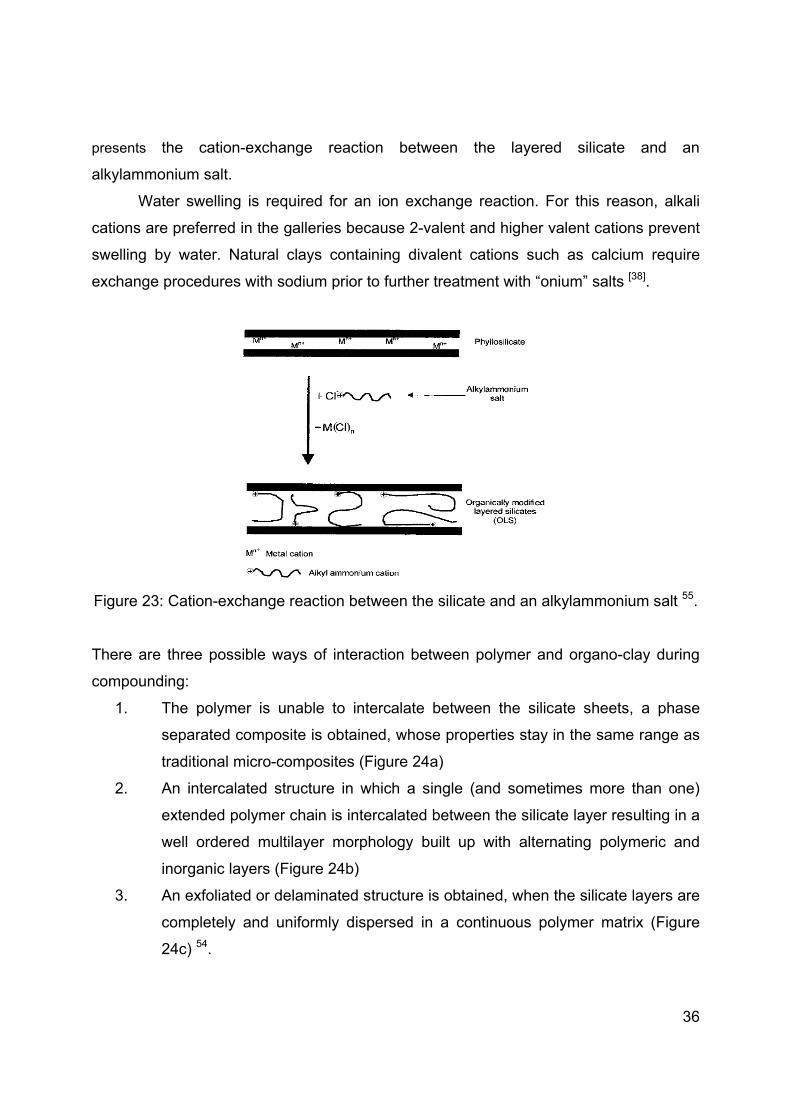
36
presents the cation-exchange reaction between the layered silicate and an
alkylammonium salt.
Water swelling is required for an ion exchange reaction. For this reason, alkali
cations are preferred in the galleries because 2-valent and higher valent cations prevent
swelling by water. Natural clays containing divalent cations such as calcium require
exchange procedures with sodium prior to further treatment with “onium” salts [38].
Figure 23: Cation-exchange reaction between the silicate and an alkylammonium salt 55.
There are three possible ways of interaction between polymer and organo-clay during
compounding:
1. The polymer is unable to intercalate between the silicate sheets, a phase
separated composite is obtained, whose properties stay in the same range as
traditional micro-composites (Figure 24a)
2. An intercalated structure in which a single (and sometimes more than one)
extended polymer chain is intercalated between the silicate layer resulting in a
well ordered multilayer morphology built up with alternating polymeric and
inorganic layers (Figure 24b)
3. An exfoliated or delaminated structure is obtained, when the silicate layers are
completely and uniformly dispersed in a continuous polymer matrix (Figure
24c) 54.

37
Figure 24: Three possible structures of layered silicate filled composites:
(a) conventional, (b) intercalated and (c) exfoliated composite 54.
Nevertheless, random exfoliation of organo-clays is not easy to obtain. In most of
the cases, composites reported in literature were found to have an intercalated or mixed
intercalated – exfoliated molecular structure. This is due to the fact that high anisotropic
filler layers (primary particles) can not be dispersed randomly in a polymer matrix even
when they are separated by large distances. In most cases, the mixed intercalated-
exfoliated structure is dominating in polymers 51. Techniques like solution blending, latex
compounding, melt intercalation and in-situ polymerization are used for obtaining a good
dispersion of organo-clays in a polymer 56, 57. Among these, only melt intercalation
seems to have some potential for practical application in the rubber industry. This
method is very cost effective, as existing compounding lines can be used, direct and
also environmentally friendly, as no organic solvent is used 57.
A lot of work has been done in clay nano-composites for many thermoplastics
and thermosetting polymers, but the studies on rubber – based nano-composites are
less frequent. Most rubber products containing organoclays are making use of the flame
retardancy. A small part of the articles focus on mechanical and dynamic properties of
this kind of rubber composites, and often they lack to show evidence of exfoliation or
even intercalation.

38
Direct mixing of organoclay with SBR in an internal mixer without using a
compatibilizer, e.g. a coupling agent or a polar polymer, leads to relatively good
mechanical properties. Mechanical and dynamic properties of organoclay filled rubber
vulcanizates exhibit much stronger dependence on filler fraction comparing to silica filled
composites. This means that a lower amount of filler is needed to obtain the same
reinforcing effect as with silica. However, in contrast to silica, the loss
tangent/temperature curve of organoclay filled SBR shows a small second peak in the
temperature range of 20 – 60°C. In this experiment, there was no direct evidence of
exfoliation or intercalation.
Recently, the incorporation of ion-exchanged clays (montmorillonite) is achieved
by applying the so-called compatibilizing polymers. For transferring organo-clay to SBR,
highly polar elastomers like carboxylated acrylonitryle butadiene rubber (XNBR) or
epoxidized natural rubber (ENR) are used. Exfoliation or intercalation of organo-clays is
carried out in polar rubbers using high temperatures (160°C) during mixing (XNBR) or
solution blending (ENR). This masterbatch was used for further compounding with SBR.
No silane coupling agent was used in these experiments 58, 59. The test results indicate
that mechanical properties as well as dynamic mechanical properties were improved.
Improvement of mechanical properties has been observed for low filler loadings of 5-10
phr, what indicates a very low percolation threshold for the organo-clays. Applying
organo-modified clay leads also to an increase of the glass transition temperature
compared to pure SBR, as shown in Figure 25. This increase can be attributed to partial
immobilization of polymer chains on silicate layers, stronger than in the case of typical
fillers 58.

39
Figure 25: Temperature influence on the loss tangent for
SBR/Montmorrillonite composites prepared from an ENR/MMT
masterbach, (–) SBR, (--) SBR+1.8 phr MMT, (-··-) SBR+3.7 phr MMT 58
The mechanism proposed by Fisher et al. 60 assumes that high aspect ratio fillers,
with at least one dimension in the nanometer range, can form in situ grafts by adsorbing
large amounts of polymer, which in turn are very effective in reducing the interfacial
tension and inducing compatibilization in highly immiscible blends 60. However,
according to Mousa 61, the reinforcement capabilities of organo-clay can also be
explained by encapsulation of filler particles by a highly crosslinked elastomer layer.
Increased crosslink density around filler particles is the effect of an acceleration of
crosslinking rate caused by amine functionalities entrapped in the silicate layers 61.
Noticeable is the second maximum at higher temperatures in most of the rubber
composites containing organoclays; this energy dissipation can be caused by sliding and
reorientation processes of the silicate platelets 53, 62. Furthermore, a second maximum
on the tangent δ curve indicates that intercalation or exfoliation of the layered silicate
was not sufficient. The above mentioned 2nd maximum appearing on the tangent δ curve
can be caused by the relaxation of the regular montmorillonite structure which was not
sufficiently intercalated.
Dynamic mechanical analysis revealed that ion-exchanged layered silicates may
also act as compatibilizers between two chemically different polymers, e.g. unpolar SBR
and highly polar XNBR. A vulcanizate containing SBR blended with 9 phr XNBR without

40
organo-clay (SB-15 in Fig. 27) was compared to a vulcanizate containing additionally 5.6
phr of organo-clay (SB-12 in Fig. 27). The latter shows a smaller storage modulus value
at room temperature indicating a low compatibility between these two different
elastomers. With increasing organo-clay content, the modulus at 300% is increasing
linearly, while the samples containing only SBR with XNBR without a filler have
corresponding values of elastic modulus which are very low (Figure 26) 59. According to
the authors of this article 59, this is a proof that the reinforcement effect indeed comes
from the organo-clay and not from XNBR.
Figure 26: Variation of the 300% modulus values with the organo-clay and XNBR
amount 59
Figure 27: Temperature dependence of G’ of the organo-clay filled rubber
composites 59.
41
The literature discussed above does not cover wet traction and wear resistance, which
are equally important as rolling resistance.
2.4 COUPLING AGENTS AND THEIR EFFECT ON RUBBER COMPOUND
PROPERTIES
2.4.1 The effect of coupling agents
Because of the high concentration of surface hydroxyl groups (high polarity), unmodified
silica does not create an appreciable interface connection with the non-polar rubber
polymer. The reinforcing capabilities of unmodified silica in a rubber matrix are rather
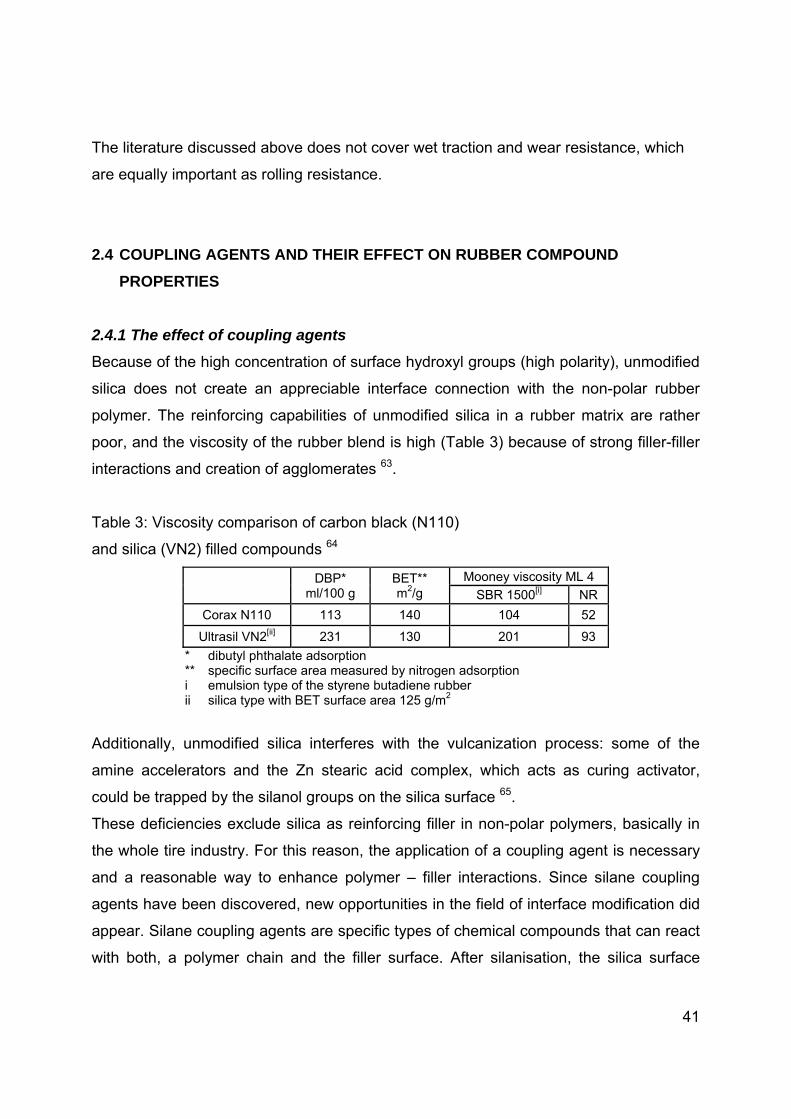
poor, and the viscosity of the rubber blend is high (Table 3) because of strong filler-filler
interactions and creation of agglomerates 63.
Table 3: Viscosity comparison of carbon black (N110)
and silica (VN2) filled compounds 64
DBP*
ml/100 g BET** m2/g
Mooney viscosity ML 4
SBR 1500[i] NR
Corax N110 113 140 104 52
Ultrasil VN2[ii] 231 130 201 93
* dibutyl phthalate adsorption ** specific surface area measured by nitrogen adsorption i emulsion type of the styrene butadiene rubber ii silica type with BET surface area 125 g/m2
Additionally, unmodified silica interferes with the vulcanization process: some of the
amine accelerators and the Zn stearic acid complex, which acts as curing activator,
could be trapped by the silanol groups on the silica surface 65.
These deficiencies exclude silica as reinforcing filler in non-polar polymers, basically in
the whole tire industry. For this reason, the application of a coupling agent is necessary
and a reasonable way to enhance polymer – filler interactions. Since silane coupling
agents have been discovered, new opportunities in the field of interface modification did
appear. Silane coupling agents are specific types of chemical compounds that can react
with both, a polymer chain and the filler surface. After silanisation, the silica surface
42
becomes hydrophobic and thus more compatible with the polymer. Strong filler – filler
interactions (hydrogen bonding) are partially replaced with strong filler – polymer
interactions which results in decreasing Mooney viscosities, which in turn has a large
effect on power consumption during mixing.
Applying of a silane coupling agent leads to:
decreasing rolling resistance
increasing wear resistance (higher abrasion resistance)
increasing tensile strength, modulus at 300% and elongation
The improvement of mechanical properties is caused by the strong covalent bond
between polymer chain and filler particle, which is not present in the case of carbon
black. Decreasing tire rolling resistance leads to lower fuel consumption, the well-known
green tire technology.
2.4.2 Silanisation process chemistry
Silane coupling agents have two types of reactive groups: the alkoxy groups capable to
react with silanol groups on the silica surface, and the sulfide groups that can react with
the polymer chain. The reaction mechanism between silica and the most widely used
silane coupling agent, bis (3-triethoxy silylpropyl) tetrasulphide TESPT, was investigated
using 13C and 29Si solid state NMR spectroscopy 66 and kinetic studies in decane as an
inert solvent 67. This resulted in a reaction model, which divides the silanization reaction
into a primary and a secondary reaction.
During the primary reaction shown in Figure 28, one ethoxy group of each silane reacts
with a silanol group on the silica surface and links chemically to the filler. Two possible
mechanisms are reported:
1. Direct reaction of silica silanol group with the ethoxy group of the coupling agent.
2. Fast preliminary hydrolysis of the ethoxy group (with formation of ethanol)
followed by a condensation reaction of partially hydrolyzed silane with silanol
groups on the silica surface releasing a second portion of water needed for the
hydrolysis step.

43
Partial hydrolysis of the silane will probably occur in the outer sphere of the silica surface
due to its high concentration of adsorbed water. It must be stated that a clear distinction
between the hydrolysis step of the silane and the following condensation step is not
possible yet. However, the influence of adsorbed water on the silica surface is very
clear. The amount of ethanol generated in the rubber blend increases with increasing
moisture content of the silica, but at a moisture content higher than 7% no further
acceleration is observed 68.
Figure 28: Primary silanisation reactions 27
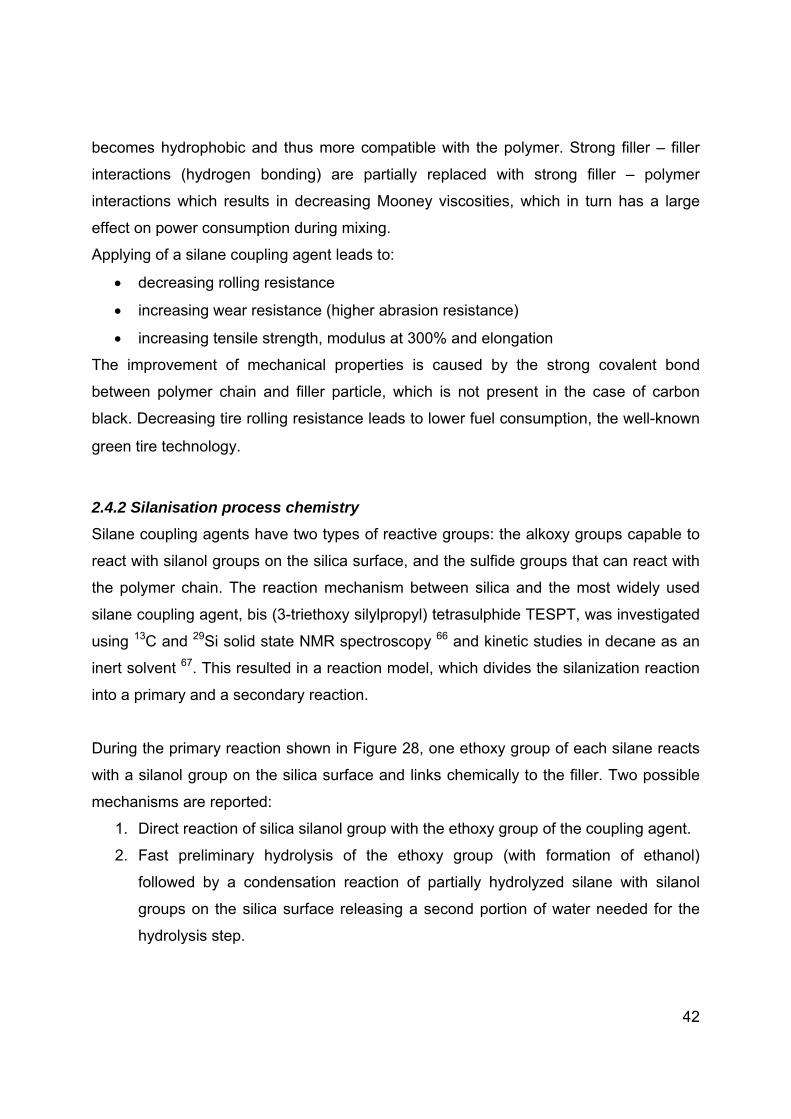
The amount of silane used during silanisation influences the reaction rate of the primary
reaction as well. With increasing silane dosage in a rubber blend from 4 to 12 phr, the
reaction rate decreases (Figure 29) due to a competition of the silane molecules with the
accessible silanol groups on the silica surface. In addition, the TESPT reaction with
silanol groups reduces their concentration, and the remaining groups become less
accessible to the rubber chains because of the TESPT polylayer 68, 69.
44
Figure 29: Ethanol evolution in different TESPT concentrations at 140°C 70
The rate of hydrolysis and also the primary reaction rate is in great part predisposed by
the type of the hydrolysable group of the silane. The influence of the hydrolysable group
on the silane coupling activity was determined by the comparison of methoxy, ethoxy
and propoxy derivatives. The reactivity decreases in the following order:
CH3O- > C2H5O- > C3H7O- > C4H9O- etc.
With the propoxy group, the reaction rate is generally too slow. Although the methoxy
group reacts very rapidly, for toxicological reasons it is not used as a silanising agent –
at least for the in situ process – because it evolves methanol. This leaves the ethoxy
group, which reacts quickly enough and which is toxicologically sufficiently harmless if
necessary precautions are taken 71.
Measuring of the amount of ethanol evolved from a rubber blend during silanisation is
the base of the estimation of the silanisation efficiency. Experiments show that the
amount of ethanol evolved rises with increased dump temperature. Effective bonding of
silane to the silica surface requires evaporation of 2 mol ethanol per 1 mol of TESPT.
However, at 150 °C only less then half of the TESPT reacted with silica surface. From
the viewpoint of silica/silane reaction time it is necessary to use the highest dump
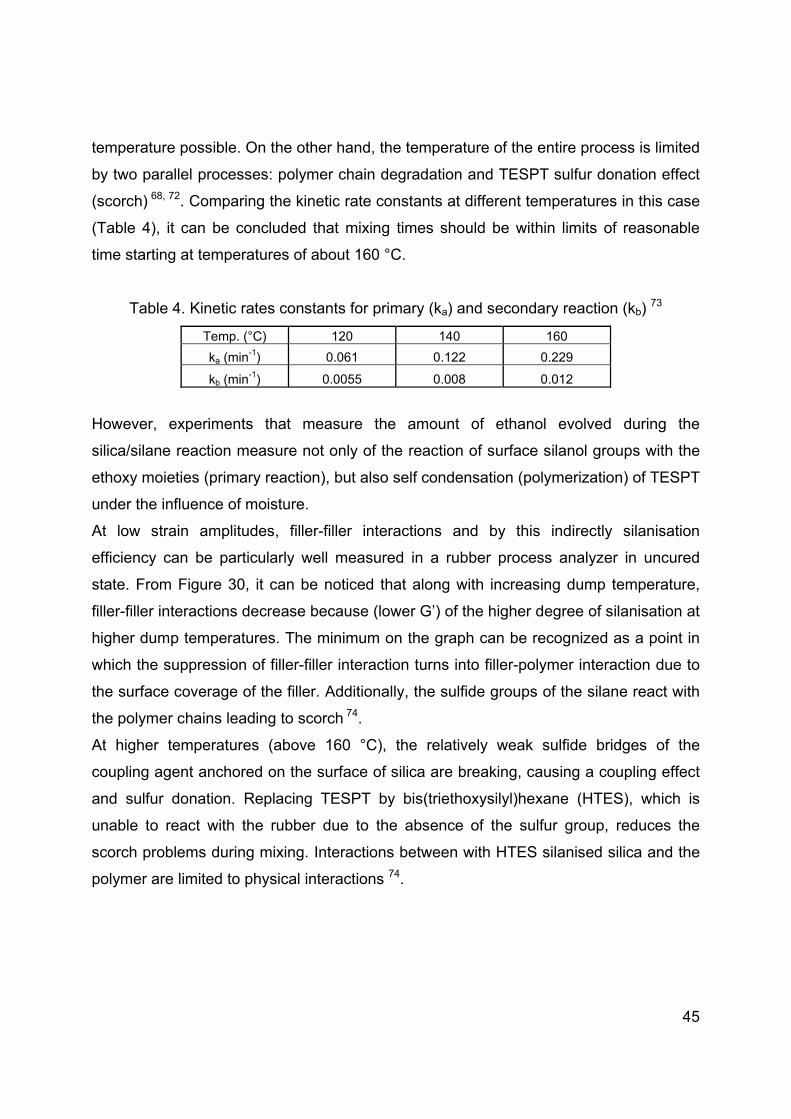
45
temperature possible. On the other hand, the temperature of the entire process is limited
by two parallel processes: polymer chain degradation and TESPT sulfur donation effect
(scorch) 68, 72. Comparing the kinetic rate constants at different temperatures in this case
(Table 4), it can be concluded that mixing times should be within limits of reasonable
time starting at temperatures of about 160 °C.
Table 4. Kinetic rates constants for primary (ka) and secondary reaction (kb) 73
Temp. (°C) 120 140 160
ka (min-1) 0.061 0.122 0.229
kb (min-1) 0.0055 0.008 0.012
However, experiments that measure the amount of ethanol evolved during the
silica/silane reaction measure not only of the reaction of surface silanol groups with the
ethoxy moieties (primary reaction), but also self condensation (polymerization) of TESPT
under the influence of moisture.
At low strain amplitudes, filler-filler interactions and by this indirectly silanisation
efficiency can be particularly well measured in a rubber process analyzer in uncured
state. From Figure 30, it can be noticed that along with increasing dump temperature,
filler-filler interactions decrease because (lower G’) of the higher degree of silanisation at
higher dump temperatures. The minimum on the graph can be recognized as a point in
which the suppression of filler-filler interaction turns into filler-polymer interaction due to
the surface coverage of the filler. Additionally, the sulfide groups of the silane react with
the polymer chains leading to scorch 74.
At higher temperatures (above 160 °C), the relatively weak sulfide bridges of the
coupling agent anchored on the surface of silica are breaking, causing a coupling effect
and sulfur donation. Replacing TESPT by bis(triethoxysilyl)hexane (HTES), which is
unable to react with the rubber due to the absence of the sulfur group, reduces the
scorch problems during mixing. Interactions between with HTES silanised silica and the
polymer are limited to physical interactions 74.

46
Figure 30: Influence of dump temperature on loss modulus for TESPT (�) and HTES (■)
The secondary reaction (Figure 31) is a condensation reaction with further evolution of
ethanol between unreacted, adjacent ethoxy groups of the coupling agent on the filler
surface or between ethoxy groups of the coupling agent and the silanol groups of the
silica in cases when there is no sterical hindrance. In contrast to the primary reaction,
this reaction is approximately 20 times slower at 120 °C and 10 times slower at 160 °C 73. The rates of both reactions are influenced by the acidity of the matrix, and the
reaction is acid as well as alkaline catalyzed 27. The secondary reaction requires
moisture for the hydrolysis before the actual condensation reaction can take place. Two
mols of ethanol are released for each siloxane bond formed. The extent to which the
secondary reaction takes place has only slight influence on the in-rubber properties 68.
Figure 31: Secondary silanisation reactions. 27

47
2.4.3 Silica – rubber coupling mechanism
In silica reinforcement systems containing TESPT, Wolff 29 has suggested that the
TESPT-silica intermediate reacts with mercaptobenzothiazyl disulfide (MBTS) to form
two moles of a polysulfide intermediate, see Figure 32. This polysulfidic pendant group
on the silica surface will undergo crosslinking with the polymer chain in much the same
way as it occurs in curing intermediates that converts to crosslinks. Wolff suggested that
the MBT entity reacts with the allyl position of a double bond of the elastomer, thus
releasing MBT (Figure 32). A covalent bond between the rubber and filler was assumed
to be formed by this reaction resulting in permanently connecting rubber and filler 29.
This reaction takes place under normal curing conditions.
Figure 32: Possible silica-silane intermediate reaction with a rubber chain during
accelerated vulcanization. 29
2.4.4 New silanes
For sulfur cured rubber compounds, the three following types of sulfur functional silanes
are used:
di- or polysulfidic bifunctional silanes
unblocked silanes with a reactive S-moiety
blocked mercaptosilanes

48
Bis-(triethoxysilylpropyl)tetrasulfide, TESPT, is shown in Figure 33. It is a widely used
coupling agent in the tire industry because it provides a good coupling. TESPT is not a
pure tetrasulfide, it is a mix of polysulfides, and the average sulfur rank of the polysulfide
is 3.86. In combination with accelerators like tetramethylthiuramdisulphide (TMTD) and
N-cyclohexyl-2-benzothiazolesulpheneamide (CBS) but without sulfur, TESPT causes
crosslinking.
TESPT requires a minimum temperature to become active during silanisation because
of the steric hindrance around the silylpropyl group, but at the same time the
temperature must not exceed a maximum above which premature crosslinking occurs
which is the main drawback of TESPT 75.
Figure 33: Bis(triethoxysilylpropyl)tetrasulfide (TESPT).
To overcome the problems with sulfur donation during processing, an alternative silane
was introduced: bis(triethoxysilylpropyl)disulfide, TESPD, Figure 34. TESPD is again not
a pure disulfide but a mixture of polysulfides. The average sulfur rank is close to 2. The
major advantage of TESPD is a higher stability under high shear and temperature
conditions. However, due to its sulfur deficiency compared to TESPT, additional
elemental sulfur is required to achieve a comparable reinforcement effect of TESPT.
Si
EtO
EtO
EtO
(CH2)3 S2 (CH2)3 Si
OEt
OEt
OEt
Figure 34: Bis(triethoxysilylpropyl)disulfide (TESPD).
The sulfur donation effect of the silane is one problem, but the high amount of generated
ethanol during the silanisation reaction is another. To overcome this particular problem,
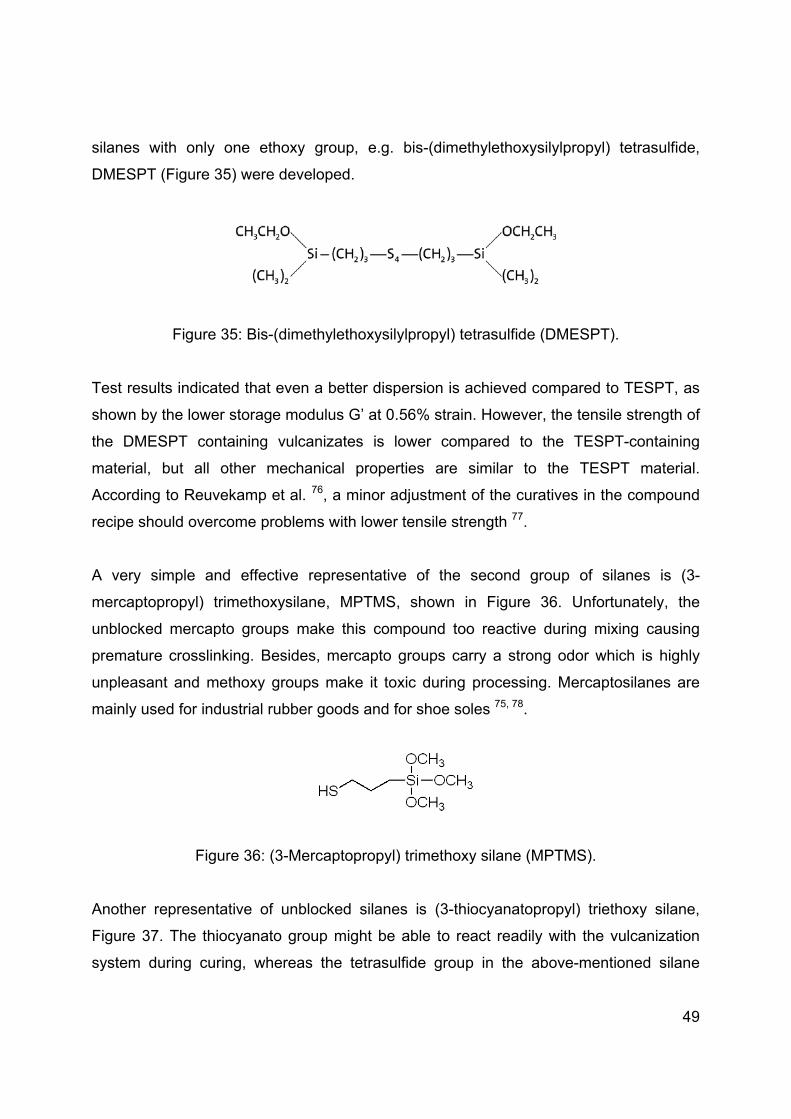
49
silanes with only one ethoxy group, e.g. bis-(dimethylethoxysilylpropyl) tetrasulfide,
DMESPT (Figure 35) were developed.
Figure 35: Bis-(dimethylethoxysilylpropyl) tetrasulfide (DMESPT).
Test results indicated that even a better dispersion is achieved compared to TESPT, as
shown by the lower storage modulus G’ at 0.56% strain. However, the tensile strength of
the DMESPT containing vulcanizates is lower compared to the TESPT-containing
material, but all other mechanical properties are similar to the TESPT material.
According to Reuvekamp et al. 76, a minor adjustment of the curatives in the compound
recipe should overcome problems with lower tensile strength 77.
A very simple and effective representative of the second group of silanes is (3-
mercaptopropyl) trimethoxysilane, MPTMS, shown in Figure 36. Unfortunately, the
unblocked mercapto groups make this compound too reactive during mixing causing
premature crosslinking. Besides, mercapto groups carry a strong odor which is highly
unpleasant and methoxy groups make it toxic during processing. Mercaptosilanes are
mainly used for industrial rubber goods and for shoe soles 75, 78.
Figure 36: (3-Mercaptopropyl) trimethoxy silane (MPTMS).
Another representative of unblocked silanes is (3-thiocyanatopropyl) triethoxy silane,
Figure 37. The thiocyanato group might be able to react readily with the vulcanization
system during curing, whereas the tetrasulfide group in the above-mentioned silane
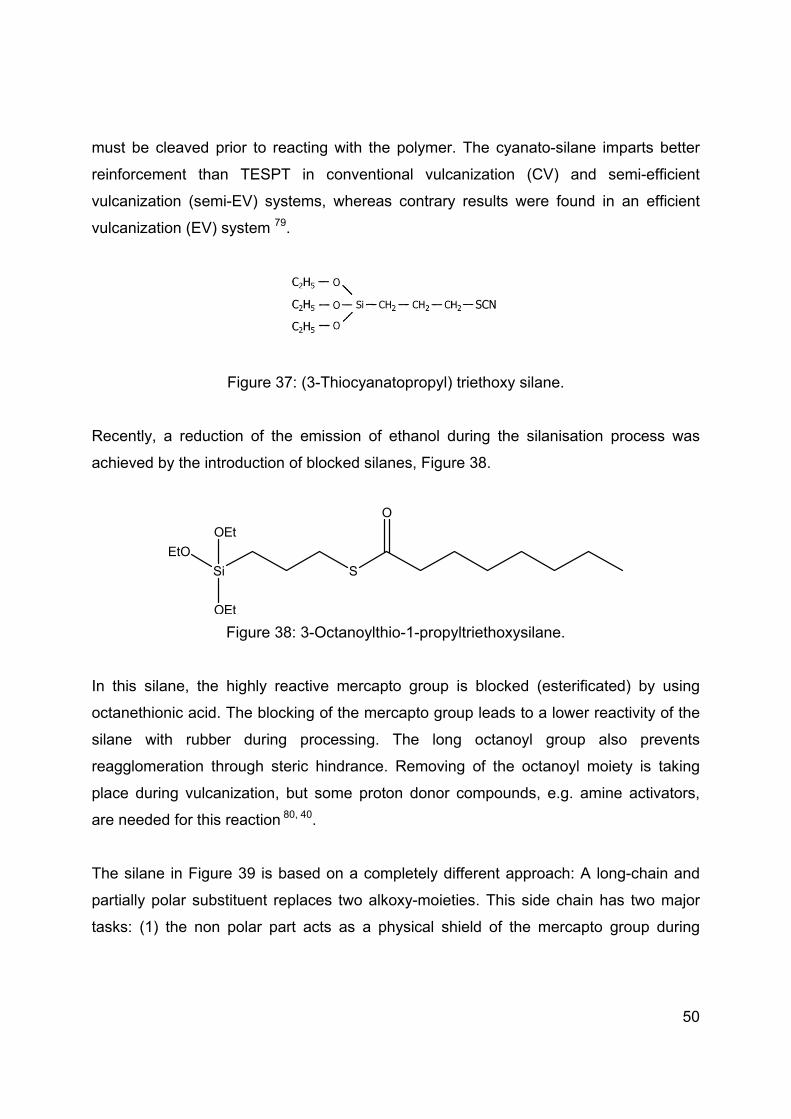
50
must be cleaved prior to reacting with the polymer. The cyanato-silane imparts better
reinforcement than TESPT in conventional vulcanization (CV) and semi-efficient
vulcanization (semi-EV) systems, whereas contrary results were found in an efficient
vulcanization (EV) system 79.
Figure 37: (3-Thiocyanatopropyl) triethoxy silane.
Recently, a reduction of the emission of ethanol during the silanisation process was
achieved by the introduction of blocked silanes, Figure 38.
Si S
O
EtO
OEt
OEt
Figure 38: 3-Octanoylthio-1-propyltriethoxysilane.
In this silane, the highly reactive mercapto group is blocked (esterificated) by using
octanethionic acid. The blocking of the mercapto group leads to a lower reactivity of the
silane with rubber during processing. The long octanoyl group also prevents
reagglomeration through steric hindrance. Removing of the octanoyl moiety is taking
place during vulcanization, but some proton donor compounds, e.g. amine activators,
are needed for this reaction 80, 40.
The silane in Figure 39 is based on a completely different approach: A long-chain and
partially polar substituent replaces two alkoxy-moieties. This side chain has two major
tasks: (1) the non polar part acts as a physical shield of the mercapto group during
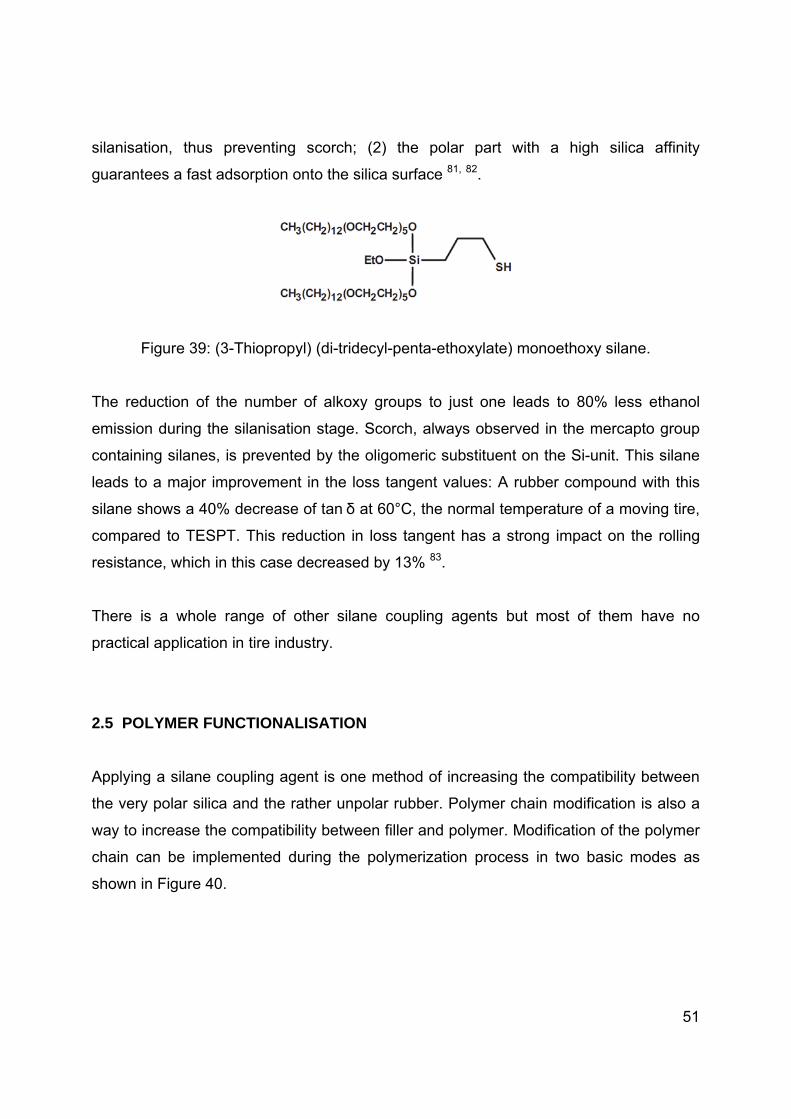
51
silanisation, thus preventing scorch; (2) the polar part with a high silica affinity
guarantees a fast adsorption onto the silica surface 81, 82.
Figure 39: (3-Thiopropyl) (di-tridecyl-penta-ethoxylate) monoethoxy silane.
The reduction of the number of alkoxy groups to just one leads to 80% less ethanol
emission during the silanisation stage. Scorch, always observed in the mercapto group
containing silanes, is prevented by the oligomeric substituent on the Si-unit. This silane
leads to a major improvement in the loss tangent values: A rubber compound with this
silane shows a 40% decrease of tan δ at 60°C, the normal temperature of a moving tire,
compared to TESPT. This reduction in loss tangent has a strong impact on the rolling
resistance, which in this case decreased by 13% 83.
There is a whole range of other silane coupling agents but most of them have no
practical application in tire industry.
2.5 POLYMER FUNCTIONALISATION
Applying a silane coupling agent is one method of increasing the compatibility between
the very polar silica and the rather unpolar rubber. Polymer chain modification is also a
way to increase the compatibility between filler and polymer. Modification of the polymer
chain can be implemented during the polymerization process in two basic modes as
shown in Figure 40.

52
Figure 40: Polymer functionalisation 84.
2.5.1. Chain-end functionalisation
In this mode, the polymer chain is terminated by a silane compound with reactive groups
towards silica. Anionic copolymerization of styrene with butadiene is a “living
polymerization” process, which means that the polymer chain is still active despite the
fact that there is no monomer to react with; implementation of reactive silane
compounds or tin compounds at this moment of copolymerization leads to termination of
the copolymer by this silane or a tin compound. Polymers, in which a silane was used as
a chain terminator or as a backbone modifier are generally used with silica, while tin
ended polymers are preferably be used in combination with carbon black. As the
coupling with the filler can occur only from the modified polymer chain ends, the density
of the silane coupling groups is rather low and so is the bonding efficiency with silica.
Tin polymer modification (Figure 41) is a complex process, in which branching of
the polymer chain caused by tin tetrachloride (or alkyl tin chloride) is playing the main
role. The living polymerization allows for the termination of polymer chains in two ways:
firstly, a small dosage of styrene (ST) is added to the reactor before termination followed
by a tin compound; alternatively, butadiene (BD) is added followed by a tin compound in
second mode. The difference between these two reaction paths is the insertion of
oligomeric styryl or butadienyl molecules between the chain ending tin and the rest of
the chain.

53
Figure 41: Two types of chain termination by tin tetrachloride
THF: tetrahydrofurane, CHX: cyclohexane 85.
Experiments indicated that butadienyl tin terminated styrene butadiene rubber filled with
carbon black have considerably lower tangent δ values in comparison to styryl tin ended
chains. This fact has been attributed to steric hindrance in the second case 85, 86, 87.
Styrene butadiene rubber terminated by tin tetrachloride creates a higher fraction of
bound rubber with carbon black than the non-functionalized polymer. Generally, the
vulcanizates of tin coupled SBRs show lower hysteresis with the increase in bound
rubber. However, the vulcanizates of randomly modified SBR with tin compounds and
SBR containing low molecular weight tin coupled SBR do not show a lower hysteresis in
spite of a large amount of bound rubber. Therefore the reduction of the hysteresis can
not be explained by the formation of bound rubber. During tin chain termination,
branched polymer structures can be created, which also can have a higher physical
interaction with carbon black 85, 86, 88.
2.5.2 Backbone functionalisation
More promising is a functionalization of the backbone of polymer chains. This
modification changes the polymer itself in a considerable way, and it must be regarded
as a different polymer.
In-chain chemical modification is easily achieved by using chemical compounds
containing thiol groups like thioglycolic acid or ethyl mercaptoacetate. Modification is
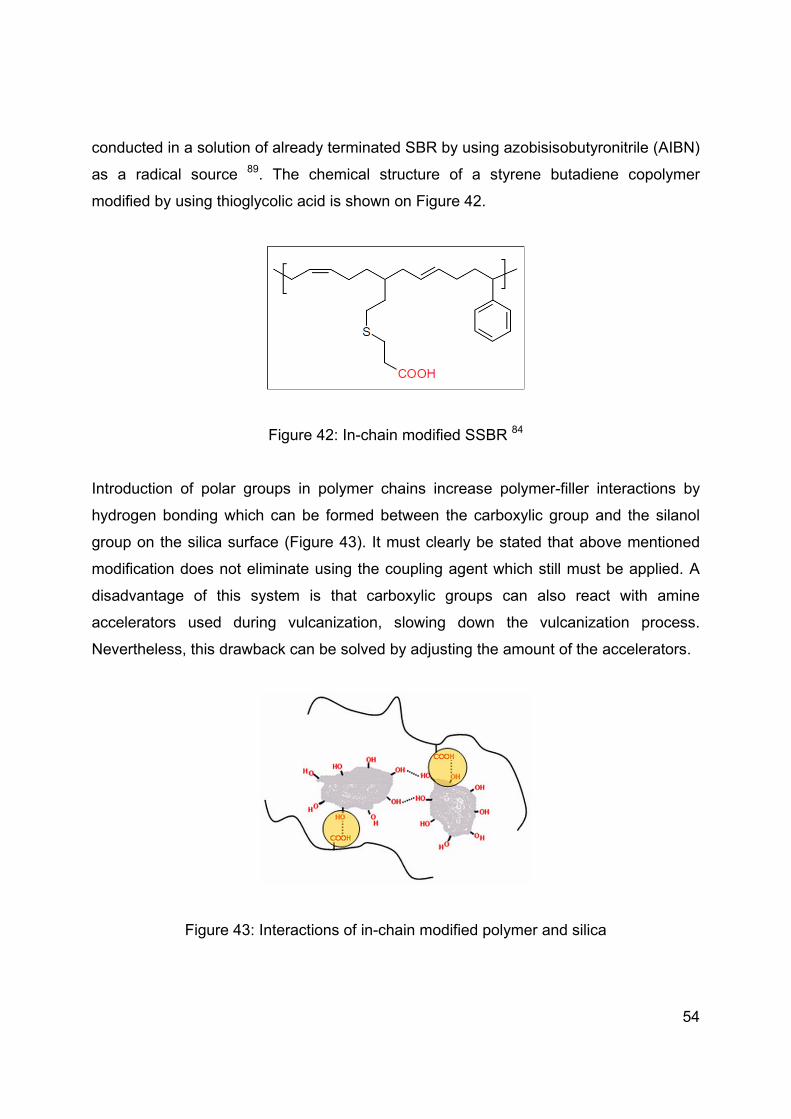
54
conducted in a solution of already terminated SBR by using azobisisobutyronitrile (AIBN)
as a radical source 89. The chemical structure of a styrene butadiene copolymer
modified by using thioglycolic acid is shown on Figure 42.
Figure 42: In-chain modified SSBR 84
Introduction of polar groups in polymer chains increase polymer-filler interactions by
hydrogen bonding which can be formed between the carboxylic group and the silanol
group on the silica surface (Figure 43). It must clearly be stated that above mentioned
modification does not eliminate using the coupling agent which still must be applied. A
disadvantage of this system is that carboxylic groups can also react with amine
accelerators used during vulcanization, slowing down the vulcanization process.
Nevertheless, this drawback can be solved by adjusting the amount of the accelerators.
Figure 43: Interactions of in-chain modified polymer and silica
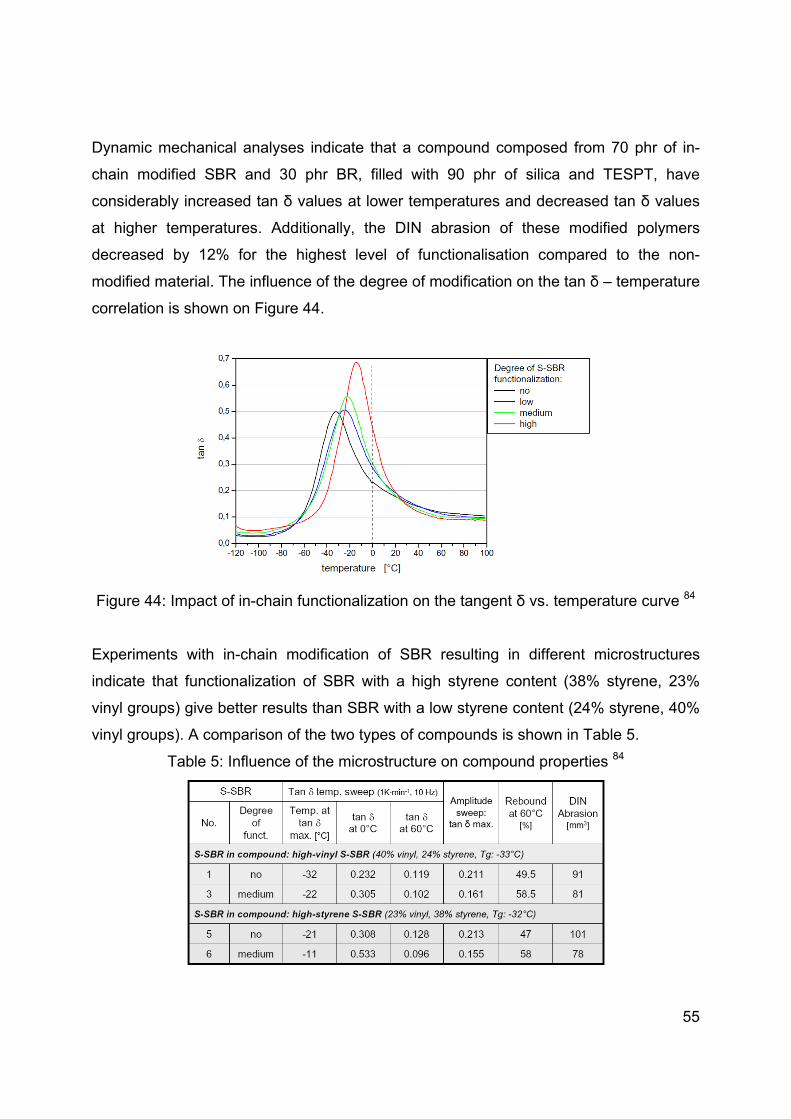
55
Dynamic mechanical analyses indicate that a compound composed from 70 phr of in-
chain modified SBR and 30 phr BR, filled with 90 phr of silica and TESPT, have
considerably increased tan δ values at lower temperatures and decreased tan δ values
at higher temperatures. Additionally, the DIN abrasion of these modified polymers
decreased by 12% for the highest level of functionalisation compared to the non-
modified material. The influence of the degree of modification on the tan δ – temperature
correlation is shown on Figure 44.
Figure 44: Impact of in-chain functionalization on the tangent δ vs. temperature curve 84
Experiments with in-chain modification of SBR resulting in different microstructures
indicate that functionalization of SBR with a high styrene content (38% styrene, 23%
vinyl groups) give better results than SBR with a low styrene content (24% styrene, 40%
vinyl groups). A comparison of the two types of compounds is shown in Table 5.
Table 5: Influence of the microstructure on compound properties 84
56
From all above mentioned methods of polymer modification, only backbone modified
polymers seem to have the potential of significant improvement of the magic triangle of
tire properties. Polymer modification is limited almost only to introduction of groups
capable to hydrogen bonding with the silica surface, because introduction of chemically
reactive groups into the polymer backbone could induce coupling already during the
mixing stage, which can lead to processing problems. Chemical bonds formed between
silica and polymer during mixing result in higher transfer of shear forces from the
polymer to the filler. This can lead to an increased mixing torque, because the silica
agglomerates would be efficiently broken by the polymer which is attached to their
surface. Chemical bonding in the mixing stage could also cause scorch during
compound mixing, because each silica particle acts as a multiple crosslink nod for
polymer chains. Groups capable of hydrogen bonding significantly increase the filler
dispersion, despite the fact that there are no covalent bonds.
The scope of this project is to understand which characteristics of fillers, filler-polymer
interactions and network characteristics are determining the performance of tread
material. The focus is on improvement of wet grip, but rolling resistance and wear will
also be considered. At the end of the thesis, a filler-polymer system will be defined,
which results in a significantly improved wet grip compared to current tread materials,
without trading any of the other tire performance properties.
2.6 FINAL CONCLUSIONS
The ideal compound for tire treads should meet the following demands:
- During breaking, the tire tread should easily deform, thus increase the contact
area between tread and road.
- Applying fillers should not cause any change in the tan δ = f(T) curve of a
polymer. In other words: energy dissipated due to rolling should be the energy
dissipated by the pure polymer. The dynamic properties of the filled and unfilled
polymer should be the same. Silanization is a method which increases the filler –

57
polymer interactions and reduces the influence of the filler on the dynamic
proerties. Additionally there is a lack of knowledge about the number of silanol
groups that should be bound to the polymer chain, to further decrease the
hysteresis of material.
o This problem could be solved by tightened filler – polymer bonding: using
more efficient coupling agents, modified polymers or both at the same
time.
o Applying low amounts of highly reinforcing fillers which will cause the same
effect as high amount of low reinforcing filler. Due to the low filler content in
the rubber matrix, its influence on dynamical properties will be low.
- The filler – filler network should break in the temperature region of wet skid,
amplifying energy dissipation in this moment. However, it should be strong
enough to withstand the higher strain under rolling conditions.
- The polymer network, namely physical and chemical crosslink’s, should partially
break under wet skid conditions, and being reformed under rolling conditions.
Breaking of the bonds will cost energy, and this would help to dissipate some of
the energy input when breaking. This should lead to a second maximum of the
tan δ = f(T) curve at the temperature region of wet skid. The material should be
partially thixotropic, which can be achieved by partially change the crosslink
system to other which is not able to withstand higher temperature prevailing
during wet skid (leads to thermal softening).
- The tread rubber should be resistant to thermal degradation – high energy
dissipation during breaking means that the tread material will be exposed to high
temperatures.
- The surface properties of the tire tread material should allow for easy breaking
(dissipation) of the water layer between the tire and road surface causing dry
friction. In other words, the surface of the tire tread should be more hydrophilic.
Conversely, the inner surface of the tire tread profile should be hydrophobic to
ease water drainage.
- Using TESPT of TESPD as coupling agent is related with emission of large
quantities of ethanol during compounding.

58
o Pre-silanised silica can be solution of this problem. However silanisation in
solvent is related with its evaporation, what makes this process more
expensive than the in-situ silanization.
o Another solution is to use coupling agents with only one ethoxy group. One
reactive group instead of two in case of TESPT leads to using higher
amount of this new coupling agent.
The scope of this project is to understand which characteristics of fillers, filler-polymer
interaction and network formation are determining the performance of tread material.
The focus is on improvement of wet grip, but rolling resistance and wear will also be
considered. At the end of the thesis, a filler-polymer system will be defined, which results
in significantly improved wet grip compared to current tread materials, without trading
other tire performance properties.

59
REFERENCES
[1] R. Bond, G. F. Morton, Polymer 25 (1984) 132. [2] M. J. Wang, Kautschuk Gummi Kunststoffe 7 (2007) 438. [3] A. Yoshioka, K. Komuro, A. Ueda, H. Watanabe, S. Akita, T. Masuda, A. Nakajima, Pure and Applied Chemistry 58 (1986) 1697. [4] M.J. Wang, Rubber Chemistry and Technology 71 (1998) 520. [5] M. J. Wang, Kautschuk Gummi Kunststoffe 1 (2008) 33. [6] S. Cervenya, A. Ghilarduccib, H. Salvab, A.J. Marzoccaa, Polymer 41 (2000) 2227. [7] B. J. Allbert, J. C. Walker, Rubber Chemistry and Technology 41 (1968) 753. [8] V. Hermann W. Niedermeier, American Chemical Society, Rubber Division Meeting, Cleveland Ohio October 16-18 (2007). [9] Marion G. Pottinger, Thomas J. Yager "The Tire pavement interface" (1986) 125. [10] Adel F. Halasa, J. Prentis, B. Hsu, Ch. Jasiunas, Polymer 46 (2005) 4166. [11] K.H. Nordsiek, Kautschuk Gummi Kunststoffe 38 (1985) 177. [12] I. M. Hutchings, D. W. Deuchar, Journal of Material Science 22 (1987) 4071. [13] Mushack, R., Lüttich, R., Bachmann, W., European Rubber Journal 7-8 (1996) 24. [14] M. J. Wang, Kautschuk Gummi Kunststoffe 4 (2008) 159. [15] I. M. Hutchings, “Friction and Wear of Engineering Materials” (1992) 150. [16] Schallamach A. “Chemistry and Physics of Rubber-like Substances” (1963) 382. [17] R. A. Beck, R. W. Truss, Wear 218 (1998) 145. [18] N. Tabsana, S. Wirasatea, K. Suchiva, Wear 269 (2010) 394. [19] A. Hunsche, U. Görl, A. Muller, M. Knaack, Th. Göbel, Kautschuk Gummi Kunststoffe 50 (1997) 881. [20] Y. Fukahori, H. Yamazaki, Wear 178 (1994) 109. [21] B. B. Boonstra, Polymer 20 (1979) 691. [22] A.I. Medalia, Rubber Chemistry and Technology, 46 (1973) 877. [23] G. Kraus, Rubber Chemistry and Technology 44 (1971) 199. [24] P.P.A. Smit, Rubber Chemistry and Technology 41 (1968) 1194. [25] J. B. Donnet, Rubber Chemistry and Technology 71 (1998) 323. [26] E. Guth, O. Gold, Physical Review 53 (1938) 322. [27] Dierkes, Wilma Karola, Economic mixing of silica-rubber compounds: interaction between the chemistry of the silica-silane reaction and the physics of mixing. Thesis (2005). [28] M. Akiba, A.S. Hashim, Progress in Polymer Science 22 (1997) 475. [29] S. Wolff, Rubber Chem. Technol. 55 (1983) 967. [30] A. Schröder, M. Klüppel, R. H. Schuster, J. Heideberg, Kautschuk Gummi Kunststoffe 54 (2001) 260. [31] A. Schröder M. Klüppel R.H. Schuster J. Heideberg, Carbon 40 (2002) 207. [32] J. B. Donnet, “Science and Technology of Rubber” (2005) 367.
60
[33] M. P. Wagner, Rubber Chemistry and Technology 49 (1976) 703. [34] M. J. Wang, Rubber Chemistry and Technology 71 (1998) 520. [35] N. Hewitt, “Compounding Precipitated Silica in Elastomers” (2007) 12. [36] P.K. Jal, S. Patel, B.K. Mishra, Talanta, 62 (2004) 1005. [37] D.R. Bassett, E.A. Boucher, A.C. Zettlemoyer, Journal of Colloid and Interface Science 27 (1968) 649. [38] J. L. Leblanc, Progress in Polymer Science 27 (2002) 627. [39] O. Klockmann, A.Hasse, Kautschuk und Gummi Kunststoffe 7 (2007) 82. [40] Satoshi Mihara, Reactive processing of silica-reinforced tire rubber, thesis, 2009. [41] M. J. Wang, Kautschuk und Gummi Kunststoffe 9 (2007) 438. [42] M. J. Wang, S. Wolff, J. B. Donnet, Rubber Chemistry and Technology, 64 (1991) 559. [43] U. Gorl, A. Hunsche, A. Mueller, H.G. Koban, Rubber Chemistry and Technology, 70 (1997) 608. [44] United States Patent No. 6,197,274, (2001). [45] United State Patent No. 5,904,762, (1999). [46] M. J. Wang, Y. Kutsovsky, P. Zhang, G. Mehos, L. J. Murphy, K. Mahmud, Kautschuk Gummi Kunststoffe 55 (2002) 33. [47] M. J. Wang, Y. Kutsovsky, P. Zhang, L. J. Murphy, S. Laube, K. Mahmud, Rubber chemistry an technology 75 (2002) 247. [48] P. Zhang, M. J. Wang, Y. Kutsovsky, S. Laube, K. Mahmud, Rubber Division, American Chemical Society, Cleveland, Ohio October 16 - 19 (2001). [49] United States Patent No. 2,531,396, (1950). [50] H. Fischer Material Science and Engineering 23 (2003) 763. [51] S. Pavlidou, C.D. Papaspyrides, Progress in Polymer Science 33 (2008) 1119. [52] C. Debek, Elastomers 5 (2006) 1. [53] M. Zanetti, S. Lomakin, G. Camino, Macromolecular Materials and Engineering 1-9 (2000) 279. [54] M. Alexandre, P. Dubois, Materials Science and Engineering 28 (2000) 1. [55] F. Schon, W. Gronski, Kautschuk Gummi Kunststoffe 56 (2003) 166. [56] M. Ganter, W. Gronski, H. Semke, T. Zilg, C. Thomman, R. Muhlhaupt, Kautschuk und Gummi Kunststoffe 54 (2001) 166. [57] R. Sengupta, S. Chakraborty, S. Bandyopadhyay, R. Mukhopadhyay, S. Dasgupta K. Auddy, A.S. Deuri Polymer Engineering and Science 47 (2007) 1956. [58] R. Rajasekar, G. Heinrich, A. Das, Ch. K. Das, Research Letters in Nanotechnology 2009 (2009) 1. [59] A. Das, R. Jurk, K. W. Stockelhuber, T. Engelhardt, J. Fritzsche, M. Kluppel, G.
Heinrich, Journal of Macromolecular Science 45 (2008) 144. [60] H. Essawy, D. El-Nashar, Polymer Testing 23 (2004) 803.

61
[61] A. Mousa, J. Karger-Kocsis, Macromolecular Materials and Enginering 286 (2001)
260. [62] M. Ganter, W. Gronski, H. Semke, T. Zilg, C. Thomann, Kautschuk Gummi Kunststoffe 54 (2001) 166. [63] J. H. Bachmann, J. W. Sellers, M. P. Wagner, R. F. Wolf , Rubber Chemistry and Technology 32 (1959) 1286. [64] S. Wolff, Wesseling, Kautschuk und Gummi Kunststoffe 28 (1975) 379. [65] J.T. Byers, Rubber World 218 (1998) 38. [66] A. Hunsche, U. Gorl, A. Muller, M. Knaack, Kautschuk und Gummi Kunststoffe 50 (1997) 881. [67] A. Hunsche, U. Gorl, H.G. Koban, T. Lehmann, Kautschuk und Gummi Kunststoffe 51 (1997) 525. [68] H. D. Luginsland, A. Hasse, American Chemical Society, Rubber Division Meeting, Dallas Texas, April (2000). [69] A. Ansarifar, H.P. Lim, R. Nijhawan, International Journal of Adhesion and Adhesives 24 (2004) 9. [70] U. Gorl, A. Hunsche, Kautschuk und Gummi Kunststoffe 51 (1998) 525. [71] Annemieke ten Brinke, Silica Reinforced Tyre Rubbers. Thesis (2002). [72] R. Bond, Chemical Society, Rubber Division Meeting, Chicago, May 3-6 (1977). [73] L.A.E.M. Reuvekamp, Reactive mixing of silica and rubber for tires and engine mounts. Thesis (2003). [74] J.W. ten Brinke, S.C. Debnath, L.A.E.M. Reuvekamp, J.W.M. Noordermeer, Composites Science and Technology 63 (2003) 1165. [75] B. Rodgers “Rubber compounding: chemistry and applications” (2005) 424. [76] L.A.E.M. Reuvekamp, P.J. van Swaaij, J.W.M. Noordermeer, Kautschuk und Gummi Kunststoffe 1 (2009) 35. [77] M. Zaborski, A. Vidal, G. Ligner, H. Balard, E. Papirer, and A. Burneauf, Langmuir 5 (1989) 447. [78] F. Thorn, S. Wolff, Kautschuk und Gummi Kunststoffe 28 (1975) 733. [79] P. Sae-oui, Ch. Sirisinha, U. Thepsuwan, K. Hatthapanit, Polymer Testing 23 (2004) 871. [80] P.G. Joshi, R.W. Cruse, R.J. Pickwell, K.J. Weller, W.E. Sloan, M. Hofstetter, E.R. Pohl, M.F. Stout and F.D. Osterholtz, Momentive performance materials. [81] A. Blume, Kautschuk und Gummi Kunststoffe 4 (2011) 38. [82] O. Klockmann, Rubber World, 3 (2010) 21. [83] O. Klockmann, A. Hasse, KGK, 3 (2007) 82. [84] N. Steinhauser, A. Lucassen, Belgian Plastics and Rubber Institute Conference, Brussels, 25th November (2009). [85] F. Tsutsumi, M. Sakakibara, N. Oshima, Rubber Chemistry and Technology 63 (1990) 8.

62
[86] V. R. S. Quiteria, C. A. Sierra, J. M. G. Fatou, Die Angewandte Makromolekulare Chemie 246 (1997) 85. [87] C. A. Sierra, C. Galan, V. Ruiz Santa Quiteria, Rubber Chemistry and Technology 68 (1995) 259. [88] S. Thiele, D. Bellgardt, M. Holzleg, Kautschuk Gummi Kunststoffe, 5 (2008) 244. [89] F. Romani, E. Passaglia, M. Aglietto, G. Ruggeri, Macromolecular Chemistry and Physics 200 (1999) 524.


63
Chapter 3
Influence of the silica specific surface area and structure on rolling and wet skid resistance of a
passenger car tire tread compound
In this study, five different rubber reinforcing silica types are investigated concerning
their influence on properties related to tire performance. The silicas are characterized by
different specific surface areas, aggregate sizes and structure, but with otherwise
comparable properties. A standard “Green tire” tread recipe is used as base compound,
and bis-(triethoxysilylpropyl)tetrasulfide (TESPT) is used as coupling agent. The amount
of coupling agent is adjusted to the specific CTAB surface area of the silicas. The silicas
are tested in two modes: the silica loading is kept constant and the silica loading is
empirically adjusted to reach equal hardness in the vulcanized state. The value of the
dynamic loss tangent, tan δ at 60 °C is used to assess the influence on rolling
resistance, and the Laboratory Abrasion Tester (LAT 100) is used to evaluate the wet
skid resistance of the tested compounds. This equipment was chosen due to the good
correlation with on-road tests. Besides these tire performance indicators, also other
properties are investigated in this paper. Silica with the smallest aggregate size provides
superior wet skid resistance at constant loading mode. The highest wet skid resistance
is maintained even when the silica load is decreased to equalize the hardness of its
corresponding vulcanizates. A decreased concentration of the high surface area silica
provides also low values of tan δ at 60 °C which correspond with better rolling resistance
of tires made therewith.
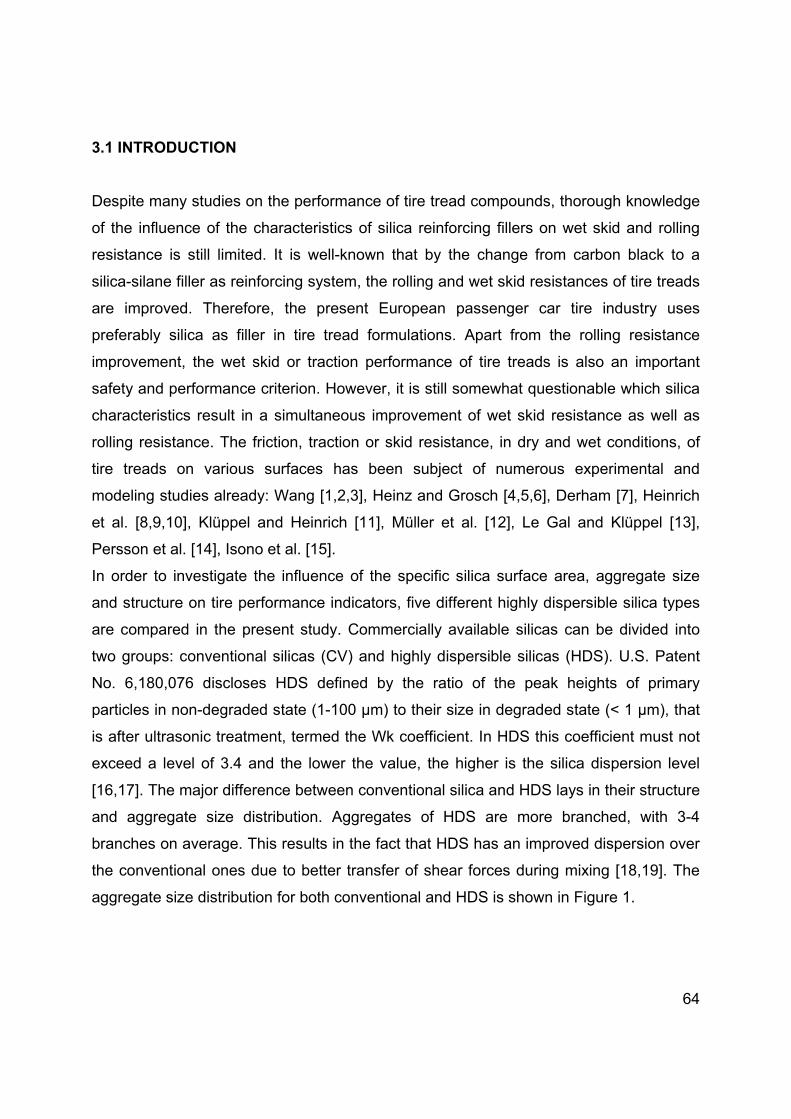
64
3.1 INTRODUCTION
Despite many studies on the performance of tire tread compounds, thorough knowledge
of the influence of the characteristics of silica reinforcing fillers on wet skid and rolling
resistance is still limited. It is well-known that by the change from carbon black to a
silica-silane filler as reinforcing system, the rolling and wet skid resistances of tire treads
are improved. Therefore, the present European passenger car tire industry uses
preferably silica as filler in tire tread formulations. Apart from the rolling resistance
improvement, the wet skid or traction performance of tire treads is also an important
safety and performance criterion. However, it is still somewhat questionable which silica
characteristics result in a simultaneous improvement of wet skid resistance as well as
rolling resistance. The friction, traction or skid resistance, in dry and wet conditions, of
tire treads on various surfaces has been subject of numerous experimental and
modeling studies already: Wang [1,2,3], Heinz and Grosch [4,5,6], Derham [7], Heinrich
et al. [8,9,10], Klüppel and Heinrich [11], Müller et al. [12], Le Gal and Klüppel [13],
Persson et al. [14], Isono et al. [15].
In order to investigate the influence of the specific silica surface area, aggregate size
and structure on tire performance indicators, five different highly dispersible silica types
are compared in the present study. Commercially available silicas can be divided into
two groups: conventional silicas (CV) and highly dispersible silicas (HDS). U.S. Patent
No. 6,180,076 discloses HDS defined by the ratio of the peak heights of primary
particles in non-degraded state (1-100 μm) to their size in degraded state (< 1 μm), that
is after ultrasonic treatment, termed the Wk coefficient. In HDS this coefficient must not
exceed a level of 3.4 and the lower the value, the higher is the silica dispersion level
[16,17]. The major difference between conventional silica and HDS lays in their structure
and aggregate size distribution. Aggregates of HDS are more branched, with 3-4
branches on average. This results in the fact that HDS has an improved dispersion over
the conventional ones due to better transfer of shear forces during mixing [18,19]. The
aggregate size distribution for both conventional and HDS is shown in Figure 1.

65
Figure 1: Size distribution of silica aggregates for conventional and highly dispersible
silica [18].
The specific surface areas measured in accordance with Brunauer Emmett Teller (BET)
and Cetyl Trimethylammonium Bromide (CTAB) describe the accessibility of the silica
surface to relatively small molecules like nitrogen in case of the BET measurement, or
relatively large molecules like polymers in the case of the CTAB measurements [20,21].
The BET value is a measure of the “total” surface area, while the CTAB value
corresponds to the “outer” surface area of the silica. The ratio of BET to CTAB is often
used to compare the particular silica types. A large difference between the two specific
surface areas is hard to achieve. For the majority of silica types the value of the BET to
CTAB ratio ranges somewhere in between 0.8 and 1.2. However higher values of 1.5 to
2.4 are also reported in the literature [22,23,24].
The goal of the present study is to characterize the underlying mechanisms involved in
filler-rubber interactions for wet skid and rolling resistance of tire treads, a dynamic-
viscoelastic phenomenon. The storage and loss moduli are commonly measured as
dynamic properties for the assessment of the tire properties. The ratio of loss to storage
modulus is the definition of the loss tangent or tangent delta. The influence of the filler-
polymer interaction on wet skid performance is investigated by testing the dynamic
properties, the tan δ in the temperature range from 0 – 20 °C at 10 Hz. The values of the
loss angle in this temperature range are so far considered to be the most suitable
indicators for the wet skid performance of a tire tread [8,25,26]. Assessment of rolling
resistance by measuring the tangent delta value at 40 – 60 °C on laboratory scale is

66
common practice, and a correlation between dynamic properties of the material and on-
road tests is widely accepted [27]. Additionally, measurements on a Laboratory Abrasion
Tester 100 (LAT 100) are performed to assess the wet skid performance, as this method
comes closer to the practical case of a rolling tire [28,29].
3.2. EXPERIMENTAL
3.2.1 Materials and compound formulations
To assess the influence of the silica specific surface area and morphology on the wet
skid, rolling resistance and other related properties, 5 types of silica differing in these
two properties but otherwise comparable were used in this study. The silica samples are
commercial grades produced by Rhodia Silices, presently member of the Solvay group
(Lyon, France). The physical properties of these silica types are described in Table 1. A
detailed specification of the other compounding ingredients is shown in Table 2.
Table 1: Physical properties of the different silica types.
Silica characteristics
Silica type Zeosil
1085GRZeosil
1115MP Zeosil
1165MP Zeosil 200MP
Z HRS 1200MP
Silica code SSA-80 SSA-110 SSA-160 SSA-200 SSA-195 BET surface area (m2/g) 90 115 165 215 200
CTAB surface area (m2/g) 80 110 160 200 195 Humidity (%) 6.0 6.0 7.0 6.5 7.0
Mean diameter of aggregates * (nm)
120 90 53 65 40
Diameter of elementary particles ** (nm)
- 25 20 10 15
Structure: Dioctyl adipate adsorption
(ml/100 g) 221 220 213 218 220
* Determined by X-ray disc centrifugation in water suspension after desagglomeration in-situ using an ultrasonic probe [30]. ** Small-Angle X-ray scattering [31]
Particular attention is drawn to two silica types, namely Zeosil 200MP and Zeosil 1200
MP. Measurements of the BET specific surface area gives evidence of similar primary
particle size of these two silicas. However the aggregate size measurements performed
after the desagglomeration confirm existence of the larger aggregates for Zeosil 200MP.
Considering the dimensions given by these two experiments, a model depicting the

67
morphology of these two silicas can be drawn, see Figure 2. The model shows also a
different aspect ratio of these two silica types.
Zeosil 1200MP Zeosil 200MP
40 nm 65 nm
Figure 2: Differences in silica structure for Zeosil 1200MP and 200MP.
Table 2: Ingredients specification.
Ingredient Specification Supplier
S-SBR Solution Styrene-Butadiene Rubber Buna VSL 5025-2 HM
Lanxess, Leverkusen, Germany
BR High -cis Butadiene Rubber Europrene BR40
Eni Polimeri, Ravenna, Italy
TESPT Bis-(triethoxysilylpropyl)tetrasulfide Evonik GmbH, Essen, Germany
TDAE Treated Distillate Aromatic Extract oil, VivaTec 500
Hansen & Rosenthal, Hamburg, Germany
Zinc oxide Inorganic oxide Sigma Aldrich, St. Louis, United States
Stearic acid Organic acid Sigma Aldrich, St. Louis, United States
6PPD Antiozonant N-phenyl-N'-1,3-dimethylbutyl-p-phenylenediamine
Flexsys, Brussels, Belgium
TMQ Antioxidant 2,2,4- trimethyl-l,2-di-hydroquinoline
Flexsys, Brussels, Belgium
Sulfur Elemental sulfur, purified by sublimation Sigma Aldrich, St. Louis, United States
TBBS Accelerator N-tert-butylbenzothiazole-2-sulphenamide
Flexsys, Brussels, Belgium
DPG Accelerator - diphenyl guanidine Flexsys Brussels, Belgium
Bis-(triethoxysilylpropyl)tetrasulfide (TESPT) was chosen as coupling agent. The experiments were performed using a typical “Green tire” recipe as given in Table 3 and [32]. The TESPT content was adjusted to the surface area of the particular silica type by
using the empirical equation proposed by L. Guy et al. [31]: Equation 1.

68
silicasilica phrCTABphrTESPT )()(103.5)( 4 (Equation 1)
Two series of batches were prepared:
1. Series I, in which the silica loading was kept at the same level of 80 phr (Table 3).
2. Series II, in which the silica loading was empirically adjusted to obtain equal
hardness for all compounds after vulcanization (Error! Reference source not
found.). Similar hardness of the samples provides more comparable materials for
the LAT 100 tests.
3.2.2 Mixing and vulcanization
A 1.6 liter Banbury mixer was used for mixing. This process was done in three steps
according to the parameters as given in Table 5. The first two steps of the mixing
process were done in the internal mixer with an initial set temperature of 40 °C. The
dump temperature of the compound was adjusted to be 155 °C by manually changing
the cooling water flow and changing the rotor speed, if necessary. Addition of curatives
was done on a two roll mill preheated to 50 °C.
Table 3: Compound formulations – constant silica loading (Series I).
I-80 I-110 I-160 I-200 I-195 SBR Buna
VSL 5025-2HM 103 103 103 103 103
Europrene BR40 25 25 25 25 25 SSA-80 80
SSA-110 80 SSA-160 80 SSA-200 80 SSA-195 80 TESPT 3,39 4,66 6,78 8,48 8,27 TDAE 5 5 5 5 5
Zinc oxide 2,5 2,5 2,5 2,5 2,5 Stearic acid 2,5 2,5 2,5 2,5 2,5
6PPD 2 2 2 2 2 TMQ 2 2 2 2 2
Sulphur 2,22 1,91 1,4 1,00 1,05 DPG 2 2 2 2 2 TBBS 1,7 1,7 1,7 1,7 1,7
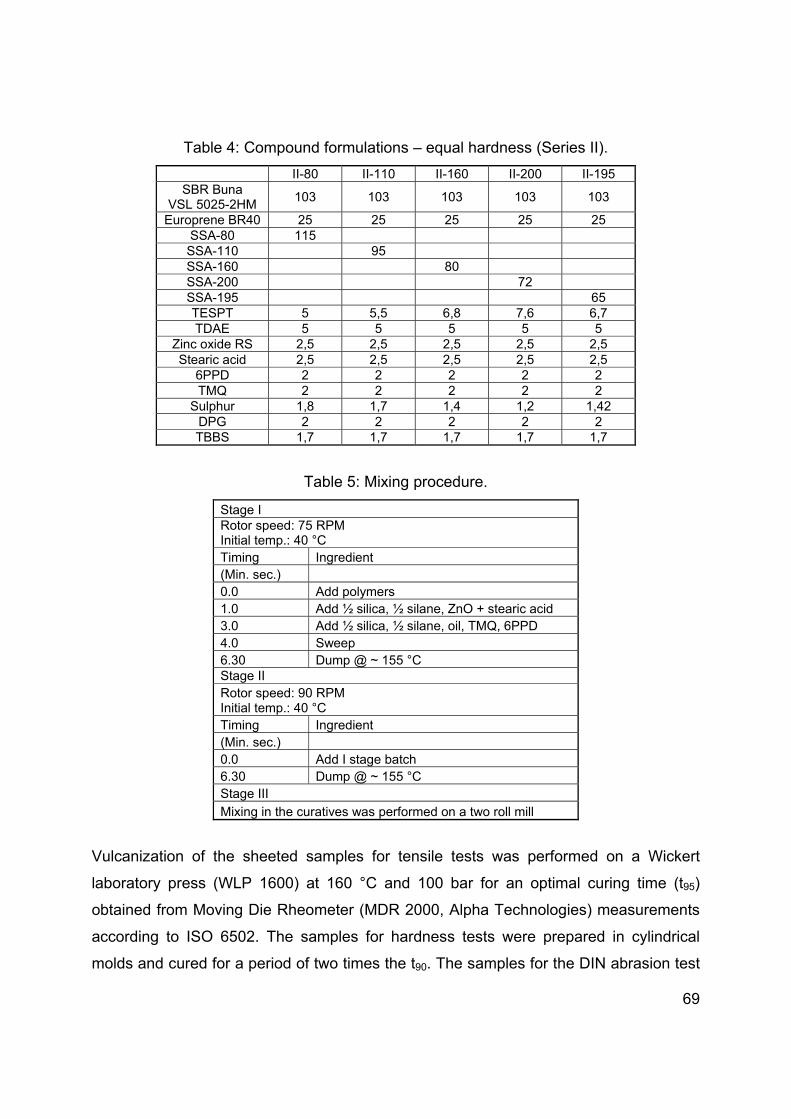
69
Table 4: Compound formulations – equal hardness (Series II).
II-80 II-110 II-160 II-200 II-195 SBR Buna
VSL 5025-2HM 103 103 103 103 103
Europrene BR40 25 25 25 25 25 SSA-80 115 SSA-110 95 SSA-160 80 SSA-200 72 SSA-195 65 TESPT 5 5,5 6,8 7,6 6,7 TDAE 5 5 5 5 5
Zinc oxide RS 2,5 2,5 2,5 2,5 2,5 Stearic acid 2,5 2,5 2,5 2,5 2,5
6PPD 2 2 2 2 2 TMQ 2 2 2 2 2
Sulphur 1,8 1,7 1,4 1,2 1,42 DPG 2 2 2 2 2 TBBS 1,7 1,7 1,7 1,7 1,7
Table 5: Mixing procedure.
Stage I Rotor speed: 75 RPM Initial temp.: 40 °C Timing Ingredient (Min. sec.) 0.0 Add polymers 1.0 Add ½ silica, ½ silane, ZnO + stearic acid 3.0 Add ½ silica, ½ silane, oil, TMQ, 6PPD 4.0 Sweep 6.30 Dump @ ~ 155 °C Stage II Rotor speed: 90 RPM Initial temp.: 40 °C Timing Ingredient (Min. sec.) 0.0 Add I stage batch 6.30 Dump @ ~ 155 °C Stage III
Mixing in the curatives was performed on a two roll mill
Vulcanization of the sheeted samples for tensile tests was performed on a Wickert
laboratory press (WLP 1600) at 160 °C and 100 bar for an optimal curing time (t95)
obtained from Moving Die Rheometer (MDR 2000, Alpha Technologies) measurements
according to ISO 6502. The samples for hardness tests were prepared in cylindrical
molds and cured for a period of two times the t90. The samples for the DIN abrasion test
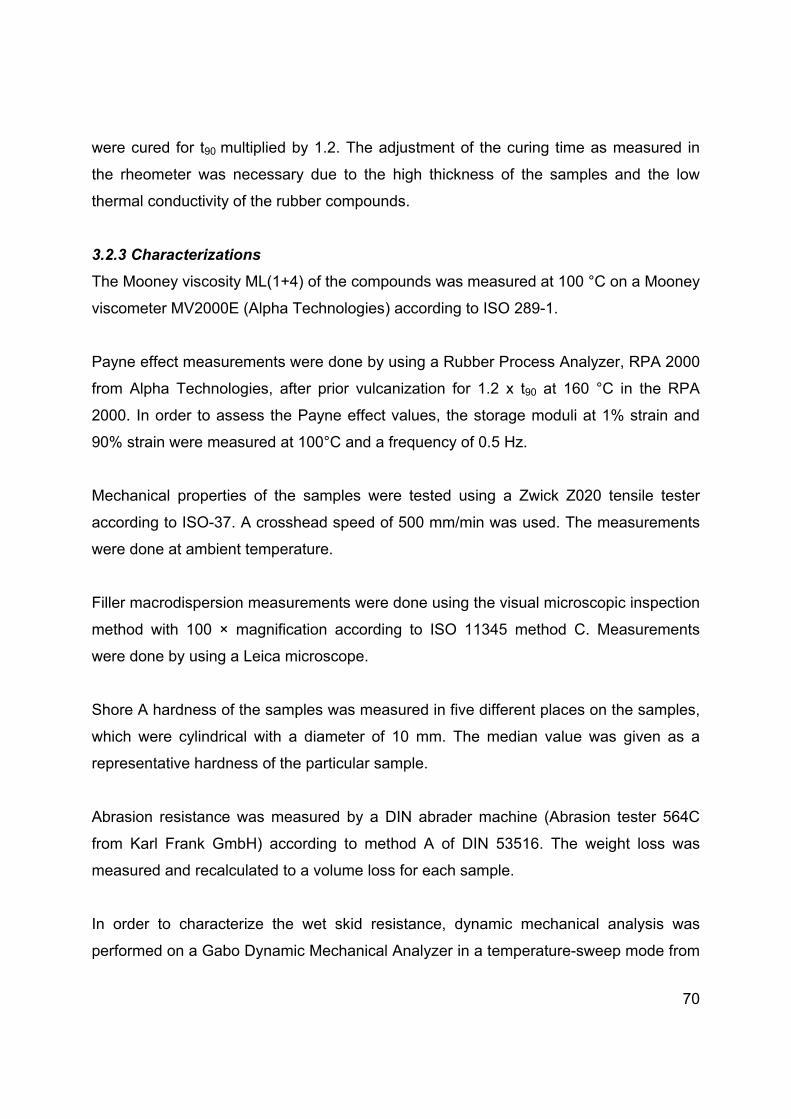
70
were cured for t90 multiplied by 1.2. The adjustment of the curing time as measured in
the rheometer was necessary due to the high thickness of the samples and the low
thermal conductivity of the rubber compounds.
3.2.3 Characterizations
The Mooney viscosity ML(1+4) of the compounds was measured at 100 °C on a Mooney
viscometer MV2000E (Alpha Technologies) according to ISO 289-1.
Payne effect measurements were done by using a Rubber Process Analyzer, RPA 2000
from Alpha Technologies, after prior vulcanization for 1.2 x t90 at 160 °C in the RPA
2000. In order to assess the Payne effect values, the storage moduli at 1% strain and
90% strain were measured at 100°C and a frequency of 0.5 Hz.
Mechanical properties of the samples were tested using a Zwick Z020 tensile tester
according to ISO-37. A crosshead speed of 500 mm/min was used. The measurements
were done at ambient temperature.
Filler macrodispersion measurements were done using the visual microscopic inspection
method with 100 × magnification according to ISO 11345 method C. Measurements
were done by using a Leica microscope.
Shore A hardness of the samples was measured in five different places on the samples,
which were cylindrical with a diameter of 10 mm. The median value was given as a
representative hardness of the particular sample.
Abrasion resistance was measured by a DIN abrader machine (Abrasion tester 564C
from Karl Frank GmbH) according to method A of DIN 53516. The weight loss was
measured and recalculated to a volume loss for each sample.
In order to characterize the wet skid resistance, dynamic mechanical analysis was
performed on a Gabo Dynamic Mechanical Analyzer in a temperature-sweep mode from
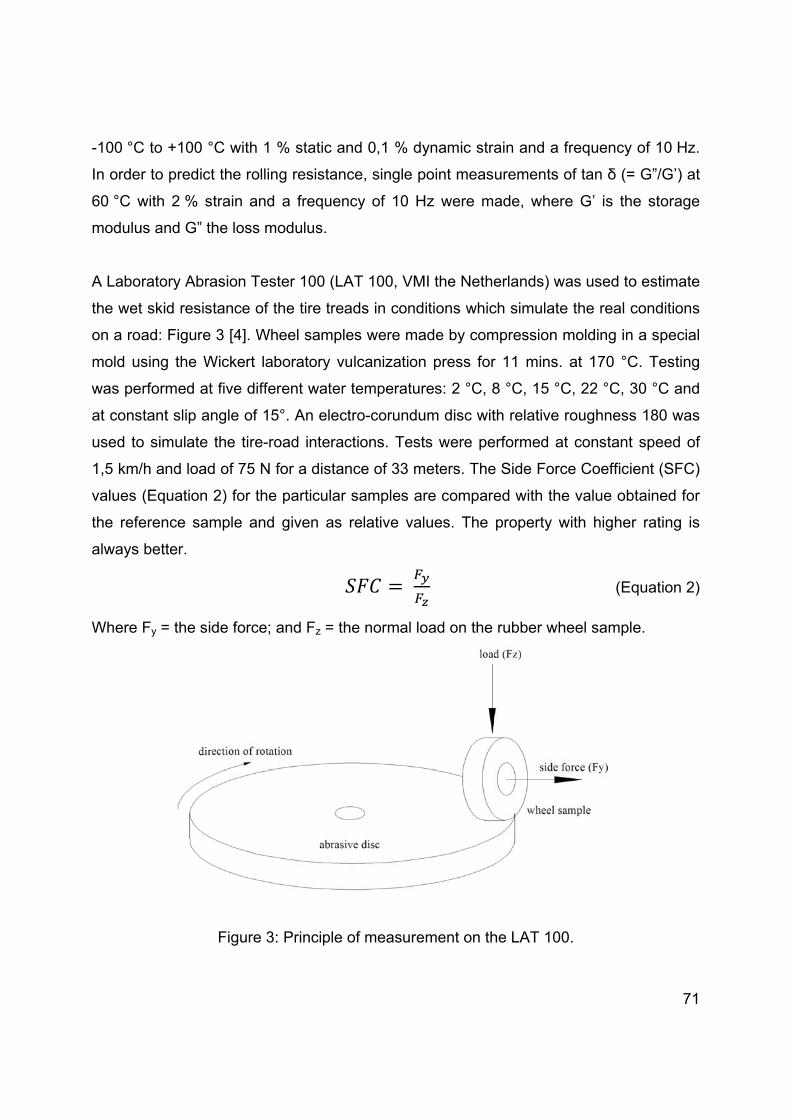
-100 °C
In orde
60 °C w
modulu
A Labo
the wet
on a ro
mold us
was pe
at cons
used to
1,5 km/
values
the refe
always
Where
C to +100 °
r to predict
with 2 % s
us and G” th
ratory Abra
t skid resis
ad: Figure
sing the W
rformed at
stant slip an
o simulate
/h and load
(Equation
erence sam
better.
Fy = the sid
°C with 1 %
t the rolling
strain and a
he loss mo
asion Teste
tance of th
3 [4]. Whe
Wickert lab
t five differe
ngle of 15°
the tire-ro
d of 75 N fo
2) for the
mple and g
de force; a
Figure 3:
% static an
g resistanc
a frequenc
odulus.
er 100 (LA
he tire trea
eel sample
oratory vu
ent water t
°. An electr
ad interact
or a distan
particular s
given as r
and Fz = the
Principle o
d 0,1 % dy
ce, single p
cy of 10 H
AT 100, VM
ds in cond
es were ma
lcanization
temperatur
ro-corundu
tions. Test
ce of 33 m
samples ar
relative val
e normal lo
of measure
ynamic stra
point meas
Hz were m
MI the Nethe
itions whic
ade by com
n press for
res: 2 °C, 8
um disc wit
ts were pe
meters. The
re compare
lues. The
oad on the
ement on th
ain and a f
urements o
ade, wher
erlands) w
ch simulate
mpression m
r 11 mins.
8 °C, 15 °C
th relative
erformed at
e Side Forc
ed with the
property w
rubber wh
he LAT 100
frequency
of tan δ (=
e G’ is the
as used to
e the real c
molding in
at 170 °C
C, 22 °C, 3
roughness
t constant
ce Coefficie
e value obt
with higher
(Eq
heel sample
0.
71
of 10 Hz.
G”/G’) at
e storage
o estimate
conditions
a special
C. Testing
30 °C and
s 180 was
speed of
ent (SFC)
tained for
r rating is
quation 2)
e.
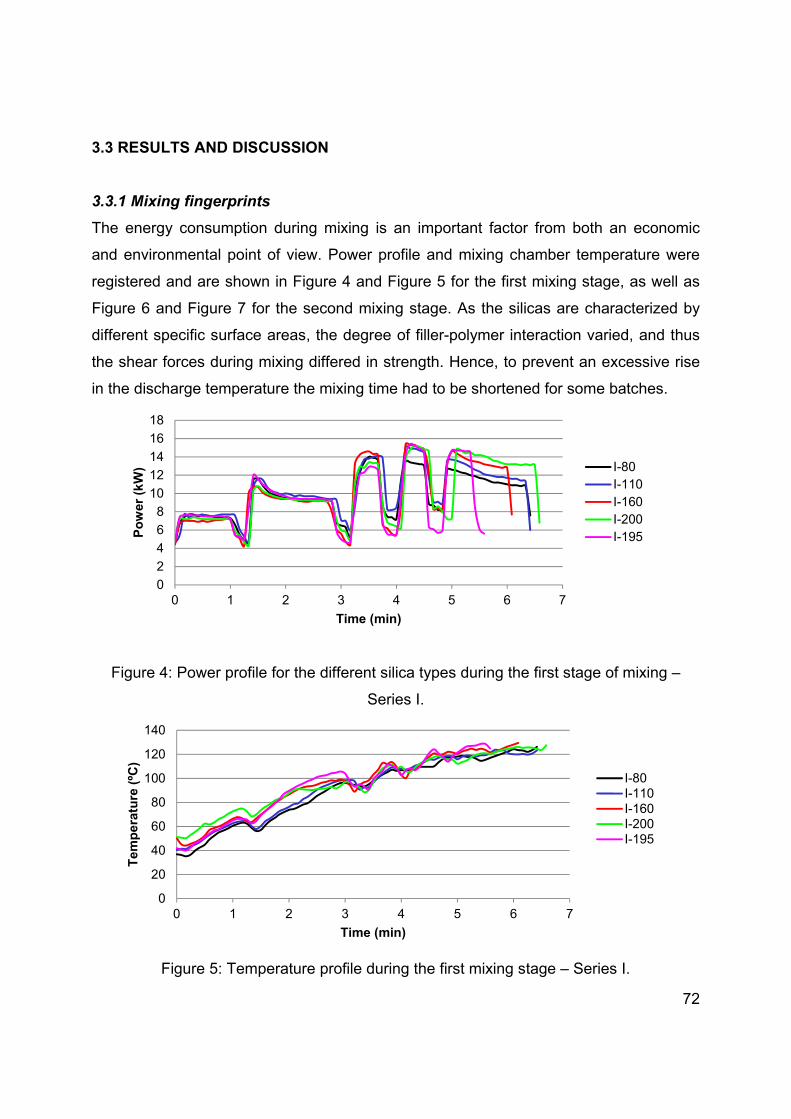
72
3.3 RESULTS AND DISCUSSION
3.3.1 Mixing fingerprints
The energy consumption during mixing is an important factor from both an economic
and environmental point of view. Power profile and mixing chamber temperature were
registered and are shown in Figure 4 and Figure 5 for the first mixing stage, as well as
Figure 6 and Figure 7 for the second mixing stage. As the silicas are characterized by
different specific surface areas, the degree of filler-polymer interaction varied, and thus
the shear forces during mixing differed in strength. Hence, to prevent an excessive rise
in the discharge temperature the mixing time had to be shortened for some batches.
Figure 4: Power profile for the different silica types during the first stage of mixing –
Series I.
Figure 5: Temperature profile during the first mixing stage – Series I.
0
2
4
6
8
10
12
14
16
18
0 1 2 3 4 5 6 7
Po
wer
(k
W)
Time (min)
I-80I-110I-160I-200I-195
0
20
40
60
80
100
120
140
0 1 2 3 4 5 6 7
Tem
pe
ratu
re (
ºC)
Time (min)
I-80I-110I-160I-200I-195
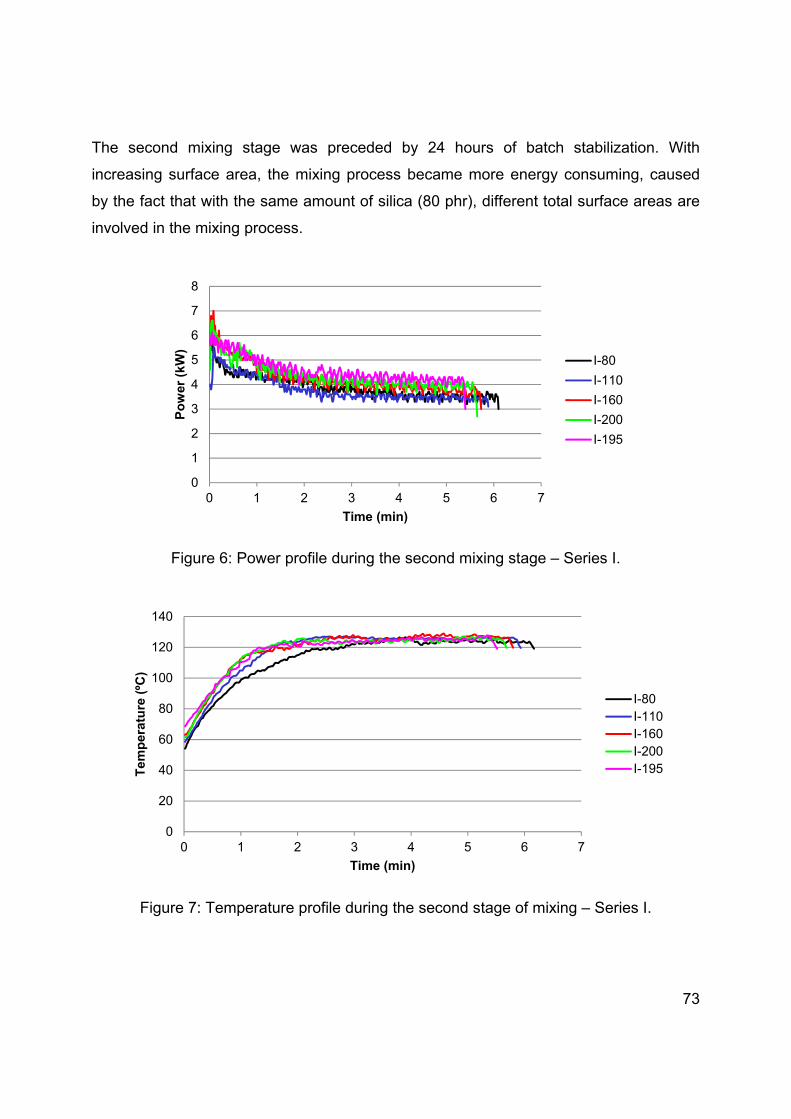
73
The second mixing stage was preceded by 24 hours of batch stabilization. With
increasing surface area, the mixing process became more energy consuming, caused
by the fact that with the same amount of silica (80 phr), different total surface areas are
involved in the mixing process.
Figure 6: Power profile during the second mixing stage – Series I.
Figure 7: Temperature profile during the second stage of mixing – Series I.
0
1
2
3
4
5
6
7
8
0 1 2 3 4 5 6 7
Po
wer
(kW
)
Time (min)
I-80
I-110
I-160
I-200
I-195
0
20
40
60
80
100
120
140
0 1 2 3 4 5 6 7
Te
mp
era
ture
(ºC
)
Time (min)
I-80I-110I-160I-200I-195

74
Fingerprints of the first mixing stage for Series II, which contain variable amounts of
silica, are shown in Figure 8 and Figure 9. In order to obtain equal hardness, the silica
loading was increased for the low reinforcing types, SSA-80 and SSA-110 and
decreased for the highly reinforcing types, SSA-195 and SSA-200. The value of
hardness obtained for the batch containing 80 phr of silica SSA-160 was used as
reference value. Increase of the silica loading with lower reinforcing capabilities, lower
specific surface area, still turns out to result in higher shear forces: Figure 8. This points
at the benefit of using a relatively small amount of highly reinforcing fillers over larger
amounts of low reinforcing fillers. By the strong reinforcing effect caused by silicas with
smallest aggregates and highest specific surface area, the loading of the silicas can in
fact be decreased resulting in lower energy consumption during mixing.
Figure 8: Power profile during first mixing stage – Series II.
The second stage of mixing is shown in Figure 10 and Figure 11. Again, it shows that
the batch containing 65 phr of silica SSA-195, the highly reinforcing type, is
characterized by the lowest energy consumption.
0
2
4
6
8
10
12
14
16
18
0 2 4 6 8
Po
wer
(kW
)
Time (min)
II-80
II-110
II-160
II-200
II-195

75
Figure 9: Temperature profile during first mixing stage – Series II.
Figure 10: Power profile during second mixing stage – Series II.
0
20
40
60
80
100
120
140
160
0 2 4 6 8
Te
mp
era
ture
(°)
Time (min)
II-80
II-110
II-160
II-200
II-195
0
1
2
3
4
5
6
7
0 2 4 6 8
Po
wer
(kW
)
Time (min)
II-80
II-110
II-160
II-200
II-195

76
Figure 11: Temperature profile during second mixing stage – Series II.
3.3.2 Compound Mooney viscosity
The Mooney viscosity of the compounds increases substantially with increasing CTAB
surface area of the silicas as shown in Figure 12. An increased surface area of the silica
is the result of a smaller size of the primary particles (Table 1), and both properties tend
to increase the viscosity: smaller particles result in lower inter-particle distances for a
given degree of dispersion. Thus these particles have a higher mutual interaction and
higher forces are need to displace the particles within the elastomer matrix.
Furthermore, a higher surface area increases the filler-polymer interaction, which results
in a higher degree of rubber immobilized on the surface of the filler. This increases the
effective diameter of the filler, which also results in an increase of the viscosity.
0
20
40
60
80
100
120
140
0 2 4 6 8
Te
mp
era
ture
(°)
Time (min)
II-80
II-110
II-160
II-200
II-195
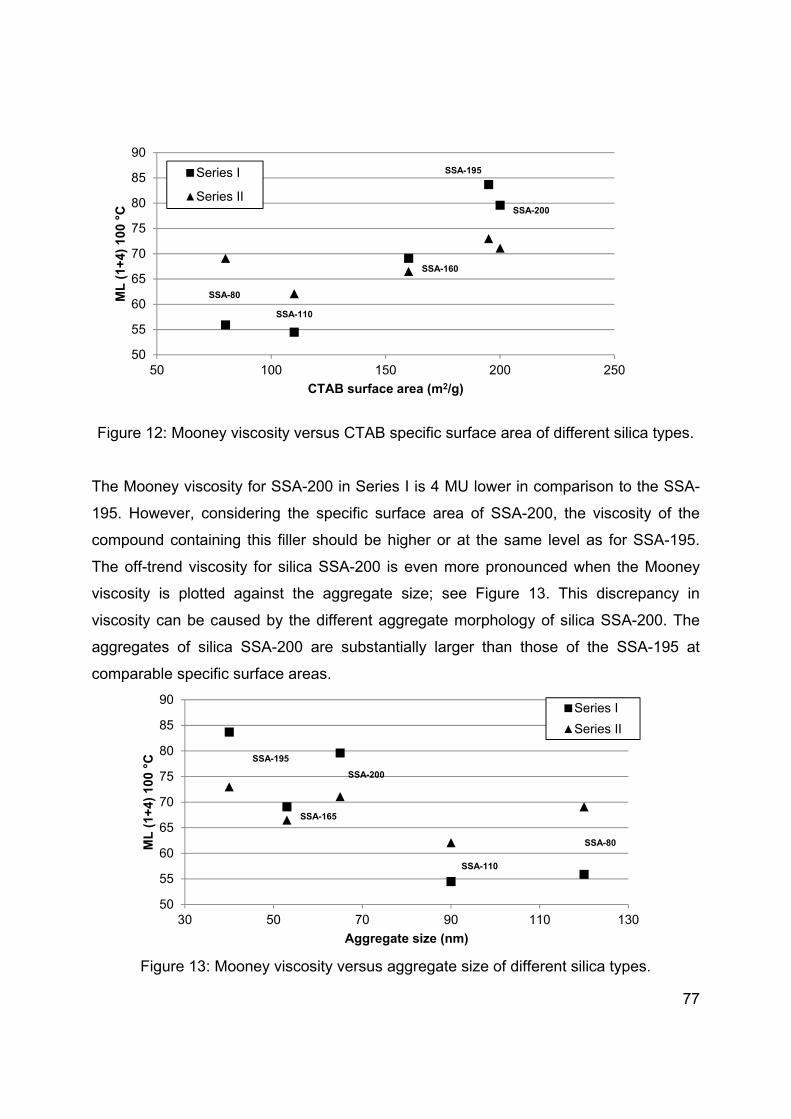
77
Figure 12: Mooney viscosity versus CTAB specific surface area of different silica types.
The Mooney viscosity for SSA-200 in Series I is 4 MU lower in comparison to the SSA-
195. However, considering the specific surface area of SSA-200, the viscosity of the
compound containing this filler should be higher or at the same level as for SSA-195.
The off-trend viscosity for silica SSA-200 is even more pronounced when the Mooney
viscosity is plotted against the aggregate size; see Figure 13. This discrepancy in
viscosity can be caused by the different aggregate morphology of silica SSA-200. The
aggregates of silica SSA-200 are substantially larger than those of the SSA-195 at
comparable specific surface areas.
Figure 13: Mooney viscosity versus aggregate size of different silica types.
SSA-80
SSA-110
SSA-160
SSA-200
SSA-195
50
55
60
65
70
75
80
85
90
50 100 150 200 250
ML
(1+
4) 1
00 °
C
CTAB surface area (m2/g)
Series I
Series II
SSA-80
SSA-110
SSA-165
SSA-200
SSA-195
50
55
60
65
70
75
80
85
90
30 50 70 90 110 130
ML
(1
+4)
100
°C
Aggregate size (nm)
Series I
Series II

78
Filler agglomerates are broken and dispersed in the rubber by mechanical mixing. The
more branched structure of silica SSA-200 shown in Figure 2 facilitates transfer of shear
forces during mixing. Therefore, a more effective disagglomeration and better dispersion
are obtained for the compounds containing SSA-200 in comparison with the silica
SSA-195: see Figure 14.
Figure 14: Dispersion of the compounds Series I.
3.3.3 Tensile properties
The tensile strength gives information about the strength of interactions between filler
particles and polymer chains at high deformation. An extreme example of this effect is
when the compound is filled with silica without using a coupling agent. When filler-
polymer interaction is low, the polymer chains adsorbed or entangled on the filler surface
slide on the filler surface under the influence of the applied load and are desorbed from
the filler surface. Molecular slippage of chains on the filler surface is also known for
carbon black filled elastomers [33,34]. At medium strain, the load is transferred via
polymer entanglements, and finally, when all entanglements are disentangled, the load
is transferred via the crosslinked polymer chains [35,36]. In such a case the fillers show
a relatively low reinforcing effect: tensile strength is low and elongation at break is high.
When the polymer chains are linked to the filler surface via covalent bonds, for instance
by a coupling agent, the elongation at break drops but the tensile strength increase,
because the molecular slippage phenomena are suppressed.
SSA-80SSA-110 SSA-160
SSA-195
SSA-200
70
75
80
85
90
95
100
50 100 150 200
Dis
per
sio
n (
%)
CTAB surface area (m2/g)
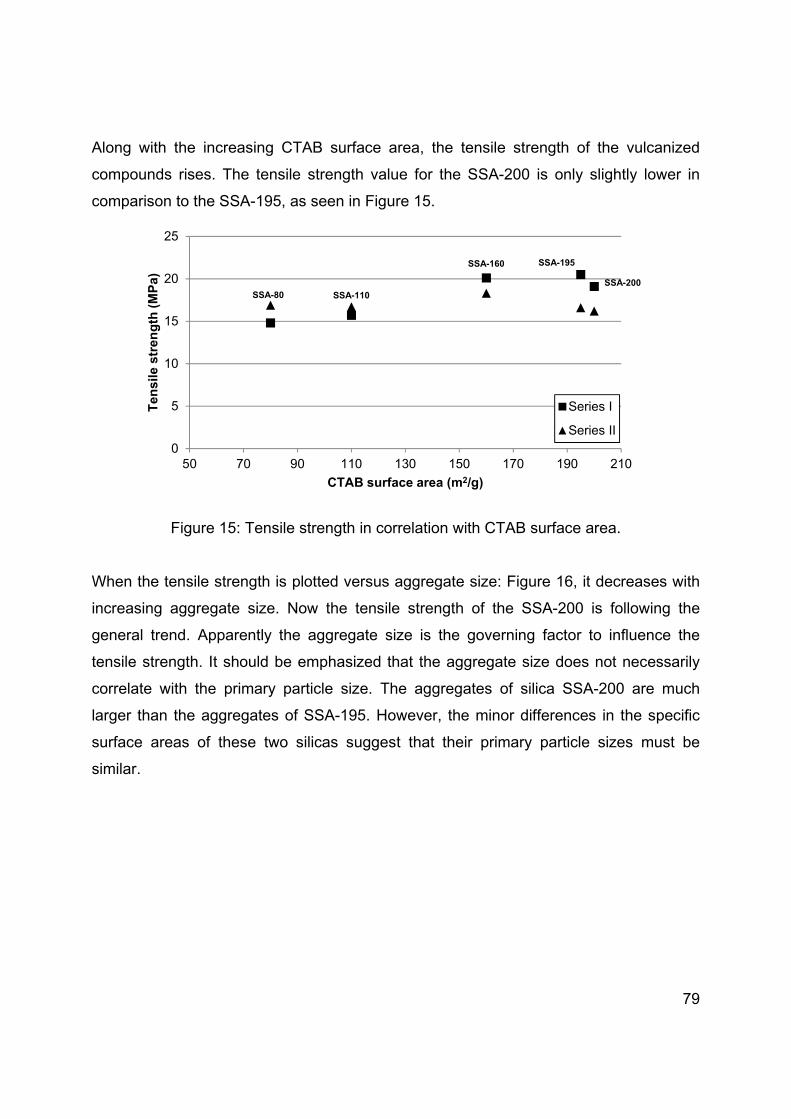
79
Along with the increasing CTAB surface area, the tensile strength of the vulcanized
compounds rises. The tensile strength value for the SSA-200 is only slightly lower in
comparison to the SSA-195, as seen in Figure 15.
Figure 15: Tensile strength in correlation with CTAB surface area.
When the tensile strength is plotted versus aggregate size: Figure 16, it decreases with
increasing aggregate size. Now the tensile strength of the SSA-200 is following the
general trend. Apparently the aggregate size is the governing factor to influence the
tensile strength. It should be emphasized that the aggregate size does not necessarily
correlate with the primary particle size. The aggregates of silica SSA-200 are much
larger than the aggregates of SSA-195. However, the minor differences in the specific
surface areas of these two silicas suggest that their primary particle sizes must be
similar.
SSA-80 SSA-110
SSA-160
SSA-200
SSA-195
0
5
10
15
20
25
50 70 90 110 130 150 170 190 210
Ten
sile
str
eng
th (
MP
a)
CTAB surface area (m2/g)
Series I
Series II

80
Figure 16: Tensile strength versus aggregate size.
For the series of batches in which the silica loading was adjusted to keep the hardness
at constant level, the tensile strength depends only slightly on the aggregate size or
specific surface area. Apart from silica loading, the tensile strength of the vulcanizates
therefore depends mainly on the aggregate size which determines the reinforcing
capabilities of the fillers.
The elongation at break is shown in Figure 17 and Figure 18. The general trend
becomes also more clear now: along with increasing surface area of the silica or
decreasing aggregate size, elongation at break increases. The value of the elongation at
break is more sensitive to the filler structure than the tensile strength.
SSA-80
SSA-110
SSA-160 SSA-200SSA-195
0
5
10
15
20
25
20 40 60 80 100 120
Te
nsi
le s
tre
ng
th (
MP
a)
Aggregate size (nm)
Series I
Series II
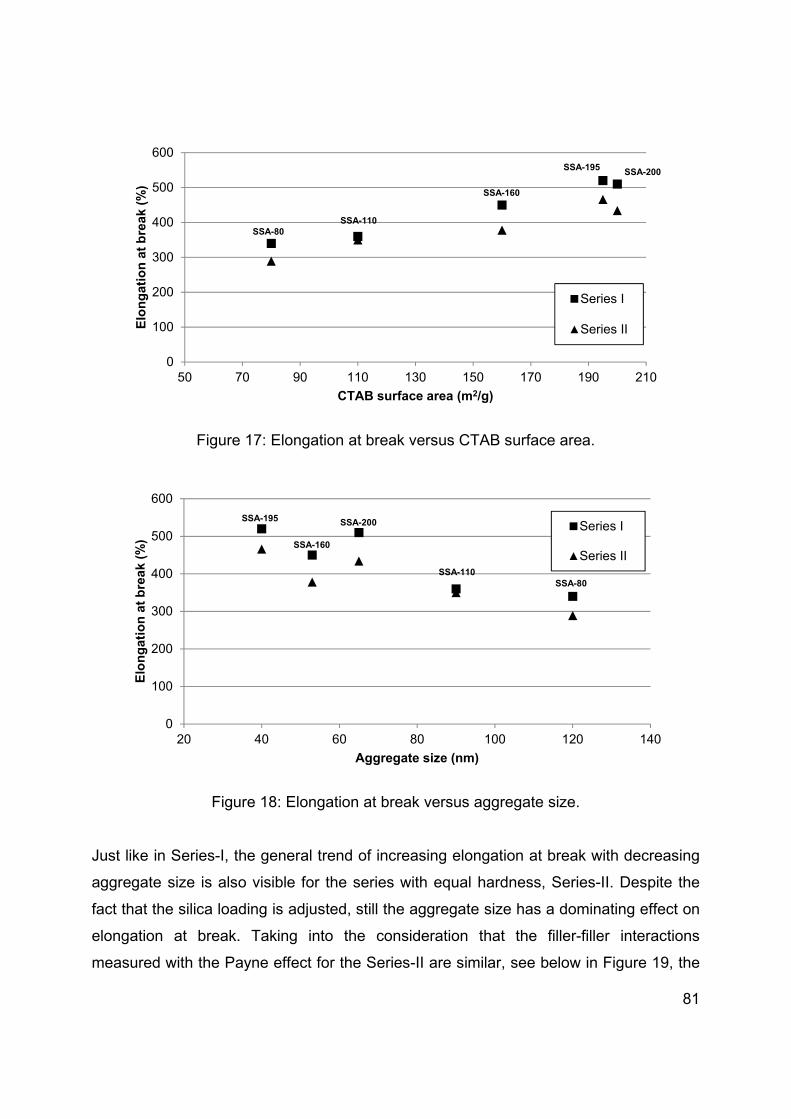
81
Figure 17: Elongation at break versus CTAB surface area.
Figure 18: Elongation at break versus aggregate size.
Just like in Series-I, the general trend of increasing elongation at break with decreasing
aggregate size is also visible for the series with equal hardness, Series-II. Despite the
fact that the silica loading is adjusted, still the aggregate size has a dominating effect on
elongation at break. Taking into the consideration that the filler-filler interactions
measured with the Payne effect for the Series-II are similar, see below in Figure 19, the
SSA-80SSA-110
SSA-160
SSA-200SSA-195
0
100
200
300
400
500
600
50 70 90 110 130 150 170 190 210
Elo
ng
atio
n a
t b
rea
k (%
)
CTAB surface area (m2/g)
Series I
Series II
SSA-80SSA-110
SSA-160
SSA-200SSA-195
0
100
200
300
400
500
600
20 40 60 80 100 120 140
Elo
ng
atio
n a
t b
rea
k (%
)
Aggregate size (nm)
Series I
Series II
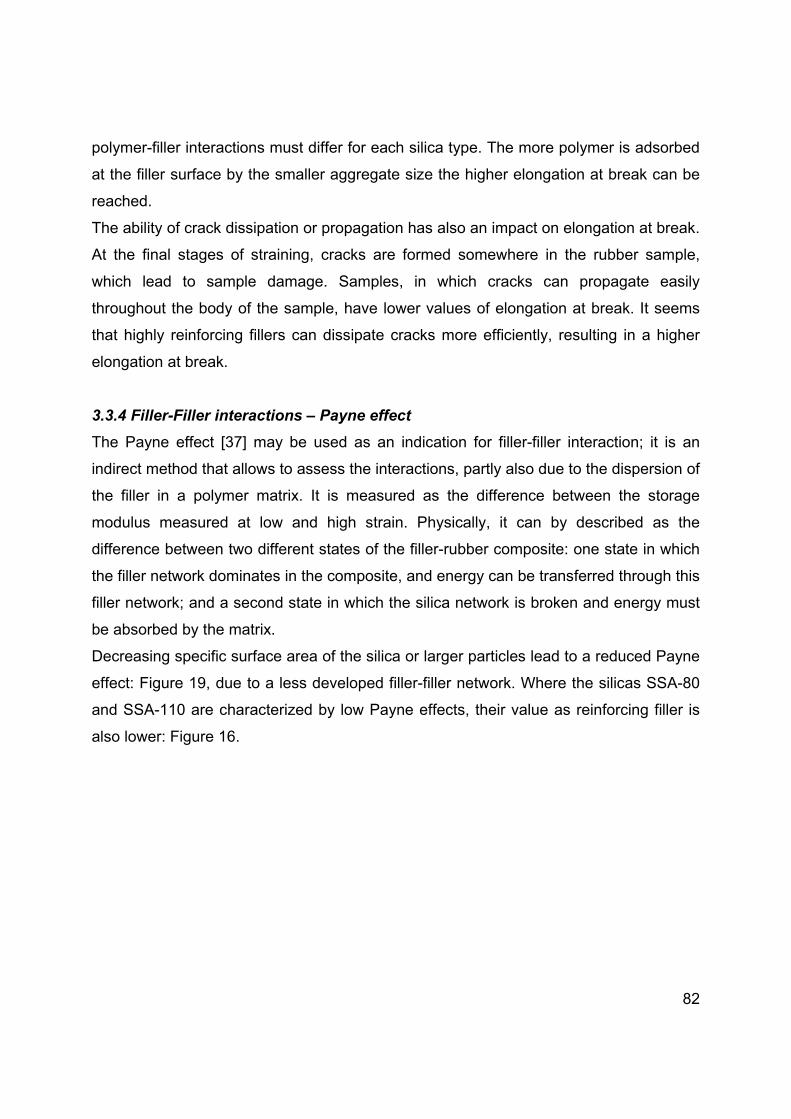
82
polymer-filler interactions must differ for each silica type. The more polymer is adsorbed
at the filler surface by the smaller aggregate size the higher elongation at break can be
reached.
The ability of crack dissipation or propagation has also an impact on elongation at break.
At the final stages of straining, cracks are formed somewhere in the rubber sample,
which lead to sample damage. Samples, in which cracks can propagate easily
throughout the body of the sample, have lower values of elongation at break. It seems
that highly reinforcing fillers can dissipate cracks more efficiently, resulting in a higher
elongation at break.
3.3.4 Filler-Filler interactions – Payne effect
The Payne effect [37] may be used as an indication for filler-filler interaction; it is an
indirect method that allows to assess the interactions, partly also due to the dispersion of
the filler in a polymer matrix. It is measured as the difference between the storage
modulus measured at low and high strain. Physically, it can by described as the
difference between two different states of the filler-rubber composite: one state in which
the filler network dominates in the composite, and energy can be transferred through this
filler network; and a second state in which the silica network is broken and energy must
be absorbed by the matrix.
Decreasing specific surface area of the silica or larger particles lead to a reduced Payne
effect: Figure 19, due to a less developed filler-filler network. Where the silicas SSA-80
and SSA-110 are characterized by low Payne effects, their value as reinforcing filler is
also lower: Figure 16.

83
Figure 19: Payne effect versus CTAB surface area Series I and II.
Again, aggregate size is a more appropriate parameter to plot the Payne effect than
CTAB specific surface area, as shown in Figure 19 and Figure 20. It is well known that
smaller particle fillers are more difficult to disperse because of the higher particle to
particle affinity. Adjustment of the silica loading in order to equalize the Shore A
hardness: Series II, causes also more or less equal values of the Payne effect for all
samples.
Figure 20: Payne effect versus aggregate size Series I and II.
SSA-80 SSA-110
SSA-160 SSA-200
SSA-195
0
200
400
600
800
1 000
1 200
1 400
1 600
1 800
2 000
50 70 90 110 130 150 170 190 210
G' 1%‐G' 90%(kPa)
CTAB surface area (m2/g)
Series I
Series II
SSA-80SSA-110
SSA-160SSA-200
SSA-195
0
200
400
600
800
1 000
1 200
1 400
1 600
1 800
2 000
20 40 60 80 100 120 140
G' 1%‐G' 90%(kPa)
Agreggate size (nm)
Series I
Series II

84
3.3.5. Hardness
In general, hardness of vulcanizates can be correlated with filler-filler interactions and
silica loading. For instance, in the extreme case of no coupling agent, thus low filler-
polymer and high filler-filler interactions, much higher hardness values are observed.
Introduction of coupling agent suppresses the filler-filler interactions and consequently
reduces the hardness.
With increasing dimensions of the silica aggregates, the hardness of the vulcanizates
decreases: Figure 21, Series-I. Adjustment of the silica loading in Series-II causes
equalization of the filler-filler interactions as well, see Figure 20.
Figure 21: Shore A hardness in relation to aggregate size.
3.3.6 Abrasion resistance
It is commonly accepted that there is inverse relation between the glass transition
temperature of a polymer matrix and abrasion resistance. DIN abrasion is expressed in
volume loss, and describes the ability of the rubber composite to resist tearing-off small
pieces of rubber from its surface by the sharp asperities of the counter surface. When
the same formulation is used, the abrasion represents the strength of polymer-filler
interactions: the stronger the interaction, the more difficult it is to break small particles
out of the rubber composite. Abrasion resistance turns out to be worse for larger
aggregate size, as shown in Figure 22.
SSA-80SSA-110SSA-160 SSA-200
SSA-195
0
10
20
30
40
50
60
70
80
30 50 70 90 110 130
ShA Hardness
Aggregate size (nm)
Series I
Series II
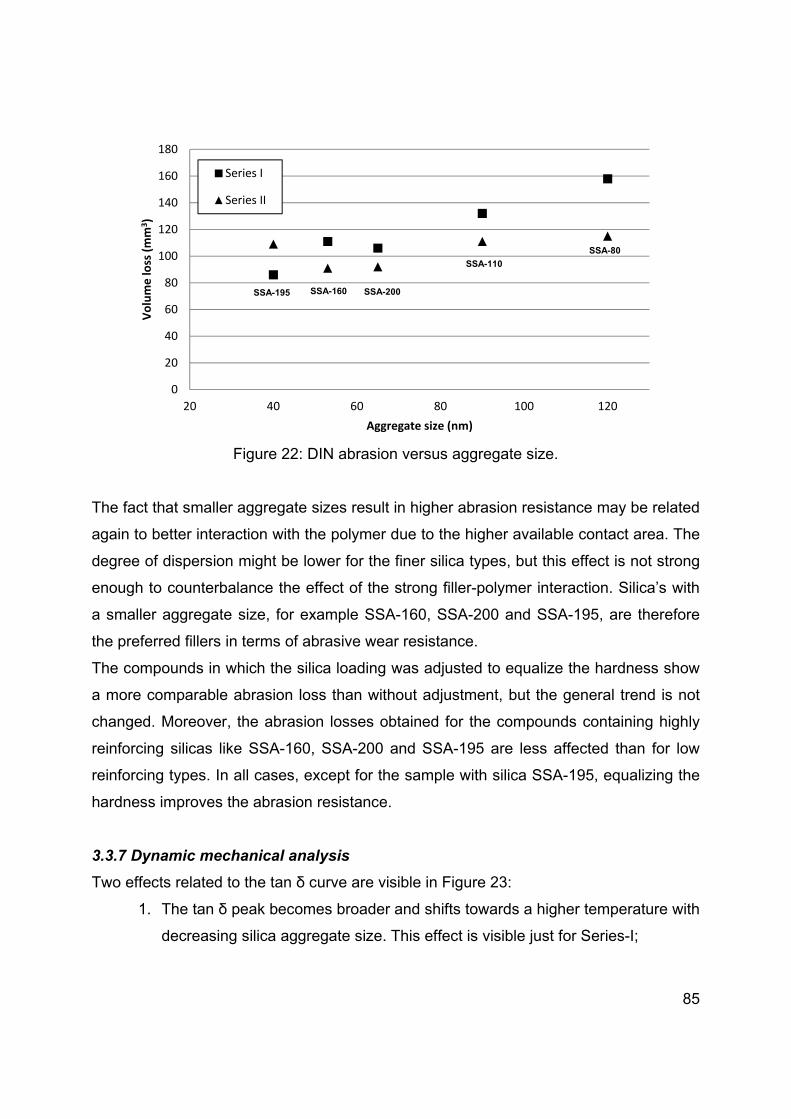
85
Figure 22: DIN abrasion versus aggregate size.
The fact that smaller aggregate sizes result in higher abrasion resistance may be related
again to better interaction with the polymer due to the higher available contact area. The
degree of dispersion might be lower for the finer silica types, but this effect is not strong
enough to counterbalance the effect of the strong filler-polymer interaction. Silica’s with
a smaller aggregate size, for example SSA-160, SSA-200 and SSA-195, are therefore
the preferred fillers in terms of abrasive wear resistance.
The compounds in which the silica loading was adjusted to equalize the hardness show
a more comparable abrasion loss than without adjustment, but the general trend is not
changed. Moreover, the abrasion losses obtained for the compounds containing highly
reinforcing silicas like SSA-160, SSA-200 and SSA-195 are less affected than for low
reinforcing types. In all cases, except for the sample with silica SSA-195, equalizing the
hardness improves the abrasion resistance.
3.3.7 Dynamic mechanical analysis
Two effects related to the tan δ curve are visible in Figure 23:
1. The tan δ peak becomes broader and shifts towards a higher temperature with
decreasing silica aggregate size. This effect is visible just for Series-I;
SSA-80
SSA-110
SSA-160 SSA-200SSA-195
0
20
40
60
80
100
120
140
160
180
20 40 60 80 100 120
Volume loss (mm
3)
Aggregate size (nm)
Series I
Series II

86
2. The height of the tan δ peak drops with decreasing aggregate size. This effect
occurs for both, Series-I and Series-II.
Decreasing dimensions of the silica aggregates lead to increased filler-filler and filler-
polymer interactions, which manifest themselves in a shift of the tan δ-curve towards
higher temperature. The tan δ-peak for the compounds with constant silica loading shifts
from -13 °C to -4 °C; see Table 6. It also shows that in particular the values of the loss
modulus (G’’) are decreasing with decreasing aggregate size, what suggests that the
polymer chain movements are more restricted with decreasing aggregate size. At this
moment, however, a clear conclusion is difficult to draw about which interactions: filler-
filler or filler-polymer, cause this effect because of the differences in the Payne effect for
Series-I. The adjustment of the silica loading in Series-II leads to similar Payne effects –
similar filler-filler interactions; see Figure 20. And in this case the tan δ-peak position is
remaining relatively stable at a value of ca. -11 °C. Therefore, the position of the tan δ-
peak on the temperature axis or its width is more related to the filler-filler and less to the
polymer-filler interactions.
The height of the tan δ-peak decreases when HDS are used both for the Series-I and
Series-II, which means less hysteresis of the compounds. For the Series-II, the values of
the storage modulus (G’) are also relatively constant and independent of the aggregate
size; see Table 6. However, the values of the loss modulus (G”) measured for Series-II
decrease with decreasing aggregate size. Consequently, the variations in the tan δ
maximum are here caused by differences in the polymer adsorption. The filler-filler
interactions measured for Series-II are similar, and therefore the changes in the tan δ
maximum are caused by the filler-polymer interactions which influence the polymer
movements at temperatures close to the glass transition of the polymer.
3.3.7.1 Tan δ at low temperatures: indicator of wet skid resistance
Values of tan δ in the temperature region from 0° C to 20 °C are generally taken as
indicator for the wet skid resistance of a tire tread. For the Series-I in which silica loading
was kept constant, it can be seen in Figure 23 that the tan δ-values for smaller
aggregate size are higher than the values for the compounds containing larger
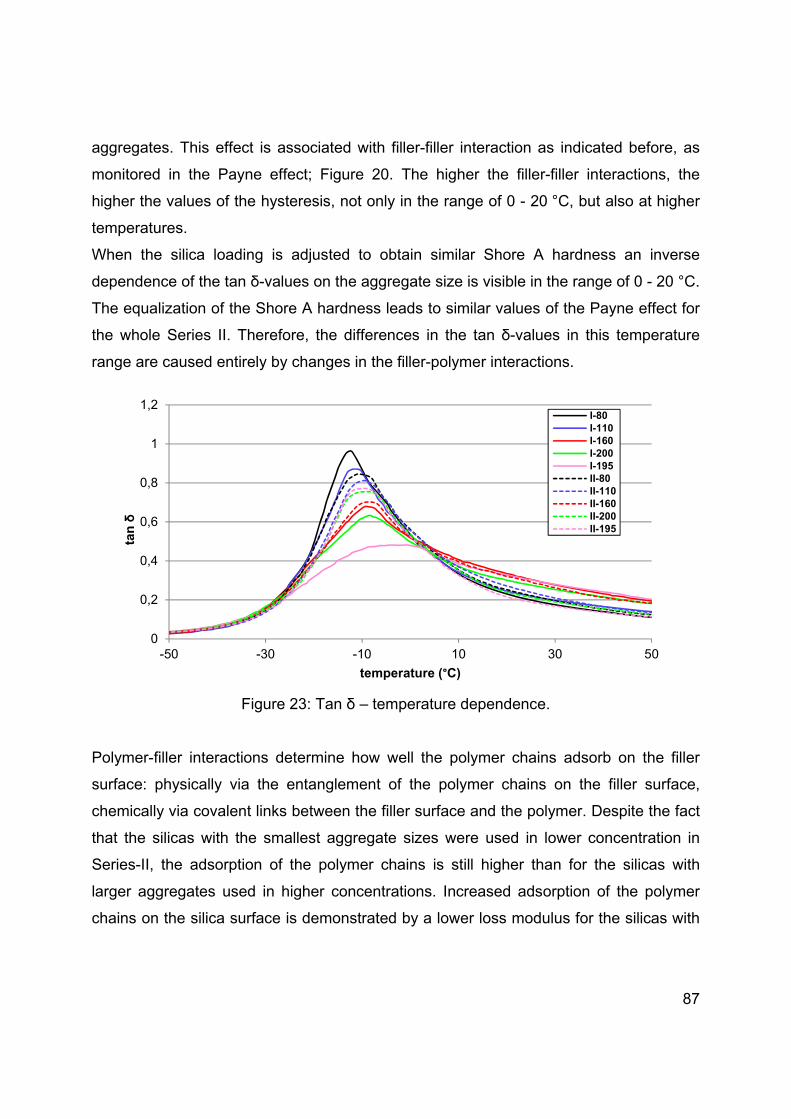
87
aggregates. This effect is associated with filler-filler interaction as indicated before, as
monitored in the Payne effect; Figure 20. The higher the filler-filler interactions, the
higher the values of the hysteresis, not only in the range of 0 - 20 °C, but also at higher
temperatures.
When the silica loading is adjusted to obtain similar Shore A hardness an inverse
dependence of the tan δ-values on the aggregate size is visible in the range of 0 - 20 °C.
The equalization of the Shore A hardness leads to similar values of the Payne effect for
the whole Series II. Therefore, the differences in the tan δ-values in this temperature
range are caused entirely by changes in the filler-polymer interactions.
Figure 23: Tan δ – temperature dependence.
Polymer-filler interactions determine how well the polymer chains adsorb on the filler
surface: physically via the entanglement of the polymer chains on the filler surface,
chemically via covalent links between the filler surface and the polymer. Despite the fact
that the silicas with the smallest aggregate sizes were used in lower concentration in
Series-II, the adsorption of the polymer chains is still higher than for the silicas with
larger aggregates used in higher concentrations. Increased adsorption of the polymer
chains on the silica surface is demonstrated by a lower loss modulus for the silicas with
0
0,2
0,4
0,6
0,8
1
1,2
-50 -30 -10 10 30 50
tan
δ
temperature (°C)
I-80I-110I-160I-200I-195II-80II-110II-160II-200II-195
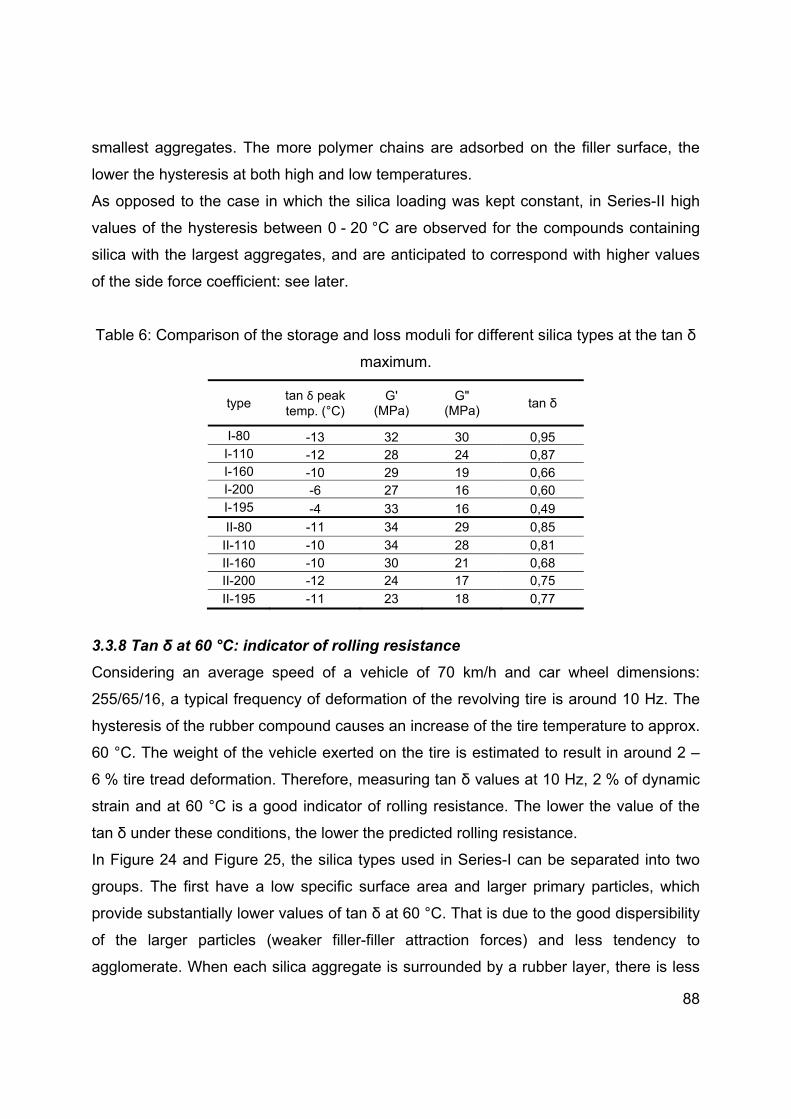
88
smallest aggregates. The more polymer chains are adsorbed on the filler surface, the
lower the hysteresis at both high and low temperatures.
As opposed to the case in which the silica loading was kept constant, in Series-II high
values of the hysteresis between 0 - 20 °C are observed for the compounds containing
silica with the largest aggregates, and are anticipated to correspond with higher values
of the side force coefficient: see later.
Table 6: Comparison of the storage and loss moduli for different silica types at the tan δ
maximum.
type tan δ peak temp. (°C)
G' (MPa)
G" (MPa)
tan δ
I-80 -13 32 30 0,95 I-110 -12 28 24 0,87 I-160 -10 29 19 0,66 I-200 -6 27 16 0,60 I-195 -4 33 16 0,49
II-80 -11 34 29 0,85
II-110 -10 34 28 0,81 II-160 -10 30 21 0,68 II-200 -12 24 17 0,75
II-195 -11 23 18 0,77
3.3.8 Tan δ at 60 °C: indicator of rolling resistance
Considering an average speed of a vehicle of 70 km/h and car wheel dimensions:
255/65/16, a typical frequency of deformation of the revolving tire is around 10 Hz. The
hysteresis of the rubber compound causes an increase of the tire temperature to approx.
60 °C. The weight of the vehicle exerted on the tire is estimated to result in around 2 –
6 % tire tread deformation. Therefore, measuring tan δ values at 10 Hz, 2 % of dynamic
strain and at 60 °C is a good indicator of rolling resistance. The lower the value of the
tan δ under these conditions, the lower the predicted rolling resistance.
In Figure 24 and Figure 25, the silica types used in Series-I can be separated into two
groups. The first have a low specific surface area and larger primary particles, which
provide substantially lower values of tan δ at 60 °C. That is due to the good dispersibility
of the larger particles (weaker filler-filler attraction forces) and less tendency to
agglomerate. When each silica aggregate is surrounded by a rubber layer, there is less

89
filler-filler friction and tendency to recombination of the filler network, thus lower
hysteresis.
Figure 24: Loss tangent at 60 °C versus CTAB specific surface area.
Figure 25: Loss tangent at 60 °C versus aggregate size.
The second group of silicas includs SSA-195, SSA-200 and SSA-160, which give
substantially higher values of tan δ at 60 °C caused by the higher specific surface areas
and smaller aggregate sizes. This leads to a more agglomerated filler in the polymer
matrix manifested in the Payne effect and gives more inter-particle friction during
dynamic deformation causing the energy loss.
SSA-80
SSA-110
SSA-160
SSA-200
SSA-195
0,060
0,080
0,100
0,120
0,140
0,160
0,180
70 90 110 130 150 170 190 210
Tan δ
CTAB surface area (m2/g)
Series I
Series II
SSA-80
SSA-110
SSA-160
SSA-200
SSA-195
0,060
0,080
0,100
0,120
0,140
0,160
0,180
20 40 60 80 100 120 140
Tan δ
Agreggate size (nm)
Series I
Series II
90
On the one hand, a decreased loading of the silicas SSA-200 (8 phr reduction) and
SSA-195 (15 phr reduction) in order to adjust the hardness causes a substantial drop of
the tan δ-values. On the other hand, increased loading of silicas with larger aggregates,
SSA-80 (35 phr increase) and SSA-110 (15 phr increase), does not cause significant
differences in comparison with constant loading of 80 phr. The dynamic properties of the
pure elastomer are the governing factors for the composite material based on this
elastomer. Reducing the amount of filler in the polymer matrix decreases the inter-
particle friction by increasing the distance between the silica aggregates, which brings
the hysteresis of the composite closer to the hysteresis of the pure elastomer.
Silica SSA-200 shows quite a different behavior compared to SSA-160 and SSA-195, as
the tan δ value at 60 °C is lower than expected from its specific surface area. However,
the reinforcing potential is still in the range of the highly reinforcing types of silica. This
difference between SSA-200 and the other highly reinforcing types of silica might be
explained by better dispersion of this silica type in comparison with the SSA-195, see
Figure 14. The dispersion level of SSA-200 is comparable with SSA-160 what explains
similar values of the tan δ value at 60 °C for the two silica types.
3.3.9 LAT 100 side force coefficient: wet skid resistance
Measurements were performed at different water temperatures; the results are shown in
Figure 26. Side force coefficient values increase with increasing surface area of silica.
Increasing surface area of silica leads to higher values of tan δ between 0 and 20 °C,
indicative of higher hysteresis. The ranking of the side force coefficient correlates
roughly with the tan δ between 0 and 20 °C. Higher values of tan δ stand for more
energy dissipation during wet skidding. Elastic material is sliding over the surface of a
relatively rough material: electro-corundum. Roughness of the disc surface causes
micro-scale deformations on the wheel sample surface. On the one hand the elastic
material which loses more energy during one deformation cycle will be characterized by
higher values of the side force coefficient. One the other hand, elastic material with
higher storage modulus (stiffer), will be also characterized by higher values of the side
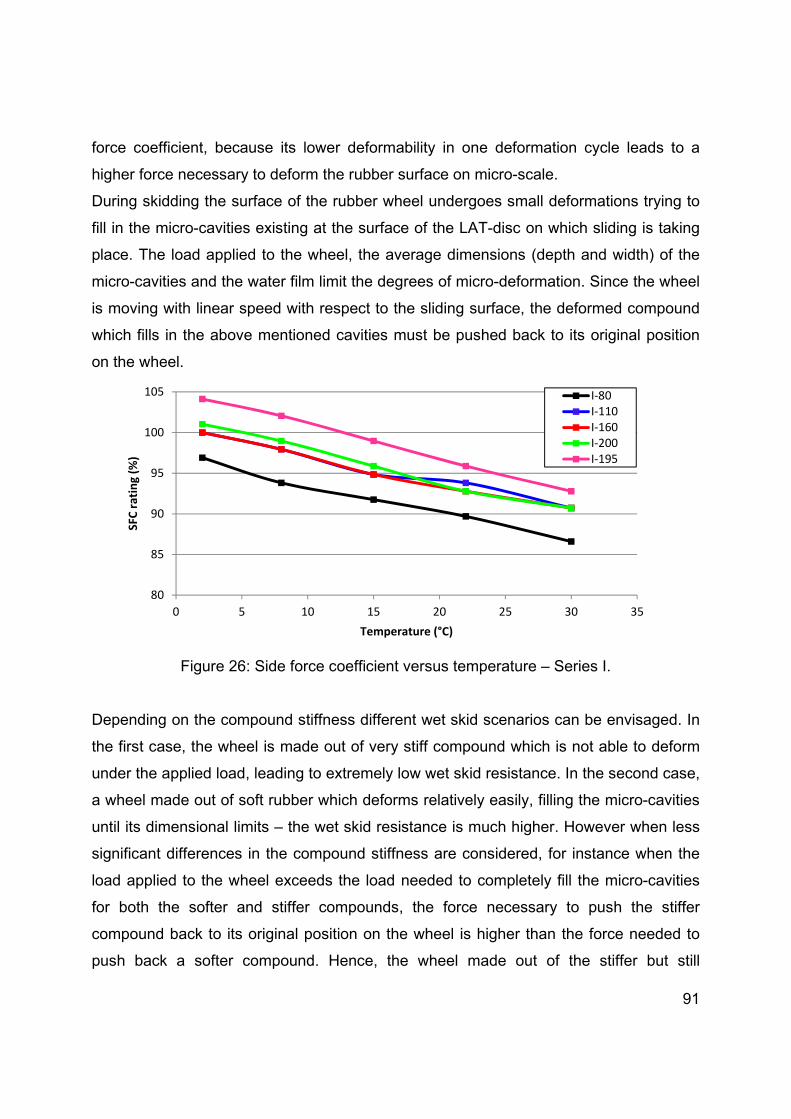
91
force coefficient, because its lower deformability in one deformation cycle leads to a
higher force necessary to deform the rubber surface on micro-scale.
During skidding the surface of the rubber wheel undergoes small deformations trying to
fill in the micro-cavities existing at the surface of the LAT-disc on which sliding is taking
place. The load applied to the wheel, the average dimensions (depth and width) of the
micro-cavities and the water film limit the degrees of micro-deformation. Since the wheel
is moving with linear speed with respect to the sliding surface, the deformed compound
which fills in the above mentioned cavities must be pushed back to its original position
on the wheel.
Figure 26: Side force coefficient versus temperature – Series I.
Depending on the compound stiffness different wet skid scenarios can be envisaged. In
the first case, the wheel is made out of very stiff compound which is not able to deform
under the applied load, leading to extremely low wet skid resistance. In the second case,
a wheel made out of soft rubber which deforms relatively easily, filling the micro-cavities
until its dimensional limits – the wet skid resistance is much higher. However when less
significant differences in the compound stiffness are considered, for instance when the
load applied to the wheel exceeds the load needed to completely fill the micro-cavities
for both the softer and stiffer compounds, the force necessary to push the stiffer
compound back to its original position on the wheel is higher than the force needed to
push back a softer compound. Hence, the wheel made out of the stiffer but still
80
85
90
95
100
105
0 5 10 15 20 25 30 35
SFC rating (%
)
Temperature (°C)
I‐80I‐110I‐160I‐200I‐195
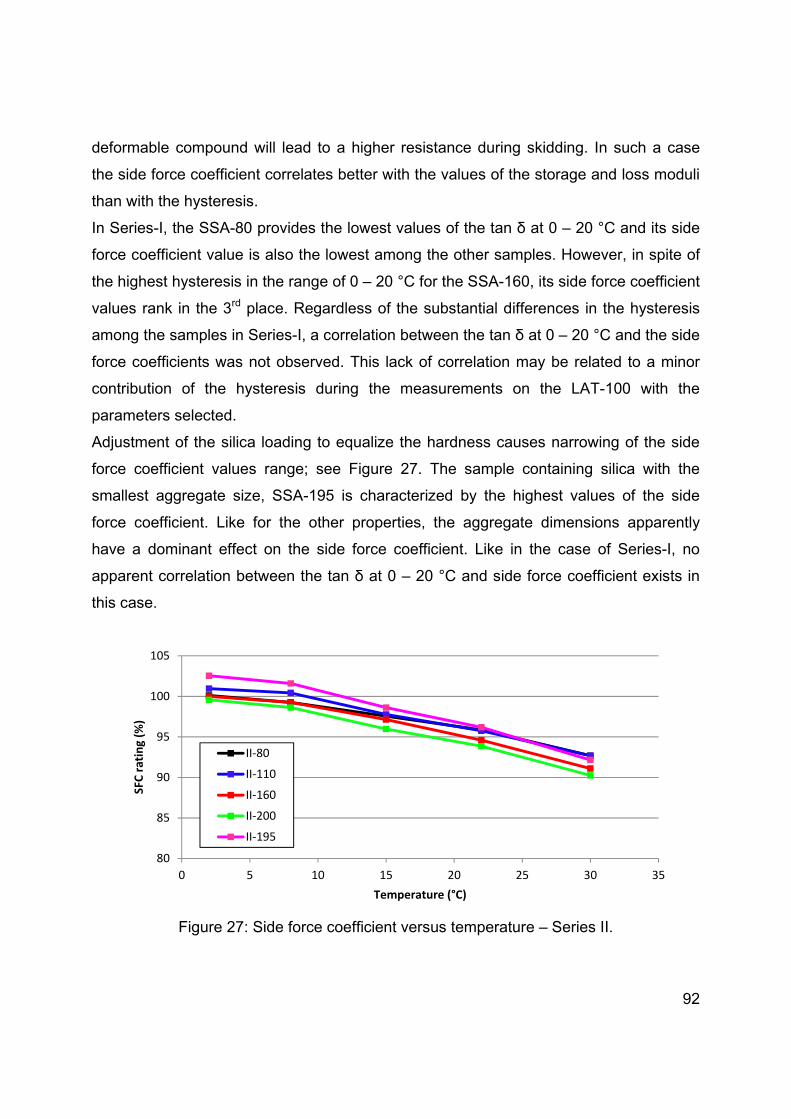
92
deformable compound will lead to a higher resistance during skidding. In such a case
the side force coefficient correlates better with the values of the storage and loss moduli
than with the hysteresis.
In Series-I, the SSA-80 provides the lowest values of the tan δ at 0 – 20 °C and its side
force coefficient value is also the lowest among the other samples. However, in spite of
the highest hysteresis in the range of 0 – 20 °C for the SSA-160, its side force coefficient
values rank in the 3rd place. Regardless of the substantial differences in the hysteresis
among the samples in Series-I, a correlation between the tan δ at 0 – 20 °C and the side
force coefficients was not observed. This lack of correlation may be related to a minor
contribution of the hysteresis during the measurements on the LAT-100 with the
parameters selected.
Adjustment of the silica loading to equalize the hardness causes narrowing of the side
force coefficient values range; see Figure 27. The sample containing silica with the
smallest aggregate size, SSA-195 is characterized by the highest values of the side
force coefficient. Like for the other properties, the aggregate dimensions apparently
have a dominant effect on the side force coefficient. Like in the case of Series-I, no
apparent correlation between the tan δ at 0 – 20 °C and side force coefficient exists in
this case.
Figure 27: Side force coefficient versus temperature – Series II.
80
85
90
95
100
105
0 5 10 15 20 25 30 35
SFC rating (%
)
Temperature (°C)
II‐80
II‐110
II‐160
II‐200
II‐195
93
Along with increasing temperature of the measurements, the values of the side force
coefficient decrease for all compounds, because the elasticity of rubber increases. More
elastic material loses less energy per deformation cycle, hence the side force
coefficients decrease.
3.4 CONCLUSIONS
Five types of silica, differing in specific CTAB surface area and aggregate size, were
tested in a passenger car tire compound. One of the silicas, SSA-200 is also
characterized by different structure – its aggregates are larger while the specific surface
are is similar to the SSA-195 type.
The silica types with smaller aggregate dimensions and larger specific surface
areas show a higher reinforcing effect, as illustrated by improved tensile
properties. However, the dispersibility of these silicas is more difficult compared
to the silica types with larger aggregates sizes. Compounds, in which SSA-195
was used, had superior tensile properties and the lowest loss modulus at lower
temperatures. This silica type also resulted in the highest values of the side force
coefficient, indicating best wet grip.
Adjustment of the silica loading in order to obtain similar hardness of the cured
compounds reverses the order of the dynamic curves. Silica with smallest
aggregates is still superior regarding side force coefficient. However, the trend
visible for constant silica loading has disappeared. This demonstrates that from
the view point of wet skid resistance, smaller aggregates sizes of fillers are better,
and that a higher aspect ratio of the fillers like in the case of SSA-200 type does
not improve the wet skid resistance.
Silicas with a larger aggregate sizes, SSA-80 and SSA-110 lead to low hysteresis
at high temperatures, but the low reinforcing effect makes them also less
appropriate as reinforcing filler for tire tread compounds.
The dynamic properties of materials containing highly reinforcing silica can be
further improved by using less filler, but the tensile properties will suffer in case of
SBR/BR used as polymer matrix. Furthermore, good dispersion of the nano-sized

94
aggregates is the key to obtain rubber composites with superior overall
properties.
With the selected measurement parameters for dynamic analysis and on the LAT-
100, no correlation of the hysteresis at 0 – 20 °C with the side force coefficient
was found for both series.
95
REFERENCES
[1] M. J. Wang, Rubber Chem. Technol.,71 (1998) 520. [2] M. J. Wang, Kautsch. Gummi Kunstst., 60 (2007) 438. [3] M. J. Wang, Kautsch. Gummi Kunstst., 61 (2008) 33. [4] M. Heinz, K.A. Grosch, 167th Technical meeting of the Rubber Division ACS, May
16 -18 2005, San Antonio, Texas, USA. [5] M. Heinz, J. Rubb. Res., 13 (2010) 91. [6] K. R. Grosch, Rubber Chem. Technol., 80 (2007) 379. [7] C. J. Derham, R. Newell and P. McL. Swift, NR Technology, 19 (1988) 1. [8] G. Heinrich, Kautsch. Gummi Kunstst., 45 (1992) 173. [9] G. Heinrich, N. Rennar, H. Dumler, Kautsch. Gummi Kunstst., 49 (1996) 32. [10] G. Heinrich, Rubber Chem. Technol.,70 (1997) 1. [11] M. Klüppel, G. Heinrich, Rubber Chem. Technol., 73 (2000) 578. [12] A. Müller, J. Schramm, M. Klüppel, Kautsch. Gummi Kunstst., 55 (2002) 432. [13] A. le Gal, M. Klüppel, J. Phys. Condens. Matter, 20 (2008) 1. [14] B. N. J. Persson, U. Tartaglino, E. Tosatti, O. Albohr, Kautsch. Gummi Kunstst.,
57 (2004) 532. [15] Y. Isono, T. Oyama, S. Kawahara, Adv. Tech. Mat. Proc. J. 5 (2003) 84. [16] S. Uhrlandt, A. Blume 161th Technical meeting of the Rubber Division ACS, April
29 - May 1, 2002, Savannah, Georgia, USA. [17] A. Blume, B. Freund, B. Schwaiger, M. Siray, S. Uhrlandt, EP0983966 A1 (2000), to Degussa-Hüls Aktiengesellschaft. [18] H.D. Luginsland, 161th Technical meeting of the Rubber Division ACS, April 29 - May 1, 2002, Savannah, Georgia, USA. [19] D.W. Schaefer, J. Appl. Crystallography 33 (2000) 587. [20] S. Brunauer, P.H. Emmet, E. Teller, J. Am. Chem. Soc. 59 (1936) 2682. [21] ASTM D 3765-02. [22] S. Uhrlandt, A. Blume, Rubber World 4 (2003) 43. [23] A. Wehmeier, O. Stenzel, 7th Fall Rubber Colloquium DIK, November 8 – 11
2006, Hannover, Germany.
[24] Leaflet Hi-Sil EZ 200G, PPG Industries. [25] S. L. Aggarwal, I. G. Hargis, R. A. Livigni, H. J. Fabris and L. F. Marker, “Advances in elastomers and rubber elasticity”. Plenum Press (1986) 17. [26] R. R. Rahalkar, Rubber Chem. Technol., 62 (1989) 246. [27] M. J. Wang, Kautsch. Gummi Kunstst., 61 (2008) 33. [28] M. Heinz, J. Rubb. Res., 13 (2010) 91. [29] K.R. Grosch, Rubber Chem. Technol., 80 (2007) 379. [30] P. Cochet, S. Daudey, L. Guy, Rhodia, Elastomer reinforced by precipitated silica
and their specific viscoelastic behaviour, IRC Mumbai (2010).

96
[31] L. Guy, Ph. Cochet, Y. Bomal , S. Daudey, Kautsch. Gummi Kunstst., 63 (2009) 383. [32] R. Rauline, European Patent No. EP0501227B1, (1992), to Michelin Co. [33] E. M. Dannenberg, Rubber Chem. Technol., 48 (1975) 410. [34] E. M. Dannenberg, Trans. Inst. Rubber Ind., 26 (1966) 42. [35] M. Kaliske, G. Heinrich, Rubber Chem. Technol., 72 (1999) 602. [36] D. F. Jones, L. R. G. Treloar, J. Phys. D: Appl. Phys., 8 (1975) 1285. [37] A. R. Payne, J. Appl. Polym. Sci., 6 (1962) 57.


97
Chapter 4
Influence of physical and chemical polymer-
filler bonds on tire wet-traction performance
indicators for passenger car tire tread materials
The rubber compound used for a tire tread is a composite material of which the dynamic
properties can be adjusted over a relatively broad range by modification of the polymer-
filler interaction. For silica–reinforced compounds, control over the polymer-filler
interaction is realized by chemical coupling of the silica to the rubber by applying
different silane coupling agents. Different molecular structures can be obtained which
lead to changes in macroscopic material properties including wet skid resistance. The
understanding of one of the influencing factors, the polymer-filler interaction, helps to
answer the key question: Which type of polymer-silica bonds govern wet skid
phenomena: weak (physical) or strong (chemical) bonds?
98
4.1 INTRODUCTION
The goal of the present study is to characterize the underlying mechanisms involved in
rubber-filler interactions for the wet skid resistance of silica-reinforced tire treads, a
dynamic viscoelastic phenomenon. The use of silica instead of carbon black has proven
to be of great importance for the reinforcement of rubbers designed for tire treads,
because of the corresponding much lower rolling resistance of tires made thereof. To
characterize the dynamic properties of rubber, storage and loss moduli are commonly
measured. The ratio of loss to storage modulus is indicated as the loss tangent (tan δ),
frequently used to characterize tire performance on small, laboratory scale [1,2,3]
Apart from the rolling resistance improvement, the wet skid or traction performance of
tire treads is an important safety and performance criterion. The friction, traction or skid
resistance, in dry and wet conditions, of tire treads on various surfaces has already been
subject of numerous experimental and modeling studies: Wang [3,4,5], Heinz and
Grosch [6,7,8], Derham [9], Heinrich et al. [10,11,12], Klüppel and Heinrich [13], Müller
et al. [14], Le Gal and Klüppel [15], Persson et al. [16], Isono et al. [17]. The focus of the
present study is on the effect of the silane coupling agent used for the rubber-silica
interfacial bonding on wet skid resistance. A first approach towards influencing the
rubber-filler interaction could be based on inducing chemical interactions between the
silica and polymer, that might lead to improvement of wet skid resistance by raising the
tan δ values in the low temperature region (0 – 20 ºC) and decreasing the same in the
higher temperature region. Based on the time-temperature superposition, increased
hysteresis at lower temperatures and frequencies should increase energy dissipation at
higher frequencies and temperatures, occurring during wet and dry skidding. An
opposite approach would be that the filler-polymer interaction should be limited,
ultimately to physical interactions. Physical interactions mean that under the influence of
energy resulting from skidding, polymer molecules can easily be displaced on the filler
surface, which should increase energy dissipation. These two approaches are clearly
each others opposite and it is not a priori obvious which of the two approaches is the
best.
The influence of the silica-polymer interaction on wet skid performance is investigated by
testing the dynamic properties, the tan δ in the temperature range from 0 – 20 °C at 10

99
Hz. The values of the loss angle in this temperature range are so far considered to be
the most suitable indicators for the wet skid performance of a tire tread [10,18,19]. To
assess the influence of silica-polymer interactions on the wet skid and other physical
properties of the tire tread compounds, two cases are investigated. In the first case,
silica-polymer interactions are aimed for to be mostly chemical of nature, inducing a
strong and rigid interface. In the second case the interactions aimed for shall be limited
to mostly physical – weak interactions. In order to check a more practical value of the
wet skid resistance, additional measurements on a Laboratory Abrasion Tester 100 (LAT
100) are performed in the final stage of this investigation.
4.2 EXPERIMENTAL
4.2.1 Materials and compound formulations
Two silane coupling agents are applied to achieve the two opposite effects in rubber-
filler interaction. Bis(3-triethoxysilylpropyl)tetrasulfane (TESPT, Evonik, Germany) was
chosen as a silane which can react directly with silica and unsaturated polymers for a
strong silica-polymer interaction, and 1,6-bis-(triethoxysilyl)hexane (TESH) which
possesses a similar molecular structure as TESPT, however it does not have sulfur
atoms which makes it inert towards reaction with the polymers. The TESH was
synthetized according to the procedure described by Reuvekamp et al. [20]. The
products structure and purity was determined with an LC-MS analyzer (Agilent-
1100/Bruker-Esquire 3000 Plus). A product with purity of 96 % was obtained. The mass
calculated for C18H42O6Si2H+ was 411.25; found 411.26. The refractive index of the
product at 25 °C was 1.4184. The chemical structures of both silanes are shown in
Figure 1. The experiments were performed using a formulation based on the well-known
Green Tire concept [21] as given in Table 1. A blend of styrene-butadiene rubber 37,5
phr oil-extended (Buna VSL 5025-2 HM, Lanxess, Germany), with high-cis butadiene
rubber (Kumho KBR 01, S-Korea) was used as elastomer base. Silica Zeosil 1165 MP
(Rhodia Silices, France) was chosen as filler. Four compounds containing TESPT in
varying amounts and a same number of compounds containing corresponding equimolar
amounts of TESH were prepared.

100
Figure 1: Bis-(3-triethoxysilylpropyl)tetrasulfane, MW = 532 g/mol (upper) and 1,6-bis-(triethoxysilyl)hexane MW = 410 g/mol (lower).
The TESPT content was adjusted for the first compound according to the
cetyltrimethylammonium bromide (CTAB) surface area of the silica type by using the
empirical equation proposed by L. Guy et al. [22]: Equation 1. The amount of free sulfur
added with the curatives was adjusted to keep the total molar amount including the
sulfur contained in the coupling agent at a constant level in all batches.
silicasilica phrCTABphrTESPT )()(103.5)( 4
(Equation 1)
Table 1. Compounds formulations.
Compound name TESPT
7 TESPT
9.5 TESPT
12.0 TESPT
14.4 TESH
5.3 TESH
7.3 TESH
9.3 TESH 11.3
SSBR 103 103 103 103 103 103 103 103
BR 25 25 25 25 25 25 25 25
Silica 80 80 80 80 80 80 80 80
Coupling agent
phr 7 9,5 12 14,4 5,3 7,3 9,3 11,3 mol 0,013 0,018 0,023 0,028 0,013 0,018 0,023 0,028
Processing oil 5 5 5 5 5 5 5 5
ZnO 2,5 2,5 2,5 2,5 2,5 2,5 2,5 2,5
Stearic acid 2,5 2,5 2,5 2,5 2,5 2,5 2,5 2,5
Sulphur 1,4 0,8 0,24 0 3,1 3,1 3,1 3,1
TBBS 1,7 1,7 1,7 1,7 1,7 1,7 1,7 1,7
DPG 2 2 2 2 2 2 2 2

101
4.2.2 Mixing and curing
To prepare the compounds, an internal laboratory mixer Brabender 350 S with mixing
volume of 390 cm3 was used. The mixing procedure is specified in Table 2. The total
volume of the batches was adjusted to a fill factor of 70 %. Preparation of sheets for
testing was done on a Schwabentan Polymix 80T 300 ml two roll mill.
Table 2. Mixing procedure.
Stage I
Rotor speed: 110 RPM Initial temp.:50 °C
Timing Ingredient (Min. sec.)
0.00 Add polymers 1.00 Add ½ silica, ½ silane, ZnO + Stearic acid 2.30 Add ½ silica, ½ silane, Oil, TMQ, 6PPD 3.00 Sweep 4.00 Dump @ ~ 155 °C
Stage II
Rotor speed: 130 RPM Initial temp.:50 °C
Timing Ingredient (Min. sec.)
0.00 Add I stage batch 3.00 Dump @ ~ 155 °C
III stage
Mixing of the curatives was performed on a two roll mill
Vulcanization of the sheeted samples for tensile tests was performed on a Wickert
laboratory press WLP 1600/5*4/3 at 160 °C and 100 bars pressure for a curing time 1.2
x t90 obtained from a Rubber Process Analyzer (RPA 2000, Alpha Technologies, USA)
rheometer measurements according to ISO 6502. The samples for hardness tests were
prepared in cylindrical moulds and cured for a period of twice the t90 - time. The samples
for DIN abrasion tests were also cured for 1.2 x t90. The adjustment of the curing times
was necessary due to the large thickness of the samples and the generally well known
low thermal conductivity of the rubber compounds.

102
4.2.3 Characterizations
The Mooney viscosities ML(1+4) of the compounds were measured at 100 °C on a
Mooney viscometer MV 2000E (Alpha Technologies) according to ISO 289-1.
In order to estimate the chemical and physical polymer – filler interactions, bound rubber
tests were performed. These tests were done by immersing approximately 0.2 g of the
uncured compound in 60 ml of toluene for 7 days to obtain equilibrium swelling.
Additionally, to separate physically from chemically bound rubber, the immersion was
done in an ammonia atmosphere. The mass of the samples before and after the test
was used to calculate the bound rubber [23,24,25].
Payne effect measurements were done by using the RPA 2000 after prior vulcanization
for 1.2 x t90 at 160 °C in the RPA. In order to estimate the Payne effect, the values of the
storage modulus at 0,56 % strain and 100 % strain were measured at 100 °C and a
frequency of 0.5 Hz.
The apparent crosslink density and distribution were measured by the swelling
experiments done in toluene according to Schotman and Datta, Ellis and Moore
[26,27,28]. The test sheets were cut to obtain appropriate test pieces. Propanethiol in
combination with piperidine was used to characterize polysulphidic crosslinks,
hexanethiol in combination with piperidine was used to characterize the poly- and di-
sulphidic crosslinks. In order to reduce the measurement error the determinations were
done in twofold.
Mechanical properties of the samples were tested using a Zwick Z020 tensile tester
according to ISO-37 at crosshead speed of 500 mm/min.
Abrasion resistance was measured with a DIN – abrader according to method A of DIN
53516. The weight loss was measured and recalculated to a volume loss for each
sample.
Tear resistance was measured using a Zwick Z020 tensile tester on Delft type samples
at a crosshead speed of 500 mm/min.
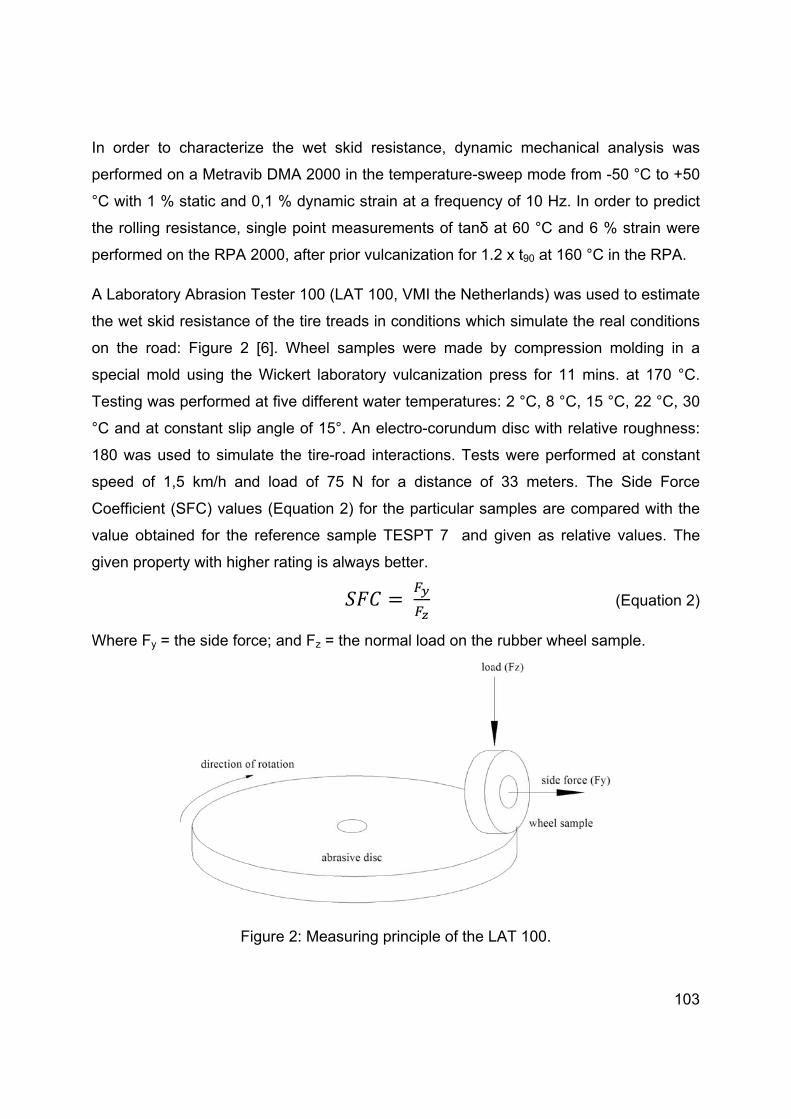
In orde
perform
°C with
the rolli
perform
A Labo
the wet
on the
special
Testing
°C and
180 wa
speed
Coeffici
value o
given p
Where
er to chara
med on a M
1 % static
ing resista
med on the
ratory Abra
t skid resis
road: Figu
mold usin
g was perfo
at constan
as used to
of 1,5 km
ient (SFC)
obtained fo
roperty wit
Fy = the sid
acterize th
Metravib DM
c and 0,1 %
nce, single
RPA 2000
asion Teste
tance of th
ure 2 [6].
ng the Wic
ormed at fiv
nt slip ang
simulate t
m/h and loa
values (E
or the refer
th higher ra
de force; a
Figure
he wet ski
MA 2000 in
% dynamic
e point me
0, after prio
er 100 (LA
he tire trea
Wheel sa
ckert labora
ve differen
le of 15°. A
the tire-roa
ad of 75
Equation 2)
rence sam
ating is alw
and Fz = the
e 2: Measu
d resistan
n the tempe
c strain at a
asurement
or vulcaniza
AT 100, VM
ds in cond
mples wer
atory vulca
t water tem
An electro-
ad interacti
N for a d
for the pa
mple TESP
ways better
e normal lo
ring princip
nce, dynam
erature-sw
a frequenc
ts of tanδ a
ation for 1.2
MI the Nethe
itions whic
re made b
anization p
mperatures
-corundum
ions. Tests
istance of
articular sa
T 7 and
r.
oad on the
ple of the L
mic mecha
weep mode
cy of 10 Hz
at 60 °C a
2 x t90 at 1
erlands) w
ch simulate
by compre
press for 1
s: 2 °C, 8 °
m disc with
s were per
33 meter
amples are
given as r
rubber wh
LAT 100.
anical anal
e from -50 °
z. In order t
and 6 % st
60 °C in th
as used to
e the real c
ession mold
1 mins. at
C, 15 °C, 2
relative ro
rformed at
rs. The Sid
compared
relative val
(Eq
heel sample
103
lysis was
°C to +50
to predict
rain were
he RPA.
o estimate
conditions
ding in a
t 170 °C.
22 °C, 30
oughness:
constant
de Force
d with the
lues. The
quation 2)
e.

104
4.3 RESULTS AND DISCUSSION
4.3.1 Mooney viscosities
The Mooney viscosities of the batches containing equimolar amounts of TESH and
TESPT silanes are shown in Figure 3. Higher concentrations of both TESH and TESPT
cause a decrease in Mooney viscosity. The effect is more evident in the case of TESH
than for TESPT. The increase in Mooney viscosity of the batch containing 14.4 phr of
TESPT is most probably caused by a slight scorch during mixing. Both silanes are
reactive towards the silica surface and after silanization their distribution between
polymer and filler phase in not homogenous. The largest amount of coupling agent
molecules is concentrated on the surface of the silica. Condensation of silane as a side
reaction due to increased concentrations of the silanes can cause formation of a thicker
layer of partially polymerized silane on the surface of the silica [29]. This thicker layer
could act as an interface lubricant which facilitates movement of filler particles in the
polymer matrix and consequently decreases the viscosity.
Figure 3: Mooney viscosities of the batches.
4.3.2 Bound rubber
These test results shown in Figure 4 clearly show the differences in polymer-filler
interactions before vulcanization for the compounds containing TESH and TESPT. The
compounds containing TESH silane dissolve completely in the presence of the ammonia
atmosphere, indicating that all rubber-filler interactions in this still unvulcanized state are
0
20
40
60
80
100
0,013 0,018 0,023 0,028
ML (1+4) 100 °C
TESH and TESPT amount (mol/80 phr of silica)
TESH
TESPT
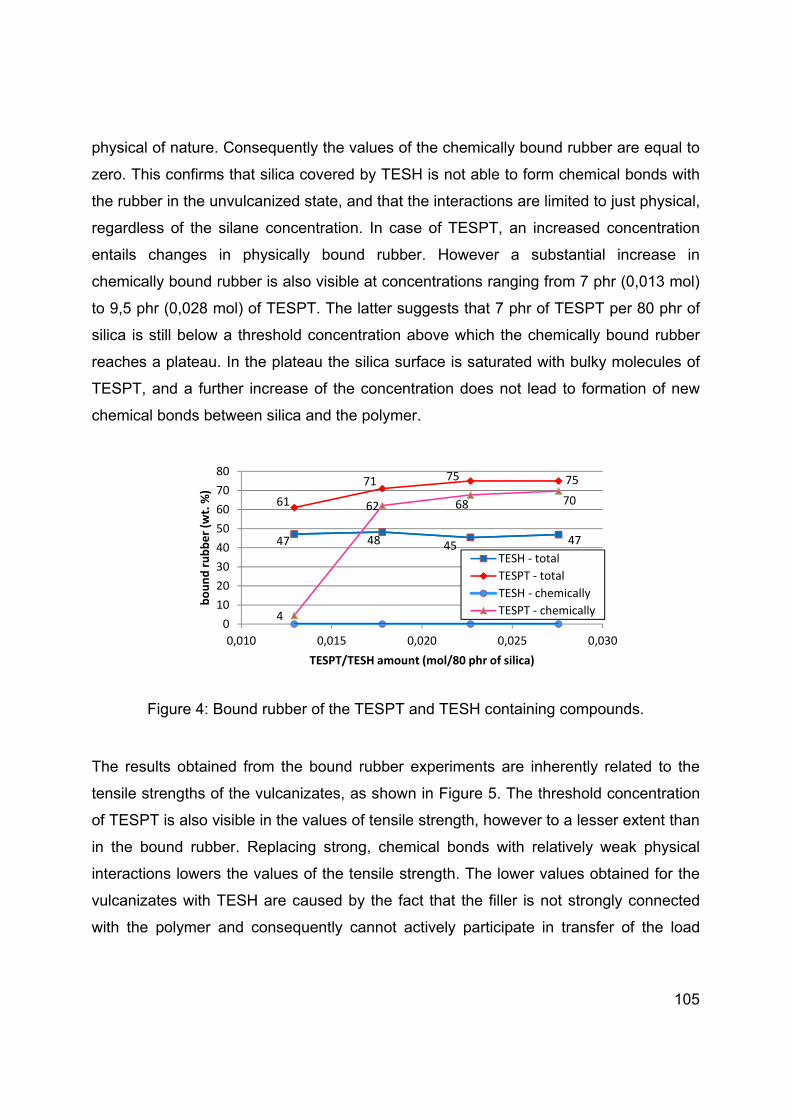
105
physical of nature. Consequently the values of the chemically bound rubber are equal to
zero. This confirms that silica covered by TESH is not able to form chemical bonds with
the rubber in the unvulcanized state, and that the interactions are limited to just physical,
regardless of the silane concentration. In case of TESPT, an increased concentration
entails changes in physically bound rubber. However a substantial increase in
chemically bound rubber is also visible at concentrations ranging from 7 phr (0,013 mol)
to 9,5 phr (0,028 mol) of TESPT. The latter suggests that 7 phr of TESPT per 80 phr of
silica is still below a threshold concentration above which the chemically bound rubber
reaches a plateau. In the plateau the silica surface is saturated with bulky molecules of
TESPT, and a further increase of the concentration does not lead to formation of new
chemical bonds between silica and the polymer.
Figure 4: Bound rubber of the TESPT and TESH containing compounds.
The results obtained from the bound rubber experiments are inherently related to the
tensile strengths of the vulcanizates, as shown in Figure 5. The threshold concentration
of TESPT is also visible in the values of tensile strength, however to a lesser extent than
in the bound rubber. Replacing strong, chemical bonds with relatively weak physical
interactions lowers the values of the tensile strength. The lower values obtained for the
vulcanizates with TESH are caused by the fact that the filler is not strongly connected
with the polymer and consequently cannot actively participate in transfer of the load
47 48 45 47
61
71 75 75
4
62 68 70
0
10
20
30
40
50
60
70
80
0,010 0,015 0,020 0,025 0,030
bound rubber (w
t. %)
TESPT/TESH amount (mol/80 phr of silica)
TESH ‐ total
TESPT ‐ total
TESH ‐ chemically
TESPT ‐ chemically
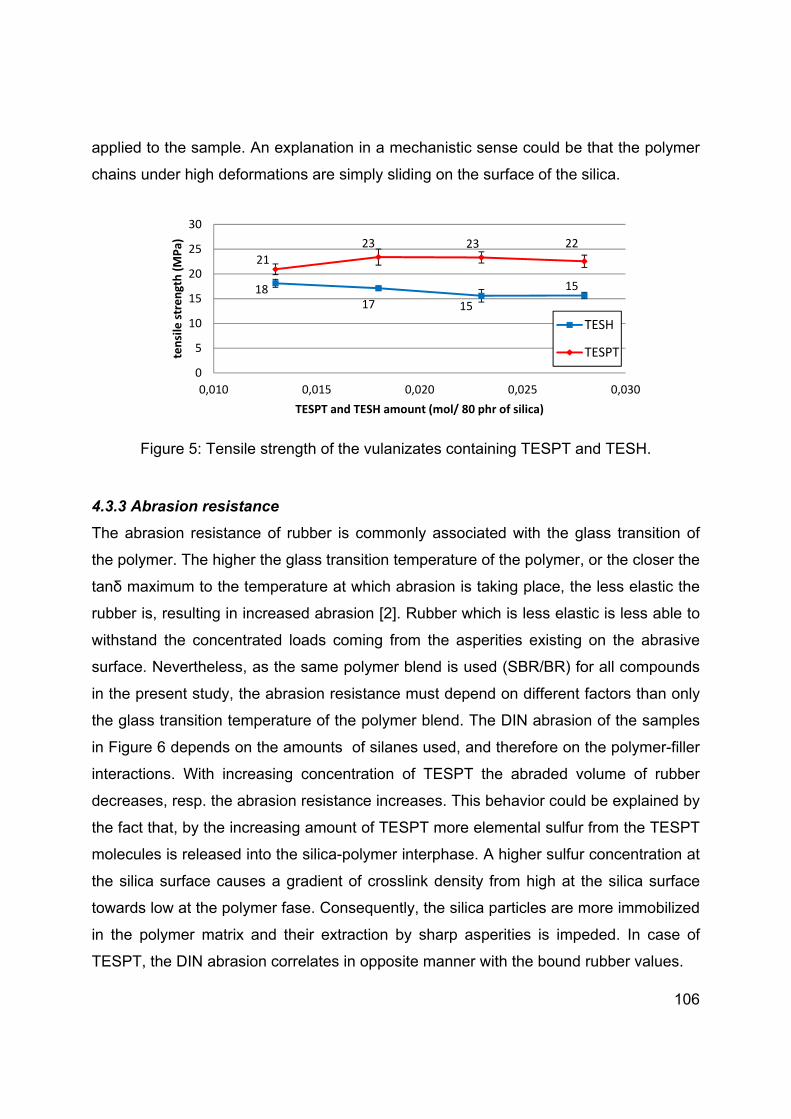
106
applied to the sample. An explanation in a mechanistic sense could be that the polymer
chains under high deformations are simply sliding on the surface of the silica.
Figure 5: Tensile strength of the vulanizates containing TESPT and TESH.
4.3.3 Abrasion resistance
The abrasion resistance of rubber is commonly associated with the glass transition of
the polymer. The higher the glass transition temperature of the polymer, or the closer the
tanδ maximum to the temperature at which abrasion is taking place, the less elastic the
rubber is, resulting in increased abrasion [2]. Rubber which is less elastic is less able to
withstand the concentrated loads coming from the asperities existing on the abrasive
surface. Nevertheless, as the same polymer blend is used (SBR/BR) for all compounds
in the present study, the abrasion resistance must depend on different factors than only
the glass transition temperature of the polymer blend. The DIN abrasion of the samples
in Figure 6 depends on the amounts of silanes used, and therefore on the polymer-filler
interactions. With increasing concentration of TESPT the abraded volume of rubber
decreases, resp. the abrasion resistance increases. This behavior could be explained by
the fact that, by the increasing amount of TESPT more elemental sulfur from the TESPT
molecules is released into the silica-polymer interphase. A higher sulfur concentration at
the silica surface causes a gradient of crosslink density from high at the silica surface
towards low at the polymer fase. Consequently, the silica particles are more immobilized
in the polymer matrix and their extraction by sharp asperities is impeded. In case of
TESPT, the DIN abrasion correlates in opposite manner with the bound rubber values.
1817 15
15
21
23 23 22
0
5
10
15
20
25
30
0,010 0,015 0,020 0,025 0,030
tensile strength (MPa)
TESPT and TESH amount (mol/ 80 phr of silica)
TESH
TESPT
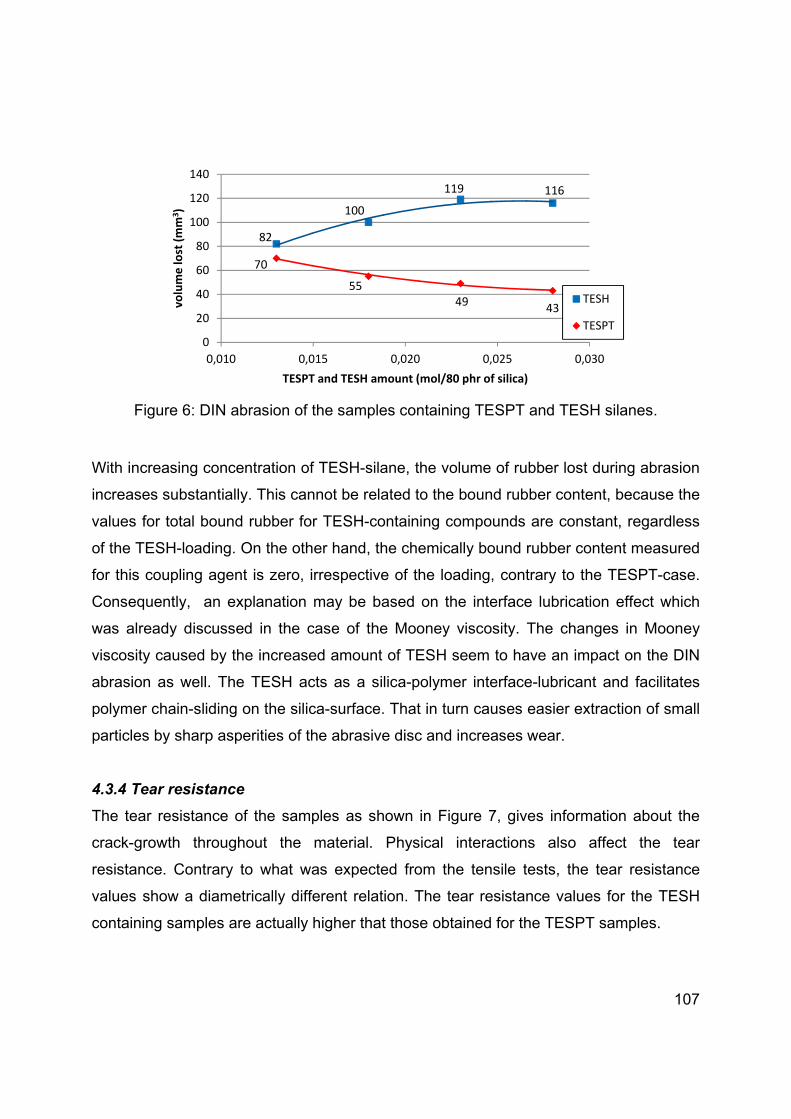
107
Figure 6: DIN abrasion of the samples containing TESPT and TESH silanes.
With increasing concentration of TESH-silane, the volume of rubber lost during abrasion
increases substantially. This cannot be related to the bound rubber content, because the
values for total bound rubber for TESH-containing compounds are constant, regardless
of the TESH-loading. On the other hand, the chemically bound rubber content measured
for this coupling agent is zero, irrespective of the loading, contrary to the TESPT-case.
Consequently, an explanation may be based on the interface lubrication effect which
was already discussed in the case of the Mooney viscosity. The changes in Mooney
viscosity caused by the increased amount of TESH seem to have an impact on the DIN
abrasion as well. The TESH acts as a silica-polymer interface-lubricant and facilitates
polymer chain-sliding on the silica-surface. That in turn causes easier extraction of small
particles by sharp asperities of the abrasive disc and increases wear.
4.3.4 Tear resistance
The tear resistance of the samples as shown in Figure 7, gives information about the
crack-growth throughout the material. Physical interactions also affect the tear
resistance. Contrary to what was expected from the tensile tests, the tear resistance
values show a diametrically different relation. The tear resistance values for the TESH
containing samples are actually higher that those obtained for the TESPT samples.
82
100
119 116
70
5549
43
0
20
40
60
80
100
120
140
0,010 0,015 0,020 0,025 0,030
volume lost (mm
3)
TESPT and TESH amount (mol/80 phr of silica)
TESH
TESPT

108
Figure 7: Tear resistance of the TESH and TESPT containing samples.
Hysteretic losses of the compounds play an important role in the tear mechanism. The
closer the glass transition temperature to the temperature where tearing is taking place,
the higher the tear strength. The glass transition temperature of the samples containing
TESH is higher in comparison with the TESPT-containing samples: see Figure 8.
Vulcanizates containing TESH are characterized by higher hysteresis during the tearing
process, therefore they have a higher possibility towards crack dissipation – higher tear
resistance.
4.3.5 Tan δ @ at low temperatures: indicator of wet skid resistance
The practical laboratory assessment methods for wet skid resistance for carbon black
filled compounds indicate that higher values of tan δ at lower temperatures, preferably 0
°C to 20 °C, correspond to better wet skid resistance of the tire treads [10,18,19]. When
the tire stops its rotation and is skidding, the frequency rises up to the megahertz region.
This high frequency is on the one hand caused by roughness of the surface on which
the rubber is sliding [30,15]. However, this high frequency is also the result of stick-slip
phenomena during skidding [31]. The service temperature of the tire during rolling is
relatively high: around 40 °C to 80 °C. Because of the frequency-temperature
superposition principle, under the influence of the high frequency during skidding the tan
δ peak of the elastomer shifts toward higher temperatures [11,32]. The values of tan δ at
7 78 7
6,4 6 6,6 6
0
1
2
3
4
5
6
7
8
9
0,010 0,015 0,020 0,025 0,030
tear resistance (MPa)
TESPT and TESH amount (mol/80 phr of silica)
TESH
TESPT

109
0 – 20 °C at 10 Hz are therefore representative for the tan δ at service temperature and
high frequency [2,33,34]. Hence, rubbers which dissipate more energy in the low
temperatures range of 0 – 20 °C should provide a higher wet skid resistance.
The dependence of the tan δ on temperature for the various compounds is shown in
Figure 8. In general, compounds in which TESH is used are characterized by a lower
peak at the glass transition temperature in comparison with the TESPT-samples.
Figure 8: Tan δ – temperature dependence.
Apparently, this is due to lower loss moduli G” at the glass transition, rather than
differences in the storage modulus G’, as seen in Table 3. The different loss moduli
point at more restricted polymer segmental motion for the TESH-containing samples in
comparison with TESPT. It suggests that silica treated with TESH as silane adsorbs
more polymer on its surface than in the case of TESPT, leaving less free polymer to
participate in the glass transition process.
Table 3. Comparison of the storage and loss moduli at tan δ peak.
Tg (°C) G' MPa G" MPa
TESH 5.3 -13 185 85
TESH 7.3 -15 206 95
TESH 9.3 -14 221 95
TESH 11.3 -14 226 98
TESPT 7 -18 180 100
TESPT 9.5 -19 215 115
TESPT 12 -20 236 128
TESPT 14.4 -20 234 126
0
0,1
0,2
0,3
0,4
0,5
0,6
-50 -40 -30 -20 -10 0 10 20 30 40 50
tan δ
temperature (°C)
TESH 5,3TESH 7,3TESH 9,3TESH 11,3TESPT 7TESPT 9,5TESPT 12TESPT 14,4

110
Further, the TESH containing compounds have higher values of tan δ in the temperature
range of 0 to 20 °C compared with the TESPT-containing compounds. In fact, replacing
TESPT with TESH shifts the curves towards higher temperature and that is why the
values of tan δ at 0 – 20 °C are higher. The shift of the tan δ peak could be caused by
differences in the rubber crosslink density. However, the values of the apparent crosslink
densities measured for the samples containing TESH are actually lower than for the
TESPT containing samples; see Table 4.
Table 4. Crosslink density, distribution and hardness of the samples containing TESPT and TESH
The shift of the glass transition temperature is also visible in the compounds as they
differ in filler-filler interactions measured by the Payne effect. At sufficient loading the
filler particles in the elastomer matrix form a secondary filler-network yielding
reinforcement well beyond the hydrodynamic effect. This filler-network is progressively
broken with increasing strain amplitude. The consequent reduction in modulus with
strain amplitude is commonly referred to as the Payne effect [35]. A good example of the
glass transition peak shift towards higher temperatures are vulcanizates in which highly-
reinforcing silica is compared with low reinforcing grades [36]. The data shown in Figure
9 indicate higher values of the Payne effect for the samples containing TESH, so higher
filler-filler interactions, which could be the cause of the above mentioned shift.
Nevertheless, the higher values of tan δ at the temperatures range of 0 - 20 °C are
related to increased hysteresis, as observed for the TESH-compounds and are
anticipated to correspond with higher side force coefficient values compared to the
TESPT-containing samples: see below.
Overall Polysulphidic Disulphidic Monosulphidic ShA hardness
TESPT 7 1.71 -100% 1.05 -61% 0.08 -5% 0.58 -34% 58
TESPT 9.5 2.00 -100% 1.23 -62% 0.13 -7% 0.64 -32% 61
TESPT 12 2.11 -100% 1.30 -62% 0.13 -6% 0.68 -32% 60
TESPT 14.3 2.28 -100% 1.35 -59% 0.17 -7% 0.76 -33% 63
TESH 5.3 1.40 -100% 0.78 -56% 0.15 -11% 0.47 -34% 58
TESH 7.3 1.64 -100% 0.95 -58% 0.24 -15% 0.45 -27% 59
TESH 9.3 1.62 -100% 1.00 -62% 0.18 -11% 0.44 -27% 61
TESH 11.3 1.80 -100% 1.10 -61% 0.24 -13% 0.46 -26% 63
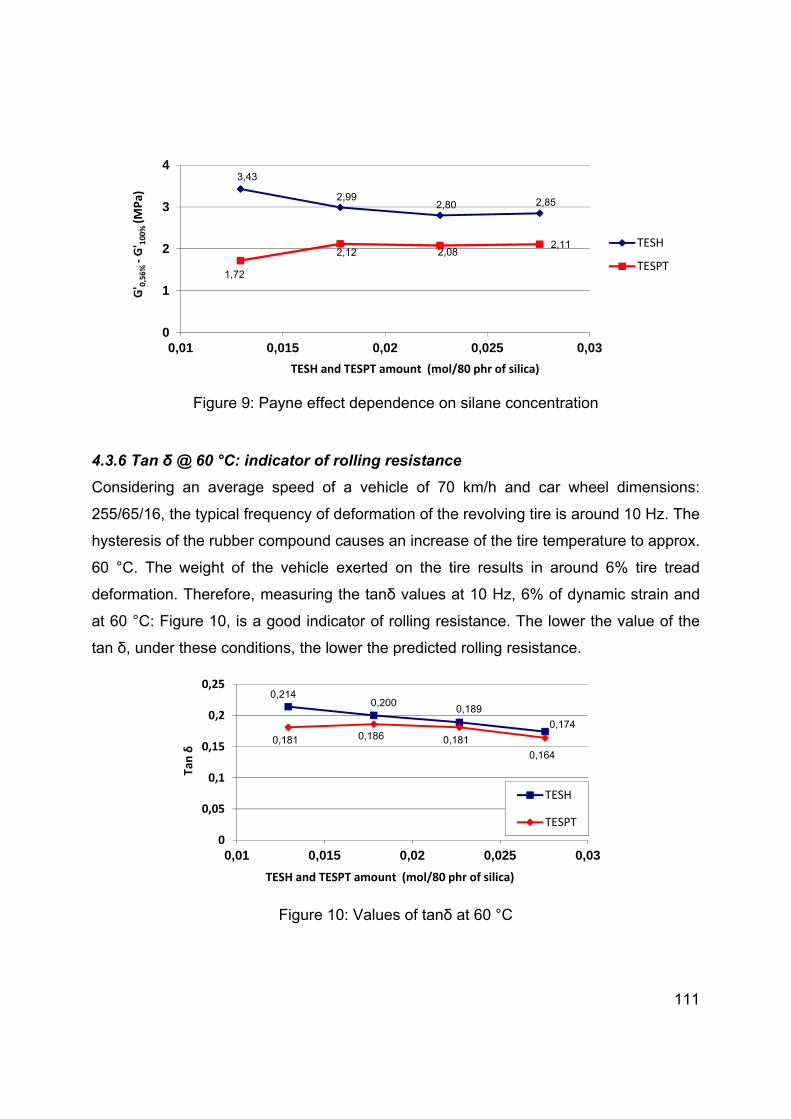
111
Figure 9: Payne effect dependence on silane concentration
4.3.6 Tan δ @ 60 °C: indicator of rolling resistance
Considering an average speed of a vehicle of 70 km/h and car wheel dimensions:
255/65/16, the typical frequency of deformation of the revolving tire is around 10 Hz. The
hysteresis of the rubber compound causes an increase of the tire temperature to approx.
60 °C. The weight of the vehicle exerted on the tire results in around 6% tire tread
deformation. Therefore, measuring the tanδ values at 10 Hz, 6% of dynamic strain and
at 60 °C: Figure 10, is a good indicator of rolling resistance. The lower the value of the
tan δ, under these conditions, the lower the predicted rolling resistance.
Figure 10: Values of tanδ at 60 °C
3,43
2,992,80 2,85
1,72
2,12 2,082,11
0
1
2
3
4
0,01 0,015 0,02 0,025 0,03
G' 0,56% ‐G' 100% (M
Pa)
TESH and TESPT amount (mol/80 phr of silica)
TESH
TESPT
0,2140,200
0,189
0,174
0,181 0,186 0,181
0,164
0
0,05
0,1
0,15
0,2
0,25
0,01 0,015 0,02 0,025 0,03
Tan δ
TESH and TESPT amount (mol/80 phr of silica)
TESH
TESPT
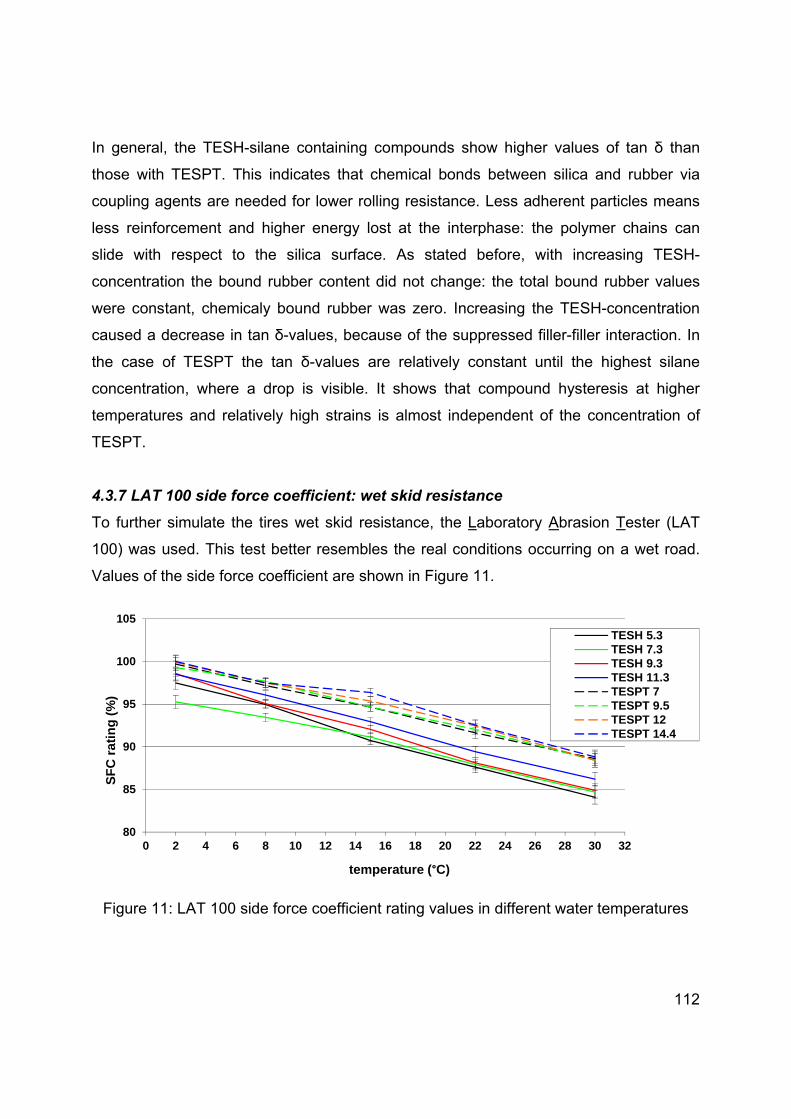
112
In general, the TESH-silane containing compounds show higher values of tan δ than
those with TESPT. This indicates that chemical bonds between silica and rubber via
coupling agents are needed for lower rolling resistance. Less adherent particles means
less reinforcement and higher energy lost at the interphase: the polymer chains can
slide with respect to the silica surface. As stated before, with increasing TESH-
concentration the bound rubber content did not change: the total bound rubber values
were constant, chemicaly bound rubber was zero. Increasing the TESH-concentration
caused a decrease in tan δ-values, because of the suppressed filler-filler interaction. In
the case of TESPT the tan δ-values are relatively constant until the highest silane
concentration, where a drop is visible. It shows that compound hysteresis at higher
temperatures and relatively high strains is almost independent of the concentration of
TESPT.
4.3.7 LAT 100 side force coefficient: wet skid resistance
To further simulate the tires wet skid resistance, the Laboratory Abrasion Tester (LAT
100) was used. This test better resembles the real conditions occurring on a wet road.
Values of the side force coefficient are shown in Figure 11.
Figure 11: LAT 100 side force coefficient rating values in different water temperatures
80
85
90
95
100
105
0 2 4 6 8 10 12 14 16 18 20 22 24 26 28 30 32
SF
C r
ati
ng
(%
)
temperature (°C)
TESH 5.3TESH 7.3TESH 9.3TESH 11.3TESPT 7TESPT 9.5TESPT 12TESPT 14.4

113
Despite the fact that the samples containing TESH have higher hysteresis at
temperatures of 0 – 20 °C in the tan δ-values than TESPT, the side force coefficient
values are lower for the samples containing TESH. In order to find an explanation for
this apparently contradicting phenomenon, mechanical properties could also be
considered. Apart from differences in tensile strength between the TESPT-and TESH-
containing vulcanizates, also the moduli of the compounds can be taken into
consideration. The shapes of the stress-strain curves obtained for the compounds
containing TESPT and TESH show that the samples containing TESH are characterized
by lower values of the secant moduli: see Figure 12. Micro-asperities existing on the
surface of the abrasive disc or surface of the road can therefore cause higher strain
deformations on a micro scale, in which fragments of the rubber compounds are
detached from the surface of the wheel or just displaced. Further, the higher the tensile
strength of the rubbers, the higher the force needed to remove the micro-fragments. The
higher the modulus of the compound the higher the force that is used to displace the
micro-fragments on the surface of the wheel sample. Both mechanisms contribute to the
larger opposing force during sliding which results in higher wet skid resistance of the
TESPT-containing samples.
Figure 12: Stress-strain curves of the TESH and TESPT containing samples
0
20
40
60
80
100
120
140
160
180
0 100 200 300 400 500 600
Stress (N)
Strain (%)
TESPT 7
TESPT 9.5
TESPT 12
TESPT 14
TESH 5.3
TESH 7.3
TESH 9.3
TESH 11.3

114
4.3.7.1 Final remarks
Experiments performed by Heinz [7] show strong correlation between the values of the
side force coefficient measured on the LAT 100 and (wet) skid values obtained during
road tests. At the same time he points out that no correlation exists between dynamic
measurements and road tests. As a consequence, a correlation between LAT 100 and
dynamic measurements do not exist. The contradiction between the higher hysteresis of
the compounds at 0 – 20 °C but yet lower values of the side force coefficient measured
with the LAT 100 found in the present study concur with the tests done by Heinz. The
authors of the present article incline towards the use the LAT 100 as a decisive tool
during assessment of the wet skid potential of a rubber compound. As a consequence,
chemical polymer-filler interactions by appropriate coupling agent (TESPT) are to be
preferred for good wet skid resistance.
4.4 CONCLUSIONS
Silica can be treated with TESH, to obtain interactions similar to those which exist
between carbon black and rubber. The bound rubber content confirms this.
Introduction of physical interactions instead of chemical bonds radically
decreases the values of the tensile strength because of inertness of the silica
surface.
The dynamic properties of the samples measured at low temperatures do not
correspond with the wet skid resistance as measured by the LAT 100.
Replacement of physical bonds (TESH) by chemical interactions (TESPT)
between rubber and fillers increases the values of side force coefficient measured
with the LAT 100. Consequently chemical bonds are preferred for good wet skid
resistance of the tire treads.
The assumption that under the influence of energy resulting from skidding,
polymer molecules physically bonded to the filler surface can easily be displaced,
what should increase the energy dissipation and as a consequence increase the
wet skid resistance, is not correct.

115
References
[1] A. A. Ward, A. A. Yehia, A. M. Bishai, Kautsch. Gummi Kunstst., 61 (2008) 569. [2] K.H. Nordsiek, Kautsch. Gummi Kunstst., 38 (1985) 177. [3] M. J. Wang, Rubber Chem. Technol.,71 (1998) 520. [4] M. J. Wang, Kautsch. Gummi Kunstst., 60 (2007) 438. [5] M. J. Wang, Kautsch. Gummi Kunstst., 61 (2008) 33. [6] M. Heinz, K.A. Grosch, 167th Technical meeting of the Rubber Division ACS, 16-18 May 2005, San Antonio, Texas, USA. [7] M. Heinz, J. Rubb. Res., 13 (2010) 91. [8] K. R. Grosch, Rubber Chem. Technol., 80 (2007) 379. [9] C. J. Derham, R. Newell and P. McL. Swift, NR Technology, 19 (1988) 1. [10] G. Heinrich, Kautsch. Gummi Kunstst., 45 (1992) 173. [11] G. Heinrich, N. Rennar, H. Dumler, Kautsch. Gummi Kunstst., 49 (1996) 32. [12] G. Heinrich, Rubber Chem. Technol.,70 (1997) 1. [13] M. Klüppel, G. Heinrich, Rubber Chem. Technol., 73 (2000) 578. [14] A. Müller, J. Schramm, M. Klüppel, Kautsch. Gummi Kunstst., 55 (2002) 432. [15] A. le Gal, M. Klüppel, J. Phys. Condens. Matter, 20 (2008) 1. [16] B. N. J. Persson, Julich U. Tartaglino, E. Tosatti, O. Albohr, Kautsch. Gummi Kunstst., 57 (2004) 532. [17] Y. Isono, T. Oyama, S. Kawahara, Adv. In Tech. Of Mat. And Mat. Proc. J. 5 (2003) 84. [18] S. L. Aggarwal, I. G. Hargis, R. A. Livigni, H. J. Fabris and L. F. Marker, “Advances in elastomers and rubber elasticity”. Plenum Press (1986) 17. [19] R. R. Rahalkar, Rubber Chem. Technol., 62 (1989) 246. [20] L.E.A.M. Reuvekamp, P.J. van Swaaij, J.W.M. Noordermeer, Kautsch. Gummi Kunstst., 63 (2009) 35. [21] R. Rauline, European Patent No. EP0501227B1, (1992), to Michelin Co. [22] L. Guy, Ph. Cochet, Y. Bomal , S. Daudey, Kautsch. Gummi Kunstst., 63 (2009) 383. [23] J. H. Fielding, Industr. Eng. Chem., 29 (1937) 880. [24] E. M. Dannenberg, Industr. Eng. Chem., 40 (1948) 2199. [25] C. M. Blow, Polymer, 14 (1973) 309. [26] A. H. M Schotman, R.N. Datta, Rubber Chem. Technol., 69 (1996) 727. [27] B. Ellis, G. N. Welding, Rubber Chem. Technol., 37 (1964) 571. [28] C. G. Moore, J. Polym. Sci. 32 (1958) 503. [29] U. Görl, A. Hunsche, A. Mueller, H.G. Koban, 150th Technical meeting of the Rubber Division ACS, 8-10 October 1996, Louisville, Kentucky, USA. [30] A. le Gal, M. Klüppel, Kautsch. Gummi Kunstst., 59 (2006) 308. [31] A. Schallamach, “Chemistry and Physics of Rubber-like Substances” ed. L.

116
Bateman. McLaren and Sons, London (1963) 382. [32] S. Cervenya, A. Ghilarduccib, H. Salvab, A.J. Marzoccaa, Polymer, 41 (2000) 2227. [33] A. Yoshioka, K. Komuro, A. Ueda, H. Watanabe, S. Akita, T. Masuda, A. Nakajima, Pure Appl. Chem., 58 (1986) 1697. [34] P. Roch, Kautsch. Gummi Kunstst., 48 (1995) 430. [35] A. R. Payne, J. Appl. Polym. Sci., 6 (1962) 57. [36] E. Cichomski, T.V. Tolpekina, S. Schultz, W.K. Dierkes, J.W.M. Noordermeer, 184th Technical Meeting of the Rubebr Division ACS, 8-10 October 2013, Cleveland, Ohio, USA.


117
Chapter 5
Influence of modification of the silane coupling agent on wet-traction and rolling resistance
performance indicators for passenger car tire tread materials: Influence of number of ethoxy
groups
The elastomer compound used for tire treads is a composite material of which the
dynamic properties can be adjusted over a relatively broad range by modification of
the polymer-filler interaction. The replacement of carbon black by a silica-silane
coupling agent system for instance, allows reducing the hysteresis of the rubber,
which results in a reduction of the rolling resistance when applied for tire treads.
Selective changes in the structure of the coupling agent, in this chapter the number
of ethoxy groups reactive towards silanol groups on the surface of the filler, lead to
changes in the microstructure of the silica-polymer interface and determine both,
mechanical and dynamic properties of the rubber compound, thus wet grip and rolling
resistance when used in a tire tread.
In this chapter the effect of the number of ethoxy groups in the silane on the
macroscopic dynamic properties as indicators for tire performance is discussed.
Silanes with just one ethoxy group instead of three as commonly used, are expected
to decrease rolling resistance and to improve wet skid resistance, based on the
changes in hysteresis caused by the structural changes of the silane.

118
5.1 INTRODUCTION
The key element of silica technology is the coupling agent, a silane which chemically
couples the silica to the rubber polymer. The chemical structure of the silane
determines the polymer-filler interactions, which on their turn influence wet skid and
rolling resistance. The goal of the present study is to characterize the underlying
mechanisms involved in rubber-filler interactions for wet skid resistance of tires, a
dynamic viscoelastic phenomenon. To characterize the dynamic properties of rubber,
storage and loss moduli are commonly measured. The ratio of the loss to storage
modulus is indicated as the tan δ.
The surface of precipitated silica’s is covered with different types of hydroxyl groups,
the silanol groups. The concentration of the silanol groups on the silica surface is in
the range of 6 to 7 groups per square nanometer of surface 1,2. High concentrations
of silanol groups make the silica surface rather hydrophilic, which in turn causes
strong agglomeration of the fine silica particles during mixing with nonpolar rubber
such as styrene-butadiene rubber (SBR). Apart from agglomeration, the highly
hydrophilic character of silica causes adsorption of amines used as accelerators for
the vulcanization process, leading to a substantial increase in curing time and
decrease in crosslink efficiency.
Using a silane reduces the hydrophilicity of silica during mixing and at the same time
provides chemical bonding 3. Due to the good dynamic and mechanical properties of
compounds, bis-(triethoxysilylpropyl)tetrasulfide (TESPT) is most frequently used as
coupling agent in the tire industry. When TESPT is used in an optimal concentration,
not more than one out of seven available silanol groups per square nanometer on the
silica surface are utilized to form the actual connection to the polymer chains 4.
Studies by Blume et al. 5 show that only 25 % of all available silanol groups on the
silica surface can react with a silane coupling agent containing triethoxysilyl moieties.
At a reaction temperature of 110 °C, the geminal and isolated silanol groups form
bonds with the silane. However, vicinal groups are not utilized which is caused by
their lower molecular accessibility.
In order to reduce the number of remaining silanol groups on the silica surface after
silanization, a coupling agent with only one silica-silane bonding unit, bis-
(dimethylethoxysilylpropyl)tetrasulfide (DMESPT) is applied 6. In this case, replacing

the two
hence
finally t
be influ
polyme
of the
propert
This ch
one eth
compo
5.2 EX
In the
methyl
being i
more b
situatio
silica s
second
structu
Fi
o lateral eth
it is anticip
to a higher
uenced as
er chains to
elastome
ties.
hapter will
hoxy group
und, and if
PERIMEN
silane use
groups:
nert, these
bulky etho
on in which
surface. Be
dary silani
res of this
igure 1: St
bis-(d
hoxy group
pated that
r bond den
s, in fact,
o the silica
ric materi
try to ans
p will affect
f the chang
TAL
ed in this
bis-(dimet
e methyl g
oxy groups
h only one
esides, the
ization rea
coupling a
ructure of
dimethyleth
ps by meth
more of t
sity to the
just only
a surface. H
al, and is
swer the q
t wet tracti
ges can be
study, two
thylethoxys
roups resu
s in the T
group on e
e reaction
action, is
agent and T
bis-(trietho
hoxysilylpr
hyl moieties
hem could
polymer m
one ethox
However, i
s expected
uestion if
on, rolling
e correlated
o ethoxy g
silylpropyl)
ult in less
TESPT mo
each side
of the ad
eliminate
TESPT are
oxysilylprop
ropyl)tetras
s leads to
d attach to
matrix. Mec
xy group
it will influe
d to resu
and how a
resistance
d to a high
groups out
)tetrasulfid
steric hind
olecule. Th
of the sila
djacent eth
ed in the
e shown in
pyl)tetrasu
sulfide, DM
less bulky
the silica
chanical pr
is necessa
ence the dy
lt in impr
a less bulk
e and othe
er bond de
of three w
e (DMES
drance in c
his modific
ne molecu
hoxy grou
experime
Figure 1.
lfide, TESP
MESPT (bo
silane mo
surface a
roperties sh
ary to atta
ynamic pro
rovements
ky silane w
r propertie
ensity.
were repla
SPT). Apa
comparison
cation lead
ule can bin
ps, the so
ental silan
PT (top) a
ottom)
119
lecules,
nd lead
houldn’t
ach the
operties
in tire
with just
es of the
aced by
rt from
n to the
ds to a
d to the
o called
ne. The
nd

The ref
synthet
5.2.1 S
This sil
synthes
3-chlor
tetrasu
After 2
yellow.
rotary
diluted
extract
further
anhydr
evapor
The yie
by liqu
3000 P
the pro
by LC-
molar m
ference sil
tized.
Synthesis
lane was s
sis was pe
ropropyl dim
lfide (Sigm
2 hours of
This susp
evaporato
with dieth
ion, the w
coloration
rous MgS
rator.
Figure
eld of the r
id chroma
Plus) as bis
ocedure sp
-MS is give
mass with
lane, TESP
of bis-(dim
synthetized
erformed in
methyletho
ma Aldrich
refluxing,
pension wa
r, which le
hyl ether,
water was
n of the wa
O4, filtere
2: Format
reaction wa
atography-m
s-(dimethyl
pecified in T
en in Figu
MS. An av
PT, was o
methyleth
d according
n absolute
oxysilane (
, Zwijndre
the color
as filtered
ead to a d
and the e
colored re
ater phase
ed, and r
tion of bis-
as 82 % o
mass spec
lethoxysily
Table I an
re 3. Each
verage sulf
obtained fro
oxysilylpr
g to the me
ethanol un
(ABCR Gm
echt, The
r of the su
and ethan
dark red s
ether layer
ed, and th
e was visib
remaining
(dimethyle
of a gold ye
ctroscopy
ylpropyl)po
d Table II.
h individua
fur rank of
om Evonik
ropyl) tetr
ethod desc
nder nitrog
mbH, Karlsr
Netherland
uspension
nol was re
suspension
was extra
he extracti
ble. The e
ether wa
ethoxysilylp
ellow clear
(LC-MS, A
lysulfide w
. The prod
al peak wa
2.7 and m
k GmbH, a
rasulfide (D
cribed by R
gen atmosp
ruhe, Germ
ds), as sh
changed
moved fro
n. The red
acted with
ion was c
ether extra
as remove
propyl)tetra
r liquid, wh
Agilent-110
with 95 % p
uct structu
as charact
molar mass
and DMES
DMESPT)
Reuvekamp
phere by r
many) and
hown in Fi
from dark
om the filtra
d suspensi
h water. Af
continued
act was dri
ed in the
asulfide
hich was id
00/Bruker-
purity acco
ure as dete
terized by
of 386 g/m
120
PT was
p 7. The
efluxing
sodium
gure 2.
k red to
ate in a
on was
fter this
until no
ied with
e rotary
dentified
Esquire
rding to
ermined
its own
mol was

121
calculated based on the MS-data. The index of refraction of the product at 22 °C was
1.5150.
Figure 3: LC-MS chromatogram of DMESPT; the different sulfur ranks and the free
sulfur peak are indicated.
Table I: LC-MS parameters to characterize the silane structures
Column Nucleosil 100-5 C18 HD (reverse phase) Mobile phase 97 acetonitryle : 3 water (vol%) Flow rate 0.3 ml/min Temperature 23 °C Detector UV (DAD) Wavelength 254 nm Injected volume 5 μl
Table II: MS ionization conditions in the ESI interface
Flow rate 0.20 ml/min Nebuliser gas pressure 0.2 MPa Dry gas flow 3 l/min Dry gas temperature 325 °C
free
sulfur
5.38 6.35
7.83
10.57
S1
13.09
S2
17.12
S3
22.68
S4S5
30.59
0
50
100
150
200
250
300
0 5 10 15 20 25 30 35
Intensity (mAU)
Retention time (min)
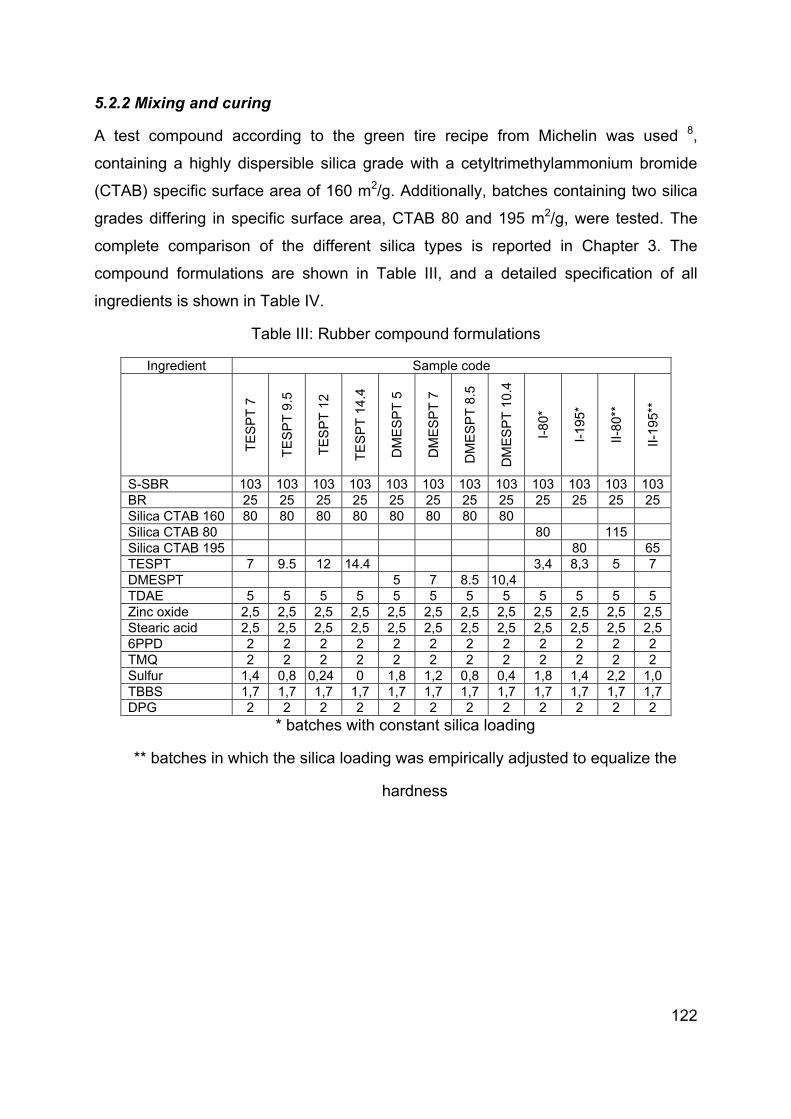
122
5.2.2 Mixing and curing
A test compound according to the green tire recipe from Michelin was used 8,
containing a highly dispersible silica grade with a cetyltrimethylammonium bromide
(CTAB) specific surface area of 160 m2/g. Additionally, batches containing two silica
grades differing in specific surface area, CTAB 80 and 195 m2/g, were tested. The
complete comparison of the different silica types is reported in Chapter 3. The
compound formulations are shown in Table III, and a detailed specification of all
ingredients is shown in Table IV.
Table III: Rubber compound formulations
Ingredient Sample code
TE
SP
T 7
TE
SP
T 9
.5
TE
SP
T 1
2
TE
SP
T 1
4.4
DM
ES
PT
5
DM
ES
PT
7
DM
ES
PT
8.5
DM
ES
PT
10.
4
I-80
*
I-19
5*
II-80
**
II-19
5**
S-SBR 103 103 103 103 103 103 103 103 103 103 103 103BR 25 25 25 25 25 25 25 25 25 25 25 25 Silica CTAB 160 80 80 80 80 80 80 80 80 Silica CTAB 80 80 115 Silica CTAB 195 80 65 TESPT 7 9.5 12 14.4 3,4 8,3 5 7 DMESPT 5 7 8.5 10,4 TDAE 5 5 5 5 5 5 5 5 5 5 5 5 Zinc oxide 2,5 2,5 2,5 2,5 2,5 2,5 2,5 2,5 2,5 2,5 2,5 2,5 Stearic acid 2,5 2,5 2,5 2,5 2,5 2,5 2,5 2,5 2,5 2,5 2,5 2,5 6PPD 2 2 2 2 2 2 2 2 2 2 2 2 TMQ 2 2 2 2 2 2 2 2 2 2 2 2 Sulfur 1,4 0,8 0,24 0 1,8 1,2 0,8 0,4 1,8 1,4 2,2 1,0 TBBS 1,7 1,7 1,7 1,7 1,7 1,7 1,7 1,7 1,7 1,7 1,7 1,7 DPG 2 2 2 2 2 2 2 2 2 2 2 2
* batches with constant silica loading
** batches in which the silica loading was empirically adjusted to equalize the
hardness
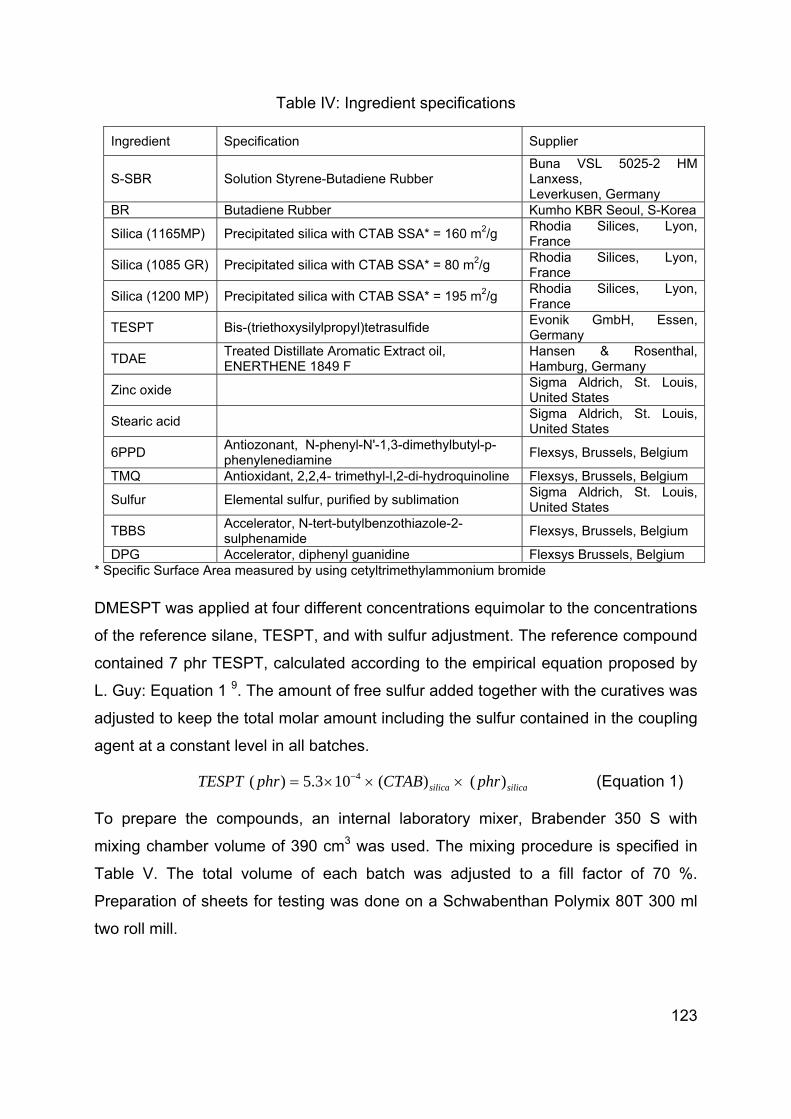
123
Table IV: Ingredient specifications
Ingredient Specification Supplier
S-SBR Solution Styrene-Butadiene Rubber Buna VSL 5025-2 HM Lanxess, Leverkusen, Germany
BR Butadiene Rubber Kumho KBR Seoul, S-Korea
Silica (1165MP) Precipitated silica with CTAB SSA* = 160 m2/g Rhodia Silices, Lyon, France
Silica (1085 GR) Precipitated silica with CTAB SSA* = 80 m2/g Rhodia Silices, Lyon, France
Silica (1200 MP) Precipitated silica with CTAB SSA* = 195 m2/g Rhodia Silices, Lyon, France
TESPT Bis-(triethoxysilylpropyl)tetrasulfide Evonik GmbH, Essen, Germany
TDAE Treated Distillate Aromatic Extract oil, ENERTHENE 1849 F
Hansen & Rosenthal, Hamburg, Germany
Zinc oxide Sigma Aldrich, St. Louis, United States
Stearic acid Sigma Aldrich, St. Louis, United States
6PPD Antiozonant, N-phenyl-N'-1,3-dimethylbutyl-p-phenylenediamine
Flexsys, Brussels, Belgium
TMQ Antioxidant, 2,2,4- trimethyl-l,2-di-hydroquinoline Flexsys, Brussels, Belgium
Sulfur Elemental sulfur, purified by sublimation Sigma Aldrich, St. Louis, United States
TBBS Accelerator, N-tert-butylbenzothiazole-2-sulphenamide
Flexsys, Brussels, Belgium
DPG Accelerator, diphenyl guanidine Flexsys Brussels, Belgium * Specific Surface Area measured by using cetyltrimethylammonium bromide
DMESPT was applied at four different concentrations equimolar to the concentrations
of the reference silane, TESPT, and with sulfur adjustment. The reference compound
contained 7 phr TESPT, calculated according to the empirical equation proposed by
L. Guy: Equation 1 9. The amount of free sulfur added together with the curatives was
adjusted to keep the total molar amount including the sulfur contained in the coupling
agent at a constant level in all batches.
silicasilica phrCTABphrTESPT )()(103.5)( 4
(Equation 1)
To prepare the compounds, an internal laboratory mixer, Brabender 350 S with
mixing chamber volume of 390 cm3 was used. The mixing procedure is specified in
Table V. The total volume of each batch was adjusted to a fill factor of 70 %.
Preparation of sheets for testing was done on a Schwabenthan Polymix 80T 300 ml
two roll mill.

124
Table V: Mixing procedure for internal mixer
Stage I Rotor speed: 110 RPM, initial temp.: 50 °C
Timing Ingredient
(min. sec.) 0.00 Add polymers
1.00 Add ½ silica, ½ silane, ZnO +
stearic acid
2.30 Add ½ silica, ½ silane, oil, TMQ,
6PPD 3.00 Sweep 4.00 Dump at ~ 155 °C
Stage II Rotor speed: 130 RPM, initial temp.: 50 °C
Timing Ingredient
(min. sec.) 0.00 Add stage I batch 3.00 Dump at ~ 155 °C
Curative addition Rotor speed: 75 RPM, initial temp.: 50 °C
Timing Ingredient
(min. sec.) 0.00 Add stage II batch 1.00 Add curatives 3.00 Dump at ~ 100 °C
The samples were vulcanized in a Wickert press WLP 1600 at 160 ºC to sheets with
a thickness of 2 mm, according to their t90 optimum vulcanization times multiplied by
1.2 as determined in a Rubber Process Analyzer, RPA 2000, from Alpha
Technologies.
5.2.3 Characterization methods
Additional to the tests described in Chapter 3, bound rubber tests were performed.
These tests were done by immersing approximately 0.2 g of the uncured compound
in 60 ml of toluene for 7 days to obtain equilibrium swelling. After swelling, the
samples were dried in a vacuum oven at 80 °C for 24 hours. The weight of the
sample before (m0) and after equilibrium swelling (m1) was used to calculate the
bound rubber value according to Equation 2. Additionally, to distinguish physically
and chemically bound rubber, the immersion of the sample in toluene was performed

in an a
treatme
The Mo
Moone
Payne
vulcani
effect,
measu
In orde
and 6 %
160 °C
Filler m
inspect
Dynam
2000 d
compo
ºC at a
A Labo
wet ski
conditio
were m
vulcani
water t
15°. An
180 wa
1.5 km
(SFC) v
compa
relative
ammonia
ent cleaves
ooney visc
y viscomet
effect me
zation for
the value
red at 100
er to predic
% strain w
also in the
macrodispe
tion metho
mic mechan
dynamic sp
unds. Tem
dynamic s
oratory Abr
id resistan
ons on the
made by co
zation pre
temperatur
n electro-c
as used to
/h and a lo
values for
red to the
e values. T
atmospher
s physicall
cosity ML(
ter MV 200
easuremen
1.2 x t90 a
es of the
°C and at
ct the rollin
were perfor
e RPA 7.
ersion me
d with 100
nical analy
pectromete
mperature s
strain of 0.
rasion Tes
nce of the
e road; see
ompressio
ss for 11 m
res: 2 °C, 8
corundum d
simulate r
oad of 75
the particu
reference
The given p
re. Accord
y bound ru
(1+4) of th
00E (Alpha
nts were
t 160 °C, a
storage m
a frequenc
g resistanc
rmed on th
easuremen
0 x magnific
ysis was p
er. The sam
sweeps we
1 %, pre-s
ster 100 (L
tire treads
e Figure 4
n molding
minutes at
8 °C, 15 °C
disc with a
road contac
N for a dis
ular sampl
e value ob
property wi
ding to Wo
ubber 10,11,1
he compou
a Technolo
done usin
also in the
modulus at
cy of 0.5 H
ce, single
he RPA 20
nts were
cation acco
performed
mples were
ere perform
strain of 2 %
LAT 100, V
s under co
4 13. Whee
in a spec
t 170 °C. T
C, 22 °C, 3
a diameter
ct. Tests w
stance of 3
es were ca
btained for
th a highe
olff and P12.
unds was
ogies) acco
ng the RP
RPA. For
t 1 % stra
Hz.
point mea
000, after v
done usin
ording to IS
in tension
e cut from
med in a ra
% and a fre
VMI Group
onditions w
el samples
cial mold u
Testing wa
30 °C, and
of 350 mm
were perfor
33 meters.
alculated a
the samp
r rating is b
Polmanteer
measured
ording to IS
PA 2000
determina
ain and 9
surements
vulcanizati
ng the vi
SO 11345,
mode on
cured she
ange betwe
equency of
p) was use
which bette
s with a dia
using the W
s performe
d at a cons
m and rela
rmed at a c
The Side
according t
ple TESPT
better.
r et al., am
(Equ
d at 100 °
SO 289-1.
before an
ation of the
90 % strai
s of tan δ a
on for 1.2
isual micr
, method C
a Metrav
eets of the
een -50 ºC
f 10 Hz.
ed to estim
er reflect t
ameter of
Wickert lab
ed at five d
stant slip a
ative rough
constant s
Force Co
to Equatio
T 7, expres
125
mmonia
ation 2)
C on a
nd after
e Payne
in were
at 60 °C
x t90 at
roscopic
C.
ib DMA
e rubber
and 60
mate the
the real
80 mm
boratory
different
angle of
hness of
peed of
efficient
n 3 and
ssed as
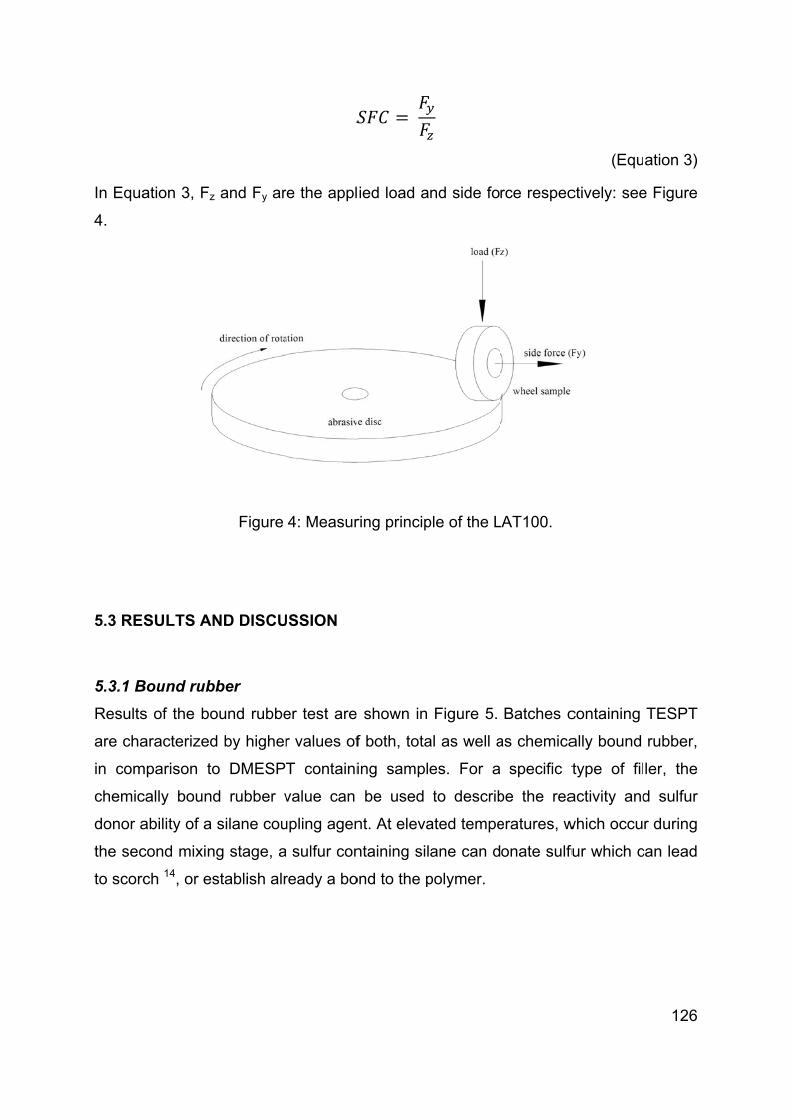
In Equa
4.
5.3 RE
5.3.1 B
Results
are cha
in com
chemic
donor a
the sec
to scorc
ation 3, Fz
SULTS AN
Bound rub
s of the bo
aracterized
mparison to
cally bound
ability of a
cond mixin
ch 14, or es
z and Fy ar
Figure
ND DISCU
bber
ound rubbe
d by higher
o DMESP
d rubber v
silane cou
ng stage, a
stablish alr
re the appl
4: Measur
USSION
er test are
r values of
T containi
value can
upling agen
a sulfur con
ready a bo
ied load a
ring princip
shown in
f both, tota
ing sampl
be used
nt. At eleva
ntaining sil
ond to the p
nd side fo
ple of the L
Figure 5.
al as well a
es. For a
to describ
ated tempe
ane can d
polymer.
rce respec
LAT100.
Batches c
as chemica
specific t
be the rea
eratures, w
onate sulfu
(Equ
ctively: see
containing
ally bound
type of fil
activity and
which occu
fur which c
126
ation 3)
e Figure
TESPT
rubber,
ler, the
d sulfur
r during
can lead

127
Figure 5: Bound rubber contents of TESPT and DMESPT containing compounds.
The sulfur donation ability of a coupling agent increases with the average sulfur rank
of a silane for ranks higher than 1: the higher the sulfur rank, the less stable is the
silane during compound preparation, resulting in a higher scorch risk 15. Differences
in bound rubber values between the coupling agents can be explained by the
difference in average sulfur rank. The average sulfur rank for TESPT is 3.7, which is
higher than for DMESPT with an average sulfur rank of 2.7. Therefore compounds
with TESPT are more prone to a scorch reaction during the mixing process than the
DMESPT containing compounds, what can also be seen in the Mooney viscosity
values; see Figure 6. The sample containing 14.4 phr TESPT shows an
extraordinarily high viscosity, caused by a scorch reaction due to the high sulfur-
content of this compound from the high silane-dosage.
5.3.2 Mooney viscosity
Silica compounds present considerable disadvantages in processing in comparison
to carbon black. These difficulties include short scorch times, environmental
problems related to alcohol evolution, and higher compound Mooney viscosities. The
high viscosity and poor processability of the silica filled rubber compounds are
associated with silica reagglomeration after compound preparation 1,16. Although both
silanes use one ethoxy group to form bonds with the surface silanol groups of silica,
the missing lateral, polar ethoxy groups in the DMESPT molecule reduces the
hydrophilic character of the silica surface to a higher extent compared to TESPT. The
0
10
20
30
40
50
60
70
80
0,010 0,015 0,020 0,025 0,030
Bo
un
d r
ub
ber
(w
t. %
)
Mol of silane/80 phr of silica)
TESPT ‐ total
DMESPT ‐ total
TESPT ‐ chemical
DMESPT ‐ chemical

128
lower polarity of the silica surface leads to suppressed filler reagglomeration followed
by lower Mooney viscosity of the compounds containing DMESPT.
Figure 6: Mooney viscosity of the batches.
5.3.3 Payne effect
At a sufficiently high loading, the filler particles in the elastomer matrix form a
secondary filler-filler network yielding reinforcement well beyond the hydrodynamic
effect. This filler-filler network is progressively broken with increasing strain
amplitude, and the consequent reduction in modulus is commonly referred to as the
Payne effect 17. Apart from the filler-filler network, the polymer-filler interaction also
has its contribution to the Payne effect value in the vulcanized state. At equilibrium,
elastomer chains are adsorbed onto the filler surface. When strain increases, it
induces a progressive extension of elastomer chain segments which bridge filler
particles as depicted in Figure 7. This extension is much larger than macroscopic
deformation because of strain amplification. At very low strain values, the
macroscopic deformation energy is stored in elongated chains as elastic energy and
can therefore be fully recovered when the strain is released.
Figure 7: Filler particles and elastic polymer extension at low strain amplitude 18.
70 72 7581
64 6568
66
0
10
20
30
40
50
60
70
80
90
0,010 0,015 0,020 0,025 0,030
Mo
on
ey v
isco
sity
Mol of silane/80 phr of silica
TESPT
DMESPT

129
Along with progressing strain amplitudes, the stored elastic energy overcomes the
adsorption energy and causes gradual desorption of the elastomer chains. The
storage modulus decreases because part of the initially elastic energy stored in
deformed chains is converted into molecular mobility and mechanically lost as
depicted in Figure 8 18.
Figure 8: Filler particles at high strain amplitude 18.
The higher the bond density of the elastomer chains on the silica surface, the higher
the storage modulus at high strains. The influence of the polymer-silica bonds is
obvious when the Payne effect values before and after curing are compared; see
Figure 9 and Figure 10. Two phenomena occurring during the vulcanization lead to
an increase of the Payne effect: Firstly, formation of the polymer-crosslinks increases
the low strain storage modulus. Secondly, the curing process also binds the polymer
chains to the filler surface via the coupling agent. Strong filler-polymer bonds are able
to withstand higher deformations, what contributes to increased values of the storage
modulus at highest strain amplitudes 19.
In the unvulcanized state, there is no clear trend in the Payne effect values; see
Figure 9. The filler-filler interaction is not significantly influenced neither by the silane
concentration nor by the type of silane. At this stage, polymer-crosslinks and linkages
between filler surface and polymer chains are not yet formed, resulting in low values
compared to the Payne effect in the cured state as seen in Figure 10. This also
suggests that DMESPT, despite its lower steric hindrance, does not lead to increased
use of the silanol groups on the silica surface: similar Payne effect values, thus
comparable filler-filler interaction is an indication of equal silanol group density.

130
Figure 9: Payne effect for the TESPT and DMESPT containing compounds – before
vulcanization.
After vulcanization, differences between the two coupling agents become more
pronounced, see Figure 10: the Payne effect of the material containing DMESPT is
higher than the Payne effect of the rubber containing the reference silane TESPT.
Due to the sulfur adjustment, the differences in crosslink densities can be ruled out
as a potential cause of the higher Payne effect values of the compounds with
DMESPT silane.
Figure 10: Payne effect for the TESPT and DMESPT containing compounds – after
vulcanization
Diminishing differences in the values of the storage modulus at highest strain
amplitudes, see Figure 11, suggest that bonds formed by DMESPT do not differ in
strength from bonds formed by TESPT, so again this cannot explain the differences
0,26
0,24 0,25
0,38
0,22
0,29 0,31
0,35
0,00
0,20
0,40
0,60
0,80
1,00
1,20
1,40
0,010 0,015 0,020 0,025 0,030
G' 1
%-G
' 90
%(M
Pa)
Mol of silane/80 phr of silica
TESPT
DMESPT
1,17
1,03 1,07 1,041,08
1,22 1,141,26
0,00
0,20
0,40
0,60
0,80
1,00
1,20
1,40
0,010 0,015 0,020 0,025 0,030
G' 1
% -
G' 9
0%
(MP
a)
Mol of silane/80 phr of silica
TESPT
DMESPT
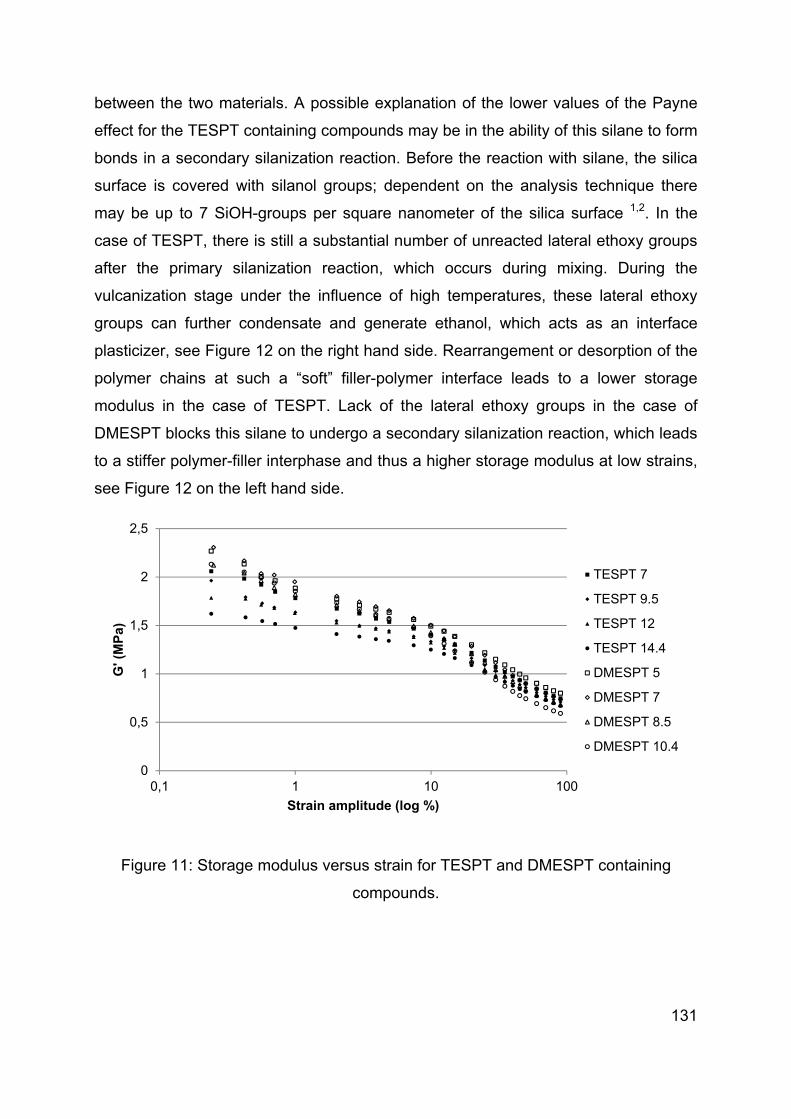
131
between the two materials. A possible explanation of the lower values of the Payne
effect for the TESPT containing compounds may be in the ability of this silane to form
bonds in a secondary silanization reaction. Before the reaction with silane, the silica
surface is covered with silanol groups; dependent on the analysis technique there
may be up to 7 SiOH-groups per square nanometer of the silica surface 1,2. In the
case of TESPT, there is still a substantial number of unreacted lateral ethoxy groups
after the primary silanization reaction, which occurs during mixing. During the
vulcanization stage under the influence of high temperatures, these lateral ethoxy
groups can further condensate and generate ethanol, which acts as an interface
plasticizer, see Figure 12 on the right hand side. Rearrangement or desorption of the
polymer chains at such a “soft” filler-polymer interface leads to a lower storage
modulus in the case of TESPT. Lack of the lateral ethoxy groups in the case of
DMESPT blocks this silane to undergo a secondary silanization reaction, which leads
to a stiffer polymer-filler interphase and thus a higher storage modulus at low strains,
see Figure 12 on the left hand side.
Figure 11: Storage modulus versus strain for TESPT and DMESPT containing
compounds.
0
0,5
1
1,5
2
2,5
0,1 1 10 100
G' (
MP
a)
Strain amplitude (log %)
TESPT 7
TESPT 9.5
TESPT 12
TESPT 14.4
DMESPT 5
DMESPT 7
DMESPT 8.5
DMESPT 10.4

132
Figure 12: Pictorial view of the silica surface after treatment with TESPT and
DMESPT.
5.3.4 Tan δ values at 60 °C: indication of rolling resistance
The tan δ values at 60 °C as indication of rolling resistance are shown in Figure 13. A
lower value of tan δ corresponds to lower rolling resistance, when this material is
used in the tread of a tire. Concentrations of TESPT higher than the commonly used
loading of 7 phr do not result in changes in the hysteresis, as saturation of the silica
surface occurs at 7 phr, and further increase of the silane loading does not lead to
changes in the filler-polymer interaction. However, due to the scorchiness of the
sample with the highest TESPT loading of 14.4 phr, a decrease of the tan δ value is
observed: polymer network formation occurs, increasing the elasticity of the material.
The difference in tan δ values between the TESPT and DMESPT containing material
is based on the same phenomenon as the difference in storage modulus. As
explained above, the main difference is the occurrence of the secondary reaction in
the case of TESPT, resulting in generation of ethanol which is accumulated at the
interface and results in an increased energy loss due to rearrangements on the filler
surface.
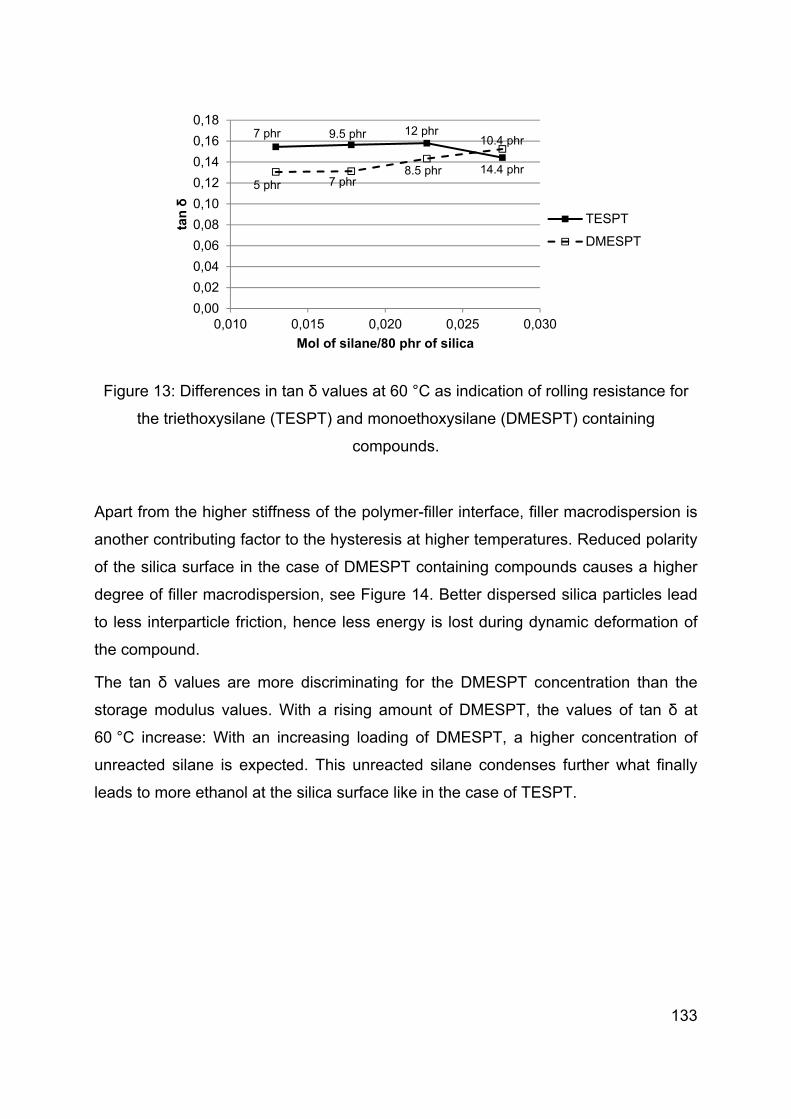
133
Figure 13: Differences in tan δ values at 60 °C as indication of rolling resistance for
the triethoxysilane (TESPT) and monoethoxysilane (DMESPT) containing
compounds.
Apart from the higher stiffness of the polymer-filler interface, filler macrodispersion is
another contributing factor to the hysteresis at higher temperatures. Reduced polarity
of the silica surface in the case of DMESPT containing compounds causes a higher
degree of filler macrodispersion, see Figure 14. Better dispersed silica particles lead
to less interparticle friction, hence less energy is lost during dynamic deformation of
the compound.
The tan δ values are more discriminating for the DMESPT concentration than the
storage modulus values. With a rising amount of DMESPT, the values of tan δ at
60 °C increase: With an increasing loading of DMESPT, a higher concentration of
unreacted silane is expected. This unreacted silane condenses further what finally
leads to more ethanol at the silica surface like in the case of TESPT.
7 phr 9.5 phr 12 phr
14.4 phr5 phr 7 phr
8.5 phr
10.4 phr
0,00
0,02
0,04
0,06
0,08
0,10
0,12
0,14
0,16
0,18
0,010 0,015 0,020 0,025 0,030
tan
δ
Mol of silane/80 phr of silica
TESPT
DMESPT
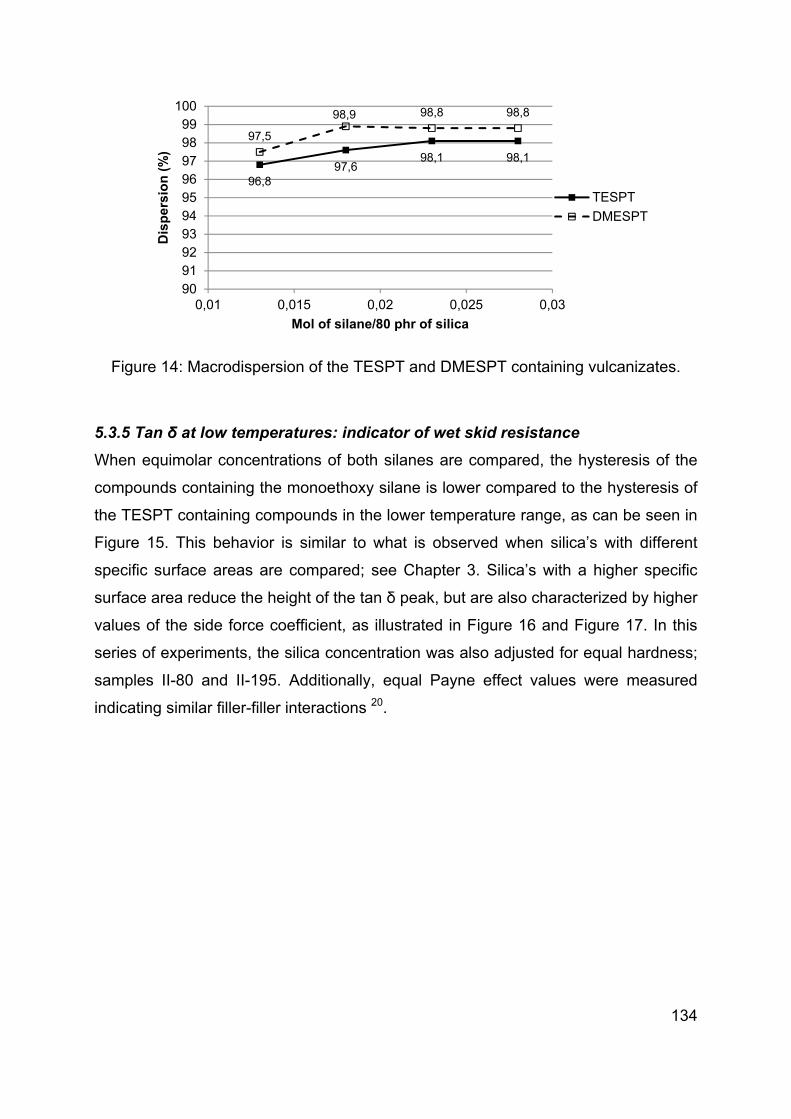
134
Figure 14: Macrodispersion of the TESPT and DMESPT containing vulcanizates.
5.3.5 Tan δ at low temperatures: indicator of wet skid resistance
When equimolar concentrations of both silanes are compared, the hysteresis of the
compounds containing the monoethoxy silane is lower compared to the hysteresis of
the TESPT containing compounds in the lower temperature range, as can be seen in
Figure 15. This behavior is similar to what is observed when silica’s with different
specific surface areas are compared; see Chapter 3. Silica’s with a higher specific
surface area reduce the height of the tan δ peak, but are also characterized by higher
values of the side force coefficient, as illustrated in Figure 16 and Figure 17. In this
series of experiments, the silica concentration was also adjusted for equal hardness;
samples II-80 and II-195. Additionally, equal Payne effect values were measured
indicating similar filler-filler interactions 20.
96,897,6
98,1 98,1
97,5
98,9 98,8 98,8
90919293949596979899
100
0,01 0,015 0,02 0,025 0,03
Dis
per
sio
n (
%)
Mol of silane/80 phr of silica
TESPT
DMESPT
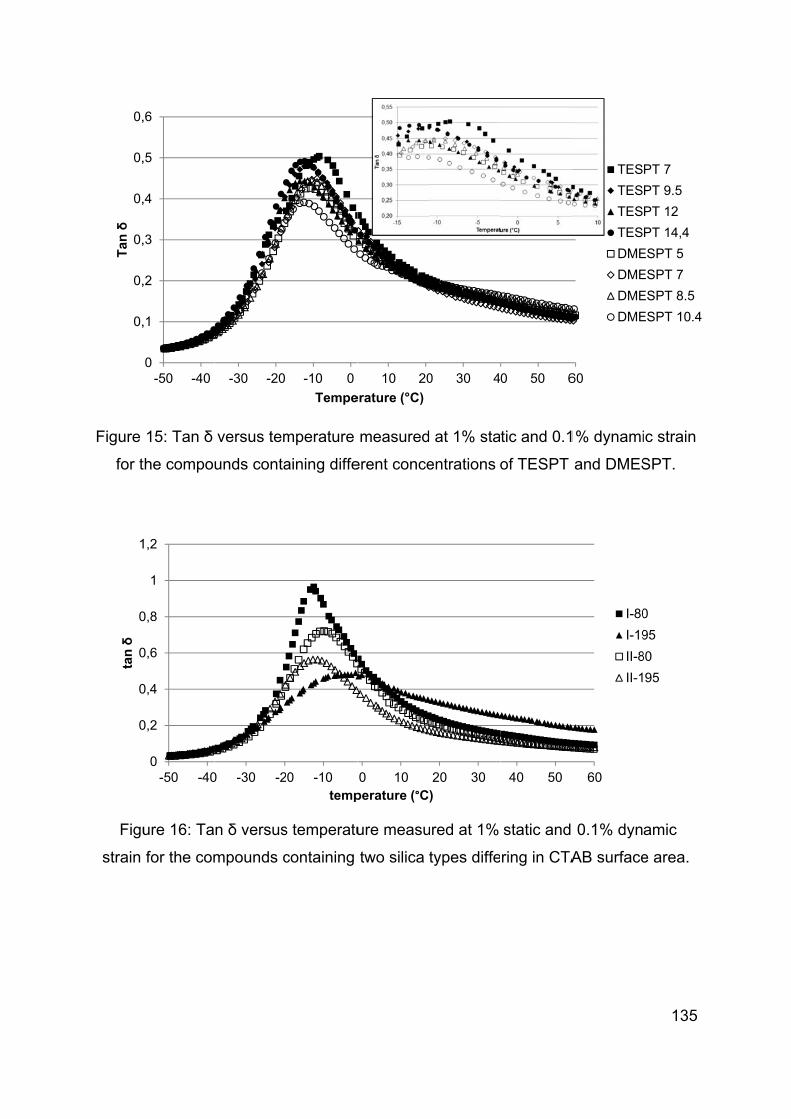
Figure
for t
Figu
strain
0,
0,
0,
0,
0,
0,T
an δ
0
0
0
0
1
tan
δ
15: Tan δ
the compo
ure 16: Ta
for the com
0
,1
,2
,3
,4
,5
,6
-50 -40
0
0,2
0,4
0,6
0,8
1
1,2
-50 -40
versus tem
unds conta
n δ versus
mpounds c
-30 -20
0 -30 -2
mperature
aining diffe
s temperatu
containing
-10 0
Tempe
20 -10temp
measured
erent conce
ure measu
two silica
10 20
erature (°C)
0 10perature (°C
d at 1% sta
entrations
ured at 1%
types diffe
0 30 4
20 30)
tic and 0.1
of TESPT
static and
ring in CTA
0 50 6
40 50
1% dynami
and DMES
0.1% dyn
AB surface
60
TES
TES
TES
TES
DME
DME
DME
DME
60
I-80
I-19
II-8
II-1
135
ic strain
SPT.
amic
e area.
PT 7
PT 9.5
PT 12
PT 14,4
ESPT 5
ESPT 7
ESPT 8.5
ESPT 10.4
0
95
80
95

136
Figure 17: Side force coefficient for the silica’s with different CTAB surface area.
The effect of reduced height of the tan δ peak is caused by more restricted
movements of the polymer chains on the surface of silica types with a higher specific
surface area - formation of a glassy layer. The same effect of decreasing height of
the tan δ peak is also observed when silica or carbon black filled rubber is compared
with unfilled compounds 21,22. Based on these different studies, it can be generally
concluded that the maximum of the tan δ curve is decreasing in height with
increasing stiffness of the glassy layer. As this decrease in the tan δ peak value is
observed here as well when replacing TESPT by DMESPT, this supports the
assumption of more restricted polymer chain movements caused by a decreased
amount of ethanol in the interface between polymer and filler in the case of DMESPT.
5.3.6 LAT 100 side force coefficient: indicator for wet skid resistance
Unlike for TESPT, for DMESPT the SFC as indicator for wet skid resistance is
dependent on the silane concentration within the range of this study, as seen in
Figure 18. More restricted polymer movements in the glassy layer, as explained
above, cause lower values of tan δ for the compounds with DMESPT, as seen in
Figure 15. This indicates a higher degree of immobilization in the lower temperature
range and stiffening of the interface in the case of DMESPT. However the results as
presented in Figure 18 indicate that the SFC increases with rising concentration of
DMESPT, contrary to TESPT. Micro-asperities existing on the surface of the road, or
equally on the abrasive disk in the LAT 100 test, cause high strain deformations on
I-80 I-195 II-80 II-19595
100
105
110
SF
C r
atin
g (
%)

137
micro scale. The stiffer the interface between filler surface and elastomer, the higher
the force required for this deformation. Hence, a higher local stiffness around the filler
particles with high DMESPT concentrations results in higher wet skid resistance.
Compounds containing TESPT are characterized by equal stiffness at lower
temperatures, therefore the side force coefficient values do not undergo substantial
changes.
Figure 18: Correlation between side force coefficient and silane concentration as an
indication for wet skid resistance for DMESPT and TESPT containing compounds.
5.4 CONCLUSIONS
Using just one ethoxy group instead of three in the silane coupling agent,
improves both, wet skid and rolling resistance. An explanation of these effects
is a more rigid filler-polymer interface in the case of DMESPT, compared to
TESPT with three ethoxy groups, which generate ethanol. The alcohol
remains adsorbed on the interface between filler and polymer and thus
influences the properties of the material.
Both silanes, TESPT and DMESPT, bind the same number of silanol groups
available on the silica surface as measured by the Payne effect of the green
compounds. Therefore, low steric hindrance caused by absence of lateral
ethoxy groups in the DMESPT molecule is not followed by a higher number of
bonded silanol groups than in the case of TESPT.
7 phr9.5 phr
12 phr14.4 phr
5 phr
7 phr
8.5 phr10.4 phr
98
99
100
101
102
103
104
0,01 0,015 0,02 0,025 0,03
SF
C r
atin
g (
%)
Mol of silane/80 phr of silica
TESPT
DMESPT

138
The filler-polymer interactions determine the peak height of the tan δ = f(T)
curve: the more restricted the polymer movements on the filler surface, the
lower the height of the peak, as the immobilized polymer acts more filler-like
than polymer-like. In the case of DMESPT, the polymer-filler interface is more
rigid in comparison to TESPT: The latter possesses secondary ethoxy groups,
which react when the material is heated up during further processing, and
splits off ethanol which is accumulated in the interface, softening the interface
and thus increasing the energy loss (indicated by tan δ) by desorption and
sliding of polymer chains at lower temperatures.
Contrary to TESPT, for DMESPT the SFC of the samples increases with rising
loading of this silane. More restricted movements of the polymer chains in the
glassy layer cause increased stiffness of the compounds containing
DMESPT. A higher local stiffness around the filler particles with high DMESPT
concentrations results in higher wet skid resistance as indicated by the SFC.
139
REFERENCES
[1] M. J. Wang, Rubber Chem. Technol. 71 (1998) 520. [2] A. P. Legrand, H. Hommel, A. Tuel, A. Vidal, Adv. Coll. Interf. Sci. 33 (1990) 91. [3] S. Wolff, 1st Franco-German Rubber Symposium, November 14-16th 1985, Obernai, France. [4] H. D. Luginsland, A. Hasse, 157th Technical meeting of the Rubber Division ACS, April 4-6th 2000, Dallas, Texas. [5] A. Blume, J. P. Gallas, M. Janik, F. Thibault-Starzyk, A. Vimont, Kautsch. Gummi Kunstst. 7-8 (2008) 359. [6] L. A. E. M. Reuvekamp, P. J. van Swaaij, J. W. M. Noordermeer, Kautsch. Gummi Kunstst. 63 (2009) 35. [7] L. A. E. M. Reuvekamp, “Reactive mixing of silica and rubber for tires and
engine mounts”, PhD Thesis: 2003, Dept. of Rubber Technology, Univ. of Twente, Enschede, the Netherlands ISBN 90 365 1856 3.
[8] R. Rauline, European Union Patent No. EP0501227B1, (1992), to Michelin Co. [9] L. Guy, Ph. Cochet, Y. Bomal , S. Daudey, Kautsch. Gummi Kunstst. 63 (2009) 383. [10] S. Wolff, M.-J. Wang, E.-H. Tan, Rubber Chem. Technol. 66 (1993) 163. [11] S. Wolff, Rubber Chem. Technol. 69 (1996) 325. [12] K. E. Polmanteer, C. W. Lentz, Rubber Chem. Technol. 48 (1975) 795. [13] M. Heinz, J. Rubb. Res. 13 (2010) 91. [14] L. A. E. M. Reuvekamp, J. W. ten Brinke, P. J. van Swaaij, J. W. M. Noordermeer, Rubber Chem. Technol. 75 (2002) 187. [15] H. D. Luginsland, Kautsch. Gummi Kunstst. 53 (2000) 10. [16] J. Mewis, Adv. Colloid Interface Sci. 37 (1976) 132. [17] A. R. Payne, J. Appl. Polym. Sci. 6 (1962) 57. [18] J. B. Donnet, E. Custodero, Reinforcement of Elastomers by Particulate Fillers., Science and Technology of Rubber (Third Edition), 2005, Pages 367-400 [19] J. Fröhlich, H.D. Luginsland, Rubber World 4 (2001) 28. [20] A. R. Payne, R. E. Whittaker, Rubber Chem. Technol. 44 (1971) 440. [21] M. M. Jacobi, M. V. Braum, T. L. A. C. Rocha, R. H. Schuster, Kautsch. Gummi Kunstst. 60 (2007) 460. [22] M. J. Wang, Kautsch. Gummi Kunstst. 60 (2007) 438.

140
Chapter 6
The European tire manufacturers for the passenger car market have changed to the
almost exclusive use of silica-silane technology for the treads. Next to the silica and
polymer types, the chemical configuration of the silane coupling agent plays an
important role in the final properties of the tire tread materials. The silane coupling
agent comprises three building blocks: commonly a trialkoxysilyl moiety which reacts
with the silica surface, a polysulfide moiety which reacts with the double bonds of a
polymer, and a hydrocarbon chain connecting the two moieties. The influence of the
alkoxysilyl- and sulfide-moieties on the wet skid- and rolling resistance-related
properties were discussed in Chapters 4 and 5; this chapter deals with the
hydrocarbon chain or simply the linker within the silane coupling agent.
In order to investigate the influence of the linker length on the wet skid and rolling
resistance indicators, a silane with a decyl-linker, bis-(triethoxysilyldecyl)-
tetrasulfide (TESDeT), was compared with bis-(triethoxysilylpropyl)
tetrasulfide (TESPT) on equimolar basis. The study shows that a longer linker lowers
the hysteresis at elevated temperatures, corresponding to a lower energy loss at the
service temperature of a running tire. Simultaneously, the silane with a longer linker
increases the hysteresis in the temperature range close to the glass transition of the
elastomer blend. However, no substantial difference in the wet skid performance
indicator could be recorded between the two investigated silanes, using the Side
Force Coefficient on a LAT 100 apparatus.
Modification of the silane coupling agent for improvement of wet traction and rolling
resistance: Influence of the length of the aliphatic linker

141
6.1 INTRODUCTION
Because of their reduced rolling resistance (RR) and improved wet skid resistance
(WSR), tire treads of passenger cars in Europe are nowadays almost exclusively
produced with the use of silica instead of carbon black as filler. The key element in
this technology is the coupling agent, a silane, which chemically couples silica to the
polymer. The chemical structure of the silane determines the polymer-filler
interactions, which on their turn influence wet skid and rolling resistance. The goal of
the present study is to elaborate the underlying mechanisms of rubber-filler
interaction determining the wet skid and rolling resistance of tires, a dynamic
viscoelastic phenomenon. Dynamic properties of the rubber vulcanizates are directly
related to wet skid and rolling resistance of the tire tread 1,2,3,4. The structure of the
coupling agent has a strong influence on the dynamic properties and therefore is the
main subject of this chapter.
The effect of a progressively decreasing storage modulus with increasing amplitude
of applied strain, a phenomenon related to filler-filler interactions, was investigated by
Payne 5,6. According to investigations described by Fröhlich, Luginsland 7,8 and
Stelandre 9, the magnitude of the Payne effect decreased with increasing length of
the alkyl pending group of silane shielding/covering agents – a silane without sulfur
moiety, which therefore cannot couple to a rubber molecule, see Figure 1. Ten Brinke
et al. 10 studied silane covering agents, which are similar in structure to bis-
(triethoxysilylpropyl)tetrasulfide (TESPT), but without sulfur and differing in the length
of the aliphatic linker. In their investigation, the decrease of the of storage modulus
values with increasing linker length was less significant than in the case of silanes
with long pending groups. The observed effects in both cases were related to a
higher degree of hydrophobation of the silica surface by the covering agent with a
longer pending group or linker.
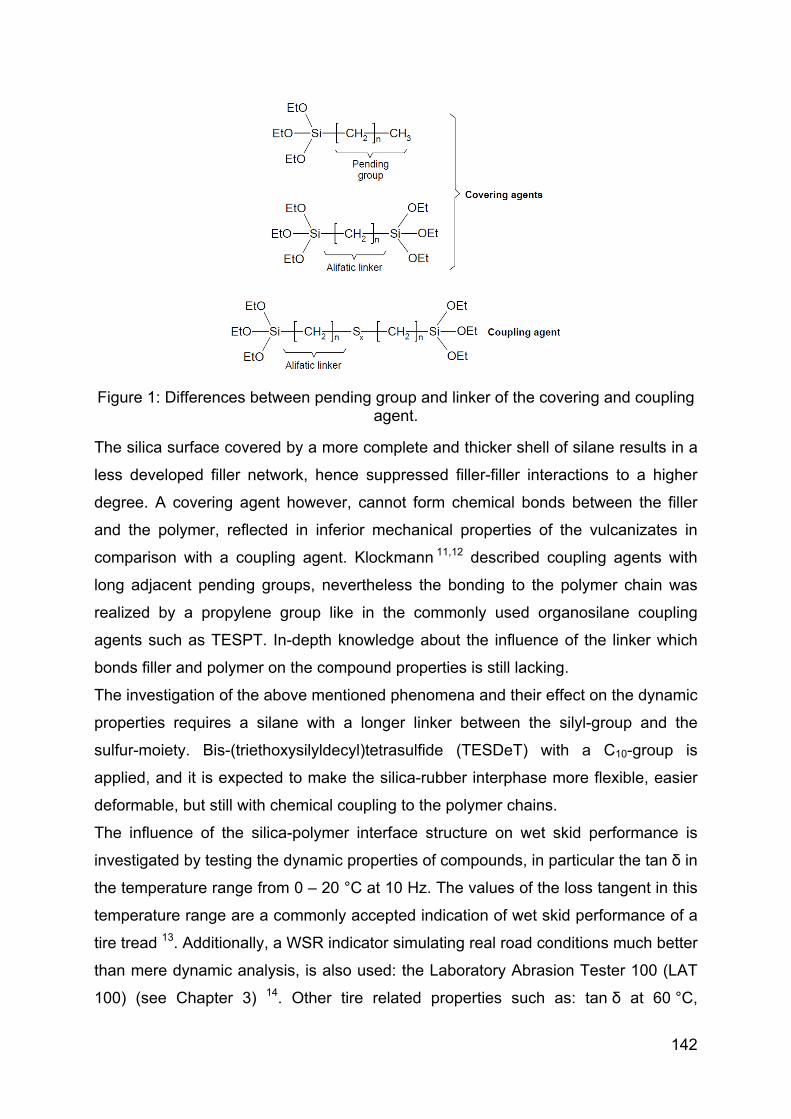
142
Figure 1: Differences between pending group and linker of the covering and coupling agent.
The silica surface covered by a more complete and thicker shell of silane results in a
less developed filler network, hence suppressed filler-filler interactions to a higher
degree. A covering agent however, cannot form chemical bonds between the filler
and the polymer, reflected in inferior mechanical properties of the vulcanizates in
comparison with a coupling agent. Klockmann 11,12 described coupling agents with
long adjacent pending groups, nevertheless the bonding to the polymer chain was
realized by a propylene group like in the commonly used organosilane coupling
agents such as TESPT. In-depth knowledge about the influence of the linker which
bonds filler and polymer on the compound properties is still lacking.
The investigation of the above mentioned phenomena and their effect on the dynamic
properties requires a silane with a longer linker between the silyl-group and the
sulfur-moiety. Bis-(triethoxysilyldecyl)tetrasulfide (TESDeT) with a C10-group is
applied, and it is expected to make the silica-rubber interphase more flexible, easier
deformable, but still with chemical coupling to the polymer chains.
The influence of the silica-polymer interface structure on wet skid performance is
investigated by testing the dynamic properties of compounds, in particular the tan δ in
the temperature range from 0 – 20 °C at 10 Hz. The values of the loss tangent in this
temperature range are a commonly accepted indication of wet skid performance of a
tire tread 13. Additionally, a WSR indicator simulating real road conditions much better
than mere dynamic analysis, is also used: the Laboratory Abrasion Tester 100 (LAT
100) (see Chapter 3) 14. Other tire related properties such as: tan δ at 60 °C,

143
mechanical properties, abrasion resistance, Payne effect are also investigated in this
study.
6.2 EXPERIMENTAL
The structures of the two silanes used in this part of the study, TESPT and TESDeT,
are shown in Figure 2.
Figure 2: Structure of bis-(triethoxysilylpropyl) tetrasulfide (TESPT) and
bis-(triethoxysilyldecyl) tetrasulfide (TESDeT).
In the modified silane, TESDeT in Figure 2, the length of the aliphatic linker between
the silicon and the sulfur atoms is increased from propyl to decyl. This modification
should result in a better hydrophobation of the silica surface due to the longer apolar
hydrocarbon chain in the molecule and a more flexible polymer-filler interphase, but
with the chemical bonding to the polymer remaining unchanged. The reference
silane, TESPT, was commercially obtained from Evonik GmbH; and TESDeT was
synthetized as described below.
6.2.1 Preparation of bis-(triethoxysilyldecyl) tetrasulfide
Bis-(triethoxysilyldecyl) tetrasulfide (TESDeT) was synthetized in a two-step reaction.
During the first step, 10-bromodecyl triethoxysilane was synthetized: A mixture of
10-bromo-1-decene (Synthon Chemicals GmbH & Co. KG, Wolfen, Germany)
triethoxysilane (TCI Europe, Zwijndrecht, Belgium) and a chloroplatinic acid (Sigma
Aldrich, Zwijndrecht, The Netherlands) catalyst in absolute ethanol were stirred under
a dry nitrogen flow for 24 hours at room temperature. Under these circumstances, the
Si
O
O
OS4Si
O
O
O CH2 10 CH2 10
Si
O
O
OS4Si
O
O
O CH2 3 CH2 3
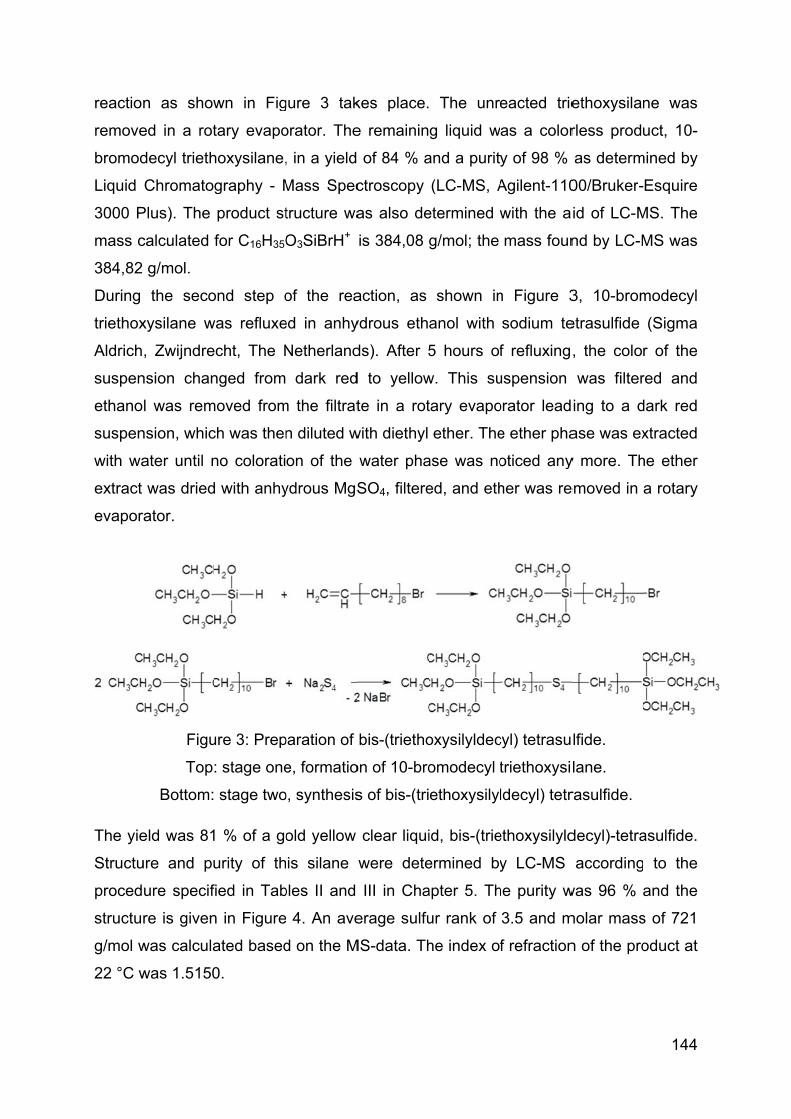
reactio
remove
bromod
Liquid
3000 P
mass c
384,82
During
triethox
Aldrich
suspen
ethano
suspen
with wa
extract
evapor
The yie
Structu
proced
structu
g/mol w
22 °C w
n as show
ed in a rot
decyl trieth
Chromatog
Plus). The
calculated f
g/mol.
the seco
xysilane w
, Zwijndre
nsion chan
l was rem
nsion, whic
ater until n
was dried
rator.
Figu
Top
Bottom:
eld was 81
ure and pu
ure specif
re is given
was calcula
was 1.5150
wn in Fig
tary evapo
hoxysilane,
graphy - M
product st
for C16H35O
ond step o
was refluxe
cht, The N
nged from
moved from
ch was then
no colorati
d with anhy
ure 3: Prep
: stage one
stage two
1 % of a go
urity of th
fied in Tab
n in Figure
ated based
0.
gure 3 tak
orator. The
, in a yield
Mass Spec
tructure wa
O3SiBrH+
of the rea
ed in anhy
Netherland
dark red
m the filtrat
n diluted w
on of the
ydrous MgS
paration of
e, formatio
o, synthesis
old yellow
is silane
bles II and
4. An ave
d on the M
kes place.
e remainin
of 84 % a
ctroscopy
as also de
is 384,08
action, as
ydrous eth
ds). After 5
d to yellow
te in a rot
with diethyl
water pha
SO4, filtere
bis-(trietho
on of 10-bro
s of bis-(tri
clear liqui
were dete
III in Cha
erage sulfu
MS-data. Th
The unre
g liquid w
and a purit
(LC-MS, A
etermined w
g/mol; the
shown in
anol with
5 hours of
w. This su
tary evapo
ether. The
ase was no
ed, and eth
oxysilyldec
omodecyl t
ethoxysilyl
id, bis-(trie
ermined by
apter 5. Th
ur rank of
he index of
eacted trie
as a color
y of 98 %
Agilent-110
with the a
mass foun
n Figure 3
sodium te
f refluxing
uspension
orator lead
e ether pha
oticed any
her was re
cyl) tetrasu
triethoxysi
ldecyl) tetr
ethoxysilyld
y LC-MS
he purity w
3.5 and m
f refraction
ethoxysilan
rless produ
as determ
00/Bruker-
id of LC-M
nd by LC-M
3, 10-brom
etrasulfide
, the colo
was filter
ing to a d
ase was ex
y more. Th
emoved in
lfide.
lane.
rasulfide.
decyl)-tetra
according
was 96 %
molar mass
n of the pro
144
ne was
uct, 10-
mined by
Esquire
MS. The
MS was
modecyl
(Sigma
r of the
red and
dark red
xtracted
he ether
a rotary
asulfide.
to the
and the
s of 721
oduct at

145
Figure 4: LC-MS chromatogram of TESDeT, the different sulfur ranks and free sulfur
peak are indicated.
6.2.2 Mixing and curing
A test compound according to the ‘green tire’ recipe containing a highly-dispersible
silica grade, Zeosil 1165 MP, which is commonly used in the tire industry, was used.
The compound formulations are shown in Table I. A detailed specification of all
ingredients was shown in Table IV in Chapter 5.
Table I: Rubber compound formulations
Ingredient Sample code
TE
SP
T 7
TE
SP
T 9
.5
TE
SP
T 1
2
TE
SP
T 1
4.4
TE
SP
DeT
9.5
TE
SP
DeT
13
TE
SP
DeT
16.
8
TE
SP
DeT
20.
5
S-SBR 103 103 103 103 103 103 103 103 BR 25 25 25 25 25 25 25 25
Silica (1165MP) 80 80 80 80 80 80 80 80 TESPT 7 9,5 12 14,4
TESDeT 9,5 13 16,8 20,5 TDAE 5 5 5 5 5 5 5 5
Zinc oxide 2,5 2,5 2,5 2,5 2,5 2,5 2,5 2,5 Stearic acid 2,5 2,5 2,5 2,5 2,5 2,5 2,5 2,5
6PPD 2 2 2 2 2 2 2 2 TMQ 2 2 2 2 2 2 2 2 Sulfur 1,4 0,8 0,24 0 1,5 1 0,4 0 TBBS 1,7 1,7 1,7 1,7 1,7 1,7 1,7 1,7 DPG 2 2 2 2 2 2 2 2
22.97
S2
36.27
44.18
S3
S4
52.45
sulfur peak
S5
65.85
S6
84.46
0
5
10
15
20
25
30
35
40
0 10 20 30 40 50 60 70 80 90 100
Intensity (mAU)
Retention time (min)
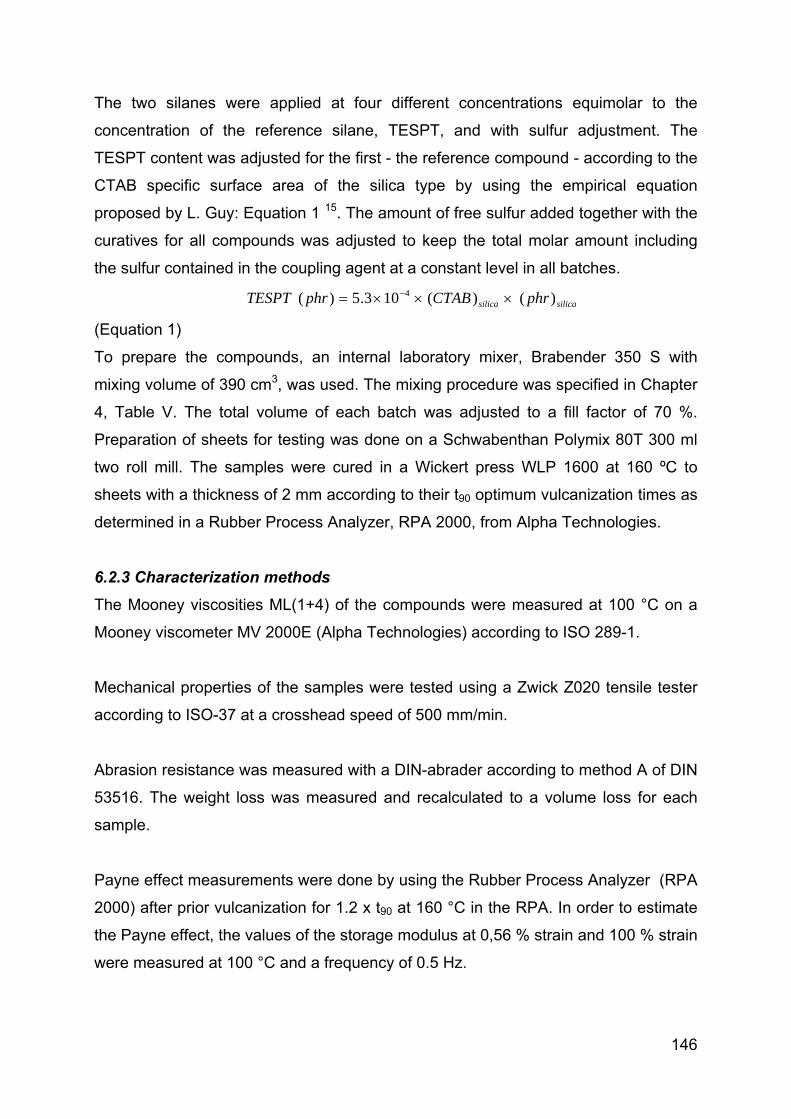
146
The two silanes were applied at four different concentrations equimolar to the
concentration of the reference silane, TESPT, and with sulfur adjustment. The
TESPT content was adjusted for the first - the reference compound - according to the
CTAB specific surface area of the silica type by using the empirical equation
proposed by L. Guy: Equation 1 15. The amount of free sulfur added together with the
curatives for all compounds was adjusted to keep the total molar amount including
the sulfur contained in the coupling agent at a constant level in all batches.
silicasilica phrCTABphrTESPT )()(103.5)( 4
(Equation 1)
To prepare the compounds, an internal laboratory mixer, Brabender 350 S with
mixing volume of 390 cm3, was used. The mixing procedure was specified in Chapter
4, Table V. The total volume of each batch was adjusted to a fill factor of 70 %.
Preparation of sheets for testing was done on a Schwabenthan Polymix 80T 300 ml
two roll mill. The samples were cured in a Wickert press WLP 1600 at 160 ºC to
sheets with a thickness of 2 mm according to their t90 optimum vulcanization times as
determined in a Rubber Process Analyzer, RPA 2000, from Alpha Technologies.
6.2.3 Characterization methods
The Mooney viscosities ML(1+4) of the compounds were measured at 100 °C on a
Mooney viscometer MV 2000E (Alpha Technologies) according to ISO 289-1.
Mechanical properties of the samples were tested using a Zwick Z020 tensile tester
according to ISO-37 at a crosshead speed of 500 mm/min.
Abrasion resistance was measured with a DIN-abrader according to method A of DIN
53516. The weight loss was measured and recalculated to a volume loss for each
sample.
Payne effect measurements were done by using the Rubber Process Analyzer (RPA
2000) after prior vulcanization for 1.2 x t90 at 160 °C in the RPA. In order to estimate
the Payne effect, the values of the storage modulus at 0,56 % strain and 100 % strain
were measured at 100 °C and a frequency of 0.5 Hz.

147
The rolling resistance was assessed by measurement of the tan δ value at 60 °C and
6 % strain, measured on the Rubber Process Analyzer 16.
Dynamic mechanical analysis was performed in tension mode on a Metravib DMA
2000 dynamic spectrometer. The samples were cut from cured sheets of the rubber
compounds. For producing dynamic curves, measurements were performed at
temperatures between -50 ºC and +80 ºC at a dynamic strain of 0.1% and a
frequency of 10 Hz.
A Laboratory Abrasion Tester 100 (LAT 100, VMI Group) was used to estimate the
wet skid resistance of the tire treads under conditions which better reflect the real
conditions on the road; see Figure 10, Chapter 3 17. The Side Force Coefficient
(SFC) values for the particular samples are calculated according to Equation 2 and
compared to the reference value obtained for the sample TESPT 7, and given as
relative values. The given property with higher rating is always better.
Equation 2
In Equation 2, Fy and Fz are the applied load and side force respectively: see Figure
10, Chapter 3.
6.3 RESULTS AND DISCUSSION
6.3.1 Mechanical properties
A pictorial view of the silica surface modified with TESDeT is shown in Figure 5.
Since the decyl linker is much longer, it is also more flexible than the propyl linker of
TESPT, and it can actually fold on the surface of silica forming more shell-like
structures around the silica particles.
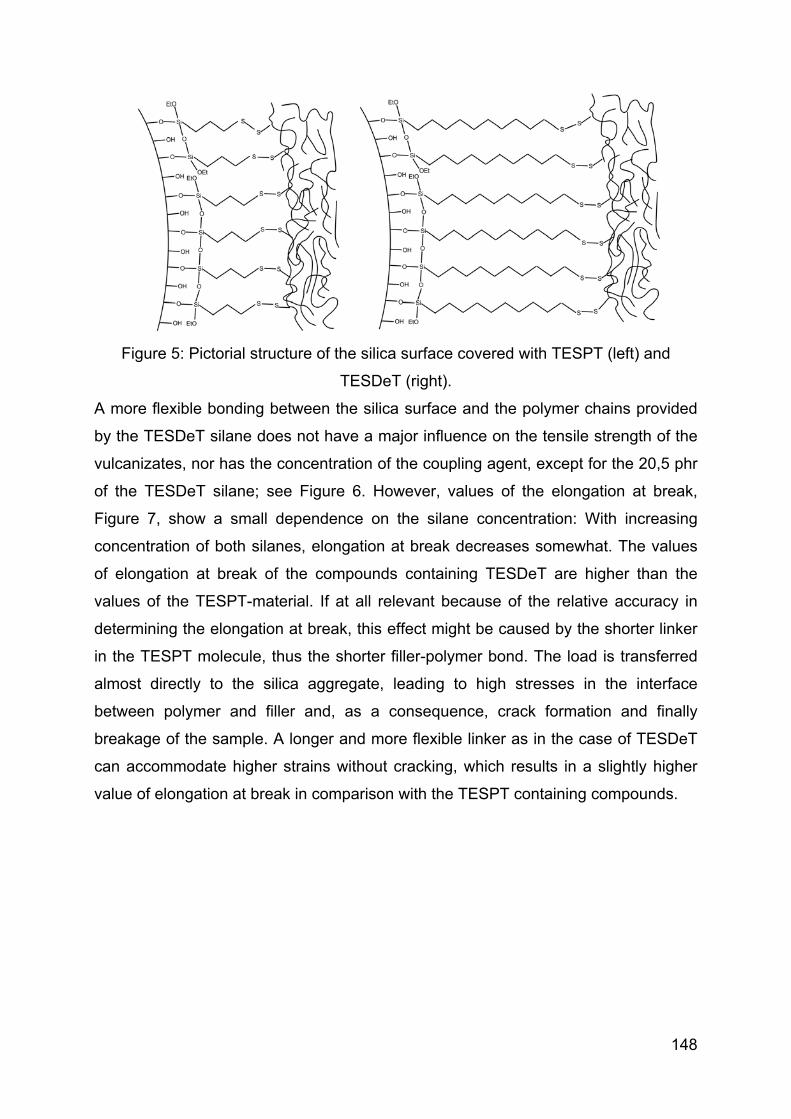
148
Figure 5: Pictorial structure of the silica surface covered with TESPT (left) and
TESDeT (right).
A more flexible bonding between the silica surface and the polymer chains provided
by the TESDeT silane does not have a major influence on the tensile strength of the
vulcanizates, nor has the concentration of the coupling agent, except for the 20,5 phr
of the TESDeT silane; see Figure 6. However, values of the elongation at break,
Figure 7, show a small dependence on the silane concentration: With increasing
concentration of both silanes, elongation at break decreases somewhat. The values
of elongation at break of the compounds containing TESDeT are higher than the
values of the TESPT-material. If at all relevant because of the relative accuracy in
determining the elongation at break, this effect might be caused by the shorter linker
in the TESPT molecule, thus the shorter filler-polymer bond. The load is transferred
almost directly to the silica aggregate, leading to high stresses in the interface
between polymer and filler and, as a consequence, crack formation and finally
breakage of the sample. A longer and more flexible linker as in the case of TESDeT
can accommodate higher strains without cracking, which results in a slightly higher
value of elongation at break in comparison with the TESPT containing compounds.
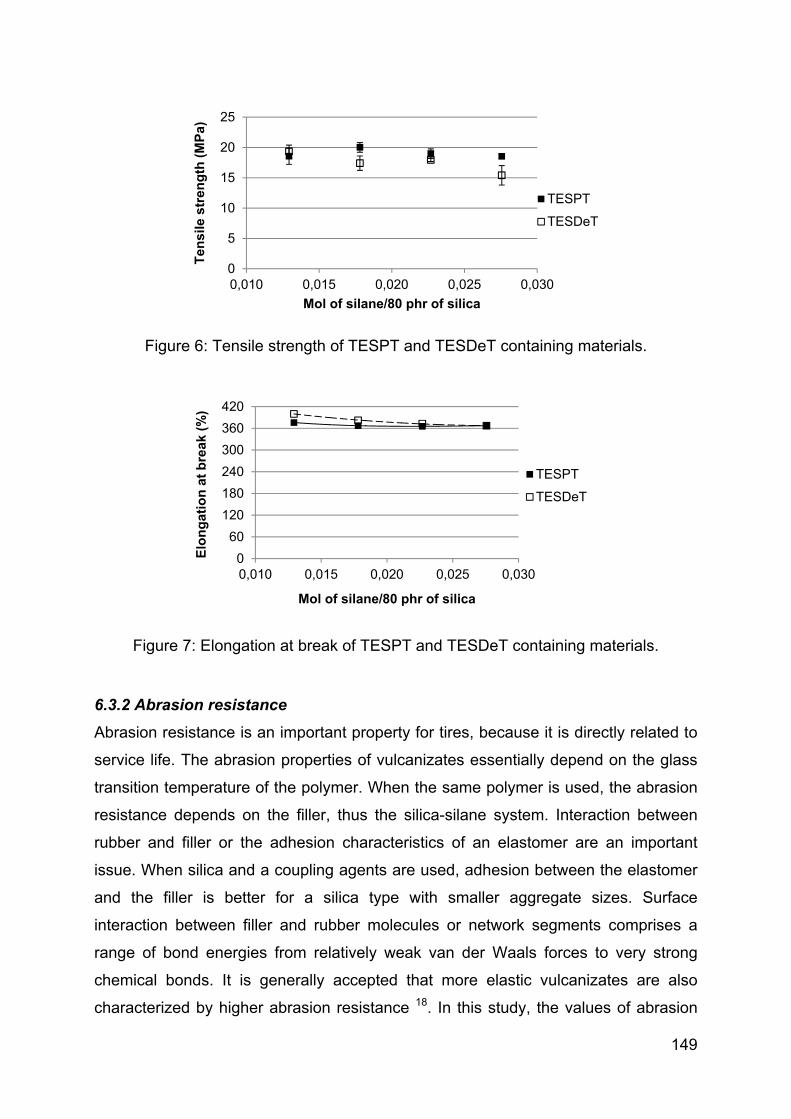
149
Figure 6: Tensile strength of TESPT and TESDeT containing materials.
Figure 7: Elongation at break of TESPT and TESDeT containing materials.
6.3.2 Abrasion resistance
Abrasion resistance is an important property for tires, because it is directly related to
service life. The abrasion properties of vulcanizates essentially depend on the glass
transition temperature of the polymer. When the same polymer is used, the abrasion
resistance depends on the filler, thus the silica-silane system. Interaction between
rubber and filler or the adhesion characteristics of an elastomer are an important
issue. When silica and a coupling agents are used, adhesion between the elastomer
and the filler is better for a silica type with smaller aggregate sizes. Surface
interaction between filler and rubber molecules or network segments comprises a
range of bond energies from relatively weak van der Waals forces to very strong
chemical bonds. It is generally accepted that more elastic vulcanizates are also
characterized by higher abrasion resistance 18. In this study, the values of abrasion
0
5
10
15
20
25
0,010 0,015 0,020 0,025 0,030
Ten
sile
str
eng
th (
MP
a)
Mol of silane/80 phr of silica
TESPT
TESDeT
0
60
120
180
240
300
360
420
0,010 0,015 0,020 0,025 0,030
Elo
ng
atio
n a
t b
reak
(%
)
Mol of silane/80 phr of silica
TESPT
TESDeT

150
loss of the materials containing the different silanes are similar within the accuracy of
the measurements, see Figure 8. An exception is the sample containing 20.5 phr of
TESDeT, for which the abrasion loss is considerably higher than that of the TESPT
counterpart - even when the general value of error of approximately 10 % for DIN
abrasion is considered.
Figure 8: DIN abrasion of the samples containing TESPT and TESDeT silanes
The increased abrasion loss of the sample containing 20.5 phr of TESDeT might be
the result of formation of a thick or multi-layer silane-shell around silica particles
caused by the high molecular weight of the silane with the longer linker. As a
consequence, weak physical silica-polymer interactions become dominant. This
effect is similar to the case in which TESH was used, see Figure 6 in Chapter 4. In
this extreme case it can lead to loosely bound polymer chains on the surface of the
silica particles which deteriorates the integrity of the composite. A lower integrity is
also visible in the lower value of tensile strength for the sample containing 20.5 phr of
the TESDeT silane; compare with Figure 6.
6.3.3 Payne effect – filler-filler interactions
The reduction in storage modulus with increasing strain amplitude in a dynamic
mechanical test is commonly referred to as the Payne effect 19. Values of the Payne
effect for both silanes are similar; see Figure 9. Like before, an exception is the
sample containing 20.5 phr of TESDeT. An increased Payne effect can be the result
of an increased crosslink density around the silica particles as explained in Chapter
5, or simply of higher filler-filler interactions. In case of the silane with the longer
76
55
4138
7162
48
60
0
10
20
30
40
50
60
70
80
90
0,01 0,015 0,02 0,025 0,03
Ab
rasi
on
loss
(m
m3)
Mol of silane/80 phr of silica
TESPT
TESDeT
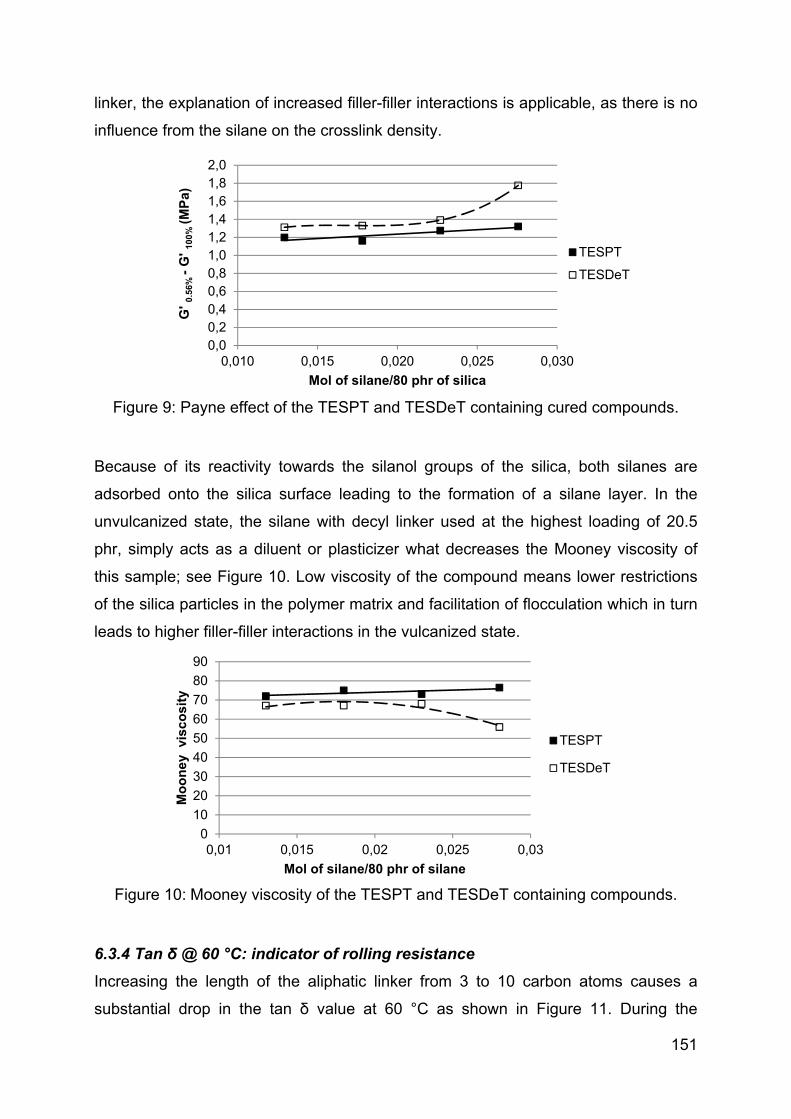
151
linker, the explanation of increased filler-filler interactions is applicable, as there is no
influence from the silane on the crosslink density.
Figure 9: Payne effect of the TESPT and TESDeT containing cured compounds.
Because of its reactivity towards the silanol groups of the silica, both silanes are
adsorbed onto the silica surface leading to the formation of a silane layer. In the
unvulcanized state, the silane with decyl linker used at the highest loading of 20.5
phr, simply acts as a diluent or plasticizer what decreases the Mooney viscosity of
this sample; see Figure 10. Low viscosity of the compound means lower restrictions
of the silica particles in the polymer matrix and facilitation of flocculation which in turn
leads to higher filler-filler interactions in the vulcanized state.
Figure 10: Mooney viscosity of the TESPT and TESDeT containing compounds.
6.3.4 Tan δ @ 60 °C: indicator of rolling resistance
Increasing the length of the aliphatic linker from 3 to 10 carbon atoms causes a
substantial drop in the tan δ value at 60 °C as shown in Figure 11. During the
0,00,20,40,60,81,01,21,41,61,82,0
0,010 0,015 0,020 0,025 0,030
G' 0
.56
% -
G' 1
00
% (M
Pa)
Mol of silane/80 phr of silica
TESPT
TESDeT
0
10
20
30
40
50
60
70
80
90
0,01 0,015 0,02 0,025 0,03
Mo
on
ey
visc
osi
ty
Mol of silane/80 phr of silane
TESPT
TESDeT

152
dynamic deformation at elevated temperature and strain amplitudes, the energy
losses are mainly the result of adsorption-desorption processes of the polymer chains
on the filler surface. Due to the flexibility of the TESDeT linker, it can accommodate
higher strain amplitudes within the filler-polymer interphase occurring during rolling,
instead of transferring them directly onto the filler surface. A thicker layer of silane on
the silica surface acts as a soft isolation between the filler surfaces. This in turn leads
to less pronounced friction between the filler particles. The contribution of the
polymer network in the energy transfer at higher temperatures and strain amplitudes
is higher when TESDeT is used, as short, more rigid filler-polymer bonds like in the
case of TESPT lead to a thinner silane shell around silica particles in which the
polymer movements are more restricted.
Values of tan δ at 60 °C plotted against the molar concentration of TESPT and
TESDeT are characterized by the same decreasing trends. That again can be
explained by the increasing thickness of the above mentioned silane layer on the
silica surface with rising concentration of both silanes.
Figure 11: Tan δ at 60 °C as indication of rolling resistance of the samples containing
TESDeT and TESPT.
Both silanes can be also treated as plasticizers which increase the separation
between the polymer chains. Separation of the polymer chains is associated with the
formation of swollen compound which basically can temporarily store the energy
during a dynamic deformation more efficiently in comparison with the non-swollen
state.
7 phr9.5 phr
12 phr14.4 phr
9.5 phr 13 phr
16.8 phr 20.5 phr
0
0,02
0,04
0,06
0,08
0,1
0,12
0,14
0,16
0,18
0,010 0,015 0,020 0,025 0,030
Tan
δat
60
°C
Mol of silane/80 phr of silica
TESPT
TESDeT

6.3.5 T
At low
TESPT
trend is
a longe
restricte
chains
extra e
temper
Figure
In orde
compo
moduli
tan δ p
differen
contain
contrib
in Figur
0,
0,
0,
0,
0,
0,
0,
Tan
δTan δ @ at
er temper
T by TESD
s also perc
er linker lea
ed movem
can contr
energy lea
rature.
12: Tan δ
of dynami
er to furthe
unds conta
(G”) need
peak are pl
nces in sto
ning the tw
ution of the
re 12 is mu
0
1
2
3
4
5
6
7
-50 -40
t low temp
ratures, pr
DeT leads t
ceived whe
ads to less
ments of the
ribute to e
ding to th
versus tem
ic strain fo
er explore
aining TES
to be con
lotted agai
orage mod
wo invest
e storage
uch higher
-30 -20
peratures:
referably n
to increase
en the filler
s restricted
e polymer
nergy diss
e increase
mperature
r the comp
the natur
SPT and T
sidered; se
nst the mo
dulus than
igated sila
modulus in
r than the c
-10 0
Tempera
indicator
near the
ed energy
content is
d polymer
chains me
sipation at
e in the hy
dependen
pounds con
re of the d
TESDeT, th
ee Table II
olar conce
n in loss m
anes; see
n the differ
contribution
10 20
ature (°C)
r of wet sk
glass tran
dissipation
s reduced 2
movement
eans that a
t lower tem
ysteresis p
ce measur
ntaining TE
differences
he values
I. When th
ntration of
modulus a
Figure 1
rences of t
n of the los
30 40
kid resistan
nsition, the
n, see Figu20,21,22. It ag
ts at the si
a higher nu
mperatures
peak at th
red at 1% o
ESPT and
s in hyster
of the stor
e values o
f the silane
re evident
3. This s
the tan δ p
ss modulus
50 60
nce
e replacem
ure 12. Th
gain indica
ilica surfac
umber of p
s. This con
e glass tr
of static an
DMESPT.
resis betwe
rage (G’) a
of G’ and G
e, more sig
t for the s
suggests t
peak heigh
s.
TESPT
TESPT
TESPT
TESPT
TESDe
TESDe
TESDe
TESDe
153
ment of
e same
ates that
ce. Less
polymer
nsumes
ansition
nd 0.1%
een the
and loss
G” at the
gnificant
samples
that the
t visible
T 7
T 9.5
T 12
T 14
eT 9.5
eT 13
eT 16.8
eT 20.5
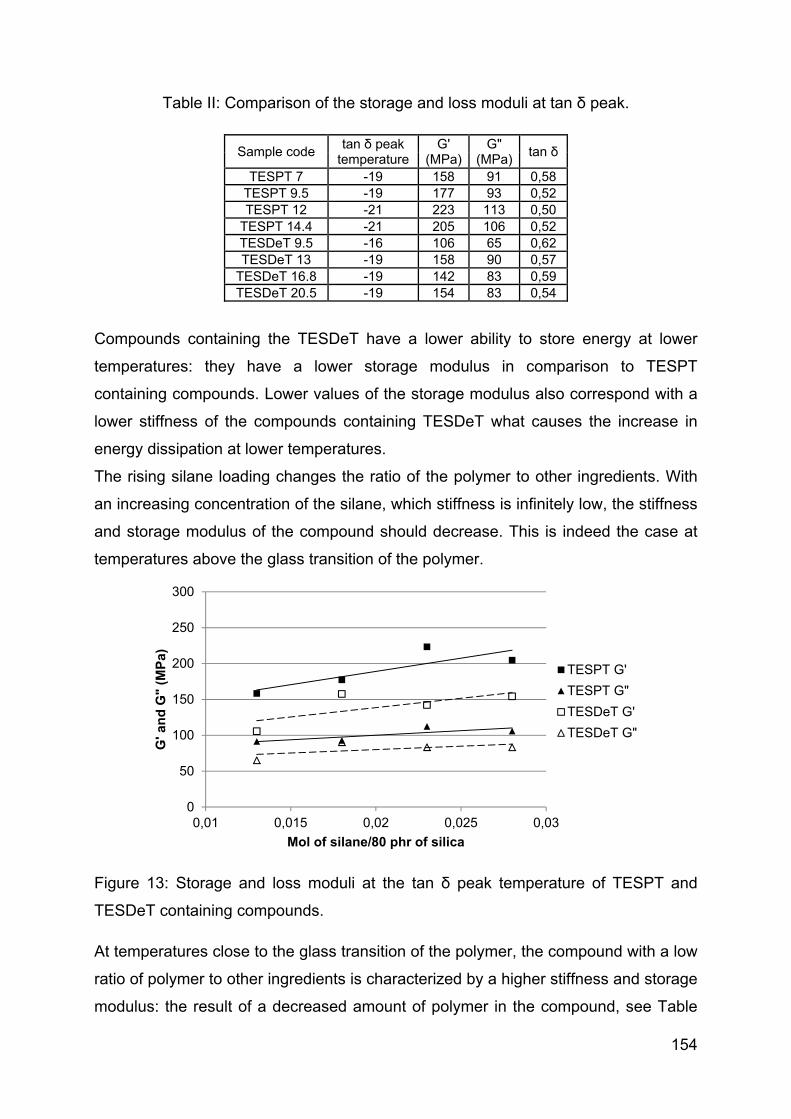
154
Table II: Comparison of the storage and loss moduli at tan δ peak.
Sample code tan δ peak
temperature G'
(MPa)G"
(MPa)tan δ
TESPT 7 -19 158 91 0,58 TESPT 9.5 -19 177 93 0,52 TESPT 12 -21 223 113 0,50
TESPT 14.4 -21 205 106 0,52 TESDeT 9.5 -16 106 65 0,62 TESDeT 13 -19 158 90 0,57
TESDeT 16.8 -19 142 83 0,59 TESDeT 20.5 -19 154 83 0,54
Compounds containing the TESDeT have a lower ability to store energy at lower
temperatures: they have a lower storage modulus in comparison to TESPT
containing compounds. Lower values of the storage modulus also correspond with a
lower stiffness of the compounds containing TESDeT what causes the increase in
energy dissipation at lower temperatures.
The rising silane loading changes the ratio of the polymer to other ingredients. With
an increasing concentration of the silane, which stiffness is infinitely low, the stiffness
and storage modulus of the compound should decrease. This is indeed the case at
temperatures above the glass transition of the polymer.
Figure 13: Storage and loss moduli at the tan δ peak temperature of TESPT and
TESDeT containing compounds.
At temperatures close to the glass transition of the polymer, the compound with a low
ratio of polymer to other ingredients is characterized by a higher stiffness and storage
modulus: the result of a decreased amount of polymer in the compound, see Table
0
50
100
150
200
250
300
0,01 0,015 0,02 0,025 0,03
G' a
nd
G"
(MP
a)
Mol of silane/80 phr of silica
TESPT G'
TESPT G"
TESDeT G'
TESDeT G"

155
III. Furthermore, with increasing loading of the silane, the stiffness and storage
modulus further increases and hysteresis decreases.
Table III: Weight ratio of polymer to remaining ingredients of the compound.
Compound name
TE
SP
T 7
TE
SP
T 9
.5
TE
SP
T 1
2
TE
SP
T 1
4.5
TE
SD
eT 9
.5
TE
SD
eT 1
3
TE
SD
eT 1
6.8
TE
SD
eT 2
0.5
Ratio of polymer to other ingredients
1,27 1,24 1,21 1,19 1,24 1,2 1,16 1,13
Compounds can also be compared at equalized concentration of silane. When the
same concentration of 9.5 phr of both silanes is compared, the storage modulus is
lower and the hysteresis is higher for the compound containing TESDeT silane.
Apparently, the molecular weight of the silane has a contribution to the compound
stiffness: The higher the molecular weight of the silane, the lower the stiffness and
storage modulus of the compound, and as a consequence the higher the hysteresis
at low temperatures. Because of the long linker of TESDeT, its molar mass is also
higher than that of TESPT. At lower temperatures, the molecule of TESDeT itself
would be characterized by a higher flexibility than the molecule of TESPT. That in
turn contributes to lower values of the storage moduli for the TESDeT containing
compounds. Therefore the introduction of a coupling agent with a molecular weight
higher than that of the TESPT to the compound will lead to increased hysteresis at
lower temperatures.
Summarizing the two last subsections: At higher temperatures, approximately 60 °C,
an increasing concentration of both silanes leads to a less stiff compound with less
internal filler-filler interactions, and therefore decreasing hysteresis. When the silanes
are compared at lower temperature, close to the glass transition, the TESDeT results
in a higher hysteresis than TESPT. At lower temperature, a higher concentration of
silanes is corresponds to a lower amount of polymer, thus the hysteresis is
decreasing with increasing concentration of both silanes. The increased hysteresis of
the compounds containing the TESDeT in comparison with equimolar concentrations
of TESPT is related to the higher molecular weight of the former, which results in a
higher mobility of the polymer chains at the silica surface. The higher molecular
weight of the TESDeT can be considered as a negative aspect, because higher
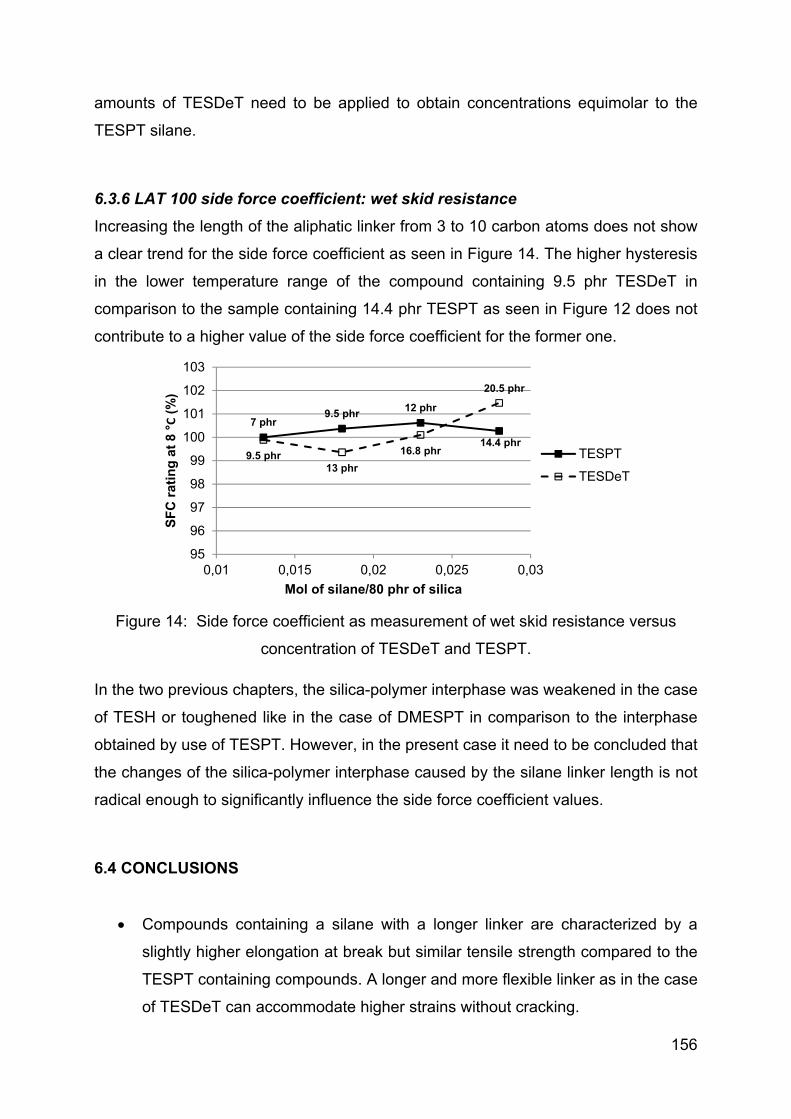
156
amounts of TESDeT need to be applied to obtain concentrations equimolar to the
TESPT silane.
6.3.6 LAT 100 side force coefficient: wet skid resistance
Increasing the length of the aliphatic linker from 3 to 10 carbon atoms does not show
a clear trend for the side force coefficient as seen in Figure 14. The higher hysteresis
in the lower temperature range of the compound containing 9.5 phr TESDeT in
comparison to the sample containing 14.4 phr TESPT as seen in Figure 12 does not
contribute to a higher value of the side force coefficient for the former one.
Figure 14: Side force coefficient as measurement of wet skid resistance versus
concentration of TESDeT and TESPT.
In the two previous chapters, the silica-polymer interphase was weakened in the case
of TESH or toughened like in the case of DMESPT in comparison to the interphase
obtained by use of TESPT. However, in the present case it need to be concluded that
the changes of the silica-polymer interphase caused by the silane linker length is not
radical enough to significantly influence the side force coefficient values.
6.4 CONCLUSIONS
Compounds containing a silane with a longer linker are characterized by a
slightly higher elongation at break but similar tensile strength compared to the
TESPT containing compounds. A longer and more flexible linker as in the case
of TESDeT can accommodate higher strains without cracking.
7 phr9.5 phr 12 phr
14.4 phr9.5 phr
13 phr
16.8 phr
20.5 phr
95
96
97
98
99
100
101
102
103
0,01 0,015 0,02 0,025 0,03
SF
C r
atin
g a
t 8
°C(%
)
Mol of silane/80 phr of silica
TESPT
TESDeT

157
An increased linker length of the coupling agent reduces rolling resistance
significantly, but does not change wet skid resistance. The longer linker of
TESDeT can accommodate higher strain amplitudes within the filler-polymer
interphase occurring during rolling, instead of transferring them directly onto
the filler surface.
An increased linked length increases hysteretic losses of the material in the
glass transition temperature range of the elastomer. A more flexible linker in
the case of TESDeT leads to less restricted polymer movements at the filler-
polymer interphase in comparison with the reference silane. Hence more
polymer can contribute to the energy dissipation phenomena at the glass
transition temperature.
By replacing TESPT by a silane with a longer linker, the rolling resistance of
this material in a tire tread can be improved. However, the major drawback of
TESDeT is its high molecular weight: in order to obtain equimolar
concentrations, higher amounts of TESDeT need to be applied compared to
TESPT.

158
REFERENCES
[1] H. G. Monneypenny, J. Harris, S. Laube, 148th Technical meeting of the
Rubber Division ACS, 17-29th October 1995, Cleveland, Ohio. [2] S. Futamura, Rubber Chem. Technol. 64 (1991) 57. [3] K. A. Grosh, Rubber Chem. Technol. 27 (1964) 386. [4] N. Yoshimura, M. Okuyama, K. Yanagawa, 122th Technical meeting of the
Rubber Division ACS, 5-7th October 1982, Chicago, Illinois. [5] A. R. Payne, Rubb. Plast. Age. 42 (1961) 963. [6] A. R. Payne, R. F. Whittaker, Rubber Chem. Technol. 44 (1971) 440. [7] J. Fröhlich, H.D. Luginsland, Rubber World 4 (2001) 28. [8] H. D. Luginsland, J. Fröhlich, A. Wehmeier, Rubber Chem. Technol. 75 (2002)
563. [9] L. L. Stelandre, Y. Bomal, L. Flandin, D. Labarre, Rubber Chem. Technol, 76
(2003) 145. [10] J. W. ten Brinke, P. J. van Swaaij, L. A. E. M. Reuvekamp,
J. W. M. Noordermeer, Rubber Chem. Technol. 76 (2003) 12. [11] O. Klockmann, P. Albert, A. Hasse, K. Korth, Rubber World 234 (2006) 36. [12] O. Klockmann, Kautsch. Gummi Kunstst. 60 (2007) 428. [13] M. J. Wang, Kautsch. Gummi Kunstst. 61 (2008) 33. [14] M. Heinz, K. A. Grosch, 167th Technical meeting of the Rubber Division ACS,
16-18th May 2005, San Antonio, Texas. [15] L. Guy, Ph. Cochet, Y. Bomal , S. Daudey, Kautsch. Gummi Kunstst. 63
(2009) 383. [16] L. A. E. M. Reuvekamp, “Reactive mixing of silica and rubber for tires and
engine mounts”, PhD Thesis: 2003, Dept. of Rubber Technology, Univ. of Twente, Enschede, the Netherlands ISBN 90 365 1856 3.
[17] M. Heinz, J. Rubb. Res. 13 (2010) 91. [18] K.H. Nordsiek, Kautsch. Gummi Kunstst. 38 (1985) 177. [19] A. R. Payne, J. Appl. Polym. Sci. 6 (1962) 57. [20] L. Guy, Ph. Cochet, Y. Bomal, S. Daudey, Kautsch. Gummi Kunstst. 62 (2009)
383. [21] M. M. Jacobi, M. V. Braum, T. L. A. C. Rocha, R. H. Schuster, Kautsch.
Gummi Kunstst. 60 (2007) 460. [22] M. J. Wang, Kautsch. Gummi Kunstst. 60 (2007) 438.

159
Chapter 7
Modification of the silane coupling agent for improvement of wet traction and rolling resistance: Influence of the type of alkoxy
group
The type of alkoxy groups on the silane coupling agent determines the silanization
rate and the kind of alcohol evolved during the silanization reaction. Therefore,
independent of the reactivity of the silane towards the silica surface and of the
reactivity towards the polymer chain, the physical and chemical properties of
byproducts of the silanization reaction are of great importance for the material
performance. To investigate the influence of the alkoxy group on wet skid and rolling
resistance related properties, two silanes differing in the alkoxy group but with
otherwise comparable structures were synthetized. One silane with methoxy-groups,
bis-(dimethylmethoxysilylpropyl)tetrasulfide (MMeOS), was chosen due to its high
silanization rate, and bis-(dimethylmethoxyethoxysilylpropyl) tetrasulfide
(MMeOEtOS) for its increased affinity of the hydrolysable group towards the silica
surface. Both silanes were compared with the reference silane - bis-
(triethoxysilylpropyl) tetrasulfide (TESPT).
Silica reinforced compounds containing the novel silanes are characterized by
improved wet skid and rolling resistance indicators in comparison with TESPT
containing samples. Improvement of both properties is the result of the absence of
lateral alkoxy groups in the synthetized silanes, with increased stiffness of the
polymer-filler interface as a consequence. The additional effect of extra filler network
in the samples containing MMeOEtOS, at lower temperatures induced by hydrogen
bonding, causes a higher stiffness followed by the highest rating of the wet skid
resistance.
160
7.1 INTRODUCTION
Silica as a reinforcing filler results in several advantages over carbon black. Used in
tire treads, silica reduces rolling resistance (RR) and improves wet skid resistance
(WSR) and wear resistance 1. Therefore, tire treads of passenger cars are nowadays
almost exclusively produced in Europe with the use of silica technology instead of
carbon black as filler. The key element in this technology is the coupling agent, a
silane, which chemically couples silica to the rubber polymer. The molecular structure
of the silane determines the polymer-filler interactions, which on their turn influence
wet skid, rolling resistance and other physical properties of the tire tread. The most
widely used bifunctional silane coupling agent for tire applications is bis-
(triethoxysilylpropyl) tetrasulfide or (TESPT) 2,3,4.
The silica surface contains different types of reactive silanol groups: isolated, vicinal
and geminal 5,6. Apart from the reactive groups, the silica surface contains
approximately 6 - 8 % of bound water 7,8. The reaction of a silane coupling agent with
the silanol groups on the silica surface is referred to as silanization. The actual
bonding of the polymer chains to the silica surface via the coupling agent occurs
during the curing process, and in case of TESPT the mechanism and kinetics were
investigated by Görl et al. 9, Luginsland 10 and Reuvekamp 11,12. At elevated
temperatures during mixing, the alkoxy groups of the silane coupling agent undergo
hydrolysis and transform into highly reactive hydroxyl groups. The rate of hydrolysis
and silanization depends on the type of alkoxy group: methoxy > ethoxy > propoxy.
The silanization reaction is an equilibrium reaction. To achieve a high yield of
silanization, the byproducts of the reaction, an alcohol, needs to be removed from the
reaction medium 13,14. Hence the longer the alkyl chain of the alkoxy group, the more
difficult it becomes to evaporate the alcohol and to achieve a high degree of
conversion.
Other ingredients of the rubber compound can have a catalytic effect on the
silanization. For instance compounds based on styrene-butadiene rubber, in which
zinc oxide is used as co-agent for sulfur vulcanization, show a decrease in compound
viscosity in comparison with compounds without this oxide 15. Nevertheless, the type
of alkoxy groups of the silane coupling agent remains the most important factor
during the silanization process.

161
The objective of the present chapter is to show the effects of two different alkoxy
moieties, methoxy- and methoxyethoxy-, on wet skid and rolling resistance tire
performance indicators in comparison with triethoxy- in TESPT.
As a first approach, a silane with the methoxy group was chosen because of its rapid
hydrolysis capabilities resulting in a high silanization rate. A coupling agent with a
high silanization rate could possibly cover more of the silica surface in comparison
with a slower reacting silane in the same period of time, and this should result in
improved wet skid and rolling resistance performance. The second approach towards
increasing the reactivity of the silane towards the silica is based on an increased
polarity of the hydrolysable group of the silane coupling agent. In order to react with
silica during the mixing step, the coupling agent must migrate towards the silica
surface. Additional oxygen atoms present in a methoxyethoxy-moiety makes it more
polar in comparison with the single methoxy group. This could provide better
adsorption of the silane molecules on the silica surface and lead to increased
efficiency of the silanization reaction.
The influence of the silica-polymer interphase structure on the wet skid performance
is investigated by testing the dynamic properties, in particular the tan δ in the
temperature range from 0 – 20 °C at 10 Hz. The values of the loss tangent in this
temperature range are so far the most suitable indicators for the wet skid
performance of a tire tread 16. However, a WSR indicator closer to actual practice are
measurements on a Laboratory Abrasion Tester 100 (LAT 100), on which additional
measurements are performed 17.
7.2 EXPERIMENTAL
In order to investigate the influence of modifications in the hydrolysable group of the
silane on wet skid as well as rolling resistance, two different silanes were selected for
the experiments and synthetized. Both silanes are compared to the reference silane
TESPT.
In the first modification, two ethoxy-groups out of three per silicon atom are replaced
by inert methyl-groups, and the ethoxy hydrolysable group was replaced by a
methoxy-group: bis-(dimethylmethoxysilylpropyl) tetrasulfide or monomethoxysilane
(MMeOS). This modification leads to a silane with an alkoxy-group which is more

162
susceptible to hydrolysis than an ethoxy-group. In the second silane, again two
ethoxy-groups out of three per silicon atom are replaced by inert methyl-groups, and
the ethoxy hydrolysable group was replaced by a methoxyethoxy-group: bis-
(dimethylmethoxyethoxysilylpropyl) tetrasulfide or monomethoxyethoxysilane
(MMeOEtOS). This modification should result in a better adsorption of the silane
onto the silica surface due to the increased polarity of the hydrolysable group. In
order to avoid sterical hindrance influencing the silanization kinetics and efficiency,
only one reactive moiety was used; two ethoxy-groups of the reference silane were
replaced by non-reactive methyl groups. The structure of the two experimental
coupling agents and the reference silane, TESPT, are shown in Figure 1. The silane
coupling agent TESPT was commercially obtained from Evonik GmbH with an
average sulfur rank of 3,7; the MMeOS and MMeOEtOS were synthetized in our
laboratory.
Figure 1: Structure of bis-(dimethylmethoxysilylpropyl) tetrasulfide, MMeOS (top)
bis-(dimethylmethoxyethoxysilylpropyl) tetrasulfide, MMeOEtOS (middle), and
bis-(triethoxysilylpropyl) tetrasulfide, TESPT (bottom).
7.2.1 Preparation of the silanes
Bis-(dimethylmethoxysilylpropyl) polysulfide (MMeOS) – This silane was synthetized
in absolute methanol in a nitrogen atmosphere by refluxing 3-
chloropropyl dimethylmethoxysilane (ABCR GmbH, Karlsruhe, Germany) and sodium
SS
SS Si
SiO
O
O
O
SS
SS Si
Si
O
O
O
O
OO
SS
SS Si
SiO
O
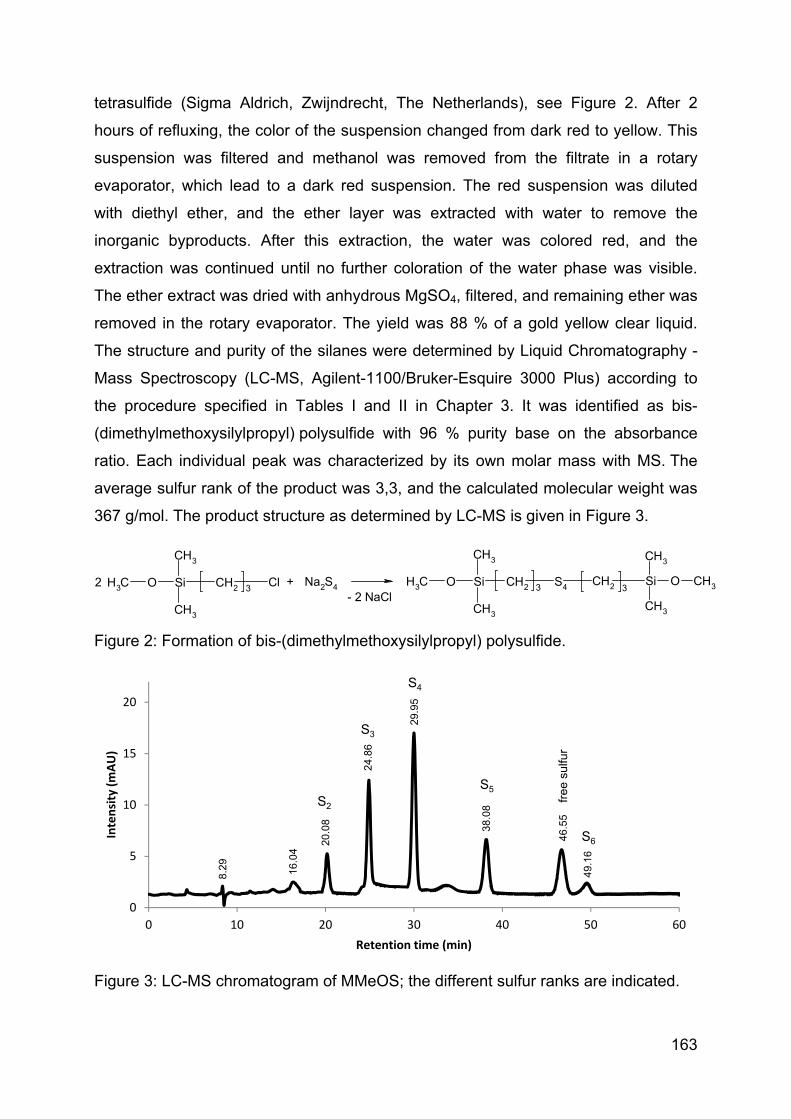
163
tetrasulfide (Sigma Aldrich, Zwijndrecht, The Netherlands), see Figure 2. After 2
hours of refluxing, the color of the suspension changed from dark red to yellow. This
suspension was filtered and methanol was removed from the filtrate in a rotary
evaporator, which lead to a dark red suspension. The red suspension was diluted
with diethyl ether, and the ether layer was extracted with water to remove the
inorganic byproducts. After this extraction, the water was colored red, and the
extraction was continued until no further coloration of the water phase was visible.
The ether extract was dried with anhydrous MgSO4, filtered, and remaining ether was
removed in the rotary evaporator. The yield was 88 % of a gold yellow clear liquid.
The structure and purity of the silanes were determined by Liquid Chromatography -
Mass Spectroscopy (LC-MS, Agilent-1100/Bruker-Esquire 3000 Plus) according to
the procedure specified in Tables I and II in Chapter 3. It was identified as bis-
(dimethylmethoxysilylpropyl) polysulfide with 96 % purity base on the absorbance
ratio. Each individual peak was characterized by its own molar mass with MS. The
average sulfur rank of the product was 3,3, and the calculated molecular weight was
367 g/mol. The product structure as determined by LC-MS is given in Figure 3.
Figure 2: Formation of bis-(dimethylmethoxysilylpropyl) polysulfide.
Figure 3: LC-MS chromatogram of MMeOS; the different sulfur ranks are indicated.
2 + Si
CH3
CH3
O CH3CH2 3SiOCH3
CH3
CH3
S4CH2SiO
CH3
CH3
CH3 CH2 Cl3Na2S4 3
- 2 NaCl
8.29 16
.04
20.0
8
S2
S3
24.8
6
S4
29.9
5
S5
38.0
8
46.5
5
S6
49.1
6
0
5
10
15
20
0 10 20 30 40 50 60
Intensity (mAU)
Retention time (min)
free
sul
fur

164
Bis-(dimethylmethoxyethoxysilylpropyl) polysulfide (MMeOEtOS) – was prepared in a
two-step synthesis. During the first step, 3-chloropropyl-dimethylmethoxyethoxysilane
was synthetized 18. 2-Methoxyethanol, dried under anhydrous magnesium sulfate,
was placed in a three-neck round bottom flask immersed in an oil bath with a
temperature controller. The flask was equipped with a reflux condenser, addition
funnel and nitrogen feed. The 3-chloropropyldimethylchlorosilane was added drop
wise to methoxyethanol. In order to facilitate the reaction by the evacuation of
hydrogen chloride from the reaction medium, a gentle flow of nitrogen was
implemented. The reaction was carried out for 7 hours at a temperature of 100 °C.
Under these circumstances, the reaction as shown in Figure 4 takes place.
Unreacted 2-methoxyethanol and 3-chloropropyldimethylchlorosilane were removed
in a rotary evaporator. The remaining liquid was a colorless product, 3-
chloropropyldimethylmethoxyethoxysilane, in a yield of 78 % and a purity of 98 % as
determined by LC-MS. The product structure was also determined with the aid of LC-
MS. The mass calculated for C8H19O2SiClH+ is 211,62 g/mol; the mass found by LC-
MS was 212,70 g/mol.
Figure 4: Formation of 3-chloropropyldimethylmethoxyethoxysilane
During the second step of the reaction, 3-chloropropyldimethylmethoxyethoxysilane
was refluxed in anhydrous ethanol with sodium tetrasulfide; see Figure 5. After 5
hours of refluxing, the color of the suspension changed from dark red to yellow. This
suspension was filtered and ethanol was removed from the filtrate in a rotary
evaporator leading to a dark red suspension, which was then diluted with diethyl
ether. The ether phase was extracted with water until no coloration of the water
phase was noticed any more. The ether extract was dried with anhydrous MgSO4,
filtered, and ether was removed in the rotary evaporator. The yield was 87 % of a
gold yellow clear liquid, bis-(dimethylmethoxyethoxysilylpropyl) tetrasulfide, with 95 %
purity measured by LC-MS. The average sulfur rank of the product was 3.7 and the
calculated molecular weight was 478 g/mol. The product structure was determined
with the aid of LC-MS and given in Figure 6.
SiCl
CH3
CH3
CH2 Cl3CH2OCH3 CH2 OH- HCl
+ SiO
CH3
CH3
CH2 CH2 Cl3CH2OCH3
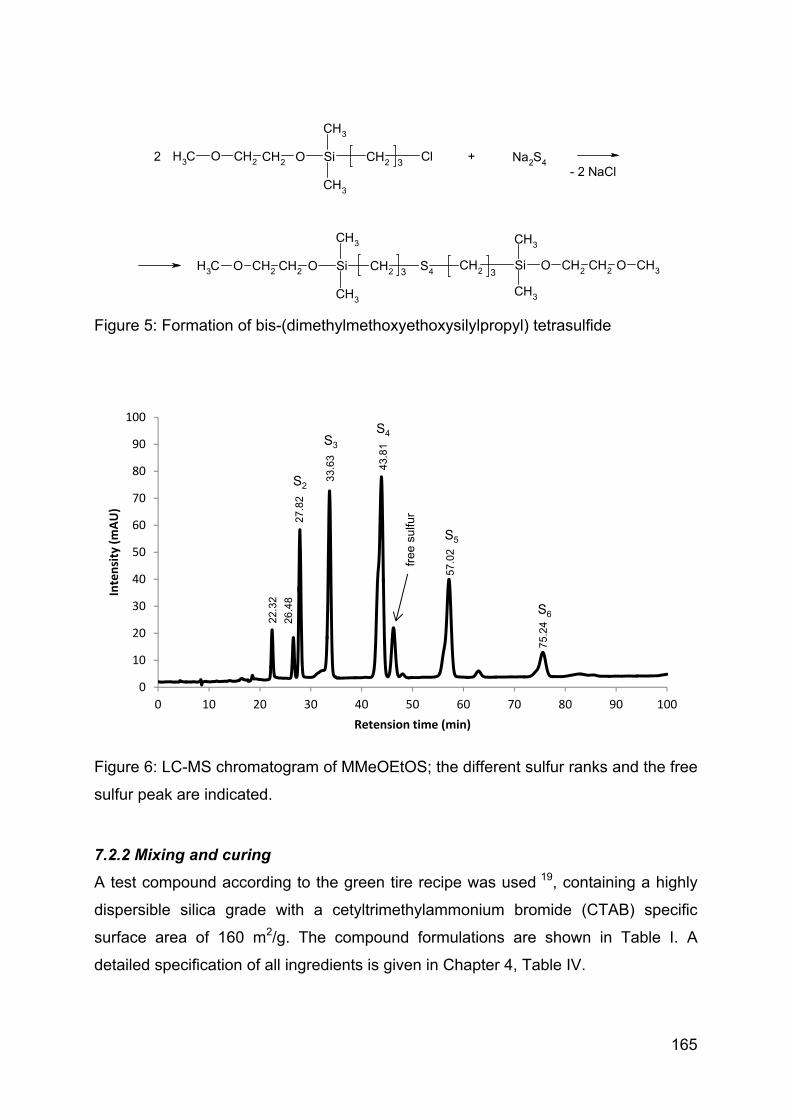
165
Figure 5: Formation of bis-(dimethylmethoxyethoxysilylpropyl) tetrasulfide
Figure 6: LC-MS chromatogram of MMeOEtOS; the different sulfur ranks and the free
sulfur peak are indicated.
7.2.2 Mixing and curing
A test compound according to the green tire recipe was used 19, containing a highly
dispersible silica grade with a cetyltrimethylammonium bromide (CTAB) specific
surface area of 160 m2/g. The compound formulations are shown in Table I. A
detailed specification of all ingredients is given in Chapter 4, Table IV.
2 +
Si
CH3
CH3
O CH2 CH2 O CH3CH2 3SiOCH2
CH3
CH3
CH2OCH3 S4CH2
SiO
CH3
CH3
CH2 CH2 Cl3CH2OCH3 Na2S4
3
- 2 NaCl
free
sul
fur
26.4
8
22.3
2
27.8
2
33.6
3
43.8
1
S4
57.0
2
S2
S5
S3
S6
75.2
4
0
10
20
30
40
50
60
70
80
90
100
0 10 20 30 40 50 60 70 80 90 100
Intensity (mAU)
Retension time (min)

166
MMeOS and MMeOEtOS were applied at four different concentrations equimolar to
the concentration of the reference silane TESPT, and with sulfur adjustment. The
TESPT content was adjusted for the reference compound, the first compound in
Table I, according to the CTAB specific surface area of this silica type by using the
empirical equation proposed by L. Guy: Equation 1 20. The amount of free sulfur
added together with the curatives for all compounds was adjusted to keep the total
molar amount of sulfur including the sulfur contained in the coupling agent at a
constant level in all batches. In all cases, the total sulfur content was kept constant;
the reactivity difference between polysulfidic groups in the coupling agents containing
3.3 or 3.7 sulfur atoms was not taken into consideration.
silicasilica phrCTABphrTESPT )()(103.5)( 4
(Equation 1)
To prepare the compounds, an internal laboratory mixer, Brabender 350 S with a
mixing volume of 390 cm3, was used. The mixing procedure was specified in Chapter
4, Table V. The total volume of each batch was adjusted to a fill factor of 70 %.
Preparation of sheets for testing was done on a Schwabenthan Polymix 80T 300 ml
two roll mill. The samples were cured in a Wickert press WLP 1600 at 160 ºC and 10
MPa to sheets with a thickness of 2 mm according to their t90 optimum vulcanization
time as determined in a Rubber Process Analyzer, RPA 2000, from Alpha
Technologies.
Table I: Rubber compound formulations
Ingredient Sample code
TE
SP
T 7
TE
SP
T 9
,5
TE
SP
T 1
2
TE
SP
T 1
4,4
MM
eOS
-4,9
MM
eOS
-6,6
MM
eOS
-8,4
MM
eOS
-9,7
MM
eOE
tOS
6,3
MM
eOE
tOS
8,6
MM
eOE
tOS
11
MM
eOE
tOS
12,
7
S-SBR 103 103 103 103 103 103 103 103 103 103 103 103 BR 25 25 25 25 25 25 25 25 25 25 25 25
Silica (1165MP) 80 80 80 80 80 80 80 80 80 80 80 80 TESPT 7,0 9,5 12,0 14,4MMeOS 5,0 6,6 8,3 9,6
MMeOEtOS 6,3 8,6 11,0 12,7TDAE 5 5 5 5 5 5 5 5 5 5 5 5
Zinc oxide 2,5 2,5 2,5 2,5 2,5 2,5 2,5 2,5 2,5 2,5 2,5 2,5 Stearic acid 2,5 2,5 2,5 2,5 2,5 2,5 2,5 2,5 2,5 2,5 2,5 2,5
6PPD 2 2 2 2 2 2 2 2 2 2 2 2 TMQ 2 2 2 2 2 2 2 2 2 2 2 2 Sulfur 1,4 0,8 0,2 0,0 1,5 1,1 0,5 0,2 1,4 0,8 0,2 0,0 TBBS 1,7 1,7 1,7 1,7 1,7 1,7 1,7 1,7 1,7 1,7 1,7 1,7 DPG 2,0 2,0 2,0 2,0 2,0 2,0 2,0 2,0 2,0 2,0 2,0 2,0

167
7.2.3 Characterization methods
The Mooney viscosity ML(1+4) of the compounds was measured at 100 °C on a
Mooney viscometer MV 2000E (Alpha Technologies) according to ISO 289-1.
Payne effect measurements were done using the RPA 2000 before and after
vulcanization for 1.2 x t90 at 160 °C in the RPA. The differences in values of the
storage modulus at 1 % strain and 90 % strain were measured at 100 °C and at a
frequency of 0.5 Hz.
In order to predict the rolling resistance, single point measurements of tan δ at 60 °C
and 6 % strain were performed on the RPA 2000, after vulcanization for 1.2 x t90 at
160 °C in the same RPA 21.
Dynamic mechanical analysis was performed in the tensile mode on a Metravib DMA
2000 dynamic spectrometer. The samples were cut with a 40 x 5 mm die from the
cured sheets of the rubber compounds. For dynamic curves, measurements were
performed at temperatures between -50 ºC and 80 ºC at a dynamic strain of 0.1%
and a frequency of 10 Hz.
A Laboratory Abrasion Tester 100 (LAT 100, VMI Group) was used to estimate the
wet skid resistance of the tire treads in conditions which better reflect the real
conditions on the road; see Figure 3, Chapter 3 22.
7.3 RESULTS AND DISCUSSION
7.3.1 Mooney viscosity
Despite an expected increase in reactivity of the monomethoxy-moiety towards the
silanol groups on the silica surface in comparison with a tri-ethoxy group, the
replacement of the tri-ethoxy by the monomethoxy-group does not lead to noticeable
changes in the values of Mooney viscosity, see Figure 7. In general, the sulfur rank
determines the stability of the sulfidic silane during the mixing: Silanes with a lower
sulfur rank are more stable and less prone to scorch during mixing, which would favor
a lower Mooney viscosity. The three investigated silanes are characterized by only
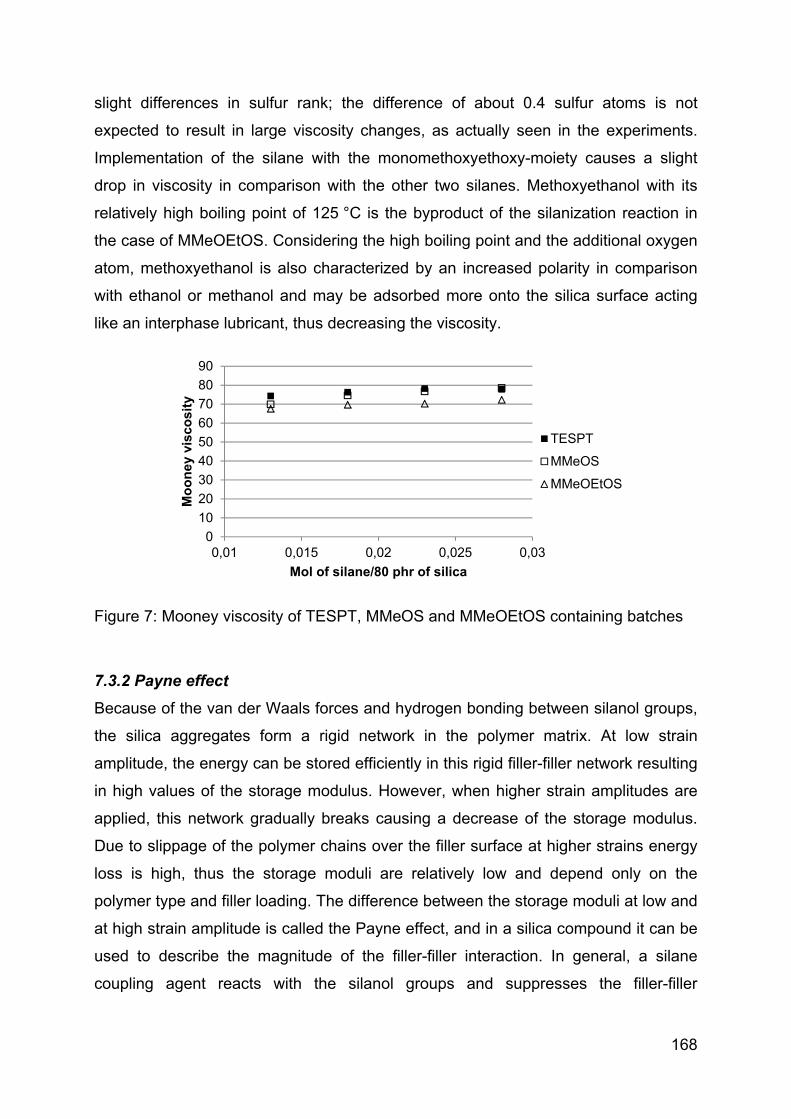
168
slight differences in sulfur rank; the difference of about 0.4 sulfur atoms is not
expected to result in large viscosity changes, as actually seen in the experiments.
Implementation of the silane with the monomethoxyethoxy-moiety causes a slight
drop in viscosity in comparison with the other two silanes. Methoxyethanol with its
relatively high boiling point of 125 °C is the byproduct of the silanization reaction in
the case of MMeOEtOS. Considering the high boiling point and the additional oxygen
atom, methoxyethanol is also characterized by an increased polarity in comparison
with ethanol or methanol and may be adsorbed more onto the silica surface acting
like an interphase lubricant, thus decreasing the viscosity.
Figure 7: Mooney viscosity of TESPT, MMeOS and MMeOEtOS containing batches
7.3.2 Payne effect
Because of the van der Waals forces and hydrogen bonding between silanol groups,
the silica aggregates form a rigid network in the polymer matrix. At low strain
amplitude, the energy can be stored efficiently in this rigid filler-filler network resulting
in high values of the storage modulus. However, when higher strain amplitudes are
applied, this network gradually breaks causing a decrease of the storage modulus.
Due to slippage of the polymer chains over the filler surface at higher strains energy
loss is high, thus the storage moduli are relatively low and depend only on the
polymer type and filler loading. The difference between the storage moduli at low and
at high strain amplitude is called the Payne effect, and in a silica compound it can be
used to describe the magnitude of the filler-filler interaction. In general, a silane
coupling agent reacts with the silanol groups and suppresses the filler-filler
0
10
20
30
40
50
60
70
80
90
0,01 0,015 0,02 0,025 0,03
Mo
on
ey v
isco
sity
Mol of silane/80 phr of silica
TESPT
MMeOS
MMeOEtOS

169
interaction, and thus decreases the Payne effect. In this study, the batches with
MMeOS as coupling agent are characterized by the lowest values of the Payne
effect, see Figure 8.
Figure 8: Payne effect of uncured compounds containing TESPT, MMeOS and
MMeOEtOS.
The lowest values of the Payne effect in the uncured state indicate that MMeOS
reacts with more silanol groups on the silica surface in comparison with the other two
silanes. Because of the fast hydrolysis of the methoxy group, more of the MMeOS
molecules can hydrolyze at the silica surface during mixing, therefore a higher
silanization efficiency is reached than in the case of MMeOEtOS or TESPT. Besides,
the generated methanol evaporates fast due to its low boiling temperature and shifts
the balance of the silanization reaction towards a higher yield of the silica-silane
reaction. In the case of MMeOEtOS, the increased polarity of the alkoxy group
apparently does not cause an increase in the silanization efficiency like was
expected; on the contrary, the higher polarity of methoxyethanol apparently
decreases the silica hydrophobicity to a lesser extent than methanol or ethanol do,
what results in somewhat increased filler-filler interactions.
Payne effect measurements performed after vulcanization are shown in Figure 9. The
differences between the silanes become smaller after the vulcanization process, but
the order of the different silanes remains unchanged: MMeOS still shows the lowest
Payne effect. In order to asses if a more efficient use of the silanol groups leads to a
higher density of polymer-filler bonds, the values of the storage modulus at high
0,00
0,05
0,10
0,15
0,20
0,25
0,30
0,35
0,40
0,45
0,01 0,015 0,02 0,025 0,03
Pay
ne
effe
ct (
G' 1
% -
G' 9
0%
) (M
Pa)
Mol of silane/80 phr of silica (mol)
TESPT
MMEOS
MMeOEtOS
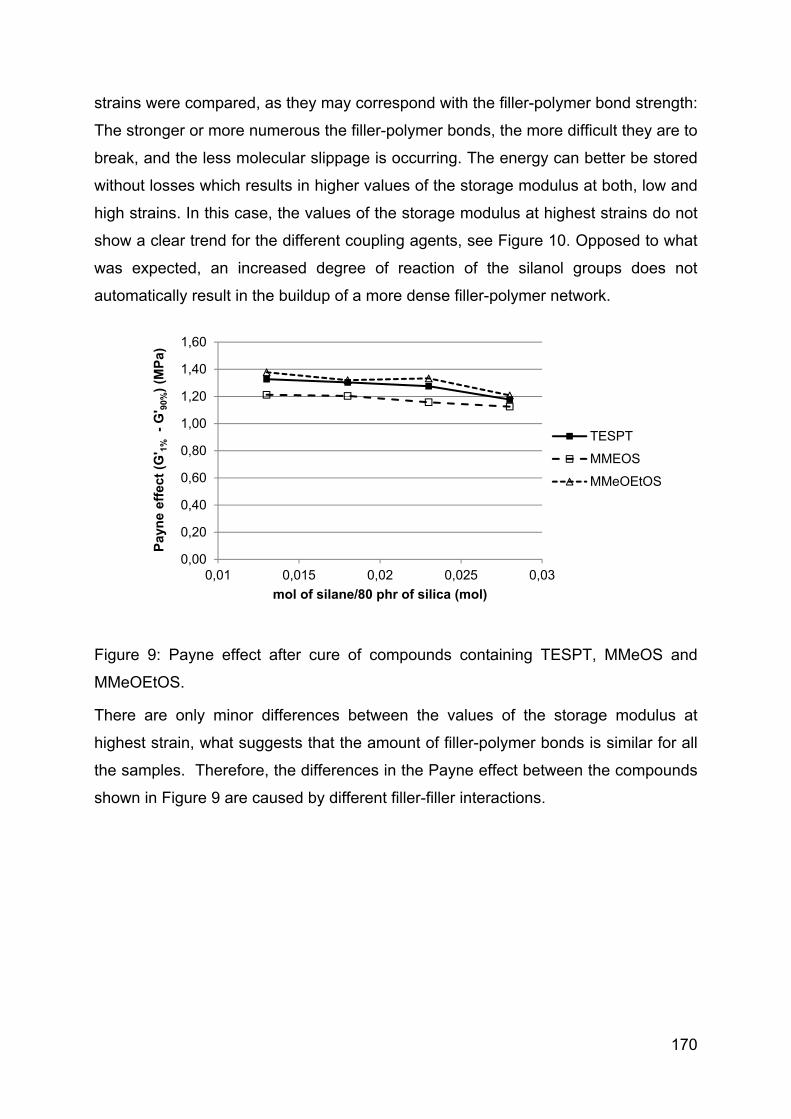
170
strains were compared, as they may correspond with the filler-polymer bond strength:
The stronger or more numerous the filler-polymer bonds, the more difficult they are to
break, and the less molecular slippage is occurring. The energy can better be stored
without losses which results in higher values of the storage modulus at both, low and
high strains. In this case, the values of the storage modulus at highest strains do not
show a clear trend for the different coupling agents, see Figure 10. Opposed to what
was expected, an increased degree of reaction of the silanol groups does not
automatically result in the buildup of a more dense filler-polymer network.
Figure 9: Payne effect after cure of compounds containing TESPT, MMeOS and
MMeOEtOS.
There are only minor differences between the values of the storage modulus at
highest strain, what suggests that the amount of filler-polymer bonds is similar for all
the samples. Therefore, the differences in the Payne effect between the compounds
shown in Figure 9 are caused by different filler-filler interactions.
0,00
0,20
0,40
0,60
0,80
1,00
1,20
1,40
1,60
0,01 0,015 0,02 0,025 0,03
Pay
ne
effe
ct (
G' 1
%-
G' 9
0%
) (M
Pa)
mol of silane/80 phr of silica (mol)
TESPT
MMEOS
MMeOEtOS

171
Figure 10: Storage modulus at 90 % strain, after cure.
7.3.3 Tan δ values at 60 °C: indicator of rolling resistance
The compounds with the newly synthetized silanes are characterized by lower values
of the tan δ at 60 °C in comparison with the TESPT compounds; see Figure 11. Both
of the experimental silanes contain one alkoxy group instead of three, like in the case
of TESPT, and this leads to the effect described in Chapter 5: in the case of TESPT,
unreacted ethoxy-groups hydrolyze during vulcanization and form ethanol which
remains bound at the polymer-filler interphase acting as a softener. Consequently,
the softer polymer-filler interphase, more energy is lost due to a higher probability of
polymer movements. However, during vulcanization of the compounds containing
MMeOEtOS and MMeOS, there are no lateral alkoxy groups present which could
further hydrolyze and form byproducts, methoxyethanol or methanol, respectively.
The interphase remains more or less unaffected, and this leads to lower probability of
polymer chain movements on the filler surface in comparison with TESPT.
Furthermore, in the case of MMeOS, apart from a lower amount of methanol at the
interphase, also lower filler-filler interactions are observed, which will contribute to
lower values of tan δ at 60 °C
0,00
0,10
0,20
0,30
0,40
0,50
0,60
0,70
0,80
0,01 0,015 0,02 0,025 0,03
G' a
t 90
% s
trai
n (
MP
a)
Mol of silane/80 phr of silica (mol)
TESPT
MMeOS
MMeOEtOS
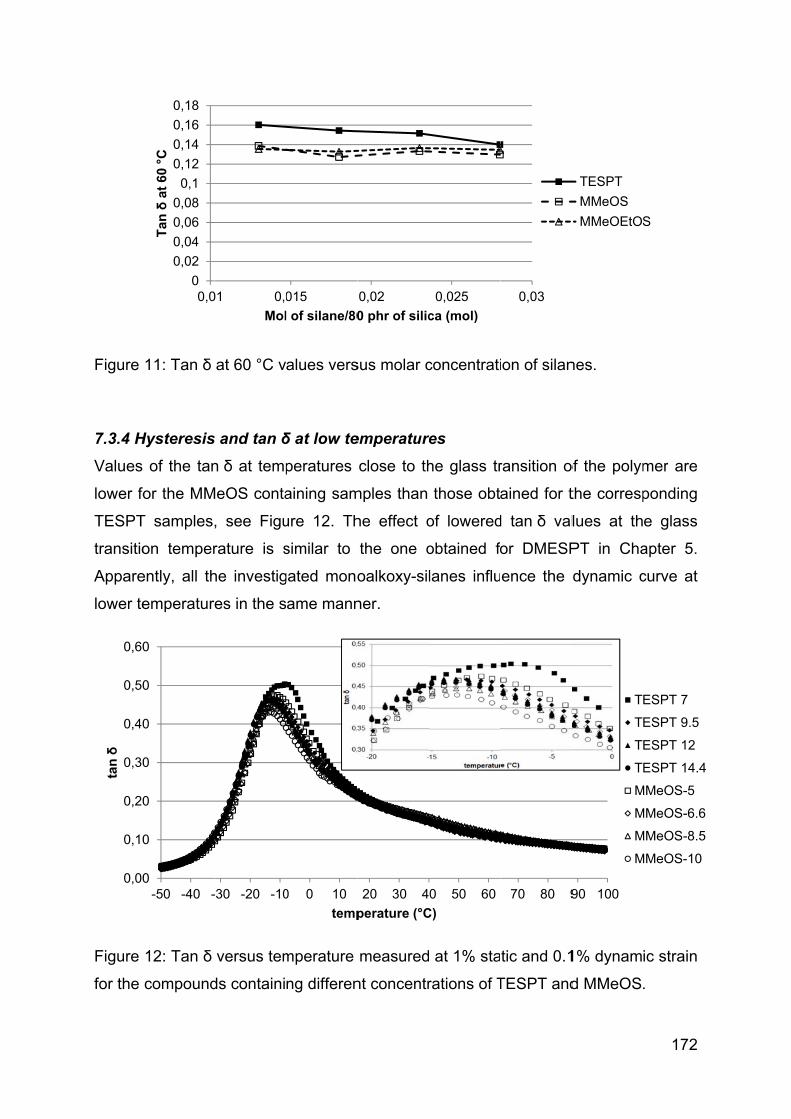
Figure
7.3.4 H
Values
lower fo
TESPT
transitio
Appare
lower te
Figure
for the
0,00
0,10
0,20
0,30
0,40
0,50
0,60
tan
δ
11: Tan δ
Hysteresis
of the tan
or the MM
T samples
on temper
ently, all th
emperatur
12: Tan δ
compound
0
0,02
0,04
0,06
0,08
0,1
0,12
0,14
0,16
0,18
0,0
Tan
δat
60
°C
0
0
0
0
0
0
0
-50 -40 -
at 60 °C v
s and tan δ
n δ at temp
MeOS conta
, see Figu
rature is s
he investig
es in the s
versus tem
ds containi
01 0,0
Mol
-30 -20 -10
alues vers
δ at low te
peratures
aining sam
ure 12. Th
similar to
gated mono
ame mann
mperature
ng differen
015
l of silane/80
0 0 10
temp
sus molar c
emperature
close to th
mples than
he effect o
the one o
oalkoxy-sil
ner.
measured
nt concentr
0,02
0 phr of silic
20 30 4
perature (°C
concentrati
res
he glass tr
those obt
of lowered
obtained f
lanes influ
at 1% sta
rations of T
0,025
ca (mol)
0 50 60
C)
ion of silan
ransition o
ained for t
d tan δ val
or DMESP
ence the
tic and 0.1
TESPT and
0,03
70 80 9
nes.
of the polym
the corresp
lues at th
PT in Cha
dynamic c
1% dynam
d MMeOS.
TESPT
MMeOS
MMeOEtOS
90 100
T
T
T
T
M
M
M
M
172
mer are
ponding
e glass
apter 5.
curve at
ic strain
.
S
ESPT 7
ESPT 9.5
ESPT 12
ESPT 14.4
MMeOS-5
MMeOS-6.6
MMeOS-8.5
MMeOS-10

The eff
more e
bump i
sample
Figure
for the
As tan
worthw
sample
of the
compo
modulu
close to
2-Meth
adsorb
oxygen
intermo
single
strengt
0
0,1
0,2
0,3
0,4
0,5
0,6
tan
δfect of dec
evident for
in the rang
es containin
13: Tan δ
compound
δ is the
while to co
es containi
loss modu
unds with
us, what c
o the glass
oxyethano
ed on the
n in the 2-m
olecular hy
hydroxyl
then or w
0
1
2
3
4
5
6
-50 -40 -3
creased ta
the samp
ge of 20 °
ng MMeOE
versus tem
ds containi
ratio of tw
nsider wh
ng the thre
uli but diff
MMeOEtO
causes the
s transition
ol is slightly
silica surfa
methoxyet
ydrogen b
group. De
weaken t
30 -20 -10
an δ values
ples with M
C to 70 °C
EtOS.
mperature
ng differen
wo differen
ich of the
ee investig
ferent valu
OS are cha
decrease
of the poly
y more pol
ace more s
hanol mak
bonding tha
ependent
he polym
0 10 20
temper
s near the
MMeOEtOS
C is visible
measured
nt concentr
nt entities
two caus
gated silane
ues of the
aracterized
e of the ta
ymers.
lar than et
strongly tha
kes this mo
an methan
on tempe
mer-filler in
0 30 40
rature (°C)
e glass tra
S, see Fig
e on the c
at 1% sta
rations of T
: the loss
ses the ch
es are cha
storage m
d by the hi
n δ values
hanol or m
an the latte
olecule mo
nol or eth
erature, th
nterphase.
50 60 70
nsition tem
ure 13. Ad
curves corr
tic and 0.1
TESPT and
vs. storag
hanges in
aracterized
moduli; see
ghest valu
s at the te
methanol, t
er two alco
ore suscep
hanol, whic
hese hydro
At the
0 80 90 1
mperature
dditionally
responding
1% dynam
d MMeOEt
ge modulu
tan δ valu
d by similar
e Figure 1
ues of the
emperature
herefore it
ohols. Addi
ptible to int
ch have ju
rogen bon
glass tr
100
TESPT
TESPT
TESPT
TESPT
MMeOE
MMeOE
MMeOE
MMeOE
173
is even
a small
g to the
ic strain
tOS.
us, it is
ue. The
r values
14. The
storage
e range
t can be
tionally,
tra- and
ust one
ds can
ansition
7
9.5
12
14.4
EtOS-6.3
EtOS-8.6
EtOS-11
EtOS-12.7
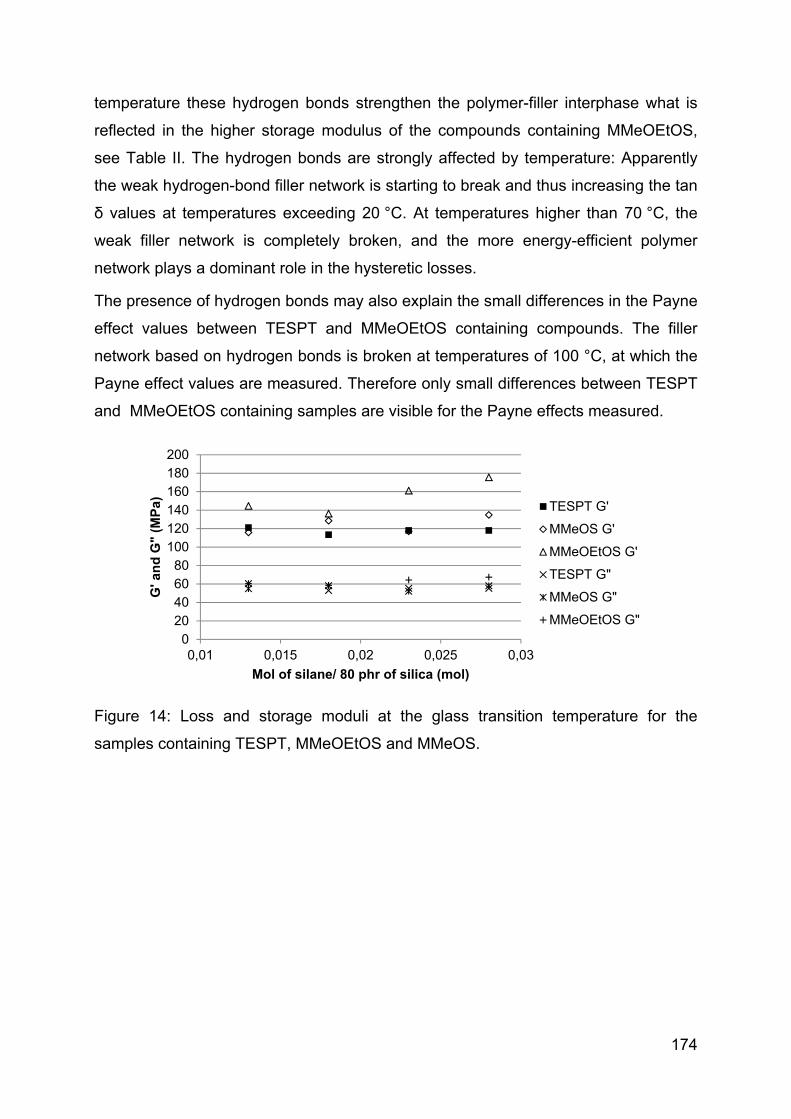
174
temperature these hydrogen bonds strengthen the polymer-filler interphase what is
reflected in the higher storage modulus of the compounds containing MMeOEtOS,
see Table II. The hydrogen bonds are strongly affected by temperature: Apparently
the weak hydrogen-bond filler network is starting to break and thus increasing the tan
δ values at temperatures exceeding 20 °C. At temperatures higher than 70 °C, the
weak filler network is completely broken, and the more energy-efficient polymer
network plays a dominant role in the hysteretic losses.
The presence of hydrogen bonds may also explain the small differences in the Payne
effect values between TESPT and MMeOEtOS containing compounds. The filler
network based on hydrogen bonds is broken at temperatures of 100 °C, at which the
Payne effect values are measured. Therefore only small differences between TESPT
and MMeOEtOS containing samples are visible for the Payne effects measured.
Figure 14: Loss and storage moduli at the glass transition temperature for the
samples containing TESPT, MMeOEtOS and MMeOS.
020406080
100120140160180200
0,01 0,015 0,02 0,025 0,03
G' a
nd
G"
(MP
a)
Mol of silane/ 80 phr of silica (mol)
TESPT G'
MMeOS G'
MMeOEtOS G'
TESPT G"
MMeOS G"
MMeOEtOS G"
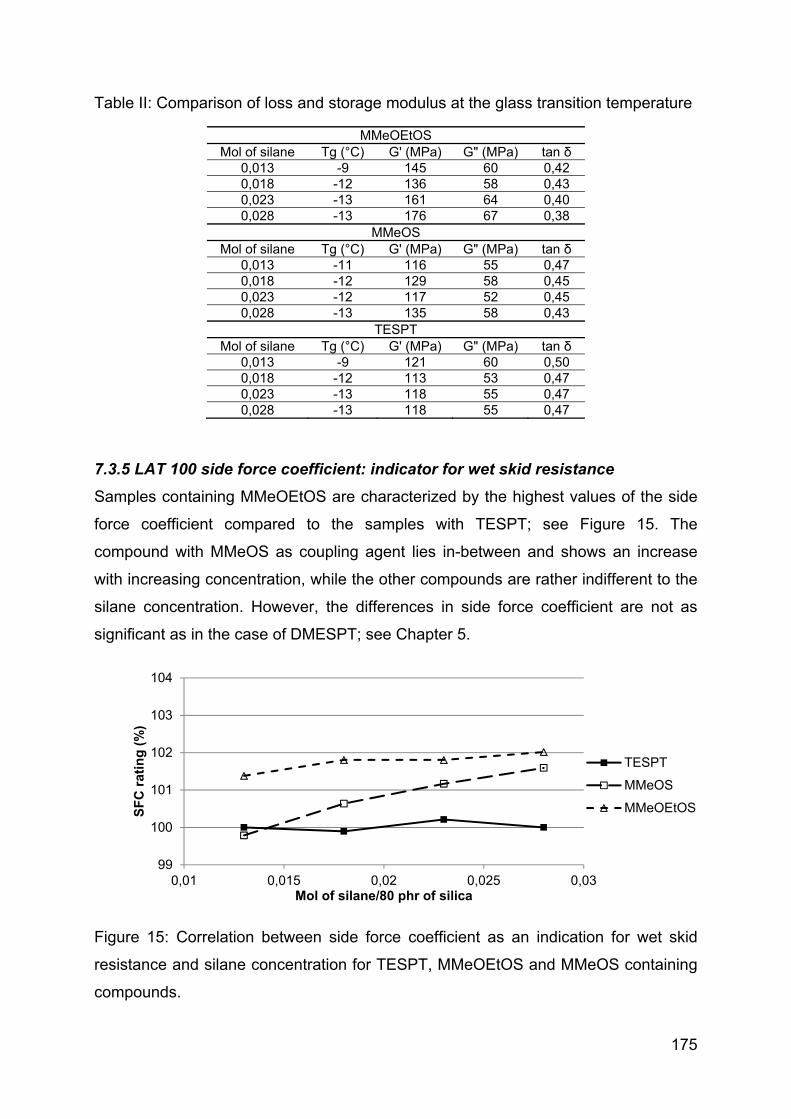
175
Table II: Comparison of loss and storage modulus at the glass transition temperature
MMeOEtOS Mol of silane Tg (°C) G' (MPa) G" (MPa) tan δ
0,013 -9 145 60 0,42 0,018 -12 136 58 0,43 0,023 -13 161 64 0,40 0,028 -13 176 67 0,38
MMeOS Mol of silane Tg (°C) G' (MPa) G" (MPa) tan δ
0,013 -11 116 55 0,47 0,018 -12 129 58 0,45 0,023 -12 117 52 0,45 0,028 -13 135 58 0,43
TESPT Mol of silane Tg (°C) G' (MPa) G" (MPa) tan δ
0,013 -9 121 60 0,50 0,018 -12 113 53 0,47 0,023 -13 118 55 0,47 0,028 -13 118 55 0,47
7.3.5 LAT 100 side force coefficient: indicator for wet skid resistance
Samples containing MMeOEtOS are characterized by the highest values of the side
force coefficient compared to the samples with TESPT; see Figure 15. The
compound with MMeOS as coupling agent lies in-between and shows an increase
with increasing concentration, while the other compounds are rather indifferent to the
silane concentration. However, the differences in side force coefficient are not as
significant as in the case of DMESPT; see Chapter 5.
Figure 15: Correlation between side force coefficient as an indication for wet skid
resistance and silane concentration for TESPT, MMeOEtOS and MMeOS containing
compounds.
99
100
101
102
103
104
0,01 0,015 0,02 0,025 0,03
SF
C r
atin
g (
%)
Mol of silane/80 phr of silica
TESPT
MMeOS
MMeOEtOS
176
The wet skid mechanism described in Chapter 3 applies here as well. In order to
elaborate on the earlier explanation some axioms are necessary to be mentioned.
Car possess certain inertia which is the results of its mass and velocity.
During skidding, when the wheel is not rotating anymore, the surface of the tire
undergoes small deformations trying to penetrate into the micro-cavities
existing in the road surface on which sliding is taking place.
The load applied to the wheel, the average dimensions (depth and width) of
the micro-cavities and the water film, limits the extension of micro-deformation.
Taking into account the quasi triangular shape of the micro-cavities and as
result of the sliding movement net force arise. Net force works against the
inertia what in the final stage cause the car to stop. This net force can be
separated on its components: vertical and horizontal, see Figure 16.
In the sliding regime a vertical force coming from the micro-cavity surpasses
the initial force causing the micro-deformation (deforming force). The forces
related with inertia of a car are incomparably higher in comparison with the
forces causing the micro-deformation. Hence the tire is sliding relative to the
road surface and deformed compound which initially fills the cavities is pushed
back to its original position on the tire by a vertical force.
The horizontal force drags the compound in the direction opposite to the
sliding direction what may result in tearing. Water lubricates the tire-road
interface what diminishes the contribution of the horizontal force in the wet
friction phenomena. Hence the compound stiffness must have the largest
contribution during friction when the water film is present.
Depending on the compound stiffness, different wet skid scenarios are possible. In
the first case the tire may be considered to be made out of very stiff material which is
not able to deform under the applied load and penetrate into the mentioned micro-
cavities, what leads to a low wet skid resistance. In the second case, the tire is made
out of very soft rubber which deforms relatively easily and thus completely fills the
micro-cavity: The wet skid resistance is higher than in the case of a very stiff
compound.

177
Figure 16: Deformation of a tire tread at a single micro-cavity.
In the third case, when smaller differences in compound stiffness are considered and
the normal load applied to the wheel exceeds the load which is needed to completely
fill the micro-cavities, both softer and stiffer compounds fill the micro-cavity to its
dimensional limits. However, the vertical force necessary to push the stiffer
compound back to its original position on the tire is higher than the force which is
needed to push back a softer compound. Hence the tire made out of stiffer but still
deformable compound will lead to higher resistance during skidding.
Samples containing MMeOEtOS are characterized by higher values of the storage
modulus at lower temperatures in comparison to compounds containing MMeOS and
TESPT; see Table II. The storage modulus is a measure of the stiffness of the
samples, which undergo dynamic deformation at certain temperatures. Therefore the
samples in which MMeOEtOS is used are characterized by the highest side force
coefficient values. The storage moduli of the samples containing MMeOS are in
between the values for the TESPT- and MMeOEtOS-containing materials, hence the
side force coefficient values of MMeOS containing compounds are higher than for
TESPT, but lower than for MMeOEtOS containing materials. This indicates that the
storage and loss moduli should both be considered as separate values and not so
much as the combined ratio tan δ in terms of wet skid resistance.

178
7.4 CONCLUSIONS
Two tailored silanes without lateral alkoxy groups were synthetized and compared in
a tire tread compound with TESPT as reference. The clear advantage of these
silanes compared to TESPT is a substantially lower alcohol generation during the
mixing process, what is not only a positive environmental aspect of the monoethoxy
silanes, but also gives an improvement in processing of the rubber compounds. The
type of alkoxy-group of the silane coupling agents determines the type of alcohol-
byproduct of the silanization reaction, and thus the kinetics of the silanization
reaction, as well as the influence on compound processing and properties.
The low boiling point of methanol leads to a relatively fast reaction with the
silanol groups on the silica surface, and presumably a higher degree of
utilization of silanol groups; this can be derived from the low Payne effect
values of the corresponding uncured compounds.
Apart from the boiling point, another important parameter describing the
alcohol evolved during silanization needs to be considered: the ability to form
hydrogen bonds. The higher tendency of 2-methoxyethanol to form intra- and
intermolecular hydrogen bonds in comparison to methanol or ethanol causes
increased stiffness of the polymer-filler interface at lower temperatures, and as
a result higher side force coefficient values in comparison to the materials
containing MMeOS and TESPT.
Due to the lack of lateral alkoxy groups, both monomethoxy and
monomethoxyethoxy silanes are also characterized by lower values of tan δ at
60 °C in comparison with TESPT. As a result of the lower amount of alcohol
provided in the silane, less alcohol remains adsorbed onto the polymer-filler
interphase. This decreases the probability of polymer segmental movements,
what reduces energy losses.
The more “rigid” polymer-filler interphase in the case of MMeOS and
MMeOEtOS at lower temperatures increases the stiffness of the compound as
measured with the storage modulus. The force necessary to deform the tread
of the tire into micro-cavities is higher for the stiffer compounds and results in
an improved, higher side force coefficient in comparison with TESPT.

179
REFERENCES [1] M. P. Wagner, Rubber Chem. Technol. 49 (1976) 703. [2] B. T. Poh, Eur. Polym. J. 34 (1998) 975. [3] R. H. Hess, H. H. Hoekje, J. R. Creasey, F. Strain, US Pat. 3,768,537, (30-10-1973) to PPG Industries. [4] P. E. Cassidy, B. J. Yager, J. Macromol. Sci. -Revs. Polym. Technol. 1 (1971) 1. [5] A. P. Legrand, H. Hommel, A. Tuel, A. Vidal, Adv. Coll. Interf. Sci. 33 (1990) 91. [6] M. J. Wang, Rubber Chem. Technol. 71 (1998) 520. [7] H. D. Luginsland, A. Hasse, 158th Technical meeting of the Rubber Division ACS, 17-19th October 2000, Cincinnati, Ohio, USA. [8] L.T. Zhuravlev, Colloids and Surfaces A: Physicochemical and Engineering Aspects 173 (2000) 1. [9] U. Görl, J. Munzenberg, H. D. Luginsland, A. Müller, Kautsch. Gummi Kunstst. 52 (1999) 588. [10] H. D. Luginsland, 155th Technical meeting of the Rubber Division ACS, 13-16th
of April 1999, Chicago, Illinois, USA.
[11] L. A. E. M. Reuvekamp, J. W. ten Brinke, P. J. van Swaaij, J. W. M. Noordermeer, Kautsch. Gummi Kunstst. 55 (2002) 41. [12] L. A. E. M. Reuvekamp, J. W. ten Brinke, P. J. van Swaaij, J. W. M. Noordermeer, Rubber Chem. Technol. 75 (2002) 187. [13] W. Dierkes, J. W. M. Noordermeer, M. Rinker, K. U. Kelting, C. Van de Pol, Kautschuk Gummi Kunststoffe 56 (2003) 340. [14] Wilma K. Dierkes, “Economic mixing of silica-rubber compounds”, PhD Thesis:
2005, Dept. of Rubber Technology, Univ. of Twente, Enschede, the Netherlands.
[15] F. Thurn, S. Wolff, Kautsch. Gummi Kunstst. 28 (1975) 733. [16] M. J. Wang, Kautsch. Gummi Kunstst. 61 (2008) 33. [17] M. Heinz, K.A. Grosch, 167th Technical meeting of the Rubber Division ACS, 16 18th of May 2005, San Antonio, Texas, USA.
[18] C. D. Seiler, H. J. Vahlensieck, H. J. Kötzsch, United States Patent No. 4173576, (06-11-1979), to Dynamit Nobel Aktiengesellschaft. [19] R. Rauline, European Union Patent No. EP0501227B1, (02-09-1992), to Michelin Co. [20] L. Guy, Ph. Cochet, Y. Bomal , S. Daudey, Kautsch. Gummi Kunstst. 63 (2009) 383. [21] L. A. E. M. Reuvekamp, “Reactive mixing of silica and rubber for tires and
engine mounts”, PhD Thesis: 2003, Dept. of Rubber Technology, Univ. of Twente, Enschede, the Netherlands.
[22] M. Heinz, J. Rubb. Res. 13 (2010) 91.


180
Chapter 8
Effect of the crosslink density and sulfur-length on wet-traction and rolling resistance
performance indicators for passenger car tire tread materials
The scope of this chapter is to study the influence of different sulfur vulcanization
systems for silica reinforced SBR/BR blends on the performance indicators of tire treads
made thereof. Three series of compounds were prepared: with conventional, semi-
efficient and efficient vulcanization systems. Each vulcanization system results in a
specific overall crosslink density and different sulfur rank distribution: mono-, di- and
polysulfidic of nature. The experimental results indicate that the influence of the overall
crosslink density on the value of tan δ at 60 °C, an indication of rolling resistance, is
higher than the type of crosslinks: A higher density of crosslinks reduces energy losses
by limiting the segmental mobility of the polymer chains. Differences between the
vulcanization systems manifest themselves only at relatively high strain levels,
exceeding those used during measurements of the tan δ values at 60 °C. The dynamic
mechanical analysis shows an increase in the glass transition temperature with rising
overall crosslink densities. Differences in the crosslink densities turn out to be too small
to have a significant influence of the LAT100 side force coefficient values, which are an
indication of wet skid resistance of tire treads. This might be caused by the similar
values of the storage modulus measured in the low temperature region, particularly
close to the glass transition of the polymer blend.
181
8.1 INTRODUCTION
Next to the elastomer type and silica-silane system, the crosslink density and distribution
are important parameters which affect the physical, mechanical and viscoelastic
properties of a vulcanizate 1,2,3. Sulfur and organic peroxides are the two most
commonly used vulcanizing agents. Unlike in a peroxide-cured system, in accelerated
sulfur-curing systems various complex reactions occur during the curing process that
form either mono-, di-, or polysulfidic crosslinks, and sulfidic ring structures within the
polymer chains 4,5. The ratio of accelerator to crosslinking agent determines the type and
density of the crosslinks 6,7. An accelerator increases the rate of cure and the efficiency
with which sulfur is used in crosslinking compared to side reactions. The concentration
of sulfidic linkages between carbon atoms of the polymer chains can be adjusted by
varying the amounts of sulfur and accelerator 8. High sulfur levels, e.g. 2 to 3.5 phr, and
low levels of accelerator, 0.5 to 1 phr, generally described as conventional vulcanizing
systems (CV), result in mostly highly flexible polysulfidic networks ([-C-Sx-C-] where
x ≥ 2) with good mechanical properties 9,10,11. However, the aging resistance is poor due
to the temperature susceptibility of polysulfidic linkages. In conventional vulcanizations,
part of the sulfur modifies the polymer chains instead of crosslink formation. Low sulfur
levels, 0.25 to 0.7 phr, with high accelerator levels, 2.5 to 5 phr, commonly known as
efficient vulcanizing systems (EV), introduce mono- or disulfidic networks ([-C-Sx-C-]
where x = 1 to 2), which exhibit low set characteristics, low stress relaxation and good
resistance to aging. The third system called semi-efficient vulcanization (SE) with
intermediate sulfur and accelerator loadings was introduced to eliminate poor cut growth
of the compounds based on natural rubber in which efficient vulcanization was used.
It is important to mention the early work of Scheele 12 and Saville and Watson 13, who
discussed network characterization; as well as the work of several authors from the Tun
Abdul Razak Research Centre (TARRC) 14,15. Ferry et al. 16 described the influence of
the crosslink density on the dynamic properties of Natural Rubber (NR). They found that
the influence of the crosslinking density on the tan δ values in the rubbery zone is
significant, whereas in the transition zone it is minor. Hamed and Rattanasom 17,18
highlighted that a higher crosslink density increases the crack propagation and worsens

182
cut growth. Bielinski and Stępkowska 19,20 discuss the tribological properties of carbon
black reinforced Emulsion-Styrene-Butadiene Rubber (E-SBR) and show that an
increasing fraction of polysulfidic crosslinks has minor influence on the friction
coefficient. Ramier et al.21 investigated the adsorption of accelerators onto the surface of
silica as reinforcing filler by the use of different grafting and coupling agents. They
concluded that without the grafting agents, the vulcanization is likely to be more
heterogeneous due to the adsorption of accelerators on the silica surface: crosslinks are
more numerous and the polysulfidic bonds shorter in the filler neighborhood. Greensmith
et al. 22 relate tensile strength with the crosslink density, and observed that the tensile
strength passes through a maximum value with increasing crosslink density. They also
reported that the tensile strength of a NR gum decreased in the sequence accelerated
sulfur > sulfurless > peroxide > high energy radiation. This observation permitted
Mullins 23 to conclude that the tensile strength depends on the type of crosslinks,
decreasing in the order polysulphidic > di- and monosulfidic> carbon-carbon, in inverse
order of the bond strength. The general dependence of different mechanical properties
on the crosslink density is shown in Figure 1. Despite numerous publications in the field
of curing systems, the knowledge concerning the influence of the vulcanization system
on tire performance indicators in silica filled synthetic rubber is still limited.
Figure 1: Vulcanizate properties versus crosslink density 24.
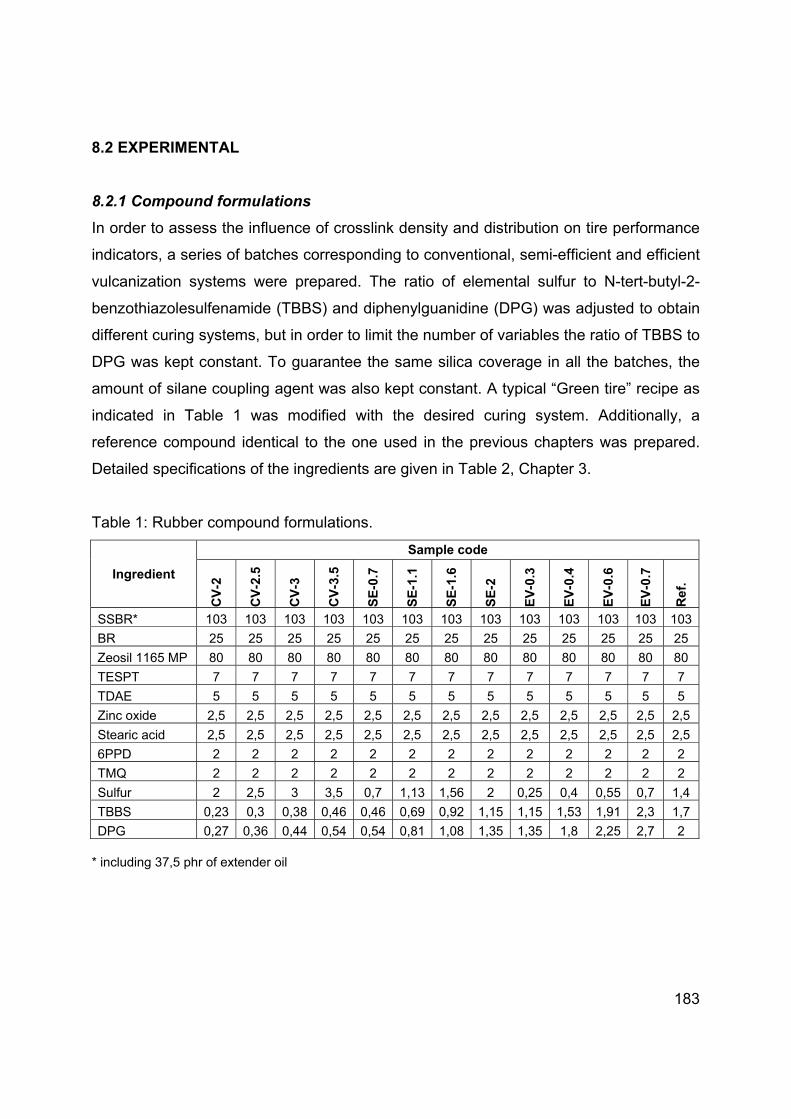
183
8.2 EXPERIMENTAL
8.2.1 Compound formulations
In order to assess the influence of crosslink density and distribution on tire performance
indicators, a series of batches corresponding to conventional, semi-efficient and efficient
vulcanization systems were prepared. The ratio of elemental sulfur to N-tert-butyl-2-
benzothiazolesulfenamide (TBBS) and diphenylguanidine (DPG) was adjusted to obtain
different curing systems, but in order to limit the number of variables the ratio of TBBS to
DPG was kept constant. To guarantee the same silica coverage in all the batches, the
amount of silane coupling agent was also kept constant. A typical “Green tire” recipe as
indicated in Table 1 was modified with the desired curing system. Additionally, a
reference compound identical to the one used in the previous chapters was prepared.
Detailed specifications of the ingredients are given in Table 2, Chapter 3.
Table 1: Rubber compound formulations.
Ingredient
Sample code
CV
-2
CV
-2.5
CV
-3
CV
-3.5
SE
-0.7
SE
-1.1
SE
-1.6
SE
-2
EV
-0.3
EV
-0.4
EV
-0.6
EV
-0.7
Re
f.
SSBR* 103 103 103 103 103 103 103 103 103 103 103 103 103
BR 25 25 25 25 25 25 25 25 25 25 25 25 25
Zeosil 1165 MP 80 80 80 80 80 80 80 80 80 80 80 80 80
TESPT 7 7 7 7 7 7 7 7 7 7 7 7 7
TDAE 5 5 5 5 5 5 5 5 5 5 5 5 5
Zinc oxide 2,5 2,5 2,5 2,5 2,5 2,5 2,5 2,5 2,5 2,5 2,5 2,5 2,5
Stearic acid 2,5 2,5 2,5 2,5 2,5 2,5 2,5 2,5 2,5 2,5 2,5 2,5 2,5
6PPD 2 2 2 2 2 2 2 2 2 2 2 2 2
TMQ 2 2 2 2 2 2 2 2 2 2 2 2 2
Sulfur 2 2,5 3 3,5 0,7 1,13 1,56 2 0,25 0,4 0,55 0,7 1,4
TBBS 0,23 0,3 0,38 0,46 0,46 0,69 0,92 1,15 1,15 1,53 1,91 2,3 1,7
DPG 0,27 0,36 0,44 0,54 0,54 0,81 1,08 1,35 1,35 1,8 2,25 2,7 2
* including 37,5 phr of extender oil

184
8.2.2 Mixing and curing
A 1.6 liter Banbury mixer was used for mixing. This process was done in three steps
according to the parameters as given in Table 5, Chapter 3. The first two steps of the
mixing process were done in the internal mixer with an initial set temperature of 40 °C.
The dump temperature of the compound was adjusted to be 155 °C by manually
changing the cooling water flow and changing the rotor speed, if necessary. Data
acquisition was done automatically. Addition of curatives was done on a two roll mill
preheated to 50 °C.
Vulcanization of the sheeted samples for tensile tests was performed on a Wickert
laboratory press (WLP 1600) at 160 °C and 100 bar for an optimal curing time (t95)
obtained from Moving Die Rheometer (MDR 2000, Alpha Technologies) measurements
according to ISO 6502. The samples for hardness tests were prepared in cylindrical
molds and cured for a period of two times t90. The samples for the DIN abrasion test
were cured for t90 multiplied by 1.2. The adjustment of the curing time as measured in
the rheometer was necessary due to the high thickness of the samples and the low
thermal conductivity of the rubber compounds.
8.2.3 Characterization methods
The overall apparent crosslink densities and distributions were measured by swelling
experiments done in toluene according to Schotman and Datta, Ellis and Moore 25,26,27.
The test sheets were cut to obtain appropriate test pieces. Propanethiol in combination
with piperidine was used to characterize the polysulfidic crosslinks according to the so-
called chemical probe method as developed for NR. The further chemical probe method
with hexanethiol and piperidine to characterize the poly- plus di- sulfidic crosslinks did
not work properly, either because the methods pertain to NR and were never re-worked
for SSBR or, secondly have never been tuned to silica-reinforced compounds. The
determinations were done in twofold, and the average was taken as final value. For the
purpose of this study only the overall apparent crosslink densities and polysulfidic
fraction thereof are taken into account.
185
Mechanical properties of the samples were tested using a Zwick Z020 tensile tester
according to ISO-37. A crosshead speed of 500 mm/min was used. The measurements
were done at ambient temperature.
Payne effect measurements were done by using a Moving Die Rheometer, MDR 2000
from Alpha Technologies, after prior vulcanization for 1.2 x t90 at 160 °C in the MDR
2000. In order to assess the Payne effect values, the storage modulus at 1% strain and
90% strain were measured at 100°C and a frequency of 0.5 Hz.
Shore A hardness of the samples was measured at five different places on the samples,
which were cylindrical with a diameter of 10 mm. The median value is given as a
representative hardness of a particular sample.
Abrasion resistance was measured by a DIN abrader machine (Abrasion tester 564C
from Karl Frank GmbH) according to method A of DIN 53516. The weight loss was
measured and recalculated to a volume loss for each sample.
In order to characterize the wet skid resistance, dynamic mechanical analysis was
performed on a Gabo Dynamic Mechanical Analyzer in a temperature-sweep mode from
-100 °C to +100 °C with 1 % static and 0,1 % dynamic strain and a frequency of 10 Hz.
In order to predict rolling resistance, single point measurements of tan δ = G”/G’, where
G’ is the storage modulus and G” is the loss modulus, at 60 °C with 2 % strain and a
frequency of 10 Hz were performed.
A Laboratory Abrasion Tester 100 (LAT 100, VMI, the Netherlands) was used to
estimate the wet skid resistance of the tire treads in conditions which simulate the real
conditions on a road. The method used to measure wet friction has been described in
Chapter 3.

186
8.3 RESULTS AND DISCUSSION
8.3.1 Crosslink density and sulfur length distribution
The variable ratio of elemental sulfur to accelerators results in different overall crosslink
densities and ratios of polysulfidic crosslinks, see Table 2. When lowering the content of
elemental sulfur and increasing the amount of accelerators in the compound, the overall
crosslink density values decrease and there is a trend away from polysulfidic crosslinks
to relatively higher di- and mono- sulfidic ranks.
Table 2: Crosslink densities.
Crosslink density (10-4 mol/g)
Sample code Overall Polysulfidic
CV-2 1,50 0,80 50% CV-2.5 1,78 1,08 61%
CV-3 1,97 1,11 56%
CV-3.5 2,40 1,54 64%
SE-0.7 0,74 0,29 29%
SE-1.1 1,12 0,57 51%
SE-1.6 1,51 0,81 54%
SE-2 2,04 1,14 56%
EV-0.3 0,74 0,30 41% EV-0.4 0,97 0,35 36%
EV-0.6 1,31 0,65 50%
EV-0.7 1,63 0,66 40%
Ref. 1,64 0,95 58%
It must be clearly stated that unlike for carbon black reinforced and crosslinked
elastomers, each silica particle can be treated as a poly-functional crosslink or nod: The
silica surface is chemically bound to polymer chains via the coupling agents. The
present measurement of the crosslink density and distribution does not differentiate
between the polymer-polymer crosslinks and silica-polymer bonds. Considering that the
same loading of TESPT was used in all batches, it is assumed that the amount of silica-
polymer bonds also remains relatively unaffected. Hence, the effects described in this
chapter may be considered as caused by changes in the density or distribution of the
sulfidic crosslinks between the polymer chains.

187
8.3.2 Mechanical properties
Depending on the overall crosslink density, the highest values of tensile strength are
observed for the efficient and semi-efficient crosslinking systems, see Figure 2. For the
conventional system, an optimum in tensile strength is barely visible. Additionally, the
efficient vulcanization system is also characterized by the highest values of tensile
strength in comparison with the two other systems. This behavior is not a commonly
observed feature. Two factors needs to be considered in the case of tensile strength: the
bond energy of the sulfidic crosslinks and the tendency to crack propagation. A higher
bond energy of the mono- and disulfidic crosslinks is responsible for the highest values
of the tensile strength for the samples with the efficient curing system. Next to bond
energy, the tendency to crack propagation is the main cause of low tensile strength
values samples with the conventional system: Crack propagation is easier in compounds
with a higher overall crosslink density 17,18. Hence the samples with conventional
vulcanization have the lowest values of the tensile strength.
Figure 2: Tensile strength of the compounds with different curing systems.
The higher overall crosslink density is the dominating factor for strength properties,
stronger than the well-known ability of the long, poly-sulfidic crosslinks to reformation
followed by stress dissipation and increased tensile strength. The semi-efficient system
0
5
10
15
20
25
0,5 1 1,5 2 2,5
Te
nsi
le s
tren
gth
(M
Pa)
Overall crosslink density (10-4 mol/g)
CV
SE
EV
Ref.

188
with moderate values of the overall crosslink density ranks somewhere in between the
other two curing systems concerning tensile strength.
The initial increase in tensile strength observed for each vulcanization system can be
caused by a primary gain in toughness caused by rising crosslink density. Further
increase in crosslink density only increases the stiffness. Compounds with a higher
stiffness are more prone to crack propagation what reduces the tensile strength.
Furthermore, the appearance of the maximum in tensile strength is not necessarily
related to the filler-polymer interaction as other authors reported the appearance of the
optimum in the tensile strength also in unreinforced compounds 28.
With increasing overall crosslink density, the values of elongation at break are
decreasing for all the crosslinking systems, see Figure 3: The vulcanizates become less
elastic what contributes to easier crack formation and sooner breakage of the sample.
When a special case is considered in which the elongation at break is compared for
samples with similar overall-crosslink densities, the conventional system is characterized
with a highest values of the elongation at break. This shows the ability of the polysulfidic
crosslinks to breaking and partial reformation and consequent energy dissipation at very
high strains.
Figure 3: Elongation at break of the compounds with different curing systems.
0
100
200
300
400
500
600
700
800
0,5 1 1,5 2 2,5
Elo
ng
atio
n a
t b
rea
k (%
)
Overall crosslink density (10-4 mol/g)
CV
SE
EV
Ref.
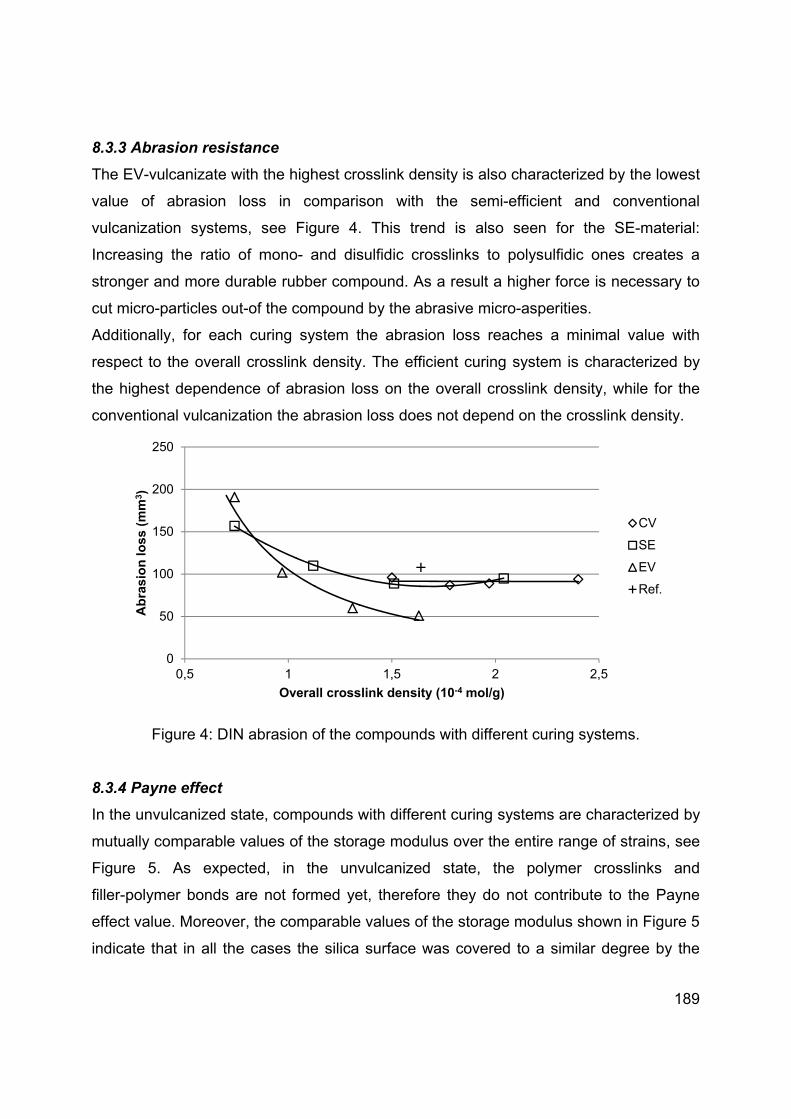
189
8.3.3 Abrasion resistance
The EV-vulcanizate with the highest crosslink density is also characterized by the lowest
value of abrasion loss in comparison with the semi-efficient and conventional
vulcanization systems, see Figure 4. This trend is also seen for the SE-material:
Increasing the ratio of mono- and disulfidic crosslinks to polysulfidic ones creates a
stronger and more durable rubber compound. As a result a higher force is necessary to
cut micro-particles out-of the compound by the abrasive micro-asperities.
Additionally, for each curing system the abrasion loss reaches a minimal value with
respect to the overall crosslink density. The efficient curing system is characterized by
the highest dependence of abrasion loss on the overall crosslink density, while for the
conventional vulcanization the abrasion loss does not depend on the crosslink density.
Figure 4: DIN abrasion of the compounds with different curing systems.
8.3.4 Payne effect
In the unvulcanized state, compounds with different curing systems are characterized by
mutually comparable values of the storage modulus over the entire range of strains, see
Figure 5. As expected, in the unvulcanized state, the polymer crosslinks and
filler-polymer bonds are not formed yet, therefore they do not contribute to the Payne
effect value. Moreover, the comparable values of the storage modulus shown in Figure 5
indicate that in all the cases the silica surface was covered to a similar degree by the
0
50
100
150
200
250
0,5 1 1,5 2 2,5
Ab
ras
ion
loss
(m
m3 )
Overall crosslink density (10-4 mol/g)
CV
SE
EV
Ref.

190
TESPT and accelerators. Even in the case in which 2,3 phr of TBBS and 2,7 phr of DPG
were used, the difference in storage modulus is not more than 0,05 MPa.
The vulcanization process creates clear differences in the storage moduli, see Figure 6.
The values of the storage modulus at both, very high and very low strain levels, increase
with the curative concentrations for each curing system.
Figure 5: Payne effect versus strain of green compounds.
The polymer network, resp. the filler-filler and filler-polymer interactions contribute to the
final values of the Payne effect. At low strain level, the deformation energy is mainly
stored in the filler network. This network is unstable and gradually disintegrates with
increasing strain levels. At the highest strain levels the polymer-filler and what is left of
the polymer network are responsible for the energy storage. When the same types and
amounts of filler and coupling agent are used, the differences in the filler-filler interaction
can be considered as invariable. In general, the energy can be stored more efficiently in
a compound with a higher overall crosslink density, because this increases the storage
modulus values at both the low and high range of the strain scale.
Comparison between the values of the storage moduli of a compound before and after
vulcanization is an example of how the energy storage increases by introduction of the
sulfur crosslinks without changes in the filler-filler interactions. The Payne effect can be
used to assess the filler-filler interactions only when the crosslink densities and the
polymer-filler interactions are similar.
0
0,05
0,1
0,15
0,2
0,25
0,3
0,35
1 10 100
G' (
MP
a)
Strain (%)
CV-2CV-2.5CV-3CV-3.5SE-0.7SE-1.1SE-1.6SE-2EV-0.3EV-0.4EV-0.6EV-0.7

191
Figure 6: Storage modulus versus strain of cured compounds.
The dependence of the Payne effect on the overall crosslinking density varies for each
curing system, see Figure 7. This dependence is stronger for the conventional and semi-
efficient systems and fades away for the efficient curing. With increasing content of the
polysulfidic crosslinks the Payne effect becomes higher.
The conventional curing system is characterized by the highest Payne effect because of
its high storage modulus at low strains which is the result of the highest overall crosslink
density. The efficient curing system is characterized by the lowest values of the Payne
effect because lower overall crosslink density leads to low values of the storage modulus
at low strains. Furthermore, probably the higher percentage of mono- and di-sulfidic
crosslinks can last unbroken, preventing the drop in the value of the storage modulus at
high strains. This effect is particularly clear when the samples with the highest
concentration of curatives are compared, see Figure 6.
0,00
0,50
1,00
1,50
2,00
2,50
1 10 100
G' (
MP
a)
Strain (%)
CV-2CV-2.5CV-3CV-3.5SE-0.7SE-1.1SE-1.6SE-2EV-0.3EV-0.4EV-0.6EV-0.7

192
Figure 7. Payne effect of cured samples versus overall crosslink density.
The compounds with the efficient vulcanization system reach higher storage moduli at
90 % strain in comparison with the semi efficient and conventional systems at similar
overall crosslink densities, see Figure 8. The higher values of the storage modulus might
be the result of differences in the ratios of mono- and disulfidic crosslinks to polysulfidic
ones. Apparently, at similar overall crosslink density, a higher percentage of the rigid
mono- and disulfidic crosslinks increases the efficiency of energy storage of the
compound, which is evident in the higher storage modulus. A higher percentage of
polysulfidic crosslinks which are prone to breaking and recombination during
deformation may be the cause of the lower energy storage capabilities of the
compounds in which the conventional curing system is used.
0,00
0,20
0,40
0,60
0,80
1,00
1,20
0,5 1 1,5 2 2,5
Pay
ne
eff
ect ∆
(G' 1
-G' 9
0) (
MP
a)
Overall crosslink density (10-4 mol/g)
CV
SE
EV
Ref.
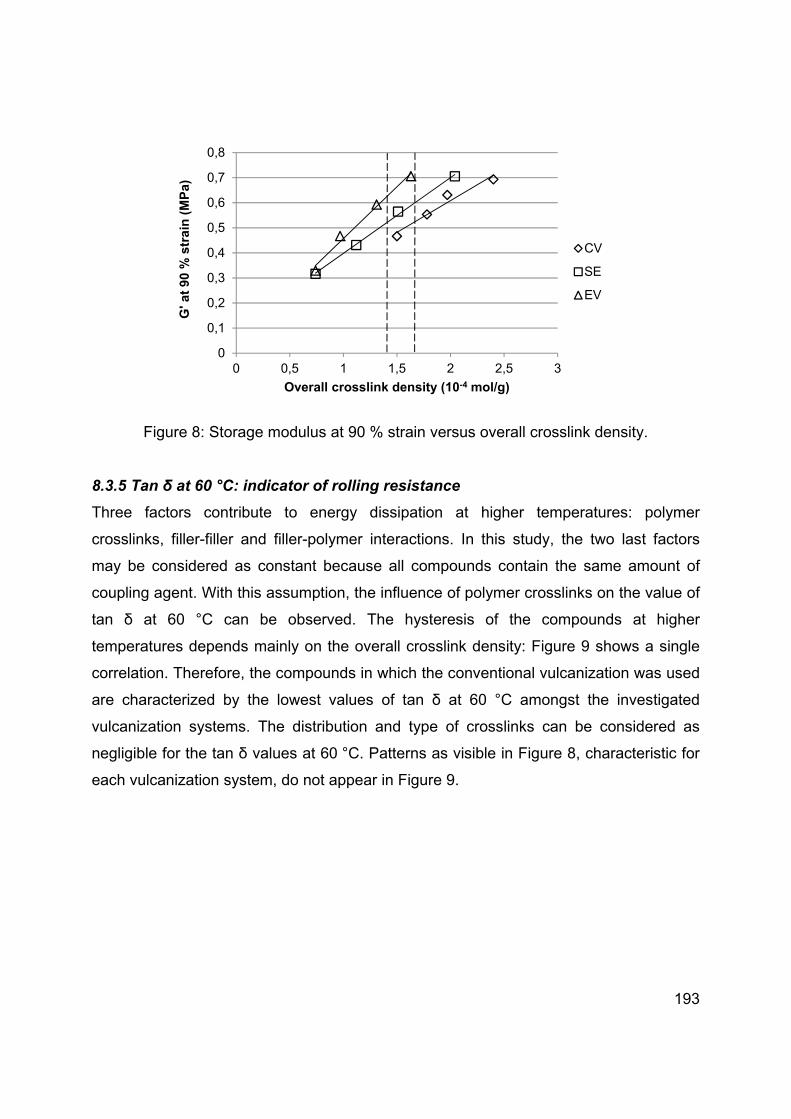
193
Figure 8: Storage modulus at 90 % strain versus overall crosslink density.
8.3.5 Tan δ at 60 °C: indicator of rolling resistance
Three factors contribute to energy dissipation at higher temperatures: polymer
crosslinks, filler-filler and filler-polymer interactions. In this study, the two last factors
may be considered as constant because all compounds contain the same amount of
coupling agent. With this assumption, the influence of polymer crosslinks on the value of
tan δ at 60 °C can be observed. The hysteresis of the compounds at higher
temperatures depends mainly on the overall crosslink density: Figure 9 shows a single
correlation. Therefore, the compounds in which the conventional vulcanization was used
are characterized by the lowest values of tan δ at 60 °C amongst the investigated
vulcanization systems. The distribution and type of crosslinks can be considered as
negligible for the tan δ values at 60 °C. Patterns as visible in Figure 8, characteristic for
each vulcanization system, do not appear in Figure 9.
0
0,1
0,2
0,3
0,4
0,5
0,6
0,7
0,8
0 0,5 1 1,5 2 2,5 3
G' a
t 90
% s
tra
in (
MP
a)
Overall crosslink density (10-4 mol/g)
CV
SE
EV

194
Figure 9: Tan δ at 60 °C values versus overall crosslink density.
Since the strain level at which the tan δ was measured is 6 %, it may be assumed that
none of the existing crosslink types undergoes breaking or recombination like in the
case of the measurements of the tensile strength and the storage modulus at 90 %
strain. Therefore, the overall crosslink density is the only factor that differentiates the
various compounds. The energy can be stored and released more efficiently and without
a loss in a compound characterized by a high overall crosslink density: an increased
number of chemical nodes connecting the polymer chains decreases the possibility of
their rearrangements, what reduces the energy dissipation.
8.3.6 Tan δ at low temperatures: indicator of wet skid resistance
As shown in Figure 10, a rising amount of curatives in the compounds has an influence
on the glass transition temperature (as is well known), but only minor changes in the
height of the tan δ peek are visible. Starting from approximately 10 °C onwards, the
differences between the individual curves gradually rise. For each vulcanization system,
the compounds with the highest loadings of curatives are characterized by the lowest
hysteresis at higher temperatures, as already seen in Figure 9.
0,00
0,05
0,10
0,15
0,20
0,25
0 0,5 1 1,5 2 2,5 3
Tan
δat
60
°C
Overall crosslink density (10-4 mol/g)
CV
SE
EV
Ref.
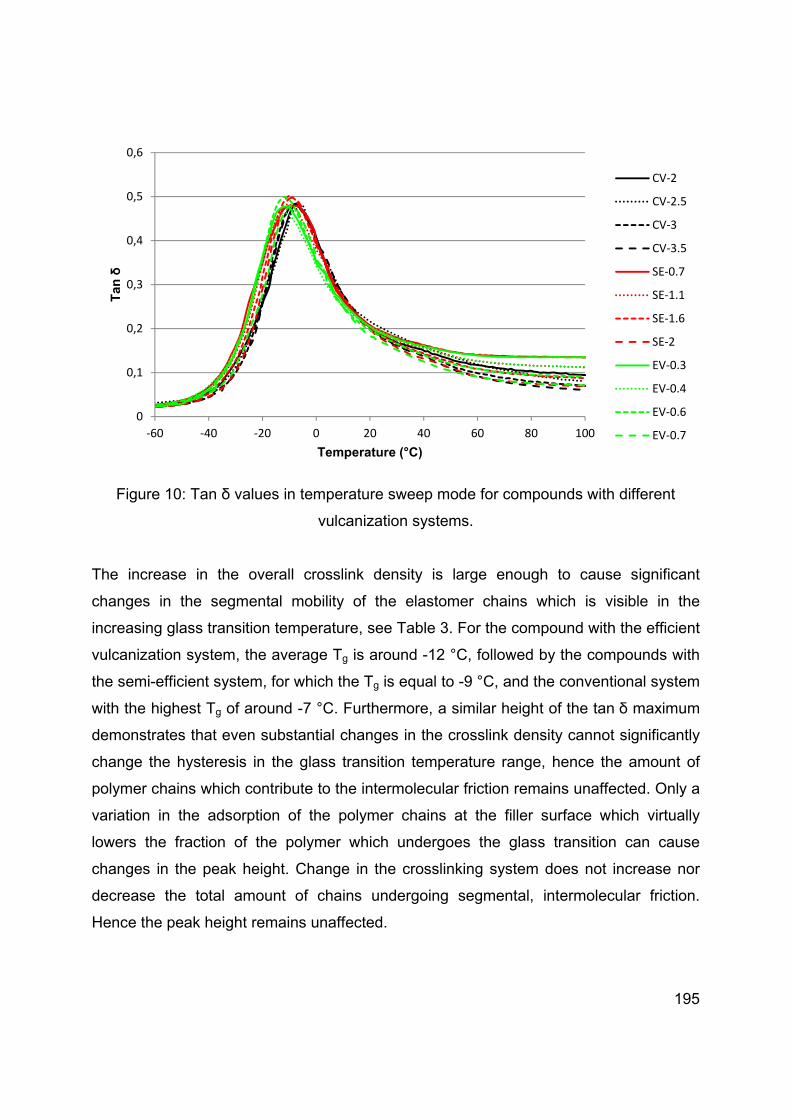
195
Figure 10: Tan δ values in temperature sweep mode for compounds with different
vulcanization systems.
The increase in the overall crosslink density is large enough to cause significant
changes in the segmental mobility of the elastomer chains which is visible in the
increasing glass transition temperature, see Table 3. For the compound with the efficient
vulcanization system, the average Tg is around -12 °C, followed by the compounds with
the semi-efficient system, for which the Tg is equal to -9 °C, and the conventional system
with the highest Tg of around -7 °C. Furthermore, a similar height of the tan δ maximum
demonstrates that even substantial changes in the crosslink density cannot significantly
change the hysteresis in the glass transition temperature range, hence the amount of
polymer chains which contribute to the intermolecular friction remains unaffected. Only a
variation in the adsorption of the polymer chains at the filler surface which virtually
lowers the fraction of the polymer which undergoes the glass transition can cause
changes in the peak height. Change in the crosslinking system does not increase nor
decrease the total amount of chains undergoing segmental, intermolecular friction.
Hence the peak height remains unaffected.
0
0,1
0,2
0,3
0,4
0,5
0,6
‐60 ‐40 ‐20 0 20 40 60 80 100
Tan
δ
Temperature (°C)
CV‐2
CV‐2.5
CV‐3
CV‐3.5
SE‐0.7
SE‐1.1
SE‐1.6
SE‐2
EV‐0.3
EV‐0.4
EV‐0.6
EV‐0.7
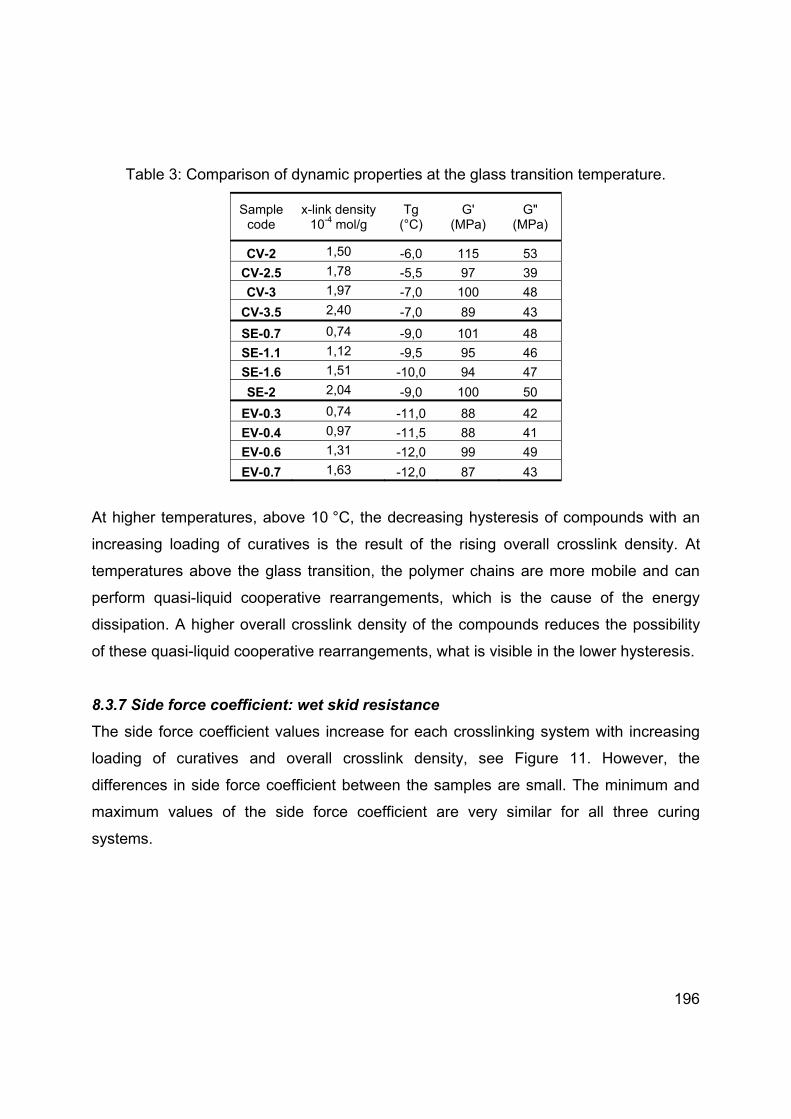
196
Table 3: Comparison of dynamic properties at the glass transition temperature.
Sample code
x-link density 10-4 mol/g
Tg (°C)
G' (MPa)
G" (MPa)
CV-2 1,50 -6,0 115 53
CV-2.5 1,78 -5,5 97 39
CV-3 1,97 -7,0 100 48
CV-3.5 2,40 -7,0 89 43
SE-0.7 0,74 -9,0 101 48
SE-1.1 1,12 -9,5 95 46
SE-1.6 1,51 -10,0 94 47
SE-2 2,04 -9,0 100 50
EV-0.3 0,74 -11,0 88 42
EV-0.4 0,97 -11,5 88 41
EV-0.6 1,31 -12,0 99 49
EV-0.7 1,63 -12,0 87 43
At higher temperatures, above 10 °C, the decreasing hysteresis of compounds with an
increasing loading of curatives is the result of the rising overall crosslink density. At
temperatures above the glass transition, the polymer chains are more mobile and can
perform quasi-liquid cooperative rearrangements, which is the cause of the energy
dissipation. A higher overall crosslink density of the compounds reduces the possibility
of these quasi-liquid cooperative rearrangements, what is visible in the lower hysteresis.
8.3.7 Side force coefficient: wet skid resistance
The side force coefficient values increase for each crosslinking system with increasing
loading of curatives and overall crosslink density, see Figure 11. However, the
differences in side force coefficient between the samples are small. The minimum and
maximum values of the side force coefficient are very similar for all three curing
systems.
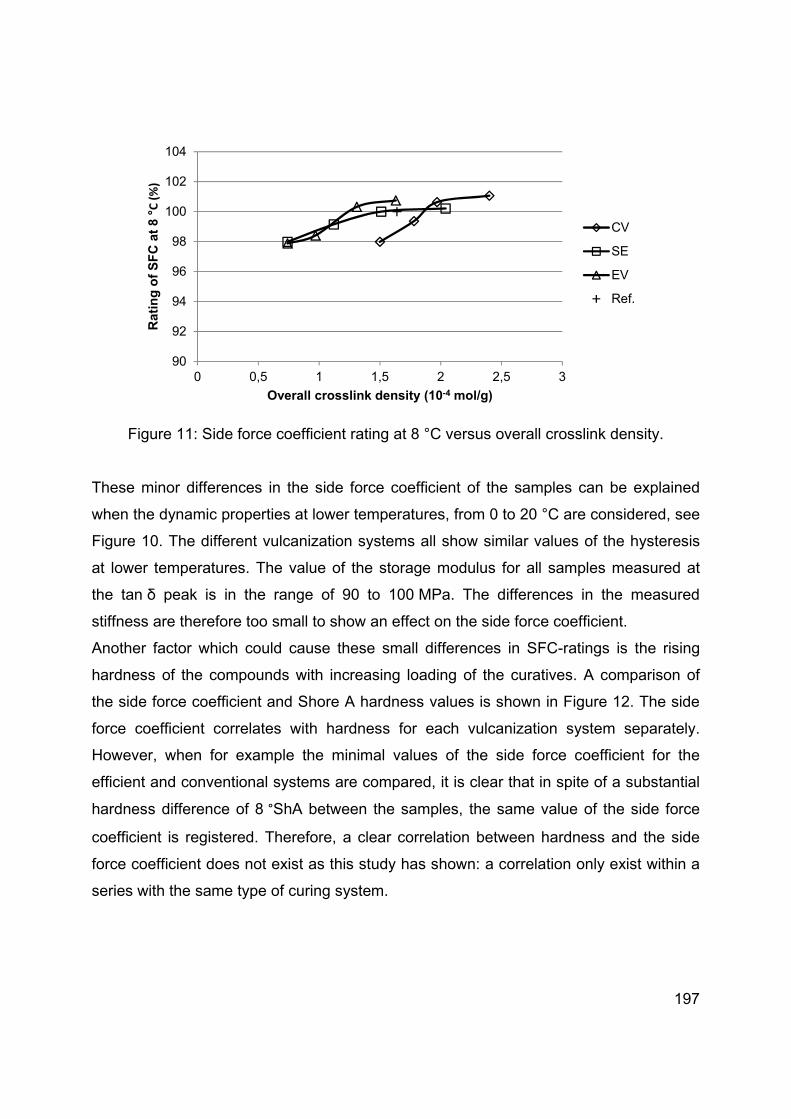
197
Figure 11: Side force coefficient rating at 8 °C versus overall crosslink density.
These minor differences in the side force coefficient of the samples can be explained
when the dynamic properties at lower temperatures, from 0 to 20 °C are considered, see
Figure 10. The different vulcanization systems all show similar values of the hysteresis
at lower temperatures. The value of the storage modulus for all samples measured at
the tan δ peak is in the range of 90 to 100 MPa. The differences in the measured
stiffness are therefore too small to show an effect on the side force coefficient.
Another factor which could cause these small differences in SFC-ratings is the rising
hardness of the compounds with increasing loading of the curatives. A comparison of
the side force coefficient and Shore A hardness values is shown in Figure 12. The side
force coefficient correlates with hardness for each vulcanization system separately.
However, when for example the minimal values of the side force coefficient for the
efficient and conventional systems are compared, it is clear that in spite of a substantial
hardness difference of 8 °ShA between the samples, the same value of the side force
coefficient is registered. Therefore, a clear correlation between hardness and the side
force coefficient does not exist as this study has shown: a correlation only exist within a
series with the same type of curing system.
90
92
94
96
98
100
102
104
0 0,5 1 1,5 2 2,5 3
Ra
tin
g o
f S
FC
at
8 °C (%)
Overall crosslink density (10-4 mol/g)
CV
SE
EV
Ref.

198
Figure 12: Rating of the side force coefficient versus Shore A hardness.
The data shown in Figure 12 also allow to compare the individual systems with a similar
hardness. When the hardness in the range of 60 to 62 °ShA is considered, the efficient
curing system is characterized by the highest value of the side force coefficient followed
by the efficient and conventional systems.
8.4 CONCLUSIONS
A maximum in tensile strength is pronounced for the efficient curing system, and
the least visible for the conventional vulcanization system. The samples with the
efficient vulcanization are also characterized by the highest values of the tensile
strength, which can be caused by the lower crack propagation ability of the
material with lower overall crosslink density together with a higher bond energy of
the mono- and disulfidic crosslinks.
Increasing the overall crosslink density of the compounds causes a rise in the
glass transition temperature by about 5 °C between the compounds with the
efficient curing system and the conventional system. However, no major changes
in the height of the tan δ peak are registered. Apparently, only variations in the
polymer immobilization on the filler surface can lead to changes in the peak
90
92
94
96
98
100
102
50 55 60 65 70
Rat
ing
of
SF
C a
t 8
°C
(%
)
Shore A hardness (°ShA)
CV
SE
EV
199
height, for instance in the case of silicas differing in the specific surface area or
different coupling agents.
The values of tan δ at 60 °C are decreasing with increasing overall crosslink
density of the compounds. This trend is independent of the crosslink types, as at
the strain level applied during the measurement the ability towards recombination
of longer poly-sulfidic crosslinks is not yet playing a role.
The compounds with the different curing systems are characterized by only a
small changes in the LAT-100 side force coefficient. This could be caused by
minor differences in the storage and loss moduli of the compounds at low
temperatures. For a similar value of hardness the efficient and semi-efficient
curing systems give slightly higher values of the SFC in comparison with a
conventional system.
200
REFERENCES
[1] J. Lal, Rubber Chem. Technol. 43 (1970) 664. [2] C.G. Moore, B.R. Trego, J. Appl. Polym. Sci. 5 (1961) 299. [3] C.M. Kok, V.H. Yee, Eur. Polym. J. 22 (1986) 341. [4] M. Nasir, G.K. Teh, Eur. Polym. J. 24 (1988) 733. [5] W. Salgueiro, A. Marzocca, A. Somoza, G. Consolati, S. Cerveny, F. Quasso, S. Goyanes, Polymer 45 (2004) 6037. [6] A.J. Marzocca, S. Goyanes, J. Appl. Polym. Sci. 91 (2004) 2601. [7] R. Joseph, K.E. George, D.J. Francis, J. Appl. Polym. Sci. 35 (1988) 1003. [8] J.A. Brydson, “Rubber Chemistry”, Applied Science Publishers Ltd, London (1978) Ch. 8. [9] L. Bateman, J.I. Cunneen, C.G. Moore, L. Mullins, "The chemistry and physics of rubber-like substances", John Wiley & Sons, New York (1963) 715. [10] B.A. Dogadkin, Z.N. Tarasova, Rubber Chem. Technol. 27 (1954) 883. [11] K.J. Saunders, “Organic Polymer Chemistry”, 2nd ed. Chapman & Hall, London,
(1988) Ch. 20. [12] W. Scheele, Rubber Chem. Technol. 34 (1961) 1306. [13] B. Saville, A.A. Watson, Rubber Chem. Technol. 40 (1967) 100. [14] M. Porter, “The Chemistry of Sulfides,” A.V. Tobolsky, Ed., John Wiley & Sons, Inc., New York (1968). [15] M. Porter, “Organic Chemistry of Sulfur,” S. Oae, Ed., Plenum Press, New York (1977). [16] J.D. Ferry, R.G. Mancke, E. Maekawa, Y. Oyanagi, R.A. Dickie, Rubber Chem. Technol. 39 (1966) 897. [17] G.R. Hamed, N. Rattanasom, Rubber Chem. Technol. 75 (2002) 323. [18] G.R. Hamed, N. Rattanasom, Rubber Chem. Technol. 75 (2002) 935. [19] D.M. Bieliński, Archives of Civil and Mechanical Engineering, 7 (2007) 15. [20] D.M. Bieliński, A. Stępkowska, Archives of Civil and Mechanical Engineering, 13 (2013) 192. [21] J. Ramier, L. Chazeau, C. Gauthier, L. Guy, M.N. Bouchereau, Rubber Chem.
Technol. 80 (2007) 183.
[22] H.W. Greensmith, L. Mullins, A.G. Thomas, “The Chemistry and Physics of Rubber-like substances”, Applied Science Publishers Ltd, London (1963) Ch. 10. [23] L. Mullins, “Relation between structure and properties”, Proc. NRPRA Jubilee
Conf. Cambridge (1964).
[24] Coran, A. Y. In Science and Technology of Rubber, 2nd ed.; Mark, J. E.; Erman, B.; Eirich, F. R., Eds.; Academic Press: New York, (1994). [25] A.H.M Schotman, R.N. Datta, Rubber Chem. Technol. 69 (1996) 727.

201
[26] B. Ellis, G.N. Welding, Rubber Chem. Technol. 37 (1964) 571. [27] C.G. Moore, J. Polym. Sci. 32 (1958) 503. [28] L. Gonzalez, A. Rodriguez, J.L. Valentin, A. Marcos-Fernandez, P. Posadas, Kautschuk Gummi Kunststoffe, 58 (2005) 638.


202
Chapter 9
Summary
Since the introduction of the “Green Tire”, silica has become one of the most important
fillers used in tire tread rubber compounds due to its contribution to a better
environment. Silica reinforced tire treads are characterized not only by reduced rolling
resistance but also improved wet skid resistance, compared to carbon black as a filler.
However, processing of silica-filled compounds is accompanied with many difficulties
caused by the polarity difference between silica and polymer. To overcome these
polarity differences a bi-functional silane coupling agent is generally used. A typical
silane coupling agent is bis-(triethoxysilylpropyl) tetrasulfide (TESPT). The silane
chemistry during rubber processing is very complicated. Basically, from a processing
point of view, two coupling reactions take place when TESPT is utilized. The first
reaction is a coupling reaction between the TESPT molecule and the silica surface, the
so-called silanization reaction. For this reaction hydrolysis of TESPT is required and
water necessary for this step is available on the silica surface. Silanization of the silica
surface improves processing by a substantial decrease of torque during mixing. The
second reaction is silane-rubber coupling, taking place preferably only during the
vulcanization stage. However, it is well known that TESPT can acts as a sulfur donor
during rubber processing. Therefore, premature crosslinking or scorch may take place at
excess temperatures in the mixing stage already. Great care needs to be taken during
silica compounding to fit in the temperature range in which optimal silanization can
proceed and the scorch reaction is minimized. All these reactions can take place
simultaneously during silica rubber processing, and therefore the reinforcing mechanism
of silica is much more complicated than that of the carbon black.
The thesis starts with a brief history of synthetic rubber in Chapter 1 were the
advantages of silica over carbon black as reinforcing fillers for rubber and the effect of
coupling agents are also reviewed. In Chapter 2 the influence of various reinforcing
203
fillers as well as of different coupling agents and rubber-polymer modification on tire
performance is reviewed.
In Chapter 3 five types of silica, differing in specific CTAB surface area and aggregate
size, are tested in a passenger car tire compound. One of the silicas, SSA-200 (the
number indicates the specific CTAB surface area given in m2/g) is also characterized by
a different structure – its aggregates are larger while the specific surface is similar to the
SSA-195 type. The silica types with smaller aggregate dimensions and larger specific
surface areas show a higher reinforcing effect, as illustrated by improved tensile
properties. However, the dispersibility of these silicas is more difficult compared to the
silica types with larger aggregates sizes. Compounds, in which SSA-195 is used, have
superior tensile properties and the lowest loss modulus at lower temperatures. This
silica type results in the highest values of the side force coefficient (SFC) in LAT-100
testing, indicating best wet grip. Adjustment of the silica loading in order to obtain similar
hardnesses of the cured compounds reverses the order of the dynamic curves. Silica
with the smallest aggregates is still superior regarding the side force coefficient.
However, the trend visible for constant silica loading has disappeared. This
demonstrates that from the view point of wet skid resistance, smaller aggregates sizes
of fillers are better, and that a higher aspect ratio of the fillers like in the case of the SSA-
200 type does not improve the wet skid resistance. Silicas with larger aggregate sizes,
SSA-80 and SSA-110 lead to low hysteresis at high temperatures, but their low
reinforcing effect makes them also less appropriate as reinforcing fillers for tire tread
compounds. The dynamic properties of materials containing highly reinforcing silica can
be further improved by using less filler, but the tensile properties will suffer in case of
SBR/BR used as polymer matrix. Furthermore, good dispersion of the nano-sized
aggregates is the key to obtain rubber composites with superior overall properties. With
the selected measurement parameters for dynamic analysis and for the LAT-100, no
correlation of the hysteresis at 0 – 20 °C with the side force coefficient was found for
both series.
The influence of physical and chemical filler-polymer bonds on the tire performance
indicators is investigated in Chapter 4. Silica is compounded with 1,6-bis-
(triethoxysilyl)hexane (TESH), to obtain interactions similar to those which exist between
204
carbon black and rubber. The bound rubber content data confirm this. Introduction of
physical interactions instead of chemical bonds radically decreases the values of the
tensile strength because of inertness of the silica surface. The dynamic properties of the
samples measured at low temperature again do not correspond with the wet skid
resistance as measured by the LAT-100. Replacement of physical bonds (TESH) by
chemical interactions (TESPT) between rubber and fillers increases the values of side
force coefficient measured with the LAT-100. Consequently, chemical bonds are
preferred for good wet skid resistance of the tire treads. The assumption that under the
influence of energy resulting from skidding, polymer molecules physically bonded to the
filler surface can easily be displaced, what should increase the energy dissipation and
as a consequence increase the wet skid resistance, is not correct. Furthermore, the
experiments performed by Heinz (M. Heinz, J. Rubb. Res., 13 (2010) 91) show strong
correlations between the values of the side force coefficient measured on the LAT 100
and (wet) skid values obtained during road tests. At the same time he points out that no
correlation exists between dynamic measurements and road tests. As a consequence, a
correlation between LAT-100 and dynamic measurements does not exist. The
contradiction between the higher hysteresis of the compounds at 0 – 20 °C but yet lower
values of the side force coefficient measured with the LAT-100 found in the present
study concur with the tests done by Heinz. The author of this thesis inclines towards the
use of the LAT-100 as a decisive tool during assessment of the wet skid potential of a
rubber compound.
Bis-(dimethylethoxysilylpropyl) tetrasulfide (DMESPT), a silane with the potential of
higher utilization of the silanol groups available on the silica surface, is investigated in
Chapter 5. Providing just one ethoxy-group instead of three in the silane coupling agent,
improves both, wet skid and rolling resistance. An explanation of these effects is a more
rigid filler-polymer interface in the case of DMESPT, compared to TESPT with three
ethoxy-groups, which generate ethanol. The alcohol remains partially adsorbed on the
interface between filler and polymer and thus influences the properties of the material.
Both silanes, TESPT and DMESPT, bind the same number of silanol groups available
on the silica surface as measured by the Payne effect of the green compounds.
Therefore, the low steric hindrance caused by absence of lateral ethoxy-groups in the

205
DMESPT molecule does not result in a higher number of bonded silanol-groups than in
the case of TESPT. The filler-polymer interactions determine the peak height of the tan δ
= f(T) curve: the more restricted the polymer movements on the filler surface, the lower
the height of the peak, as the immobilized polymer acts more filler-like than polymer-like.
In the case of DMESPT, the polymer-filler interface is more rigid in comparison to
TESPT: The latter possesses secondary ethoxy-groups, which react when the material
heated up during further processing, and splits off ethanol which partially remains
accumulated at the interface, softening the interface and thus increasing the energy loss
(indicated by tan δ) by desorption and sliding of polymer chains at lower temperatures.
Contrary to TESPT, for DMESPT the SFC of the samples increases with rising loading
of this silane. More restricted movements of the polymer chains in the glassy layer
cause increased stiffness of the compounds containing DMESPT. A higher local
stiffness around the filler particles with high DMESPT concentrations results in higher
wet skid resistance as indicated by the SFC.
The impact of the linker length which connects the silicone atom with the sulfidic moiety
in the silane coupling agent is described in Chapter 6. Compounds containing a silane
with longer linker, bis-(triethoxysilyldecyl) tetrasulfide (TESDeT) are characterized by a
slightly higher elongation at break but similar tensile strength compared to the TESPT
containing compounds. A longer and more flexible linker as in the case of TESDeT can
accommodate higher strains without cracking. An increased linker length of the coupling
agent reduces rolling resistance significantly, but does not change the wet skid
resistance. The longer linker of TESDeT can accommodate higher strain amplitudes
within the filler-polymer interphase occurring during deformation, instead of transferring
them directly onto the filler surface. An increased linked length increases the hysteretic
losses in the glass transition temperature range of the elastomer. A more flexible linker
in the case of TESDeT leads to less restricted polymer movements at the filler-polymer
interphase in comparison with the reference silane. Hence, more polymer can contribute
to the energy dissipation phenomena at the glass transition temperature. By replacing
TESPT by a silane with a longer linker, the rolling resistance of this material in a tire
tread can be improved. However, the major drawback of TESDeT is its high molecular

206
weight: in order to obtain equimolar concentrations, higher amounts of TESDeT need to
be applied compared to TESPT.
Chapter 7 is dedicated to the influence of the reactivity of silane coupling agents
towards the silica surface on the tire tread performance indicators. Two tailored silanes
without lateral alkoxy-groups are synthetized: bis-(dimethylmethoxysilylpropyl)
tetrasulfide (MMeOS) and bis-(dimethylmethoxyethoxysilylpropyl) tetrasulfide
(MMeOEtOS), and compared in a tire tread compound with TESPT as reference. The
clear advantage of these silanes compared to TESPT is a substantially lower alcohol-
generation during the mixing process, what is not only a positive environmental aspect
of the monoethoxy silanes, but also gives an improvement in processing of the rubber
compounds. The type of alkoxy-groups of the silane coupling agents determines the
type of alcohol-byproducts of the silanization reaction, and thus the kinetics of the
silanization reaction, as well as the influence on compound processing and properties.
The low boiling point of methanol leads to a relatively fast reaction with the silanol
groups on the silica surface, and presumably a higher degree of utilization of silanol
groups; this can be derived from the low Payne effect values of the corresponding
uncured compounds. Apart from the boiling point, another important parameter
concerning the alcohol evolved during silanization needs to be considered: the ability to
form hydrogen bonds. The higher tendency of 2-methoxyethanol-containing silanes to
form intra- and intermolecular hydrogen bonds in comparison to methanol- or ethanol-
containing causes increased stiffness of the polymer-filler interface at lower
temperatures, and as a result higher side force coefficient values in comparison to the
materials containing MMeOS and TESPT. Due to the lack of lateral alkoxy-groups, both
monomethoxy- and monomethoxyethoxy-silanes are also characterized by lower values
of tan δ at 60 °C in comparison with TESPT. As a result of the lower amount of alcohol
provided in the silane, less alcohol remains adsorbed onto the polymer-filler interphase.
This decreases the probability of polymer segmental movements, what reduces energy
losses. The more “rigid” polymer-filler interphase in the case of MMeOS and
MMeOEtOS at lower temperatures increases the stiffness of the compound as
measured with the storage modulus. The force necessary to deform the tread of a tire
207
into micro-cavities is higher for stiffer compounds and results in an improved, higher side
force coefficient in comparison with TESPT.
The impact of three different sulfur vulcanization systems is described in Chapter 8. A
maximum in tensile strength is most pronounced for the efficient curing system, and the
least visible for the conventional vulcanization system. The samples with efficient
vulcanization are also characterized by the highest values of the tensile strength, which
can be caused by lower crack propagation ability of the material with lower overall
crosslink density, together with a higher bond-energy of the mono- and disulfidic
crosslinks. Increasing the overall crosslink density of the compounds causes a rise in the
glass transition temperature by about 5 °C between the compounds with the efficient
curing system and the conventional system. However, no major changes in the height of
the tan δ peak are registered. Apparently, only variations in the polymer immobilization
on the filler surface can lead to changes in the peak height, for instance in the case of
silicas differing in specific surface area or different coupling agents. The values of tan δ
at 60 °C are decreasing with increasing overall crosslink density of the compounds. This
trend is independent of the crosslink types, as at the strain level applied during the
measurement the ability towards recombination of longer poly-sulfidic crosslinks is not
yet playing a role. The compounds with the different curing systems are characterized by
only a small change in the LAT-100 SFC. This could be caused by minor differences in
the storage and loss moduli of the compounds at low temperatures, for a similar value of
hardness the efficient and semi-efficient curing systems give slightly higher values of the
SFC in comparison with the conventional system.

208
Samenvatting
Sinds de introductie van de "Green tire", is silica uitgegroeid tot een van de belangrijkste
vulstoffen gebruikt in loopvlak rubbermengsels voor banden vanwege de bijdrage aan
een beter milieu. Silica versterkte band-loopvlakken worden niet alleen gekenmerkt door
een verlaagde rolweerstand, maar ook door verbeterde natte slip-weerstand in
vergelijking met roet als vulmiddel. Echter de verwerking van silica-gevulde mengsels
gaat gepaard met vele problemen als gevolg van het verschil in polariteit tussen silica en
polymeer. Om deze polariteits-verschillen te overbruggen worden bi-functionele silaan
koppelingsmiddelen (couplingagents) algemeen toegepast. Een typische silaan
couplingagent is bis-(triethoxysilylpropyl) tetrasulfide (TESPT). De silaan chemie tijdens
de verwerking van rubber is zeer ingewikkeld. Er vinden twee koppelingsreacties plaats,
wanneer TESPT wordt gebruikt. De eerste reactie is een koppelingsreactie tussen het
TESPT molecuul en het silica oppervlak, de zogenaamde silanisatie-reactie. Voor deze
reactie is hydrolyse van TESPT met water vereist, aanwezig op het silica oppervlak.
Silaniseren van het silica oppervlak verbetert de verwerking door een aanzienlijke
verlaging van het aandrijf-koppel tijdens mengen. De tweede reactie is silaan-rubber
koppeling, die bij voorkeur alleen tijdens het vulkaniseren moet plaatsvinden. Het is
echter bekend dat TESPT kan functioneren als zwaveldonor tijdens de verwerking van
rubber. Daarom kan voortijdige vernetting of aanvulkanisatie (gewoonlijk aangeduid met
‘premature scorch’) al plaatsvinden bij te hoge temperaturen in de menging. Grote zorg
moet worden besteed aan silica compoundering door deze te bedrijven in het
temperatuurgebied waarin optimale silanisatie kan plaatsvinden en de scorch-reactie
wordt geminimaliseerd. Al deze reacties kunnen gelijktijdig plaatsvinden tijdens silica
rubberverwerking en derhalve is het versterkings mechanisme van silica veel
ingewikkelder van roet.
Het proefschrift begint met een korte geschiedenis van synthetische rubber in
Hoofdstuk 1, waarin de voordelen van silica t.o.v. roet als versterkende vulstoffen voor
rubber en het effect van de couplingagents worden beschreven. In Hoofdstuk 2 wordt

209
de invloed van verschillende versterkende vulstoffen, alsook van verschillende
couplingagents en rubber-polymeermodificatie op de prestaties van banden
gedocumenteerd.
In Hoofdstuk 3 worden vijf soorten silica, verschillend in het specifieke CTAB oppervlak
en aggregaat grootte, getest in een personenauto-band mengsel. Een van de silica’s:
SSA-200 (het getal geeft het CTAB specifieke oppervlak uitgedrukt in m2/g) heeft ook
een andere structuur – de silica aggregaten zijn groter terwijl het specifieke oppervlak
vergelijkbaar is met het type SSA-195. De types silica met kleinere totale afmetingen en
groter specifiek oppervlak vertonen een hoger versterkend effect, zoals geïllustreerd in
verbeterde treksterkte-eigenschappen. Echter, de mengbaarheid van deze silica is
moeilijker dan voor de silica types met grotere aggregaten. Mengsels waarin SSA-195
wordt gebruikt, hebben superieure treksterkte-eigenschappen en de laagste
verliesmodulus bij lagere temperaturen. Dit type silica resulteert in de hoogste waardes
van de Side-Force Coëfficient (SFC) in LAT-100 testen, hetgeen de beste grip op nat
wegdek indiceert. Aanpassing van de hoeveelheid voor het verkrijgen van een
vergelijkbare hardheid van de vulkanisaten leidt tot een omgekeerde volgorde van de
dynamische eigenschappen. Silica met de kleinste aggregaten is nog steeds superieur
ten aanzien van de SFC. Echter, de trend zichtbaar voor constante silica belading is
verdwenen. Dit toont aan dat met betrekking tot de natte grip of slip-weerstand
vulstoffen met kleinere aggregaten beter voldoen en dat een hogere lengte-breedte
verhouding van de vulstoffen zoals bij type SSA-200 niet bijdraagt tot de natte
slipweerstand. Silicas met grotere aggregaten, SSA-80 en SSA-110 leiden tot lage
hysterese bij hoge temperaturen, maar hun lage versterkende werking maakt ze wel
minder geschikt als versterkende vulstof voor loopvlak mengsels. De dynamische
eigenschappen van materialen met hoog versterkende silica kunnen verder worden
verbeterd door minder vulmiddel, maar de trek-rek eigenschappen worden nadelig
beïnvloed bij SBR/BR als polymeermatrix. Verder is een goede dispersie van de nano-
aggregaten de sleutel om rubbercomposieten met algeheel superieure eigenschappen
te verkrijgen. Met de gebruikte meetparameters voor dynamische analyse en voor de
210
LAT-100, wordt geen correlatie gevonden van de hysterese bij 0 - 20 °C met de SFC
voor beide reeksen experimenten.
De invloed van fysische en chemische vulstof-polymeer bindingen op de performance
indicatoren van banden worden onderzocht in Hoofdstuk 4. Silica wordt gemengd met
1,6-bis-(triethoxysilyl)hexaan (TESH), om interacties vergelijkbaar met die tussen roet
en rubber te verkrijgen. De Bound Rubber Content gegevens bevestigen dit. Het
aanbrengen van fysische interacties in plaats van chemische bindingen verlaagt de
waarden van de treksterkte drastisch door de inertheid van het silica oppervlak. De
dynamische eigenschappen van de monsters gemeten bij lage temperatuur komen
wederom niet overeen met de natte slipweerstand zoals gemeten met de LAT-100.
Vervanging van fysische interacties (TESH) door chemische bindingen (TESPT) tussen
rubber en vulstoffen verhoogt de waarden voor de SFC met de LAT-100. Bijgevolg
hebben chemische bindingen de voorkeur voor een goede natte slipweerstand van de
loopvlakken. De veronderstelling dat onder invloed van energie als gevolg van slippen,
polymeermoleculen fysisch gebonden aan het vulmiddel oppervlak zich gemakkelijk
kunnen heroriënteren, waardoor de energiedissipatie en dus de natte slipweerstand zou
toenemen, is niet correct. Daarnaast vertonen de experimenten uitgevoerd door Heinz
(Heinz M., J. Rubb. Res., 13 (2010) 91) een sterke correlatie tussen de waarden van de
SFC gemeten met LAT 100 en (natte) slip verkregen met weg-testen. Tegelijkertijd wijst
hij erop dat er geen correlatie bestaat tussen dynamische metingen en testen op de
weg. Bijgevolg bestaat er geen correlatie tussen LAT-100 en dynamische metingen. De
tegenstelling tussen de hogere hysterese van de mengsels bij 0 - 20 ° C, maar
desalniettemin lagere waarden van de SFC gemeten met de LAT-100 in het huidige
onderzoek, sluiten aan bij de tests gedaan door Heinz. De auteur van het huidige
proefschrift neigt naar het gebruik van de LAT-100 als doorslaggevend hulpmiddel bij de
beoordeling van het natte slip vermogen van een rubber mengsel.
Bis-(dimethylethoxysilylpropyl)tetrasulfide (DMESPT), een silaan met mogelijk hogere
benutting van de silanolgroepen op het silica-oppervlak, wordt onderzocht in Hoofdstuk
5. De aanwezigheid van slechts één ethoxy-groep in plaats van drie in de silaan

211
couplingagent verbetert zowel de natte slip- als rol-weerstand. Een verklaring voor deze
effecten is een stijver vulstof-polymeer-grensvlak bij DMESPT ten opzichte van de drie
ethoxy-groepen in TESPT, die ethanol afgeven. Deze alcohol blijft gedeeltelijk
geadsorbeerd op het grensvlak tussen vulstof en polymeer en beïnvloedt daardoor de
eigenschappen van het materiaal. Beide silanen, TESPT en DMESPT, fixeren dezelfde
aantallen silanol-groepen op het silica-oppervlak, zoals gemeten met het Payne effect
van de ongevulkaniseerde mengsels. Daarom leidt de lagere sterische hindering
veroorzaakt door afwezigheid van zijwaardse ethoxy-groepen in het molecuul DMESPT
niet tot een hoger aantal gebonden silanol-groepen dan bij TESPT. De vulstof-polymeer
wisselwerkingen bepalen de piekhoogte van de tanδ = f(T) curve: hoe geremder de
polymeer beweeglijkheid aan het vulmiddel oppervlak, hoe lager de hoogte van de piek;
het geïmmobiliseerde polymeer fungeert meer vulstof-achtig dan polymeer-achtig. Bij
DMESPT is het polymeer-vulstof grensvlak stijver dan bij TESPT: deze bezit secundaire
ethoxy-groepen, die reageren wanneer het materiaal weer wordt opgewarmd tijdens
verdere verwerking en splitsen ethanol af, dat zich gedeeltelijk ophoopt aan het
grensvlak en dus het energieverlies (aangeduid met tan δ) verhoogt door desorptie en
glijden van de polymeerketens bij lagere temperaturen. Anders dan bij TESPT neemt
voor DMESPT de SFC van de monsters toe bij verhoogde silaan-dosering. Meer
bewegingsbeperking van de polymeerketens in de glasachtige grenslaag veroorzaakt
verhoogde stijfheid bij de mengsel met DMESPT. Een hogere lokale stijfheid rondom de
vulstofdeeltjes met hoge DMESPT concentraties leidt tot hogere natte slipweerstand,
zoals gemeten met de SFC.
Het effect van de linker-lengte die het siliciumatoom met het sulfidische deel in de silaan
couplingagent verbindt, wordt beschreven in Hoofdstuk 6. Mengsels die een silaan
bevatten met langere linker, bis-(triethoxysilyldecyl) tetrasulfide (TESDeT) worden
gekenmerkt door een iets hogere rek bij breuk maar vergelijkbare treksterkte vergeleken
met TESPT bevattende mengsels. Een langere en flexibeler linker als bij TESDeT kan
grotere deformaties opvangen zonder te breken. Een verhoogde linker lengte van het
koppelingsmiddel vermindert de rolweerstand aanzienlijk, maar niet de natte
slipweerstand. De langere linker van TESDeT is geschikt voor hogere deformatie-
amplitudes in het vulstof-polymeer grensvlak tijdens vervorming, in plaats van dat ze

212
deze direct overbrengen op het vulstof-oppervlak. Een langere linker-lengte verhoogt de
hysterese verliezen in het glasovergangs-temperatuur bereik van het elastomeer. Een
flexibeler linker bij TESDeT leidt tot minder belemmering in de polymeer- bewegingen
aan het vulstof-polymeer grensvlak in vergelijking met de referentie silaan TESPT.
Derhalve kan meer polymeer bijdragen aan de energiedissipatie verschijnselen op de
glasovergangstemperatuur. Door TESPT te vervangen door een silaan met langere
linker kan de rolweerstand van het materiaal in een loopvlak worden verbeterd. Echter,
het belangrijkste nadeel van TESDeT is het hoge molecuulgewicht: om equimolaire
concentraties te verkrijgen moeten grotere hoeveelheden TESDeT worden toegepast
dan TESPT.
Hoofdstuk 7 is gewijd aan de invloed van de reactiviteit van silaan couplingagents naar
het silica oppervlak op de loopvlak indicatoren. Twee silanen zonder zijwaardse alkoxy-
groepen worden op maat gesynthetiseerd: bis-(dimethylmethoxysilylpropyl)tetrasulfide
(MMeOS) en bis-(dimethylmethoxyethoxysilylpropyl)tetrasulfide (MMeOEtOS), en
vergeleken in een loopvlak mengsel met TESPT als referentie. Het duidelijke voordeel
van deze silanen ten opzichte van TESPT is een aanzienlijk lagere alcohol ontwikkeling
gedurende het mengproces, wat niet alleen een positief milieuaspect vertegenwoordigt
van de mono-ethoxy silanen, maar ook een verbetering geeft van de verwerking in
rubbermengsels. Het type alkoxy-groepen van de silaan couplingagents bepaalt het type
alcohol-bijproducten van de silanisatie reactie en dus de kinetiek van de silaniserings-
reactie, alsmede de invloed op mengsel verwerking en eigenschappen. Het lage
kookpunt van methanol leidt tot een relatief snelle reactie van de genoemde silanen met
de silanolgroepen op het silica-oppervlak en vermoedelijk een hogere mate van
benutting van de silanolgroepen. Dit kan worden afgeleid uit de lage Payne effect
waardes van de overeenkomstige gevulcaniseerde mengsels. Naast het kookpunt moet
een andere belangrijke parameter worden meegenomen betreffende de alcohol
ontwikkeld gedurende de silanisering: het vermogen om waterstofbindingen te vormen.
De grotere neiging van 2-methoxyethanol bevattende silanen om intra- en
intermoleculaire waterstofbindingen te vormen in vergelijking met methanol- of ethanol-
bevattende soorten veroorzaakt verhoogde stijfheid van het polymeer-vulstof-grensvlak
bij lagere temperaturen, en daardoor hogere SFC-waardes in vergelijking met de

213
materialen die MMeOS of TESPT bevatten. Door het ontbreken van zijwaardse alkoxy-
groepen worden beide monomethoxy- en monomethoxyethoxy-silanen gekenmerkt door
lagere waarden van tanδ bij 60 °C ten opzichte TESPT. Als gevolg van de lagere
hoeveelheid alcohol die in de silaan aanwezig is blijft minder alcohol geadsorbeerd aan
het polymeer-vulstof grensvlak. Dit vermindert de kans op polymeer korte-segment
bewegingen, hetgeen energieverlies reduceert. Het stijvere polymeer-vulstof grensvlak
bij MMeOS en MMeOEtOS bij lagere temperaturen verhoogt de stijfheid van het
mengsel zoals gemeten met de opslagmodulus. De kracht die nodig is om het loopvlak
van een band te vervormen in microholtes in het wegdek is hoger voor stijvere mengsels
en resulteert in een verbeterde, hogere SFC ten opzichte van TESPT.
Het effect van drie verschillende zwavel vulkanisatiesystemen wordt beschreven in
Hoofdstuk 8. Een maximale treksterkte is meest uitgesproken voor een efficiënt
vulkanisatiesysteem, en het minst voor een conventioneel systeem. De hoogste
waardes in treksterkte voor de monsters met efficiënte vulkanisatie, kunnen worden
veroorzaakt door lagere scheurpropagatie van het materiaal met lagere totale
crosslinkdichtheid, gecombineerd met een hogere bindings-energie van mono- en
disulfidische crosslinks. Het verhogen van de algehele crosslinkdichtheid van de
mengsels geeft een verhoging van de glasovergangstemperatuur van ongeveer 5 ° C
tussen de mengsels met het efficiënte vs. conventionele vulkanisatie-systeem. Echter,
geen grote veranderingen in de hoogte van de tanδ-piek worden waargenomen.
Blijkbaar kunnen alleen veranderingen in de immobilisatie van het polymeer op het
vulmiddel oppervlak leiden tot veranderingen in de piekhoogte, bijvoorbeeld in het geval
van silica’s verschillend in specifiek oppervlak of gebruik van verschillende
couplingagents. De waardes van tanδ bij 60°C nemen af bij toenemende totale
crosslinkdichtheid van de mengsels. Deze trend is onafhankelijk van de crosslink types,
aangezien bij het rek-niveau toegepast in de meting het vermogen tot recombinatie van
langere poly-sulfidisch crosslinks nog geen rol speelt. De mengsels met de verschillende
vulkanisatiesystemen worden gekenmerkt door slechts een kleine verandering in de
LAT-100 SFC. Dit zou kunnen worden veroorzaakt door kleine verschillen in de opslag
en verlies moduli van de mengsels bij lage temperaturen; bij vergelijkbare hardheid

214
geven de efficiënte en semi-efficiënte vulkanisatiesystemen iets hogere waardes van de
SFC ten opzichte van het conventionele systeem.
215
Annex 1
Publications and papers
1. E. Cichomski, A. Blume, W.K. Dierkes, J.W.M. Noordermeer, T.V. Tolpekina,
S. Schultz, "Influence of Silica-Polymer Bond Microstructure on Tire-Performance
Indicators" Kautschuk und Gummi Kunststoffe 68 (2015) 38.
2. E. Cichomski, W.K. Dierkes, T.V. Tolpekina, S. Schultz, “Influence of physical and
chemical polymer-filler bonds on tire wet-traction performance indicators for
passenger car tire tread materials” Kautschuk und Gummi Kunststoffe, 67 (2014) 50.
3. E. Cichomski, T.V. Tolpekina, Steven Schultz, Jacques W.M. Noordermeer, W.K.
Dierkes, Anke Blume 11th Fall Rubber Colloquium, 26-28 November 2014,
Hannover, Germany.
4. W.K. Dierkes, E. Cichomski, T.V. Tolpekina, S. Schultz, A. Blume,
J.W.M. Noordermeer “Influence of Silica Characteristics on Tire Performance
Indicators” 185th Technical Meeting of the Rubber Division ACS, 14-16 October
2014, Nashville, Tennessee, USA.
5. W.K. Dierkes, E. Cichomski, W. Kawesakul, S.S. Sarkawi, S. Schultz,
T.V. Tolpekina, K. Sahakaro, J.W.M. Noordermeer, “Filler - coupling agent - polymer
interactions and their significance for tire performance” 15. Tagung der
Bezirksgruppe Nord "automobil for the future" 28-29 November 2013, Hamburg,
Germany.

216
6. E. Cichomski, T.V. Tolpekina, S. Schultz, W.K. Dierkes, J.W.M. Noordermeer,
“Structural influences of silane coupling agents on the dynamic properties of a SBR /
silica compound” 184th Technical Meeting of the Rubber Division ACS, 8-10 October
2013, Cleveland, Ohio, USA.
7. E. Cichomski, T.V. Tolpekina, S. Schultz, W.K. Dierkes, J.W.M. Noordermeer,
“Influence of the silica surface area and structure on rolling and wet skid resistance
of a passenger car tire tread” Eurofillers 2013, 25-29 August 2013, Bratislava,
Slovakia.
8. E. Cichomski, T.V. Tolpekina, S. Schultz, W.K Dierkes, J.W.M. Noordermeer,
”Structural influences of silane coupling agents on the dynamic properties of a SBR /
silica compound” 29th Polymer Processing Society, 15-19 July 2013, Nürnberg,
Germany.
9. E. Cichomski, T.V. Tolpekina, S. Schultz, W.K. Dierkes, J.W.M. Noordermeer,
“Influence of the structure of silane coupling agent on wet skid and rolling resistance
of passenger car tire treads” European PhD Seminar, 13-14 June 2013, Łódź,
Poland.
10. W.K. Dierkes, E. Cichomski, W. Kaewsakul, S.S. Sarkawi, S. Schultz,
T.V. Tolpekina, K. Sahakaro, J.W.M. Noordermeer, “A scientific view on silica
technology: filler - coupling agent - polymer interactions and their significance for tire
performance” 183rd Technical Meeting of the Rubber Division ACS, 22-24 April
2013, Akron, Ohio, USA.
11. E. Cichomski, W.K. Dierkes, J.W.M. Noordermeer, T.V. Tolpekina, S. Schultz,
“Influence of physical and chemical polymer-filler bonds on wet skid resistance and
related properties of passenger car tire treads” Deutsche Kautschuk-Tagung 2012,
2-5 July 2012, Nürnberg, Germany.

217
12. E. Cichomski, W.K. Dierkes, J.W.M. Noordermeer, T. V. Tolpekina, S. Schultz
"Influence of physical and chemical polymer-filler bonds on wet skid resistance of
the passenger car tire treads" Elastomery 2011, 23-25 November 2011 Warsaw,
Poland.
13. E. Cichomski “Influence of chemical or physical filler-polymer interactions on the wet
skid resistance of silica filled SBR-BR blends” presentation at the PhD-workshop
IPF/UT/MLU/TUL/ContiTech, 6-8 June 2011, Hannover, Germany.

218
Annex 2
Symbols and abbreviations
Symbol Abbreviation
H hysteresis
γ shear strain
γ(t) sinusoidal shear deformation
ω angular frequency
σ(t) sinusoidal shear stress response of a material
γ0 maximum strain amplitude
σ0 shear response at maximum strain
t time
G’ storage modulus
G” loss modulus
δ loss angle
tan δ mechanical loss tangent
BR butadiene rubber
CBS N-cyclohexyl-2-benzothiazole sulphenamide
TMTD tetramethylthiuramdisulphide
DPG diphenyl guanidine
EtO ethoxy
MeO methoxy
EtOH ethanol
MeOH methanol
NR natural rubber
phr parts per hundred rubber
ppm parts per million
C-BR conventional vinyl content polybutadiene rubber
V-BR high vinyl content polybutadiene rubber

219
RPA rubber process analyser
T temperature
TESPD bis(triethoxysilylpropyl) disulphide
TESPT bis(triethoxysilylpropyl) tetrasulphide
TMTD tetramethylthiuram disulphide
TESH bis(triethoxysilyl)hexane
DMESPT bis-(dimethylethoxysilylpropyl) tetrasulfide
ZnO zinc oxide
E-SBR emulsion styrene butadiene Rubber
Tg glass transition temperature
LAT 100 laboratory abrasion tester 100
φ volumetric concentration of the particles
η0 viscosity of the pure liquid
η viscosity of the suspension
E elasticity modulus
kB Boltzmann constant
ν crosslink density
M100 stress at 100 % strain
M300 stress at 300 % strain
CV conventional vulcanization
S-EV semi-efficient vulcanization
EV efficient vulcanization
DSA dynamic strain deformation
H-bonds hydrogen bonds
pKa logarithmic acid dissociation constant
CTAB cetyl trimethylammonium bromide
γs surface energy
γd dispersive surface energy
γsp specific surface energy
OE SBR oil extended styrene butadiene rubber
MMT montmorillonite
220
MBT mercaptobenzothiazyl
MBTS mercaptobenzothiazyl disulfide
XNBR carboxylated nitrile butadiene rubber
DBP dibutyl phthalate adsorption
BET specific surface area measured by nitrogen adsorption
ka primary kinetic rate constants
kb secondary reaction rate constants
MPTMS (3-mercaptopropyl) trimethoxysilane
THF tetrahydrofurane
CHX cyclohexane
AIBN azobisisobutyronitrile
DIN Deutsches Institut für Normung

221
Curriculum Vita
Ernest Cichomski grew up together with two older sisters and their parents in Lodz,
Poland. Due to his technical interest, he attended a school for motor vehicle engineering
(high-school with technical specification) that the graduated from in 2003 as an
automobile technician and obtained university entrance qualification with high final grade
in chemistry.
2003 he started at the University of Technology in Lodz, Poland and graduated in 2009
with a master’s degree in materials engineering with a major in polymer materials. His
master thesis was on silica filled dental composites (silane coupling agents) and thus
allowed him to gain in depth knowledge of polymer chemistry.
2010 he then had the chance to enter a PhD programme at the University of Twente in
Enschede, Netherlands. Since then he has been working as a researcher at the
university with a focus on engineering technology of elastomers. At the same time he
supervised Master student in writing their thesis and supporting other fellow PhD
candidates. Furthermore, he organized and attended multiple conferences, especially on
polymer topics. In the past 4 years he has done extensive research on rubber
compounding, working closely not only with the university but also with Apollo Global
Tyres R&D in Enschede on project related with the improvement of the rolling
resistance, tire wet-traction etc. with corresponding publications.

222
Acknowledgments
I would have never been able to finish my dissertation without guidance from my
committee members, help from my friends, and support from my family. I would like to
express my deepest gratitude to my co-promotor Dr. Dierkes, for her excellent guidance,
caring and patience, and for providing me with the optimal atmosphere for doing
research, not forgetting of course her persistent corrections of my writing. I would like to
thank my promotor Professor Noordermeer, who helped me experience research
beyond the textbooks and inspired me to develop good ideas and interpretations of my
results. I would also like to thank Professor Blume for her valuable advice and the
intellectual discussions during the final stage of the project.
I would like to thank my good friend Jacob Lopulissa, who was always willing to help by
giving me his best suggestions not only on a professional level but also on a private
plane. The lab would have been a lonely place without him. Special thanks go to André
Louis and Nadia Vleugels, who were always supporting me with their friendship. Our
discussions of work and research were provided with comic relief in jokes and light
comments that resonated through our offices. I hope we will all meet again somewhere
in the world of rubber.
I would also like to thank my parents and two sisters. They were always supporting me
and encouraging me with their best wishes. Finally, I would like to thank my life partner,
Rima Cortbawi. Thank you for you generous and loving support. You have always been
there cheering me up and standing by my side through the good and bad times.
Top Related