


Languages
Pages
Legal

Norsk Marinteknisk Forskningsinstitutt
Dag Atle Nesheim, Research Scientist MARINTEK
Helge Olsen, Senior Vice President Ship Management Odfjell Management
Shipping KPI Reaches Maturity
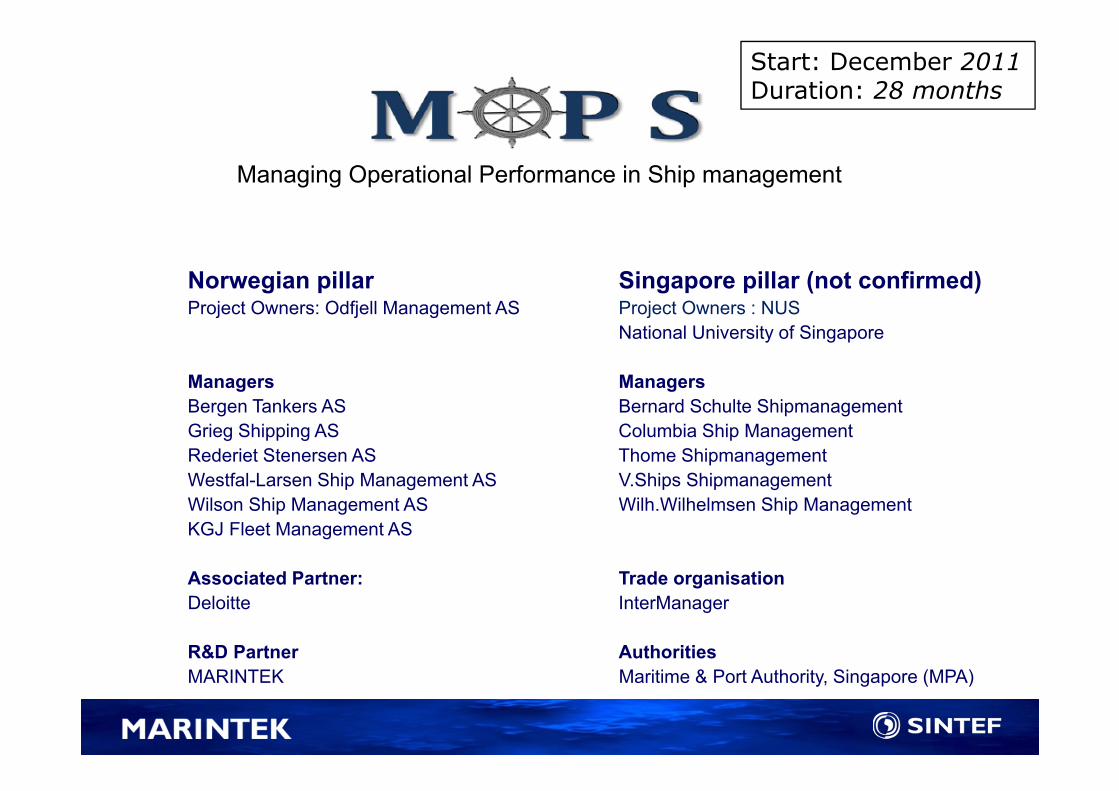
Norwegian pillar Singapore pillar (not confirmed)Project Owners: Odfjell Management AS Project Owners : NUS
National University of Singapore
Managers ManagersBergen Tankers AS Bernard Schulte ShipmanagementGrieg Shipping AS Columbia Ship ManagementRederiet Stenersen AS Thome ShipmanagementWestfal-Larsen Ship Management AS V.Ships ShipmanagementWilson Ship Management AS Wilh.Wilhelmsen Ship ManagementKGJ Fleet Management AS
Associated Partner: Trade organisationDeloitte InterManager
R&D Partner AuthoritiesMARINTEK Maritime & Port Authority, Singapore (MPA)
Managing Operational Performance in Ship management
Start: December 2011Duration: 28 months
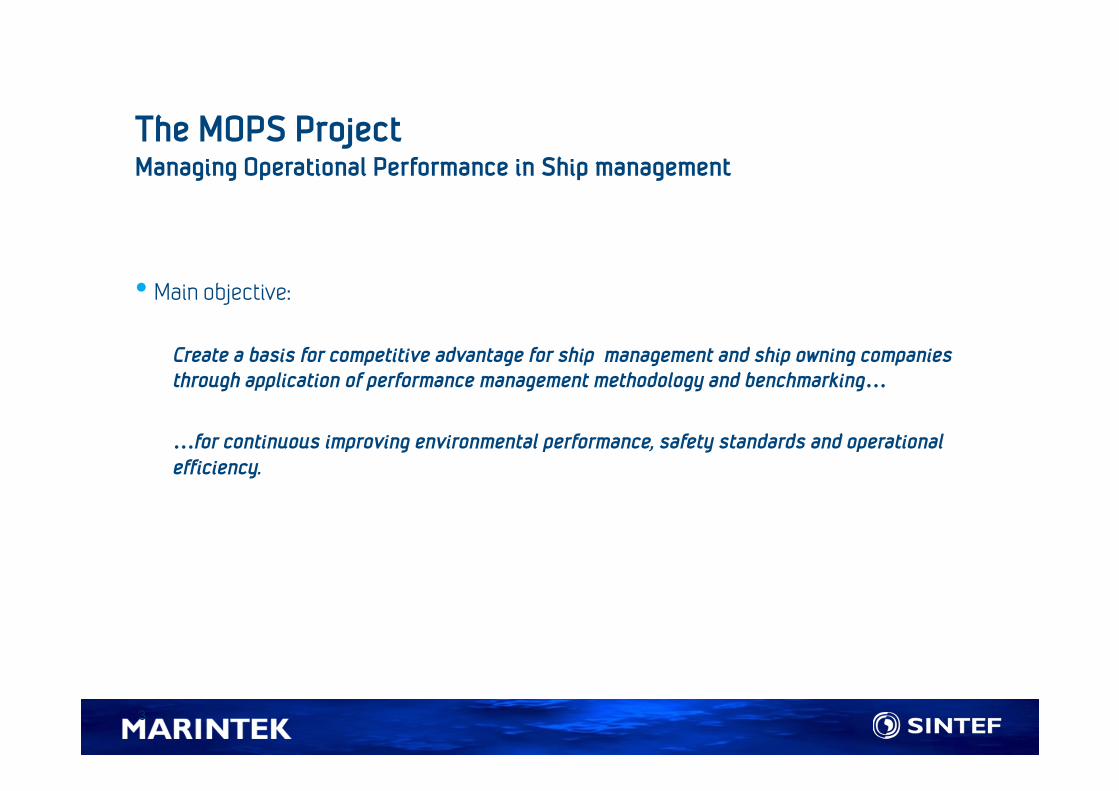
The MOPS Project Managing Operational Performance in Ship management
• Main objective:
Create a basis for competitive advantage for ship management and ship owning companies through application of performance management methodology and benchmarking…
…for continuous improving environmental performance, safety standards and operational efficiency.
3
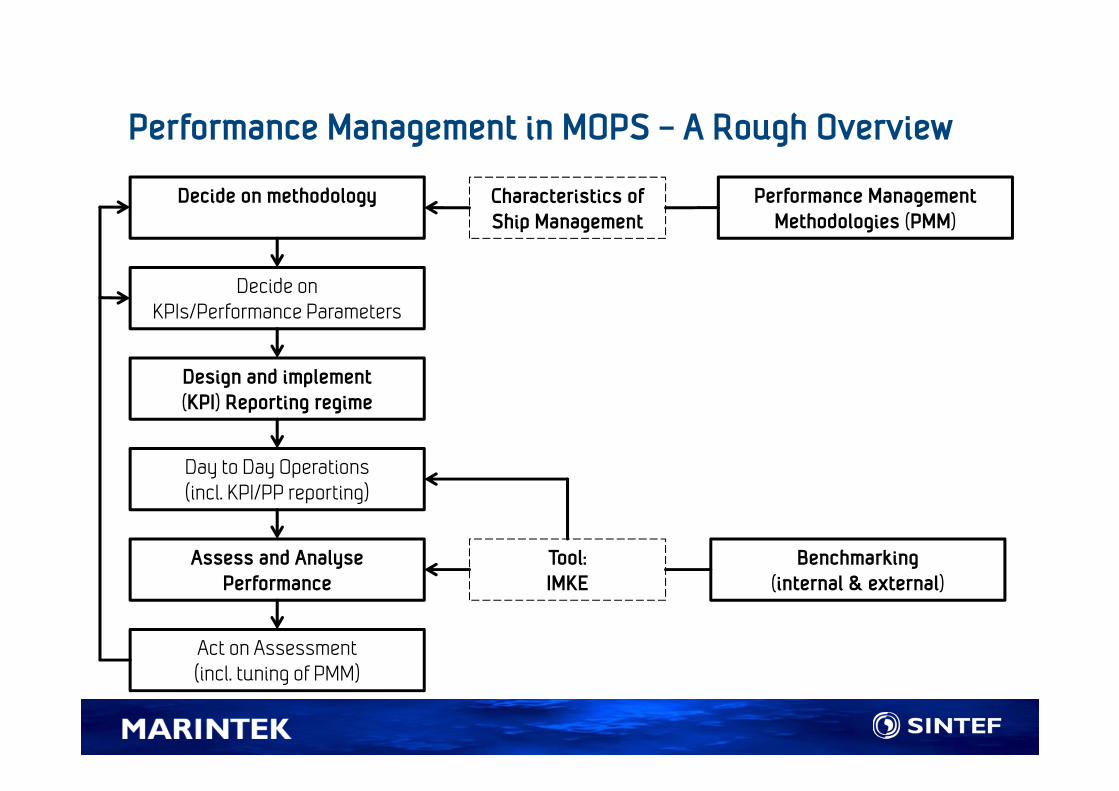
Performance Management in MOPS – A Rough Overview
Decide on methodology
Decide onKPIs/Performance Parameters
Design and implement(KPI) Reporting regime
Day to Day Operations(incl. KPI/PP reporting)
Assess and AnalysePerformance
Act on Assessment(incl. tuning of PMM)
Performance Management Methodologies (PMM)
Benchmarking (internal & external)
Characteristics ofShip Management
Tool:IMKE
The Shipping KPI Project Objectives
In order to:
• boost performance improvements internally
• provide an efficient communication platform about ship operation performance information to internal and external stakeholders through increased transparency
Develop tools to measure company and vessel performance.Have these recognized as
“a Standard Industry Measurement Tool”
You cannot measure what is not defined. You also cannot tell whether you have improved something, if you have not measured its performance Strassman, 1985

The Concept of the Shipping KPI Standard
SPI
PI
Proc
esse
s
Cust
omer
Lear
ning
HSE OthersFinancial
KPI
PI – textual definitions of measurements (PI Values) and guidelines for data collection
SPI – mathematical definitions (linear calculation using weighted sum of KPI Ratings)
KPI – mathematical definitions based on the PI Values. Two concepts are defined
The KPI Value (natural number calculated directly from PI Values)
The KPI Rating bringing the KPI Value into a 0-100 range)

SPI
KPIs
PIs
Environmental Performance
SOx efficiency
Other relevant KPIs(complete map. not shown)
CO2 efficiency
Cargo damage ratio
Total no of damaged or
lost cargo units or passengers injured during
voyage
Total no of cargo units or passengers transported
Accidental releases of substances as def by MARPOL
SOxefficiency
CO2efficiency
55 70 75 50 Av: 75
65
420,6 1879430325 24692,2
2 100 000
0 1
Emitted mass of SOx
Transport Work Emitted mass of CO2
Severe spills of bulk liquid
Total no of accidental releases of substances covered by MARPOL, to the environment
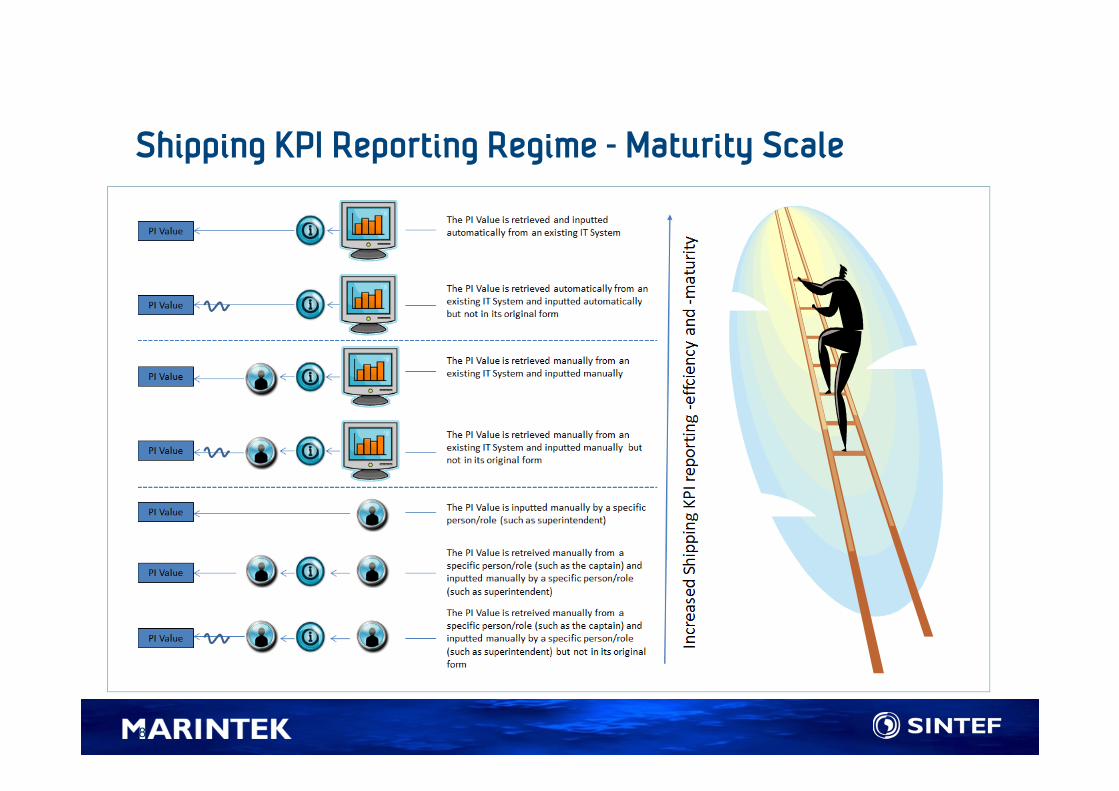
Shipping KPI Reporting Regime - Maturity Scale
8

Tool: InterManagerKPIEnvironment (IMKE) Vessel Overview
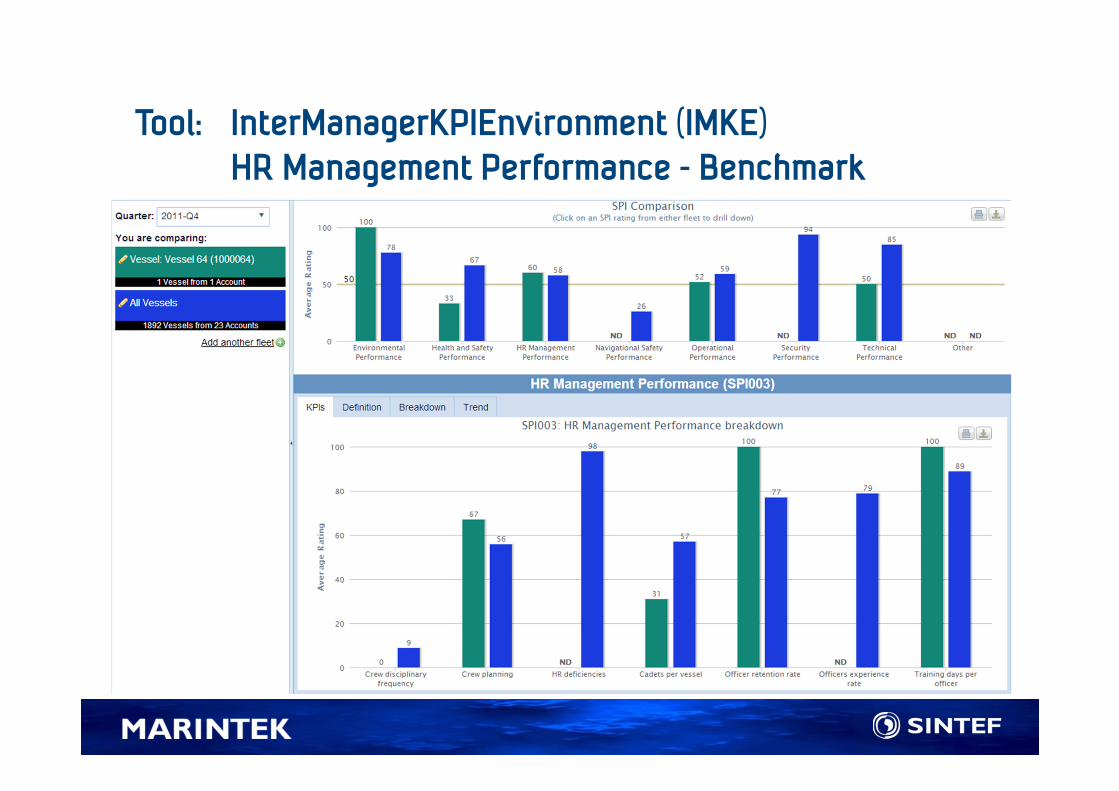
Tool: InterManagerKPIEnvironment (IMKE) HR Management Performance - Benchmark

KPIs in Odfjell
Key Performance Indicators (KPIs)
Our Key Performance Indicators (KPIs), totally 18, are expressions of performance within specific areas. Current KPIs established 2005
The objectives of our KPIs are to:• measure for continuous improvement • measure for internal and external benchmarking • measure to set incentives

Maturing in use of KPIs as a management tool
While maturing in use of KPIs as a management tool, we have realised that we need to change the idea that the KPIs is simply a collection of interesting numbers that people benefit to be knowledgeable about. We need to think about the KPIs in a more structured way.
There are 2 key principles that should be applied:
• “Top down – Ownership", the KPIs developed and driving the behaviours of officers, supervisors, managers, and executives should all be in alignment.
• “Driven from the process”, it is needed to have a clear understanding at every level of the organization about what the end-to end process is

© 2012 Deloitte AS
Main Processes
14
3. Ship Operations
4. Manage fleet capacity
1. CharteringMai
n
pro
cess
es:
Su
pp
ort
pro
cess
es:
2. Ship Management
6. Finance
7. HSEQ & S
10. Managementand strategy
5. IT
8. Emergency
9. HR
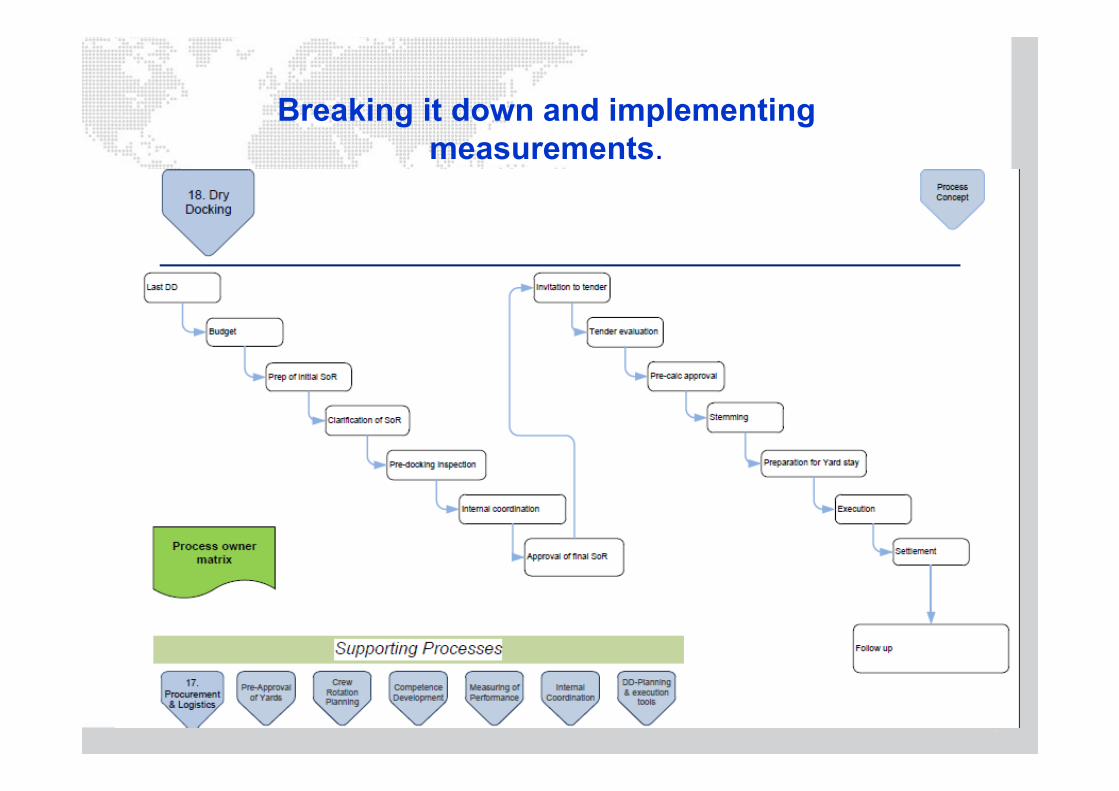
Breaking it down and implementingmeasurements.

Probability – reducing barriers, :- Competence- Procedures- Task Risk Assessment (TRA)
Consequence – reducing barriers, e.g.:- First aid- Detectors- Firefighting- PPE
Activities involving risk, .:- Tank entry- Mooring
Bow Tie Model and lagging indicators vs. leading indicators
Lost Time Injury
Most KPIs are Lagging indcators
leading indicators are clearly more valuable than lagging because
they measure effectiveness
in decided actions

In a proactive safety culture, safety indicators that are preventative as well as indicators that measure outcomes are measured.
Our goal is to increase focus on the preventative (probability side of the Bow Tie Model) side in order to reduce the frequencies within each indicator of the consequence side of the Bow Tie Model. It is important to realise that activities can develop with an unacceptable risk well before the evaluation of KPIs indication that there may be a problem.
Quite often a KPI on the right hand side has a corresponding KPI on the left hand side.
KPIs to support a proactive safety culture

Contact Information
• For the MOPS Project:− Jan Arthur Nordbeck (project manager) [email protected]
• For the Shipping KPI standard (www.shipping-kpi.org)− Dag Atle Nesheim (member of expert group) [email protected]
− Capt. Kuba Szymanski (Secretary General of InterManager) [email protected]
Top Related