


Languages
Pages
Legal


Shale Nano-Pore Structures and Confined Fluid Behavior
Project Number: FWP FE 406/408/409 2
Hongwu Xu, Qinjun Kang, Rex HjelmRajesh Pawar & George GuthrieLos Alamos National Laboratory
U.S. Department of EnergyNational Energy Technology Laboratory
Mastering the Subsurface Through Technology Innovation, Partnerships and Collaboration:Carbon Storage and Oil and Natural Gas Technologies Review Meeting
August 1-3, 2017

2
Presentation Outline
Technical Status– Experimental Studies (SANS)– Computer Simulations (LBM)
Accomplishments to Date Synergy Opportunities Project Summary
Why Shale Matrix?
3
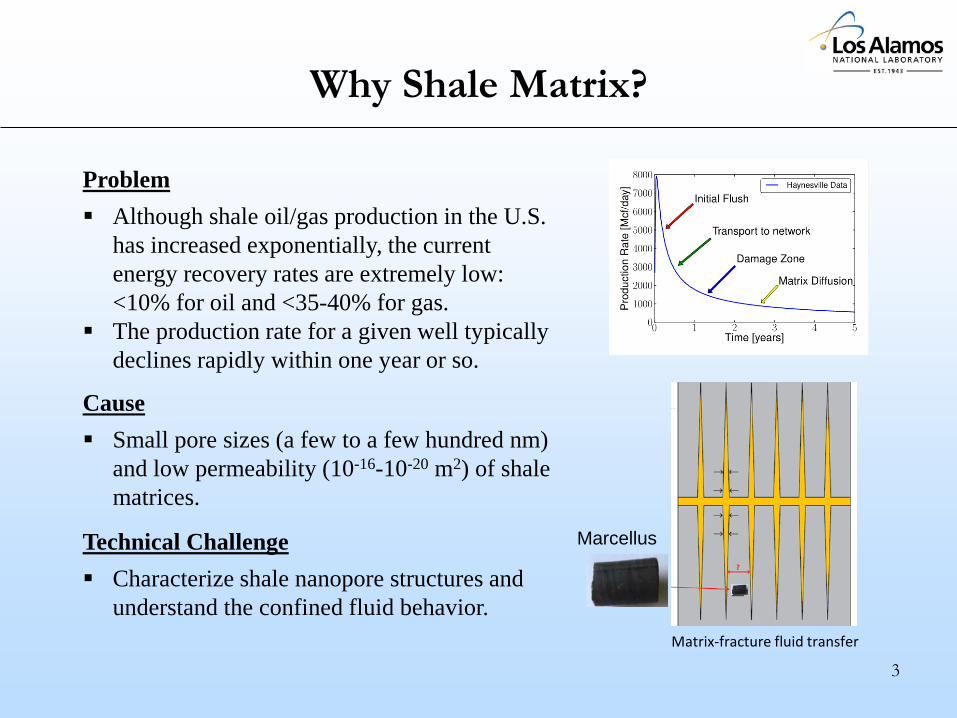
Problem Although shale oil/gas production in the U.S.
has increased exponentially, the current energy recovery rates are extremely low: <10% for oil and <35-40% for gas.
The production rate for a given well typically declines rapidly within one year or so.
Cause Small pore sizes (a few to a few hundred nm)
and low permeability (10-16-10-20 m2) of shale matrices.
Technical Challenge Characterize shale nanopore structures and
understand the confined fluid behavior.
Marcellus
Matrix-fracture fluid transfer
Shale Nano-Pore Structure (Open vs. Closed)
4
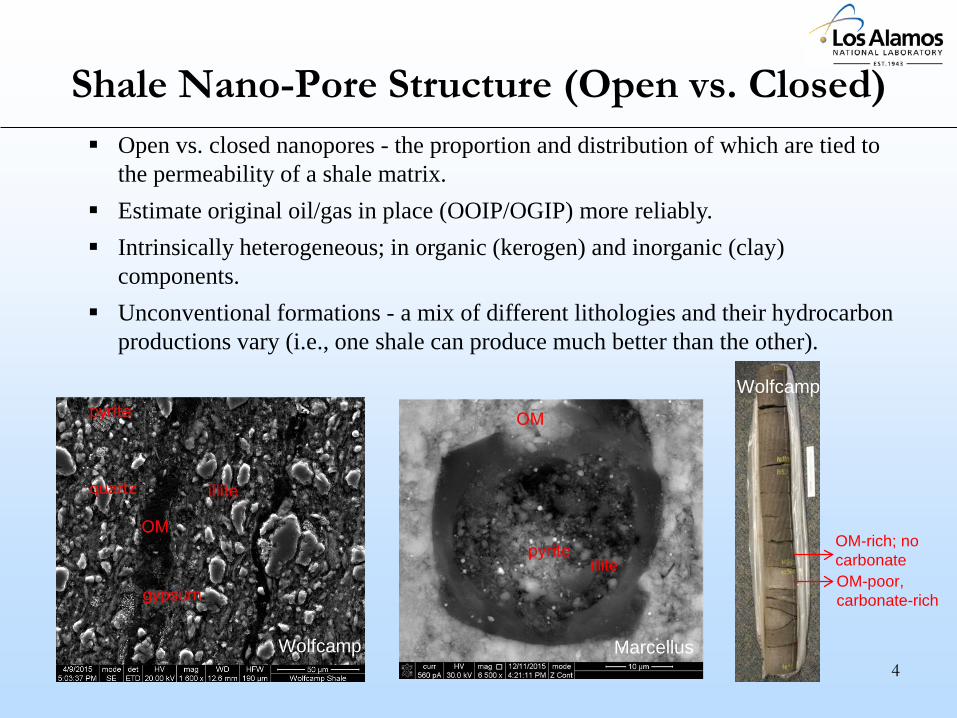
Open vs. closed nanopores - the proportion and distribution of which are tied to the permeability of a shale matrix.
Estimate original oil/gas in place (OOIP/OGIP) more reliably. Intrinsically heterogeneous; in organic (kerogen) and inorganic (clay)
components. Unconventional formations - a mix of different lithologies and their hydrocarbon
productions vary (i.e., one shale can produce much better than the other).
OM-poor, carbonate-rich
OM-rich; no carbonate
Wolfcamp
Wolfcamp Marcellus
illite
Nano-Pore Fluid Confinement (Pressure Mgmt.)
5
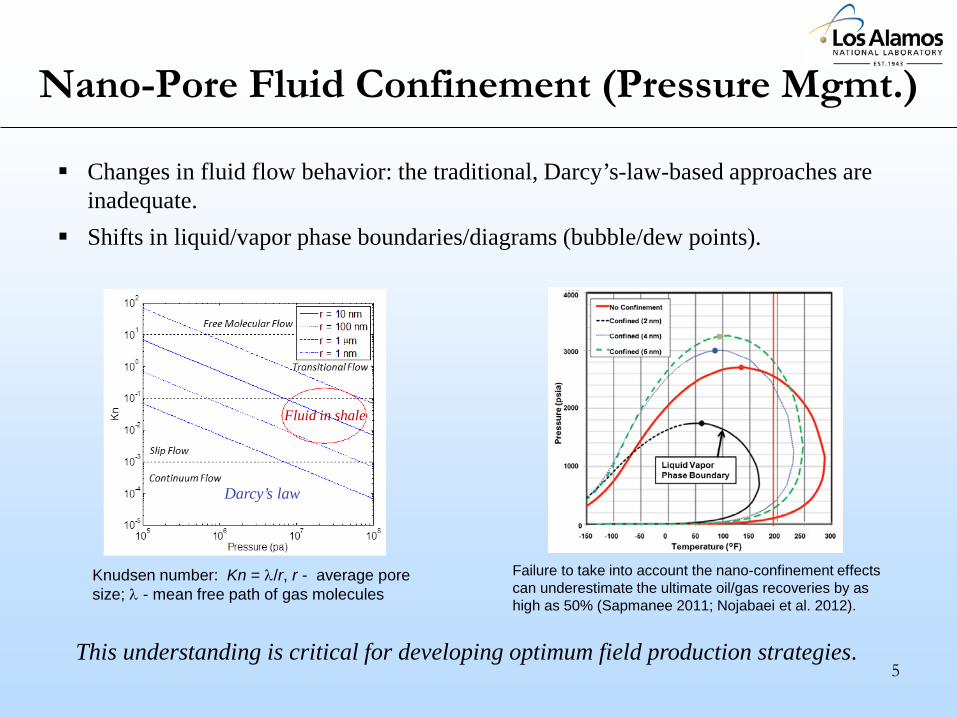
Changes in fluid flow behavior: the traditional, Darcy’s-law-based approaches are inadequate.
Shifts in liquid/vapor phase boundaries/diagrams (bubble/dew points).
This understanding is critical for developing optimum field production strategies.
Knudsen number: Kn = λ/r, r - average pore size; λ - mean free path of gas molecules
Failure to take into account the nano-confinement effects can underestimate the ultimate oil/gas recoveries by as high as 50% (Sapmanee 2011; Nojabaei et al. 2012).
Darcy’s law
Fluid in shale

Basic Shale Matrix Characterization
6
Compositions (mineralogy & chemistry) X-ray diffraction (XRD) – Mineral compositions X-ray fluorescence (XRF) – Chemical compositions Differential scanning calorimetry (DSC) / Thermogravimetry (TG) – TOC/water contents;
kerogen thermal maturity Microstructure
Scanning electron microscopy (SEM) / Focused ion beam (FIB); X-ray/neutron tomography tomography
illite dehydration
kerogen pyrolysis
Wolfcamp Dark Layer
Reflecting thermal maturity

Shale Nano-Pore Characterization
7
Conventional Techniques Gas adsorption and mercury intrusion/immersion porosimetry Transmission electron microscopy (TEM)
Larger pores dominate the overall pore volumes and pore surface areas. The high TOC shale is more porous than the low TOC shale: Kerogen is more porous.
Pore Diameter (nm)0 10 20 30
Cum
ulat
ive
Pore
Vol
ume
(cc/
g)
0.00
0.01
0.02
0.03
0.04
0.05
High TOC
Low TOC
N2 Adsorption
Marcellus
Marcellus (High TOC)TEM
Kerogen Nano-Pores

Shale Nano-Pore Characterization
8
Conventional Techniques Gas adsorption / mercury porosimetry: limited to measuring open pores TEM: requires thin specimens and measures a small area.
Neutron Scattering Neutrons are highly penetrating (e.g. compared with X-rays)
Probing samples at depths Ease of combination with sample environments (e.g. a pressure cell)
Neutrons are sensitive to hydrogen (rich in hydrocarbons and water) & its isotopes
Small-Angle Neutron Scattering
9
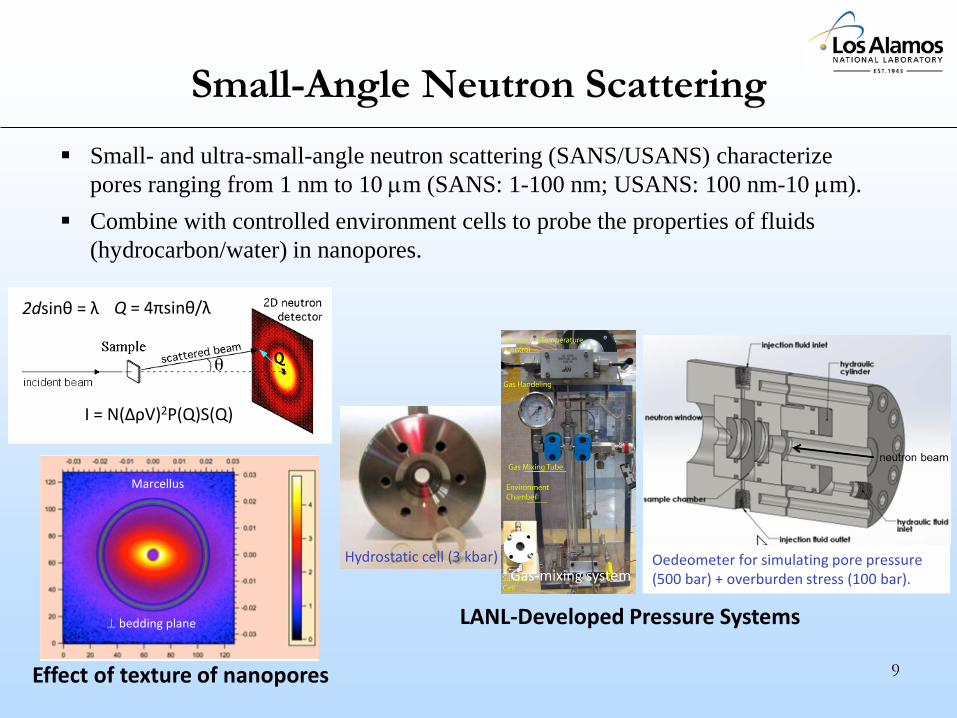
Small- and ultra-small-angle neutron scattering (SANS/USANS) characterize pores ranging from 1 nm to 10 µm (SANS: 1-100 nm; USANS: 100 nm-10 µm).
Combine with controlled environment cells to probe the properties of fluids (hydrocarbon/water) in nanopores.
Q = 4πsinθ/λ2dsinθ = λ
I = N(ΔρV)2P(Q)S(Q)
Hydrostatic cell (3 kbar) Oedeometer for simulating pore pressure (500 bar) + overburden stress (100 bar).Gas-mixing system
LANL-Developed Pressure Systems⊥ bedding plane
Marcellus
Effect of texture of nanopores
Develop an Approach to Distinguish Open vs. Closed Shale Nano-Pores
10
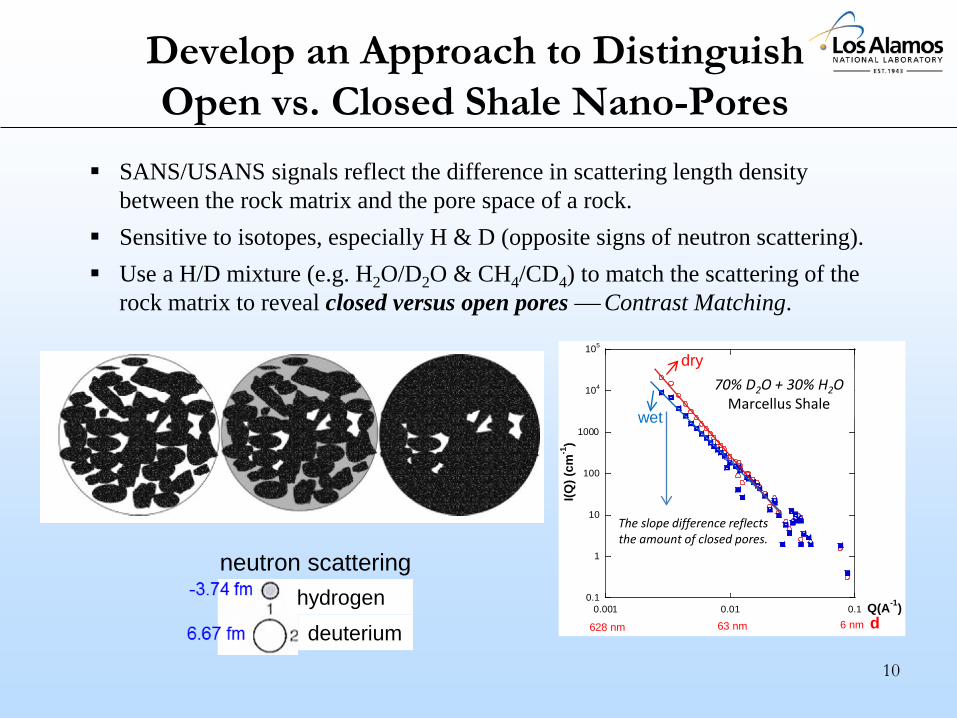
SANS/USANS signals reflect the difference in scattering length density between the rock matrix and the pore space of a rock.
Sensitive to isotopes, especially H & D (opposite signs of neutron scattering). Use a H/D mixture (e.g. H2O/D2O & CH4/CD4) to match the scattering of the
rock matrix to reveal closed versus open pores Contrast Matching.
0.1
1
10
100
1000
104
105
0.001 0.01 0.1
I(Q) (
cm-1
)
Q(A-1)
The slope difference reflects the amount of closed pores.
70% D2O + 30% H2OMarcellus Shale
628 nm 63 nm 6 nm d
dry
wet
hydrogendeuterium
neutron scattering

11
• Higher pressures (> 4K psi) had little effect.• Water entered into larger pores (tens of nm).• On decreasing P, water remained in the pores.
psipsi
psipsi
Water Imbibition – Water Stays in the Matrix
12
Pressure media: 70% D2O + 30% H2O – to match the matrix
Knudsen diffusion Surface diffusionViscous flow
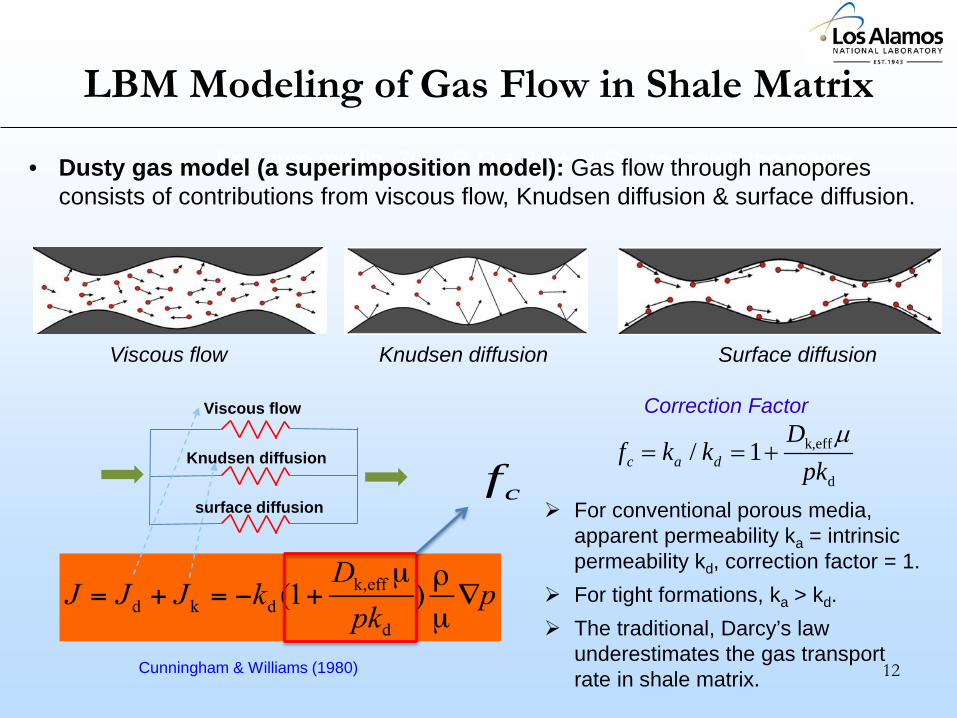
Cunningham & Williams (1980)
Viscous flow
Knudsen diffusion
surface diffusioncf
• Dusty gas model (a superimposition model): Gas flow through nanoporesconsists of contributions from viscous flow, Knudsen diffusion & surface diffusion.
k,eff
d
/ 1c a d
Df k k
pkµ
= = +
For conventional porous media, apparent permeability ka = intrinsic permeability kd, correction factor = 1.
For tight formations, ka > kd. The traditional, Darcy’s law
underestimates the gas transport rate in shale matrix.
Correction Factor
LBM Modeling of Gas Flow in Shale Matrix
Develop a Predictive Method for Modeling Gas Flow in Shale Matrix
13
Pressure media: 70% D2O + 30% H2O – to match the matrix
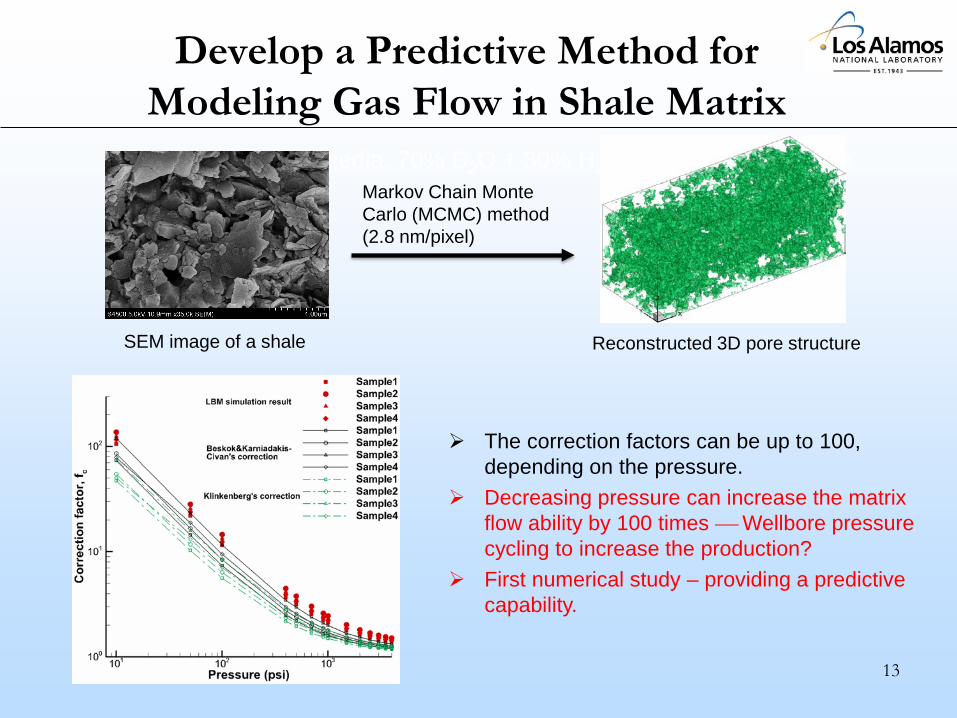
SEM image of a shale Reconstructed 3D pore structure
Markov Chain Monte Carlo (MCMC) method (2.8 nm/pixel)
The correction factors can be up to 100, depending on the pressure.
Decreasing pressure can increase the matrix flow ability by 100 times Wellbore pressure cycling to increase the production?
First numerical study – providing a predictive capability.
Effect of Surface Diffusion on Gas Flow
14
Pressure media: 70% D2O + 30% H2O – to match the matrix
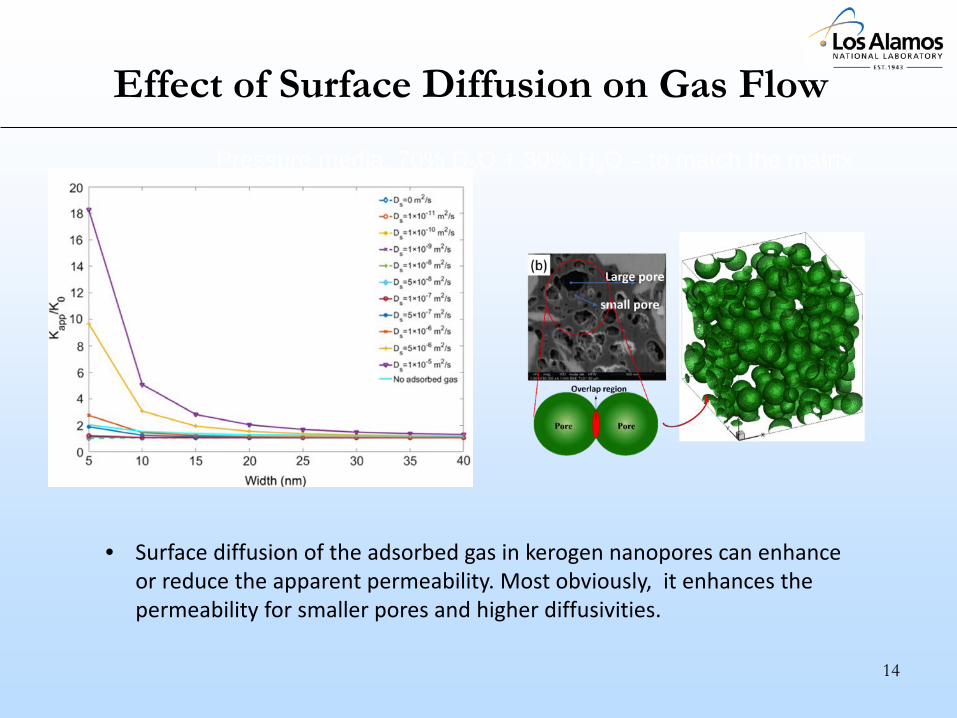
• Surface diffusion of the adsorbed gas in kerogen nanopores can enhance or reduce the apparent permeability. Most obviously, it enhances the permeability for smaller pores and higher diffusivities.

Effect of Mixed Wettability on the Relative Permeability of Oil-Water flow
15
Pressure media: 70% D2O + 30% H2O – to match the matrix
Oil-Wet Solid
Water-Wet Solid
O/W = 4/1 O/W = 3/2
O/W = 2/3 O/W = 1/4
Porous media with different wettability properties. Grey color denotes oil wet and black color water wet. The fractions of water wet solids are 0.0, 0.2, 0.4, 0.6, 0.8 and 1.0, respectively, from top left to bottom right.
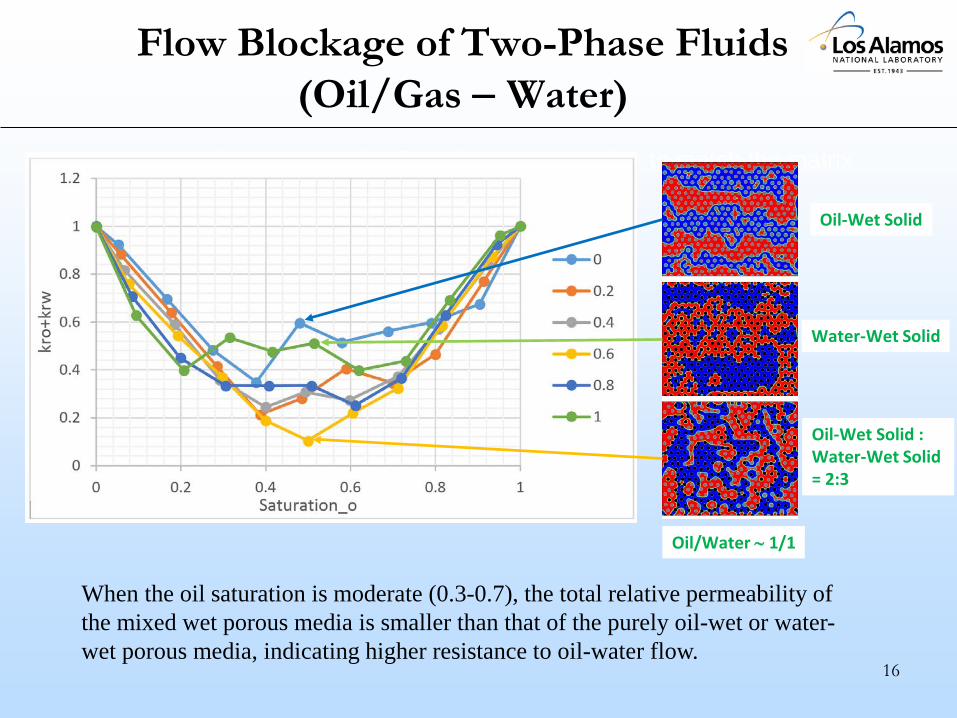
Flow Blockage of Two-Phase Fluids (Oil/Gas − Water)
16
Pressure media: 70% D2O + 30% H2O – to match the matrix
Oil-Wet Solid
Water-Wet Solid
Oil-Wet Solid : Water-Wet Solid = 2:3
Oil/Water ∼ 1/1
When the oil saturation is moderate (0.3-0.7), the total relative permeability of the mixed wet porous media is smaller than that of the purely oil-wet or water-wet porous media, indicating higher resistance to oil-water flow.
Accomplishments to Date
Developed a capability/approach to measure open vs. closed shale nanopores at reservoir conditions important for better estimating original gas/oil in place.
Examined the water imbibition phenomenon in shale matrix important for addressing the question of ‘where does the water go during fracking?’.
Discovered the enhanced gas flow ability in shale matrix by 100 times via decreasing pressure wellbore pressure cycling to increase gas production?
Predicted the reduced total relative permeability of mixed wet porous media compared to that of a purely oil-wet or water-wet medium higher resistance to two-phase oil/gas-water flow.
17

Synergy Opportunities
Multi-Lab Synergies and Collaborations on Unconventional Gas/Oil Research
• Common field site: Marcellus and MSEEL• Sample sharing: Avoid redundant sample characterization
and provide/share complementary information obtained with different techniques
• Geochemistry/mineralogy collaboration between LANL, SLAC, Sandia, LBL and NETL.
Synergies with CO2 Sequestration (caprock properties)
18
Project Summary Key FindingsDetermination of open vs. closed shale nanopores is important for
better estimating original gas/oil in place and for predicting well production performance.While increasing pressure generally opens fractures to facilitate gas
flow, decreasing pressure can also enhance gas flow in shale matrix. This finding suggests the production can potentially be increased via wellbore pressure cycling.
Next StepsCharacterize open/closed nanopores for a set of representative shale
lithologies and link the characteristics with the production data. Predict the gas flow in shale matrix based on the determined nanopore
structures and incorporate the results into DFN modeling to simulate the production curve. 19

20
Questions?

21
Appendix: Benefit to the Program
• Program goals being addressed:The magnitude of the natural gas resource recoverable from domestic fractured shales has only been recognized within the past decade as a combination of drilling and well completion technology advancements, which have made it possible to produce gas from shales at economic rates. NETL research efforts focus on further refining these technologies, characterizing the geology of emerging shale plays, and accelerating the development of technologies that can reduce the environmental impacts of shale play development.
• Project benefits statement:This research project is developing an approach for characterizing shale nanoporestructures and their confined fluid behavior with high fidelity. The obtained new knowledge will reveal the key factors controlling the production tail and thus will help develop optimum long-term field production strategies to enhance hydrocarbon recovery.
22
Appendix: Project Overview Goals and Objectives
Develop a fundamental understanding of what controls hydrocarbon transport at different scales, using an integration of experimental and modeling methods.– Experimental studies and pore-scale modeling of shale matrix
nanopore structures and their fluid behavior• What are the characteristics of shale nanopores?• How to better estimate the original gas/oil in place?• How do fluids move within the matrix and to fractures?
23
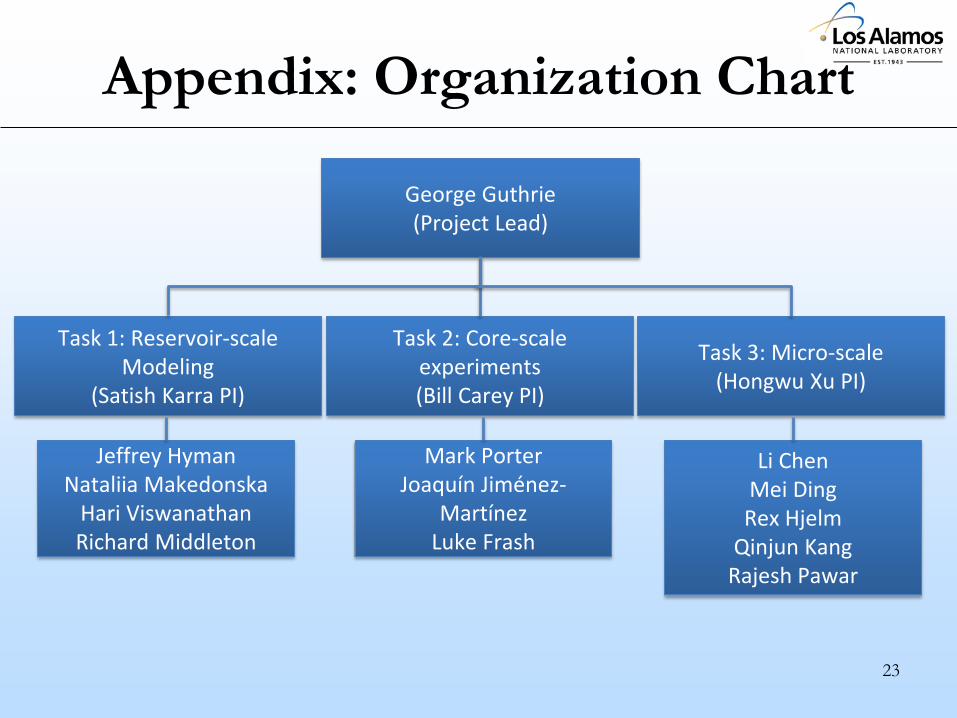
Appendix: Organization Chart
George Guthrie(Project Lead)
Task 1: Reservoir-scale Modeling
(Satish Karra PI)
Task 2: Core-scale experiments(Bill Carey PI)
Task 3: Micro-scale(Hongwu Xu PI)
Jeffrey HymanNataliia Makedonska
Hari ViswanathanRichard Middleton
Mark PorterJoaquín Jiménez-
MartínezLuke Frash
Li ChenMei DingRex Hjelm
Qinjun KangRajesh Pawar
24
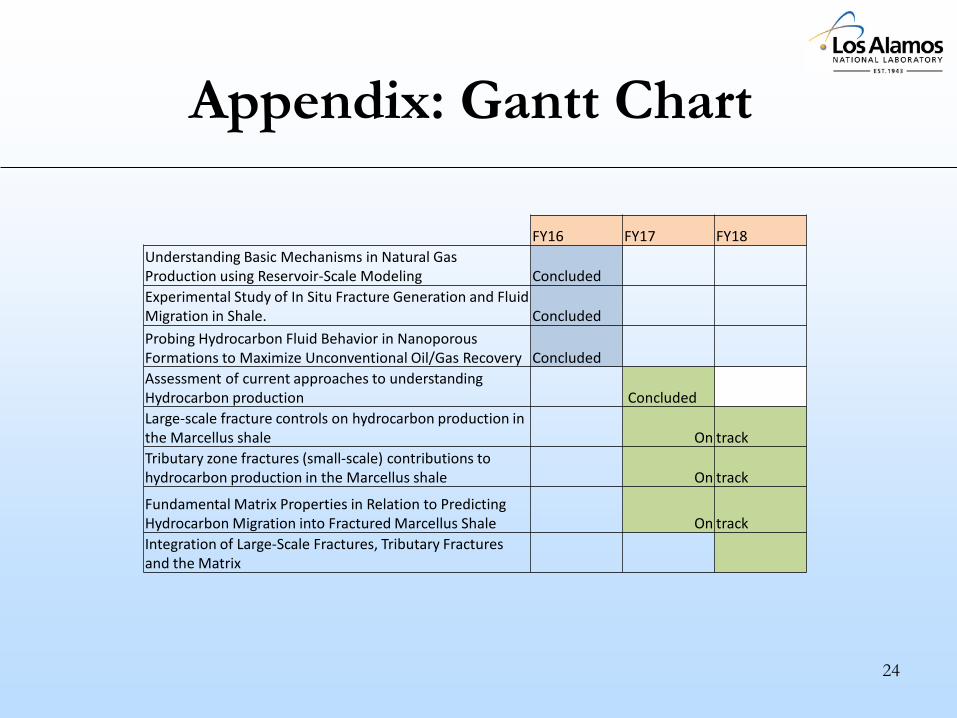
Appendix: Gantt Chart
FY16 FY17 FY18Understanding Basic Mechanisms in Natural Gas Production using Reservoir-Scale Modeling ConcludedExperimental Study of In Situ Fracture Generation and Fluid Migration in Shale. ConcludedProbing Hydrocarbon Fluid Behavior in NanoporousFormations to Maximize Unconventional Oil/Gas Recovery ConcludedAssessment of current approaches to understanding Hydrocarbon production ConcludedLarge-scale fracture controls on hydrocarbon production in the Marcellus shale On trackTributary zone fractures (small-scale) contributions to hydrocarbon production in the Marcellus shale On track
Fundamental Matrix Properties in Relation to Predicting Hydrocarbon Migration into Fractured Marcellus Shale On trackIntegration of Large-Scale Fractures, Tributary Fractures and the Matrix
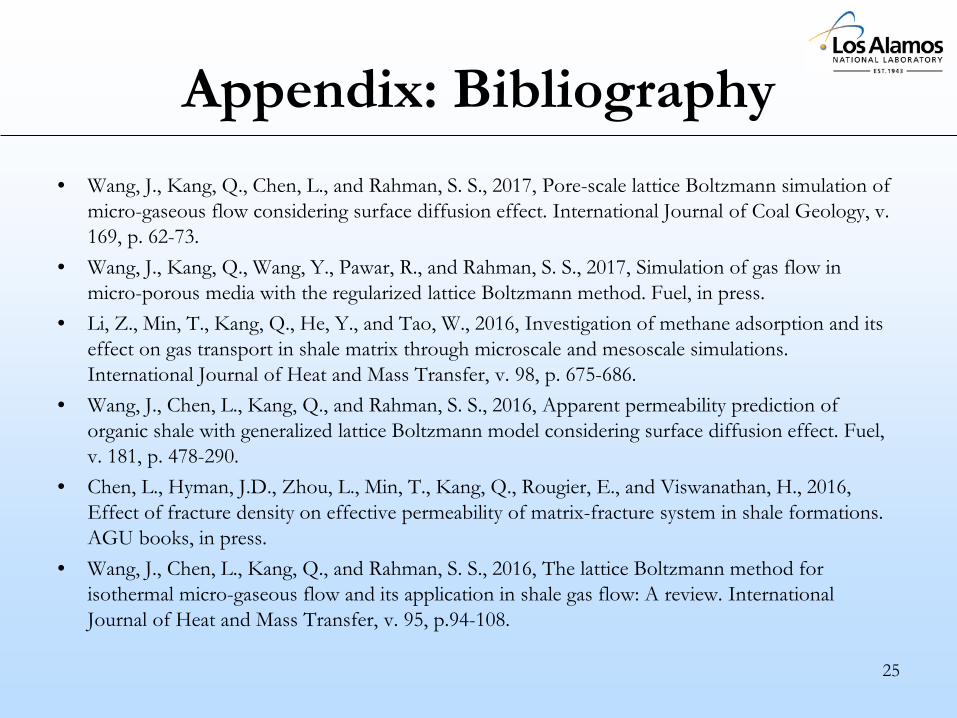
Appendix: Bibliography• Wang, J., Kang, Q., Chen, L., and Rahman, S. S., 2017, Pore-scale lattice Boltzmann simulation of
micro-gaseous flow considering surface diffusion effect. International Journal of Coal Geology, v. 169, p. 62-73.
• Wang, J., Kang, Q., Wang, Y., Pawar, R., and Rahman, S. S., 2017, Simulation of gas flow in micro-porous media with the regularized lattice Boltzmann method. Fuel, in press.
• Li, Z., Min, T., Kang, Q., He, Y., and Tao, W., 2016, Investigation of methane adsorption and its effect on gas transport in shale matrix through microscale and mesoscale simulations. International Journal of Heat and Mass Transfer, v. 98, p. 675-686.
• Wang, J., Chen, L., Kang, Q., and Rahman, S. S., 2016, Apparent permeability prediction of organic shale with generalized lattice Boltzmann model considering surface diffusion effect. Fuel, v. 181, p. 478-290.
• Chen, L., Hyman, J.D., Zhou, L., Min, T., Kang, Q., Rougier, E., and Viswanathan, H., 2016, Effect of fracture density on effective permeability of matrix-fracture system in shale formations. AGU books, in press.
• Wang, J., Chen, L., Kang, Q., and Rahman, S. S., 2016, The lattice Boltzmann method for isothermal micro-gaseous flow and its application in shale gas flow: A review. International Journal of Heat and Mass Transfer, v. 95, p.94-108.
25
Top Related