


Languages
Pages
Legal

Entrepreneurs for a Sustainable Renewal:
Community Capital in Greater New Orleans and
the Impacts of Sustainability Entrepreneurship
by
Brennan Lowery
B.A., Rhodes College, 2011
Research Project Submitted In Partial Fulfillment of the
Requirements for the Degree of
Master of Resource Management (Planning)
in the
School of Resource and Environmental Management
Faculty of Environment
Project No. 573
Brennan Lowery 2013
SIMON FRASER UNIVERSITY
Summer 2013
ii
Approval
Name: Brennan Lowery
Degree: Master of Resource Management (Planning)
Project No.: 573
Title of Thesis: Entrepreneurs for a Sustainable Renewal: Community Capital in Greater New Orleans and the Impacts of Sustainability Entrepreneurship
Examining Committee: Chair:
Larissa Ardis Master of Resource Management Candidate
Mark Roseland Senior Supervisor Professor
John F. L. M. M. Dagevos Co-supervisor Adjunct Professor
Date Defended/Approved:
May 10, 2013
iii
Partial Copyright Licence
Ethics Statement
The author, whose name appears on the title page of this work, has obtained, for the research described in this work, either:
a. human research ethics approval from the Simon Fraser University Office of Research Ethics,
or
b. advance approval of the animal care protocol from the University Animal Care Committee of Simon Fraser University;
or has conducted the research
c. as a co-investigator, collaborator or research assistant in a research project approved in advance,
or
d. as a member of a course approved in advance for minimal risk human research, by the Office of Research Ethics.
A copy of the approval letter has been filed at the Theses Office of the University Library at the time of submission of this thesis or project.
The original application for approval and letter of approval are filed with the relevant offices. Inquiries may be directed to those authorities.
Simon Fraser University Library Burnaby, British Columbia, Canada
update Spring 2010
iv
Abstract
This project intends to identify the vision for regional sustainable development in Greater
New Orleans, LA and offer an initial assessment of the recent advent of sustainability
entrepreneurs on progress toward this vision. Given the lack of consensus on the
meaning of and goals for a sustainable region, especially in light of planning and policy
debates surrounding post-Hurricane Katrina renewal, this study attempts to articulate a
more unified vision for regional sustainable development. This vision is comprised of
both existing policy and planning documents and the perspectives of local leaders in key
community issues. The project is guided by the Community Capital Tool and also offers
a region-wide sustainable development monitoring tool known as the Sustainable
Region Balance Sheet which measures Greater New Orleans’ progress towards this
vision. In parallel, it also explores the phenomenon of sustainability entrepreneurship,
both by integrating existing literature on the concept and examining the impacts of
entrepreneurs with a sustainability vision on stocks of community capital in the region.
This assessment reveals that Greater New Orleans is in need of extensive efforts to
improve critical stocks of community capital to become a more sustainable region, while
there is considerable promise for sustainability entrepreneurs from private, non-profit,
and hybrid sectors to lead these efforts.
Keywords: Regional sustainable development; New Orleans; Community Capital Tool; Sustainability Entrepreneurship
v
Dedication
This project is dedicated first to the people of New Orleans living across all of its
communities and neighbourhoods. My constant hope has always been that my efforts in
this project can be relevant to their continual journey to renewing and revitalizing the
unique gem that they call home. I also hope that this project can serve as a chance to
fulfill a lifelong desire to give something meaningful to the city and region that, despite
always being my home and part of me, I regretfully have left in my own journey. May our
paths often cross in the future and may my efforts be able, even from afar, to make a
small but meaningful contribution to your rebirth and empowerment.
I also would like to dedicate this project to my family: to my fiancé, Valeria, whose
endless support and encouragement has always given me strength and hope to believe
in my vision and in myself; to my mother, Ellen, whose guidance and mentorship as a
fellow researcher and advocate of New Orleans, and as my personal role model, gave
me indispensable insight and inspiration; to my father, David, for teaching me confidence
and strength; to my aunts and uncles for always believing in me; and to my Babay, for
always watching over me.
vi
Acknowledgements
I owe immeasurable gratitude to my supervisors, Mark Roseland and John Dagevos,
whose careful and patient guidance made this project possible. I am also grateful to
Simon Fraser University, the School of Resource and Environmental Management, the
Centre for Sustainable Community Development, and the Telos Centre for Sustainable
Development. I am also grateful to fellow CSCD researchers Julie Lowry, Larissa Ardis,
Nelly Bouevitch, and Julia Fryer for their support.
I am also extremely grateful for the collaboration of local organizations, most notably
LifeCity, whose continual support and coordination made this project possible; as well as
the Green Collaborative and The New Orleans Chamber of Commerce for their
invaluable support. I would also like to acknowledge and thank the organizations that
contributed to this project through the insight and generosity of those who gave their
perspectives during this research, including the City of New Orleans, the Regional
Planning Commission, NOLA Brewery, Hollygrove Market and Farm, LA Green Corps,
the University of New Orleans, the Greater New Orleans Sports Foundation, Entergy
New Orleans, Bayou Kayaks, La Divina Gelateria, Waggoner & Ball Architects, The
Green Project, Sierra Club New Orleans, and Bayou Rebirth. Several individuals,
including Lizzy Shephard, David Young, Lauren Nelson, Brusnichka Moroshkina, Daniel
Paschall, and Dr. Laura Murphy, also are due my gratitude.
vii
Table of Contents
Approval .......................................................................................................................... ii Partial Copyright Licence ............................................................................................... iii Abstract .......................................................................................................................... iv Dedication ....................................................................................................................... v Acknowledgements ........................................................................................................ vi Table of Contents .......................................................................................................... vii List of Tables ................................................................................................................. xii List of Figures................................................................................................................xiv List of Acronyms ........................................................................................................... xvii
1. Sustainable Communities and Regional Development in Greater New Orleans .................................................................................................................. 1
1.1. The Need for Sustainability in Marginalized Communities ...................................... 3 1.2. Entrepreneurship for Sustainable Development ...................................................... 4 1.3. Sustainability Entrepreneurship in New Orleans ..................................................... 6 1.4. Purpose of Study .................................................................................................... 7
1.4.1. Process Objective ....................................................................................... 8 1.4.2. Outcome Objectives .................................................................................... 8 1.4.3. Intended Outcomes ..................................................................................... 9
2. Literature Review ................................................................................................ 11 2.1. Sustainable Community Development .................................................................. 11
2.1.1. Community Capital .................................................................................... 12 2.1.2. Community Capital Tool ............................................................................ 15 2.1.3. Market Approaches to Sustainability ......................................................... 17
2.2. Sustainability Entrepreneurship ............................................................................ 18 2.2.1. What is Sustainability Entrepreneurship? .................................................. 18 2.2.2. Why Focus on Entrepreneurship for Sustainability? .................................. 19 2.2.3. A Broader Concept of Entrepreneurship .................................................... 22 2.2.4. Lending Support to SE .............................................................................. 23
Social Entrepreneurship ............................................................................ 23 Corporate Social Responsibility ................................................................ 25 Shared Value ............................................................................................ 27 Sustainable Value Chains ......................................................................... 28
2.2.5. What is Missing from the SE Framework? ................................................. 30 2.2.6. Sustainability Entrepreneurship and Marginalized Communities ............... 31 2.2.7. Supporting Entrepreneurs for Community Sustainability ........................... 33 2.2.8. An Integrated Model of Sustainability Entrepreneurship ............................ 34
2.3. Indicator Frameworks for Measuring Regional Development ................................ 36 2.3.1. Strengths and Weaknesses of Top-down and Bottom-up Indicator
Frameworks .............................................................................................. 37 2.4. Greater New Orleans: Contemporary Policy and Planning Context ...................... 39
2.4.1. New Orleans up to 2005 ........................................................................... 39 2.4.2. The Post-Katrina Response ...................................................................... 42 2.4.3. Contested Visions of Recovery ................................................................. 43
Two Recovery Plans ................................................................................. 43
viii
2.4.4. Two Disasters on the Way to Recovery ..................................................... 45 Great Recession ....................................................................................... 45 BP Oil Spill ................................................................................................ 46
2.4.5. Contemporary Political, Ecological and Socio-economic Environment .............................................................................................. 46 Political ..................................................................................................... 47 Environmental ........................................................................................... 47 Social ........................................................................................................ 48 Economic .................................................................................................. 49
2.4.6. The Need for a Common Vision for Regional Development ...................... 49
3. Methodology ....................................................................................................... 51 3.1. Integrating Empirical Data and Community Perspectives...................................... 51 3.2. Sustainability Entrepreneurship Collaboration ...................................................... 52
3.2.1. Partnership with LifeCity ........................................................................... 53 3.2.2. Participants ............................................................................................... 54 3.2.3. Semi-structured Interviews ........................................................................ 56 3.2.4. Collaborative Workshop ............................................................................ 56
3.3. Executing the New Orleans Model ........................................................................ 57 3.3.1. Crafting a Common Regional Vision ......................................................... 57
Pre-existing Visions .................................................................................. 57 Stakeholder Visions .................................................................................. 58 Community Capital Vision ......................................................................... 59 Common Vision ........................................................................................ 59
3.3.2. Measuring Empirical Sustainability through the Balance Sheet ................. 59 3.3.3. Assessing the Role of Sustainability Entrepreneurship in Regional
Development ............................................................................................. 60 3.4. Final Project Delivery ............................................................................................ 61
4. A Common Vision of Regional Sustainable Development in Greater New Orleans ........................................................................................................ 63
4.1. Pre-existing Visions .............................................................................................. 64 4.1.1. The New Orleans Index ............................................................................ 64 4.1.2. New Orleans 2030 .................................................................................... 65 4.1.3. Greater New Orleans at the Inflection Point .............................................. 67 4.1.4. Impact Economy ....................................................................................... 68 4.1.5. Lessons from Pre-existing Visions ............................................................ 69
4.2. Stakeholder Visions .............................................................................................. 73 4.2.1. Healing and Learning ................................................................................ 74 4.2.2. Ecocity ...................................................................................................... 75 4.2.3. Entrepreneurship and Growth ................................................................... 77 4.2.4. Water Steward .......................................................................................... 79 4.2.5. Local NOLA .............................................................................................. 80 4.2.6. Governance and Ethics ............................................................................. 82 4.2.7. Somewhere Else ....................................................................................... 83 4.2.8. Analyzing Stakeholder Visions .................................................................. 84
4.3. Integrating Visions into the Community Capital Framework .................................. 85 4.4. Common Vision .................................................................................................... 88 4.5. Review of Findings ............................................................................................... 91
ix
5. The Sustainable Region Balance Sheet ............................................................ 92 5.1. Results ................................................................................................................. 96
5.1.1. Social Capital ............................................................................................ 97 Citizenship ................................................................................................ 98 Safety ..................................................................................................... 100
5.1.2. Cultural Capital ....................................................................................... 102 Cultural Heritage ..................................................................................... 103 Identity and Diversity ............................................................................... 104
5.1.3. Human Capital ........................................................................................ 106 Education ................................................................................................ 107 Health and Well-being ............................................................................. 110
5.1.4. Economic Capital .................................................................................... 112 Labour .................................................................................................... 113 Economic Structure ................................................................................. 115 Financial Resources ............................................................................... 117
5.1.5. Physical Capital ...................................................................................... 119 Transportation ......................................................................................... 120 Land........................................................................................................ 122 Housing and Living Conditions ................................................................ 123 Infrastructure ........................................................................................... 125
5.1.6. Natural Capital ........................................................................................ 127 Surface Water ......................................................................................... 128 Ground Water ......................................................................................... 129 Air .......................................................................................................... 131 Soil ......................................................................................................... 133 Minerals and Non-renewable Resources ................................................ 135 Landscape .............................................................................................. 137
5.2. Review of Findings ............................................................................................. 139
6. Community Impacts of Sustainability Entrepreneurship in Greater New Orleans .............................................................................................................. 141
6.1. Intended Impacts of Sustainability Entrepreneurs ............................................... 144 6.1.1. Sustainability Entrepreneurs and the Common Vision ............................. 144 6.1.2. Promoting Sustainable Business ............................................................. 145
Putting Community First .......................................................................... 146 Staple-on Sustainability........................................................................... 147
6.1.3. Reducing Waste ...................................................................................... 149 Changing Public Attitudes Towards Waste.............................................. 150 Adapting to Local Capacity ..................................................................... 150
6.1.4. Restoring Ecosystems ............................................................................ 152 Supporting Habitat Protection ................................................................. 153
6.1.5. Increasing Food Security ........................................................................ 153 Food Sharing .......................................................................................... 154
6.1.6. Strengthening Communities .................................................................... 155 Understanding Local Needs and Values ................................................. 156 Inspiring Leadership ................................................................................ 156
6.1.7. Organizational Models and Their Relationship to Intended Impacts ........ 157 Private .................................................................................................... 158
Strengthening the Local Economy ..................................................... 158
x
Altruism and Opportunism ................................................................. 159 Non-profit ................................................................................................ 159
Supporting Economic Development .................................................. 160 Instilling Confidence .......................................................................... 160
Hybrid ..................................................................................................... 161 Improving Food Access ..................................................................... 161 Promoting Healing ............................................................................. 162
6.1.8. Overview of SE Intended Impacts ........................................................... 162 6.1.9. Sustainability Entrepreneurs in Theory and Practice ............................... 164
Private .................................................................................................... 165 Non-profit ................................................................................................ 166 Hybrid ..................................................................................................... 167 Overall SE Network ................................................................................. 168
6.2. Perceived Regional Impacts of Sustainability Entrepreneurs .............................. 168 6.2.1. Sustainability Entrepreneur Self-Assessment .......................................... 169
Non-profit ................................................................................................ 170 Private .................................................................................................... 171
6.2.2. Sustainability Entrepreneurship Cross-evaluation ................................... 172 Community.............................................................................................. 173
Strengthening Green Markets ........................................................... 173 Spreading Sustainability Values ........................................................ 174
Municipal Agencies ................................................................................. 174 Municipal Sustainability Champions .................................................. 175 Supporting Sustainability Partnerships .............................................. 175
Green Business Owners ......................................................................... 175 Support for Green Business .............................................................. 176
Non-profit Organizations ......................................................................... 176 Engaging Communities ..................................................................... 176 Fostering Sustainable Change .......................................................... 177
6.3. Barriers ............................................................................................................... 177 6.3.1. Community Barriers ................................................................................ 178
Lack of Community Capacity................................................................... 178 Unaffordability ......................................................................................... 179
6.3.2. Municipal Government Barriers ............................................................... 179 Misaligned Priorities ................................................................................ 179 Financial Constraints .............................................................................. 180
6.3.3. Green Business Barriers ......................................................................... 181 Irrelevance to Communities .................................................................... 181
6.3.4. Non-profit Barriers ................................................................................... 182 Mission Silos ........................................................................................... 182
6.3.5. Overview of Barriers ................................................................................ 183 6.4. Review of Findings ............................................................................................. 184
7. The Role of LifeCity in Regional Sustainable Development .......................... 185 7.1. LifeCity’s Goals .................................................................................................. 186 7.2. Perceived Impacts of LifeCity ............................................................................. 187
7.2.1. Forms of Community Impact ................................................................... 187 Building a Green Business Community ................................................... 187 Reaching the Broader Community .......................................................... 188
xi
Providing Expertise and Reflection ......................................................... 188 7.3. Key Actors Supported by LifeCity ....................................................................... 190
7.3.1. Green Businesses ................................................................................... 191 7.3.2. Non-profits .............................................................................................. 192
7.4. Impacts on Community Capital in Greater New Orleans ..................................... 193 7.5. Review of Findings ............................................................................................. 194
8. Recommendations and Conclusions .............................................................. 196 8.1. Practical Recommendations ............................................................................... 198
8.1.1. Participatory Planning Framework ........................................................... 199 8.1.2. Stakeholder Recommendations .............................................................. 202
Citizen Organizations .............................................................................. 202 SE and Supporters of Sustainability Entrepreneurs ................................. 203 Business Community .............................................................................. 204 Municipal Government ............................................................................ 205 State and Federal Government ............................................................... 206
8.2. Research Implications ........................................................................................ 207 8.2.1. Community Capital Framework ............................................................... 207
Applicability of the 6-Capital Model in New Orleans ................................ 207 The Need for Equity Considerations........................................................ 208 Considering the Governmental Context .................................................. 208
8.2.2. Implications for SE Framework ............................................................... 210 8.3. Limitations .......................................................................................................... 211 8.4. Suggestions for Future Research ....................................................................... 213 8.5. Conclusion ......................................................................................................... 215
References ................................................................................................................. 217
Appendices ................................................................................................................ 236 Appendix A. The Common Vision .......................................................................... 237 Appendix B. Community Capital Tool Basic Stocks and Requirements ................. 242 Appendix C. Interview Guiding Questions .............................................................. 245 Appendix D. Stakeholder Visions Characteristics .................................................. 247 Appendix E. Balance Sheet Detailed Methodology ................................................ 249 Appendix F. Balance Sheet Data Sheets .............................................................. 251
xii
List of Tables
Table 1. Characteristics of an Integrated Sustainability Entrepreneurship Model. .......... 34
Table 2. Characteristics of Sustainability Entrepreneur Sample..................................... 54
Table 3. Priorities and Goals Encompassed in the Pre-existing Visions. ....................... 68
Table 4. Pre-existing Visions and their Comprehensiveness. ........................................ 70
Table 5. Community Validation of the Common Vision .................................................. 88
Table 6. Requirements and Indicators for Citizenship. ................................................... 96
Table 7. Requirements and Indicators for Safety. .......................................................... 98
Table 8. Requirements and Indicators for Cultural Heritage. ....................................... 101
Table 9. Requirements and Indicators for Identity and Diversity. ................................. 102
Table 10. Requirements and Indicators for Education. ................................................ 105
Table 11. Requirements and Indicators for Health and Well-being. ............................. 108
Table 12. Requirements and Indicators for Labour. ..................................................... 110
Table 13. Requirements and Indicators for Economic Structure. ................................. 113
Table 14. Requirements and Indicators for Financial Resources. ................................ 115
Table 15. Requirements and Indicators for Transportation. ......................................... 117
Table 16. Requirements and Indicators for Land. ........................................................ 119
Table 17. Requirements and Indicators for Housing and Living Conditions. ................ 120
Table 18. Requirements and Indicators for Infrastructure. ........................................... 122
Table 19. Requirements and Indicators for Surface Water. ......................................... 125
xiii
Table 20. Requirements and Indicators for Ground Water. .......................................... 127
Table 21. Requirements and Indicators for Air. ............................................................ 129
Table 22. Requirements and Indicators for Soil. .......................................................... 130
Table 23. Requirements and Indicators for Minerals and Non-renewable Resources. ......................................................................................................... 132
Table 24. Requirements and Indicators for Landscape. ............................................... 134
Table 25. Stakeholders in an Integrated Model of SE. ................................................. 163
Table 26. Barriers Facing Sustainability Entrepreneurs. .............................................. 181
Table 27. Core Activities of LifeCity. ............................................................................ 185
Table 28. Actors Supported by LifeCity. ...................................................................... 189
xiv
List of Figures
Figure 1. New Orleans Model Conceptual Framework. ................................................. 10
Figure 2. The Community Capital Framework. .............................................................. 14
Figure 3. The Telos Triangle. ........................................................................................ 15
Figure 4. Characteristics of Sustainability Entrepreneurship. ......................................... 20
Figure 5. The Corporate Value Chain. ........................................................................... 28
Figure 6. Incorporating Community Review into the Long Term Requirements. ............ 86
Figure 7. The Representation of Visions in the Common Vision. ................................... 87
Figure 8. The Representation of Community Capital in the Common Vision. ................. 88
Figure 9. The Balance Sheet Norms. ............................................................................ 92
Figure 10. The Greater New Orleans Community Capital Balance. ............................... 94
Figure 11. Social Capital Scores. .................................................................................. 95
Figure 12. Citizenship Scores. ....................................................................................... 97
Figure 13. Safety Scores. .............................................................................................. 99
Figure 14. Cultural Capital Scores. .............................................................................. 100
Figure 15. Cultural Heritage Scores. ........................................................................... 101
Figure 16. Identity and Diversity Scores. ..................................................................... 103
Figure 17. Human Capital Scores. ............................................................................... 104
Figure 18. Education Scores. ...................................................................................... 106
Figure 19. Health and Well-being Scores. ................................................................... 108
xv
Figure 20. Economic Capital Scores. .......................................................................... 110
Figure 21. Labour Scores. ........................................................................................... 111
Figure 22. Economic Structure Scores. ....................................................................... 113
Figure 23. Financial Resources Scores. ...................................................................... 115
Figure 24. Physical Capital Scores. ............................................................................. 117
Figure 25. Transportation Scores. ............................................................................... 118
Figure 26: Land Scores. .............................................................................................. 119
Figure 27. Housing and Living Conditions Scores. ...................................................... 121
Figure 28. Infrastructure Scores. ................................................................................. 123
Figure 29. Natural Capital Scores. ............................................................................... 125
Figure 30. Surface Water Scores. ............................................................................... 126
Figure 31. Ground Water Scores. ................................................................................ 127
Figure 32. Air Scores. .................................................................................................. 129
Figure 33. Soil Scores. ................................................................................................ 131
Figure 34. Minerals and Non-renewable Resources Scores. ....................................... 133
Figure 35. Landscape Scores. ..................................................................................... 135
Figure 36. Intended Economic Capital Impacts. ......................................................... 146
Figure 37. Intended Natural Capital Impacts. .............................................................. 149
Figure 38. Intended Human Capital Impacts. .............................................................. 152
Figure 39. Intended Social Capital Impacts. ................................................................ 154
Figure 40. Overall Intended Impacts. ........................................................................... 161
xvi
Figure 41. Overall Perceived Impacts. ......................................................................... 167
Figure 42. LifeCity’s Forms of Community Impact. ...................................................... 189
xvii
List of Acronyms
SCD Sustainable Community Development
SE Sustainability Entrepreneurship
CCT Community Capital Tool
GNO Greater New Orleans
1
1. Sustainable Communities and Regional Development in Greater New Orleans
In regions on the social, economic, and political margins of the world, the
struggle to empower communities has coincided with the necessity for less
environmentally destructive means of doing so. Movements among citizens on the
periphery of national and international hierarchies have sought to provide their
communities with greater control over how to achieve locally appropriate and self-
determined forms of development. At the same time, concern has increased for the
health of ecological systems on which these communities depend, and has been a long-
standing priority among many indigenous and natural resource dependent communities.
These colliding forces have sparked efforts around the world to plan and implement
visions for local sustainable development.
In all regions, the focus for sustainable planning and policies has increasingly
shifted to the community level. Though extensive efforts have been made to create
sustainable development strategies on national and international scales, sustainability is
often most effectively implemented at the local level. These scales are well suited to the
direct contact and jurisdiction that local governments maintain over key decisions
affecting consumption of resources like water and energy, land use and zoning, the built
environment, investment, and employment (Hendrickson, Lindberg, Connelly, &
Roseland, 2011). In addition, local authorities are often the most accountable decision-
makers in community-level development and planning (Roseland, 2000). In communities
with low institutional capacity, a mixture of non-profit and private sector actors often fills
the void in governance and services. Other sustainable development imperatives are
best approached at the regional level, such as the reversal of suburban sprawl, and
necessitate collaboration between communities to cooperate in regional planning and
policy-making (Tomalty, 2002). However, there are also many factors which limit the
local level’s effectiveness, such as the short-term policy cycle and incentives for self-
2
interested decision-making, the excessive influence of powerful actors, and disparities in
capacity and sovereignty within, across and between communities (Roseland, 2012).
However, despite these shortcomings, progress toward sustainable development
can be achieved in many aspects much more effectively at local scales. Realising these
strengths, the quest for sustainable communities has ensued in many local contexts,
from the largest megacities to the smallest rural settlements, from European
metropolises to remote Andean villages.
In all of these settings, there must be a framework to plan and implement a
process of sustainable community development. This process is best conceived of as a
decision-making approach that considers multiple priorities of community well-being and
seeks to enhance all of them through balanced policymaking. Though a multitude of
approaches exist to measure and enhance the goals of community sustainability, one of
the most versatile tools available is the consideration of community capital (Roseland,
2012). Expanding on the economic concept of capital, the idea of community capital
concerns itself with the broad array of valuable community resources and processes that
sustainable development is intended to maximize. Community capital, described in
Roseland (2012), encompasses all natural, economic, social, physical, human, and
cultural spheres of community life. These capitals can describe any community but take
on specific characteristics and priorities in each context. The ideal form of development
is one in which social, cultural, economic, physical, and human capitals are increased
across a community without depleting natural capital on which it depends (Roseland,
2012; Dagevos & Evers, 2008). In addition, the growth of community capital should be
balanced, without great discrepancies between one form of capital and another
(Dagevos & Evers, 2008). In this vision, sustainable community development (SCD) is a
policy and planning strategy that must ultimately enhance and balance all forms of
community capital, while also working toward more equitable community relations and
increasing the responsiveness of development toward local values and priorities
(Roseland, 2012; Reed, Fraser, & Dougill, 2006; Hermans, Haarmann, & Dagevos,
2011; Martinez-Alier, 2004; Morgan, 2009).
3
1.1. The Need for Sustainability in Marginalized Communities
In communities most vulnerable to social, ecological, political, and economic
changes, there is an especially high need for improved decision-making for sustainable
community development. These communities often experience a vicious circle of
poverty, dysfunctional governance, and societal ills. The legacies of post-colonial
experiences and economic dependency that many communities face are especially
strong in marginalized communities, which often have even less self-determination than
other communities over the decisions most important for community development. In
addition, the need to fulfil immediate needs often limits the ability to focus on long-term
goals. Another deterrent to community sustainability is the context of deep cultural and
historical grievances, both between members of these communities and with external
agents, which often prevents cooperation and reconciliation. Finally, vulnerability to
natural and socio-political disasters such as floods, conflict, and economic downturns
implies a high risk of community disruption.
Nonetheless, a wide array of initiatives has appeared in marginalized
communities that aim to follow local priorities for community sustainability (Campbell &
Vainio-Mattila, 2003; Meyer & Konisky, 2007). Ranging from eco-tourism to green
business incubation, from deconstruction to community-based conservation, these
projects have sought to reconcile the need to address socio-economic needs with
ecological concerns of local or global significance. These projects are often also
accompanied by local policy and planning frameworks to support the goals of SCD.
All communities, especially those in marginalized regions, must strive to pursue
policies and projects that enhance all forms of their community capital in an equitable
manner. However, local actors, observers, and researchers debate whether sustainable
community development is best entrusted in the hands of local organizations,
governments, or the private sector (Martinez-Alier, 1992; Lizano, 2006; Roseland, 2012).
Much debate surrounds the question of market-driven tools for sustainability and their
ability to further SCD (Hendrickson et al., 2011). Proponents of market-driven
sustainability initiatives argue that they are more efficient and effective than state or non-
profit projects, while others critique their perpetuation of the growth paradigm, their
4
failure to address the market failures that cause many local development challenges,
and their disconnectedness with the needs and values of communities (O’Neill,
Hershauer, & Jay, 2006; Lizano, 2006; Hickey & Mohan, 2005).
1.2. Entrepreneurship for Sustainable Development
An attempt to reconcile these concerns has appeared in an emerging framework
on the concept of sustainability entrepreneurship (SE). Originating in the social
entrepreneurship model, in which business and non-profit leaders become agents of
meeting societal needs, the framework on SE appeared in the 2000s to reconcile the
goals of sustainable development with entrepreneurship in a broader vision of social and
ecological responsibility (Austin, Stevenson, & Wei-Skillern, 2006; Dyllick & Hockerts,
2002; Tilley & Young, 2009; Allen & Malin, 2008). This framework envisions that
innovative organizations can advance local and global sustainability goals through a
range of for- and non-profit initiatives (Tilley & Young, 2009). Foundational publications
in the SE framework have described this process in several ways. Dyllick & Hockerts
(2002) have emphasized how sustainability entrepreneurship is more than simply a
business case for sustainable practices, but rather an integration of multiple
sustainability goals within the actions of entrepreneurs. Similarly, Tilley & Young (2009)
assert that sustainability entrepreneurs must integrate social, economic, and
environmental concerns while displaying a handful of characteristics such as
intergenerational equity and eco-efficiency. O’Neill et al. (2006) describe the need for
these entrepreneurs to remain sensitive to the cultural identities of their communities and
build on existing values and needs. The SE framework asserts that sustainability
entrepreneurs are not only businesspeople, but also community organizers, scientists, or
any innovative practitioner of sustainability that positively impacts communities. The SE
framework can be broadened by considerations of overlap between business and
community interests, described in the concept of shared value of Porter & Kramer
(2011), the analysis of community impacts across the corporate value chain, and by
considering strategic investment in sustainability through meaningful practices of
corporate social responsibility (Fearne, Martinez, & Dent, 2012; Porter & Kramer, 2006).
A wave of SE has spread across parts of the world, appearing in regions of Europe and
North America in recent years and the motivations and practices of these
5
entrepreneurs have been studied in locations such as Utah (Allen & Malin, 2008; Daddi,
Testa, & Iraldo, 2010; Blankenship, Kulhavy, & Lagneryd, 2007). The rise of SE can
advance sustainable development in many ways, such as reducing the ecological
footprint of businesses, providing new work and training opportunities, strengthening
cultural identity, and enhancing learning and education. On a local scale, SE can fit into
a larger vision for a sustainable community.
Though presumably all communities could enjoy the benefits of SE, these
initiatives are currently limited to a few regions (Allen & Malin, 2008; Daddi et al., 2010;
Blankenship et al., 2007). SE has spread very unevenly, endowing some regions with
extensive entrepreneurial activity but failing to take hold in other areas. These regions
tend to overlap with communities facing multiple challenges such as natural resource
dependency, socio-economic marginality, and vulnerability to natural and social
disasters (Jones, 2008). Sustainability advocates and entrepreneurs in these regions
must respond to concerns such as local ownership, cultural appropriateness, equity, and
capacity building (Hickey & Mohan, 2005; Morgan, 2009; O’Neill et al., 2006).
Despite these challenges, many marginalized communities have begun to foster
SE through a range of initiatives. Such projects have focused on tools such as green
jobs training, alternative lending, and business incubation in marginalized areas of cities
such as Baltimore, MD, New York, NY, and Vancouver, BC, working in fields such as
deconstruction, green roof installation, and brown-field remediation (Jones, 2008). In
these contexts, SE can presumably help improve well-being in these communities, but
there remains a poor understanding of their role in a comprehensive vision of SCD.
Specifically, there is a lack of understanding of the impacts of the SE movement,
including businesses, municipal initiatives, and non-profit organizations, on long-term
goals that are required to enhance community capital in these areas. Local decision-
makers must first articulate the vision of a sustainable community and the goals for
achieving it, and then must understand how sustainability entrepreneurship can play a
role in that process.
6
1.3. Sustainability Entrepreneurship in New Orleans
This knowledge is needed in Greater New Orleans, LA, where a wave of
initiatives has begun to collaborate in a sustainability entrepreneurship network in the
past several years. Consisting mostly of small private, non-profit, and social enterprise
organizations, these sustainability entrepreneurs are a nascent but growing movement
of professionals and community leaders. There are currently over 90 certified green
businesses in the city, as well as dozens of non-profit organizations working on projects
ranging from wetlands restoration to restaurant composting, accompanied by an official
commitment of the City of New Orleans to greenhouse gas reductions as a member of
ICLEI - Local Governments for Sustainability (LifeCity, 2013; City of New Orleans, 2009).
This spectrum of initiatives has spread across the greater New Orleans region,
connecting entrepreneurs from non-profit, governmental, and business backgrounds.
This wave of SE has great potential to enhance SCD across the greater New Orleans
community, but no research has yet been conducted to determine their potential impacts
or how their goals fit into a comprehensive vision for sustainable development in the
region.
The Greater New Orleans region consists of approximately 1.2 million people
living in Southeast Louisiana. The region includes Orleans, Jefferson, St. Tammany, St.
Bernard, Plaquemines, St. John the Baptist, and St. Charles parishes. The centre of this
region is New Orleans, which is one of the oldest urban areas in North America and is
renowned for its rich cultural heritage in French, African American, and Creole roots, as
well as architectural, musical and culinary uniqueness. At the same time, it has
continually high poverty and social inequality with some of the greatest income gaps in
the United States (Plyer & Ortiz, 2011). Nevertheless, many communities have rates of
membership in community organizations and extensive networks of interdependence
and trust (Chamlee-Wright & Storr, 2009; Plyer & Ortiz, 2011). The regional economy is
based historically in oil and gas, tourism, and shipping, but new sectors such as film and
renewable energy are beginning to grow (Plyer & Ortiz, 2011). One of New Orleans’
greatest challenges is public education, with some of the lowest-performing schools of
any American city, and an adult population with low education levels, uncommonly high
dropout rates and youth incarceration, and chronic lack of access to training and
7
employment (Plyer & Ortiz, 2012). The region’s ecological context implies both great
assets and risks; the coastal wetland ecosystem, despite providing an estimated $200
billion per year in ecosystem services ranging from flood protection to seafood habitat,
have been continually mismanaged and degraded (Costanza, Mitsch, & Day, 2006). The
loss of over 1,800 square miles of coastal wetlands since the 1930s removed New
Orleans’ natural buffer from the storm surges of Hurricane Katrina, whose landfall in
August 2005 and subsequent levee failures submerged over 75% of the region, took
1,464 documented lives, and caused the greatest economic damage of any natural
disaster in U.S. history (National Oceanographic & Atmospheric Administration, 2007).
This catastrophe began a new phase in the history of New Orleans. In the
aftermath, this region’s many social and ecological vulnerabilities were exposed to the
world like never before. However, the post-Katrina period has also provided an
opportunity to consider different alternatives for the restructuring of the region’s
damaged physical, ecological, and social systems. This renewal effort was stymied by
two successive disasters: the international economic recession beginning in 2008 and
the 2010 British Petroleum oil spill. In the wake of these disasters, a deep conflict of
visions has emerged surrounding the region’s development that residents, policymakers,
and academics continue to debate. The recent wave of social and environmental
entrepreneurship in the region has sparked interest in an environmentally sound vision
for the region’s development, but its role in the ongoing economic and social renewal of
the post-Katrina era is unclear.
1.4. Purpose of Study
This study intends to identify a sustainable vision for the development of the
Greater New Orleans region and the role of sustainability entrepreneurship in attaining
that vision. Its objectives are to articulate the long-term goals that comprise a
sustainable development vision for the region, measure progress towards them, and
identify how sustainability entrepreneurship (SE) is beginning to contribute to this
process. SE will be defined as a network of actors working in an array of innovative
private, non-profit, public sector, and hybrid initiatives committed to a mission of creating
shared value in their communities across ecological, economic, and social criteria and
8
throughout multiple aspects of their operations in a strategic approach to achieving local
sustainable development goals while remaining sensitive to socio-economic conditions
in their communities and forming partnerships with supporting agencies for maximized
community impact. The geographic focus of the study is the seven-parish metropolitan
area, although many goals and issues focus specifically on the city of New Orleans. The
research question is “to what extent has the Greater New Orleans region made progress
towards a comprehensive vision for sustainable development, and what is the role of
sustainability entrepreneurship in achieving this vision?”
1.4.1. Process Objective
A chief priority of this project is to make a practical contribution to the ongoing
process of planning, implementing, and measuring sustainability in Greater New
Orleans. This overarching goal, which guides the design of the project, collection of data,
and delivery of results to local stakeholders and decision-makers, will take shape
throughout the other objectives of the project. To that end, I strive to incorporate
community perspectives and build stakeholder collaboration into the project. This
process objective is to be interwoven into all of the outcome objectives of the study.
1.4.2. Outcome Objectives
While aspiring to achieve local relevance and engagement in process, this study
also has a handful of outcomes that it aims to realize. The study’s chief outcome
objective is to assess the progress of New Orleans towards achieving sustainable
development. However, in order to evaluate this progress, it is necessary to define
clearly what the end goal of community sustainable development is through a shared
regional vision. Thus, the first task of the study is to identify a comprehensive vision for
sustainable regional development that emerges from community perspectives and
contemporary planning and policy work in the region. After defining this vision, I intend to
propose a framework for monitoring progress towards this vision using an indicator-
based tool. This approach, guided by the methods of the Community Capital Framework,
proposes a number of long-term goals and identifies indicators and normative
benchmarks that can be monitored as they are achieved.
9
In addition, the study aspires to evaluate the SE movement in New Orleans. This
evaluation identifies the variety of entrepreneurs working towards long-term
sustainability goals, as well as the scope of SCD priorities that these entrepreneurs
consider in their efforts. In addition, this assessment will show the entrepreneurs' self-
perceived impacts on the New Orleans region through various forms of community
capital, as well as how they perceive the impacts of the movement of SE overall. Finally,
I intend to determine the impact that the enterprise LifeCity, which supports green
business in New Orleans, is perceived to have on the SE movement and the region.
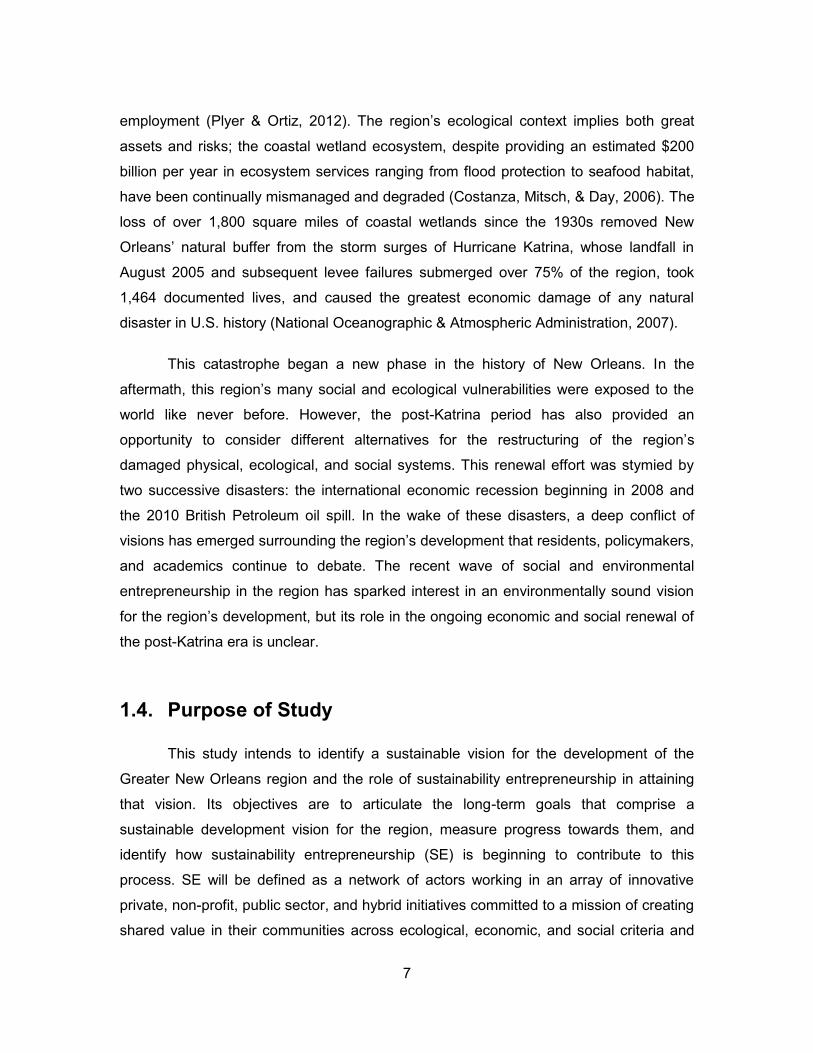
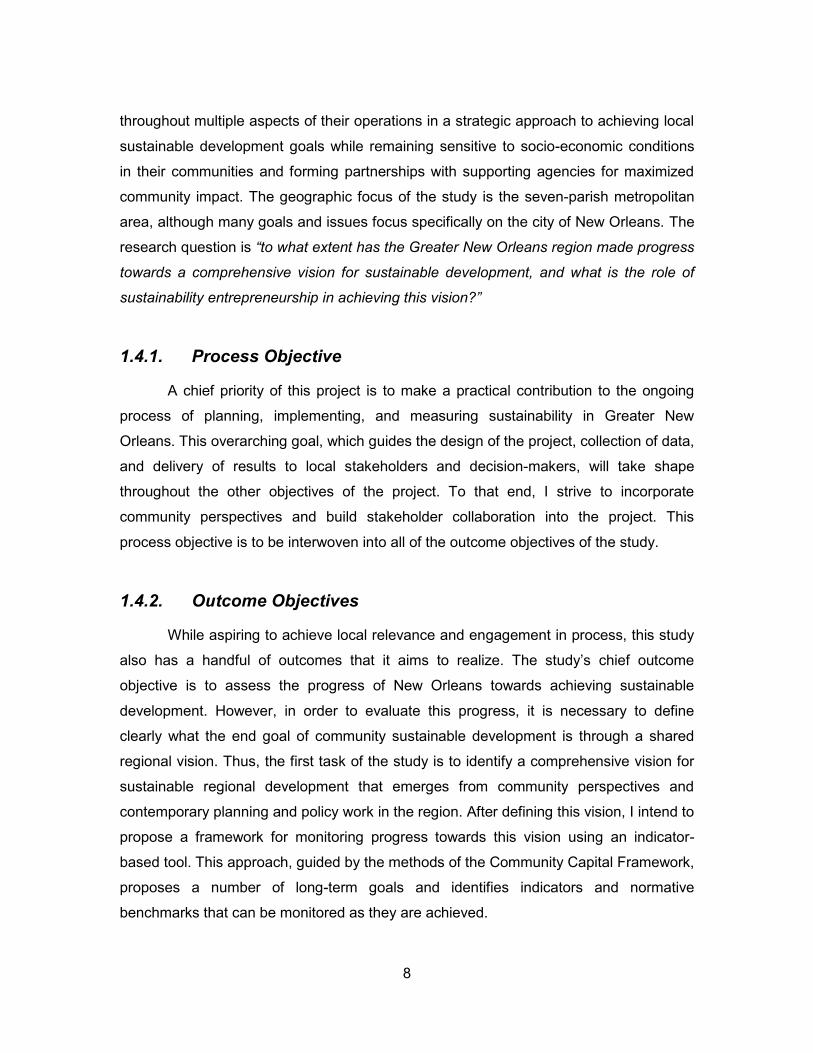
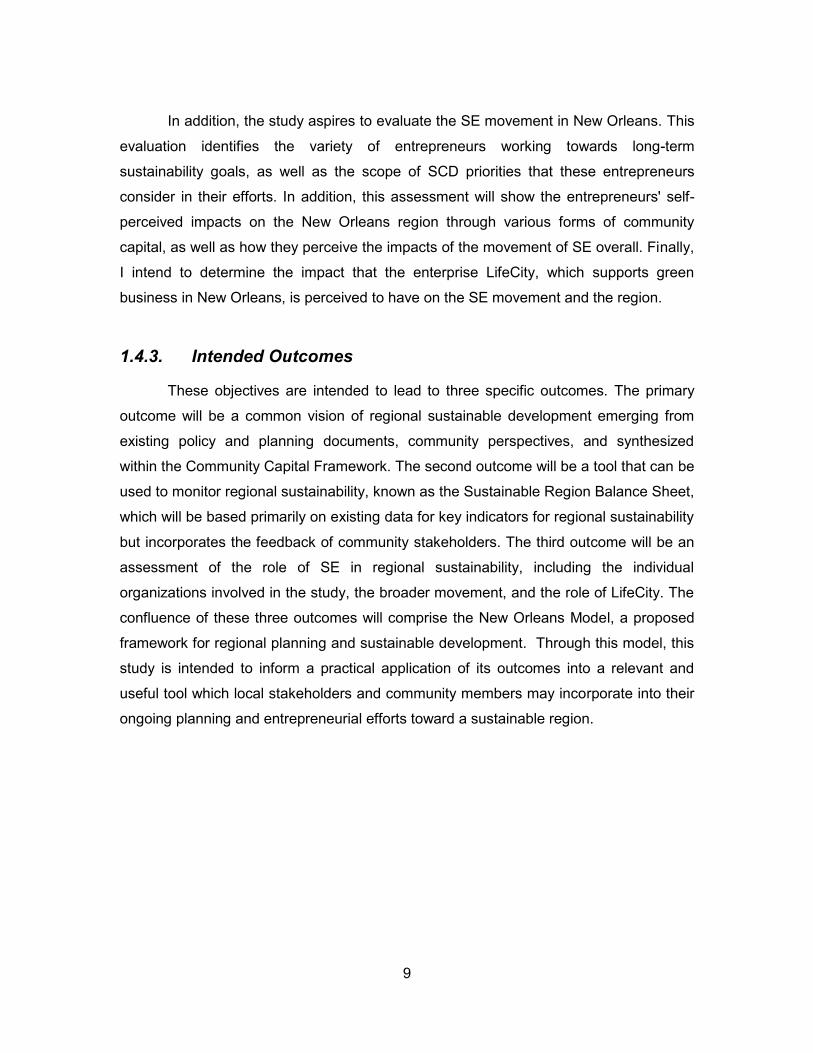
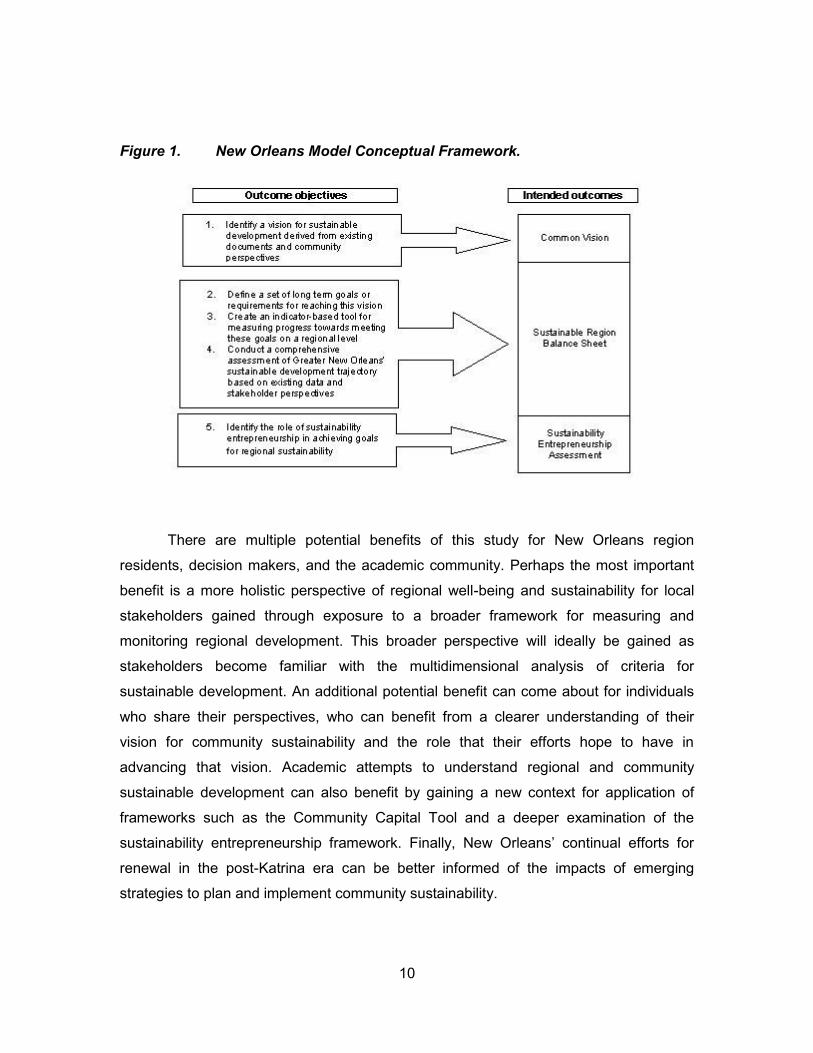
1.4.3. Intended Outcomes
These objectives are intended to lead to three specific outcomes. The primary
outcome will be a common vision of regional sustainable development emerging from
existing policy and planning documents, community perspectives, and synthesized
within the Community Capital Framework. The second outcome will be a tool that can be
used to monitor regional sustainability, known as the Sustainable Region Balance Sheet,
which will be based primarily on existing data for key indicators for regional sustainability
but incorporates the feedback of community stakeholders. The third outcome will be an
assessment of the role of SE in regional sustainability, including the individual
organizations involved in the study, the broader movement, and the role of LifeCity. The
confluence of these three outcomes will comprise the New Orleans Model, a proposed
framework for regional planning and sustainable development. Through this model, this
study is intended to inform a practical application of its outcomes into a relevant and
useful tool which local stakeholders and community members may incorporate into their
ongoing planning and entrepreneurial efforts toward a sustainable region.
10
Figure 1. New Orleans Model Conceptual Framework.
There are multiple potential benefits of this study for New Orleans region
residents, decision makers, and the academic community. Perhaps the most important
benefit is a more holistic perspective of regional well-being and sustainability for local
stakeholders gained through exposure to a broader framework for measuring and
monitoring regional development. This broader perspective will ideally be gained as
stakeholders become familiar with the multidimensional analysis of criteria for
sustainable development. An additional potential benefit can come about for individuals
who share their perspectives, who can benefit from a clearer understanding of their
vision for community sustainability and the role that their efforts hope to have in
advancing that vision. Academic attempts to understand regional and community
sustainable development can also benefit by gaining a new context for application of
frameworks such as the Community Capital Tool and a deeper examination of the
sustainability entrepreneurship framework. Finally, New Orleans’ continual efforts for
renewal in the post-Katrina era can be better informed of the impacts of emerging
strategies to plan and implement community sustainability.
11
2. Literature Review
This study stands on the foundation of several frameworks that inform the
analysis of sustainable development in New Orleans. Before determining a common
vision for regional development and the impact of SE on it, these frameworks should be
explored. This section reviews this literature, including frameworks on sustainable
community development, sustainability entrepreneurship, indicator frameworks for
regional development, and the contemporary context of New Orleans.
2.1. Sustainable Community Development
The first framework that contributes to this study is that of Sustainable
Community Development (SCD). SCD is a paradigm for sustainable development
concerned with global problems but focused on local solutions (Roseland, 2012). The
paradigm borrows from literature on ecological economics, international development,
natural and social sciences, and planning theory, offering an approach to achieving
global sustainability through local initiatives at the community level (Roseland, 2012).
Roseland’s Towards Sustainable Communities (2012) outlines the foundation of the
SCD framework. SCD asserts that global threats to environmental sustainability are
often most effectively resolved by local strategies, and the best way to attain global
sustainability is to implement and monitor small-scale initiatives administered by
governmental, private, and non-profit actors (Roseland, 2012).
Within this vision, SCD offers a precise definition of sustainability and
investigates the impact of various initiatives on this process. The framework intends to
move beyond the vague concepts of sustainable development in United Nations
mandates and local policy documents, and envisions sustainability that benefits
communities across multiple criteria of human and ecological well-being (Roseland,
2012). SCD criticizes the weak sustainability perspective that many policies and projects
12
pursue, in which the declining health of natural systems is compensated for by the
growth of built capital and innovation (Roseland, 2012). In this way, SCD assumes a
strong sustainability perspective, arguing that societies around the world should maintain
or regenerate life-support services, such as clean water, air, and biodiversity, while
improving social and economic priorities (Hendrickson et al., 2011). These natural
support systems have no substitutes because they are essential to human survival
(Hendrickson et al., 2011). However, it is the definition of sustainable development itself
which gives the SCD framework its true character.
2.1.1. Community Capital
This definition of sustainable development, and the centrepiece of the SCD
framework, is the concept of community capital. Community capital is an amalgamation
of natural and human systems and processes that produce valuable resources for
communities (Lowry, 2012). In the vision of SCD, communities are able to reach
sustainability by maximizing six forms of community capital, including social, economic,
natural, cultural, physical, and human capital (Roseland, 2012). These forms of
community capital are informed by social science literature, economics, natural science
and ecological economics (Dagevos & Evers, 2008). The community capital model was
designed in part to synthesise these frameworks into an integrated definition, and in part
to expand on the definition of sustainability. The community capital framework refines
more commonly used definitions of sustainable development with a more specific and
conceptualized approach that allows for the precise definition of the criteria of
sustainability and how to measure them (Roseland, 2012). These forms of capital are
both the foundation for this definition of sustainable development and the criteria from
which assessments of sustainability can be conducted.
Each form of community capital has a specific definition that outlines its
characteristics and guides its application in context. They are divided into more specific
units called stocks, which derive from concepts of stock from both economics and
natural science and constitute the extent to which each form of capital is in healthy
condition (Dagevos & Evers, 2008; Lowry, 2012). Natural capital is defined by the
website of the Community Capital Scan (CC Scan) as “any stock of natural assets that
yields a flow of valuable goods and services into the future” (2013, para. 1). These
13
stocks include landscape, soil, ground and surface water, air, and minerals and non-
renewable resources (CC Scan, 2013; Wackernagel & Rees, 1996; Jansson, Hammer,
Folke, & Costanza, 1994; Goodland, 2002). Physical capital is defined as “the
infrastructure that helps people obtain their basic needs” (CC Scan, 2013, para. 2;
National Round Table on the Environment and the Economy, 2003; Rainey, Robinson,
Allen, & Christy, 2003), and is comprised of infrastructure, land, transportation, housing
and living conditions, and public facilities (CC Scan, 2013). Economic capital, or “the
ways in which we allocate resources and make decisions about our material lives”
includes labour, financial resources, and economic structure (CC Scan, 2013, para. 3;
Goodland, 2002; Nozick, 1992). Social capital is “community cohesion, connectedness,
reciprocity, tolerance, compassion, patience, forbearance, fellowship, love, commonly
accepted standards of honesty, discipline and ethics, and commonly shared rules, laws,
and information” (CC Scan, 2013, para. 5; Coleman, 1988; Putnam, Leonardi, & Nanetti,
1993; Hancock, 2001). Social capital consists of citizenship, or the extent to which
citizens are engaged in public life and create an inclusive, equitable community, and the
level of public safety. Human capital is defined as the “knowledge, skills, competencies
and other attributes embodied in individuals that facilitate the creation of personal, social
and economic well-being”, and consists of education, health, and well-being (CC Scan,
2013, para. 4; Organization for European Cooperation & Development, 2001; Ostrom,
1993). Cultural capital is defined as “the product of shared experience through traditions,
customs, values, heritage, identity, and history”, which consists of stocks of cultural
heritage and identity and diversity (CC Scan, 2013, para. 6).
14
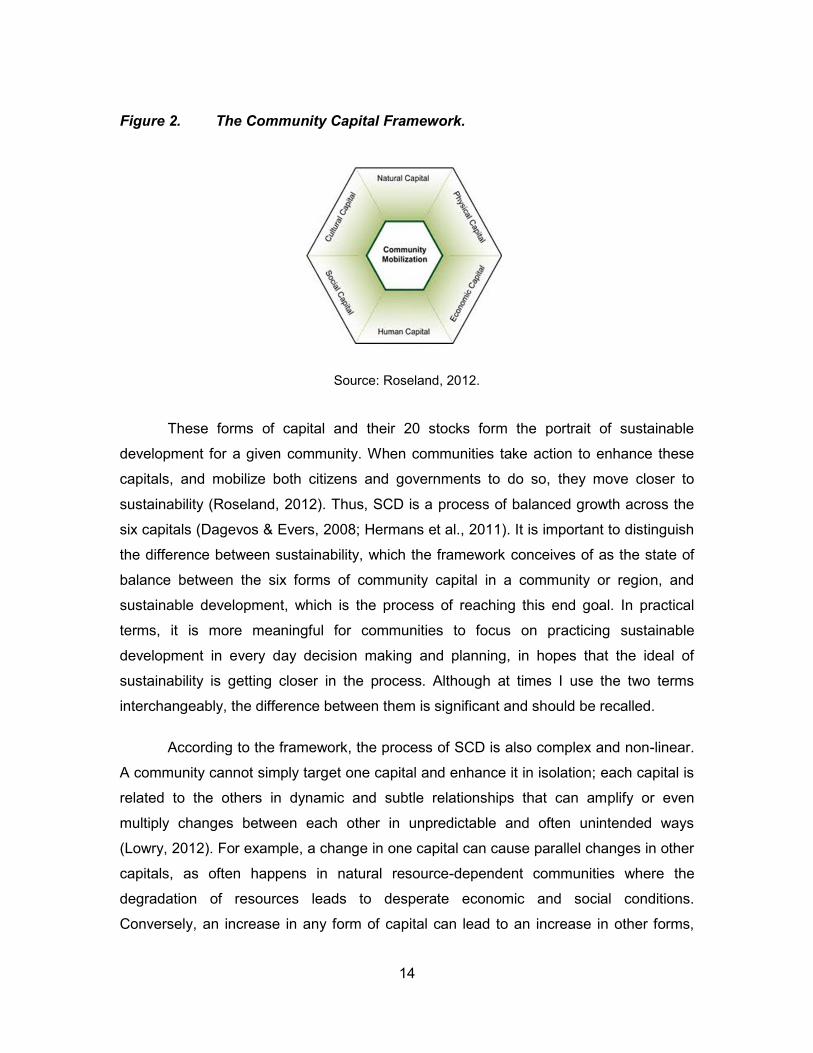
Figure 2. The Community Capital Framework.
Source: Roseland, 2012.
These forms of capital and their 20 stocks form the portrait of sustainable
development for a given community. When communities take action to enhance these
capitals, and mobilize both citizens and governments to do so, they move closer to
sustainability (Roseland, 2012). Thus, SCD is a process of balanced growth across the
six capitals (Dagevos & Evers, 2008; Hermans et al., 2011). It is important to distinguish
the difference between sustainability, which the framework conceives of as the state of
balance between the six forms of community capital in a community or region, and
sustainable development, which is the process of reaching this end goal. In practical
terms, it is more meaningful for communities to focus on practicing sustainable
development in every day decision making and planning, in hopes that the ideal of
sustainability is getting closer in the process. Although at times I use the two terms
interchangeably, the difference between them is significant and should be recalled.
According to the framework, the process of SCD is also complex and non-linear.
A community cannot simply target one capital and enhance it in isolation; each capital is
related to the others in dynamic and subtle relationships that can amplify or even
multiply changes between each other in unpredictable and often unintended ways
(Lowry, 2012). For example, a change in one capital can cause parallel changes in other
capitals, as often happens in natural resource-dependent communities where the
degradation of resources leads to desperate economic and social conditions.
Conversely, an increase in any form of capital can lead to an increase in other forms,
15
such as in Aboriginal communities that have experienced improvements in psychological
and social well-being due to the preservation of their cultures (Lowry, 2012; Chandler &
Lalonde, 2009). These synergistic relationships imply that communities are behoved to
take a balanced approach in planning and policy-making, emphasising each capital
equally over the long-term.
2.1.2. Community Capital Tool
Despite its theoretical origins, the SCD framework has a highly practical
emphasis. The framework ultimately intends to be applied in practice in community
planning and policy-making to empower local stakeholders to understand and improve
local sustainability (Dagevos, 2011). To that end, the concept has been transformed into
a practical instrument called the Community Capital Tool. The Community Capital Tool
(CCT) is a decision analysis and support method that enables local stakeholders to
monitor progress towards community sustainable development and determine the
impact of policies or projects on that process (CC Scan, 2013). The CCT is an ongoing
collaboration between Simon Fraser University (Canada) and Tilburg University
(Netherlands), which originated in the latter with an instrument called the Telos Triangle
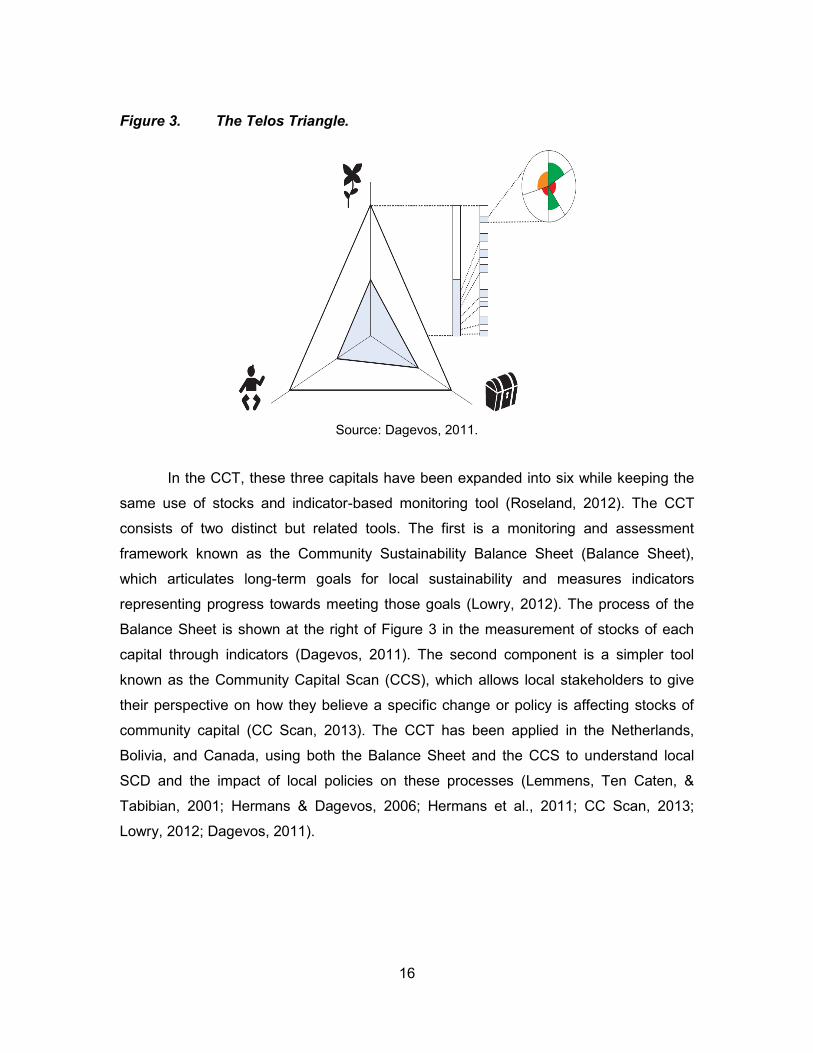
(CC Scan, 2013). This model, developed by the Telos Centre for Sustainable
Development, uses three capitals (socio-cultural, ecological, and economic), to measure
sustainability (Dagevos, 2011).
16
Figure 3. The Telos Triangle.
Source: Dagevos, 2011.
In the CCT, these three capitals have been expanded into six while keeping the
same use of stocks and indicator-based monitoring tool (Roseland, 2012). The CCT
consists of two distinct but related tools. The first is a monitoring and assessment
framework known as the Community Sustainability Balance Sheet (Balance Sheet),
which articulates long-term goals for local sustainability and measures indicators
representing progress towards meeting those goals (Lowry, 2012). The process of the
Balance Sheet is shown at the right of Figure 3 in the measurement of stocks of each
capital through indicators (Dagevos, 2011). The second component is a simpler tool
known as the Community Capital Scan (CCS), which allows local stakeholders to give
their perspective on how they believe a specific change or policy is affecting stocks of
community capital (CC Scan, 2013). The CCT has been applied in the Netherlands,
Bolivia, and Canada, using both the Balance Sheet and the CCS to understand local
SCD and the impact of local policies on these processes (Lemmens, Ten Caten, &
Tabibian, 2001; Hermans & Dagevos, 2006; Hermans et al., 2011; CC Scan, 2013;
Lowry, 2012; Dagevos, 2011).
17
2.1.3. Market Approaches to Sustainability
The SCD framework has paid considerable attention to market-based
approaches to enhancing sustainable development. The question of whether market-
based tools can advance community capital, as with SE in New Orleans, has been
answered in several ways by the SCD literature. Several studies have enumerated the
ways that market-based mechanisms can enhance the process of SCD. The Community
Economic Development (CED) literature is dedicated to these approaches and offers
examples such as small business counselling, “buy local” programs, worker co-
operatives, and local land trusts (Lamb, 2011). Market-based tools can increase
transparency, deliver benefits to environmental, social and economic spheres, and
achieve economic prosperity while challenging the conventional growth paradigm
(Hendrickson et al., 2011). Market-based sustainability efforts also may reject the
neoliberal aversion to regulation, allowing for strategic intervention such as carbon taxes
(Hendrickson et al., 2011).
However, there are many critiques of market-based sustainability tools. The
foremost is that standard market mechanisms are not capable of preserving natural
capital without regulation or curbing harmful externalities such as greenhouse gas
emissions, which businesses try to externalize while avoiding regulation at all costs
(Pearce & Barbier, 2000; Stavins, 2001). Another critique levied against market tools is
the inherent bias against community welfare that both markets and conventional state
responses to market failures display (Hendrickson et al., 2011). For example, the
economic downturn beginning in 2008 led to multi-billion dollar corporate bailouts in the
U.S., while entire communities were overlooked and allowed to spiral into recession
(Leonard, 2008; Gray, 2009). Many market tools and their advocates continue to
espouse the conventional growth paradigm and the assumptions underlying it, leading to
many environmental initiatives which are nothing but examples of business as usual in
the same unsustainable model with a green outer layer. The debate continues over the
ability of market-based actors and initiatives to advance sustainable development in
community and regional contexts. However, there is one kind of market actor that has
18
shown a promising ability to create meaningful value for multiple forms of community
capital: sustainability entrepreneurs.
2.2. Sustainability Entrepreneurship
This section moves from the general framework of assessing SCD to the
phenomenon of sustainability entrepreneurship. Sustainability Entrepreneurship (SE) is
a concept that has emerged from an array of research on environmentally focused
actors operating mostly in the private sector to improve multiple priorities of sustainability
in their communities. The following section will discuss these conceptualisations of SE
and offer a broader definition of the phenomenon.
2.2.1. What is Sustainability Entrepreneurship?
The idea of sustainability entrepreneurship is not an immediately intuitive one.
Entrepreneurs, typically associated with the world of profit, competitive advantage, and
the continuity of business interests (Tilley & Young, 2009), making a commitment to
sustainable change—the idea sounds at first paradoxical. Yet that is exactly the idea of
what sustainability entrepreneurs are. According to Hockerts (2003), SE is “the
identification of a sustainability innovation and its implementation either through the
foundation of a start-up or the radical reorientation of an existing organization’s business
model so as to achieve the underlying ecological or social objectives” (p. 50). The
literature on SE has emerged in the 2000s, focusing mostly on the ability of business
leaders to become pioneers of sustainability. Most of the literature in this framework has
focused on entrepreneurship in the sense of business creation and innovation, but some
authors have broadened the concept to include non-profit or public sector actors, as well
as organizations sharing both for-profit and non-profit characteristics (Tilley & Young,
2009; Dyllick & Hockerts, 2002; Schaper, 2002; Allen & Malin, 2008).
The SE literature emphasises the strong role that entrepreneurs will play in the
transition to sustainability. Tilley & Young (2009) claim that entrepreneurs are the key
drivers on the move to a sustainable society, whose leadership in environmentally sound
practices will encourage others to improve their own. Allen & Malin (2008) assert that SE
19
can be a major part of the solution to the world’s pressing environmental and social
problems. Ideally, entrepreneurs will focus on each of the three poles of environmental,
economic, and social sustainability; however, their efforts are only contributing to
sustainability when they prioritize all three poles and ensure that their practices improve
them (Tilley & Young, 2009). In the SE framework, entrepreneurs can contribute to the
realization of long-term goals that comprise the vision for local sustainable development
(Dagevos & Evers, 2008). Tilley & Young (2009) propose 12 characteristics of SE under
the three poles discussed above, ranging from eco-efficiency to social responsibility.
This model proposes that only when entrepreneurs realize all three poles can they fulfill
these characteristics and live out the ideal of SE.
2.2.2. Why Focus on Entrepreneurship for Sustainability?
Sustainability entrepreneurs are commonly conceived of as business leaders;
why, then, would they become champions of a more sustainable world? Given the
critiques of market-based approaches to sustainability, why would we expect
businesses, which externalize costs, seek to avoid regulation, and accept the paradigm
of unending growth, to embrace sustainable change? The literature on SE offers
explanations rooted in the role of entrepreneurship in social change and the motivations
of business leaders with sustainable models.
The first explanation for the ability of entrepreneurs to contribute to sustainable
development focuses on their potential to foster social change. The concept of
entrepreneurship is borrowed from neoclassical economics, focusing on the ability to
create wealth out of high-risk environments (Tilley & Young, 2009). Knight (1921)
highlighted how entrepreneurs distinguish themselves as skilled at managing risk and
uncertainty in order to find new opportunities. Kirzner (1985) defined entrepreneurship
as an inherent alertness to opportunities for profit and innovation. However,
entrepreneurs have also long been called social catalysts and the drivers of innovation
and change (Allen & Malin, 2008). This emphasis on catalyzing change has its origins in
the seminal work of Schumpeter (1954), whose writings solidified the modern idea of the
entrepreneur in the broader concept of what he coined “creative destruction”. In the view
of Schumpeter, social change and progress emerges from a process of economic
innovation wherein the destruction of obsolete technologies and ways of doing things
20
spurs innovative ways to replace them (1954). The architects of this creative destruction
are those who can innovate, turn existing materials into a new product, and fill the social
and economic niches created by the obsolescence of the old: in short, entrepreneurs
(Tilley & Young, 2009). In this framework, entrepreneurs push for discovery in society,
accomplishing a level of social change that is almost revolutionary (Tilley & Young,
2009). In this vision, entrepreneurs are not only an actor, but the lead role in the drama
of social change whose creativity and agility in uncertainty makes them natural leaders
in finding solutions to current environmental and social problems.
The second explanation turns to the motivations of business leaders. This
explanation rejects the belief that entrepreneurs will naturally supply the solutions for a
sustainable society, positing that only the leaders who intentionally work towards this
goal will do so. Allen & Malin (2008) admit that business owners need not be saints in
order to operate green businesses, and their motivations for doing so range from
opportunistic to altruistic (Allen & Malin, 2008). However, many entrepreneurs have a
guiding vision for sustainability, which has guided either their creation of a new business
or the transition of their existing firm. For these actors, “a driving force motivating
entrepreneurial behaviour and activity is the opportunity to apply their personal value
system in the way they work” (Tilley & Young, 2009, p. 85). A new kind of entrepreneur
has recently emerged, who places ecological and social objectives at the core of
corporate ethics, yet still find ways to follow those values in a way that gives them a
competitive market edge (Allen & Malin, 2008).
This duality gives sustainability entrepreneurs a special position between two
seemingly conflicting worlds, allowing them to demonstrate that businesses can become
sustainable while remaining economically viable (Allen & Malin, 2008). However, for
companies to achieve meaningful sustainability, they must change their concept of
corporate responsibility from being a peripheral concern, stemming from the avoidance
of liability or public relations, to a central priority (Porter & Kramer, 2011). The
prioritization of community and ecological concerns into business practice leads to a
handful of distinct attributes that distinguish sustainability entrepreneurs. Tilley & Young
(2009) identify 12 characteristics of SE at the nexus of social, ecological, and economic
priorities, ranging from intergenerational equity to eco-efficiency, as shown in Figure 4.
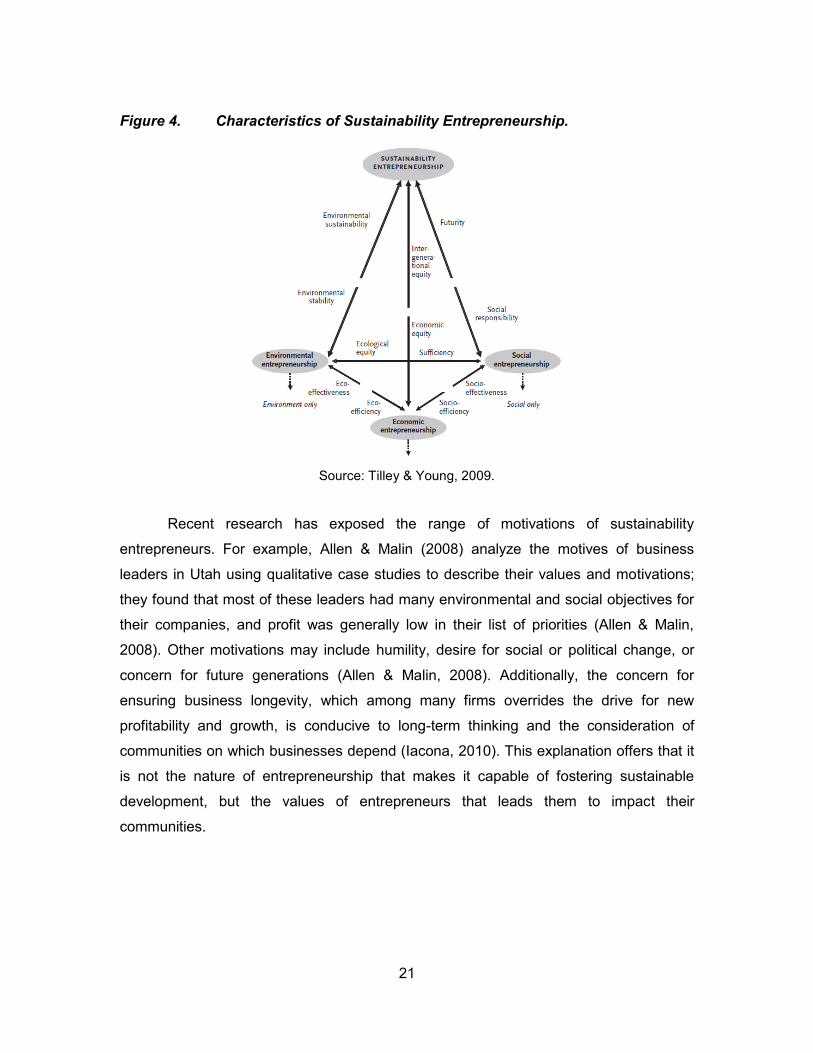
21
Figure 4. Characteristics of Sustainability Entrepreneurship.
Source: Tilley & Young, 2009.
Recent research has exposed the range of motivations of sustainability
entrepreneurs. For example, Allen & Malin (2008) analyze the motives of business
leaders in Utah using qualitative case studies to describe their values and motivations;
they found that most of these leaders had many environmental and social objectives for
their companies, and profit was generally low in their list of priorities (Allen & Malin,
2008). Other motivations may include humility, desire for social or political change, or
concern for future generations (Allen & Malin, 2008). Additionally, the concern for
ensuring business longevity, which among many firms overrides the drive for new
profitability and growth, is conducive to long-term thinking and the consideration of
communities on which businesses depend (Iacona, 2010). This explanation offers that it
is not the nature of entrepreneurship that makes it capable of fostering sustainable
development, but the values of entrepreneurs that leads them to impact their
communities.
22
2.2.3. A Broader Concept of Entrepreneurship
Whether entrepreneurs help foster sustainable development through their
innovative potential, their motivations, or some mixture of the two, it is necessary to
expand the concept of the entrepreneur to be more inclusive than the SE framework
often defines it. For-profit actors are one, but certainly not the only kind of leader who
creatively approaches uncertain and high-risk environments to find innovative ways to
further sustainability. Often, communities owe more credit to leaders from non-profit
organizations, government agencies, and individuals whose activities cannot easily be
categorized. Contemporary community development is increasingly in the purview of
hybrid actors who may follow a community mission typical of non-profits but using a for-
profit model, use public funding to spark non-profit initiatives that generate profit for
communities, or some other combination of models. Given this multiplicity of roles and
models that real-world champions of sustainability often follow, it is necessary to
conceptualize entrepreneurship more broadly.
The framework on SE has made initial steps at broadening the concept of
entrepreneurship. Perren & Jennings (2005) reject the typical notion of the entrepreneur,
and argue that there are many kinds of entrepreneurs and their role in society is much
more than simply economic stimulation. Some authors have emphasized the ability of
actors outside of the business community to become sustainability entrepreneurs. For
example, Jones (2008) speaks of a multifaceted “green growth alliance” made up of
several coalitions, including labour organizations, social justice activists,
environmentalists, students, and faith organizations, which bring about sustainability in
low-income communities (p. 87-88). Tilley & Young (2009) have pointed out that many of
the concepts often used to describe SE, such as futurity, social responsibility, and eco-
efficiency demonstrate an inherent bias towards business logic and assumptions. Jack &
Anderson (2002) locate the concept of the entrepreneur in predominant Western
capitalist values, highlighting that entrepreneurs are just as much a product of their
social context as agents of change in society.
23
2.2.4. Lending Support to SE
The literature on SE offers a useful framework for approaching the assessment
of entrepreneurs in New Orleans and their impact on regional sustainability. However,
the concept should be integrated with insights from several other frameworks. To that
end, I will briefly review the concepts of social entrepreneurship, corporate social
responsibility, shared value, and sustainable value chains.
Social Entrepreneurship
The first framework that strengthens SE is the literature on social
entrepreneurship. In many ways, social entrepreneurship is the precursor of SE as the
first consideration of entrepreneurs in their broader role in community development.
Many SE authors city social entrepreneurship literature as the foundational concept on
which the idea of sustainability entrepreneurs is built (Tilley & Young, 2009; Dyllick &
Hockerts, 2002; O’Neill et al., 2006).
The most common theme in social entrepreneurship is the redefining of an
entrepreneur’s role in society into one of a powerful agent of social change with a clear
mission of community benefit. Austin, Stevenson, & Wei-Skillern (2006) define it as
“entrepreneurial activity with an embedded social purpose” (p. 1). As opposed to
creating private profit, like most entrepreneurs, these individuals have the goal of
creating social value, especially by benefiting low-income communities and individuals.
Social enterprises commonly pursue missions such as employing workers with barriers
to employment, providing services overlooked by the market, and enhancing local
ownership and control of economic development (Canadian Community Economic
Development Network, 2009). A Canadian Community Economic Development Network
(CCEDN) report on social enterprise in Winnipeg, MB revealed seventeen social
entrepreneurs in that city with goals such as employing barriered workers and promoting
environmental sustainability through a range of organizational models (2009). In this
way, entrepreneurs overlap into many roles traditionally filled by non-profit organizations.
Dees (1998) outlines four common characteristics of social enterprise:
o “Adopting a mission to create and sustain social value (not just private value),
o Recognizing and relentlessly pursuing new opportunities to serve that mission,
o Engaging in a process of continuous innovation, adaptation, and learning,
24
o Acting boldly without being limited by resources currently in hand, and
o Exhibiting a heightened sense of accountability to the constituencies served and for the outcomes created” (p. 4).
These characteristics reveal another common feature of social entrepreneurs:
their use of innovative approaches to meet social needs. The focus on entrepreneurship
emphasises the use of the same shrewd decision-making, innovation, and discipline
required in the business world but applied to the agency’s social mission (Dees, 1998).
Social entrepreneurs are motivated by the social problem or population to which they are
dedicated, but remain flexible and ready to mobilize any resource or technique that is
effective to meet that need (Austin et al., 2006). This dexterity often calls for experience
with business, requiring social entrepreneurs to be comfortable “applying business
expertise and market-based skills in the non-profit sector such as when non-profit
organizations develop innovative approaches to earn income” (Austin et al., 2006, p. 2).
However social entrepreneurs need not adhere to any single organizational
model. The final theme of social entrepreneurship is the blending of organizational
model to fulfill social missions at the intersection of community, market and state actors.
Social entrepreneurs can take on many forms in non-profit, private, and governmental
sectors, but have been most commonly organized as commercial enterprises with a
social mission, corporate social responsibility, non-profit organizations, and hybrid actors
not clearly fitting into one approach (Austin et al., 2006). CCEDN defines social
enterprise as “a revenue-generating business with primarily social objectives whose
surpluses are reinvested for that purpose in the business or in the community” (2009, p.
6). This and other definitions employ concepts of business, social investment, and a
range of characteristics borrowed from different organizational models. In this way,
social enterprises blend and blur the boundaries of these divisions and create a new
model for how to meet community needs (Dees, 1998). Often, this hybrid nature comes
as a response to gaps in services or needs that have been left in communities by the
failure of more conventional institutions. In many urban areas with high unemployment
and skills deficits, social entrepreneurs have replaced receding social services and work
opportunities, as in Winnipeg (CCEDN, 2009). In this way, social entrepreneurship
represents a community-driven response to market and state failures and a powerful
engine to address social problems.
25
Corporate Social Responsibility
The second framework that can supplement the literature on SE is the concept of
corporate social responsibility (CSR). According to the Dutch Social and Economic
Council (2000, as cited in Dagevos & Evers, 2008), CSR is defined as “the conscious
focusing of the activities of the business on long-term value creation in three
dimensions-profit, people, planet—and thus on the contribution to social living standards
in the longer term [whereby businesses] maintain a relationship with the various
stakeholders on the basis of transparency and dialogue”. In other words, CSR is the
extent to which business activity contributes to the realization of long-term sustainable
development goals that comprise the vision for local or regional sustainability (Dagevos
& Evers, 2008).
CSR is not only a focus of scholarship, but is becoming an increasingly important
business priority (Porter & Kramer, 2006). Over 360 corporations have official CSR
policies, and hundreds more are adopting them (Porter & Kramer, 2006). However, CSR
has different meaning for each company, determined by factors such as the company’s
goals and values, markets where the company operates, production processes, and the
expectations of stakeholders that are affected by the company (Dagevos & Evers, 2008).
CSR goes beyond the minimum requirements of regulations, making deep societal
impacts (Dagevos & Evers, 2008). CSR also often considers ecological impacts of
corporate activities, as well as a broad range of additional priorities. Businesses that live
up to this vision of CSR “think through the external and long-term impact of all the
processes within the business” and “limit the negative external effects of their own
actions” (Dagevos & Evers, 2008, p. 15).
Despite this idealized vision of CSR, the concept has emerged from a history of
adversarial relations between corporations and community advocates. The original
impetus for CSR for many businesses was not an internal vision, but external pressure
from public interest groups. Often in the history of a business, the public has criticized
some aspect of its operation and, through campaigns, has brought attention to a
business responsibility that the company had previously ignored (Porter & Kramer,
2006). These outcries have arisen over corporate practices like Nike’s poor working
conditions in Indonesia or Shell’s improper disposal of oil rigs, and resulted in the public,
26
led by activist organizations, forcing new priorities and responsibilities onto the business
agenda (Porter & Kramer, 2006). As a result, a great deal of the corporate sustainability
and social welfare initiatives has arisen in a very reactive manner out of the assumption
that CSR is “a cost, a constraint, or a charitable deed” (Porter & Kramer, 2006, p. 2).
This reactivity often leads to the adoption of cosmetic reforms to show to the media and
public that the business is taking action about a given problem but, in truth, usually doing
the bare minimum to quiet public dissent (Porter & Kramer, 2006).
In contrast, a more constructive approach to CSR can be achieved based on
mutual interdependence. Though many corporate decisions are made without social or
environmental concerns in mind, business and society are in fact highly interdependent
(Dagevos & Evers, 2008). Favourable social and ecological conditions are preferable to
businesses, which need a healthy and prosperous community in which to operate and a
stable environment to depend on (Porter & Kramer, 2006). Porter & Kramer (2006)
argue that businesses need adequate education and healthcare in communities where
they operate just as much as they need to maximize efficient use of natural resources.
Societies with a high living standard are able to consume more products and services.
Vice versa, society could never replace all of the benefits that businesses provide
communities, from employment to innovation and a variety of goods and services.
It is clear that both business and community are interdependent. But how can
this reality lead to a deeper sense of corporate responsibility to society and the
environment? What is needed is an integration of business and community interests,
whereby the overlap of benefit between business and society is the starting point of
corporate social and environmental responsibility (Porter & Kramer, 2006). Ironically, this
goal can be achieved if businesses approach CSR the way they make other decisions,
in a strategic calculus. If corporations can benefit society while improving their own
competitive advantage, then CSR becomes not an external cost but an essential
business priority rooted in profit but ensuring community benefit (Porter & Kramer,
2006). However, the most beneficial community business partners are likely to be
smaller, locally owned firms rather than multinational corporations whose ownership and
local accountability, no matter how ethically inclined, are not oriented toward community-
level sustainable development or investment. This approach becomes realistic when
27
businesses bring community concerns into their strategic decision- making, so that what
is good for business is actually good for social and ecological concerns as well.
Shared Value
Another concept that adds to the discussion of SE is shared value. Porter &
Kramer (2011) introduce the concept of shared value to add to the understanding of
CSR, drawing on the economic concept of value creation but arguing that companies
should not focus solely on creating private economic value, but should also operate in
order to produce value for the broader community and help to meet social needs.
According to Porter & Kramer (2011), “shared value is not social responsibility,
philanthropy, or even sustainability, but a new way to achieve economic success. It is
not on the margin of what companies do but at the center” (p. 4). The authors posit that
the mainstream definition of value creation disregards the forms of capital that are
essential to both business and communities (Porter & Kramer, 2011). Businesses have
ignored forms of value outside of private profit and left them to government, which often
creates an adversarial paradigm in which the public good and private enterprise are
seen as a zero sum game (Porter & Kramer, 2011). However, societal welfare is what
underscores and enables markets, just as social problems often create costs that firms
incur (Porter & Kramer, 2011). Similar to the concept of CSR, shared value represents
the area of mutual benefit between corporate and community actors.
This new form of shared value creation implies a radically different relationship
between business and society. Similar to the CSR perspective, shared value highlights
the interdependence of both and encourages both to better understand each other’s
interests in the pursuit of a greater common welfare. Shared value need not be created
by radically changing the values of businesspeople or redistributing wealth, but by
reinforcing decision making that is interested in expanding common resources (Porter &
Kramer, 2011). This implies that businesses pursue “policies and operating practices
that enhance the competitiveness of a company while simultaneously advancing the
economic and social conditions in the communities in which it operates” (Porter &
Kramer, 2011, p. 6). There are several practical strategies that can be pursued to create
shared value, including rethinking markets and the products sold in those markets,
redefining how productivity works in the greater chain of value, and strengthening the
28
growth of local clusters (Porter & Kramer, 2011). The shared value concept offers a new
vision of a classic business priority in a way that reinforces the goals of SE and expands
on the theme of interdependence and mutual benefit exposed by the CSR literature. This
concept also helps expose how value is created in a chain of business activities.
Sustainable Value Chains
The final framework that adds to the understanding of SE and its contribution to a
better society is the concept of value chains. Value chain analysis (VCA) is a method of
analysing and improving the impacts of businesses on communities by paying attention
to their actions across a chain of their activities (Fearne et al., 2012). A value chain is
essentially a depiction of all of a company’s activities in terms of their positive and
negative social impacts across temporal phases of company activity (Porter & Kramer,
2006; Fearne et al., 2012). Value chains can be thought of as an inventory of challenges
and opportunities for corporate sustainability, highlighting ways that the business
currently adds to social and environmental well-being while bringing attention to areas
for improvement (Porter & Kramer, 2006). The ideal is to create shared value at each
point along the value chain and minimise negative impacts that detract from community
value, as shown in Figure 5.
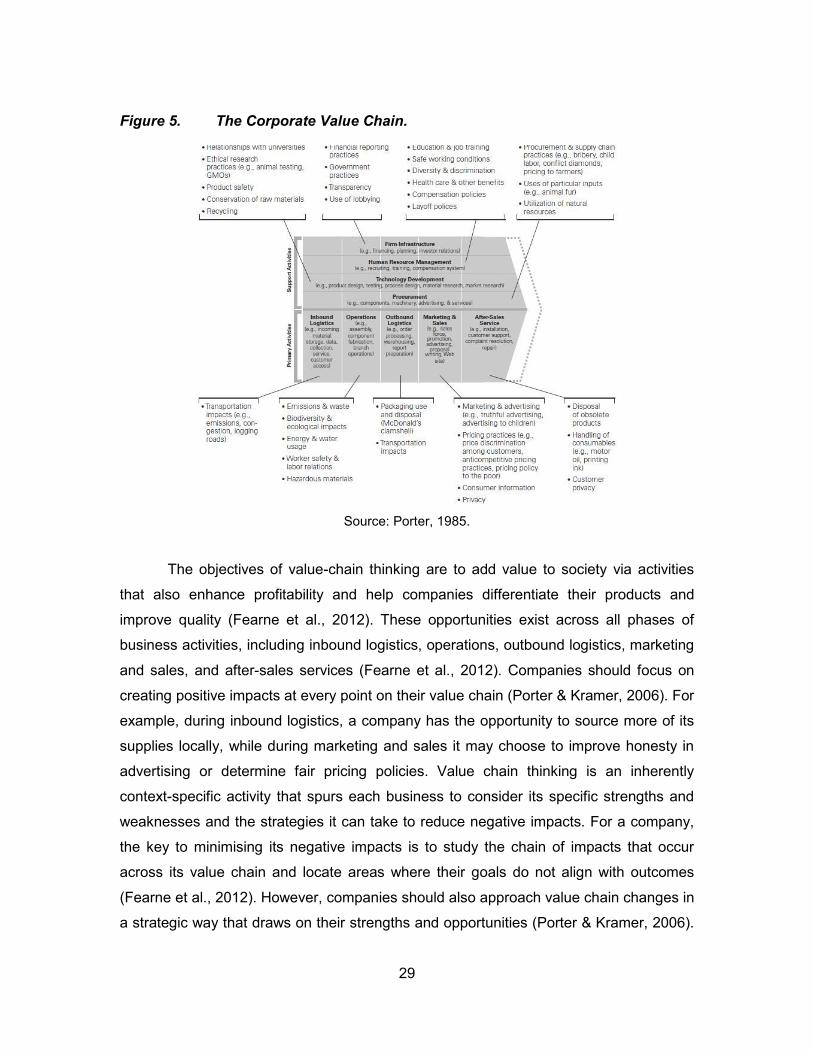
29
Figure 5. The Corporate Value Chain.
Source: Porter, 1985.
The objectives of value-chain thinking are to add value to society via activities
that also enhance profitability and help companies differentiate their products and
improve quality (Fearne et al., 2012). These opportunities exist across all phases of
business activities, including inbound logistics, operations, outbound logistics, marketing
and sales, and after-sales services (Fearne et al., 2012). Companies should focus on
creating positive impacts at every point on their value chain (Porter & Kramer, 2006). For
example, during inbound logistics, a company has the opportunity to source more of its
supplies locally, while during marketing and sales it may choose to improve honesty in
advertising or determine fair pricing policies. Value chain thinking is an inherently
context-specific activity that spurs each business to consider its specific strengths and
weaknesses and the strategies it can take to reduce negative impacts. For a company,
the key to minimising its negative impacts is to study the chain of impacts that occur
across its value chain and locate areas where their goals do not align with outcomes
(Fearne et al., 2012). However, companies should also approach value chain changes in
a strategic way that draws on their strengths and opportunities (Porter & Kramer, 2006).
30
Value chain thinking gives a useful and practical framework for approaching the impacts
of entrepreneurs on various aspects of sustainable development. The visual
representation of business activities across a timeline allows the more abstract concepts
of CSR and shared value to be placed into the specific context of a business or
organization.
2.2.5. What is Missing from the SE Framework?
These frameworks offer important insights to the understanding of SE and how it
may work towards sustainable communities. The incorporation of the innovative
character of entrepreneurs, combined with their motivations to improve their
communities, creates a dynamic framework to understand the behaviour of a range of
entrepreneurial actors. Also, the expansion of entrepreneurship to include not only
business owners but a diffuse range of actors following organizational models that blend
private, non-profit, and public elements makes the concept of SE flexible to different
kinds of actors. Additionally, the understanding of the behaviour and impacts of business
actors is enhanced by literature on CSR, shared value, and sustainable value chains,
introduced by the foundational concept of social entrepreneurship and integrated into a
broader concept. Together, these frameworks offer a helpful paradigm to inform the
assessment of SE.
However, the SE framework has several weaknesses. The first is the reality that
most SE literature is located within the conventional economic model and does not
adequately challenge the assumptions of the growth paradigm. For example, several
studies that describe SE focus on technological innovation as a solution to
environmental problems, failing to address the need for behavioural change to address
the root causes of problems like energy consumption or GHG emissions (Tilley & Young,
2009); Dyllick & Hockerts, 2002). Another limitation of the SE framework is its definition
of sustainability, which is a vaguely articulated version of the three-legged stool
approach but never described in a specific way to translate the actions of entrepreneurs
into these spheres. Another weakness is that it has not effectively defined how to
measure wealth in social and environmental terms that sustainability entrepreneurs are
supposed to create. According to Tilley & Young (2009), “there are no adequate
measures of the contribution to the social wealth of the community at present” (p. 87).
31
Finally, there is a problem with the generalizability of some of the literature’s findings
about the characteristics of sustainability entrepreneurs. The businesses studied in Allen
& Malin (2008), for example, are described as very socially conscious and have lofty
motives for community empowerment and sustainability. However, are these businesses
and their owners relevant to understanding why or how other businesses, which lack a
strong community mission, might transition to a sustainable model? Though these
business leaders have impressive goals and values guiding their practices, it is doubtful
that more research into these kinds of entrepreneurs can shed light on how more
mainstream companies can become sustainability entrepreneurs.
2.2.6. Sustainability Entrepreneurship and Marginalized Communities
The final limitation of SE is the uneven nature of its proliferation. Entrepreneurs
who embrace a sustainability vision have mostly arisen in middle and high-income
regions with little appearance in marginalized communities (Jones, 2008; Allen & Malin,
2008; Daddi et al., 2010; Blankenship et al., 2007). A wave of SE has spread across
parts of North America and Europe, for example, growing in urban and regional networks
connecting grassroots cooperatives, incubator programs, and business cluster
organizations in areas such as Karlstad, Sweden, eastern Utah, and the Lombardy
region of Italy (Allen & Malin, 2008; Daddi et al., 2010; Blankenship et al., 2007).
However, the rise of SE has failed to take hold in most other regions. SE is most absent
in communities on the periphery of national and international hierarchies, which face
multiple challenges such as dependence on natural resources, socio-economic divides,
and vulnerability to disasters (Jones, 2008; Martinez-Alier, 2004). These regions often
experience poverty, which restricts financial capital for start-up creation, dysfunctional
governance and lack of public safety, and limited social capital to organize community
resources and build trust. Moreover, peripheral communities are often compelled to
dedicate any available resources to meeting basic needs instead of pursuing benefits
that may be temporally distant or intangible. Local sustainability in these communities
must be relevant to concerns such as local ownership and participation in development,
the respect of marginalized cultural practices, the equitable distribution of benefits, and
the enhancement of education and training.
32
Despite these challenges, many marginalized communities have begun to foster
SE through a range of initiatives. Various entrepreneurial activities have created
programs such as green jobs training, microcredit, and business incubation in
marginalized neighbourhoods of cities such as Baltimore, MD, New York’s South Bronx,
and Vancouver, BC, working in fields such as deconstruction, green roof installation and
brown-field remediation (Jones 2008). SE can often take on roles that have been
abandoned by government agencies, such as cleaning polluted environments and
educating the public about dietary health. In marginalized communities, the ability to
offer green jobs is an especially acute need that environmentally focused organizations
and companies have recently dedicated to provide to workers with employment barriers
(Gray, 2009). Jones (2008) identifies how low-income communities can meet these
needs through high-quality “green collar jobs” that engage minority and barriered
workers in a meaningful livelihood while minimizing the environmental impacts of
communities. In communities with minority or indigenous cultural heritage, SE is more
rooted in the community by deriving its business or organizational mission from cultural
values and norms (O’Neill et al., 2006). These kinds of initiatives can also help address
the need for education and training, both providing skills development for employment
and building a ladder to personal empowerment, self-actualization, and the gaining of
critical consciousness to resist oppressive structures (Jones, 2008; Freire, 1970).
In these contexts, the growth of a network of SE would presumably be able to
help meet community needs in marginalized regions, but there remains a poor
understanding of their role in local visions of sustainable development. Marginalized
communities and regions are especially in need of understanding the impacts that
entrepreneurs, including businesses, non-profits, government actors, and the
organizations that support them, could have on local forms of community capital. SE
could serve as an engine for marginalized communities to mobilize people and
resources in a strengthened effort to meet their needs more fully and sustainably.
However, these communities continue to have very low amounts of entrepreneurship.
Local agencies and organizations are in need of a greater understanding of how to
support sustainability entrepreneurs while meeting local needs.
33
2.2.7. Supporting Entrepreneurs for Community Sustainability
How can local agencies and organizations support entrepreneurs to foster the
growth of an SE network in marginalized communities? Clearly, intervention is needed to
reduce the systemic barriers to SE in many regions, and there are several forms of
support that municipal government and other organizations can offer to lower these
barriers. Dagevos & Evers (2008) describe multiple approaches for supporting
sustainable enterprise from a case study in Tilburg, Netherlands.
According to the authors, local agencies are poised to foster sustainable
enterprise through initiating, facilitating, and directing the transition of new and existing
businesses to a sustainable model (Dagevos & Evers, 2008). Their initiating role implies
that municipal agencies and other organizations are able to help aspiring entrepreneurs
start businesses; the facilitating and directing functions include removing barriers to a
sustainable transition and guiding enterprises towards activities that meet community
needs. Municipalities can support the process of creating sustainable value chains by a
variety of roles, including:
o creating conditions for business with a priority for sustainable businesses;
o enacting a location statute which creates social and environmental requirements for new enterprises;
o investing in new and existing business parks to maximize efficient land use choices and industrial ecology;
o demonstrating leadership through a sustainable procurement policy;
o promoting the production and sale of local and regional products; and
o supporting education, training, and innovation.
The case study from Tilburg also expands on the ways that local agencies can
help reinforce community capital through entrepreneurship. According to the authors,
municipalities can foster SE both by enhancing the relationships that businesses create
between natural and economic capital, or between social and economic capital
(Dagevos & Evers, 2008). In order to support these relationships, municipal authorities
can pursue several policies, such as:
o promoting recruitment which reduces school dropout rates and helps train students for future careers;
34
o enabling the provision of accessible infrastructure such as public transit for commuters and reducing traffic;
o supporting the transition to a 24-7 economy;
o promoting start-up enterprises with sustainable visions;
o launching information campaigns to inform and educate residents about sustainability entrepreneurship;
o improving legislative and regulatory transparency; promoting entrepreneurship for special groups in need;
o promoting the reintegration of at-risk job-seekers into the labour market;
o supervising the re-entry of job seekers into work; and
o promoting social enterprise
These strategies can presumably be used in other communities to support and
foster SE for the betterment of multiple forms of community capital.
2.2.8. An Integrated Model of Sustainability Entrepreneurship
In light of the insights that these frameworks provide, it is possible to synthesize
a more inclusive and integrated definition of SE. These additional lenses have
demonstrated how sustainability entrepreneurs can be better understood through how
they transcend organizational models to foster community change, as in the social
entrepreneurship model; create shared value for parallel business and community
benefit; study the impacts of their actions across the chain of value of their operations;
and attempt to achieve community benefit strategically in the practice of meaningful
corporate social responsibility. The roles of sustainability entrepreneurs as change
agents should also be sensitized to the socio-economic needs and conditions of
communities where SE is located, especially in marginalized communities and regions
where there are high barriers to entrepreneurship and local buy-in. In all communities,
but especially those facing these barriers, municipal agencies and other actors should
support SE through initiating, facilitating, and directing the transition to more sustainable
enterprise. An expanded concept of SE should take account of these concerns to
expand on how it has been defined in Tilley & Young (2009) and other foundational
studies in the framework.
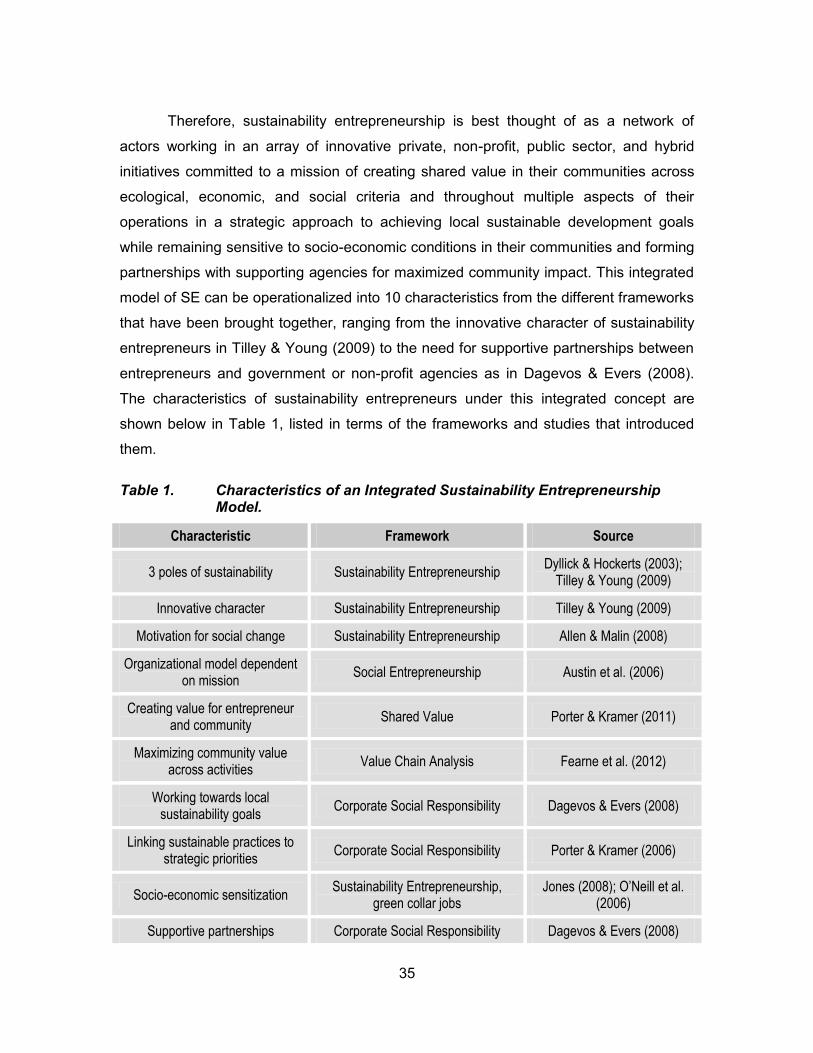
35
Therefore, sustainability entrepreneurship is best thought of as a network of
actors working in an array of innovative private, non-profit, public sector, and hybrid
initiatives committed to a mission of creating shared value in their communities across
ecological, economic, and social criteria and throughout multiple aspects of their
operations in a strategic approach to achieving local sustainable development goals
while remaining sensitive to socio-economic conditions in their communities and forming
partnerships with supporting agencies for maximized community impact. This integrated
model of SE can be operationalized into 10 characteristics from the different frameworks
that have been brought together, ranging from the innovative character of sustainability
entrepreneurs in Tilley & Young (2009) to the need for supportive partnerships between
entrepreneurs and government or non-profit agencies as in Dagevos & Evers (2008).
The characteristics of sustainability entrepreneurs under this integrated concept are
shown below in Table 1, listed in terms of the frameworks and studies that introduced
them.
Table 1. Characteristics of an Integrated Sustainability Entrepreneurship Model.
Characteristic Framework Source
3 poles of sustainability Sustainability Entrepreneurship Dyllick & Hockerts (2003);
Tilley & Young (2009)
Innovative character Sustainability Entrepreneurship Tilley & Young (2009)
Motivation for social change Sustainability Entrepreneurship Allen & Malin (2008)
Organizational model dependent on mission
Social Entrepreneurship Austin et al. (2006)
Creating value for entrepreneur and community
Shared Value Porter & Kramer (2011)
Maximizing community value across activities
Value Chain Analysis Fearne et al. (2012)
Working towards local sustainability goals
Corporate Social Responsibility Dagevos & Evers (2008)
Linking sustainable practices to strategic priorities
Corporate Social Responsibility Porter & Kramer (2006)
Socio-economic sensitization Sustainability Entrepreneurship,
green collar jobs Jones (2008); O’Neill et al.
(2006)
Supportive partnerships Corporate Social Responsibility Dagevos & Evers (2008)
36
2.3. Indicator Frameworks for Measuring Regional Development
Moving away from the theoretical frameworks that underpin this study, I will now
review the literature that contributes to a full understanding of the practical and
contextual realities of the phenomenon of SE in New Orleans. Before exploring the
contemporary context of the region, I will address concerns that arise in the use of an
assessment tool based in indicators. Given that a major component of this study is
based in an indicator-based sustainability monitoring tool, it is necessary to understand
how indicator frameworks are best used in community research. In the following section,
I will briefly review the emergence of indicator-based approaches to monitoring local
sustainability and derive a handful of best practices from recent studies in this field.
The sustainability indicator approach was first used by natural scientists to
assess ecological systems without involving the people affected by them. The first
sustainability indicator approaches were developed in expert-led projects such as the
United Nations Working List of Sustainable Development Indicators, technical methods
such as Multicriteria Analysis (MCA), and projects such as Soft Systems Analysis, the
Natural Step, and the Resilient Communities Project (Reed et al., 2006). Indicator
frameworks began to enter social and economic discourse in the 1960s and 1970s
during mounting objections to strictly scientific indicators with no community input
(Voogd, 1983). Ever since the first indicator frameworks emerged, there has been desire
among communities and researchers for more participatory ways of evaluating
sustainability (MacKendrick & Parkins, 2004). Many communities have designed their
own methods for measuring progress towards sustainable development, choosing their
own social, economic, and cultural factors into indicator frameworks (Bell & Morse,
2008). These frameworks are beneficial to communities in a number of ways, such as
increasing awareness of local goals and needs, enhancing agency and empowerment,
and identifying the strengths and weaknesses of various approaches to fulfill community
objectives (MacKendrick & Parkins, 2004; Bell & Morse, 2008; Reed et al., 2006;
Whitmore, 1998).
However, an inherent dilemma exists in sustainability indicator frameworks. On
one hand, the need for community participation and ownership implies that local people
37
be involved throughout the design, application, data collection, and evaluation of
indicator frameworks. On the other hand, the realities of many communities imply that
practical limitations inhibit the full participation of community members in crafting
indicators to evaluate local sustainability initiatives. Additionally, many frameworks are
adaptable enough to be employed in a number of community contexts. However, despite
the need for indicator frameworks to reflect the values of residents, it may be more
feasible for some communities to borrow externally designed frameworks. This dilemma
forces communities to face the difficult questions of how much of a framework to design
from the bottom up and how much to import from top-down projects. A full consideration
of the resources and possibilities of the community requires that evaluations choose
some point on this continuum.
2.3.1. Strengths and Weaknesses of Top-down and Bottom-up Indicator Frameworks
However, both bottom-up and top-down sustainability indicator frameworks have
their strengths and weaknesses. Top-down sustainability indicator projects employ
frameworks designed outside of the communities in which they are used with little or no
adaptation to local values and goals. In the meantime, bottom-up projects design all
goals, indicators, and other elements based on community input without the ability to
benefit from effective existing frameworks. To demonstrate the strengths and
weaknesses of each approach, I will briefly review three case studies and their best
practices.
The first case is a relatively top-down indicator framework. Parkins, Varghese &
Stedman (2004) developed a set of sustainability indicators in the Robson Valley of
British Columbia. One of this study’s main objectives was to “strike a balance between
relying on locally obtained information and information obtained from the social science
literature” in indicator design and monitoring (Parkins et al., 2004, p. 2). The researchers
employed the New Rural Economy (NRE) framework to measure economic, social,
human, and natural capital in the region (Parkins et al., 2004). They evaluated their
framework using 14 sustainability criteria based on Hart (1999). The authors’ use of a
relatively top-down approach demonstrates both best practices and areas for
improvements. Allowing the NRE principles to guide most aspects of their research, they
38
demonstrated the versatility of the framework (Parkins et al., 2004). However, the study
was not very participatory, with community input only occurring in the initial survey
design process. Workshops and interviews were used to identify locally defined quality
of life, but this step did not significantly impact the monitoring tool. The study’s statistical
analysis and positivist assumptions give a simple and clear ranking of each indicator but
sacrifice the depth that qualitative research could give. Overall, this study is moderately
helpful for identifying best practices and also shows some important pitfalls to avoid.
The next case study exemplifies a more bottom-up indicator design. Natcher &
Hickey (2002) provide an example of original indicator design in their study of the Little
Red River Cree Nation (LRRCN). Initially based on the Canadian Council of Forest
Ministers (CCFM) indicator framework, the researchers decided to abandon the majority
of the framework and design a new system with community members (Natcher & Hickey,
2002). This study offers several best practices. The decision to abandon most external
indicators and design original ones kept the framework sensitive to local values. The
study allowed for a high amount of flexibility during the interviewing process, allowing
continual revision of indicators and other elements. The researchers also ensured
tangible community development outcomes from the project, such as training programs
for community members (Natcher & Hickey, 2002). However, the study’s scope was so
broad that its process almost took on the size of a full-scale community planning
exercise, which is not very practical or focused.
The final case study is that of Fraser, Dougill, Mabee, Reed, & McAlpine (2005),
which was carried out in three communities in Botswana. The researchers used the
Sustainable Livelihoods Analysis (SLA), which guided a methodology of semi-structured
interviews with residents and generated an initial list of over 200 indicators for ecological
criteria (Fraser et al., 2005). This study shows a very effective balance top-down and
bottom-up design. Its open-ended interview format and focus groups for condensing
indicators successfully engaged both expert and community knowledge and achieved
scientific objectivity in the final indicators while keeping them relevant to community
priorities. The study offers multiple practices, such as open-ended community polling for
indicators, a process that respects both expert and local knowledge, relying on focus
group evaluation for accuracy and ease of use, and a grounded theory and adaptive
approach (Fraser et al., 2005).
39
These are only a few approaches that communities have carried out using
sustainability indicator tools. However, these case studies have a handful of implications
for this study. The best practices from these three cases include the techniques that
each study took to ensure a high level of community participation; cultural
appropriateness; a clear choice on the range of indicator design versus importation; an
interdisciplinary balance between natural science, social science, and other disciplines;
the flexibility of the research design; relevance, clarity, and simplicity of the framework;
the empirical accuracy of findings; and the use of a mixture of qualitative and
quantitative methods. These case studies show the strengths and weaknesses of
indicator frameworks that are designed by both bottom-up and top-down approaches.
They show various best practices that can occur across a range of community
participation and demonstrate that elements of externally designed sustainability
indicator tools can be imported into community and regional assessments of sustainable
development while effectively capturing local values and priorities.
2.4. Greater New Orleans: Contemporary Policy and Planning Context
In order to understand the relevance of these theoretical frameworks and how
this study can benefit from their application, the contemporary context of the New
Orleans region must be explained. The metropolitan region is centred in the city of New
Orleans, upon which the six surrounding parishes depend. Together, they constitute a
multifaceted organism of interrelated social, cultural, ecological, and economic systems
situated within the greater coastal ecosystem, the state and national political cycles, and
the global economy. The following section briefly reviews the evolution of the New
Orleans region up to the contemporary period, from its origins to the pivotal point of
Hurricane Katrina, the aftermath, and the present-day political, ecological, social, and
economic contexts.
2.4.1. New Orleans up to 2005
The area now inhabited by the metropolitan New Orleans region was originally
an ecosystem characterized by deltaic marshes, low-lying pine forests, and cypress
40
swamps at the mouth of the Mississippi River (Costanza et al., 2006). The first
inhabitants were American Indian tribes such as the Chawasha, Choctaw, Houma,
Quinipissa, and Tchefuncte peoples (Swanton, 1953). These peoples were virtually
destroyed by European disease and conquest, after which the French settled at the site
of the French Quarter in 1722 and built the original town site of Nouvelle Orleans. The
city changed hands between the French and Spanish empires until it was acquired by
the United States in 1804. New Orleans became an important trade hub and the centre
of a plantation society organized around the French colonial aristocracy, and built on the
backs of African slaves with revenues from plantation crops such as sugarcane. Some of
the region’s larger towns were settled before the Civil War, serving as centres to rural
districts based in agriculture and forestry.
The aristocratic plantation society was disrupted by the Civil War and the
abolition of slavery. Afterwards, the city was characterized by harsh segregation in which
newly freed African Americans, a majority in the city, were kept separate and in inferior
socio-economic status to Caucasians who remained in control of key institutions. During
this time, New Orleans emerged as a significant port, gaining a worldlier cultural flavour
than most Southern cities (City of New Orleans, 2010). New Orleans became the site of
great environmental modifications such as the dredging of coastal wetlands, the
construction of a modern storm water drainage system, and the redirection of the
Mississippi River along a series of levees (City of New Orleans, 2010). These
modifications, as well as oil and gas exploration, set forces in motion that destroyed the
buffer of coastal wetlands around the city (Costanza et al., 2006). During this time, the
municipality sponsored urban renewal projects such as the clearance of low-income
housing that pushed poor, mostly African American residents into ghetto areas where
new housing projects were soon built (Diefendorf, 2009).
The modern New Orleans was created by the same change that transformed
virtually all American cities in the 1950s and ‘60s: suburban growth. Federal housing and
highway policies, as well as changing social attitudes, led to an out-migration of
residents into surrounding areas in Jefferson and St. Tammany parishes. This
suburbanization took on a racial character known as White Flight in the 1950s and ‘60s,
with middle and upper class Caucasian residents leaving the city in a mass exodus
(Diefendorf, 2009). White Flight paralleled the forced integration of many of New
41
Orleans’ public institutions at the onset of the Civil Rights Movement during the 1960s
and effectively segregated neighbourhoods such as Lakeview and the Lower Ninth Ward
(Diefendorf, 2009). This wave of de facto segregation across the region widened
inequities, leading to one of the country’s highest GINI coefficients, which measures
income inequality; New Orleans public schools, which had 95% African American
students, comprised the poorest-performing school district in the nation with 72% of
schools failing state standards (Plyer & Ortiz, 2011). Another sea change was the
development of the oil and gas industry, which boomed in the 1970s and ‘80s, drawing
massive investment and development to downtown New Orleans (City of New Orleans,
2010). Along with tourism based in dining, entertainment, and hospitality, and shipping,
these three sectors were the bulwark of the regional economy (Plyer& Ortiz, 2011).
However, in 1985 the bust of the energy sector brought on a sharp economic decline
that shed tens of thousands of jobs and left the region in a deep recession (City of New
Orleans, 2010).
Throughout these changes, the region developed with little or no regard to the
ever-present spectre of hurricanes, which threatened New Orleans each year with rising
temperatures in the Gulf of Mexico and a levee system which remained unsuited for
higher than a Category Three storm. The region’s tourism infrastructure hosted
thousands of visitors, who flocked to the region to enjoy well-known tourist attractions,
with no preparation for the looming threat of disaster. The New Orleans region was a
relatively stable, yet marginal and highly vulnerable system of overlapping social,
economic, racial, and ecological pressures that lay beneath the façade of a timeless and
iconic city.
On August 29th, 2005, this façade was abruptly and irreversibly shattered by
Hurricane Katrina and its aftermath. The storm, a Category Four hurricane at landfall,
barrelled up the Gulf of Mexico and slammed into Plaquemines Parish, unleashing the
equivalent of ten atomic bombs of energy per second, and 140 mile per hour winds onto
the coast of Louisiana and Mississippi (New York Times, 2012). The hurricane pushed a
storm surge of over 18 feet towards the city, topping the levee system immediately at
several locations; yet the deadliest event came with the breaching of three canals from
storm surges that let over 250 billion gallons of water into the city (Grossi & Muir-Wood,
2006). Overall, the surges inundated approximately 80% of the region (Plyer& Ortiz,
42
2011). However, the greatest wound left by the storm is the 1,464 lives which have been
documented as the hurricane’s death toll, though many estimates are much higher
(NOAA, 2007).
2.4.2. The Post-Katrina Response
As the floodwater receded in early September 2005, the world watched and
wondered if New Orleans would ever recover from this unparalleled catastrophe. In the
relief effort, all levels of government were criticized for their actions during the high-
pressure days following the storm. Many have accused authorities such as the Federal
Emergency Management Administration (FEMA) and state agencies of institutionalized
racism in their slow rescue of minority residents trapped on their roofs. Violence and
looting ensued, during which a state of martial law was declared, and numerous
accusations against the New Orleans Police Department were made for undue force and
discriminatory behaviour (Chamlee-Wright & Storr, 2009).
The storm’s aftermath led to an exodus of 29% of the city’s population, while the
metro area overall lost 11% (Plyer & Ortiz, 2011). In terms of physical damage, the
greatest losses were suffered by residents in low-lying areas, typically African American
residents in lower and middle classes; however, notable exceptions include wealthy
Caucasian neighbourhoods such as Lakeview (Diefendorf, 2009). Neighbourhoods such
as the Lower Ninth Ward were almost levelled, and residents were not allowed to return
for months. The demographic character of the evacuation, resulting in thousands of the
city’s lowest income African American residents never returning to their neighbourhoods,
unleashed a wave of racial tension. Openly bigoted statements were even made by
public figures; as one municipal politician publicly stated, “We finally cleaned up public
housing in New Orleans. We couldn’t do it, but God did” (Anonymous, as cited in
Diefendorf, 2009, p. 386).
The physical toll of Katrina was equally great. The storm created 22 million tons
of debris, most of which was slowly collected by residents and waste management
agencies (Ardani, Reith, & Donlan, 2009). The hurricane exacted an economic toll of
over $10 billion, making it the costliest natural disaster in U.S. history (Grossi & Muir-
Wood, 2006). Thousands of homes and businesses were destroyed or damaged beyond
43
repair. As the smoke cleared from the wreckage of New Orleans, the same questions
recurred on the media and among local residents: Could New Orleans rebuild? Should
it? What would a renewed region look like compared to the New Orleans before August
29th?
2.4.3. Contested Visions of Recovery
Following Hurricane Katrina, the questions of rebuilding the damaged region
sparked an intense conflict over New Orleans’ recovery. Residents vowed to return to
even the most beleaguered areas, while some politicians spoke of drastically changing
the landscape of the city. In this wave of debate, architects and planners from around
the country “jumped in to offer opinions on relocation, mitigation, building codes,
architectural style, priorities, and planning procedures” (Diefendorf, 2009, p. 385).
Architects made over 600 offers for pro bono design projects to design new housing
(Diefendorf, 2009). Many proposals suggested radical changes, such as abandoning
entire neighbourhoods for parkland memorials, and some even spoke of relocating the
entire city (Diefendorf, 2009). Though these proposals were understandable from a
standpoint of vulnerability, they made no acknowledgment of the cultural significance of
the city to residents whose sense of place was rooted in their neighbourhoods. Many
proposed plans responded primarily to reducing the risks of catastrophic storms and sea
level rise, or to employ ecological principles such as restoring the Mississippi River’s
natural variations (Diefendorf, 2009). The academic community turned to New Orleans
both to “provide real help and as a kind of laboratory for study”, while local policymakers
recruited researchers to offer fresh perspectives on how to rebuild the region
(Diefendorf, 2009, p. 386). Studies from the University of Pennsylvania, Brown
University, and other institutions were published on lessons from the storm and
principles for rebuilding (Diefendorf, 2009).
Two Recovery Plans
Of the hundreds of proposals for redevelopment, and dozens of studies and
plans conducted by academics and practitioners, two recovery plans are noteworthy in
their shaping of the vision for post-Katrina New Orleans. The Bring New Orleans Back
Commission, organized immediately after the storm, and the Lambert Plan of 2006 had
44
considerable influence on the dialogue around the contested renewal of the region and
on the physical outcomes of their proposals.
The first recovery plan that emerged was the Bring New Orleans Back (BNOB)
Plan. Launched by Mayor Ray Nagin in September 2005, the plan was the product of a
commission of the same name (City of New Orleans, 2010). The commission held
subcommittees on housing, historic preservation, land use, infrastructure, urban design,
and sustainability (Diefendorf, 2009). Its findings were compiled into a study by the
Urban Land Institute (ULI), which led to the BNOB Action Plan in January 2006. Most of
its recommendations follow urban planning and smart growth principles such as
revitalizing downtown, neighbourhood rebuilding, park space expansion, light rail, and
investment in universities and training (Diefendorf, 2009). During the BNOB
Commission, the ULI raised the critical but galvanizing question of whether the
geographic footprint of New Orleans should change (City of New Orleans, 2010). This
question had a reasonable physical and ecological basis but it took on a divisive socio-
economic and racial tone. The plan called for a moratorium on construction in highly
damaged neighbourhoods pending planning of their rebuilding process (Diefendorf,
2009). Destroyed properties in these neighbourhoods were marked for acquisition by
recovery agencies (Diefendorf, 2009). The BNOB plan became known for the infamous
“green dots” which were placed over five high flood risk neighbourhoods, coincidentally
five of the poorest parts of the city, which were marked to be bulldozed for park space
(Diefendorf, 2009). The response from the community to this plan was a resounding
“no”, as angry residents asserted that every neighbourhood should have the right to
return regardless of flooding risk (City of New Orleans, 2010).
The other major rebuilding plan that emerged in the post-Katrina period was the
Lambert Plan (City of New Orleans, 2010). Sponsored by City Council in 2006, this plan
sought to create plans for all Orleans Parish neighbourhoods to adapt for future storms
(Diefendorf, 2009). The Lambert Plan had a more thorough and participatory process
than its predecessor, incorporating considerable input from residents (City of New
Orleans, 2010). The Lambert team held meetings with community members, travelling to
other cities to consult with residents in evacuation (Diefendorf, 2009). The UNOP
process also involved three forums on planning which involved thousands of residents in
articulating the goals of the planning process (City of New Orleans, 2010). The result of
45
this process was a compendium of 48 neighbourhood plans (Diefendorf, 2009). The plan
proposed to rebuild all neighbourhoods in New Orleans, calling for incentives to
encourage homeowners in heavily damaged areas to either return or to move to less
flood-prone neighbourhoods (Green, Bates, & Smyth, 2007). The Lambert Plan was not
perfect, but it was a marked improvement from the BNOB Plan. This plan brought about
a deeper sense of community participation and a human focus to the future vision of
rebuilding. Eventually, the Lambert Plan also had a considerable influence on the 2010
Master Plan, the city’s current plan in force, by introducing the focus on neighbourhood-
level planning and citizen participation (City of New Orleans, 2010).
2.4.4. Two Disasters on the Way to Recovery
In the wake of Hurricane Katrina, the New Orleans region went about attempting
to return to a sense of normalcy. Though many contributions to this debate were divisive,
many bright spots emerged in the recovery period, such as the influx of thousands of
volunteers from charitable organizations who rebuilt homes and provided needed
services. Residents also made considerable strides to rebuilding their neighbourhoods
and improving some of the social ills exposed by the storm. However, these efforts were
stymied by two overlapping disasters that hit the region in the post-Katrina years: the
international economic recession and the British Petroleum oil spill.
Great Recession
The economic downturn otherwise known as the Great Recession began in 2008
with the housing market “bubble” bursting in the United States, quickly leading to
widespread foreclosures, corporations losing massive investments, and the highest
unemployment in the country since the 1970s (Holt, 2009). Like all major urban areas in
the country, New Orleans was impacted by the recession, but was somewhat insulated
from the deepest impacts (Plyer & Ortiz, 2011). The region experienced a loss of 1.2%
of jobs between 2008 and 2010, which was lower than the national job loss of 5.1%
(Plyer & Ortiz, 2011). The recession also reduced the region’s wages, which had been
growing steadily since after Katrina but subsequently dropped to near the national
average (Plyer & Ortiz, 2011). However, median household incomes have not changed
since 1999, while national incomes are 7% lower, reflecting protection from the worst of
46
the recession (Plyer & Ortiz, 2011). The region continues to experience economic
hardship associated with the recession, including a depressed housing market, elevated
unemployment, and an array of other symptoms.
BP Oil Spill
When the Deepwater Horizon oil rig exploded on April 20, 2010, killing 11
workers and initiating a leak of over 4.9 million barrels of oil into the Gulf of Mexico, the
New Orleans region was exposed to the third major disaster (Bryant, 2011). The leak,
which became the largest offshore oil spill in United States history, occurred only 41
miles away from Louisiana coastline inhabited by human and ecological communities.
Coastal communities from Texas to Florida were impacted, leaving an estimated 10% of
the Gulf coast shoreline covered in oil and other toxic residues over the 87-day period
that the leak continued (Corn & Copeland, 2010). When the well was finally capped on
July 15th, the coast had been dealt an immeasurable blow to the social, ecological, and
economic health of the entire Gulf coast region. Efforts to recover or dissipate the
escaped oil were only marginally successful, and resulted in the dumping of toxic
substances used to break down the oil, which joined the petroleum to damage aquatic
and coastal marsh ecosystems, countless fisheries of oyster, redfish, and other species,
and devastated hospitality-based industries, especially the staple local seafood industry.
Outcry at British Petroleum, as well as the federal government, continues along with a
steadily increasing tally of lawsuits for damages caused by the spill (Bryant, 2011).
2.4.5. Contemporary Political, Ecological and Socio-economic Environment
This overview of the historical evolution of the New Orleans region and its
direction in the post-Katrina period has intended to paint a portrait of the region in its
contemporary context. Before explaining how this study intends to contribute to a more
holistic understanding of the region’s path to sustainable development, and how
sustainability entrepreneurs are beginning to enhance community capital in the region, I
will briefly summarize the contemporary context of New Orleans in terms of its present-
day political, environmental, social, and economic conditions.
47
Political
Present-day New Orleans has a markedly different political character than on the
eve of August 29th, 2005. The municipal administration under Mayor Mitch Landrieu has
made significant strides towards reducing the city’s public corruption, with a recent spike
in indictments made by the U.S. attorney giving demanding greater accountability of
officials (Ross, 2012). The city has a new Master Plan, given greater force over land use
decisions by an amendment to the New Orleans Charter (City of New Orleans, 2010).
One of the most far-reaching institutional transformations is the reform of the New
Orleans public school system, which is now operated almost entirely by privately
administered charter schools and has quickly brought dramatic improvements to student
achievement (Cowen Institute, 2012). Recent legislative successes for the region are the
Restore Act, a federal policy which will funnel BP fines towards coastal restoration, and
the state adoption of Benefit Corporation (B Corps) legislation to support socially
conscious businesses (RESTORE, 2013; Benefit Corps Information Center, 2013).
However, many challenges still remain, such as the reform of state and local criminal
justice systems and the continual occurrence of public corruption.
Environmental
The story of the natural environment of Greater New Orleans is not quite as
optimistic. The region continues to suffer multiple environmental threats, most notably
the intensification of tropical storm risk and sea level rise from climate change,
subsidence from storm water management practices, and the continued destruction of
coastal wetlands (Costanza et al., 2006). The most alarming of these threats are coastal
loss and climate change. Having lost an estimated 1,800 square miles of marsh
ecosystem, which buffers the region from storm surge, the state is projected to lose an
estimated 1,700 more if no action is taken (State of Louisiana, 2012). New Orleans is the
country’s most vulnerable city to the projected effects of climate change (City of New
Orleans, 2009). According to the City of New Orleans Carbon Footprint Report, “the
entire city could be submerged with a 7-15 inch rise, which is what is predicted by the
end of the century in the most optimistic scenarios. Not only could New Orleans be
submerged due to sea level rise, but…may experience increased hurricane intensity due
to the warming of the ocean” (City of New Orleans, 2009, p. 9).
48
A recent improvement is the leadership that the City of New Orleans has taken in
sustainability initiatives. This progress began with the creation of the GreeNola Action
Plan, a roadmap to an environmentally sustainable city that spelled out actions and
strategies for reducing the ecological footprint of the city (City of New Orleans, 2008).
The goals in this plan, ranging from energy efficiency to urban agriculture, had a
considerable influence on the 2010 Master Plan now guiding municipal sustainability
efforts (City of New Orleans, 2010). Another of the City’s environmental successes was
the reinstatement of the recycling program in 2011 (Ross, 2011). Curbside recycling had
been discontinued following Hurricane Katrina and the City could not afford to launch the
service again until it renegotiated its contracts with the companies that provided garbage
pickup services. Within the first few months, over 17,000 residents requested bins,
approximately 15% of the city’s population (Ross, 2011). Lastly, the municipality
demonstrated its leadership by joining ICLEI – Local Governments for Sustainability in
1999 (City of New Orleans, 2010). In so doing, the municipality committed to reduce
greenhouse gas emissions, to which it made initial strides by publishing the City’s first
Greenhouse Gas Report in 2009 (City of New Orleans, 2009).
Social
The contemporary social context of New Orleans shows both progress and
stagnation. The major social change post-Katrina has been a demographic shift in which
the region became more Caucasian and wealthier on average; the White population
grew from 59% to 73%, with an increase in median incomes from $55,000 to $64,000
(Green et al., 2007). These changes are largely the result of the evacuation of many of
the city’s poorest African American residents and the influx of new middle class
Caucasian professionals (Ortiz, 2012). Racial inequalities remain very high, as do
poverty levels (Plyer & Ortiz, 2011). The poverty rate has shifted regionally, with the
city’s poverty rate decreasing but increasing across the rest of the metro area (Plyer &
Ortiz, 2011). Other changes in social trends have occurred in housing, education, and
public safety. The most notable change is the drastic improvement of public education.
In eight years, New Orleans public schools have gone from an essentially failing school
system to seeing 68% of schools now passing state standards (Plyer & Ortiz, 2011).
However, there are many inequities in the charter school system and a high proportion
of private school attendance (Ross, 2012). Housing has become less affordable for
49
many residents (Green et al., 2007). At the same time, violent crime has fallen
significantly but is still 80% higher than the national average (Plyer & Ortiz, 2011).
Economic
Finally, several economic changes have characterized the region. There has
been a general diversification of the regional economy, with a continual decline in the
three legacy sectors as well as growth in new sectors based in “knowledge-based”
activities such as higher education, the film industry, and legal services (Plyer & Ortiz,
2011). Entrepreneurship has been another defining marker of the economic landscape,
with New Orleans boasting one of the highest rates of start-up business creation in the
country (Plyer & Ortiz, 2011). Many major investments have come to New Orleans,
increasing the competitiveness of the region and providing new employment
opportunities (GNOInc., 2013). Another marker of the contemporary regional economy is
a surge of growth in green businesses, which have been both opened by entrepreneurs
with visions for sustainable business and which long-established firms have decided to
embrace (LifeCity, 2013).
2.4.6. The Need for a Common Vision for Regional Development
This review of literature has exposed the theoretical and contextual lenses
through which an analysis of the sustainability of the Greater New Orleans is best
informed. The concept of sustainable community development provides both a precise
and flexible definition of sustainability, as well as versatile tools for operationalizing it in
the region. The central task of this approach, the design of a sustainability indicator
framework in Greater New Orleans, is informed by a handful of projects that have struck
a balance between community appropriateness and scientific rigour in the application of
indicator-based tools in various communities. Finally, the SE framework provides a
helpful foundation to evaluate the rise of sustainability entrepreneurs in the region, which
has been augmented by attendant literatures to offer a more complete concept of the
phenomenon.
These frameworks expose that sustainable regional development can be
articulated in a way that represents the values and needs of the New Orleans region,
and this goal can be assessed using well informed indicators with methodological rigour
50
and local sensitivity. The rise of sustainability entrepreneurs in New Orleans is a
phenomenon whose contribution to this process of regional sustainable development
can and should be better understood. However, what has not been clarified is the nature
of the vision for a sustainable region. Given the historical challenges facing New
Orleans, and the galvanizing wounds of the post-Katrina experience, can New Orleans
pursue sustainable community development in a way that enhances its various forms of
community capital equitably and in keeping with local values? How can this vision work
towards healing a region wracked by deep-seated divisions and not one, but three
disasters? The rest of this study is dedicated to answering these questions, first by
outlining the methods I have chosen to do so, and then by articulating the vision for a
sustainable New Orleans.
51
3. Methodology
Having reviewed the relevant theoretical and contextual frameworks for to this
study, I will now turn to the methods that the study has taken to answer its research
question. I have employed a methodology informed by both the theoretical paradigms
discussed above and the practical context of Greater New Orleans. The methodology is
drawn primarily from the Community Capital Framework, which has inspired an
indicator-based tool that measures progress towards regional sustainability and gauges
the perceived impacts of sustainability entrepreneurship on it. However, the study’s
methods also draw upon principles of qualitative research, which guide the integration of
stakeholder perspectives and local priorities into the analysis.
3.1. Integrating Empirical Data and Community Perspectives
One of the major principles guiding this project is the necessity for Greater New
Orleans to integrate both empirical data and community perspectives in planning and
implementing regional sustainability. This integration is an imperative of collaborative
planning and practice, which must strike a balance between expert-driven research and
monitoring on the one hand, and the attitudes and perceptions of community members
on the other (Gunton & Day, 2003; Hermans et al., 2011). To respond to the need for the
former, this study has integrated a wide range of existent information to measure
indicators of sustainability in the New Orleans region. The outcome is the Sustainable
Region Balance Sheet (Balance Sheet for short), which is a mainly quantitative tool of
the Community Capital approach designed to facilitate decision making and monitor
regional sustainability (Lowry, 2012). In response to the need to consider and integrate
community perspectives, this project also incorporates qualitative perceptions from
residents of the GNO area, spanning a range of stakeholders including sustainability,
business owners, neighbourhood activists, educators, municipal and regional
52
policymakers, and community members. This study was also enabled through a
research partnership with a local sustainability entrepreneurship leader known as
LifeCity. Finally, these community perspectives are used to render an assessment of
sustainability entrepreneurship in the GNO region.
The methodology has been chosen specifically to match the objectives of this
study. The Community Capital Tool has directly informed objectives 1 through 4 of the
project, which I attempt to meet by employing methodological tools provided by this
approach, mostly in the form of the Balance Sheet. Objective 1 will be met by conducting
a thorough analysis of planning and policy documents from Greater New Orleans, in
conjunction with an in-depth analysis of the perspectives of local sustainability leaders;
objectives 2-4 are dedicated to the Balance Sheet. I have also blended this approach
with community perspectives by conducting semi-structured interviews with residents of
Greater New Orleans, including individuals involved in organizations that work toward
the long-term goals identified in the Balance Sheet and who represent a cross-section of
the SE network. These perspectives introduce a significant qualitative component that I
seek to integrate into all of the objectives, especially objectives 1, which compare the
visions for regional sustainability found in planning documents with those identified by
local stakeholders; and objective 5, which will be achieved by discerning the intended
and perceived community impacts of the SE network from semi-structured interviews, a
collaborative workshop, and the partnership with the enterprise LifeCity.
3.2. Sustainability Entrepreneurship Collaboration
The goal of incorporating community perspectives into the study was pursued
through collaboration with sustainability entrepreneurship organizations in the Greater
New Orleans region. However, the scope of community perspectives that the study
considers are confined to individuals connected to the SE network, as opposed to the
GNO region’s general population. This choice was made for two reasons. First, I
concluded that consulting with a cross-section of residents representing all of the various
communities present in the region is more appropriate for a project more focused on
bottom-up processes of regional sustainability planning, such as community-based
indicator frameworks like Natcher & Hickey (2002) discussed in Section 2. In the
53
classification of stakeholders made by Hermans et al., (2011), the stakeholders chosen
in this study are best described as experts, in light of their extensive knowledge of
different domains of sustainability-related issues in the region, and, to some extent, they
can be considered representatives of a small cross-section of New Orleans’ population,
but are not intended to be fully representative. Before crafting an entirely participatory
set of goals based on representative community perspectives, it is important to
incorporate pre-existing work to identify a synthesized vision for the region which lays
the groundwork for a more bottom-up process. Second, the focus on SE as an agent for
enhancing multiple forms of community capital necessitates that the first perspectives to
be considered in this assessment are those of the entrepreneurs themselves. Although
the community impact of the SE network on Greater New Orleans must be articulated
ultimately by members of the communities in the region, such an assessment must be
informed by a clear understanding of how the entrepreneurs themselves intend to impact
community capital.
3.2.1. Partnership with LifeCity
The first collaborative component of the study was the relationship established
between myself and the SE leader known as LifeCity. During the design of the project,
this partnership was formed in order to ground the study in the contemporary SE context
in Greater New Orleans and to initiate collaboration with a local partner organization. I
chose LifeCity because its goal is to foster a community, as well as a market, between
environmentally conscious residents in the GNO area, green businesses, and the
organizations that support them (LifeCity, 2013). Though a for-profit company that offers
consulting and certification to businesses seeking to adopt sustainable practices, many
of LifeCity’s objectives span multiple policy and advocacy roles (LifeCity, 2013).
Therefore, I believed that LifeCity would be a very valuable partner in increasing the
project’s relevance to the region’s sustainability context and its network of sustainability
entrepreneurs.
The nature of this partnership consisted of an ongoing process of consultation
and dialogue about the project between myself and LifeCity staff. In order to ensure
mutual benefit, I participated in an internship for several months with the organization. In
exchange for assistance with several current planning and advocacy projects, LifeCity
54
offered me extensive expertise and advisement concerning the design and execution of
the study, assistance in identifying multiple interview participants, the organization of the
collaborative workshop that was an integral part of the study, and willingness to give
extensive support and guidance. I was able to use this assistance to become more
familiar with the nature and changes of the SE network in Greater New Orleans, the
communities in which they operate, and the kinds of impacts that these leaders have
across the region. This partnership also intended to initiate a closer relationship between
the region, LifeCity, and initiatives focused on planning and implementing sustainable
development, as well as an avenue for the transformation of the project into a tangible
local initiative.
3.2.2. Participants
The choice of participants in this project was driven by two goals. First, I intended
to speak with local leaders in community issues who had expertise in regional
sustainability goals. This goal was driven by the need to gain local context for the
Common Vision and the Balance Sheet, and informed my choice of individuals whose
experiences gave them extensive insights into salient regional issues. I based these
issue areas on priorities from local policy and planning documents, such as wetlands
restoration and food access, choosing stakeholders whose leadership in these issue
areas gave them strong visions for how they would like the region to be.
Second, I hoped to portray the network of sustainability entrepreneurs in Greater
New Orleans. This portrayal intended to rely on a small but illustrative sample of
entrepreneurs who could offer meaningful findings about SE in the region. Of course, the
theoretical framework on SE and the related body of literature that gives the concept
more depth were essential in informing the choice of individuals whose activities and
goals were consistent with the term. However, it was also important to be flexible in the
selection of stakeholders and to gain a fuller understanding of the SE network in Greater
New Orleans. In this way, participant selection was done in an exploratory manner in
which I attempted to learn about the SE network and then chose a diverse group of
sustainability entrepreneurs whose perspectives and experience could paint a colourful
portrait of the SE network in Greater New Orleans as I came to know it. The goal of this
selection process was not to arrive at a representative sample as in a statistical analysis,
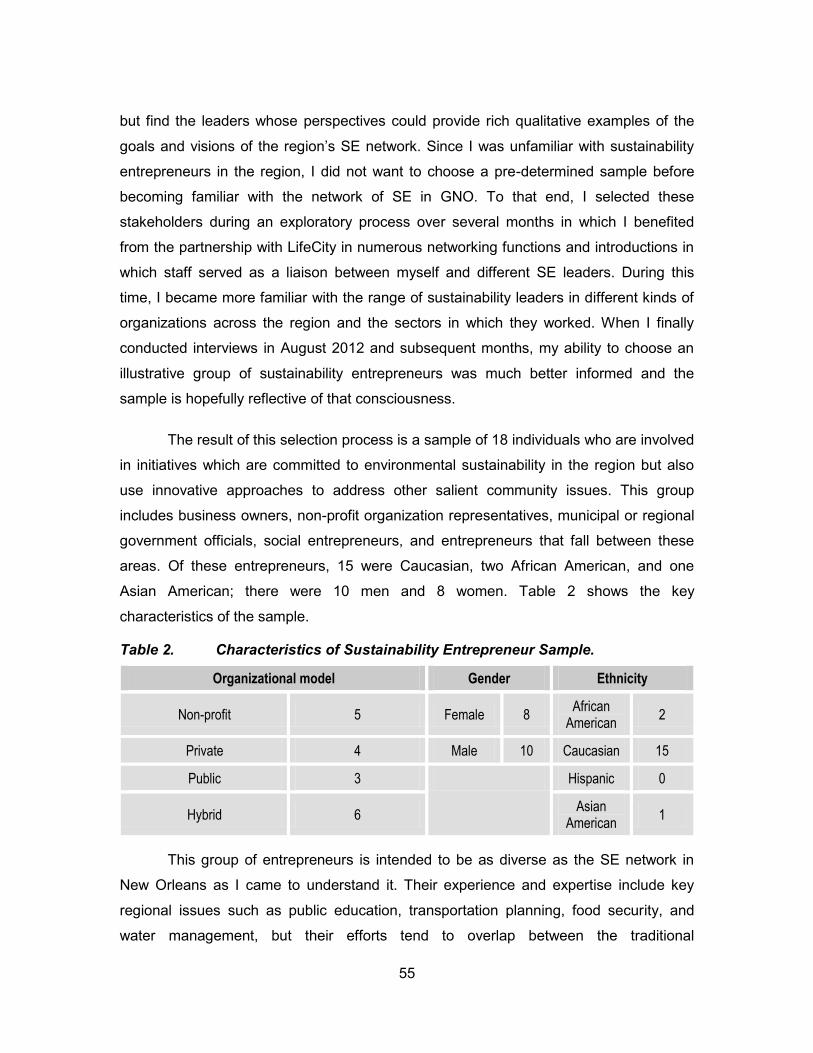
55
but find the leaders whose perspectives could provide rich qualitative examples of the
goals and visions of the region’s SE network. Since I was unfamiliar with sustainability
entrepreneurs in the region, I did not want to choose a pre-determined sample before
becoming familiar with the network of SE in GNO. To that end, I selected these
stakeholders during an exploratory process over several months in which I benefited
from the partnership with LifeCity in numerous networking functions and introductions in
which staff served as a liaison between myself and different SE leaders. During this
time, I became more familiar with the range of sustainability leaders in different kinds of
organizations across the region and the sectors in which they worked. When I finally
conducted interviews in August 2012 and subsequent months, my ability to choose an
illustrative group of sustainability entrepreneurs was much better informed and the
sample is hopefully reflective of that consciousness.
The result of this selection process is a sample of 18 individuals who are involved
in initiatives which are committed to environmental sustainability in the region but also
use innovative approaches to address other salient community issues. This group
includes business owners, non-profit organization representatives, municipal or regional
government officials, social entrepreneurs, and entrepreneurs that fall between these
areas. Of these entrepreneurs, 15 were Caucasian, two African American, and one
Asian American; there were 10 men and 8 women. Table 2 shows the key
characteristics of the sample.
Table 2. Characteristics of Sustainability Entrepreneur Sample.
Organizational model Gender Ethnicity
Non-profit 5 Female 8 African
American 2
Private 4 Male 10 Caucasian 15
Public 3 Hispanic 0
Hybrid 6 Asian
American 1
This group of entrepreneurs is intended to be as diverse as the SE network in
New Orleans as I came to understand it. Their experience and expertise include key
regional issues such as public education, transportation planning, food security, and
water management, but their efforts tend to overlap between the traditional
56
organizational models that work in these areas. In order to gain the most expertise
possible from these individuals, I spoke with representatives of these organizations who
are directly involved with the sustainability project that the organization is conducting. As
mentioned before, this variety of experience in local priorities and issues informed both
their ability to enrich the goals of the Common Vision and the subsequent Balance
Sheet, as well as portray the multiplicity of community priorities that are important to
sustainability entrepreneurs in GNO.
3.2.3. Semi-structured Interviews
I conducted semi-structured interviews with these stakeholders, either in person
or via telephone, during which they answered guiding questions about their role in their
organization and in the SE network, their intended and self-perceived community impact,
vision for regional sustainability, long-term goals for achieving the vision, and the
community impacts of the SE network overall and of LifeCity. In addition, I asked these
individuals to identify recommendations and suggested action items that they considered
important for different actors to removing barriers they identified that prevented greater
impact of SE on the region’s vision. Throughout these interviews and their analysis, I
employed qualitative research principles of grounded theory such as a flexible interview
structure, contextual settings for interviewing, and in vivo coding (Spradley, 1979; Glaser
& Strauss, 1967). Please refer to Appendix C for a list of guiding questions.
3.2.4. Collaborative Workshop
The final component of the stakeholder collaboration consisted of a workshop
that was held in New Orleans with residents and sustainability leaders. Its purpose was
to introduce a group of sustainability entrepreneurs and other community leaders,
including many of the interview participants, to the study’s objectives and the Community
Capital Tool, as well as to receive feedback on the long-term requirements and
indicators to be used in the Balance Sheet. This workshop was jointly organized by
myself and a consortium of New Orleans organizations, including LifeCity, the New
Orleans Chamber of Commerce, and a group of sustainability leaders known as the
Green Collaborative. Over 60 residents attended, representing a variety of sustainability
entrepreneurs and other community voices including residents, non-profit organizers,
57
green business owners, municipal officials, public health advocates, local attorneys, and
other stakeholders. The workshop was facilitated by trained professionals and produced
a great amount of community input and dialogue.
3.3. Executing the New Orleans Model
These collaborative methods were employed in pursuit of composing the three
intended outcomes of this study. These three outcomes, including a common regional
vision for sustainable development, the Balance Sheet, and an assessment of SE,
constitute the New Orleans Model, the regional planning framework that is the ultimate
outcome of this study. In the following sections, I review the methods that the study
followed in constructing the components of the New Orleans Model.
3.3.1. Crafting a Common Regional Vision
The first phase of the study was the identification of a common vision for regional
sustainability in accordance with local priorities and perspectives. This vision was built
on pre-existing community and regional planning frameworks carried out by municipal,
non-profit, and business actors, but also incorporated the perspectives of community
leaders into the creation of a more comprehensive vision for regional sustainable
development. This vision was built on the scaffold of the Community Capital Framework,
but ultimately attempts to reflect the most important long-term goals for the region that
correspond to the six forms of community capital but remain rooted in local research and
values. The ultimate outcome of this process, which I describe below, is the Common
Vision, which outlines a list of planning goals that guide the Balance Sheet and later
components of the study.
Pre-existing Visions
This common vision was constructed during three phases. First, I drew an initial
set of priorities from locally created projects that have articulated a vision for regional
sustainable development. This set of pre-existing visions was the starting point of the
Common Vision. The priorities that emerged from the analysis of these documents
intended not to incorporate the full breadth of local visions for sustainability, but to
58
demonstrate the diversity of organizational and ideological standpoints that comprise the
existing visions for Greater New Orleans. These visioning projects intended to represent
a wide array of community voices, including a major planning document put forward by
the municipal government, a community report organized by a local non-profit
organization, the community impact model used by a sustainable enterprise, and a
series of reports generated by a regional organization dedicated to economic
development. This small sample of local visions is intended to serve as a foundation
upon which to create a more community-driven articulation of a regional vision of
sustainability. From these documents, I drew out a series of issues and priorities and
compared these visions in terms of their priorities, level of community participation,
recommended changes, and comprehensiveness. I verified the analysis of these
documents at the collaborative workshop in October 2012, gathering community
feedback on the contribution of these projects to a comprehensive regional vision.
Stakeholder Visions
Second, I identified the visions for regional sustainability that emerged from
stakeholder perspectives. In order to achieve a measure of community participation and
fulfill the process objective of collaborative research that guides this study, an in-depth
analysis was conducted of the imagined future visions for the region held by
sustainability entrepreneurs and community leaders. To that end, I analyzed the
interviews of stakeholders by discerning the vision for a future region that each individual
articulated, comparing the emergent themes of their perspectives. Each of these
priorities, and the larger stakeholder visions into which I organized them, represents a
distinct desired future state for the region. These priorities and visions were analyzed in
terms of the extent to which stakeholders expressed a desire for them, the
organizational backgrounds of these stakeholders, the extent to which they aligned with
different forms of community capital, and how comprehensive they were in terms of the
six capitals. There were a number of emergent stakeholder visions that were not widely
supported by the various stakeholders, which I incorporated into larger visions that had
similar themes as these smaller visions.
59
Community Capital Vision
Finally, I integrated these priorities and goals into the Community Capital
Framework. This list included several dozen issues from documents, 42 stakeholder
priorities, and hundreds of emergent themes, which were integrated into the framework
by relying both on the 20 stocks of community capital and on a series of basic
requirements from the Community Capital Tool (CC Scan, 2013). For example, one of
the most salient priorities expressed by stakeholders was that of restoring the damaged
coastal wetland ecosystem, which corresponded with a goal in the New Orleans Index
and were merged through the basic requirement to “eliminate soil erosion or instability”,
within the Soil stock of natural capital. This process rendered preliminary requirements,
such as the goal that, from the aforementioned example, that “the greater New Orleans
region is reversing the disappearance of the coastal wetland ecosystem and restoring
the function and health of the coast”. The last phase was a final community review of
these composite goals that rendered commentary about how to better contextualize
these goals for community relevance.
Common Vision
Finally, all of these elements were rendered into the long-term goals that
comprise the requirements of the Common Vision. Overall, the Common Vision rendered
66 long-term goals, blending the three layers of pre-existing, stakeholder, and
community capital visions into a set of goals for regional sustainable development meant
to capture all of these priorities. I also assessed the extent to which these goals were
supported by a process of community validation, drawing on both interview and
workshop input, to show the extent to which the goals as a whole were supported by
stakeholder input, and how much stakeholders had validated individual requirements.
3.3.2. Measuring Empirical Sustainability through the Balance Sheet
The second major phase of the methodology was the construction of the
Sustainable Region Balance Sheet. The design of the Balance Sheet was the
methodological phase with the most established body of previous use and application.
The starting place of the Greater New Orleans Balance Sheet was the list of long-term
60
goals identified in the Common Vision for the region from the previous section, and it
concluded in the second component of the New Orleans Model: the Sustainable Region
Balance Sheet. For a full discussion of the Balance Sheet methodology and its
application in Greater New Orleans, please refer to Appendix E and Section 5.
3.3.3. Assessing the Role of Sustainability Entrepreneurship in Regional Development
The final phase of the project was an assessment of the impact of SE on regional
development goals. This phase of the project was rooted entirely in the perspectives of
local entrepreneurs, and is the most qualitative portion of the project. The first
component of this assessment was the creation of a typology of sustainability
entrepreneurship as represented by the 18 stakeholders consulted during interviews.
This typology represented their goals and objectives in terms of the community impact
they hoped to make, which were organized into emergent themes and analyzed across
different kinds of entrepreneurs. I compared and contrasted the intended impacts of
these entrepreneur groups, including non-profit, private, and public sector actors, as well
as actors taking more of a hybrid role, and compared how widely their goals ranged from
the narrowest goals, such as purely profit-motivated, to the most community-oriented
objectives with multiple goals for community benefit. This typology also showed how the
entrepreneurs’ emergent themes corresponded to the requirements articulated in the
Common Vision and Balance Sheet. The Community Capital Scan (CCS) was used to
represent these intended and perceived impacts visually.
The second part of the SE assessment was an assessment of the perceived
impacts of sustainability entrepreneurs. The perceived impacts were gauged first by
comparing the goals of entrepreneurs to how well they believed to be achieving these
goals, which I compared qualitatively and quantitatively using the Community Capital
Scan. The second step in gauging the perceived impacts of SE was a cross-evaluation
of the SE movement. I asked stakeholders to what extent they believed the broader
network of sustainability leaders was impacting the region. Next, the major emergent
themes were coded into the requirements of the Balance Sheet and represented in the
CCS to represent how the SE network intended to improve community capital and how
these entrepreneurs perceived that impact. Finally, I collected the categories of
61
sustainability entrepreneurs mentioned in interviews and compared the kinds of
community impacts that they were described as having.
The final element was an analysis of the role that LifeCity plays in the SE
movement. I asked entrepreneurs, some of which were representatives of certified green
businesses and other organizations certified by LifeCity’s organizational sustainability
rating system, and some of which were not affiliated with the company, what impacts
they perceived LifeCity as having on regional sustainability and the SE network. These
responses rendered themes that I coded in terms of the kind of actors that LifeCity was
perceived to support and in which kinds of supporting activities, and related to
requirements of the Common Vision. These supporting functions were compared to the
guiding principles of the company, which it has articulated to me, and the perceived level
of community impact was compared across members of the LifeCity certification network
and non-members, and across non-profit and private sector stakeholders.
3.4. Final Project Delivery
The final step of this project is the transfer of its findings to community actors in
the region in order to ensure that the project can be applied in a relevant way to the
continual search for initiatives to plan and implement sustainable regional development
in New Orleans. Throughout the study, preliminary results and drafts of the various
elements of the project have been made available for community review through the in-
person channel of the workshop, and through numerous online opportunities for public
comment. At the conclusion of the study, all results will be made publicly available in a
format that stakeholders and the broader community can access. Ideally, this final
delivery will consist of a presentation made to the broader community in a publicly
accessible and inclusive venue where a discussion can take place about its findings,
relevance, and options for local actors and agencies to take action to put its findings to
use. The ultimate goal of this study is to make all findings available to local
organizations, agencies, and community members in hopes that they can be used, either
in whole or in part, to raise awareness among sustainability entrepreneurs, local
policymakers, and the broader community about regional sustainability efforts and,

62
ideally, highlight new opportunities for improving the impacts of various actors on the
community.
63
4. A Common Vision of Regional Sustainable Development in Greater New Orleans
I will now show the findings of the project, which begin with a Common Vision to
guide sustainable development in Greater New Orleans. Identifying this vision is
necessary because in order to measure progress towards sustainable community
development in the region, or to understand the intended impacts of sustainability
entrepreneurship on that process, it is necessary to understand the end goal towards
which progress should be measured. In this section, I have blended regional priorities
from local planning and policy documents from a variety of organizations, the goals of
local residents who are leaders in a range of community and sustainability issues, and
the Community Capital Tool. Together, these priorities comprise an initial attempt at
creating a truly comprehensive outlook for regional SCD. The Common Vision is not
meant to represent the goals and interests of all residents of GNO; that audacious task
must be initiated by a collective community effort. Instead, this vision shows a basic
template how such a comprehensive process could be built in the future.
The Common Vision is the product of an integrative synthesis that begins with
the vague concept of a sustainable region and ends with a list of long-term goals that
aspires to be as comprehensive and representative as possible. The Common Vision
was created in three steps. First, I reviewed four local planning and policy documents
which each offer a distinct outlook for the region. Second, I reported on the qualitative
exploratory research process undertaken with 18 local stakeholders who maintain
professional roles in various domains of community capital, and many of which are
considered sustainability entrepreneurs in their communities. The perspectives of these
stakeholders are integrated into a qualitative analysis that generated a series of 42
stakeholder priorities in seven broader visions for a sustainable region. Finally, I
integrated these elements into the Community Capital Framework. The outcome is 66
long-term goals, or requirements, which also form the cornerstone of the Sustainable
64
Region Balance Sheet, which is the second major outcome of this study. In the following
sections, I will review these three processes.
4.1. Pre-existing Visions
There has been a great amount of debate about how to resolve the region’s
numerous social, environmental, political, and economic challenges. Especially in the
post-Katrina era, a multitude of initiatives have tried to identify a future vision for Greater
New Orleans. Many efforts have taken place on the community, governmental, private
sector, and academic levels, producing a multitude of outlooks that chart the way to a
better region. These visions stand on the shoulders of the recovery plans discussed in
Section 2, but expand the focus from the question of post-hurricane recovery to the long-
term path to improving Greater New Orleans. Though a multitude of these documents
exist, I have chosen four that intend to represent a variety of ideological and
organizational orientations. In the following section, I will analyze the visions described in
the New Orleans Index of the Greater New Orleans Community Data Center, the City
Planning Commission’s Master Plan, GNOInc.’s New Orleans at the Inflection Point, and
the Impact Economy introduced by LifeCity.
4.1.1. The New Orleans Index
The first local vision that is included is the New Orleans Index. Organized by the
Greater New Orleans Community Data Center (GNOCDC), a local non-profit
organization that increases the public accessibility of local data and research, the New
Orleans Index consists of a set of indicators on regional well-being measuring economic
growth, inclusion, quality of life, and sustainability (Plyer & Ortiz, 2011). The first New
Orleans Index was published in 2007 in conjunction with the Brookings Institute,
presenting recovery data in hopes of serving as a “go-to resource for national and local
media, decision-makers across all levels of government, researchers, and leaders in the
private sector and non-profit community” on post-Katrina recovery (Plyer & Ortiz, 2011,
p. 4). In 2010, the Index was updated to consider not only recovery but also “to assess
the remaking of a great American city” (Plyer & Ortiz, 2011, p. 4). The Index is intended
to contribute to an ongoing effort of monitoring of the region’s progress (Plyer & Ortiz,
65
2011). This report relies on 20 indicators across four themes of economic growth,
inclusion, quality of life, and sustainability.
The New Orleans Index at Six, published in 2011, is based on the theme of
resilience in the face of disaster. It frames the six-year anniversary of Katrina as a time
of opportunity, reminding that “there are cases where regions hit by disasters broke from
their historical path when residents and leaders used the interruption in the status quo to
transform key institutions” (Plyer & Ortiz, 2011, p. 6). In light of this opportunity, the
report uses recent data to show how 20 indicators, ranging from school performance to
air quality, reflect the region’s renewal (Plyer & Ortiz, 2011). This progress is also
measured against benchmarks selected from various sources, at times using national
averages and, when possible, showing the average of a group of 57 cities with aging
industry and infrastructure (Plyer & Ortiz, 2011). The report offers these indicators as a
verification of the extent to which the region has broken from its historical path. Refer to
Table 3 for a full list of indicators.
The New Orleans Index reveals several key findings and recommendations. The
authors are optimistic about reforms in public education, housing, health care, and
criminal justice systems and show how a wide array of indicators, such as college
educational attainment and violent crime rates, have reflected considerable progress
(Plyer & Ortiz, 2011). They also call for greater economic diversification, with a heavy
emphasis on new “knowledge-based” sectors while maintaining a role for legacy sectors
(Plyer & Ortiz, 2011). The report places hope in entrepreneurship and its ability to
provide workforce training (Plyer & Ortiz, 2011). However, the Index highlights several
alarming trends, such as the increase in income inequality and the disappearance of
coastal wetlands (Plyer & Ortiz, 2011). In the area of resilience and flood risk, the
authors call for government funding of coastal restoration, as well as implementation of
effective storm water management practices derived from Dutch models (Plyer & Ortiz,
2011).
4.1.2. New Orleans 2030
The next of the pre-existing visions is the Master Plan for Orleans Parish. The
City Planning Commission published the plan, titled New Orleans 2030: Plan for the 21st
66
Century, which was adopted into bylaw in August 2010. New Orleans 2030 replaces the
outdated New Century New Orleans Master Plan from 1990 as the city’s official planning
document (City of New Orleans, 2010). The plan frames the identity of the city as one of
a persistent community in the face of hardship, in which residents and the municipality
must now enter the uncharted territory of revitalizing a city almost destroyed by natural
and social disasters. The plan also locates itself within New Orleans’ planning context,
describing the weakness of the planning process pre-Katrina, the turbulent flurry of
planning proposals and conflict in the storm’s aftermath, and the current need to initiate
a participatory and effective planning process (City of New Orleans, 2010).
In order to respond to this need, the plan articulates a clear blueprint that
represents the input of citizens and the municipality’s aspirations. The Master Plan
achieved a high level of citizen participation in its design, reflected in a long description
of its community participation process which involved over 5,000 residents. In chapters
on issues such as housing, environment, human services, and other planning
categories, citizen input has been included in hundreds of comments. Each chapter also
includes dozens of strategies and actions at varying levels of specificity and short,
medium, and long-term timescales. One of the key foci of New Orleans 2030 is a land
use pattern that optimizes the city’s vast stock of vacant and blighted land, envisioned
vividly in a series of artistic renderings of future streetscapes. To the benefit of this
vision, the land use plan now bears the force of law due to an amendment of the New
Orleans Charter, the city’s foundational legal document, and for its recommendation to
overhaul the city’s outdated Comprehensive Zoning Ordinance (City of New Orleans,
2010). New Orleans 2030 offers an integrated vision for the city. This vision, based in
the three principles of livability, opportunity, and sustainability, calls for a New Orleans
that maintains its unique cultural identity but solves its deep-seated problems across
social, ecological, spatial, infrastructural, political, and economic dimensions (City of
New Orleans, 2010).
Each of the three pillars of the New Orleans 2030 vision has several key priorities
and a long list of proposed strategies and actions for achieving them. In the livability
vision, the Master Plan calls for creating vibrant neighbourhoods through actions blight
eradication and walkable, mixed-use corridors. Livability is also conceived of as historic
and cultural preservation in neighbourhood scales, strengthening new transit-oriented
67
neighbourhood centres and greenways (City of New Orleans, 2010). The Master Plan’s
second pillar is the vision for opportunity. This vision focuses mostly on economic and
workforce development, calling for prosperity and an “entrepreneurial edge”, job training
to meet the demands of the workforce, a dynamic small business base, and a
strengthened 24-hour downtown (City of New Orleans, 2010). The third component is
sustainability. This vision plays on the theme of resilience based in multiple lines of
defence against flood risk, integrated storm water management, and climate action (City
of New Orleans, 2010). This vision also calls for transportation choice, citizen efforts to
create a green city, and high-quality services and facilities. The final component of the
Master Plan’s vision calls for partnerships between citizens, businesses, public
institutions, housing authorities, and non-profit organizations to “shape a shared destiny”
(City of New Orleans, 2010, p. 3). For a full list of the priorities of New Orleans 2030,
refer to Table 3.
4.1.3. Greater New Orleans at the Inflection Point
The third vision for regional development is known as Greater New Orleans at
the Inflection Point. This outlook emerged from GNOInc., an organization which supports
economic development opportunities in New Orleans. The vision which GNOInc.
proposes is based on a memorandum that the organization published in 2011 titled
“Greater New Orleans at the Inflection Point”. This short document sketches a vision of a
region where economic growth and innovation spur a fast ascent out of recovery and
into prosperity. The organization makes the case that the region’s outlook is “at an
‘inflection point’—on the brink of rapid acceleration in a number of key areas” (GNOInc.,
2011, p. 1). This metaphor describes a region standing at a crossroads where, after
traversing decades of economic stagnation and the calamity of Katrina, now has the
chance to make a radical divergence into unprecedented growth and prosperity
(GNOInc., 2011). Throughout the document, the authors refer to a handful of national
polls and rankings from business magazines such as Forbes to show how New Orleans
is perceived by the business community. It creates an optimistic and excited tone of
regional progress while serenading the reader with numerous figures about new jobs
created, contracts sealed, investment dollars attracted, and rankings given to the region
(GNOInc., 2011).
68
This optimistic vision heralds four specific inflection points that are presented as
the sources of the region’s future growth and prosperity. The first of these is the
entrepreneurial inflection point. The document places great faith in entrepreneurship,
boasting of the remarkably high rate of start-ups which can serve the basis of a local
brand for businesses to market themselves to potential investors (GNOInc., 2011). The
second inflection point is in the area of talent. New Orleans is attributed with becoming a
region of “brain gain”, as opposed to brain drain, whereby “the best and brightest in the
country are now choosing to move—or come back to—New Orleans” (GNOInc., 2011, p.
1). This talent will bring an influx of training and education to the region and continue to
attract skilled individuals to New Orleans. Next, the document speaks of a perception
inflection point, in which national polls and journalism has begun to look favourably on
New Orleans and helped create a positive perception for the region (GNOInc., 2011).
Finally, the opportunity inflection point is occurring in the area of business development,
where new sectors such as advanced manufacturing and biomedical services present
great opportunities for new investment (GNOInc., 2011). Across these four inflection
points, seven key priorities emerge. These are entrepreneurship, innovation, brain gain,
reinvigorated business climate, job growth, business development, and regional
comeback.
4.1.4. Impact Economy
The final pre-existing vision is that of the Impact Economy. The idea of the
Impact Economy is the guiding principle of the sustainability entrepreneur LifeCity, which
is a for-profit company that certifies green businesses but also works towards various
advocacy and community-building initiatives to further the region’s broader sustainability
movement. The end goal of LifeCity is a city characterized by what the enterprise calls
the Impact Economy (LifeCity, 2013). This idea envisions a city in which businesses and
organizations are equally dedicated to ensuring positive social and ecological impacts as
they are to ensuring an economic impact and financial viability (LifeCity, 2013). LifeCity
is dedicated to the idea that every business can be a green business, and its vision for a
sustainable region is rooted in that ideal. The Impact Economy foresees a region in
which businesses and other organizations contribute positively to the environmental,
social, and economic well-being of the community, residents become conscious
69
consumers and support sustainable businesses, and policymakers provide legislative
support to this process (LifeCity, 2013).
The Impact Economy vision is comprised of eight principles. The first principle
calls for an economy that strengthens health in a holistic conception of physical, spiritual,
and mental well-being (LifeCity, 2013). The next principle is that businesses are non-
toxic and the community is reducing toxic contamination of ecological systems; this
value is related to the value that businesses make an investment in ecology to
strengthen ecological health (LifeCity, 2013). Two related principles are design, which
describe institutions and businesses that “reflect intentional organization” for better
outcomes, and efficiency, which describes the optimization of material throughput of
businesses (LifeCity, 2013). A related goal is that business practices rely on renewable
resources and increase recycling (LifeCity, 2013). Additionally, businesses should
become leaders of education and instilling greater understanding of sustainability in the
community in the future Impact Economy (LifeCity, 2013). Finally, all business activities
should respect the need for equity, both between members of the community and
between present and future generations (LifeCity, 2013).
4.1.5. Lessons from Pre-existing Visions
These four visions for regional development offer a diverse collection of priorities
for Greater New Orleans. They offer a broad range of ideals for the region, where New
Orleans stands on the path to realizing it, and which goals must be achieved in order to
progress. Their main variations are reflected in their organizational and ideological
backgrounds. Each document was highly influenced by the kind of organization which
authored it; for example, the themes of New Orleans 2030 are governed by planning
categories that follow the bureaucratic structure of municipal government (housing,
human services, land use, etc.), while the Impact Economy vision’s authorship by a
business lends a central focus on how the private sector can strengthen a sustainable
region. The other key distinction between these documents is their guiding ideologies.
The ideals guiding these visions remain highly consistent with these ideological
foundations, giving the Inflection Point vision a consistent neoliberal agenda with a focus
on export-oriented development, and the New Orleans Index a focus on resilience and
equity deriving from the goals of the organization. Though these four ideological
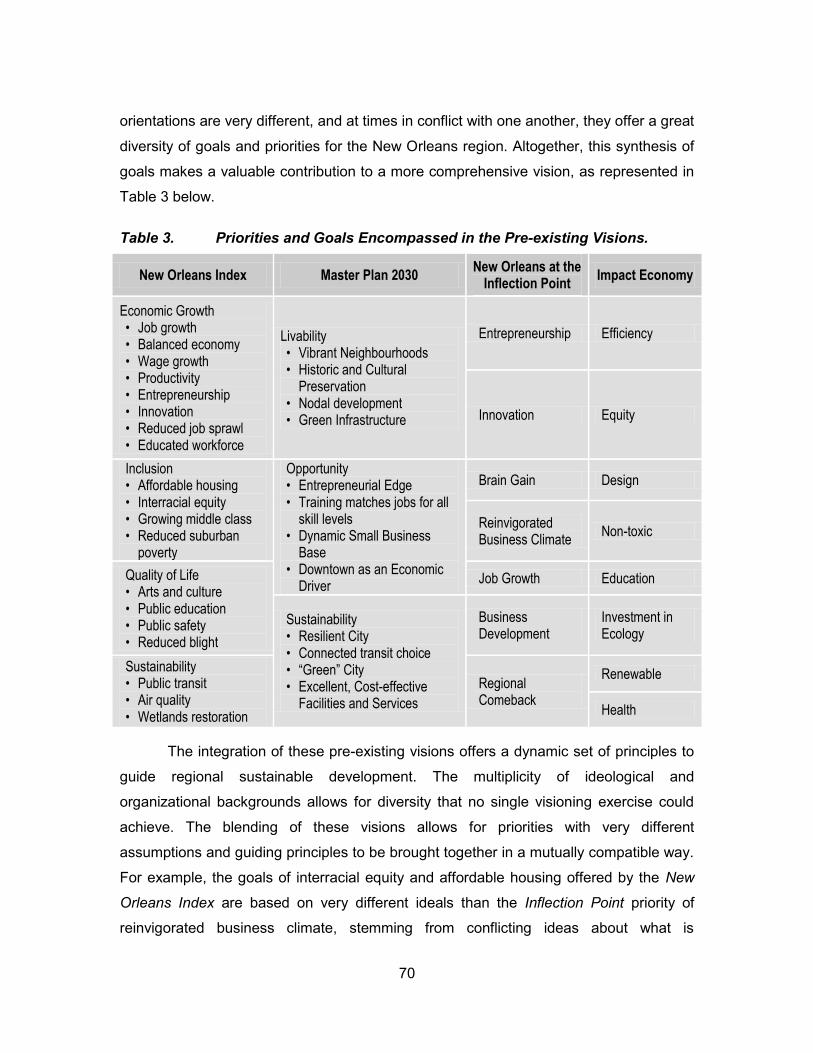
70
orientations are very different, and at times in conflict with one another, they offer a great
diversity of goals and priorities for the New Orleans region. Altogether, this synthesis of
goals makes a valuable contribution to a more comprehensive vision, as represented in
Table 3 below.
Table 3. Priorities and Goals Encompassed in the Pre-existing Visions.
New Orleans Index Master Plan 2030 New Orleans at the
Inflection Point Impact Economy
Economic Growth • Job growth • Balanced economy • Wage growth • Productivity • Entrepreneurship • Innovation • Reduced job sprawl • Educated workforce
Livability • Vibrant Neighbourhoods • Historic and Cultural
Preservation • Nodal development • Green Infrastructure
Entrepreneurship Efficiency
Innovation Equity
Inclusion • Affordable housing • Interracial equity • Growing middle class • Reduced suburban
poverty
Opportunity • Entrepreneurial Edge • Training matches jobs for all
skill levels • Dynamic Small Business
Base • Downtown as an Economic
Driver
Brain Gain Design
Reinvigorated Business Climate
Non-toxic
Quality of Life • Arts and culture • Public education • Public safety • Reduced blight
Job Growth Education
Sustainability • Resilient City • Connected transit choice • “Green” City • Excellent, Cost-effective
Facilities and Services
Business Development
Investment in Ecology
Sustainability • Public transit • Air quality • Wetlands restoration
Regional Comeback
Renewable
Health
The integration of these pre-existing visions offers a dynamic set of principles to
guide regional sustainable development. The multiplicity of ideological and
organizational backgrounds allows for diversity that no single visioning exercise could
achieve. The blending of these visions allows for priorities with very different
assumptions and guiding principles to be brought together in a mutually compatible way.
For example, the goals of interracial equity and affordable housing offered by the New
Orleans Index are based on very different ideals than the Inflection Point priority of
reinvigorated business climate, stemming from conflicting ideas about what is
71
development, whom it should serve, and which actors are central to attaining it. Though
the neoliberal vision of GNOInc. conflicts with key assumptions of the New Orleans
Index, such as the need for subsidized housing or the reduction of job sprawl across the
region, its ideology need not be adopted in order to consider its regional priorities. This
diversity also allows a more comprehensive set of ideas about who the key actors in
regional sustainable development are and how they advance regional goals. Though the
Impact Economy and the Master Plan have very different foci, their visions can be
compared together to show how both enterprises and municipal agencies can act
together in advancing sustainable development. Finally, these visions offer a diverse
range of goals in terms of the Community Capital Framework, with some documents
considering all six capitals in multiple priorities, such as the New Orleans Index, and
others, such as the Inflection Point, focusing on a smaller number of capitals but giving
great detail on the ways to enhance them. As shown in Table 4 below, the visions
represent a range of comprehensiveness across the six capitals and different amounts
of emphasis that renders a varied sketch of community capital across the region.
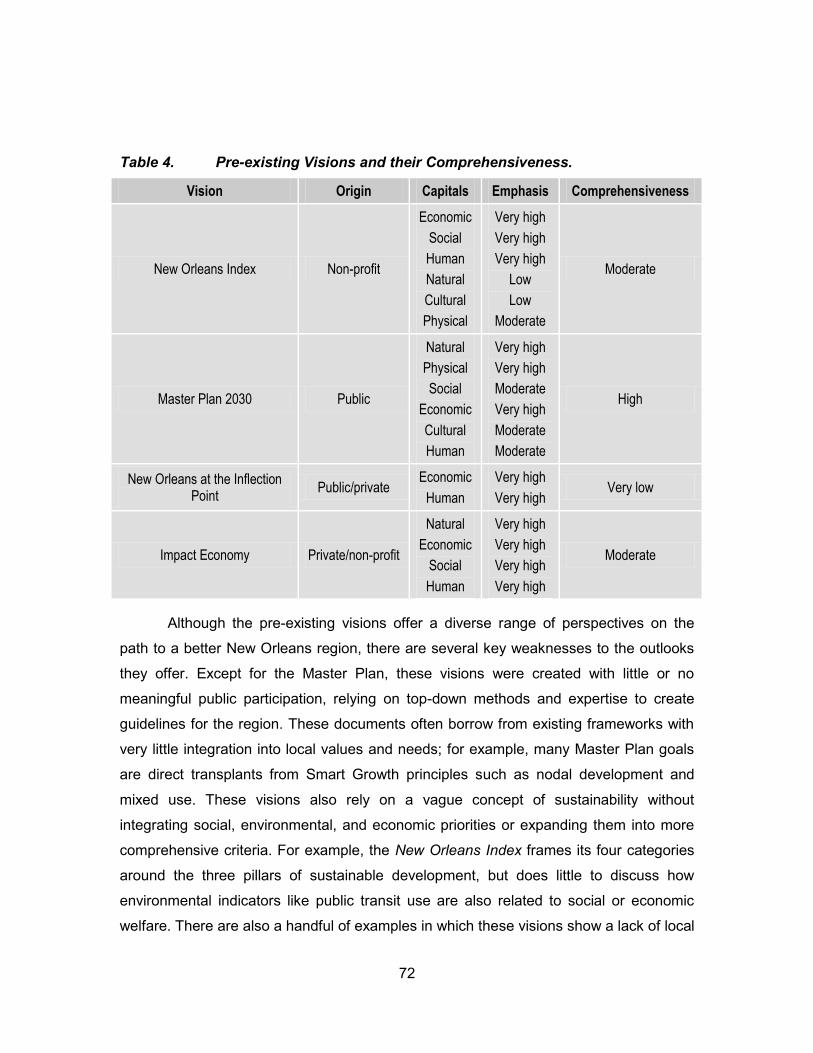
72
Table 4. Pre-existing Visions and their Comprehensiveness.
Vision Origin Capitals Emphasis Comprehensiveness
New Orleans Index Non-profit
Economic
Social
Human
Natural
Cultural
Physical
Very high
Very high
Very high
Low
Low
Moderate
Moderate
Master Plan 2030 Public
Natural
Physical
Social
Economic
Cultural
Human
Very high
Very high
Moderate
Very high
Moderate
Moderate
High
New Orleans at the Inflection Point
Public/private Economic
Human
Very high
Very high Very low
Impact Economy Private/non-profit
Natural
Economic
Social
Human
Very high
Very high
Very high
Very high
Moderate
Although the pre-existing visions offer a diverse range of perspectives on the
path to a better New Orleans region, there are several key weaknesses to the outlooks
they offer. Except for the Master Plan, these visions were created with little or no
meaningful public participation, relying on top-down methods and expertise to create
guidelines for the region. These documents often borrow from existing frameworks with
very little integration into local values and needs; for example, many Master Plan goals
are direct transplants from Smart Growth principles such as nodal development and
mixed use. These visions also rely on a vague concept of sustainability without
integrating social, environmental, and economic priorities or expanding them into more
comprehensive criteria. For example, the New Orleans Index frames its four categories
around the three pillars of sustainable development, but does little to discuss how
environmental indicators like public transit use are also related to social or economic
welfare. There are also a handful of examples in which these visions show a lack of local
73
relevance and, at times, accuracy. For example, the New Orleans Index makes some
dubious statements about high-growth “new sectors”, such as oil spill remediation and
legal services, which are more appropriately considered defensive expenditures in
response to the BP oil spill, not signs of progress. Additionally, New Orleans 2030 is
peppered with sleek visual representations of the ideal city, but some of these
streetscapes reflect a futuristic image of New Orleans that seems anachronistic against
the present-day backdrop and most likely were not assessed for cultural
appropriateness. Finally, the pre-existing visions focus on New Orleans’ domains of
community capital very unevenly, paying great attention to natural, physical, and
economic capital, but giving less attention to social, human, and cultural capital, as
represented in Table 4.
In conclusion, these documents offer a fairly broad variety of visions for regional
development and the various organizational and ideological orientations they represent.
Each takes a different approach and strikes a different balance between the different
forms of community capital in their outlooks for a better region. However, this portrait is
still incomplete, for it only includes the brushstrokes that have already been applied to
the canvas of the region’s future by a small group of interests. What is needed now is a
dialogue with local residents who can breathe life into these visions and enrich them with
the concerns of the present day and the perspectives that each of these individuals has
gained from their experience in various areas of community leadership.
4.2. Stakeholder Visions
The visions for sustainable development in Greater New Orleans that emerge
from stakeholder interviews are a diverse and detailed portrait of the region. After
interviewing with 18 residents who stand out in their communities for leadership in
sustainability and other community issues ranging from food security to architecture, I
discerned the following group of future outlooks for the region. When asked what their
vision of an ideal New Orleans would be, these stakeholders described 18 different
regions that were remarkably varied and, at times, in direct conflict with each other.
Specifically, these stakeholders pointed to 42 priorities that they considered important in
the attainment of a sustainable region, encompassed in seven broad vision archetypes.
74
4.2.1. Healing and Learning
The most salient theme that appeared in stakeholder interviews was that of
Healing and Learning. This vision focused on the social and cultural wounds in the
region and how multiple approaches, from public education to the sharing of food,
should be strengthened to heal them. Stakeholders envisioned a region with greater
trust between citizens and more equity between communities, as well as adequate
services, especially decent and equitable education. In this vision, sustainability needs to
become more relevant to the plight of marginalized communities and find ways to
translate environmental concerns into pathways to empowerment.
One of the most common themes in the Healing and Learning vision were the
linked concepts of trust and equity. Numerous stakeholders characterized New Orleans’
communities as divided by deep socio-economic rifts, leading to injustice and disunity.
These individuals spoke of a need to break down cultural and racial barriers and
deconstruct stereotypes of low-income neighbourhoods. Many stakeholders explained
crime as a result of lack of trust and racial inequities, which could be addressed by
sharing and trust building. Many stakeholders expressed a desire to reduce these
barriers through initiatives such as local food markets and community gardening. One
stakeholder, a Caucasian resident living in the Lower Ninth Ward, recounted a telling
incident.
"The lady across the street had told her cousin ‘You don’t need to be over there at his garden’…and the guy said ‘Why’s that?’, and she said ‘’cuz white people have all the money.’ And, you know, we had talked quite a few times by then, and his response that he told me to her was ‘He’s no whiter than you or I’ (Anonymous, personal communication, August 21, 2012).
This topic also relates to another theme that focused on the need for equitable
services between communities. Stakeholders explained the great lack of public facilities
and services in minority neighbourhoods, and the equity issues that have arisen with the
pattern of rebuilding efforts. This theme was elaborated on by descriptions of deplorable
infrastructure in neighbourhoods such as the Lower Ninth Ward, and the potential
impacts of recent infill development and transit expansion on low-income residents.
"why wasn’t the wall (Industrial Canal Levee) built to proper standards? Why did we have nine schools before Katrina, and now we have one charter school and
75
very few, if any, of our kids even go there...why can’t we get a community center back? Why don’t we have an actual police station? Why don’t we have an actual fire station? Why don’t we have a grocery store?" (Anonymous, personal communication, August 21, 2012).
By far one of the most salient themes within this vision was that of education.
Stakeholders repeatedly cited wide opportunity gaps between socio-economic groups of
students and the need for an educational system that meets the needs of all children
and adults. Local leaders in education expressed the need for more multidisciplinary,
hands-on educational opportunities for children to help them find a purpose in life and a
calling that they can pursue. The advent of charter schools, which now privately operate
the majority of New Orleans public schools, was described as both a salvation for
schoolchildren and a source of further segregation. Some stakeholders placed hope in
the charter schools, explaining that they are helping parents and children to finally
perceive that the system cares about their children's education. One stakeholder, a
public educator, explained that:
"people think someone cares about their kids’ education and maybe that gives them a better buy-in into their education. Maybe if people are saying “Wow, we have teachers from all over the world coming here to teach our kids! What better school is there than this?" Then they have pride in their community. They feel a part of it in a way. They feel like someone cares about them and their children" (Anonymous, personal communication, February 10, 2013).
4.2.2. Ecocity
Another salient vision was that of New Orleans as an Ecocity. Many participants
expressed desire for a more sustainable region, characterized by a more holistic
relationship with the ecosystem and urban systems designed with sustainable principles.
New Orleans as an Ecocity is also placed into context of the renewal process, where
ecological resilience is enhanced while also delivering social and economic benefits. In
this vision, sustainability becomes democratized to be accessible to all communities and
sensitive to local culture and needs. One stakeholder characterized this vision in the
following way: "My interest in all this is, given all the heartache and pain of Katrina, the
opportunity is for New Orleans to be known as a sustainable region, a green region
that’s economically, socially viable" (Anonymous, personal communication, August 16,
2012).
76
Stakeholders envisioned a community in which citizens were engaged in
sustainable living and green initiatives balance environmental, economic, and social
viability. This vision is based on a new relationship with the ecosystem, in which the city
is more integrated with the Mississippi River, industrial space is converted to parks, and
recreational and educational activities reconnect people to nature. Another theme was
the restoration of ecosystems. Stakeholders expressed a need to rehabilitate swamps,
marshes, and the Gulf Coast in light of erosion, the BP oil spill, and other impacts. One
stakeholder, who has long been involved in sustainability efforts in the Lower Ninth
Ward, explained how "the neighborhood, in its vision for sustainability…talked about—
“it’s not good enough just to work on the built environment, we need to restore the
natural environment” (Anonymous, personal communication, August 12, 2012).
The restoration of the coastal wetlands takes precedence above the other
ecological priorities in the Ecocity vision. Stakeholders confirmed that coastal restoration
is essential to the region’s survival and call for public awareness about wetlands loss
and restoration as well as strong political support of restoration efforts through the
Restore Act and other initiatives. This stakeholder emphatically expressed that "if we
don’t protect the coastal wetlands, New Orleans won’t be here…in another 100 years.
So that’s a real high priority" (Anonymous, personal communication, August 6, 2012).
The Ecocity vision also placed sustainability in the context of post-Katrina
renewal and recovery. Stakeholders explained how the crises of Katrina and recent
years could be turned into a chance for renewal in a sustainable manner. This vision
sought to reconcile the goals of neighbourhood rebuilding, sustainability, and the
realities of environmental vulnerability and poverty. However, the proponents of this
vision expressed multiple challenges, such as those explained by this participant. "The
Lower Ninth Ward is trying to figure out, how do you rebuild a neighborhood that’s been
flooded, sustainably, without any money?" (Anonymous, personal communication,
August 12, 2012).
Realities such as these imply the need for sustainability initiatives to remain
sensitive to local values and needs. Green technologies and projects should advance
equity and justice, balance environmental goals with historic preservation and cultural
values, and reduce the tense atmosphere created by land use questions in the Katrina
77
aftermath. Emergent themes included the need for poor communities to be leaders who
increase the visibility of the environmental movement, and the ability of historic
neighbourhoods like the Lower Ninth Ward to incorporate environmentally friendly
building technologies while preserving architectural integrity. Stakeholders also
expressed the need for sustainable systems, such as the local food movement, to be in
tune with the food access needs of the people and reduce vacant land in the city.
4.2.3. Entrepreneurship and Growth
Another salient vision for the region is that of Entrepreneurship and Growth. The
central value of this vision is attracting investment and talent to the region by
strengthening entrepreneurship. Though principally occupied with economic concerns,
this vision embraces environmental sustainability insomuch as it expands the platform of
business opportunities for the region and encourages the attraction of new green sectors
such as renewable energy. Sustainability serves economic and practical interests,
allowing business to capitalize on the environmental assets of the region and use green
business as a new brand for New Orleans to market to the world.
In the Entrepreneurship and Growth vision, there is a lively spirit of comeback
and renaissance with which stakeholders describe the region. Stakeholders refer to the
post-Katrina period as a rebirth of the city, in which the increased attention from national
and international observers has led to a general sense of improvement and progress. In
the words of one participant:
“Over the last year or two, this city…has been probably the most marketable city in the country, really…since Katrina, people have had an eye on New Orleans…you hear it all the time, the city’s in a renaissance…we’re back. We’re not…still reeling over Katrina, we’re back and we’re improving (Anonymous, personal communication, August 12, 2012).
One of the most salient themes in this vision is that of entrepreneurship.
Stakeholders repeatedly described New Orleans as a city of entrepreneurs, making
great strides by attracting talented young people who can invigorate the economic
landscape. The region’s new reputation for entrepreneurship is changing its perception
nationwide. One individual, herself an entrepreneur, even stated that “this [New Orleans]
is being projected as being the entrepreneur capital…of not only the state but actually
78
the entire...nation” (Anonymous, personal communication, August 10, 2012). This new
role is not only changing the external perception of New Orleans but also affects
communities. Entrepreneurship was often associated with the “roll-up-your-sleeves
mentality” of New Orleanians who, having long been used to government inaction and
neglect, recognize the need to create their own solutions to problems and unleash great
creativity in the process.
In addition to meeting local needs, entrepreneurs also were described as a
promising source of economic diversification. Many participants believed the region
should maintain the position of the three legacy sectors while also simultaneously
strengthen new "knowledge-based" sectors. Despite a general faith in the existing
economic system, some proponents of Entrepreneurship and Growth also believed that
environmental sustainability had a strong role to play in a competitive New Orleans.
Most of these stakeholders incorporated the idea of a sustainable city seamlessly into
the export-oriented neoliberal vision they described. In this image, interest in
sustainability derived from the ability to improve New Orleans’ reputation and market the
region to potential investors and high-skilled job seekers. Although a handful of
participants acknowledged that the environmental improvement of the city was important
for ecological reasons, it was much more common for it to be justified with economic or
pragmatic concerns. This stakeholder believed that:
“it’s creative people trying to connect dots and create a mass, a density, so you can get to that tipping point so you become known as [a sustainable region]. And my interest in that, if we became known as that, a), we would be a green community, and then b), we would have a product that we could export, sell to others internationally” (Anonymous, personal communication, August 16, 2012).
There was a consistent belief that environmental innovation and values are not
native to New Orleans, but imported from more sustainable regions when needed. The
reputation of the region as perceived by external agents is a mirror against which the
region should appraise itself. This reputation would be built by modeling the efforts made
by companies from other states who have marketed their regional sustainability to
external actors, creating a citywide green business brand, and employing effective green
solutions in New Orleans wherever they worked.
79
4.2.4. Water Steward
A starkly different regional vision is offered in the idea of New Orleans as a water
steward. This vision seeks to reinvent the physical and cultural landscape of the region
by integrating aquatic environments into the heart of community life. Proponents of
Water Steward highlight the inherent unsustainability of current storm water and coastal
management practices and seek to reshape the region with ecosystem principles to
allow water to not only flow through communities, but recreate them with linkages
between people and water ranging from recreation to education and employment. A
region in keeping with this vision would become more resilient in the face of climate
change and hydrological stresses, while at the same time restoring a deep cultural
connection between communities and water. This vision is encapsulated in the words of
this stakeholder:
"I see...a lot more water in the city and that provides for storage of water in the city which means that when it rains a) we don’t use as much energy but we don’t have as much flooding. People are more accepting of water and more people can swim, more people have boats, and...for people to accept that we’re a coastal city and we’re below sea level, and we’re going to flood and we need to figure out how to deal with that…so it’s storm water management but it’s something that will make the city more resilient and finally to be able to survive" (Anonymous, personal communication, August 7, 2012).
A major theme of the Water Steward vision is a new cultural and physical
connection with public water spaces. This theme calls for New Orleanians to accept
water and integrate aquatic spaces into everyday life. Stakeholders mentioned the
engrained societal fear that many residents have towards water and municipal water
management policies meant to disconnect communities from water. In response to these
barriers, this vision recommends integrating water into part of the identities of
communities and into the landscape. The key strategy recommended for achieving a
closer relationship to water is integration of water into community spaces and
infrastructure. This theme highlights the need to create a hydrological landscape similar
to the network of natural waterways that existed previous to the development of the city.
Stakeholders described a vision of creating space to store water in the city by restoring
canals and bayous and reversing the municipal policy of concealment of public water
infrastructure by transforming canals into public parks and catchment areas. However,
this vision entails wholesale transformation of many key systems and values, such as a
80
new idea of the role of parks in the landscape, the reduction of mentalities that respond
to water as a risk or a nuisance, and the abandonment of the elaborate pumping system.
One stakeholder, himself involved in integrated storm water management planning,
described this vision:
"it’s...going to require a wholesale reconsideration of what our public landscape looks like...What should the sides of our street…what should our street edges look like?...Should our neutral grounds hold water like Canal Boulevard or is there green ground that may drain water off?...that’s a total reconsideration of "what is public space? What is the role of a park in the landscape?”...in some ways it’s incredibly simply. You create a space for that water to go, and that water isn’t flooding your streets and your homes. So it’s a matter of...looking at the landscape, and creating those spaces for water” (Anonymous, personal communication, August 12, 2012).
Finally, the Water Steward vision foresees a more resilient region with reduced
vulnerability through sustainable water systems. The proponents of Water Steward
speak to the reduced risk of flooding, drastically reduced municipal energy use and
greenhouse gas emissions resulting from decreased volumes of pumped storm water,
and the slowing of subsidence as coinciding benefits of a better water management
system. They laud the remarkable way that a common solution can contribute to
resolving related ecological, social, and infrastructural problems and make the region
more resilient to future flooding and sea level rise from climate change.
4.2.5. Local NOLA
Another salient vision for regional sustainability is called Local NOLA.
Stakeholders described this vision as the ideal of a self-sufficient economy in which
people meet their needs with local goods and services. In this vision, supporting and
celebrating local business can build a strong community, as well as restore waning
industries and bring healing to severed communities. The first theme of the Local Nola
vision is self-sufficiency. This theme sketches a profile of New Orleans as a completely
local economy where people's lifestyle can be sustained while supporting the local
economy. The goal of self-sufficiency envisions keeping money in the local economy
and reducing economic leakage. Stakeholders described how companies both large and
small can make the local economy more viable. One participant, who owns a local food
market, describes that:
81
"We’re here simply to create that community and to provide a service to these local producers and make sure that their products are getting into the hands of local residents, so that ideally, people are getting all their milk, their eggs, their meat, their produce from local farmers and not from somewhere thousands of miles away" (Anonymous, personal communication, August 3, 2012).
Like the focus of this stakeholder, one of the main foci of this vision is centred on
creating a local food system. Participants repeated the need for residents to increase the
local food supply through supporting the market for local food products. This theme
describes how an enhanced local food system can foster new entrepreneurs and meet
local needs as the market grows. However, participants listed many barriers to this goal,
such as inhibiting government regulations, lack of support by consumers, and
unaffordability. Supporters of local food believed that the movement must not be
romanticized as the perfectly sustainable and socially ideal option, but should instead
represent the practices and values of local food producers and consumers.
With food and other sectors, a central focus of the Local Nola vision is the need
to meet the needs of residents locally. This theme calls for markets that ensure that
there is a local company producing all of the goods that are consumed. Stakeholders
expressed a desire for recreation activities such as kayaking to be available in the city in
order to replace services that residents currently must travel hours to reach, and
frustration that there was no locally produced beer after Katrina. This theme also
foresees a region in which localism permeates all areas of life, not only for special
occasions, but for all products and needs. In order to meet people’s needs, local
producers must be in tune with the values and needs of residents. Often, the past was
referred to in which the region was more self-sufficient.
Finally, the Local Nola vision extols the virtue of supporting local business. In
New Orleans, there is an uncommon reverence for locally owned businesses, which are
celebrated even after they shut down. Stakeholders explained how extinct local
businesses are still remembered and reminisced by people years later in local art,
memorabilia, and Mardi Gras parades. However, these local icons are celebrated and
revered but, ironically, reflect the lack of actual support from the community to keep
them alive. One stakeholder described this ironic phenomenon:
82
“I wonder why they [celebrated local businesses] went out of business. If the local support wasn’t enough to keep those companies in business, like K & B, Rosenberg’s, McKenzie’s. Maybe it’s the influx of people who prefer to shop at Wal-Mart Super Center or Sam’s, or places like that. But why do we love these businesses so much, so much that we’ll make jewelry out of them, coasters out of them, artwork for our walls out of them, why couldn’t we keep ‘em alive?" (Anonymous, personal communication, February 10, 2013).
4.2.6. Governance and Ethics
Another common vision is that of Governance and Ethics. This vision calls for
more competent and effective government institutions in order to resolve corruption and
the abuse of public resources. In this vision, stakeholders also highlighted the need to
balance the leisure-based culture of New Orleans with efficient institutions, and the need
for local governments to create a policy platform for sustainability. This stakeholder
confirmed that "the dilemma for New Orleans is to find a culture of less corruption, more
straightforwardness" (Anonymous, personal communication, August 19, 2012).
The importance of more competent governance permeated through the
perspectives of stakeholders. The need to address corruption was often cited as one of
the most important issues for the region. Stakeholders expressed mistrust of
government due to corruption in practices such as building code inspections, public
school budgets and other policies. This theme also addressed problems with inefficient
bureaucratic systems and the need for institutional change in municipal government.
One participant expressed her reflections of the Katrina response period:
“we did learn that you can’t rely on the government to do stuff, whether it’s the federal government, or state government, or city government. So I think there is that—if you want to get something done, you kind of have to create your own mechanism to make it happen, and you have to find the people who are nearest your way of thinking to push forward” (Anonymous, personal communication, August 19, 2012).
Finally, the Governance and Ethics vision recommends a unified policy platform
for sustainability. Stakeholders expressed a need for local governments to enact major
environmental policy changes like in cities with progressive policies, create a
comprehensive recycling service, and enact necessary legislation to strengthen
environmental policies.
83
4.2.7. Somewhere Else
Several stakeholders also illuminated a vision for New Orleans characterized by
comparing the region to other places. This element ran throughout many of the
responses that individuals gave when describing their vision for the region, often used to
compare New Orleans to a city or region that had successfully employed a solution to a
salient local problem. However, this allusion to somewhere else runs deeper than simply
a tactic used for the sake of comparison, suggesting a common tendency for New
Orleanians to look to the outside for ideas of how to improve their region. Therefore, the
final stakeholder vision is called the vision of Somewhere Else.
The tendency to reach to other areas for recommended improvements was very
pervasive in interviews with stakeholders. Effective solutions for a wide range of issues,
such increasing aquatic recreation, brown-field rehabilitation, coastal restoration, and
many other problems were offered by comparing New Orleans to Austin, TX, San
Francisco, CA, Rotterdam, Netherlands, New York, NY, Venice, Italy, and many other
cities. The most commonly referenced somewhere else was the Netherlands, whose
sustainable urban water management systems in cities below sea level were proposed
to local planners and architects after Katrina (Waggoner & Ball Architects, 2013). Many
stakeholders answered the question of their idea of an ideal New Orleans by referring
almost instantly to somewhere else, as was the case with this participant:
"Have you been to Venice? Have you seen pictures of Venice? It’s a combination between Venice, more like Amsterdam actually. So Amsterdam is in a city that’s below sea level, and has canals running all through it and boats, and it’s very packed, it’s a very old city, and very tight. But New Orleans has the land and the ability to make this happen" (Anonymous, personal communication, August 7, 2012).
The other common trait that stakeholders used in referring to somewhere else as
the vision for New Orleans was placing a great role for newcomers from other regions in
creating sustainable change. Multiple stakeholders believed that transplants to New
Orleans are the leaders of a transition to a more sustainable region, characterized by
young driven people coming to New Orleans and bringing their environmental values to
the city. This vision also expressed that locals also have environmental consciousness,
but it is much lower than that of newcomers.
84
"And they [newcomers to the region] are coming here in droves and they’re making their lives here. Especially young people with ambition and drive and lots of energy. With that ambition and drive and energy, they also bring this care for the environment that came with them. They’ve learned that and it was part of their lives as a child in other places…I feel very strongly that this is one really good thing about the rest of the country that has come to New Orleans. A lot of things we don’t want here, like strip malls…but the point is we have this new blood population that is bringing their values to New Orleans" (Anonymous, personal communication, August 7, 2012).
4.2.8. Analyzing Stakeholder Visions
The seven visions expressed by participants portray a wide variety of ideals for
the New Orleans region and priorities for fulfilling them. The perspectives of
stakeholders offer an even more diverse collection of visions for a sustainable region
than the pre-existing visions. The images which they used to describe their idea of a
better New Orleans varied from that of a resilient living system in tune with the
ecosystem to a growing goliath of prosperity and profit, from a scarred social landscape
of severed community to a charred phoenix rising from the ashes of Katrina.
The stakeholder visions have important similarities and differences that must be
considered when integrating them into a common vision. Though the seven overarching
visions that have been described are each distinct, they bear many common threads.
For example, the Ecocity and Water Steward visions are strongly linked by a focus on
sustainable systems and the importance of aquatic ecosystems. Similarly, many of the
values expressed in Healing and Learning were very similar to concepts in Local NOLA,
each drawing on themes of trust and community. There were some surprising
commonalities as well. Visions that may have very little in common, such as
Entrepreneurship and Growth and Ecocity, shared an emphasis on the multiple benefits
of sustainable practices ranging from cost savings to training opportunities. These
similarities allow the broad range of perspectives to be integrated more seamlessly into
a unified vision.
However, many elements of these visions recommend very different paths for
Greater New Orleans. Of the dozens of desired future states that stakeholders
expressed, a handful is so disparate in their goals and assumptions that they conflict
with each other. For example, many proponents of Entrepreneurship and Growth
85
supported maintaining and strengthening the region’s legacy sectors, while the Local
NOLA vision speaks against the export-oriented economic model and seeks local self-
sufficiency. At a higher level, there were ideological differences between the visions
espoused by different individuals. The insistence on equity and justice by many
proponents of the Healing and Learning vision at times clashed with the ideals of
Ecocity, some of which draw from Smart Growth and environmentalist philosophies that
are perceived by many residents as elitist and insensitive to the needs of marginalized
communities. Though many contrasts emerged from these visions, the 42 key priorities
that synthesize the stakeholder visions integrate only the priorities that are compatible
with those from other visions.
4.3. Integrating Visions into the Community Capital Framework
The analysis of the visions for a sustainable New Orleans region from both
planning and policy documents and from stakeholder perspectives has revealed a great
diversity of goals and priorities for a sustainable region. However, the ultimate goal of
this section is to integrate this highly diverse set of ideals into a common outlook for the
region’s path to sustainable development. To that end, I brought together these goals
and priorities into the Community Capital Framework and blended all three into a
Common Vision for Greater New Orleans. Below I describe how these three vision
phases were integrated into a unified portrait of the New Orleans region.
The first step was to supplement the pre-existing visions with enriched detail from
the perspectives of stakeholders. Though many pre-existing visions have much in
common with stakeholder priorities, sometimes with very obvious parallels between
proponents of Ecocity, for example, and recommendations in the Master Plan, the
interviews allowed for the themes introduced by these documents to be drawn out and
enlivened. This comparison showed how insights from the Master Plan could be
enriched by priorities such as the need to democratize sustainability, how the New
Orleans Index could deepen its emphasis on equity by discussing it not only in material
terms but also in the cultural and psychological context of healing communities. The
Inflection Point vision’s contributions of entrepreneurship and brain gain acquired new
86
depth in the perspectives of stakeholders who spoke of the many kinds of entrepreneurs
in New Orleans and how training talented people should occur in high-growth sectors as
well as marginalized neighbourhoods. The Impact Economy ideal was enlivened by
comparisons of New Orleans to other cities where a new relationship between business
and the community had been achieved.
After integrating pre-existing and stakeholder visions, the next phase in creating
a common vision involved channelling these priorities into the Community Capital
Framework. As discussed in Section 2, the Community Capital Tool creates a vision for
sustainable community development based on balance between the six forms of
community capital and the locally created priorities that encompass them at the
community or regional level (Dagevos, 2011). That vision is articulated locally by
identifying long-term goals, or requirements, that represent the top priorities for
maintaining or enhancing stocks of community capital in a balanced manner. In order to
integrate the priorities emerging from the documents and stakeholder perspectives that
have been discussed, I assessed them for the forms of community capital that they
related to and how their various goals could be translated into requirements in the Tool.
Overall, the goals from pre-existing and stakeholder visions were relatively
comprehensive in representing the various forms of community capital. Their integrated
priorities covered the 20 stocks of community capital with adequate detail, although
many capitals and stocks received more attention than others. However, this
comprehensiveness was only possible by integrating the visions. At the level of the
visions themselves, there was a large variation in how well the six community capitals
were represented. Pre-existing visions such as the Master Plan and the New Orleans
Index achieved a relatively high level of comprehensiveness, focusing on all six capitals
and giving most at least a moderate level of attention. However, the Inflection Point
vision focused solely on human and economic capital, although it contributed valuable
priorities to those areas. The same variation in comprehensiveness occurred in the
stakeholder visions. The most comprehensive vision, Healing and Learning, highly
emphasized all capitals, while Governance and Ethics only focused strongly on social
and cultural capital. However, the low comprehensiveness of some visions did not
detract from their ability to add to the overall construct of goals and priorities from which
87
to build the requirements. This process is what occurred in the third and final phase of
constructing the Common Vision.
The final step leading up to the Common Vision was to interpret the goals
emerging from pre-existing and stakeholder visions into the Community Capital Tool. In
order to create a final set of requirements to guide the vision of a sustainable New
Orleans region, I turned to the basic requirements, a list of 50 general goals that the Tool
offers as guidelines for identifying locally relevant requirements. Please refer to
Appendix B for a list of these requirements. For each of the 20 stocks of community
capital, the basic requirements provided a general starting point that could then be
enriched by the detail of the visions that have been identified. In this process, each basic
requirement transformed into a dynamic fusion of goals and values from stakeholder
priorities and documents. To illustrate an example of how this process occurred, I will
return to the example of storm water management. The basic requirement most relevant
to this issue states “preservation of existing reservoirs and replenishment through
natural processes” under groundwater. Turning to the pre-existing visions, I considered
the Master Plan’s emphasis on a resilient city and the Impact Economy principle of
Design, as well as key stakeholder priorities from the Water Steward vision highlighting
the need to integrate sustainable water management principles into public space and
infrastructure, eventually creating a requirement which read “Regional water
infrastructure is working towards a more sustainable integrated water management
system”. Consulting with the documents and interviews in the same way, this process
yielded a set of 60 requirements.
However, these requirements represented only my interpretation of the Common
Vision for regional sustainability, necessitating the need to incorporate community review
into the process. To that end, I presented a draft list of these requirements to community
members, some of which were participants in interviews, in the workshop in October
2012 and collected electronic feedback afterwards. The feedback that emerged from this
process gave many suggestions, as well as validation of the existing draft goals that I
had presented. The incorporation of these perspectives yielded a final list of
requirements. In Figure 6 this process of community review is represented.
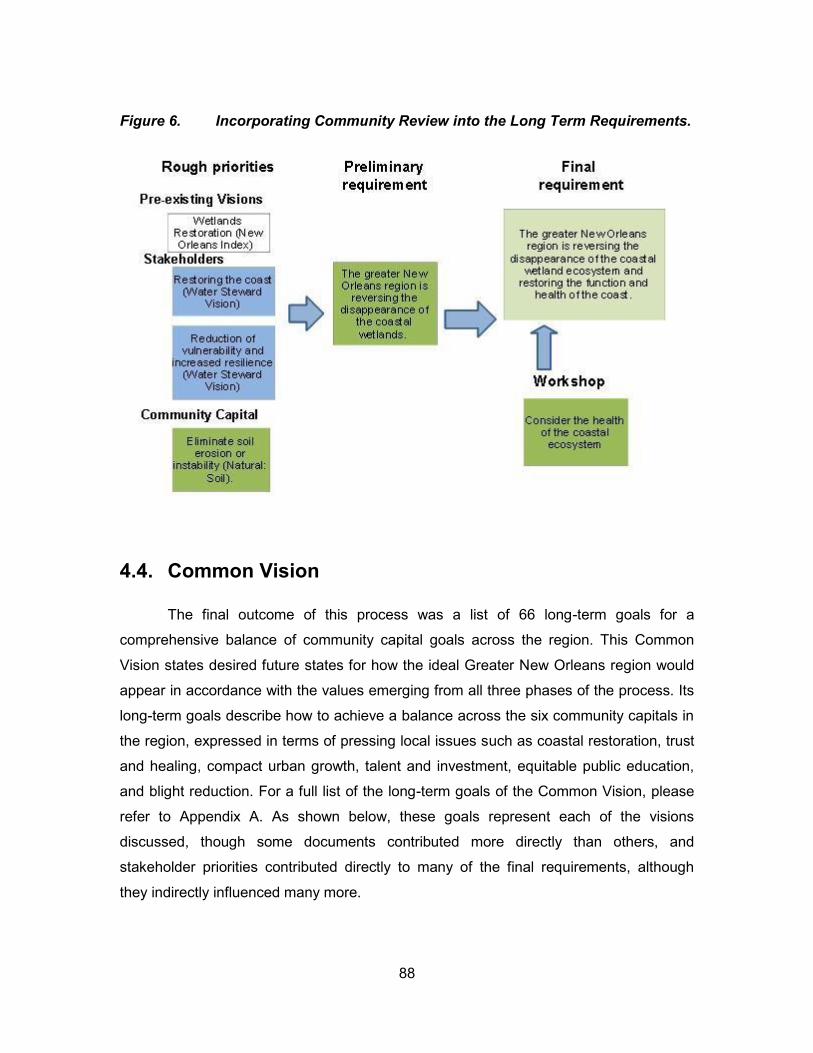
88
Figure 6. Incorporating Community Review into the Long Term Requirements.
4.4. Common Vision
The final outcome of this process was a list of 66 long-term goals for a
comprehensive balance of community capital goals across the region. This Common
Vision states desired future states for how the ideal Greater New Orleans region would
appear in accordance with the values emerging from all three phases of the process. Its
long-term goals describe how to achieve a balance across the six community capitals in
the region, expressed in terms of pressing local issues such as coastal restoration, trust
and healing, compact urban growth, talent and investment, equitable public education,
and blight reduction. For a full list of the long-term goals of the Common Vision, please
refer to Appendix A. As shown below, these goals represent each of the visions
discussed, though some documents contributed more directly than others, and
stakeholder priorities contributed directly to many of the final requirements, although
they indirectly influenced many more.
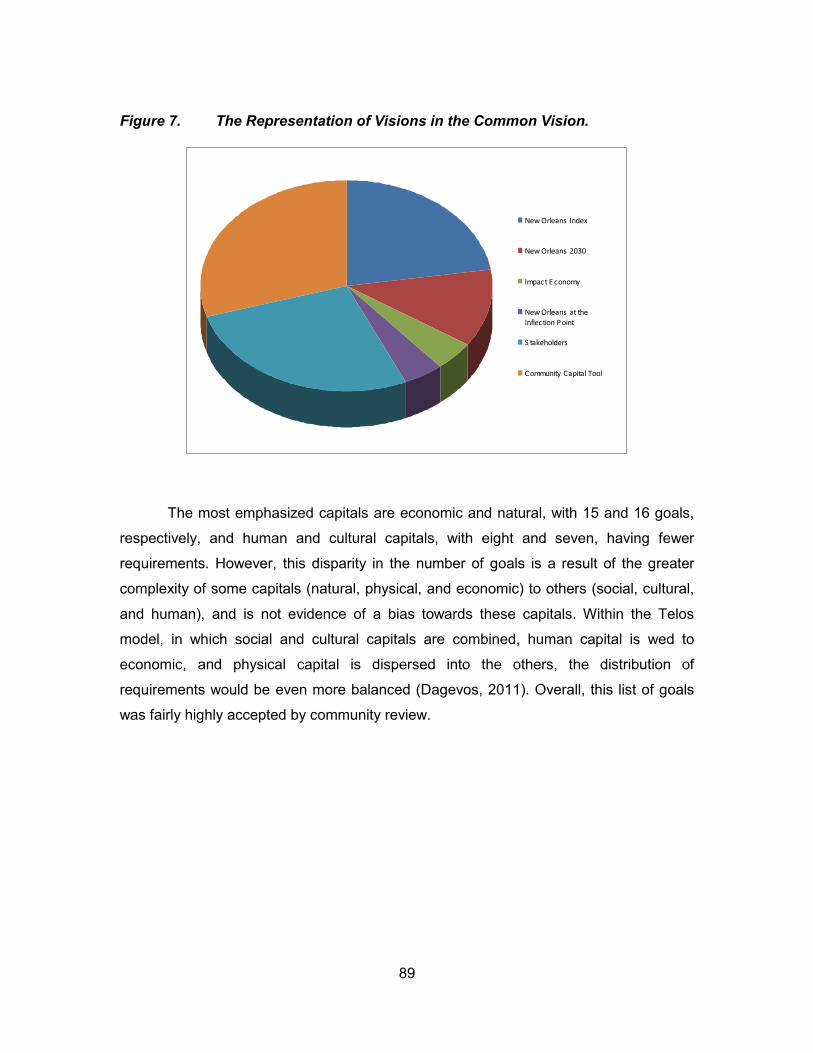
89
Figure 7. The Representation of Visions in the Common Vision.
New Orleans Index
New Orleans 2030
Impact E conomy
New Orleans at theInflection Point
S takeholders
Community Capital Tool
The most emphasized capitals are economic and natural, with 15 and 16 goals,
respectively, and human and cultural capitals, with eight and seven, having fewer
requirements. However, this disparity in the number of goals is a result of the greater
complexity of some capitals (natural, physical, and economic) to others (social, cultural,
and human), and is not evidence of a bias towards these capitals. Within the Telos
model, in which social and cultural capitals are combined, human capital is wed to
economic, and physical capital is dispersed into the others, the distribution of
requirements would be even more balanced (Dagevos, 2011). Overall, this list of goals
was fairly highly accepted by community review.
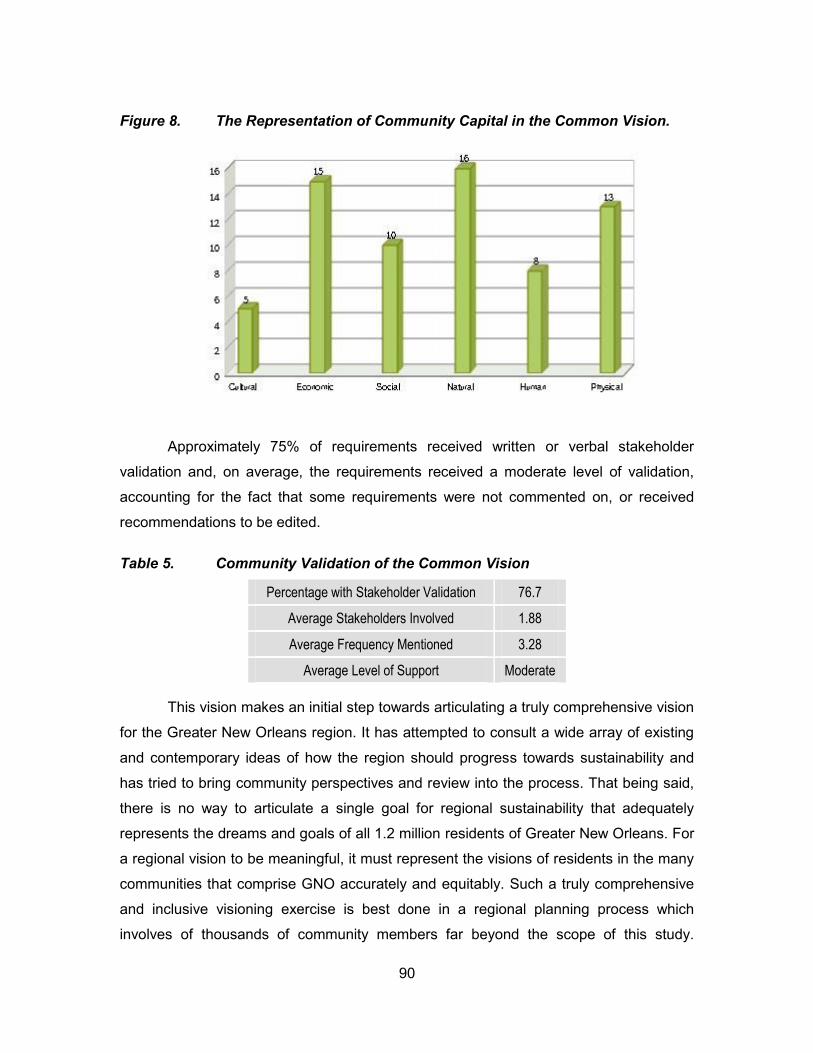
90
Figure 8. The Representation of Community Capital in the Common Vision.
Approximately 75% of requirements received written or verbal stakeholder
validation and, on average, the requirements received a moderate level of validation,
accounting for the fact that some requirements were not commented on, or received
recommendations to be edited.
Table 5. Community Validation of the Common Vision
Percentage with Stakeholder Validation 76.7
Average Stakeholders Involved 1.88
Average Frequency Mentioned 3.28
Average Level of Support Moderate
This vision makes an initial step towards articulating a truly comprehensive vision
for the Greater New Orleans region. It has attempted to consult a wide array of existing
and contemporary ideas of how the region should progress towards sustainability and
has tried to bring community perspectives and review into the process. That being said,
there is no way to articulate a single goal for regional sustainability that adequately
represents the dreams and goals of all 1.2 million residents of Greater New Orleans. For
a regional vision to be meaningful, it must represent the visions of residents in the many
communities that comprise GNO accurately and equitably. Such a truly comprehensive
and inclusive visioning exercise is best done in a regional planning process which
involves of thousands of community members far beyond the scope of this study.
91
Nonetheless, the Common Vision hopes to make a small but meaningful step towards a
comprehensive vision for regional sustainable development. The vision articulated here
is meant to offer a model for local stakeholders to use and adapt in order to arrive at a
truly participatory vision in the future.
4.5. Review of Findings
This section has identified and integrated the divergent portraits of a sustainable
Greater New Orleans region. The basic vision of the region rendered by planning and
policy documents, which called for goals such as economic prowess, ecological integrity,
and social equity, was enriched by the perspectives of community members. In the
words of stakeholders, these priorities took on shape and form, gaining the specificity
and context that the experience and vision of these community leaders alone could give.
In this transmutation, the regional vision gained a critical focus on present-day issues
such as integrated storm water management, cross-cultural healing, food security, and
wetlands restoration. It also gained the local salience that only a bottom-up process of
community visioning can impart (Reed et al., 2006). By engaging with local community
leaders, the vision for Greater New Orleans became a participatory visioning process in
miniature, limited by the constraints of a single researcher but aspiring to show how the
end goal of sustainability for the region should be defined from the bottom up. This
diverse range of goals and priorities was filtered into the vision of the Community Capital
Tool, calling for communities with balance between six forms of community capital and
allowing the region’s vision for sustainability to be operationalized. This integration of
local visions and the Tool approximated the balance between bottom-up and top-down
indicator frameworks demonstrated by Fraser et al. (2006) by relying on both local
perspectives and a versatile external framework. In the end, the vision that emerged for
Greater New Orleans is a portrait of a region which exists in harmony with its ecological
support systems while healing broken communities and strengthening a more equitable
and innovative economy while respecting its rich and diverse local culture and identity.
This common vision for sustainable development represents an agenda for sustainability
which different stakeholders can use to find common interests and begin to work
together to build a better region.
92
5. The Sustainable Region Balance Sheet
Now that the Common Vision has been articulated, it is possible to measure the
region’s progress towards the goals that it identifies. This section introduces a tool for
monitoring progress towards regional sustainable development in New Orleans. This tool
is known as the Greater New Orleans Sustainable Region Balance and comprises the
second outcome objective of this study. The Balance Sheet is a component of the
Community Capital Tool, and has been employed in settings such as Sechelt, British
Columbia, Viacha, Bolivia, and several provinces in the Netherlands where regional
governments continue to use it to monitor sustainable development (Hermans et al.,
2011; Lowry, 2012). The Balance Sheet was developed as a tool for monitoring
community or regional sustainable development in light of contemporary changes and
proposed developments (Lemmens et al., 2001; Dagevos, 2011; Lowry, 2012). Its
objective is to measure sustainable development through incorporating community
priorities and expert knowledge, reflecting of the political and normative nature of
sustainable development, increasing citizen participation, and mobilizing citizens in
defining and measuring sustainability (Dagevos, 2011).
The creation of a Balance Sheet for Greater New Orleans is this project’s most
significant outcome. Given the goals of this monitoring tool and the wide variety of
contexts in which it has been adopted and continues to be used, the Balance Sheet
could make a considerable impact in the region at the hands of local stakeholders.
Ideally, the Balance Sheet can inform decision-making and monitoring of progress
toward sustainable development by various organizations and decision-making bodies in
the region. Its cornerstone is the list of long-term goals which constitute the Common
Vision introduced in Section 4 and the simple but rigourous approach to measuring their
current status. In the following sections, I will describe the rationale and approach of the
Balance Sheet, overview its adaptation to the region, and report its results in Greater
New Orleans.
93
The Balance Sheet has developed over time with a coherent methodology that
has guided its application in sustainability monitoring systems around the world. For a
more detailed description of these methods, refer to Appendix E. The first step involved
in creating the Balance Sheet for a community or region is the identification of a
comprehensive sustainable development vision. In the next step of the Balance Sheet,
these stocks are put into local context through the means of long-term goals, or
requirements (Dagevos & Evers, 2008). In this project, these steps were followed during
the creation of the Common Vision. Next, the requirements that have been identified are
assigned indicators (Dagevos, 2011). These indicators are meant to provide a
measurable quantitative way to verify to what extent the requirement it represents is
being met. In the selection of indicators, it is important to ensure that indicators are both
locally relevant as well as scientifically rigourous, in that they are based on reliable data
that can be collected in other contexts for indicators in other locales. Care should be
taken to create indicators that are not based on isolated local studies but could draw on
data from other regions for their monitoring systems. The Balance Sheet for Greater
New Orleans uses 122 indicators, although the size of the region or community
influences the amount of indicators that should be used.
After identifying indicators, benchmarks must be selected to place normative
boundaries on the indicators that reflect societal expectations for their performance. This
process is one of the most essential parts of the Balance Sheet, second in importance
only to the formation requirements, in that it should reflect social norms regarding the
desired and acceptable levels that the community or region would seek of a given
indicator (Dagevos, 2011; Hermans et al., 2011). Other regions or cities are often used
to create these norms, both to set a high standard for the community in which another
community has shown excellence and to identify the lowest acceptable level of each
indicator from communities with poor performance. Figure 9 shows the four ranges that
the Balance Sheet uses to create norms.
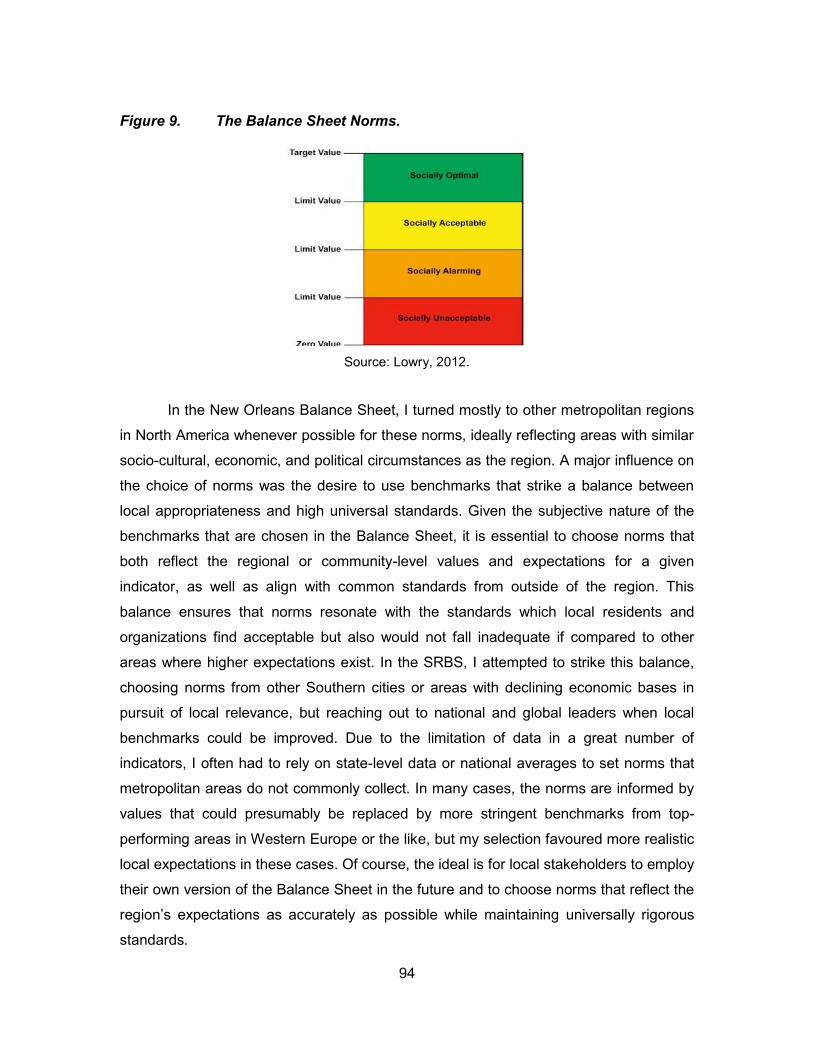
94
Figure 9. The Balance Sheet Norms.
Source: Lowry, 2012.
In the New Orleans Balance Sheet, I turned mostly to other metropolitan regions
in North America whenever possible for these norms, ideally reflecting areas with similar
socio-cultural, economic, and political circumstances as the region. A major influence on
the choice of norms was the desire to use benchmarks that strike a balance between
local appropriateness and high universal standards. Given the subjective nature of the
benchmarks that are chosen in the Balance Sheet, it is essential to choose norms that
both reflect the regional or community-level values and expectations for a given
indicator, as well as align with common standards from outside of the region. This
balance ensures that norms resonate with the standards which local residents and
organizations find acceptable but also would not fall inadequate if compared to other
areas where higher expectations exist. In the SRBS, I attempted to strike this balance,
choosing norms from other Southern cities or areas with declining economic bases in
pursuit of local relevance, but reaching out to national and global leaders when local
benchmarks could be improved. Due to the limitation of data in a great number of
indicators, I often had to rely on state-level data or national averages to set norms that
metropolitan areas do not commonly collect. In many cases, the norms are informed by
values that could presumably be replaced by more stringent benchmarks from top-
performing areas in Western Europe or the like, but my selection favoured more realistic
local expectations in these cases. Of course, the ideal is for local stakeholders to employ
their own version of the Balance Sheet in the future and to choose norms that reflect the
region’s expectations as accurately as possible while maintaining universally rigorous
standards.
95
Finally, the indicators are measured using existing data, which can range from
scientific studies to planning documents and media sources. An essential element of
measurement is the use of data from the closest geographic aggregation level to that of
the focus area. In New Orleans, the aggregation level was the seven-parish metropolitan
area, and I strove to use as many data as were available from this level in order to
render the most accurate measurement. However, there is a wide gap in the availability
of data that exists on local, regional, state, and national levels determined by
government and academic research priorities. An ongoing challenge in the New Orleans
Balance Sheet was the lack of data for many indicators at the seven-parish level, driving
the need to use state-level, single-parish, or national data in place of the correct
aggregation level.
The end result of this process was the Sustainable Region Balance Sheet, a final
draft of which was completed in spring 2013. Before reviewing the results of the SRBS, it
is necessary to note two important points. First, the assessment offered here is meant to
evaluate regional sustainability en masse. The data selected to measure stocks of
community capital are most often at the 7-parish level, meaning that the assessment
reflects the median level of these indicators and cannot reflect the specific conditions of
smaller communities or neighbourhoods. In so doing, the SRBS is not able to reflect the
widely disparate conditions of communities within the area, which often range from some
of the most favourable in the state to those of developing nations. With its regional focus,
the SRBS is not able to reflect the wide gulf between many communities in Greater New
Orleans expounded upon in Section 3. Therefore, all results should be considered with
attention to the inequities not shown on either side of them.
Second, the Balance Sheet covers a very wide array of regional issues and data,
and is meant to assess these with an appropriate balance between depth and breadth. It
is not meant to offer an exhaustive account of the indicators that are used. Each of these
indicators and its recent performance could be the subject of its own study; it is not the
purpose of the Balance Sheet to explore them at their full depth exhaustively. It is,
however, the responsibility of the monitoring tool to ensure that the indicators are chosen
carefully and accurately represent their requirements, the local situation, and the
research out of which they were taken. Therefore, in the SRBS I attempt to describe
briefly but thoroughly the current status of each indicator and how it contributes to its
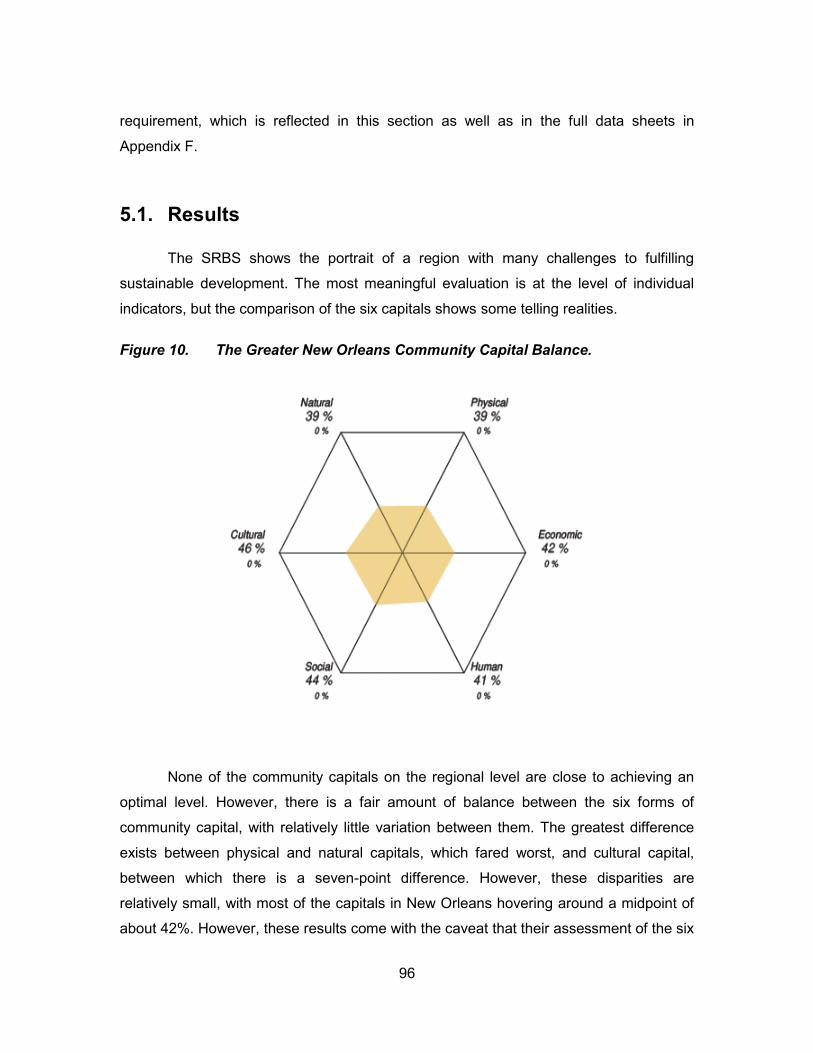
96
requirement, which is reflected in this section as well as in the full data sheets in
Appendix F.
5.1. Results
The SRBS shows the portrait of a region with many challenges to fulfilling
sustainable development. The most meaningful evaluation is at the level of individual
indicators, but the comparison of the six capitals shows some telling realities.
Figure 10. The Greater New Orleans Community Capital Balance.
None of the community capitals on the regional level are close to achieving an
optimal level. However, there is a fair amount of balance between the six forms of
community capital, with relatively little variation between them. The greatest difference
exists between physical and natural capitals, which fared worst, and cultural capital,
between which there is a seven-point difference. However, these disparities are
relatively small, with most of the capitals in New Orleans hovering around a midpoint of
about 42%. However, these results come with the caveat that their assessment of the six
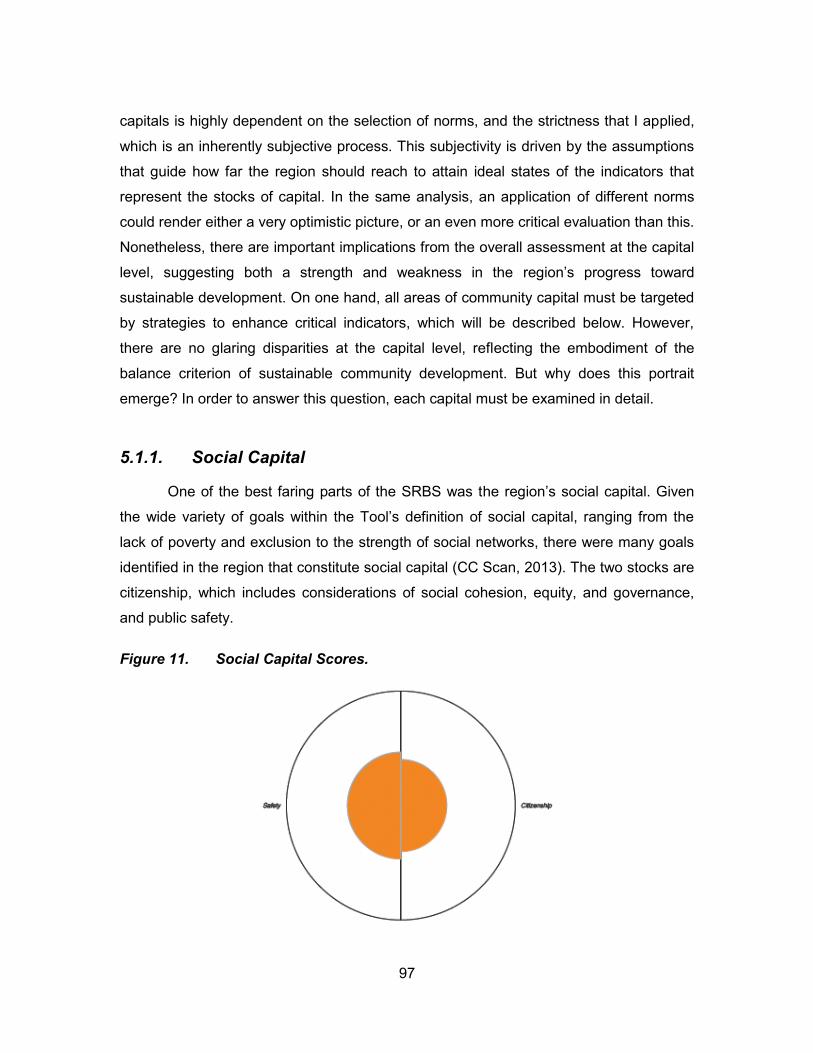
97
capitals is highly dependent on the selection of norms, and the strictness that I applied,
which is an inherently subjective process. This subjectivity is driven by the assumptions
that guide how far the region should reach to attain ideal states of the indicators that
represent the stocks of capital. In the same analysis, an application of different norms
could render either a very optimistic picture, or an even more critical evaluation than this.
Nonetheless, there are important implications from the overall assessment at the capital
level, suggesting both a strength and weakness in the region’s progress toward
sustainable development. On one hand, all areas of community capital must be targeted
by strategies to enhance critical indicators, which will be described below. However,
there are no glaring disparities at the capital level, reflecting the embodiment of the
balance criterion of sustainable community development. But why does this portrait
emerge? In order to answer this question, each capital must be examined in detail.
5.1.1. Social Capital
One of the best faring parts of the SRBS was the region’s social capital. Given
the wide variety of goals within the Tool’s definition of social capital, ranging from the
lack of poverty and exclusion to the strength of social networks, there were many goals
identified in the region that constitute social capital (CC Scan, 2013). The two stocks are
citizenship, which includes considerations of social cohesion, equity, and governance,
and public safety.
Figure 11. Social Capital Scores.
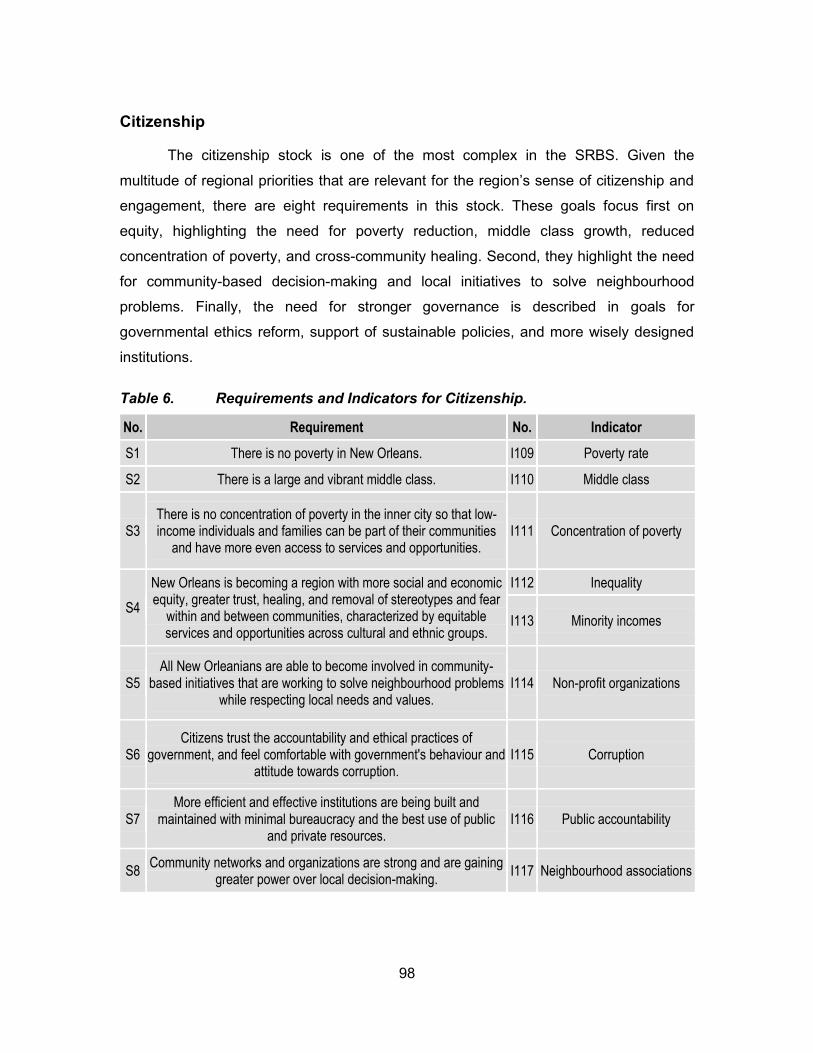
98
Citizenship
The citizenship stock is one of the most complex in the SRBS. Given the
multitude of regional priorities that are relevant for the region’s sense of citizenship and
engagement, there are eight requirements in this stock. These goals focus first on
equity, highlighting the need for poverty reduction, middle class growth, reduced
concentration of poverty, and cross-community healing. Second, they highlight the need
for community-based decision-making and local initiatives to solve neighbourhood
problems. Finally, the need for stronger governance is described in goals for
governmental ethics reform, support of sustainable policies, and more wisely designed
institutions.
Table 6. Requirements and Indicators for Citizenship.
No. Requirement No. Indicator
S1 There is no poverty in New Orleans. I109 Poverty rate
S2 There is a large and vibrant middle class. I110 Middle class
S3 There is no concentration of poverty in the inner city so that low-income individuals and families can be part of their communities
and have more even access to services and opportunities. I111 Concentration of poverty
S4
New Orleans is becoming a region with more social and economic equity, greater trust, healing, and removal of stereotypes and fear
within and between communities, characterized by equitable services and opportunities across cultural and ethnic groups.
I112 Inequality
I113 Minority incomes
S5 All New Orleanians are able to become involved in community-
based initiatives that are working to solve neighbourhood problems while respecting local needs and values.
I114 Non-profit organizations
S6 Citizens trust the accountability and ethical practices of
government, and feel comfortable with government's behaviour and attitude towards corruption.
I115 Corruption
S7 More efficient and effective institutions are being built and
maintained with minimal bureaucracy and the best use of public and private resources.
I116 Public accountability
S8 Community networks and organizations are strong and are gaining
greater power over local decision-making. I117 Neighbourhood associations
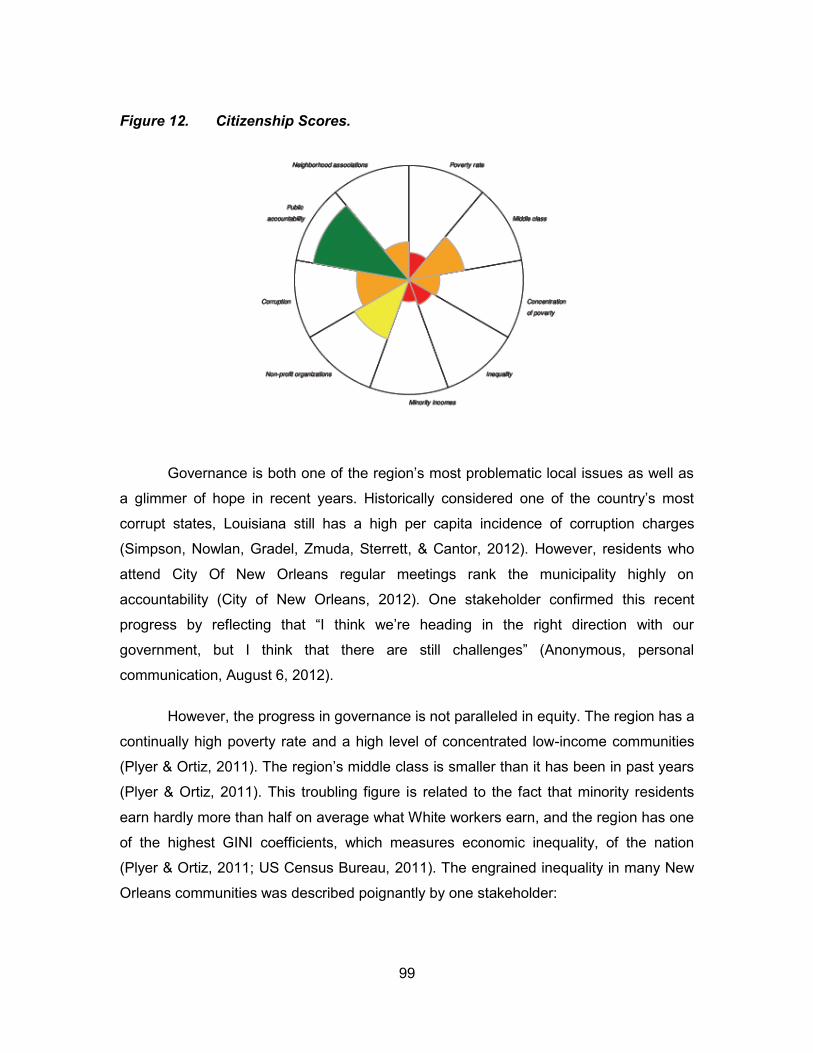
99
Figure 12. Citizenship Scores.
Governance is both one of the region’s most problematic local issues as well as
a glimmer of hope in recent years. Historically considered one of the country’s most
corrupt states, Louisiana still has a high per capita incidence of corruption charges
(Simpson, Nowlan, Gradel, Zmuda, Sterrett, & Cantor, 2012). However, residents who
attend City Of New Orleans regular meetings rank the municipality highly on
accountability (City of New Orleans, 2012). One stakeholder confirmed this recent
progress by reflecting that “I think we’re heading in the right direction with our
government, but I think that there are still challenges” (Anonymous, personal
communication, August 6, 2012).
However, the progress in governance is not paralleled in equity. The region has a
continually high poverty rate and a high level of concentrated low-income communities
(Plyer & Ortiz, 2011). The region’s middle class is smaller than it has been in past years
(Plyer & Ortiz, 2011). This troubling figure is related to the fact that minority residents
earn hardly more than half on average what White workers earn, and the region has one
of the highest GINI coefficients, which measures economic inequality, of the nation
(Plyer & Ortiz, 2011; US Census Bureau, 2011). The engrained inequality in many New
Orleans communities was described poignantly by one stakeholder:
100
“I think that in New Orleans, the most fabulous opulence is on St. Charles, and…you go two blocks in away from St. Charles and you come into the most destitute poverty…And a lot of times kids in New Orleans have to…grow up living in a shanty and riding, walking, being trolleyed past these fabulous mansions, and they don’t know if they’re gonna have a meal” (Anonymous, personal communication, February 10, 2013).
Although indicators for equity are unacceptable, there is some promise in recent
initiatives for neighbourhoods to take greater ownership of community development.
Having always been a culture in which strong family and friendship networks exist, New
Orleans has recently seen an upsurge in community-based initiatives to solve local
problems. The region in post-Katrina years has had a relatively high level of non-profit
organizations working in many locally-driven community development programs and
surpassing the rate of nearby cities like Baton Rouge (De Vita, Blackwood, & Roeger,
2012). Additionally, the rise of neighbourhood associations since 2005 has increased
citizen participation in local decision-making. One stakeholder explained that
“everybody’s engaged. Everybody knows their neighborhood. Everybody knows their
City Councilperson. Everybody wants to be involved in getting the mayor elected. You
know, nothing happens around here without all the neighborhood associations”
(Anonymous, personal communication, August 16, 2012). The attendance in
neighbourhood associations has risen sharply, but is still relatively low considering the
residents that are enrolled in them and do not participate. Overall, however, the
citizenship stock reflects mostly challenge, weighted heavily by the ongoing problems
with equity and governance issues with corruption.
Safety
Public safety has long been at the top of local priorities. With continuously high
levels of violent crime, situated in a vicious circle of socio-economic divides and the rise
of gang and criminal networks to replace failing employment opportunities, many
communities in the region have become known foremost for their perceived danger. The
safety stock considers two requirements that call for both self-perceived safety by
community members and an effective criminal justice system.
Table 7. Requirements and Indicators for Safety.
No. Requirement No. Indicator
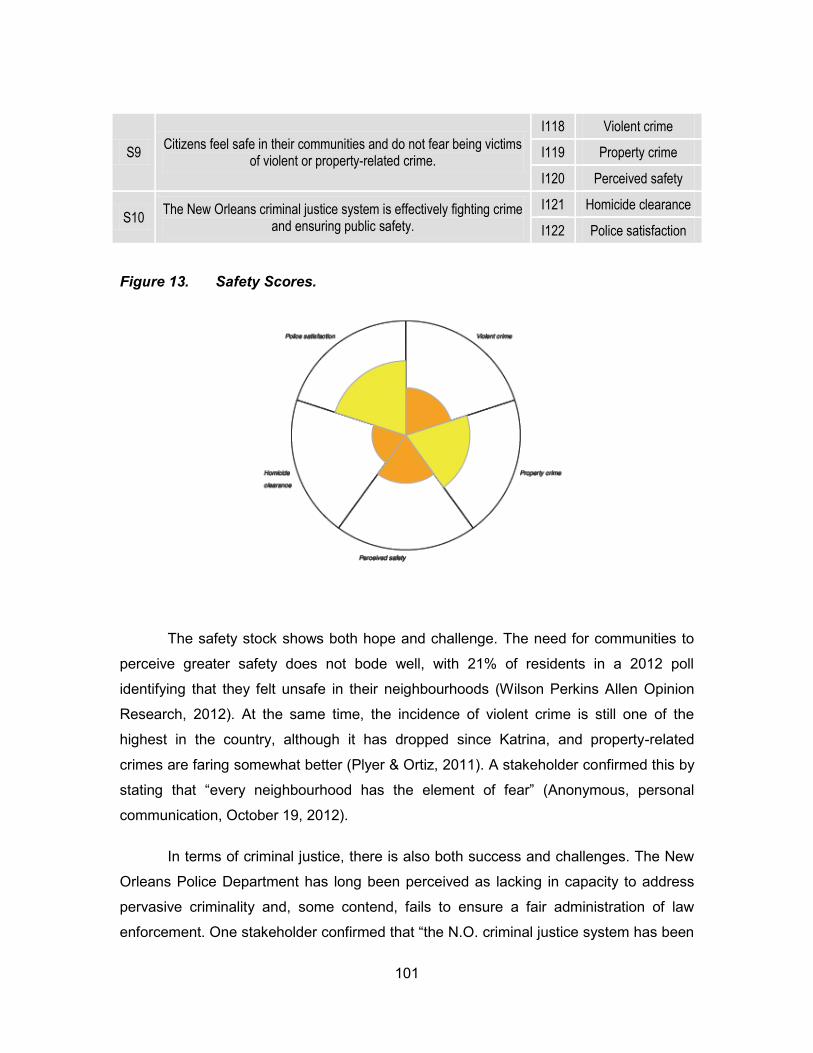
101
S9 Citizens feel safe in their communities and do not fear being victims
of violent or property-related crime.
I118 Violent crime
I119 Property crime
I120 Perceived safety
S10 The New Orleans criminal justice system is effectively fighting crime
and ensuring public safety.
I121 Homicide clearance
I122 Police satisfaction
Figure 13. Safety Scores.
The safety stock shows both hope and challenge. The need for communities to
perceive greater safety does not bode well, with 21% of residents in a 2012 poll
identifying that they felt unsafe in their neighbourhoods (Wilson Perkins Allen Opinion
Research, 2012). At the same time, the incidence of violent crime is still one of the
highest in the country, although it has dropped since Katrina, and property-related
crimes are faring somewhat better (Plyer & Ortiz, 2011). A stakeholder confirmed this by
stating that “every neighbourhood has the element of fear” (Anonymous, personal
communication, October 19, 2012).
In terms of criminal justice, there is also both success and challenges. The New
Orleans Police Department has long been perceived as lacking in capacity to address
pervasive criminality and, some contend, fails to ensure a fair administration of law
enforcement. One stakeholder confirmed that “the N.O. criminal justice system has been
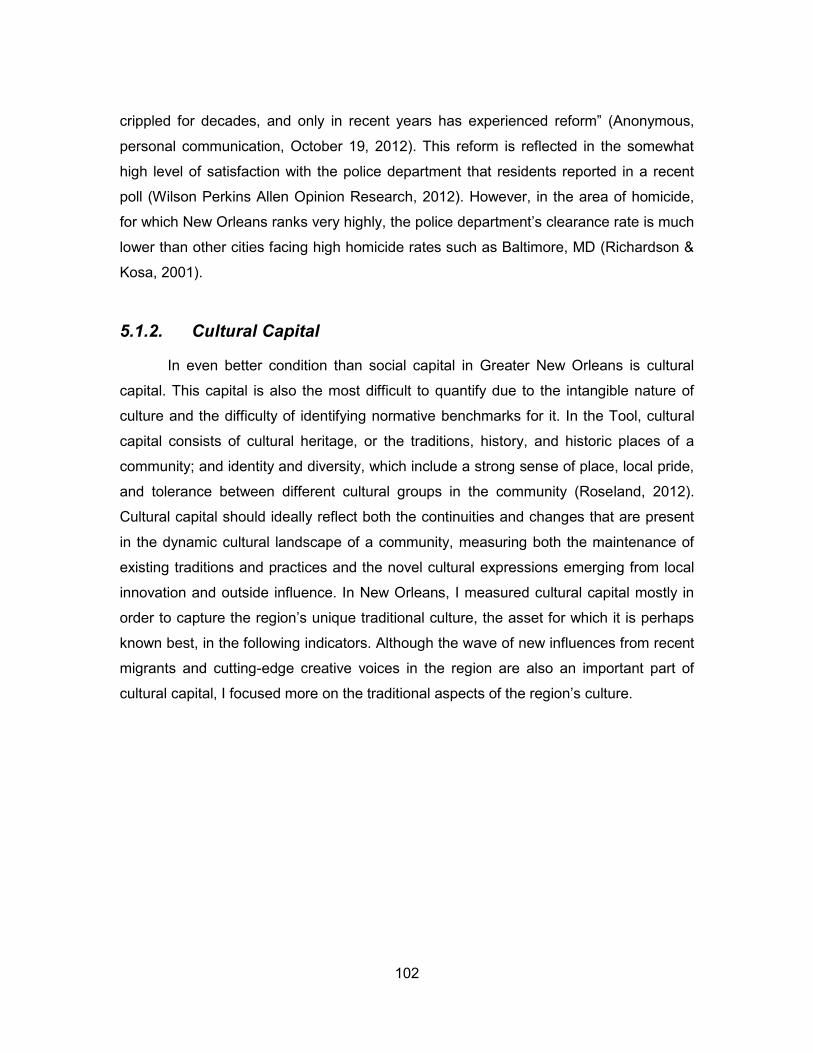
102
crippled for decades, and only in recent years has experienced reform” (Anonymous,
personal communication, October 19, 2012). This reform is reflected in the somewhat
high level of satisfaction with the police department that residents reported in a recent
poll (Wilson Perkins Allen Opinion Research, 2012). However, in the area of homicide,
for which New Orleans ranks very highly, the police department’s clearance rate is much
lower than other cities facing high homicide rates such as Baltimore, MD (Richardson &
Kosa, 2001).
5.1.2. Cultural Capital
In even better condition than social capital in Greater New Orleans is cultural
capital. This capital is also the most difficult to quantify due to the intangible nature of
culture and the difficulty of identifying normative benchmarks for it. In the Tool, cultural
capital consists of cultural heritage, or the traditions, history, and historic places of a
community; and identity and diversity, which include a strong sense of place, local pride,
and tolerance between different cultural groups in the community (Roseland, 2012).
Cultural capital should ideally reflect both the continuities and changes that are present
in the dynamic cultural landscape of a community, measuring both the maintenance of
existing traditions and practices and the novel cultural expressions emerging from local
innovation and outside influence. In New Orleans, I measured cultural capital mostly in
order to capture the region’s unique traditional culture, the asset for which it is perhaps
known best, in the following indicators. Although the wave of new influences from recent
migrants and cutting-edge creative voices in the region are also an important part of
cultural capital, I focused more on the traditional aspects of the region’s culture.
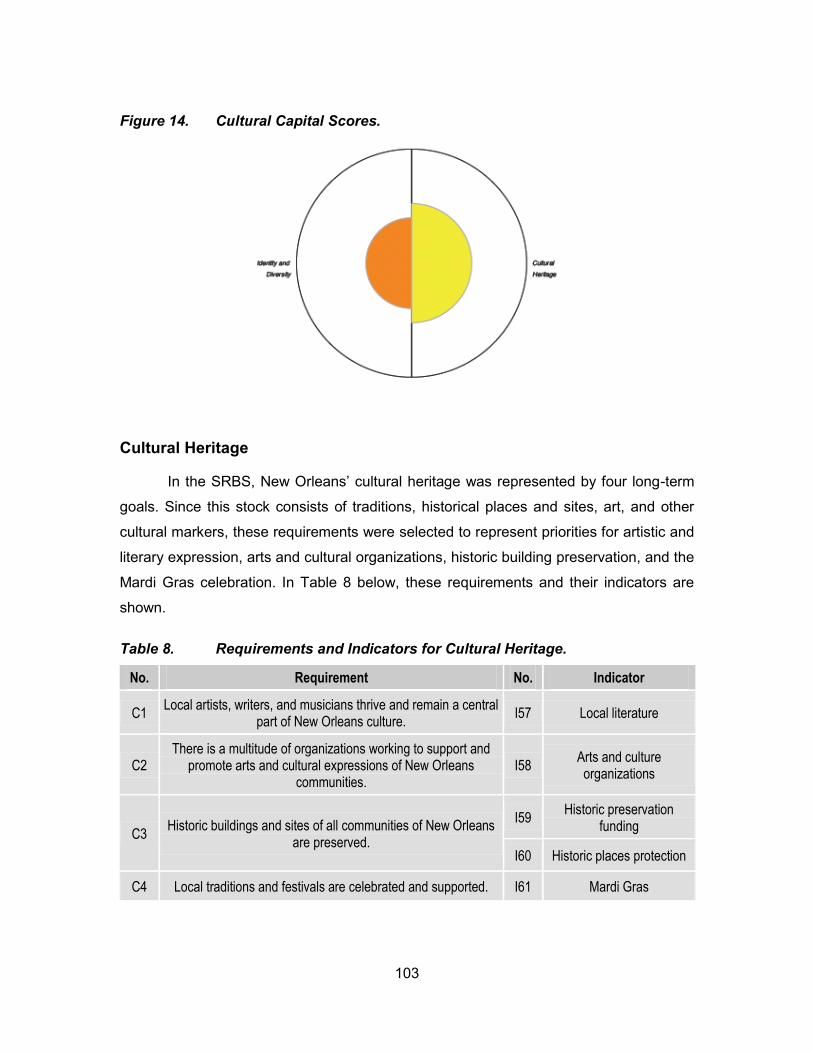
103
Figure 14. Cultural Capital Scores.
Cultural Heritage
In the SRBS, New Orleans’ cultural heritage was represented by four long-term
goals. Since this stock consists of traditions, historical places and sites, art, and other
cultural markers, these requirements were selected to represent priorities for artistic and
literary expression, arts and cultural organizations, historic building preservation, and the
Mardi Gras celebration. In Table 8 below, these requirements and their indicators are
shown.
Table 8. Requirements and Indicators for Cultural Heritage.
No. Requirement No. Indicator
C1 Local artists, writers, and musicians thrive and remain a central
part of New Orleans culture. I57 Local literature
C2 There is a multitude of organizations working to support and
promote arts and cultural expressions of New Orleans communities.
I58 Arts and culture organizations
C3 Historic buildings and sites of all communities of New Orleans
are preserved.
I59 Historic preservation
funding
I60 Historic places protection
C4 Local traditions and festivals are celebrated and supported. I61 Mardi Gras
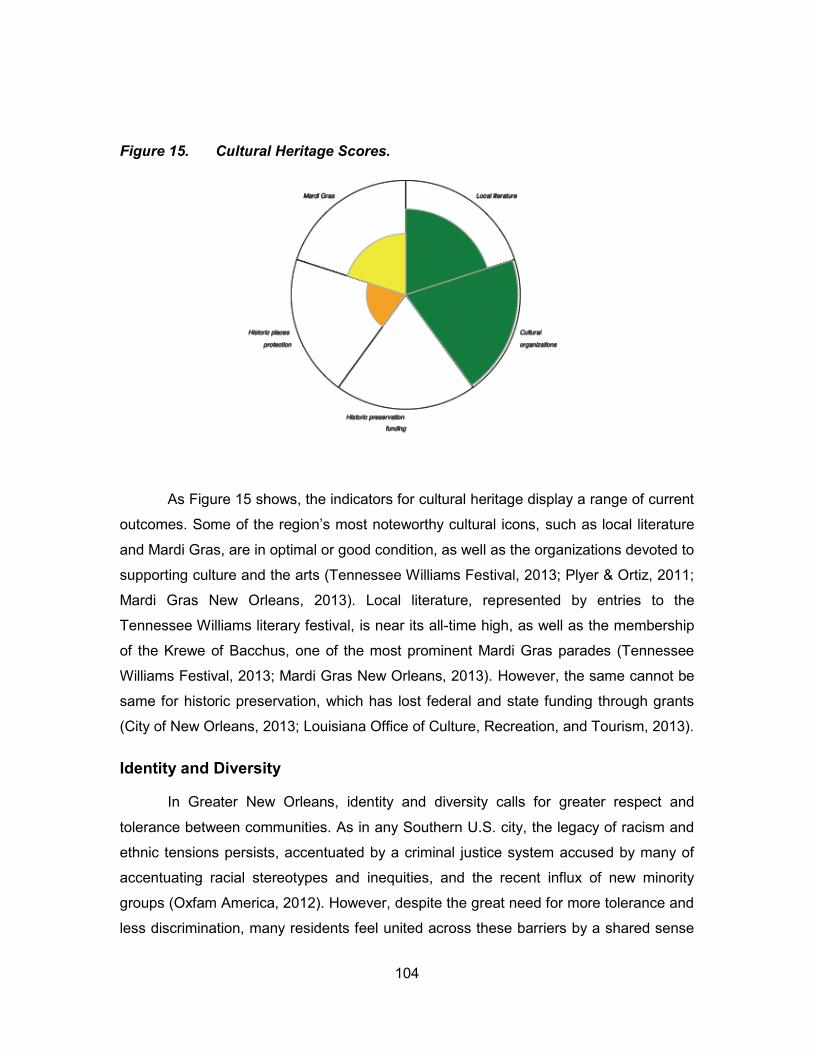
104
Figure 15. Cultural Heritage Scores.
As Figure 15 shows, the indicators for cultural heritage display a range of current
outcomes. Some of the region’s most noteworthy cultural icons, such as local literature
and Mardi Gras, are in optimal or good condition, as well as the organizations devoted to
supporting culture and the arts (Tennessee Williams Festival, 2013; Plyer & Ortiz, 2011;
Mardi Gras New Orleans, 2013). Local literature, represented by entries to the
Tennessee Williams literary festival, is near its all-time high, as well as the membership
of the Krewe of Bacchus, one of the most prominent Mardi Gras parades (Tennessee
Williams Festival, 2013; Mardi Gras New Orleans, 2013). However, the same cannot be
same for historic preservation, which has lost federal and state funding through grants
(City of New Orleans, 2013; Louisiana Office of Culture, Recreation, and Tourism, 2013).
Identity and Diversity
In Greater New Orleans, identity and diversity calls for greater respect and
tolerance between communities. As in any Southern U.S. city, the legacy of racism and
ethnic tensions persists, accentuated by a criminal justice system accused by many of
accentuating racial stereotypes and inequities, and the recent influx of new minority
groups (Oxfam America, 2012). However, despite the great need for more tolerance and
less discrimination, many residents feel united across these barriers by a shared sense
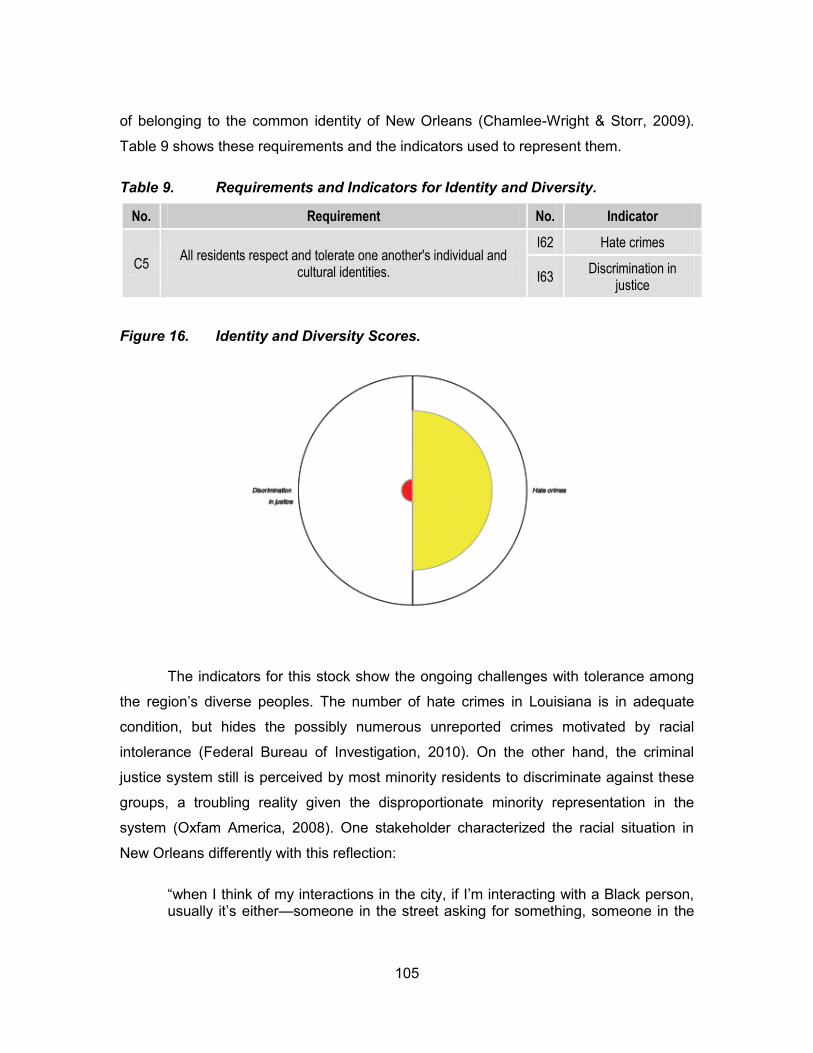
105
of belonging to the common identity of New Orleans (Chamlee-Wright & Storr, 2009).
Table 9 shows these requirements and the indicators used to represent them.
Table 9. Requirements and Indicators for Identity and Diversity.
No. Requirement No. Indicator
C5 All residents respect and tolerate one another's individual and
cultural identities.
I62 Hate crimes
I63 Discrimination in
justice
Figure 16. Identity and Diversity Scores.
The indicators for this stock show the ongoing challenges with tolerance among
the region’s diverse peoples. The number of hate crimes in Louisiana is in adequate
condition, but hides the possibly numerous unreported crimes motivated by racial
intolerance (Federal Bureau of Investigation, 2010). On the other hand, the criminal
justice system still is perceived by most minority residents to discriminate against these
groups, a troubling reality given the disproportionate minority representation in the
system (Oxfam America, 2008). One stakeholder characterized the racial situation in
New Orleans differently with this reflection:
“when I think of my interactions in the city, if I’m interacting with a Black person, usually it’s either—someone in the street asking for something, someone in the
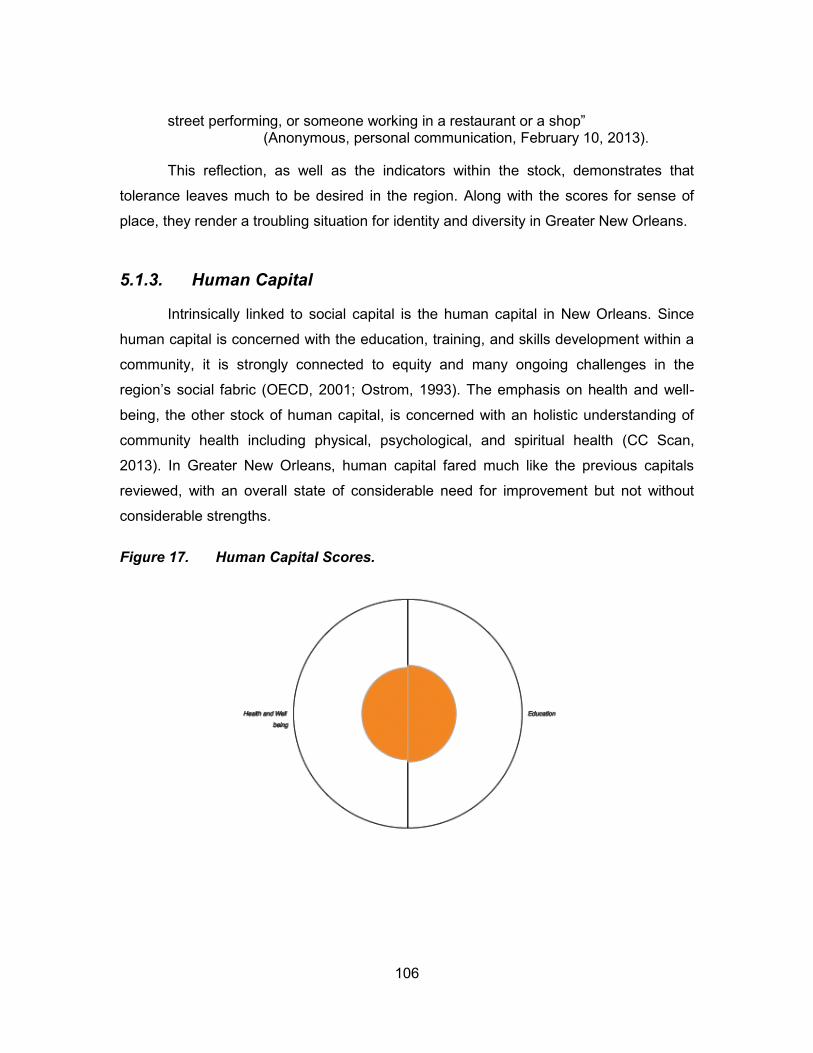
106
street performing, or someone working in a restaurant or a shop” (Anonymous, personal communication, February 10, 2013).
This reflection, as well as the indicators within the stock, demonstrates that
tolerance leaves much to be desired in the region. Along with the scores for sense of
place, they render a troubling situation for identity and diversity in Greater New Orleans.
5.1.3. Human Capital
Intrinsically linked to social capital is the human capital in New Orleans. Since
human capital is concerned with the education, training, and skills development within a
community, it is strongly connected to equity and many ongoing challenges in the
region’s social fabric (OECD, 2001; Ostrom, 1993). The emphasis on health and well-
being, the other stock of human capital, is concerned with an holistic understanding of
community health including physical, psychological, and spiritual health (CC Scan,
2013). In Greater New Orleans, human capital fared much like the previous capitals
reviewed, with an overall state of considerable need for improvement but not without
considerable strengths.
Figure 17. Human Capital Scores.
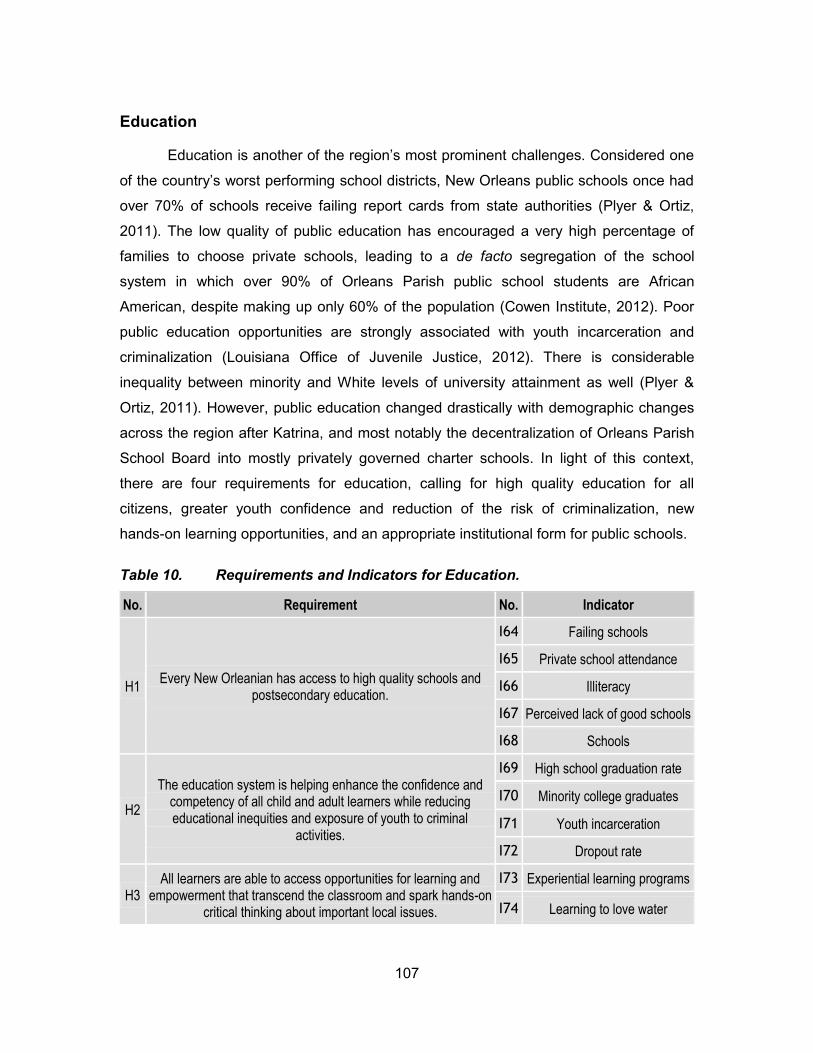
107
Education
Education is another of the region’s most prominent challenges. Considered one
of the country’s worst performing school districts, New Orleans public schools once had
over 70% of schools receive failing report cards from state authorities (Plyer & Ortiz,
2011). The low quality of public education has encouraged a very high percentage of
families to choose private schools, leading to a de facto segregation of the school
system in which over 90% of Orleans Parish public school students are African
American, despite making up only 60% of the population (Cowen Institute, 2012). Poor
public education opportunities are strongly associated with youth incarceration and
criminalization (Louisiana Office of Juvenile Justice, 2012). There is considerable
inequality between minority and White levels of university attainment as well (Plyer &
Ortiz, 2011). However, public education changed drastically with demographic changes
across the region after Katrina, and most notably the decentralization of Orleans Parish
School Board into mostly privately governed charter schools. In light of this context,
there are four requirements for education, calling for high quality education for all
citizens, greater youth confidence and reduction of the risk of criminalization, new
hands-on learning opportunities, and an appropriate institutional form for public schools.
Table 10. Requirements and Indicators for Education.
No. Requirement No. Indicator
H1 Every New Orleanian has access to high quality schools and
postsecondary education.
I64 Failing schools
I65 Private school attendance
I66 Illiteracy
I67 Perceived lack of good schools
I68 Schools
H2
The education system is helping enhance the confidence and competency of all child and adult learners while reducing educational inequities and exposure of youth to criminal
activities.
I69 High school graduation rate
I70 Minority college graduates
I71 Youth incarceration
I72 Dropout rate
H3 All learners are able to access opportunities for learning and
empowerment that transcend the classroom and spark hands-on critical thinking about important local issues.
I73 Experiential learning programs
I74 Learning to love water
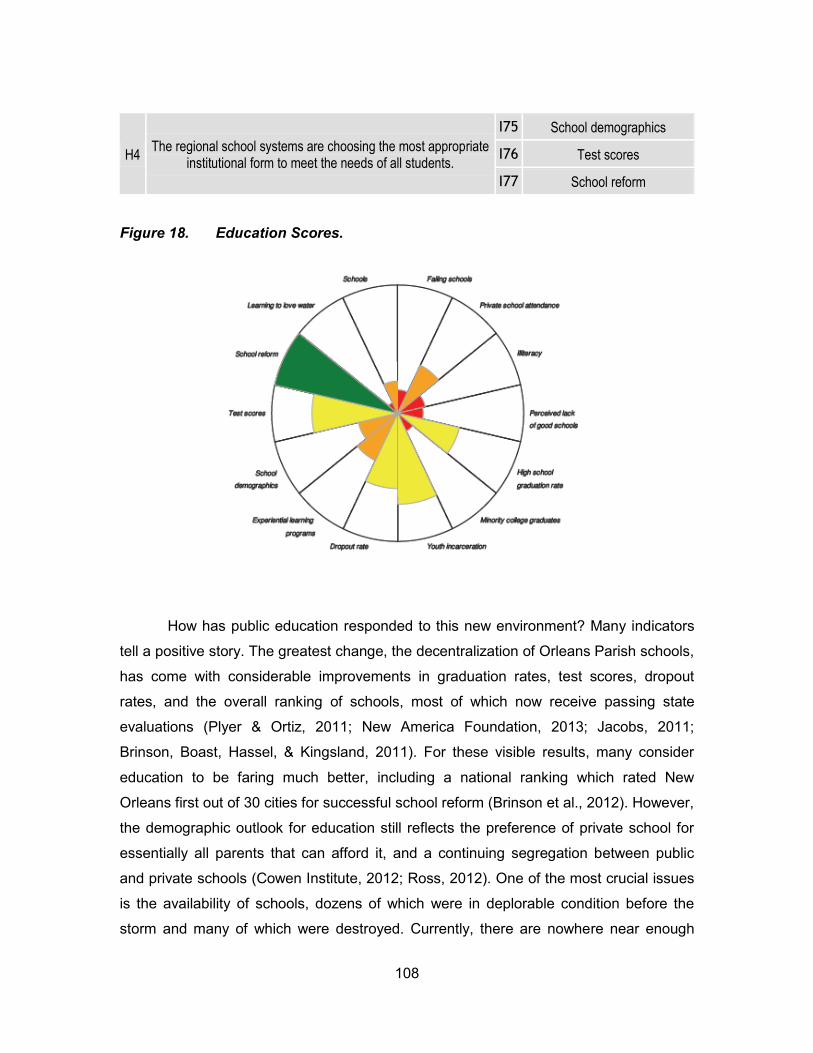
108
H4 The regional school systems are choosing the most appropriate
institutional form to meet the needs of all students.
I75 School demographics
I76 Test scores
I77 School reform
Figure 18. Education Scores.
How has public education responded to this new environment? Many indicators
tell a positive story. The greatest change, the decentralization of Orleans Parish schools,
has come with considerable improvements in graduation rates, test scores, dropout
rates, and the overall ranking of schools, most of which now receive passing state
evaluations (Plyer & Ortiz, 2011; New America Foundation, 2013; Jacobs, 2011;
Brinson, Boast, Hassel, & Kingsland, 2011). For these visible results, many consider
education to be faring much better, including a national ranking which rated New
Orleans first out of 30 cities for successful school reform (Brinson et al., 2012). However,
the demographic outlook for education still reflects the preference of private school for
essentially all parents that can afford it, and a continuing segregation between public
and private schools (Cowen Institute, 2012; Ross, 2012). One of the most crucial issues
is the availability of schools, dozens of which were in deplorable condition before the
storm and many of which were destroyed. Currently, there are nowhere near enough
109
decent public schools to serve all of the region’s school-aged children (Brinson et al.,
2012).
The perception that New Orleans schools are “still some of the worst anywhere”
(Anonymous, personal communication, October 19, 2012) also led to many Katrina
evacuees not returning in order to enrol their children in higher-performing school
districts. The perception of public primary and secondary education is still overall quite
low. One stakeholder explained that “people are paying...$10,000 or $12,000 a year to
put their kids into Catholic school with 30 kids in a classroom and not highly qualified
teachers because they’re under the impression that the schools are so bad and so
dangerous” (Anonymous, personal communication, February 10, 2013).
In addition to the continuing poor perceptions and the lack of demographic
integration, illiteracy is still shockingly high in New Orleans (Hodgson, 2011). These
issues are related to a wide gulf between minorities and White residents in obtaining a
university degree, which is a major barrier to employment and personal empowerment
(Plyer & Ortiz, 2011). One stakeholder described that “education is the biggest barrier to
those low-income communities becoming upwardly mobile” (Anonymous, personal
communication, August 8, 2012). This barrier, reflected in the educational gaps and
youth incarceration, also calls for the need for non-traditional opportunities for low-
income individuals to learn hands-on skills and competencies for both job training and to
gain a sense of accomplishment and pride in their ability to achieve their goals. In order
to meet this need, a wide array of new experiential learning programs have been offered
mostly by non-profit organizations, beginning to fill this gap but still unable to reach most
students (Connect to Educate, 2012). A major need identified by stakeholders was the
importance for children to learn to experience aquatic recreation and environmental
education to this end, but only a handful of dedicated organizations have been able to
offer these courses to about 13,000 out of the region’s over 72,000 school-aged children
(T.R.E.E., 2013; Bayou Rebirth, 2013). These promising signs reflect the state of
education in the region: a long legacy of persistent challenges with small but meaningful
reforms underway.
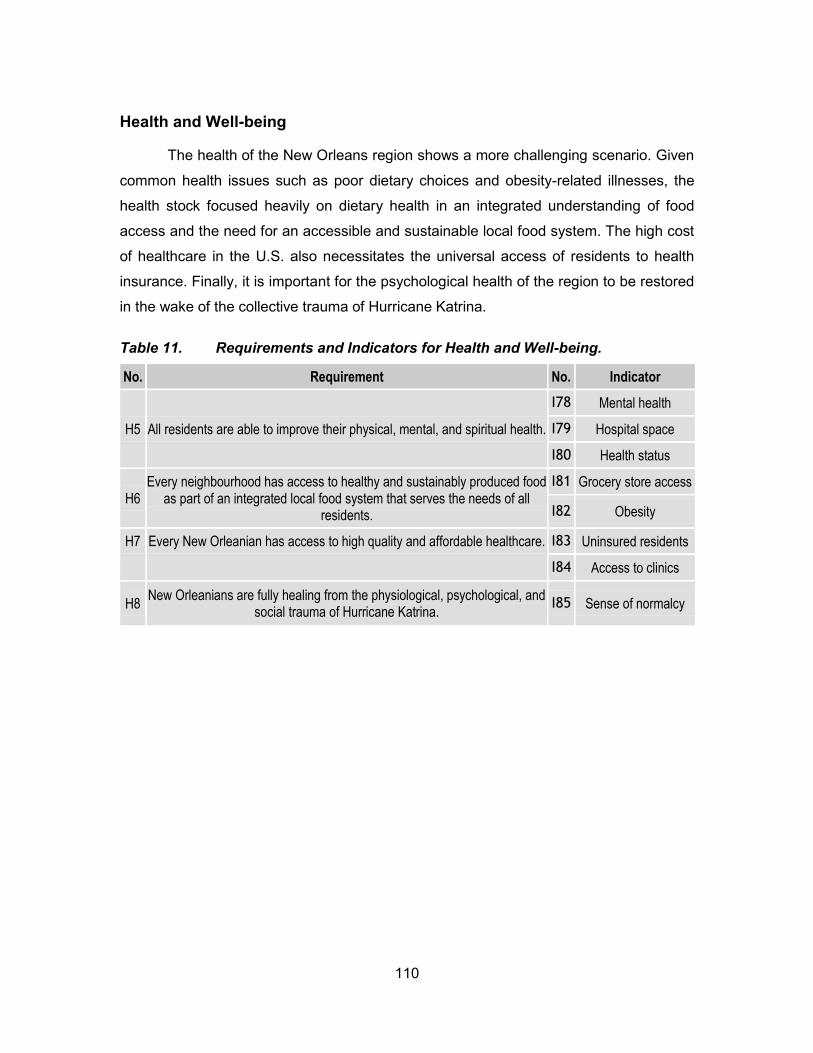
110
Health and Well-being
The health of the New Orleans region shows a more challenging scenario. Given
common health issues such as poor dietary choices and obesity-related illnesses, the
health stock focused heavily on dietary health in an integrated understanding of food
access and the need for an accessible and sustainable local food system. The high cost
of healthcare in the U.S. also necessitates the universal access of residents to health
insurance. Finally, it is important for the psychological health of the region to be restored
in the wake of the collective trauma of Hurricane Katrina.
Table 11. Requirements and Indicators for Health and Well-being.
No. Requirement No. Indicator
H5 All residents are able to improve their physical, mental, and spiritual health.
I78 Mental health
I79 Hospital space
I80 Health status
H6 Every neighbourhood has access to healthy and sustainably produced food
as part of an integrated local food system that serves the needs of all residents.
I81 Grocery store access
I82 Obesity
H7 Every New Orleanian has access to high quality and affordable healthcare. I83 Uninsured residents
I84 Access to clinics
H8 New Orleanians are fully healing from the physiological, psychological, and
social trauma of Hurricane Katrina. I85 Sense of normalcy
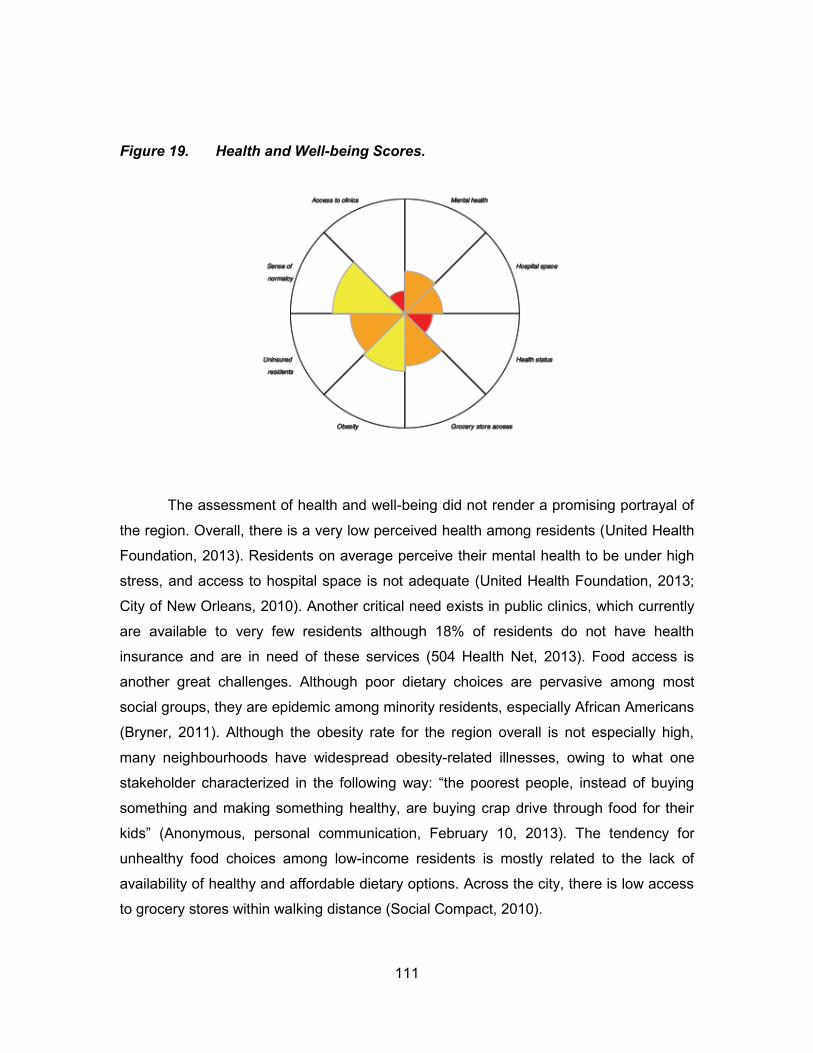
111
Figure 19. Health and Well-being Scores.
The assessment of health and well-being did not render a promising portrayal of
the region. Overall, there is a very low perceived health among residents (United Health
Foundation, 2013). Residents on average perceive their mental health to be under high
stress, and access to hospital space is not adequate (United Health Foundation, 2013;
City of New Orleans, 2010). Another critical need exists in public clinics, which currently
are available to very few residents although 18% of residents do not have health
insurance and are in need of these services (504 Health Net, 2013). Food access is
another great challenges. Although poor dietary choices are pervasive among most
social groups, they are epidemic among minority residents, especially African Americans
(Bryner, 2011). Although the obesity rate for the region overall is not especially high,
many neighbourhoods have widespread obesity-related illnesses, owing to what one
stakeholder characterized in the following way: “the poorest people, instead of buying
something and making something healthy, are buying crap drive through food for their
kids” (Anonymous, personal communication, February 10, 2013). The tendency for
unhealthy food choices among low-income residents is mostly related to the lack of
availability of healthy and affordable dietary options. Across the city, there is low access
to grocery stores within walking distance (Social Compact, 2010).
112
Although the indicators for health and well-being show many challenges, there is
one notable success in the sense of healing from post-Katrina trauma. According to
Mock (2007), 66% of residents surveyed in a region-wide poll perceive their lives to have
returned to a sense of normalcy, representing a movement towards healing from the
stresses of the storm and its aftermath. However, this statistic is much less illustrative
than the actual experience of this healing, which was described evocatively to me by one
stakeholder who recounted the return of his Lower Ninth Ward neighbour to her almost
destroyed home:
“Their house had been rebuilt by a group of volunteers that weren’t very skilled. They got in a hurry and they textured and painted the walls before they were actually done puttin’ all the mud on. And I got called, and we ended up basically tearin’ into all kinds of stuff to get the drywall up. And over five months, she’d come to the house every day. She’d come in the door, just cryin’ her brains out, to the point of being hysterical. And then as she’d start to see progress, and we’d talk a little bit, she would be able to stay in the house longer and longer, and was actually to the point of smiling on a frequent basis, and she started some counselling. By the time she got back in the house, she was much better than she was five or six months before. Her husband, he wouldn’t go in the house at all” (Anonymous, personal communication, August 21, 2012).
5.1.4. Economic Capital
The SRBS reveals a portrait of economic capital in Greater New Orleans with
many strengths but ongoing limitations. The Tool emphasizes labour conditions, the
structure of the regional economy, and the availability of finances to fuel it as the
cornerstones of economic capital (Roseland, 2012; Goodland, 2002; Nozick, 1992). In
terms of these stocks, New Orleans is progressing in important ways but also challenged
by many economic barriers.
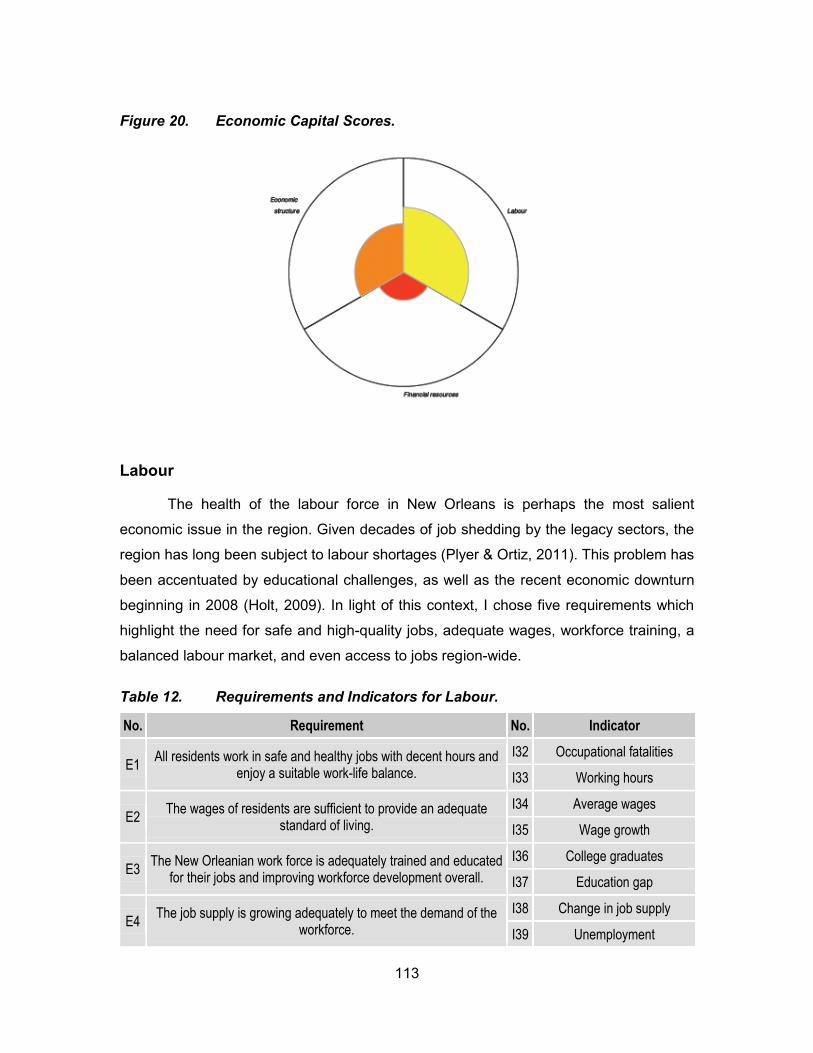
113
Figure 20. Economic Capital Scores.
Labour
The health of the labour force in New Orleans is perhaps the most salient
economic issue in the region. Given decades of job shedding by the legacy sectors, the
region has long been subject to labour shortages (Plyer & Ortiz, 2011). This problem has
been accentuated by educational challenges, as well as the recent economic downturn
beginning in 2008 (Holt, 2009). In light of this context, I chose five requirements which
highlight the need for safe and high-quality jobs, adequate wages, workforce training, a
balanced labour market, and even access to jobs region-wide.
Table 12. Requirements and Indicators for Labour.
No. Requirement No. Indicator
E1 All residents work in safe and healthy jobs with decent hours and
enjoy a suitable work-life balance.
I32 Occupational fatalities
I33 Working hours
E2 The wages of residents are sufficient to provide an adequate
standard of living.
I34 Average wages
I35 Wage growth
E3 The New Orleanian work force is adequately trained and educated
for their jobs and improving workforce development overall.
I36 College graduates
I37 Education gap
E4 The job supply is growing adequately to meet the demand of the
workforce.
I38 Change in job supply
I39 Unemployment
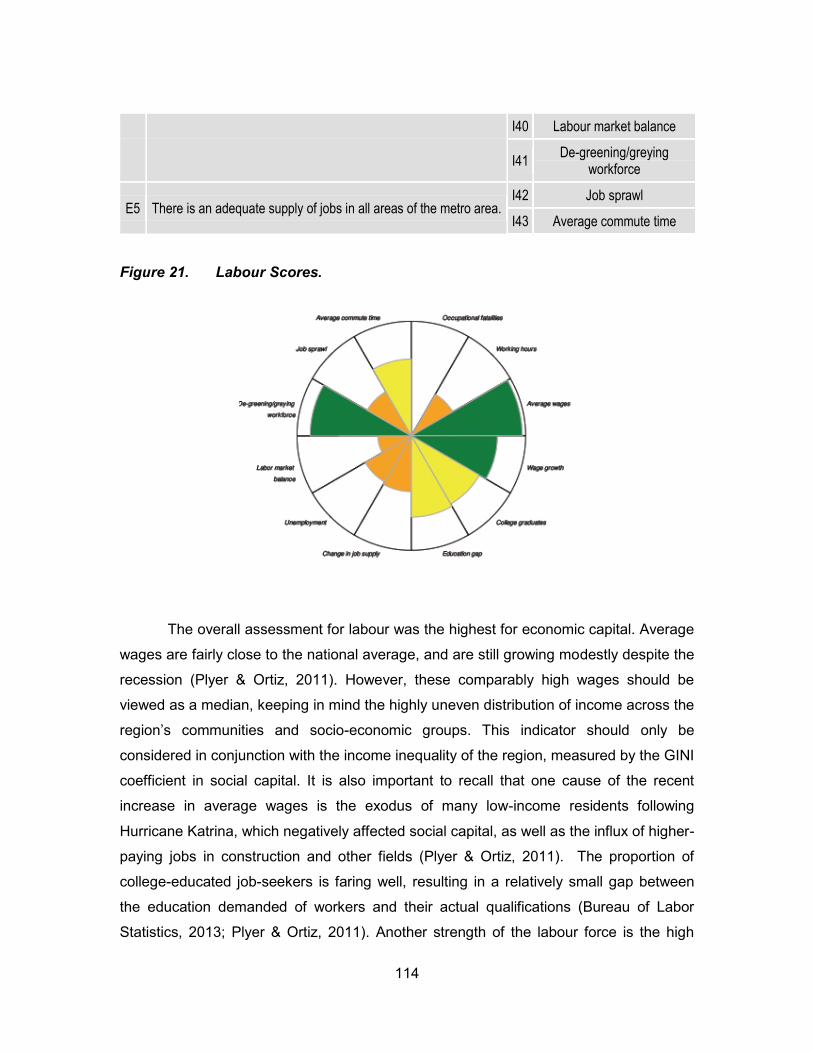
114
I40 Labour market balance
I41 De-greening/greying
workforce
E5 There is an adequate supply of jobs in all areas of the metro area. I42 Job sprawl
I43 Average commute time
Figure 21. Labour Scores.
The overall assessment for labour was the highest for economic capital. Average
wages are fairly close to the national average, and are still growing modestly despite the
recession (Plyer & Ortiz, 2011). However, these comparably high wages should be
viewed as a median, keeping in mind the highly uneven distribution of income across the
region’s communities and socio-economic groups. This indicator should only be
considered in conjunction with the income inequality of the region, measured by the GINI
coefficient in social capital. It is also important to recall that one cause of the recent
increase in average wages is the exodus of many low-income residents following
Hurricane Katrina, which negatively affected social capital, as well as the influx of higher-
paying jobs in construction and other fields (Plyer & Ortiz, 2011). The proportion of
college-educated job-seekers is faring well, resulting in a relatively small gap between
the education demanded of workers and their actual qualifications (Bureau of Labor
Statistics, 2013; Plyer & Ortiz, 2011). Another strength of the labour force is the high
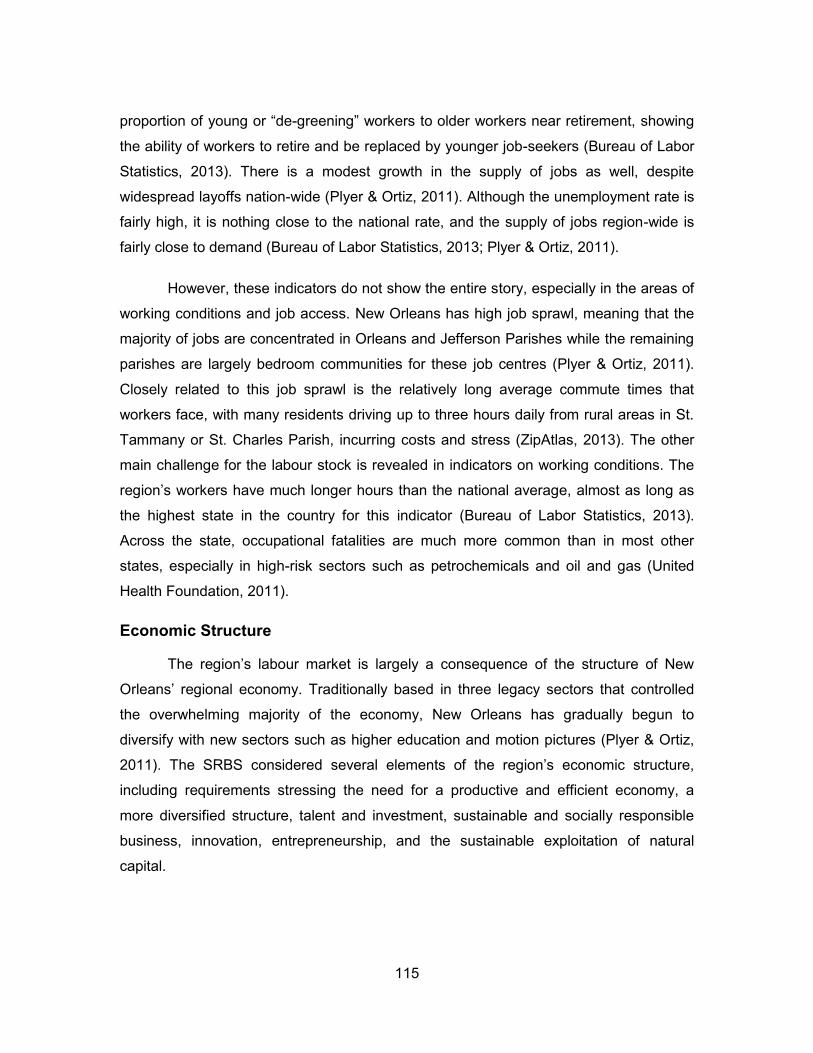
115
proportion of young or “de-greening” workers to older workers near retirement, showing
the ability of workers to retire and be replaced by younger job-seekers (Bureau of Labor
Statistics, 2013). There is a modest growth in the supply of jobs as well, despite
widespread layoffs nation-wide (Plyer & Ortiz, 2011). Although the unemployment rate is
fairly high, it is nothing close to the national rate, and the supply of jobs region-wide is
fairly close to demand (Bureau of Labor Statistics, 2013; Plyer & Ortiz, 2011).
However, these indicators do not show the entire story, especially in the areas of
working conditions and job access. New Orleans has high job sprawl, meaning that the
majority of jobs are concentrated in Orleans and Jefferson Parishes while the remaining
parishes are largely bedroom communities for these job centres (Plyer & Ortiz, 2011).
Closely related to this job sprawl is the relatively long average commute times that
workers face, with many residents driving up to three hours daily from rural areas in St.
Tammany or St. Charles Parish, incurring costs and stress (ZipAtlas, 2013). The other
main challenge for the labour stock is revealed in indicators on working conditions. The
region’s workers have much longer hours than the national average, almost as long as
the highest state in the country for this indicator (Bureau of Labor Statistics, 2013).
Across the state, occupational fatalities are much more common than in most other
states, especially in high-risk sectors such as petrochemicals and oil and gas (United
Health Foundation, 2011).
Economic Structure
The region’s labour market is largely a consequence of the structure of New
Orleans’ regional economy. Traditionally based in three legacy sectors that controlled
the overwhelming majority of the economy, New Orleans has gradually begun to
diversify with new sectors such as higher education and motion pictures (Plyer & Ortiz,
2011). The SRBS considered several elements of the region’s economic structure,
including requirements stressing the need for a productive and efficient economy, a
more diversified structure, talent and investment, sustainable and socially responsible
business, innovation, entrepreneurship, and the sustainable exploitation of natural
capital.
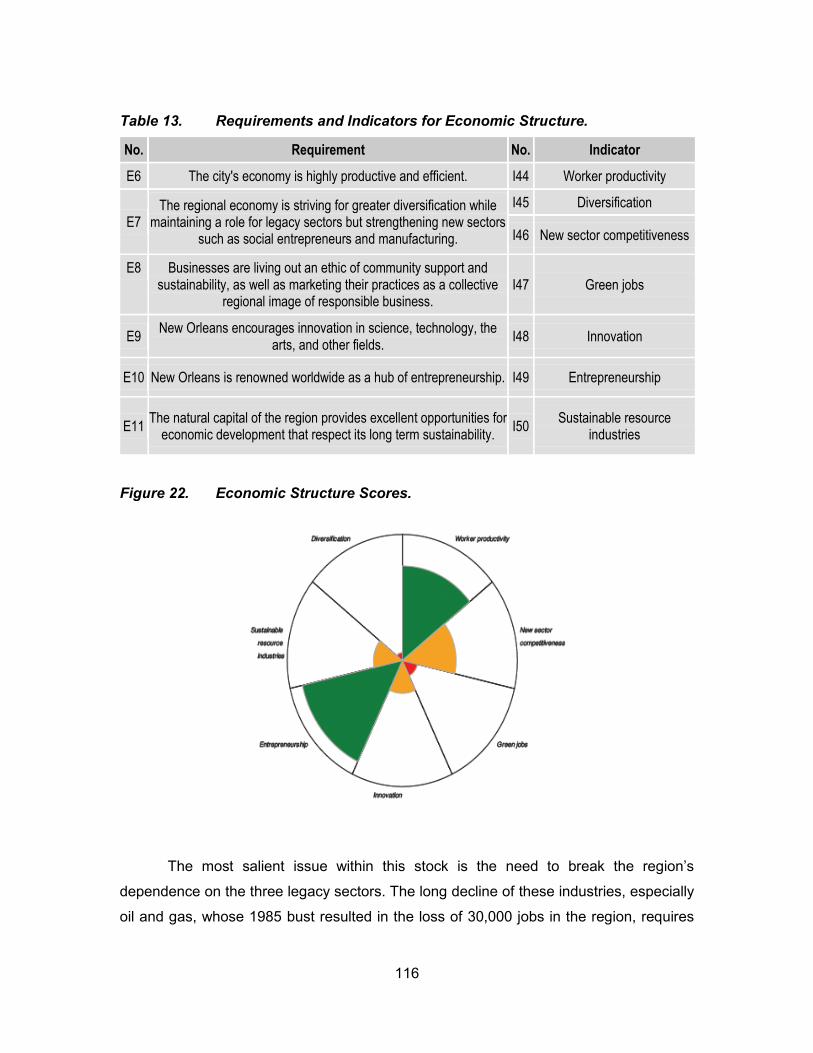
116
Table 13. Requirements and Indicators for Economic Structure.
No. Requirement No. Indicator
E6 The city's economy is highly productive and efficient. I44 Worker productivity
E7 The regional economy is striving for greater diversification while
maintaining a role for legacy sectors but strengthening new sectors such as social entrepreneurs and manufacturing.
I45 Diversification
I46 New sector competitiveness
E8 Businesses are living out an ethic of community support and sustainability, as well as marketing their practices as a collective
regional image of responsible business. I47 Green jobs
E9 New Orleans encourages innovation in science, technology, the
arts, and other fields. I48 Innovation
E10 New Orleans is renowned worldwide as a hub of entrepreneurship. I49 Entrepreneurship
E11 The natural capital of the region provides excellent opportunities for
economic development that respect its long term sustainability. I50
Sustainable resource industries
Figure 22. Economic Structure Scores.
The most salient issue within this stock is the need to break the region’s
dependence on the three legacy sectors. The long decline of these industries, especially
oil and gas, whose 1985 bust resulted in the loss of 30,000 jobs in the region, requires
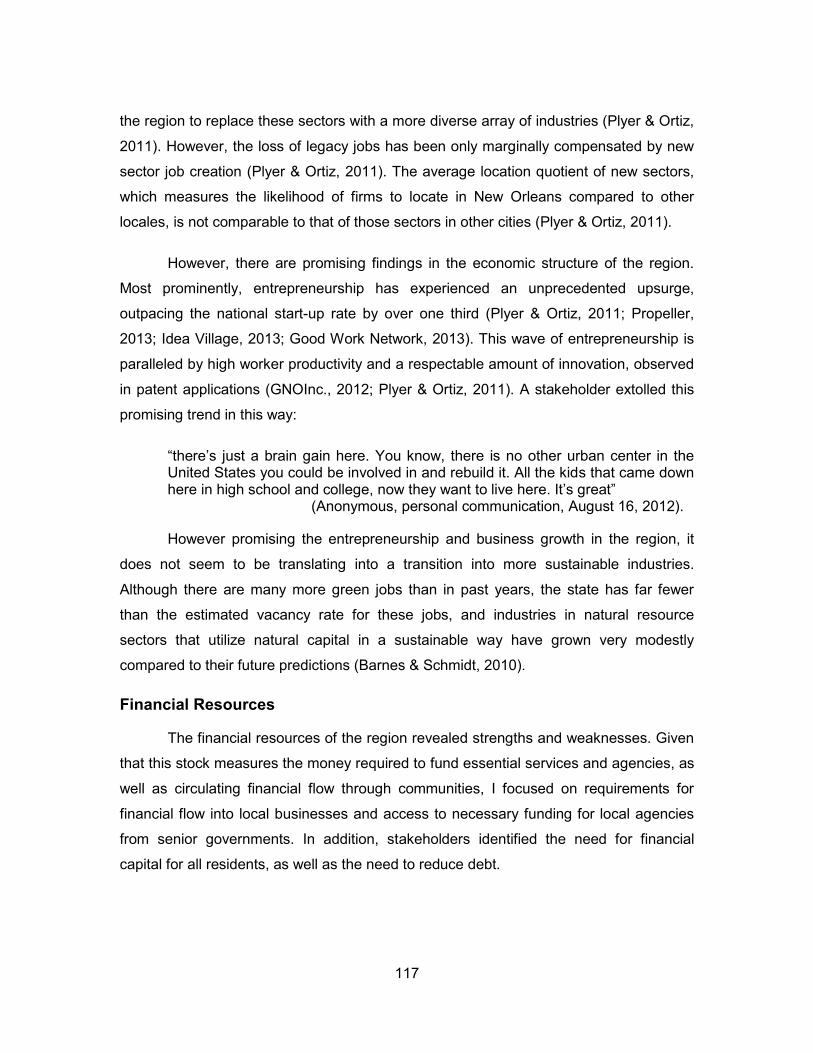
117
the region to replace these sectors with a more diverse array of industries (Plyer & Ortiz,
2011). However, the loss of legacy jobs has been only marginally compensated by new
sector job creation (Plyer & Ortiz, 2011). The average location quotient of new sectors,
which measures the likelihood of firms to locate in New Orleans compared to other
locales, is not comparable to that of those sectors in other cities (Plyer & Ortiz, 2011).
However, there are promising findings in the economic structure of the region.
Most prominently, entrepreneurship has experienced an unprecedented upsurge,
outpacing the national start-up rate by over one third (Plyer & Ortiz, 2011; Propeller,
2013; Idea Village, 2013; Good Work Network, 2013). This wave of entrepreneurship is
paralleled by high worker productivity and a respectable amount of innovation, observed
in patent applications (GNOInc., 2012; Plyer & Ortiz, 2011). A stakeholder extolled this
promising trend in this way:
“there’s just a brain gain here. You know, there is no other urban center in the United States you could be involved in and rebuild it. All the kids that came down here in high school and college, now they want to live here. It’s great” (Anonymous, personal communication, August 16, 2012).
However promising the entrepreneurship and business growth in the region, it
does not seem to be translating into a transition into more sustainable industries.
Although there are many more green jobs than in past years, the state has far fewer
than the estimated vacancy rate for these jobs, and industries in natural resource
sectors that utilize natural capital in a sustainable way have grown very modestly
compared to their future predictions (Barnes & Schmidt, 2010).
Financial Resources
The financial resources of the region revealed strengths and weaknesses. Given
that this stock measures the money required to fund essential services and agencies, as
well as circulating financial flow through communities, I focused on requirements for
financial flow into local businesses and access to necessary funding for local agencies
from senior governments. In addition, stakeholders identified the need for financial
capital for all residents, as well as the need to reduce debt.
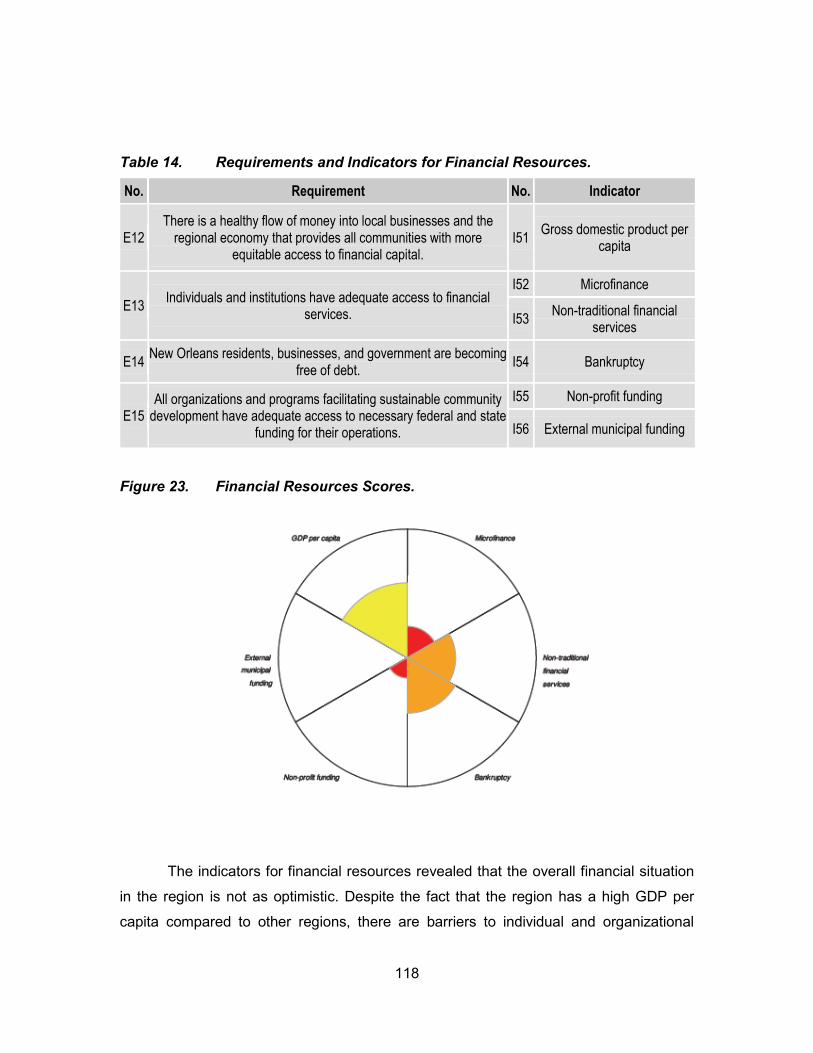
118
Table 14. Requirements and Indicators for Financial Resources.
No. Requirement No. Indicator
E12 There is a healthy flow of money into local businesses and the
regional economy that provides all communities with more equitable access to financial capital.
I51 Gross domestic product per
capita
E13 Individuals and institutions have adequate access to financial
services.
I52 Microfinance
I53 Non-traditional financial
services
E14 New Orleans residents, businesses, and government are becoming
free of debt. I54 Bankruptcy
E15 All organizations and programs facilitating sustainable community
development have adequate access to necessary federal and state funding for their operations.
I55 Non-profit funding
I56 External municipal funding
Figure 23. Financial Resources Scores.
The indicators for financial resources revealed that the overall financial situation
in the region is not as optimistic. Despite the fact that the region has a high GDP per
capita compared to other regions, there are barriers to individual and organizational
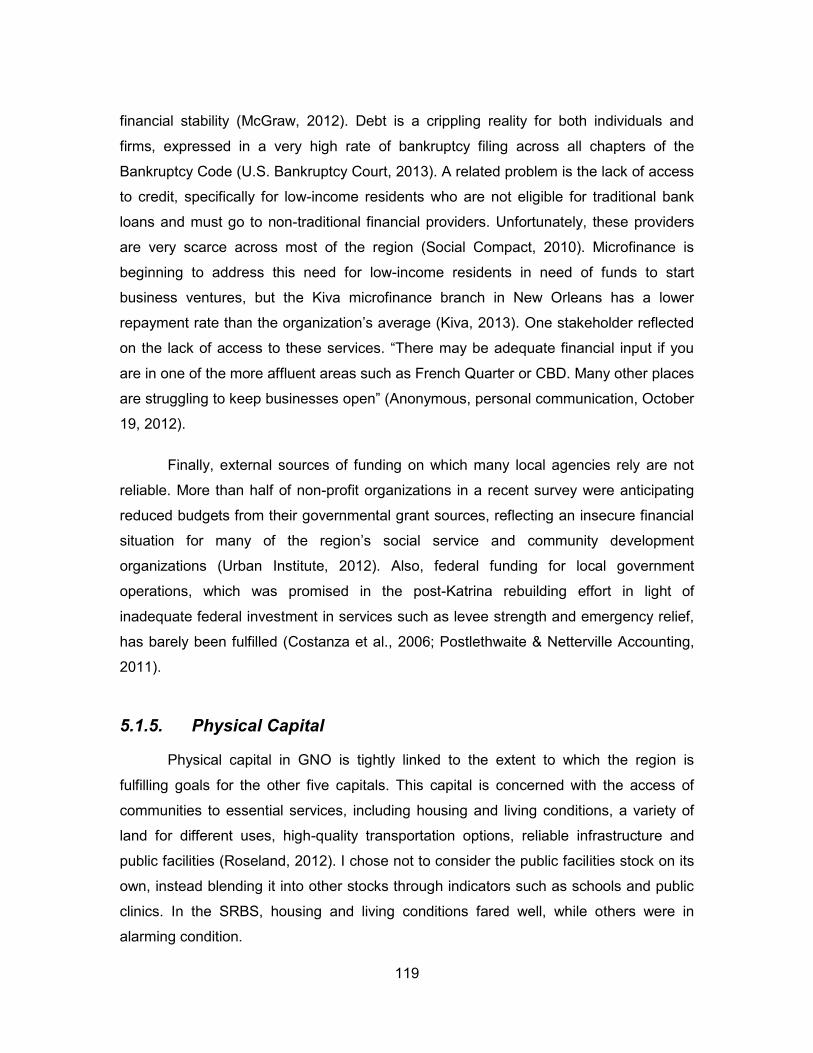
119
financial stability (McGraw, 2012). Debt is a crippling reality for both individuals and
firms, expressed in a very high rate of bankruptcy filing across all chapters of the
Bankruptcy Code (U.S. Bankruptcy Court, 2013). A related problem is the lack of access
to credit, specifically for low-income residents who are not eligible for traditional bank
loans and must go to non-traditional financial providers. Unfortunately, these providers
are very scarce across most of the region (Social Compact, 2010). Microfinance is
beginning to address this need for low-income residents in need of funds to start
business ventures, but the Kiva microfinance branch in New Orleans has a lower
repayment rate than the organization’s average (Kiva, 2013). One stakeholder reflected
on the lack of access to these services. “There may be adequate financial input if you
are in one of the more affluent areas such as French Quarter or CBD. Many other places
are struggling to keep businesses open” (Anonymous, personal communication, October
19, 2012).
Finally, external sources of funding on which many local agencies rely are not
reliable. More than half of non-profit organizations in a recent survey were anticipating
reduced budgets from their governmental grant sources, reflecting an insecure financial
situation for many of the region’s social service and community development
organizations (Urban Institute, 2012). Also, federal funding for local government
operations, which was promised in the post-Katrina rebuilding effort in light of
inadequate federal investment in services such as levee strength and emergency relief,
has barely been fulfilled (Costanza et al., 2006; Postlethwaite & Netterville Accounting,
2011).
5.1.5. Physical Capital
Physical capital in GNO is tightly linked to the extent to which the region is
fulfilling goals for the other five capitals. This capital is concerned with the access of
communities to essential services, including housing and living conditions, a variety of
land for different uses, high-quality transportation options, reliable infrastructure and
public facilities (Roseland, 2012). I chose not to consider the public facilities stock on its
own, instead blending it into other stocks through indicators such as schools and public
clinics. In the SRBS, housing and living conditions fared well, while others were in
alarming condition.
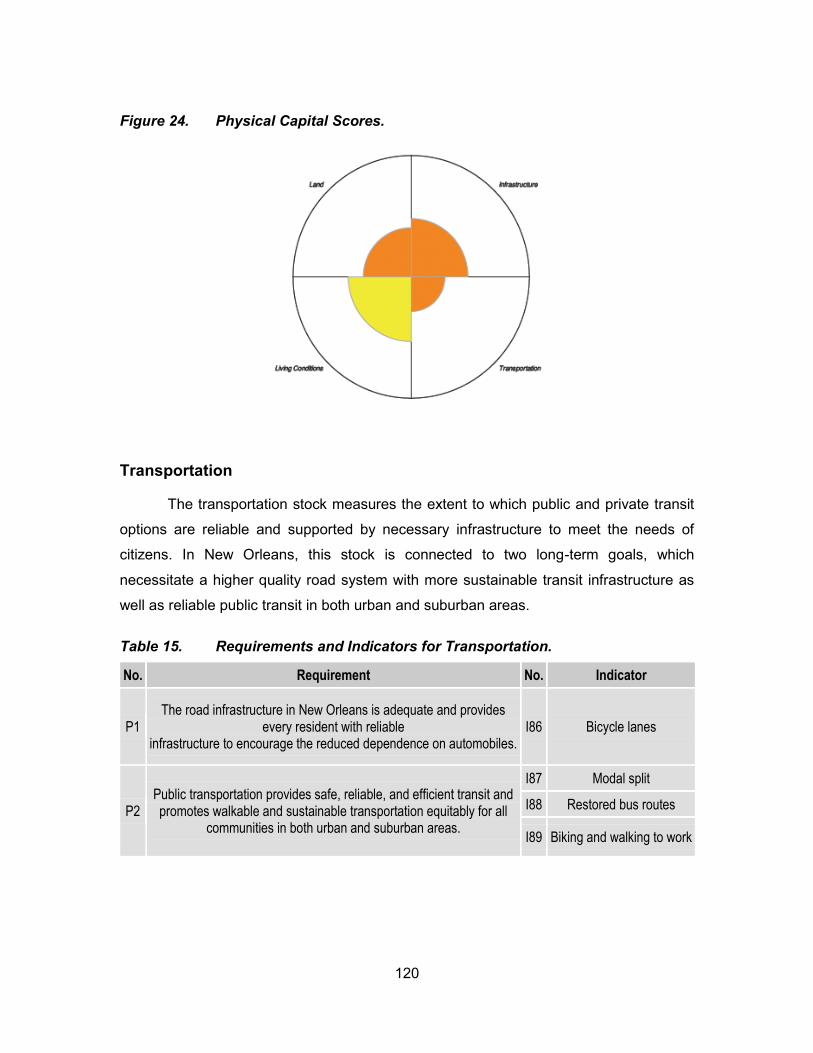
120
Figure 24. Physical Capital Scores.
Transportation
The transportation stock measures the extent to which public and private transit
options are reliable and supported by necessary infrastructure to meet the needs of
citizens. In New Orleans, this stock is connected to two long-term goals, which
necessitate a higher quality road system with more sustainable transit infrastructure as
well as reliable public transit in both urban and suburban areas.
Table 15. Requirements and Indicators for Transportation.
No. Requirement No. Indicator
P1 The road infrastructure in New Orleans is adequate and provides
every resident with reliable infrastructure to encourage the reduced dependence on automobiles.
I86 Bicycle lanes
P2 Public transportation provides safe, reliable, and efficient transit and promotes walkable and sustainable transportation equitably for all
communities in both urban and suburban areas.
I87 Modal split
I88 Restored bus routes
I89 Biking and walking to work
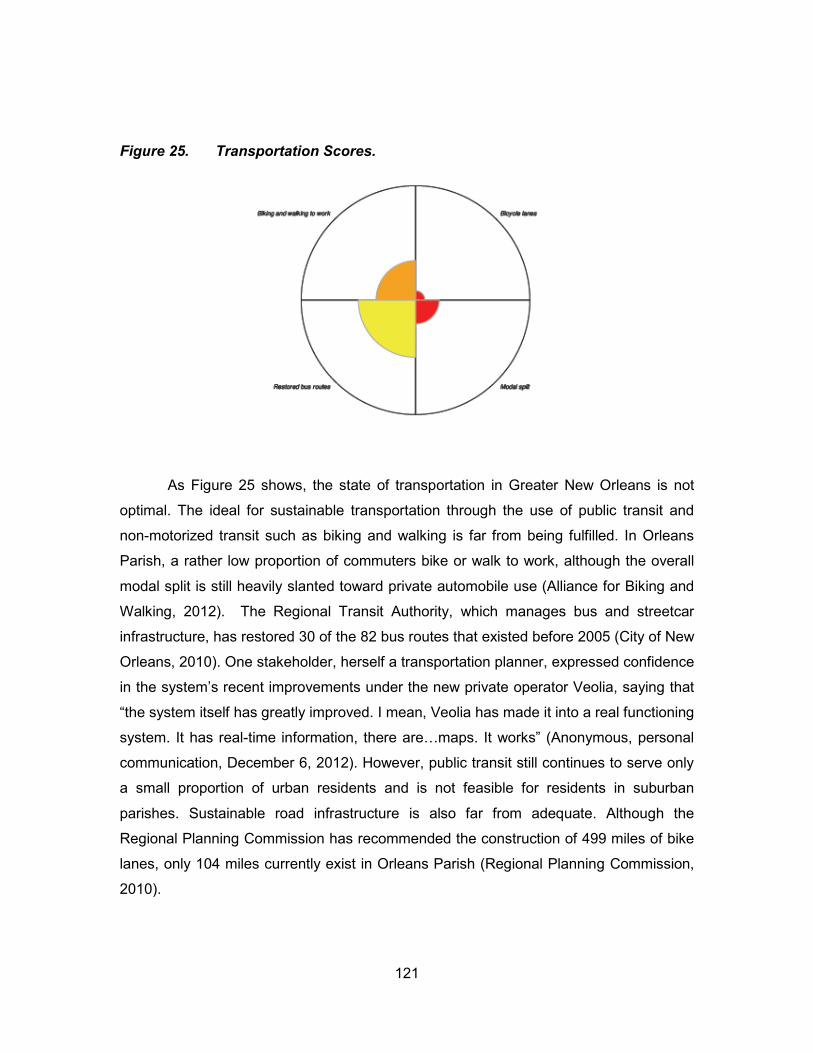
121
Figure 25. Transportation Scores.
As Figure 25 shows, the state of transportation in Greater New Orleans is not
optimal. The ideal for sustainable transportation through the use of public transit and
non-motorized transit such as biking and walking is far from being fulfilled. In Orleans
Parish, a rather low proportion of commuters bike or walk to work, although the overall
modal split is still heavily slanted toward private automobile use (Alliance for Biking and
Walking, 2012). The Regional Transit Authority, which manages bus and streetcar
infrastructure, has restored 30 of the 82 bus routes that existed before 2005 (City of New
Orleans, 2010). One stakeholder, herself a transportation planner, expressed confidence
in the system’s recent improvements under the new private operator Veolia, saying that
“the system itself has greatly improved. I mean, Veolia has made it into a real functioning
system. It has real-time information, there are…maps. It works” (Anonymous, personal
communication, December 6, 2012). However, public transit still continues to serve only
a small proportion of urban residents and is not feasible for residents in suburban
parishes. Sustainable road infrastructure is also far from adequate. Although the
Regional Planning Commission has recommended the construction of 499 miles of bike
lanes, only 104 miles currently exist in Orleans Parish (Regional Planning Commission,
2010).
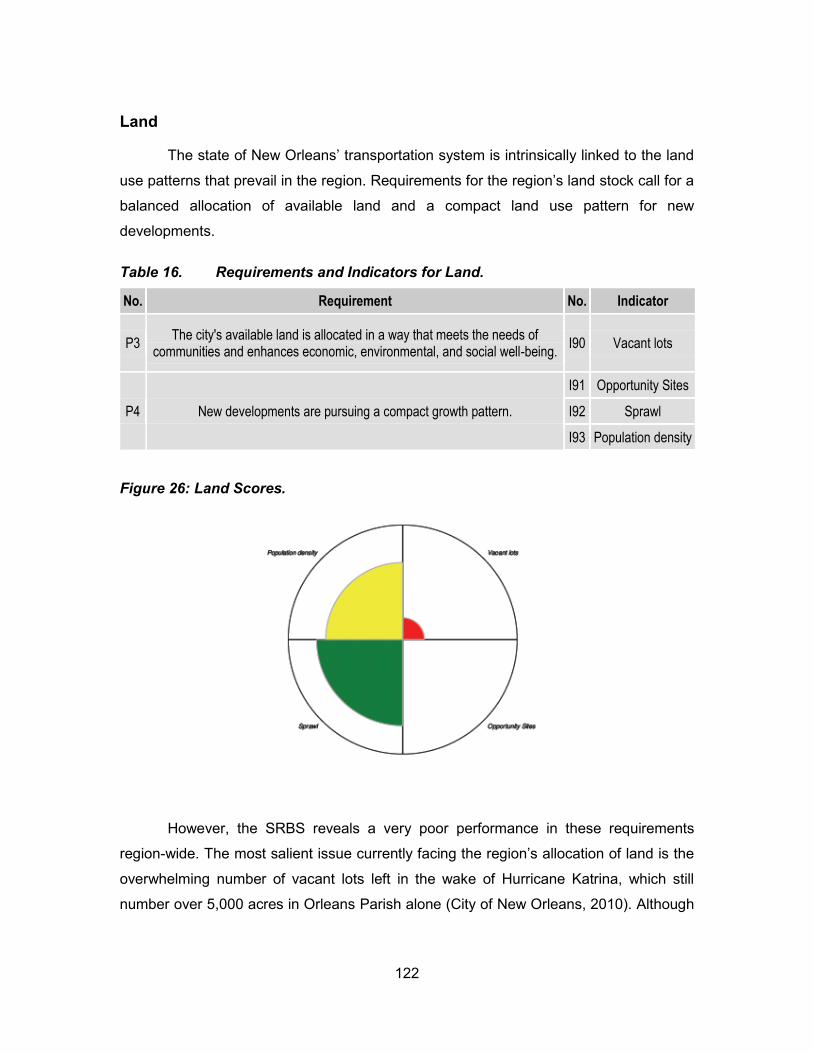
122
Land
The state of New Orleans’ transportation system is intrinsically linked to the land
use patterns that prevail in the region. Requirements for the region’s land stock call for a
balanced allocation of available land and a compact land use pattern for new
developments.
Table 16. Requirements and Indicators for Land.
No. Requirement No. Indicator
P3 The city's available land is allocated in a way that meets the needs of
communities and enhances economic, environmental, and social well-being. I90 Vacant lots
P4 New developments are pursuing a compact growth pattern.
I91 Opportunity Sites
I92 Sprawl
I93 Population density
Figure 26: Land Scores.
However, the SRBS reveals a very poor performance in these requirements
region-wide. The most salient issue currently facing the region’s allocation of land is the
overwhelming number of vacant lots left in the wake of Hurricane Katrina, which still
number over 5,000 acres in Orleans Parish alone (City of New Orleans, 2010). Although
123
many vacant lots have been repurposed for a variety of uses, there has been very little
progress.
Additionally, new developments are not showing progress toward a more
compact land use pattern. None of the currently vacant areas highlighted by New
Orleans’ current Master Plan as Opportunity Sites for mixed use transit-oriented nodes
have begun to be developed (City of New Orleans, 2010). However, the region’s pre-
existing land use pattern is relatively compact despite the failure to develop these new
sites. Population density in Orleans Parish is significantly higher than in suburban
parishes, reflecting a tendency for more intensification in the urban centre than continual
sprawl (CityData, 2013). On a four-point index of sprawl, the region ranked quite well
compared to many other metropolitan areas, and sprawl has slowed considerably after
Hurricane Katrina (Smart Growth America, 2012; City of New Orleans, 2010).
Housing and Living Conditions
In contrast, housing and living conditions are faring much better than land use.
Within the Tool, this stock calls attention to the need for affordable housing options for all
residents and for the improvement of overall living conditions (CC Scan, 2013). In the
SRBS, this focus implied the need for the region to pursue goals of reducing urban
blight, increasing affordable housing in a socially harmonious way, pursuing rebuilding
through energy and material efficiency, improving chances for home ownership, and
improving neighbourhood quality of life through public waterscapes.
Table 17. Requirements and Indicators for Housing and Living Conditions.
No. Requirement No. Indicator
P5 Neighbourhoods of New Orleans are reducing blight and urban
decay.
I94 Blight
I95 Blight reduction
P6 All New Orleanians have access to affordable housing that
blends incomes and reduces the concentration of poverty while creating more harmony between socio-economic groups.
I96 Unaffordable housing
I97 Affordable housing construction
I98 Mortgage rates
P7 The reconstruction of New Orleans restores the building stock
to a more energy- and material-efficient standard by meeting or exceeding building code requirements.
I99 Rebuilding
I100 LEED buildings
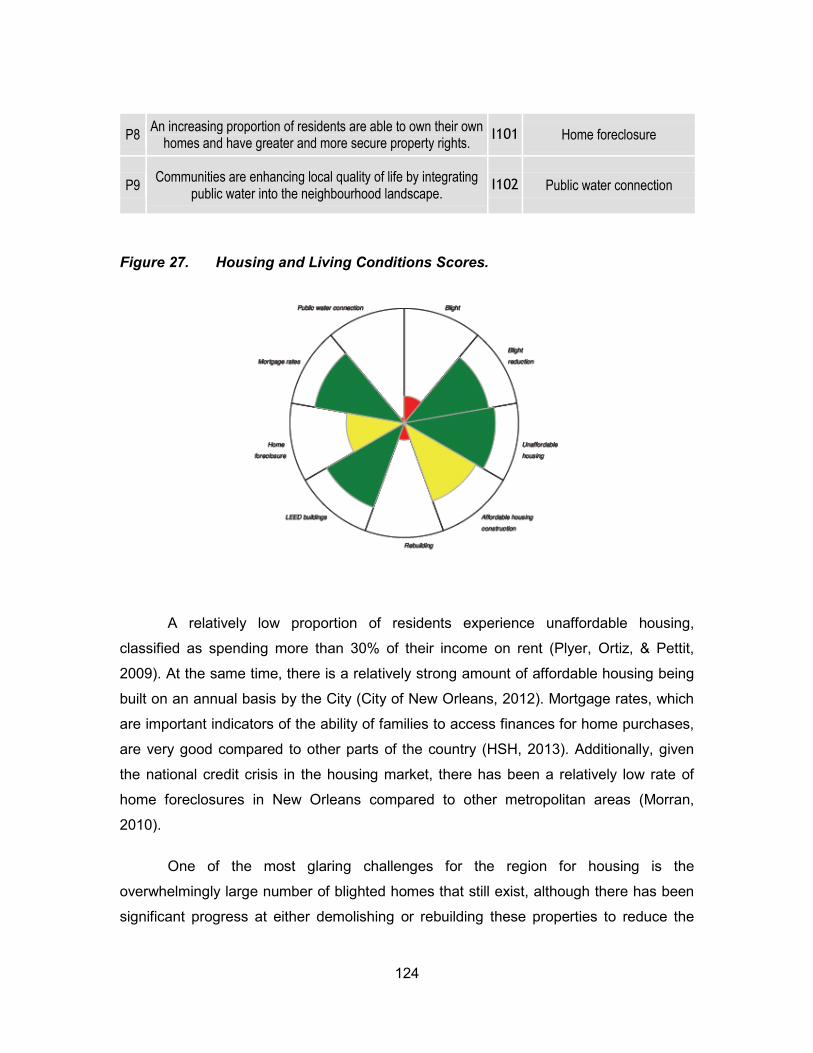
124
P8 An increasing proportion of residents are able to own their own
homes and have greater and more secure property rights. I101 Home foreclosure
P9 Communities are enhancing local quality of life by integrating
public water into the neighbourhood landscape. I102 Public water connection
Figure 27. Housing and Living Conditions Scores.
A relatively low proportion of residents experience unaffordable housing,
classified as spending more than 30% of their income on rent (Plyer, Ortiz, & Pettit,
2009). At the same time, there is a relatively strong amount of affordable housing being
built on an annual basis by the City (City of New Orleans, 2012). Mortgage rates, which
are important indicators of the ability of families to access finances for home purchases,
are very good compared to other parts of the country (HSH, 2013). Additionally, given
the national credit crisis in the housing market, there has been a relatively low rate of
home foreclosures in New Orleans compared to other metropolitan areas (Morran,
2010).
One of the most glaring challenges for the region for housing is the
overwhelmingly large number of blighted homes that still exist, although there has been
significant progress at either demolishing or rebuilding these properties to reduce the
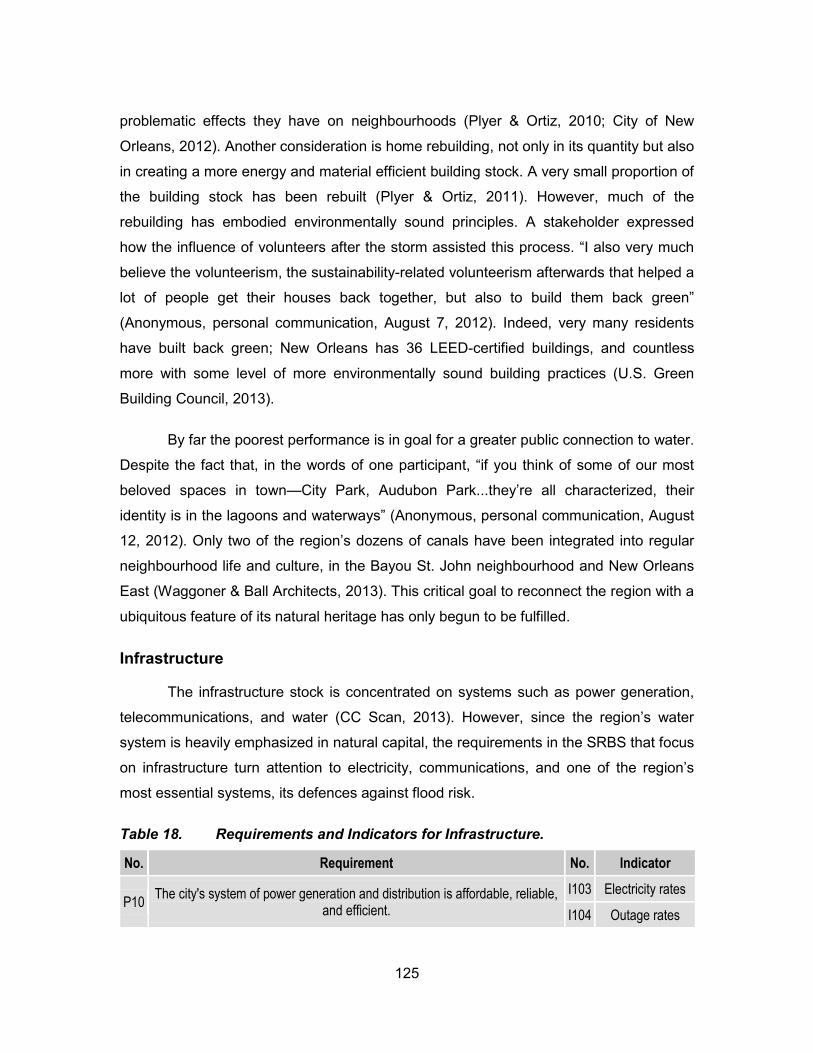
125
problematic effects they have on neighbourhoods (Plyer & Ortiz, 2010; City of New
Orleans, 2012). Another consideration is home rebuilding, not only in its quantity but also
in creating a more energy and material efficient building stock. A very small proportion of
the building stock has been rebuilt (Plyer & Ortiz, 2011). However, much of the
rebuilding has embodied environmentally sound principles. A stakeholder expressed
how the influence of volunteers after the storm assisted this process. “I also very much
believe the volunteerism, the sustainability-related volunteerism afterwards that helped a
lot of people get their houses back together, but also to build them back green”
(Anonymous, personal communication, August 7, 2012). Indeed, very many residents
have built back green; New Orleans has 36 LEED-certified buildings, and countless
more with some level of more environmentally sound building practices (U.S. Green
Building Council, 2013).
By far the poorest performance is in goal for a greater public connection to water.
Despite the fact that, in the words of one participant, “if you think of some of our most
beloved spaces in town—City Park, Audubon Park...they’re all characterized, their
identity is in the lagoons and waterways” (Anonymous, personal communication, August
12, 2012). Only two of the region’s dozens of canals have been integrated into regular
neighbourhood life and culture, in the Bayou St. John neighbourhood and New Orleans
East (Waggoner & Ball Architects, 2013). This critical goal to reconnect the region with a
ubiquitous feature of its natural heritage has only begun to be fulfilled.
Infrastructure
The infrastructure stock is concentrated on systems such as power generation,
telecommunications, and water (CC Scan, 2013). However, since the region’s water
system is heavily emphasized in natural capital, the requirements in the SRBS that focus
on infrastructure turn attention to electricity, communications, and one of the region’s
most essential systems, its defences against flood risk.
Table 18. Requirements and Indicators for Infrastructure.
No. Requirement No. Indicator
P10 The city's system of power generation and distribution is affordable, reliable,
and efficient.
I103 Electricity rates
I104 Outage rates
126
P11 Telecommunications infrastructure provides all residents with reliable access
to information technology services. I105 Internet access
P12 All residents are protected from the risk of flooding and hurricane-related
damage through an adequate mixture of engineered and ecosystem-based lines of defence.
I106 Flooding risk
I107 Levees
I108 Hazard mitigation
Figure 28. Infrastructure Scores.
These goals show both progress and challenges toward their fulfillment. The
most promising indicators within infrastructure are related to the region’s power
generation. Overseen by utilities such as Entergy and Cleco, New Orleans’ electricity
system provides power at a very affordable rate while preventing outages very
consistently (Entergy, 2011). However, the goal of accessible and reliable
telecommunications is not being realized. The need for internet usage in all aspects of
daily life implies that access to the internet is a key indicator of telecommunications,
which is currently not highly accessible to residents in comparison with the national
average (Internet World Stats, 2012). One stakeholder explained the internet access in
his neighbourhood:
“my internet access is limited to my cell phone or traveling to the closest wifi spot. In the Lower 9th Ward I can go to the library on Claiborne when they're open. It doesn't work outside the building. That's all there is. I don't even know anyone
127
around my house who has the internet” (Anonymous, personal communication, October 19, 2012).
Finally, perhaps the most important infrastructural consideration for the region is
the need for dependable flood protection systems. Although many of the solutions to
flooding risk lie not in human-made systems but in ecosystem-based approaches to risk
reduction, the levees surrounding much of the region are extremely important and were
demonstrated to be absolutely inadequate in 2005. However, the Army Corps of
Engineers federal levee system is making considerable progress toward upgrading all
350 miles of the system (Sinkler, 2010). This system is extremely important given the
fact that residents on average can expect eight feet of flood risk from a significant
hurricane or other flood event (City of New Orleans, 2010). Another indicator of flood-
related infrastructure are the modifications that residents have made to their own homes
to mitigate natural hazards, which is severely behind schedule in Orleans Parish (City of
New Orleans, 2012).
5.1.6. Natural Capital
Last, but most certainly not least, is the status of Greater New Orleans’ natural
capital. The health of New Orleans’ ecological systems is truly the basis of a sustainable
region and the wider system on which the human subsystems described in the previous
five capitals depend. The reliance of the region’s social, economic, institutional, and
cultural integrity on the health of the ecosystem is more apparent than in other
metropolitan regions. Whether observed in the dependence of the regional economy on
non-renewable fossil fuel resources, the ever-receding coastline, or the spectre of
climate change for below sea-level communities, the importance of natural capital
cannot be overstated. In the SRBS, the greatest threats to New Orleans’ natural capital
are in its groundwater and soil, while landscape and minerals and non-renewable
resources are also in alarming condition. However, some promise is visible in air and
surface water, as shown below in Figure 29.
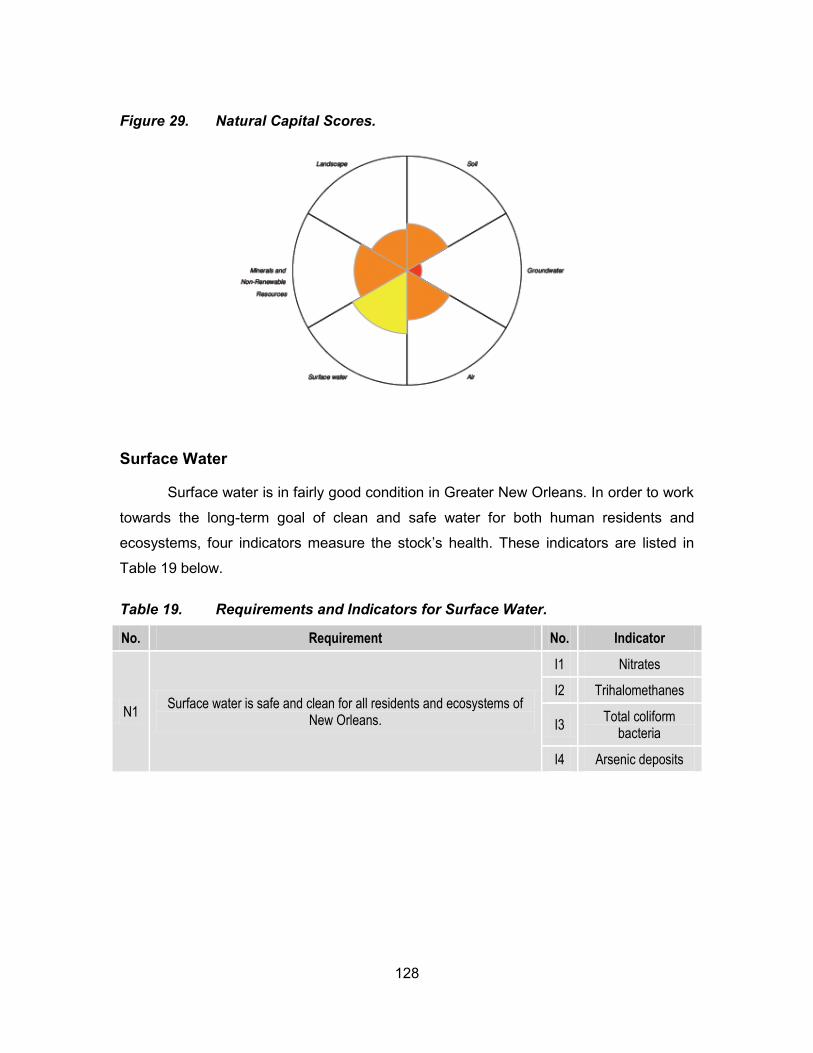
128
Figure 29. Natural Capital Scores.
Surface Water
Surface water is in fairly good condition in Greater New Orleans. In order to work
towards the long-term goal of clean and safe water for both human residents and
ecosystems, four indicators measure the stock’s health. These indicators are listed in
Table 19 below.
Table 19. Requirements and Indicators for Surface Water.
No. Requirement No. Indicator
N1 Surface water is safe and clean for all residents and ecosystems of
New Orleans.
I1 Nitrates
I2 Trihalomethanes
I3 Total coliform
bacteria
I4 Arsenic deposits
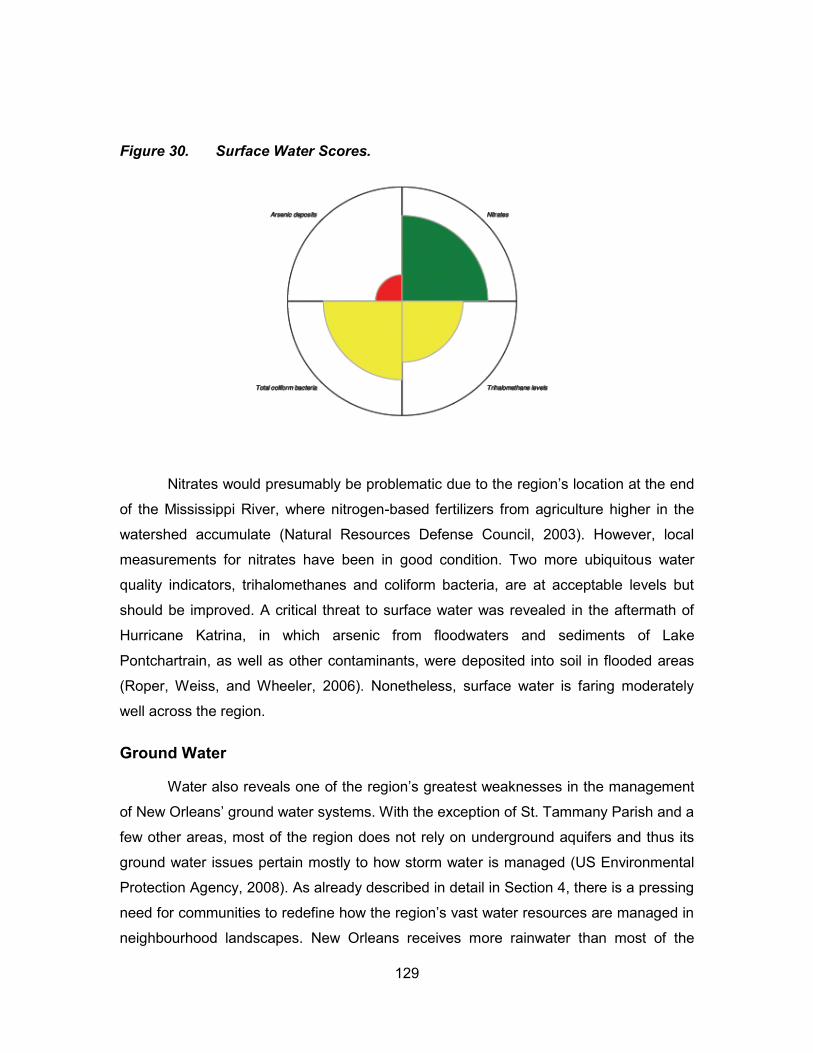
129
Figure 30. Surface Water Scores.
Nitrates would presumably be problematic due to the region’s location at the end
of the Mississippi River, where nitrogen-based fertilizers from agriculture higher in the
watershed accumulate (Natural Resources Defense Council, 2003). However, local
measurements for nitrates have been in good condition. Two more ubiquitous water
quality indicators, trihalomethanes and coliform bacteria, are at acceptable levels but
should be improved. A critical threat to surface water was revealed in the aftermath of
Hurricane Katrina, in which arsenic from floodwaters and sediments of Lake
Pontchartrain, as well as other contaminants, were deposited into soil in flooded areas
(Roper, Weiss, and Wheeler, 2006). Nonetheless, surface water is faring moderately
well across the region.
Ground Water
Water also reveals one of the region’s greatest weaknesses in the management
of New Orleans’ ground water systems. With the exception of St. Tammany Parish and a
few other areas, most of the region does not rely on underground aquifers and thus its
ground water issues pertain mostly to how storm water is managed (US Environmental
Protection Agency, 2008). As already described in detail in Section 4, there is a pressing
need for communities to redefine how the region’s vast water resources are managed in
neighbourhood landscapes. New Orleans receives more rainwater than most of the
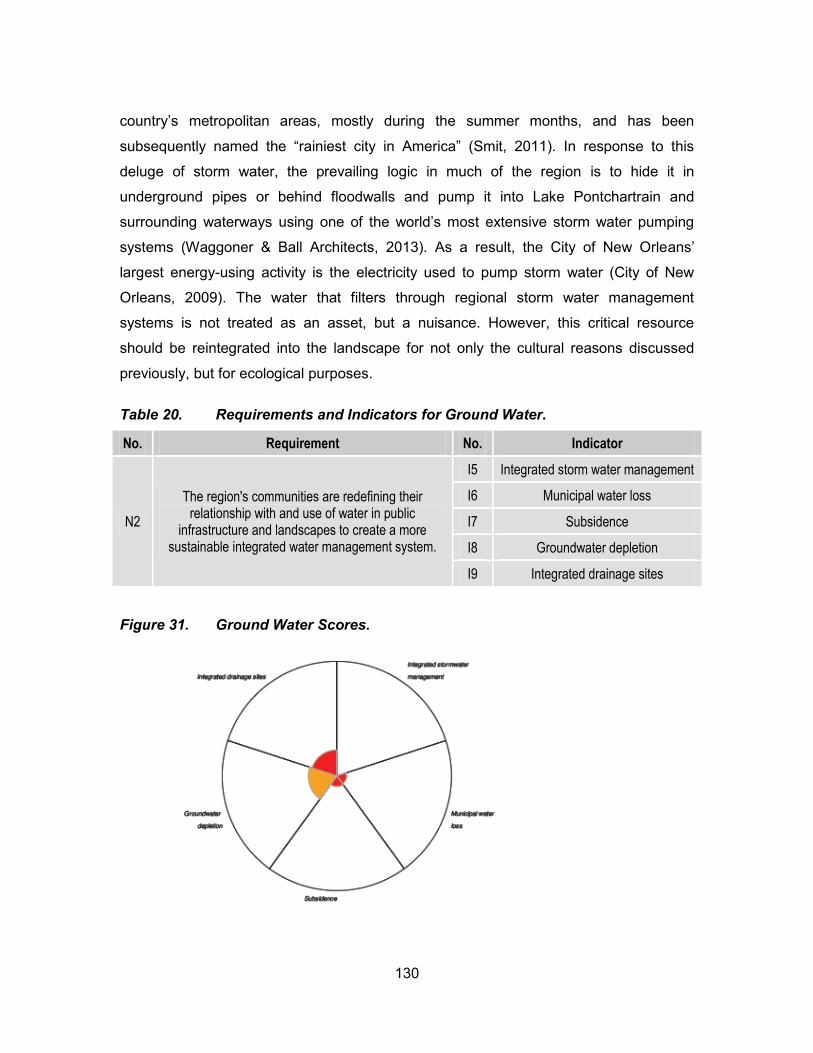
130
country’s metropolitan areas, mostly during the summer months, and has been
subsequently named the “rainiest city in America” (Smit, 2011). In response to this
deluge of storm water, the prevailing logic in much of the region is to hide it in
underground pipes or behind floodwalls and pump it into Lake Pontchartrain and
surrounding waterways using one of the world’s most extensive storm water pumping
systems (Waggoner & Ball Architects, 2013). As a result, the City of New Orleans’
largest energy-using activity is the electricity used to pump storm water (City of New
Orleans, 2009). The water that filters through regional storm water management
systems is not treated as an asset, but a nuisance. However, this critical resource
should be reintegrated into the landscape for not only the cultural reasons discussed
previously, but for ecological purposes.
Table 20. Requirements and Indicators for Ground Water.
No. Requirement No. Indicator
N2
The region's communities are redefining their relationship with and use of water in public
infrastructure and landscapes to create a more sustainable integrated water management system.
I5 Integrated storm water management
I6 Municipal water loss
I7 Subsidence
I8 Groundwater depletion
I9 Integrated drainage sites
Figure 31. Ground Water Scores.
131
The ground water stock demonstrates the pressing need for a sustainable storm
water management system in the region. In the strict sense of aquifers, which is only
relevant for residents of St. Tammany Parish, this stock of ground water is threatened by
a fairly fast rate of ground water depletion (EPA, 2008). In the city, the most problematic
ecological consequence of the elaborate pumping system is subsidence, whereby the
sucking of groundwater out of soil causes it to compress and literally sink, in some areas
as fast as almost a centimetre per year (Dixon, Amelung, & Ferretti, 2006). This
subsidence results in the drying out of soil and widespread foundation problems for
buildings resulting in a large foundation repair industry in the region. However, there are
plans for a sustainable form of storm water management that recommends a more
ecosystem-based approach with the storage of water at the surface and reliance on
natural filtration processes and the reintegration of canals and bayous into the urban
landscape to drain storm water more gradually (Waggoner & Ball Architects, 2013).
Efforts such as the Dutch Dialogues and Living With Water have recommended
revitalizing a handful of the region’s dozens of outflow canals into functioning
ecosystems that embody this sustainable drainage approach while creating liveable
community park space (Waggoner & Ball Architects, 2013). However, none of these pilot
projects have been implemented at the scale of canals, and only a small handful of
smaller scale household or institutional drainage projects, such as rain gardens, have
been built (Waggoner & Ball Architects, 2013). A stakeholder explained the way that this
continual reliance on the unsustainable drainage system is affecting her neighbourhood:
“I recently heard that we are going to be getting drainage on the street that we live on, Louisiana Avenue, where they’re going to be putting in pipes to pump water out. But according to the architects who went to Amsterdam and worked on…what should be the best practices for the city, that is just a really old school and ineffective way of controlling the water. It really shouldn’t happen” (Anonymous, personal communication, August 6, 2012).
Air
The air stock encapsulates both local air quality as well as the contribution of a
community to climate change through greenhouse gas emissions. In Greater New
Orleans, long-term goals focus on these two aspects of the stock, and reveal a relatively
positive performance of the region overall.
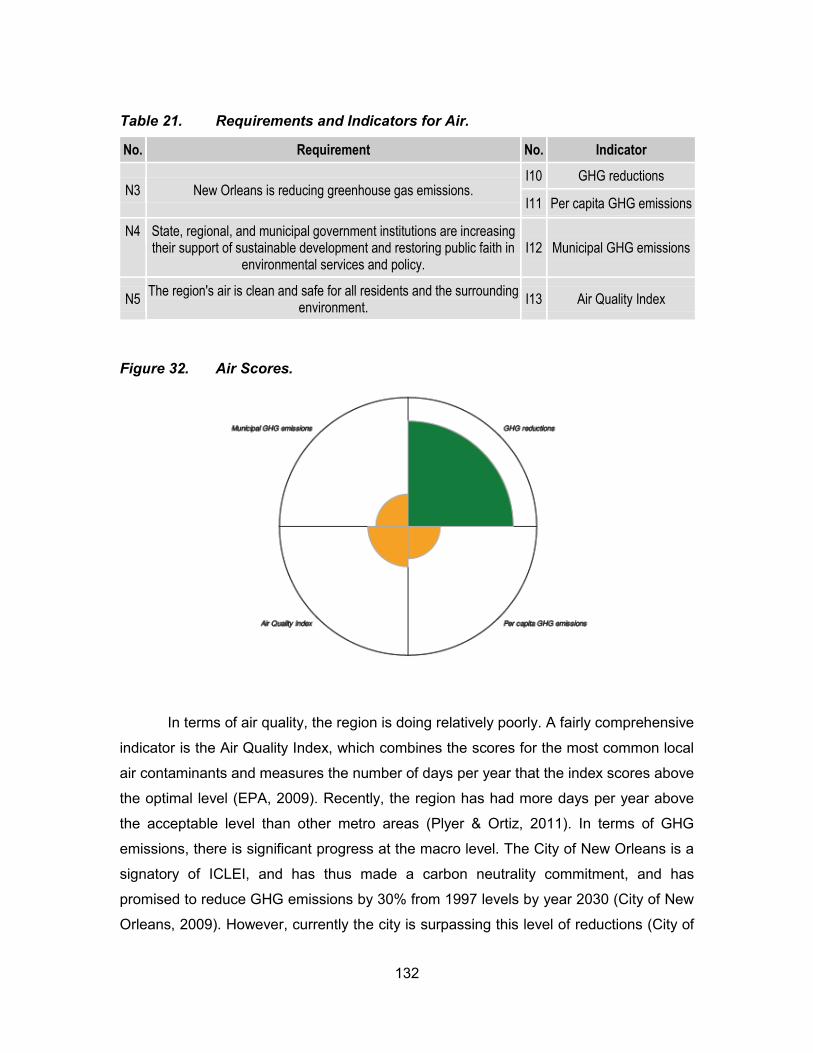
132
Table 21. Requirements and Indicators for Air.
No. Requirement No. Indicator
N3 New Orleans is reducing greenhouse gas emissions. I10 GHG reductions
I11 Per capita GHG emissions
N4 State, regional, and municipal government institutions are increasing their support of sustainable development and restoring public faith in
environmental services and policy. I12 Municipal GHG emissions
N5 The region's air is clean and safe for all residents and the surrounding
environment. I13 Air Quality Index
Figure 32. Air Scores.
In terms of air quality, the region is doing relatively poorly. A fairly comprehensive
indicator is the Air Quality Index, which combines the scores for the most common local
air contaminants and measures the number of days per year that the index scores above
the optimal level (EPA, 2009). Recently, the region has had more days per year above
the acceptable level than other metro areas (Plyer & Ortiz, 2011). In terms of GHG
emissions, there is significant progress at the macro level. The City of New Orleans is a
signatory of ICLEI, and has thus made a carbon neutrality commitment, and has
promised to reduce GHG emissions by 30% from 1997 levels by year 2030 (City of New
Orleans, 2009). However, currently the city is surpassing this level of reductions (City of
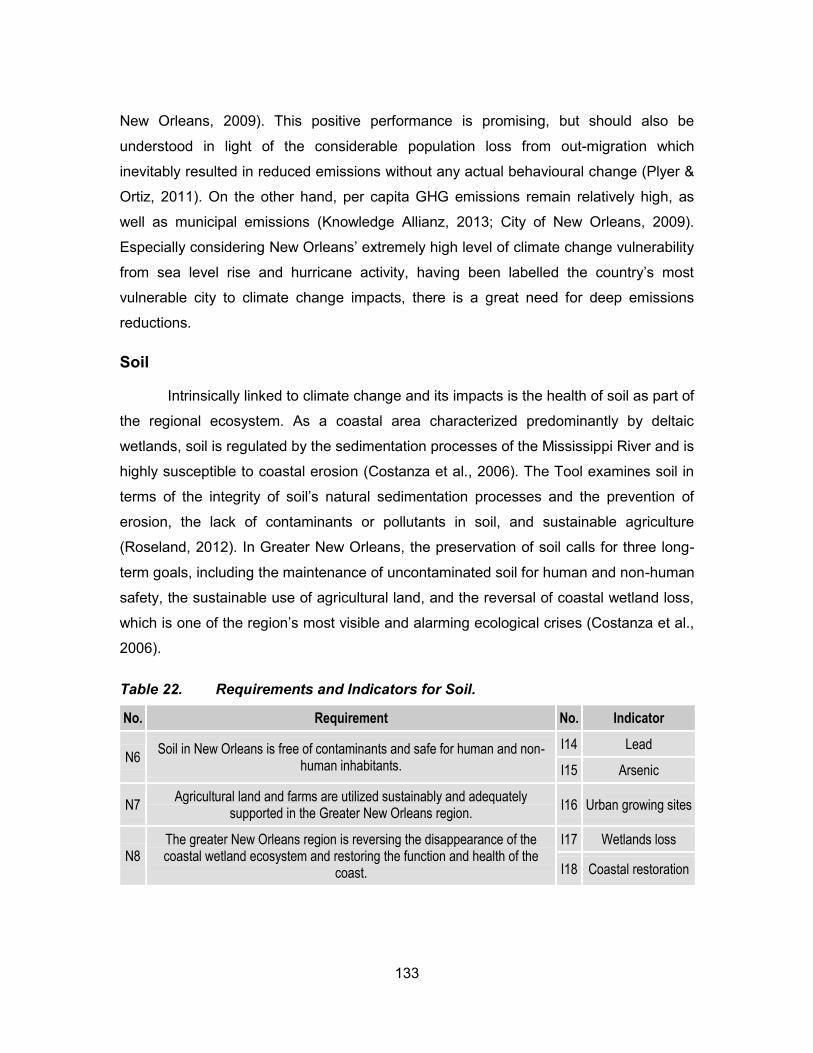
133
New Orleans, 2009). This positive performance is promising, but should also be
understood in light of the considerable population loss from out-migration which
inevitably resulted in reduced emissions without any actual behavioural change (Plyer &
Ortiz, 2011). On the other hand, per capita GHG emissions remain relatively high, as
well as municipal emissions (Knowledge Allianz, 2013; City of New Orleans, 2009).
Especially considering New Orleans’ extremely high level of climate change vulnerability
from sea level rise and hurricane activity, having been labelled the country’s most
vulnerable city to climate change impacts, there is a great need for deep emissions
reductions.
Soil
Intrinsically linked to climate change and its impacts is the health of soil as part of
the regional ecosystem. As a coastal area characterized predominantly by deltaic
wetlands, soil is regulated by the sedimentation processes of the Mississippi River and is
highly susceptible to coastal erosion (Costanza et al., 2006). The Tool examines soil in
terms of the integrity of soil’s natural sedimentation processes and the prevention of
erosion, the lack of contaminants or pollutants in soil, and sustainable agriculture
(Roseland, 2012). In Greater New Orleans, the preservation of soil calls for three long-
term goals, including the maintenance of uncontaminated soil for human and non-human
safety, the sustainable use of agricultural land, and the reversal of coastal wetland loss,
which is one of the region’s most visible and alarming ecological crises (Costanza et al.,
2006).
Table 22. Requirements and Indicators for Soil.
No. Requirement No. Indicator
N6 Soil in New Orleans is free of contaminants and safe for human and non-
human inhabitants.
I14 Lead
I15 Arsenic
N7 Agricultural land and farms are utilized sustainably and adequately
supported in the Greater New Orleans region. I16 Urban growing sites
N8 The greater New Orleans region is reversing the disappearance of the coastal wetland ecosystem and restoring the function and health of the
coast.
I17 Wetlands loss
I18 Coastal restoration
134
Figure 33. Soil Scores.
The most positively ranked indicators were in soil contaminants. Two common
soil pollutants in the region, lead and arsenic, have been tested extensively within
Orleans Parish and are at relatively safe levels; although lead is very high in some
neighbourhoods, its overall concentration in the city is relatively low (Rabito, Iqbal, Perry,
Arroyave, & Rice, 2012). Arsenic was deposited into soil throughout the region by
Hurricane Katrina’s floodwaters, but has dissipated to a safe concentration in most areas
(Rotkin-Ellman, Somolon, Gonzales, Agwaramgbo, & Mielke, 2009). However, the
region is not doing well at protecting soil through sustainable agriculture. Many parishes
have significant agricultural production, but urban growing sites reflect how the
urbanized area’s vast amounts of arable land, especially in vacant lots, are being left to
idle despite the great need for healthy food access in many neighbourhoods (New
Orleans Food and Farm Network, 2013).
Despite the importance of these indicators, the most critical requirement for the
region’s soil is the reversal of coastal wetland loss. Since the 1930s, a suite of activities
ranging from river diversion to oil and gas shipping has choked the natural flow of
sedimentation that fuels the dynamic deltaic wetland on which New Orleans was built, as
well as accelerated saltwater intrusion into freshwater swamps and marshes (Costanza
et al., 2006). The result has been the most dramatic land loss event in the country, with
135
over 1800 square miles of land disappearing into the Gulf of Mexico at a rate of 16
square miles per year (State of Louisiana, 2012). This dire situation has long been the
focus of ecologists and local activists, whose cause recently won a considerable victory
through the federal RESTORE Act, which will funnel British Petroleum oil spill fines into
funding for coastal restoration (RESTORE, 2013). One stakeholder, herself a long-time
advocate of coastal restoration, explained that “the oil spill was by far the…biggest thing
that brought…the eyes and ears of the nation to coastal Louisiana. And in the end that’s
what’s going to pay for restoration, at least the big part of it” (Anonymous, personal
communication, August 7, 2012).
Currently, very few coastal wetlands have been restored (State of Louisiana,
2012). One promising development is the adoption in 2012 of a state-level master plan
to restore wetlands, which identifies over 100 restoration projects and, if implemented,
could restore up to 800 square miles of wetlands in the next 50 years (State of
Louisiana, 2012). The recommendations of this plan should be followed and exceeded if
the region’s soils and, in a way, of the region itself, is to have a future.
Minerals and Non-renewable Resources
Natural capital cannot be brought to a healthier state in the region without
envisioning a more sustainable paradigm for the region’s non-renewable resources. The
Tool calls for communities both to reduce the extraction of non-renewable resources
and, when continuing to exploit them, to do so only in environmentally safe ways (CC
Scan, 2013). These goals have vast implications for New Orleans, which built much of
its economic system on oil and gas extraction (Plyer & Ortiz, 2011). This stock also
considers sustainable waste management, as well as energy use. There are five long-
term goals calling to minimize the impacts of fossil fuel industries, reduce non-renewable
resource exploitation, reduce waste, increase energy efficiency and conservation, and
expand renewable energy.
Table 23. Requirements and Indicators for Minerals and Non-renewable Resources.
No. Requirement No. Indicator
N9 Extraction of fossil fuels in the Greater New Orleans region is
minimizing environmental and social impacts.
I19 Hazardous waste
I20 Oil spill cleanup
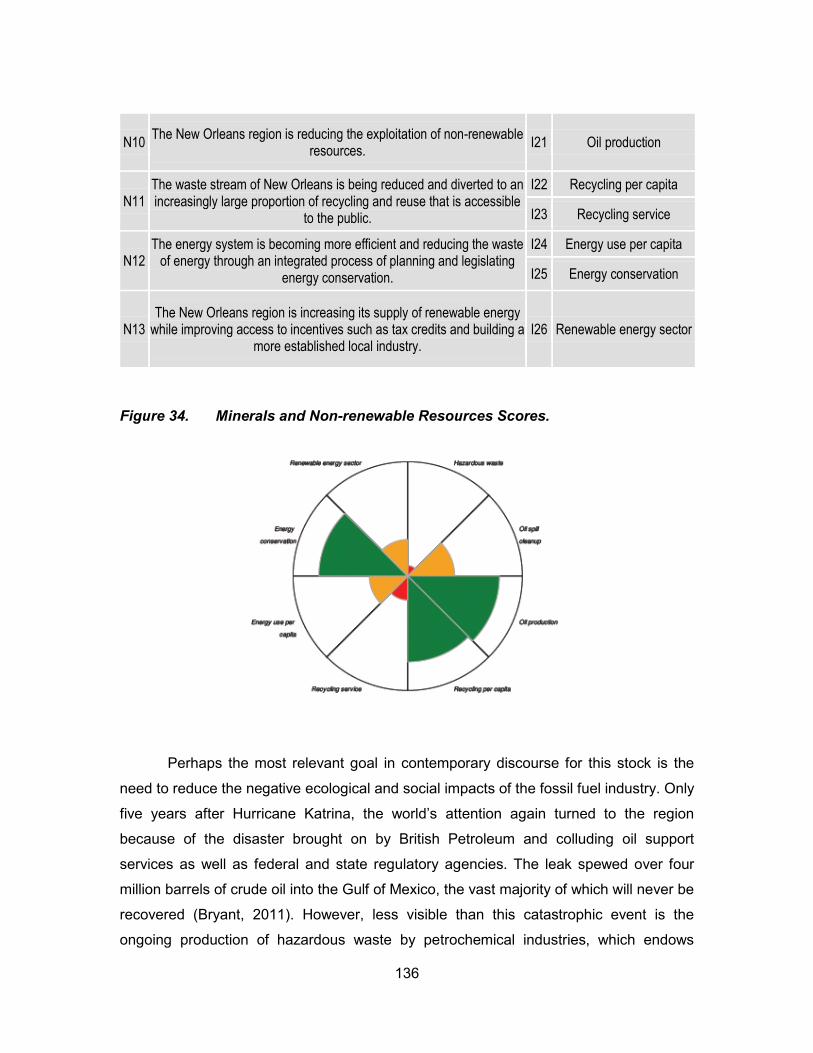
136
N10 The New Orleans region is reducing the exploitation of non-renewable
resources. I21 Oil production
N11 The waste stream of New Orleans is being reduced and diverted to an increasingly large proportion of recycling and reuse that is accessible
to the public.
I22 Recycling per capita
I23 Recycling service
N12 The energy system is becoming more efficient and reducing the waste
of energy through an integrated process of planning and legislating energy conservation.
I24 Energy use per capita
I25 Energy conservation
N13 The New Orleans region is increasing its supply of renewable energy
while improving access to incentives such as tax credits and building a more established local industry.
I26 Renewable energy sector
Figure 34. Minerals and Non-renewable Resources Scores.
Perhaps the most relevant goal in contemporary discourse for this stock is the
need to reduce the negative ecological and social impacts of the fossil fuel industry. Only
five years after Hurricane Katrina, the world’s attention again turned to the region
because of the disaster brought on by British Petroleum and colluding oil support
services as well as federal and state regulatory agencies. The leak spewed over four
million barrels of crude oil into the Gulf of Mexico, the vast majority of which will never be
recovered (Bryant, 2011). However, less visible than this catastrophic event is the
ongoing production of hazardous waste by petrochemical industries, which endows
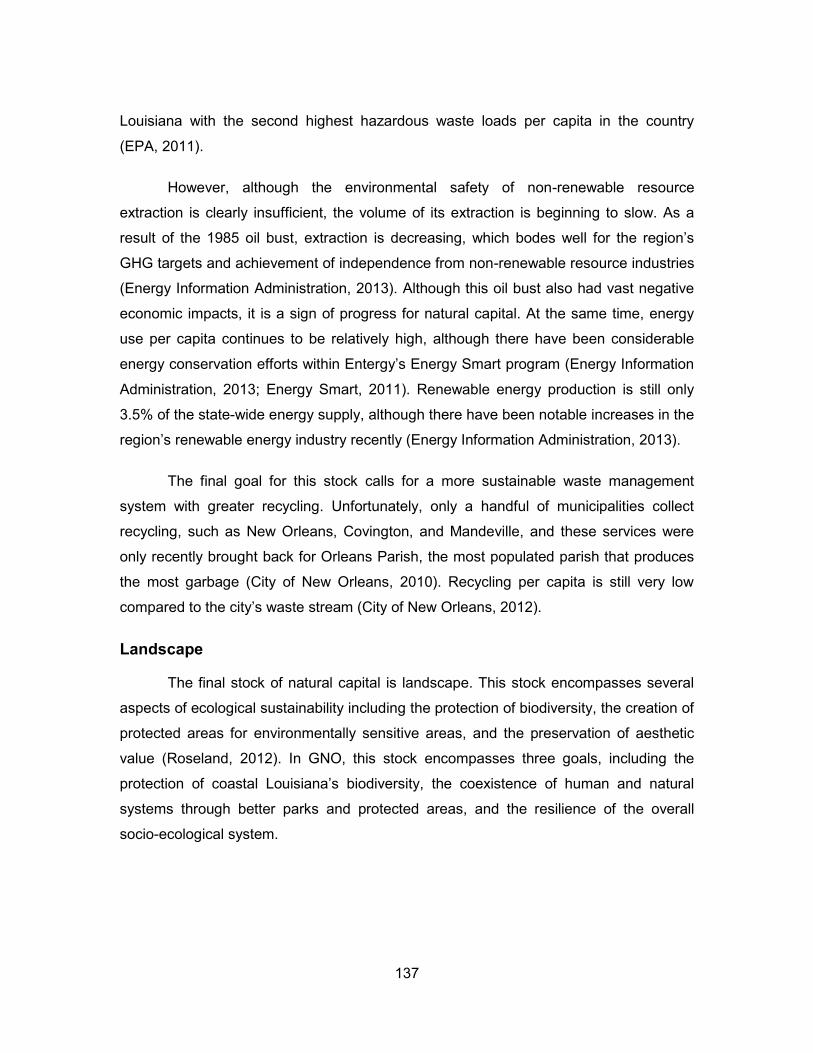
137
Louisiana with the second highest hazardous waste loads per capita in the country
(EPA, 2011).
However, although the environmental safety of non-renewable resource
extraction is clearly insufficient, the volume of its extraction is beginning to slow. As a
result of the 1985 oil bust, extraction is decreasing, which bodes well for the region’s
GHG targets and achievement of independence from non-renewable resource industries
(Energy Information Administration, 2013). Although this oil bust also had vast negative
economic impacts, it is a sign of progress for natural capital. At the same time, energy
use per capita continues to be relatively high, although there have been considerable
energy conservation efforts within Entergy’s Energy Smart program (Energy Information
Administration, 2013; Energy Smart, 2011). Renewable energy production is still only
3.5% of the state-wide energy supply, although there have been notable increases in the
region’s renewable energy industry recently (Energy Information Administration, 2013).
The final goal for this stock calls for a more sustainable waste management
system with greater recycling. Unfortunately, only a handful of municipalities collect
recycling, such as New Orleans, Covington, and Mandeville, and these services were
only recently brought back for Orleans Parish, the most populated parish that produces
the most garbage (City of New Orleans, 2010). Recycling per capita is still very low
compared to the city’s waste stream (City of New Orleans, 2012).
Landscape
The final stock of natural capital is landscape. This stock encompasses several
aspects of ecological sustainability including the protection of biodiversity, the creation of
protected areas for environmentally sensitive areas, and the preservation of aesthetic
value (Roseland, 2012). In GNO, this stock encompasses three goals, including the
protection of coastal Louisiana’s biodiversity, the coexistence of human and natural
systems through better parks and protected areas, and the resilience of the overall
socio-ecological system.
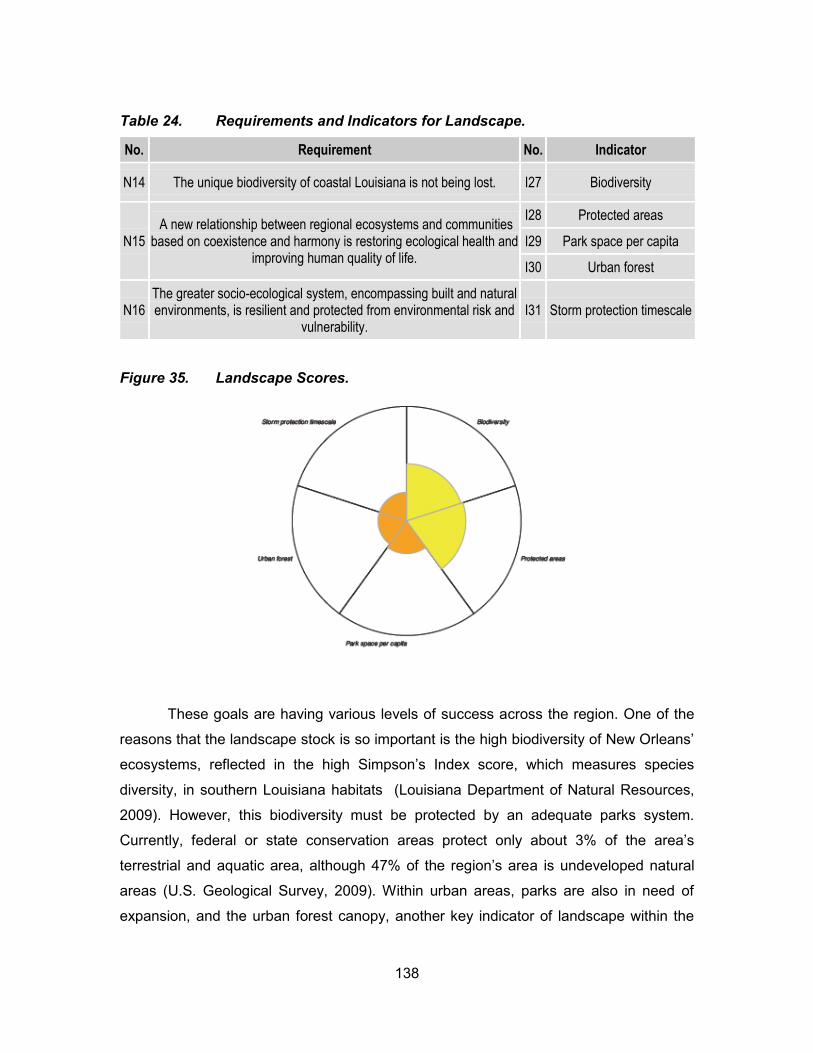
138
Table 24. Requirements and Indicators for Landscape.
No. Requirement No. Indicator
N14 The unique biodiversity of coastal Louisiana is not being lost. I27 Biodiversity
N15 A new relationship between regional ecosystems and communities
based on coexistence and harmony is restoring ecological health and improving human quality of life.
I28 Protected areas
I29 Park space per capita
I30 Urban forest
N16 The greater socio-ecological system, encompassing built and natural environments, is resilient and protected from environmental risk and
vulnerability. I31 Storm protection timescale
Figure 35. Landscape Scores.
These goals are having various levels of success across the region. One of the
reasons that the landscape stock is so important is the high biodiversity of New Orleans’
ecosystems, reflected in the high Simpson’s Index score, which measures species
diversity, in southern Louisiana habitats (Louisiana Department of Natural Resources,
2009). However, this biodiversity must be protected by an adequate parks system.
Currently, federal or state conservation areas protect only about 3% of the area’s
terrestrial and aquatic area, although 47% of the region’s area is undeveloped natural
areas (U.S. Geological Survey, 2009). Within urban areas, parks are also in need of
expansion, and the urban forest canopy, another key indicator of landscape within the
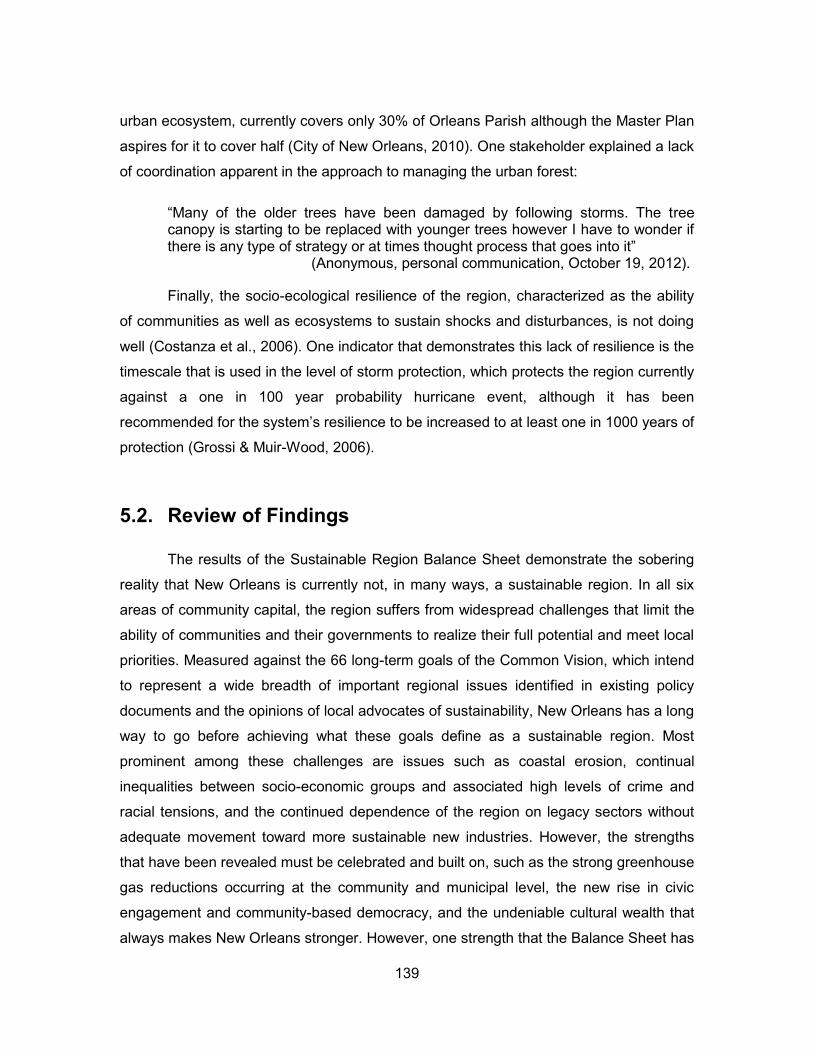
139
urban ecosystem, currently covers only 30% of Orleans Parish although the Master Plan
aspires for it to cover half (City of New Orleans, 2010). One stakeholder explained a lack
of coordination apparent in the approach to managing the urban forest:
“Many of the older trees have been damaged by following storms. The tree canopy is starting to be replaced with younger trees however I have to wonder if there is any type of strategy or at times thought process that goes into it” (Anonymous, personal communication, October 19, 2012).
Finally, the socio-ecological resilience of the region, characterized as the ability
of communities as well as ecosystems to sustain shocks and disturbances, is not doing
well (Costanza et al., 2006). One indicator that demonstrates this lack of resilience is the
timescale that is used in the level of storm protection, which protects the region currently
against a one in 100 year probability hurricane event, although it has been
recommended for the system’s resilience to be increased to at least one in 1000 years of
protection (Grossi & Muir-Wood, 2006).
5.2. Review of Findings
The results of the Sustainable Region Balance Sheet demonstrate the sobering
reality that New Orleans is currently not, in many ways, a sustainable region. In all six
areas of community capital, the region suffers from widespread challenges that limit the
ability of communities and their governments to realize their full potential and meet local
priorities. Measured against the 66 long-term goals of the Common Vision, which intend
to represent a wide breadth of important regional issues identified in existing policy
documents and the opinions of local advocates of sustainability, New Orleans has a long
way to go before achieving what these goals define as a sustainable region. Most
prominent among these challenges are issues such as coastal erosion, continual
inequalities between socio-economic groups and associated high levels of crime and
racial tensions, and the continued dependence of the region on legacy sectors without
adequate movement toward more sustainable new industries. However, the strengths
that have been revealed must be celebrated and built on, such as the strong greenhouse
gas reductions occurring at the community and municipal level, the new rise in civic
engagement and community-based democracy, and the undeniable cultural wealth that
always makes New Orleans stronger. However, one strength that the Balance Sheet has
140
revealed has attracted so much attention that it the focus of the rest of this study:
entrepreneurship. One of the greatest successes of the new New Orleans is the
entrepreneurial spirit that has characterized many residents’ paths to rebuilding their
lives or beginning a new one in the post-Katrina era. Now with an understanding of the
status of community capital across the region, it is necessary to determine the role that
these entrepreneurs are beginning to play in addressing the challenges that face New
Orleans.
141
6. Community Impacts of Sustainability Entrepreneurship in Greater New Orleans
The next major outcome of this study is an initial assessment of the movement of
sustainability entrepreneurship and its role in the New Orleans region. As previously
discussed, the concept of SE outlines a new kind of entrepreneur whose innovative
activities create not only economic value, but shared community value in the form of
benefits that enhance multiple criteria of community well-being, most notably
environmental and social criteria (Allen & Malin, 2008; Tilley & Young, 2009; Dyllick &
Hockerts, 2002; Porter & Kramer, 2011). These entrepreneurs use a variety of models,
but tend to follow similar principles such as social responsibility, eco-efficiency, equity,
and environmental sustainability (Tilley & Young, 2009). In marginalized communities
and regions, SE can be strengthened by local governments through a variety of forms of
support such as incentives for responsible business practices and linking high-needs
populations and social service agencies with enterprises for mutual benefit (Dagevos &
Evers, 2008). The integration of this concept with other frameworks of organizational and
corporate sustainability has rendered a more versatile conception of SE characterized as
a network of actors working in an array of innovative private, non-profit, public sector,
and hybrid initiatives committed to a mission of creating shared value in their
communities across ecological, economic, and social criteria and throughout multiple
aspects of their operations in a strategic approach to achieving local sustainable
development goals while remaining sensitive to socio-economic conditions in their
communities and forming partnerships with supporting agencies for maximized
community impact. Please refer to Section 2 for a full list of characteristics of SE that
have been proposed in this model.
In the Greater New Orleans region, there is a great need for many of the benefits
that SE has been associated with in other areas. As we have seen in Section 5, the
outlook for New Orleans’ community capital highlights areas of great need in which
many of the critical stocks that constitute a sustainable region are in dire condition. How
142
can sustainability entrepreneurs take part in addressing these critical needs? Certainly,
these entrepreneurs cannot solve all of the problems facing the New Orleans region, but
they could likely have great potential to take part in a collaborative effort to meet needs
that are suited to their specific talents and resources.
However, the onset of SE in New Orleans is so recent that very little is currently
known about it. Entrepreneurship in general, whether measured in the creation of for-
profit or non-profit organizations, was quite low prior to 2005 (Plyer & Ortiz, 2011; DeVita
et al., 2012). However, the post-Katrina era has been marked by an upsurge in both.
One in seven non-profit organizations in the region was created as a direct response to
the storm (DeVita et al., 2012), while in the private sector, the rate of business creation
more than doubled in the post-Katrina years (Plyer & Ortiz, 2011). With this increase in
entrepreneurial activity, there has also been a new emphasis on environmental
sustainability in the planning process, seen in municipal efforts such as the GreeNola
Action Plan and state-level initiatives such as the Coastal Master Plan (City of New
Orleans, 2008; State of Louisiana, 2012).
As municipal and state agencies have taken steps towards planning a more
sustainable region, what kinds of leaders have emerged to achieve these goals in
practice? As discussed in Section 4, a sustainable region means not only environmental
action in the form of coastal restoration or climate change policy, but a multidimensional
framework of interrelated goals stretching much farther than typical conceptions of
sustainable development. There are many contours in the fabric of a vision for regional
sustainability that represent the top priorities for improving New Orleans’ community
capital, ranging from climate action to economic diversification, from public education to
financial stability. Given the multiplicity of goals encompassed in the vision for a
sustainable New Orleans, what role can these new entrepreneurs play in meeting them?
This section attempts to answer that question by showing how sustainability
entrepreneurs intend to impact goals for regional sustainability and how effective they
perceive both themselves and their peers to be at doing so. First, this assessment
gauges the intended impacts of sustainability entrepreneurs on regional sustainability,
comparing the goals of different entrepreneurs and their relationship to the Common
Vision and an integrated concept of SE, as defined above. Second, the perceived
143
impacts of these entrepreneurs are portrayed by both a self-assessment of how well
they perceive their own efforts and a cross-evaluation in which the overall SE network is
assessed in terms of what kinds of actors make up the network of sustainability
entrepreneurs and how the groups identified by their peers are perceived to impact
communities across the region across the different goals of the Common Vision. This
assessment concludes by identifying the barriers standing between sustainability
entrepreneurs and their goals for impacting their communities.
In pursuit of these goals, I conducted interviews with 18 individuals from a range
of backgrounds. The result of this process is a colourful sample of sustainability
entrepreneurs that is intended to illustrate the diversity of the network of SE in New
Orleans as I came to understand it. These entrepreneurs are entrenched in activities
ranging from growing organic produce in the Lower Ninth Ward to greening the Super
Bowl, from recycling building materials to brewing eco-friendly beer. Six of these
entrepreneurs are involved in organizations that cannot be easily classified, such as Bill,
whose local food market uses a for-profit model to increase food access in a low-income
neighbourhood and reinvest in community programs, or Phyllis, who has used her
experience as the founder of a coffee franchise to help create a non-profit recycling
project.
These individuals are not only entrepreneurs in the traditional sense of starting
innovative organizations, but also take brave steps toward bridging social barriers. David
uses organic produce to help his neighbours in the Lower Ninth Ward increase food
security, where he is one of the few White residents and has experienced firsthand both
the racial barriers entrenched in the community and the acceptance that can come with
building trust and striving to meet community needs. In fact, most of the entrepreneurs
interviewed were Caucasian, depicting the reality of most of New Orleans’ sustainability
entrepreneurs. Also, this group is comprised of both native and recently relocated New
Orleanians, the latter of which is another common marker of SE. Rhonda has spent her
entire life in Louisiana but has begun to pursue her life-long dream of sharing her love of
paddling with a community in which many fear the water. These entrepreneurs have a
wide array of visions for a sustainable region, as discussed in Section 4, informed by
diverse experiences and values. Colleen was inspired by the interplay of water and city
in Venice to imagine a more integrated relationship between the community and its
144
canals; Lizzy has used her formative experiences at sea to consider how the city can
emulate the closed system of a ship and minimize its impacts on the surrounding
ecosystem.
6.1. Intended Impacts of Sustainability Entrepreneurs
The impacts that these entrepreneurs intend to have on the New Orleans region
are as diverse as their personal values. These intended impacts often represented the
goals of the organizations in which the entrepreneurs work, which ranged from public
education to coastal restoration. These intended impacts were extremely diverse. Some
stakeholders expressed their goals in terms of the main work of their organizations, such
as this individual:
“Our goal is to connect people to wetland plants. And to do restoration through plantings. And we work with kids…we set up a small wetland plant nursery in a schoolyard, and the kids take care of the plants throughout the semester. That’s the whole premise of it” (Anonymous, personal communication, August 7, 2012).
Other entrepreneurs expressed their desire to take an active role in the process
of recovery from Hurricane Katrina, such as this stakeholder who described the
motivation of her husband and herself in returning to start their business:
“we got back a month before the hurricane. And once it had happened and the city had flooded, it was again the question of, “well do we go back and do this”? And we thought there was really no question for either of us, it really wasn’t any discussion. We felt like we owed it to New Orleans to be part of the rebuilding” (Anonymous, personal communication, August 6, 2012).
6.1.1. Sustainability Entrepreneurs and the Common Vision
Expressed in terms of long-term goals for a regional vision, the intended impacts
of sustainability entrepreneurs were also extremely diverse. Overall, the intended
impacts of entrepreneurs were well represented by the goals of the Common Vision,
which can be attributed to the integration of these individuals’ perspectives into the
broad vision archetypes and the specific goals that informed the requirements of the
Sustainable Region Balance Sheet. Many of the entrepreneurs interviewed expressed

145
intended impacts encompassed in a single long-term goal, such as E8, which aspires for
businesses in the region to embody socially and environmentally sustainable models in
pursuit of positive community impact. This long-term goal aligned with the intended
impacts of eight stakeholders, while only one stakeholder expressed sentiments similar
to H5, which hopes for all residents to be able to improve their physical, mental, and
spiritual health. Altogether, the intended impacts of sustainability entrepreneurs can be
encompassed in 34 long-term goals. Entrepreneurs from very different backgrounds
often worked toward the same goal, such as the representative of a major power utility
and the owner of a small local food market who both worked towards poverty reduction
(S1) through subsidizing low-income residents in the services they offered.
The entrepreneurs interviewed expressed many forms of community issues that
they wished to impact, as shown in the long-term goals of the Common Vision. Although
these motivations for benefiting communities the region varied across all six capitals, a
handful of intended impacts were the most salient. Of the 18 individuals sampled, 12
gave information regarding their intended impacts on sustainability goals in the region. I
represent these intended impacts quantitatively through the Community Capital Scans
which are shown in the following section. In these scans, the stocks of community capital
into which various intended impacts fit are shown in terms of how strongly entrepreneurs
wished to enhance them; some entrepreneurs expressed a very strong desire to impact
the community through a given stock (expressed as 4 or 5 on the scale), while others did
not wish to impact certain stocks at all (expressed as 0). However, these quantitative
codes only serve the purpose of facilitating the visual representation of the intended
impacts of entrepreneurs. Their perspectives that they shared through their stories about
their experiences, goals, and community roles are the most valuable data that this
project uncovered about this group of individuals. Below I describe the most salient
intended impacts expressed by these entrepreneurs.
6.1.2. Promoting Sustainable Business
The most commonly expressed intended impact was the goal of advancing
sustainable business practices. The largest component of these entrepreneurs came
from primarily non-profit backgrounds, with the second largest organizational model
being private sector leaders. However, it was also common for entrepreneurs with hybrid
146
organizational models to express this goal. Overall, eight stakeholders showed a desire
to follow a commitment to sustainable business. Some of these entrepreneurs’ personal
visions for corporate sustainability were very evocative and well-developed, such as this
stakeholder’s four priorities for his brewery:
“this is basically the checklist for when you’re making a decision for the brewery, and we all use it whenever we’re making decisions. So the first thing is how is it affecting the beer? If it messes with the beer, then we’re not gonna do it. If it’s gonna improve the beer, then we’ll do it…then we go to the second line. Is it gonna mess with the team, or is it not gonna mess with the team? And then the third thing is our community and our environment. And the two are hand in hand, I think. I mean, environmental issues like most green companies think of are, you know, waste creation, use of electricity, use of water, things like that, but in a very real sense, for us environmental is our entire environment, our entire community. And then the fourth after that is profits. And profits are important. If you don’t make money, you can’t keep your business open, and I have 10 people who are out of jobs and I’ve done a horrible job rebuilding New Orleans, which is my goal for starting this company…But I think if you do those top three, if you concentrate on those, the fourth one just flows with it” (Anonymous, personal communication, August 21, 2012).
Putting Community First
This image of corporate sustainability has a highly community-oriented ethic,
placing labour interests and the community and environment above profits in the
decision rule of the company. This kind of corporate ethos validates Allen & Malin (2008)
whose findings about sustainability entrepreneurs in Utah show that the main
determinant in the adoption of sustainable practices is their personal values for
community change. Other entrepreneurs had similarly strong commitments to
community and environmental benefit at the core of their businesses. Some
entrepreneurs expressed a strong desire to ensure that customers trust their authentic
green practices, while others placed great value on the trust of their customers and
suppliers as fellow sustainable enterprises. This entrepreneur explained that:
“it’s better for the world’s bottom line because I’m a green business, because if I just keep on throwing away as much garbage as everybody else, that eventually…the City of New Orleans dump would get even fuller and the City would have to deal with it, but this business individually would not have to deal with. And I would spread my cost around to everybody…what I’m doing as a business owner is taking individual responsibility that everybody should be taking to try to reduce waste and to try to minimize my footprint” (Anonymous, personal communication, August 6, 2012).
147
This entrepreneur’s concern for committing to zero waste is an example of value
chain thinking, showing a consideration for making positive impacts across the disposal
and end use areas of the business’s value chain (Fearne et al., 2012). Other
entrepreneurs working in more non-profit capacities showed their desire to expose
community members to knowledge of sustainable industries and to use popular avenues
such as sports to introduce people to sustainability. Community-oriented organizations
had often adopted a business model in order to be financially viable but still were
committed to sustaining their community missions. In addition, companies with a clearly
profit-oriented mission also expressed a commitment to sustainability. The
representative of Entergy, New Orleans’ electric utility provider, explained that “at
Entergy we really see sustainability evolving as—it’s not just nice to do, there’s a
business imperative behind it, or there’s a community sustainability imperative behind it”
(Anonymous, personal communication, August 24, 2012).
Staple-on Sustainability
At the same time, some entrepreneurs did not have the strong commitment of
their peers to develop an integrated sustainability platform. Several stakeholders
described their organizations’ visions of sustainable practices in terms of simply
augmenting the status quo of their operations with new “green initiatives” that seemed
ad hoc in nature.
“in and of itself, it [sports] presents an opportunity to create and implement very high level and new and innovative ways of being green and practicing environmentally safe practices…that naturally became a component of everything that we do as a sports foundation and putting on sporting events. So this is just another component that we add into it, along with the other things that we do” (Anonymous, personal communication, August 12, 2012).
Though these kinds of program could be more integrated into the operations of
an organization, the stakeholder in question has been a pioneer of green initiatives in an
organization focused mostly on economic development. Intended impacts like this one
show a range of missions ranging from conceptions of sustainability deeply integrated
into company or organizational ethos to more ad hoc green initiatives employing
somewhat more “staple-on” sustainability than the kind of corporate sustainability that
148
Porter & Kramer (2011) recommend should be at the core of business activities and
motivations.
Another range exists among New Orleans’ sustainability entrepreneurs, which
locates stakeholders on a continuum from community-oriented to profit-oriented.
Community-oriented companies like Kirk’s, with its four priorities, stand at one end, while
Entergy’s ethos for sustainability made no attempt to hide its self-interest in supporting
environmental projects such as coastal restoration. Motivations of cost avoidance and
the protection of customers who are the source of revenue may not embody the pure
sustainability motives of many sustainability entrepreneurs, but they do locate
environmental and social concerns at the core of business logic. This more profit-
oriented outlook to sustainability is similar to the need for a strategic approach to CSR
advocated by Porter & Kramer (2006).
This multiplicity of motives in supporting more environmentally responsible
business practices revealed a great diversity in why and how entrepreneurs intended to
contribute to regional sustainability. As stated, this emergent theme aligns closely with
the goal for sustainable business in the Common Vision, which is repeated below:
E8 Businesses are living out an ethic of community support and sustainability, as well as marketing their
practices as a collective regional image of responsible business.
This long-term goal matches closely with the intended impacts of the
entrepreneurs that have been described. Represented in the Community Capital
Framework, this goal contributes to the regional vision for the stock of economic capital
known as Economic Structure. In the Community Capital Scan below, I have shown how
the eight entrepreneurs discussed expressed desire to positively impact Economic
Structure, specifically through promoting and practicing sustainable business practice.
As shown in Figure 36, two stakeholders had a high intended impact (4), while the
majority hoped to have a very high impact (5) on regional economic structure through
sustainable business.
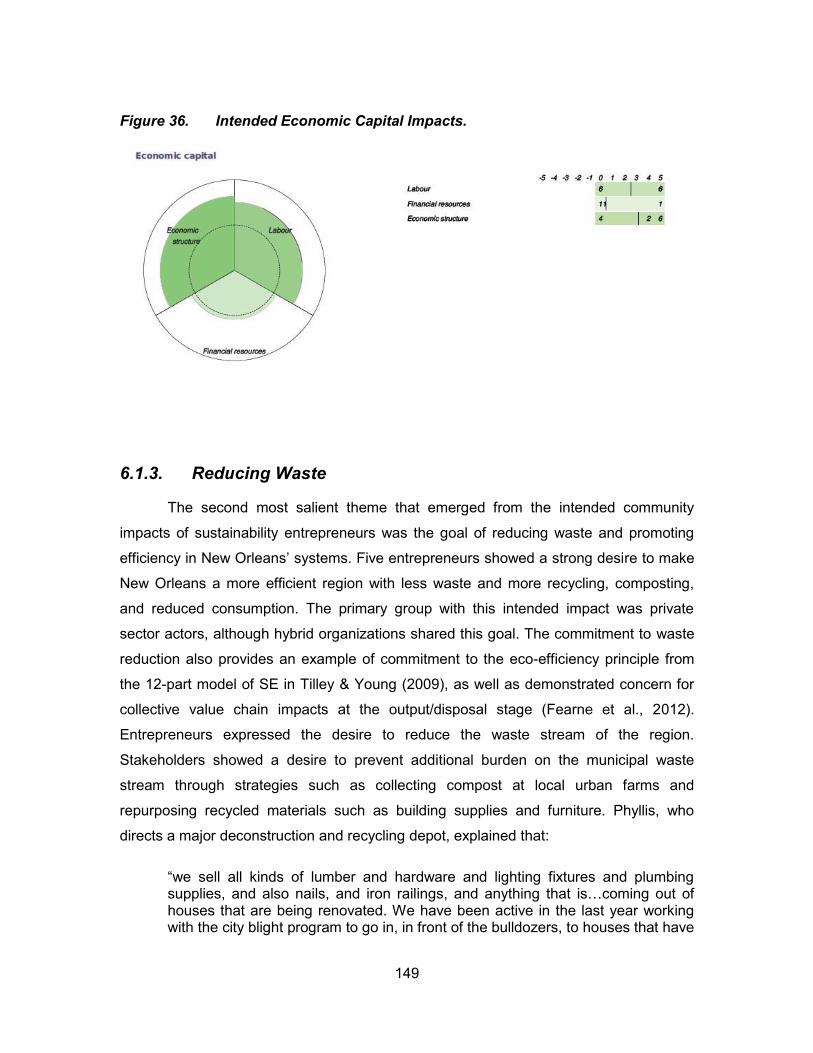
149
Figure 36. Intended Economic Capital Impacts.
6.1.3. Reducing Waste
The second most salient theme that emerged from the intended community
impacts of sustainability entrepreneurs was the goal of reducing waste and promoting
efficiency in New Orleans’ systems. Five entrepreneurs showed a strong desire to make
New Orleans a more efficient region with less waste and more recycling, composting,
and reduced consumption. The primary group with this intended impact was private
sector actors, although hybrid organizations shared this goal. The commitment to waste
reduction also provides an example of commitment to the eco-efficiency principle from
the 12-part model of SE in Tilley & Young (2009), as well as demonstrated concern for
collective value chain impacts at the output/disposal stage (Fearne et al., 2012).
Entrepreneurs expressed the desire to reduce the waste stream of the region.
Stakeholders showed a desire to prevent additional burden on the municipal waste
stream through strategies such as collecting compost at local urban farms and
repurposing recycled materials such as building supplies and furniture. Phyllis, who
directs a major deconstruction and recycling depot, explained that:
“we sell all kinds of lumber and hardware and lighting fixtures and plumbing supplies, and also nails, and iron railings, and anything that is…coming out of houses that are being renovated. We have been active in the last year working with the city blight program to go in, in front of the bulldozers, to houses that have
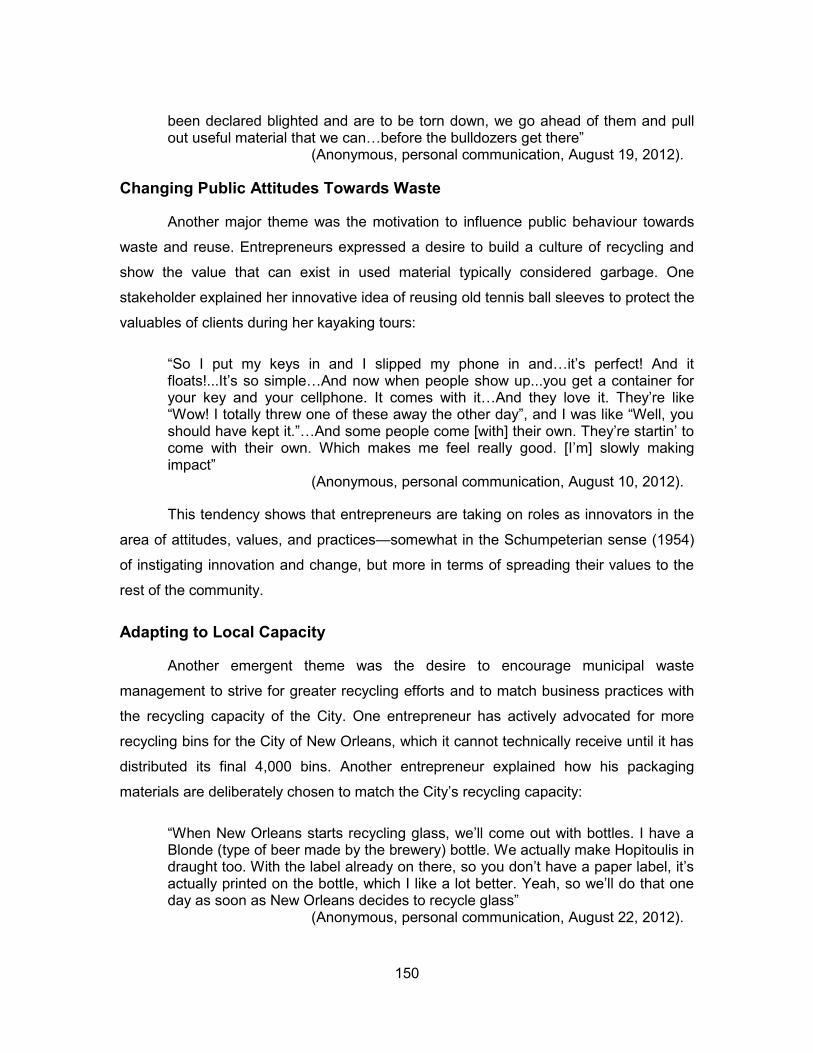
150
been declared blighted and are to be torn down, we go ahead of them and pull out useful material that we can…before the bulldozers get there” (Anonymous, personal communication, August 19, 2012).
Changing Public Attitudes Towards Waste
Another major theme was the motivation to influence public behaviour towards
waste and reuse. Entrepreneurs expressed a desire to build a culture of recycling and
show the value that can exist in used material typically considered garbage. One
stakeholder explained her innovative idea of reusing old tennis ball sleeves to protect the
valuables of clients during her kayaking tours:
“So I put my keys in and I slipped my phone in and…it’s perfect! And it floats!...It’s so simple…And now when people show up...you get a container for your key and your cellphone. It comes with it…And they love it. They’re like “Wow! I totally threw one of these away the other day”, and I was like “Well, you should have kept it.”…And some people come [with] their own. They’re startin’ to come with their own. Which makes me feel really good. [I’m] slowly making impact” (Anonymous, personal communication, August 10, 2012).
This tendency shows that entrepreneurs are taking on roles as innovators in the
area of attitudes, values, and practices—somewhat in the Schumpeterian sense (1954)
of instigating innovation and change, but more in terms of spreading their values to the
rest of the community.
Adapting to Local Capacity
Another emergent theme was the desire to encourage municipal waste
management to strive for greater recycling efforts and to match business practices with
the recycling capacity of the City. One entrepreneur has actively advocated for more
recycling bins for the City of New Orleans, which it cannot technically receive until it has
distributed its final 4,000 bins. Another entrepreneur explained how his packaging
materials are deliberately chosen to match the City’s recycling capacity:
“When New Orleans starts recycling glass, we’ll come out with bottles. I have a Blonde (type of beer made by the brewery) bottle. We actually make Hopitoulis in draught too. With the label already on there, so you don’t have a paper label, it’s actually printed on the bottle, which I like a lot better. Yeah, so we’ll do that one day as soon as New Orleans decides to recycle glass” (Anonymous, personal communication, August 22, 2012).
151
These themes show a variety of motivations to reduce waste across the region.
Some stakeholders are concerned with materials management per se, while others are
focused on public behaviour and values in attempts to influence more efficient waste
management. This intended impact embodies the value of eco-efficiency discussed in
Tilley & Young (2009), which these authors describe as a characteristic of sustainability
entrepreneurship, aimed at improving the efficiency of businesses through better
materials management and reduced waste. This impact also is encompassed by the
goal from the Common Vision associated with waste management, repeated below. This
concern highlights a gap in the current SE framework for the need for entrepreneurs to
be locally appropriate in institutional terms. Although O’Neill et al. (2006) consider how to
make SE more culturally appropriate, the theme of local capacity and making products
and services adaptable to them has not been explored. Also needing research is the
ways that sustainability entrepreneurs may begin to fill existing voids in services left by
market and state actors. This focus from several New Orleans entrepreneurs, such as
Kirk, begins to fill this gap.
N11 The waste stream of New Orleans is being reduced and diverted to an increasingly large proportion
of recycling and reuse that is accessible to the public.
This goal, with its focus on both waste diversion and public accessibility, is
reflected in the intended impacts of the entrepreneurs who wished to reduce waste
through their activities. Expressed in the Community Capital Tool, their goals are
reflected in the stock known as Minerals and Non-renewable Resources. The rationale
of this listing originates in the nature of waste systems as a key non-renewable resource
managed by communities that should be re-envisioned for reduction, reuse, and
potential sources of revenue (Roseland, 2012). This intended impact is reflected in the
CCS below, where five of the seven stakeholders with intentions to make a positive
impact on this stock were referring to goal N10 in its emphasis on waste reduction and
management. All of the entrepreneurs had a very strong desire to positively impact this
stock.
152
Figure 37. Intended Natural Capital Impacts.
6.1.4. Restoring Ecosystems
The other salient intended impact within natural capital is the desire to restore
ecosystems. Five entrepreneurs also expressed a strong desire to recuperate the
region’s natural habitats such as coastal wetlands and aquatic ecosystems. This
intended impact was held exclusively by non-profit and hybrid actors. The first emergent
theme is the desire to educate people about ecosystems in order to encourage
stewardship. Entrepreneurs expressed an interest in engaging and educating volunteers
and residents about issues like coastal restoration and anti-littering. One stakeholder
uses her position as a kayak tour operator to inform kayakers that the bayou is a natural
habitat where they should respect wildlife, especially alligators. This entrepreneur also
raises awareness about reducing littering and habitat protection among customers.
Perhaps the strongest intention to restore ecosystems was expressed by Colleen, the
founder of a coastal restoration agency:
“my masters project, part of my big focus was wetlands loss in Louisiana, and the oil in particular but I did a sort of business plan for a non-profit called Bayou Rebirth, and I came down here and started the non-profit, and we do wetlands planting projects with volunteers” (Anonymous, personal communication, August 7, 2012).
153
Supporting Habitat Protection
This entrepreneur’s efforts to help restore coastal marshes represent the
achievement of a lifelong goal that aspires not only to restore wetlands but also to
educate volunteers and the public. The deep commitment shown by this and other
entrepreneurs validates Allen & Malin (2008), whose sustainability entrepreneurs in Utah
often had lofty social justice and sustainability motivations that were their driving force.
The other aspect of this intended impact is the achievement of concrete biophysical
outcomes that improve ecological integrity in the region. This goal is encompassed in the
desire to plant street trees for the urban forest, participate in city beautification, donate
marsh grasses, and support local cleanups by providing kayaks free of charge. “I’ve
already provided my kayaks for free a lot of times. To do cleanups. I take a hit. I do. I
could have made 350 bucks for that whole session, but…instead everybody uses ‘em in
the cleanup” (Anonymous, personal communication, August 10, 2012).
N15 A new relationship between regional ecosystems and communities based on coexistence and
harmony is restoring ecological health and improving human quality of life.
As shown above in the Community Capital Scan for natural capital, the intended
impacts expressed by entrepreneurs correspond to the Landscape stock of natural
capital (shown as Land in the Scan). The goal of creating a more harmonious
relationship between ecosystems and communities highlights the importance of
protecting ecologically sensitive land and preserving habitats for biodiversity (CC Scan,
2013). Of the six entrepreneurs who expressed a desire to impact the Landscape stock,
five had the intended impact described by N15, as shown in Figure 37 above.
6.1.5. Increasing Food Security
Another intended impact of sustainability entrepreneurs is the goal to improve
food security for the region’s communities. Stakeholders identified the desire to motivate
people to eat more healthy food and change people's perceptions and behaviours
towards food and nutrition. Five entrepreneurs showed a desire to increase food
security, from non-profit, hybrid, and public sector backgrounds, and their goals included
the interest in providing more vegetarian food options, the desire to hold cooking classes
to teach healthy dietary options, and the goal of meeting the food needs of marginalized
154
communities through market approaches. This stakeholder explained his desire to
“spread local food and healthy eating to others who can’t afford it and because there’s a
population that has a need for [our] service” (Anonymous, personal communication,
August 3, 2012).
Food Sharing
Another entrepreneur wished to meet the food needs of communities through
simply sharing the fruits of his labour. One stakeholder decided to help meet the high
need for local healthy food by expanding his individual garden plot into a community
garden. He explained his decision to expand the garden:
“I found out that other people were enjoying it and had a need for it. And I thought, you know, why not expand and get a little bigger…so I just gradually, each growing season, took it out a little further, and this spring was the first time I put the whole area actually in garden” (Anonymous, personal communication, August 21, 2012).
This emphasis on sharing food brings an important consideration to non-market
exchange that SE currently does not address. Many of the entrepreneurs in New
Orleans, especially those of a non-profit background, do not charge for their services
and are helping expand a non-market exchange of needed products and services. The
SE framework, with its predominant focus on private sector entrepreneurs, currently
does not include this focus on non-market exchange, which the activities of many New
Orleanian entrepreneurs can offer. Ultimately, entrepreneurs with this intended impact
expressed a desire to create a local food community and to enable people to meet their
own food needs. These entrepreneurs hoped to support other actors who are making the
food system more local and healthy. Stakeholders used multiple approaches, such as
sharing gardening techniques and sponsoring cooking classes, to grow the local food
system. The founder of a local food market told how:
“what we stumbled upon was this huge community in New Orleans who wanted fresh local produce. And from there, we kind of built it up, we started driving around and meeting up with farmers, just growing our list of suppliers, adding departments like dairy and baked goods and meats. Just to kind of, what people ask for, we try to go out and find the farmers who have the equipment so they can do that, to now where it’s pretty much, not quite, but we’re pretty close to being like a full service small grocery store” (Anonymous, personal communication, August 3, 2012).
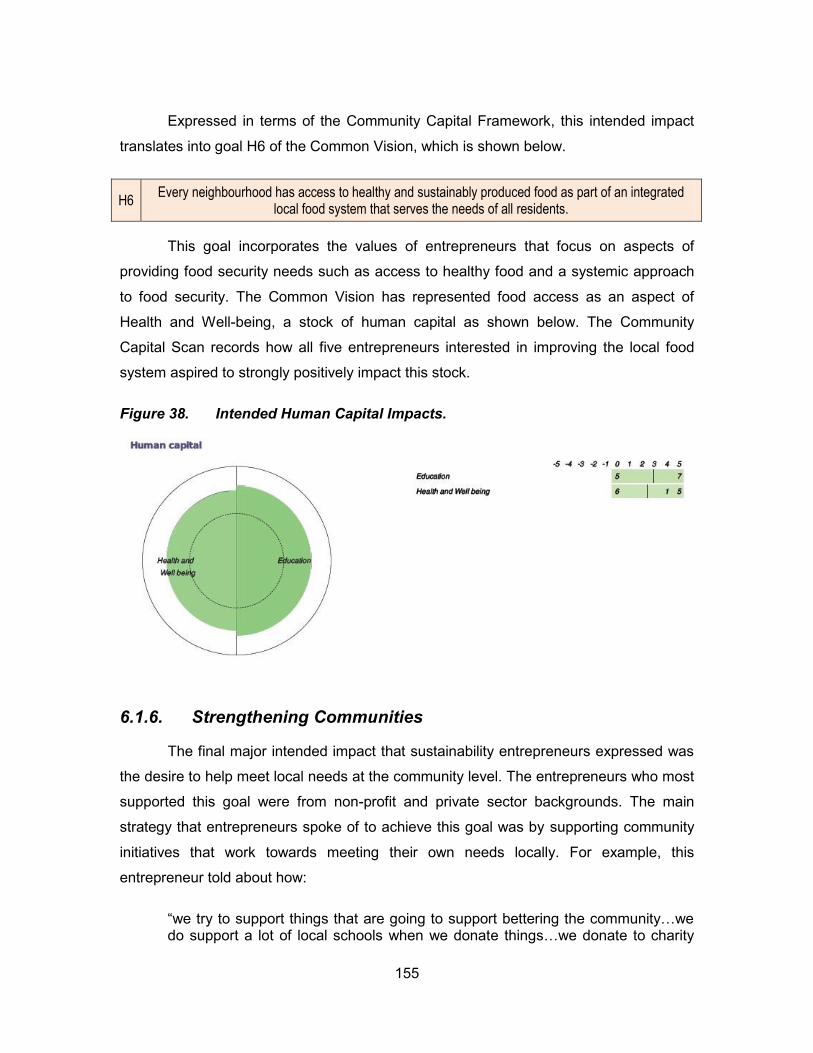
155
Expressed in terms of the Community Capital Framework, this intended impact
translates into goal H6 of the Common Vision, which is shown below.
H6 Every neighbourhood has access to healthy and sustainably produced food as part of an integrated
local food system that serves the needs of all residents.
This goal incorporates the values of entrepreneurs that focus on aspects of
providing food security needs such as access to healthy food and a systemic approach
to food security. The Common Vision has represented food access as an aspect of
Health and Well-being, a stock of human capital as shown below. The Community
Capital Scan records how all five entrepreneurs interested in improving the local food
system aspired to strongly positively impact this stock.
Figure 38. Intended Human Capital Impacts.
6.1.6. Strengthening Communities
The final major intended impact that sustainability entrepreneurs expressed was
the desire to help meet local needs at the community level. The entrepreneurs who most
supported this goal were from non-profit and private sector backgrounds. The main
strategy that entrepreneurs spoke of to achieve this goal was by supporting community
initiatives that work towards meeting their own needs locally. For example, this
entrepreneur told about how:
“we try to support things that are going to support bettering the community…we do support a lot of local schools when we donate things…we donate to charity
156
events. We try to support for example “night out against crime” , neighborhood parties, we offer them gelato, we try to create a part of the community, but also try to help efforts that are to the betterment of the city” (Anonymous, personal communication, August 6, 2012).
Understanding Local Needs and Values
A major emergent theme in this intended impact was the importance of
understanding local needs and values. Entrepreneurs described working closely with
residents to understand their preferences in food needs and other areas. Other
individuals spoke of a desire to find environmentally friendly means to meet
neighbourhood needs. One entrepreneur with a long history of advocacy in low-income
communities described that:
“we work in neighbourhoods that have asked us to come in and help rather than, you know, some environmental groups think they know what the answer is and they come in and say “This is what the answer is”. I work the other way. I go and I talk with the groups and try to figure out how to help them reach their goals using my expertise, whatever that is” (Anonymous, personal communication, August 12, 2012).
Inspiring Leadership
This intended impact features a respect for the values and perspectives of
community members and the encouragement of residents to meet their needs and
reduce dependence on outside agencies and services. Entrepreneurs spoke of
encouraging residents to do cleanups of local waterways, inspiring neighbours to start
their own gardens, and collaborate and share to solve problems together. Suzy, the
director of a green job training agency, expressed her passion to instil leadership and
self-confidence in low-income community members:
“one of the things that I like to talk about with our new students is leadership. And having some leadership competencies that, you know, even as a young person it can mean a difference of getting a great job or getting, you know, just a Wal-mart job and just living. And I think, you know, having, encouraging elements of leadership to develop in our students is the most important thing that we could do” (Anonymous, personal communication, August 8, 2012).
This intended impact is synonymous with the goal within the Common Vision that
emphasizes the importance of communities creating their own initiatives and respecting
local needs and interests.
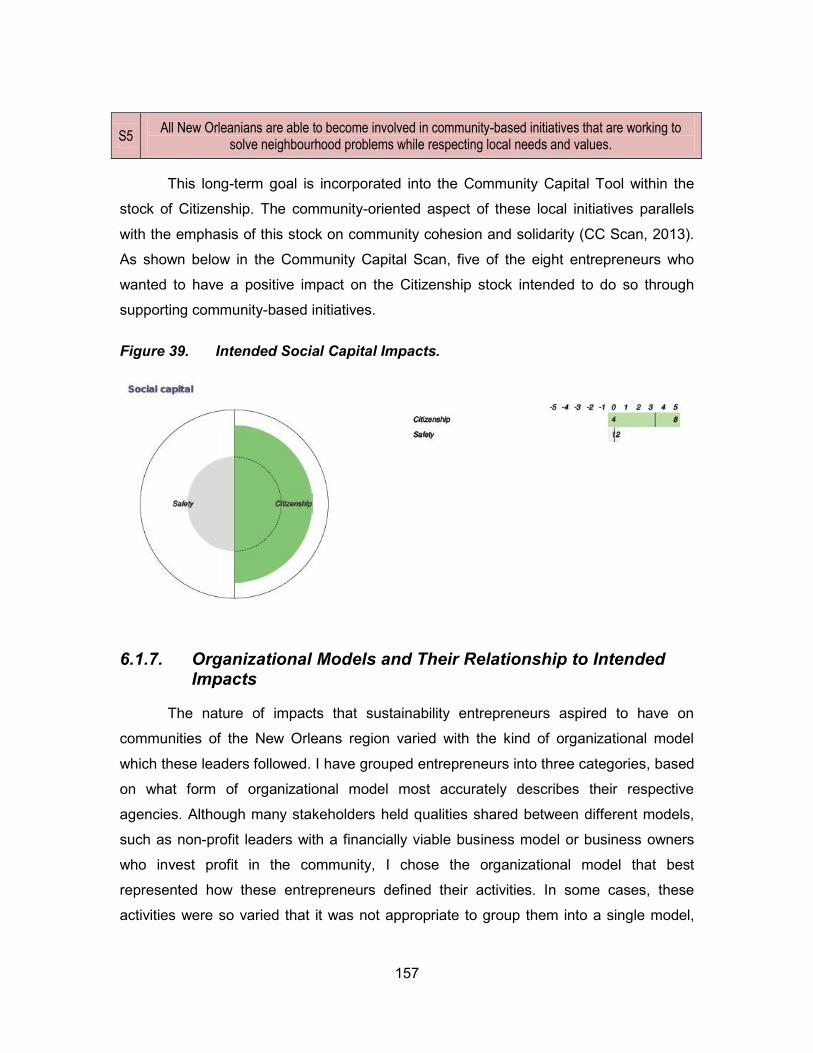
157
S5 All New Orleanians are able to become involved in community-based initiatives that are working to
solve neighbourhood problems while respecting local needs and values.
This long-term goal is incorporated into the Community Capital Tool within the
stock of Citizenship. The community-oriented aspect of these local initiatives parallels
with the emphasis of this stock on community cohesion and solidarity (CC Scan, 2013).
As shown below in the Community Capital Scan, five of the eight entrepreneurs who
wanted to have a positive impact on the Citizenship stock intended to do so through
supporting community-based initiatives.
Figure 39. Intended Social Capital Impacts.
6.1.7. Organizational Models and Their Relationship to Intended Impacts
The nature of impacts that sustainability entrepreneurs aspired to have on
communities of the New Orleans region varied with the kind of organizational model
which these leaders followed. I have grouped entrepreneurs into three categories, based
on what form of organizational model most accurately describes their respective
agencies. Although many stakeholders held qualities shared between different models,
such as non-profit leaders with a financially viable business model or business owners
who invest profit in the community, I chose the organizational model that best
represented how these entrepreneurs defined their activities. In some cases, these
activities were so varied that it was not appropriate to group them into a single model,
158
giving rise to a number of hybrid entrepreneurs who blended private, non-profit, and
public sector models. This finding parallels that of Austin et al. (2006), whose focus on
social entrepreneurs found a tendency to blur the traditional organizational models. Of
the 12 individuals who commented on their intended impacts, three were private sector
actors, six non-profit, and three a hybrid of private, non-profit, and public sector traits.
However, there was not sufficient representation of public sector leaders to identify their
characteristics.
As seen in the most salient intended impacts above, some themes were more
commonly endorsed by private sector entrepreneurs, while non-profit leaders more
commonly expressed other impacts, and others were more likely to be endorsed by
hybrid entrepreneurs. Overall, the different kinds of organizational models from which
entrepreneurs approached community impact had common features that demarcated
them from the other alternatives. A few key differences emerged between the
entrepreneurs that I consulted. These differences were apparent between private sector
and non-profit actors which, despite their many similarities in visions and intended
impacts, diverged on a few important points. Hybrid leaders show characteristics of both
of these models, as well as some unique traits. However, business and non-profit
entrepreneurs illustrated several important distinctions.
Private
The most common marker of private sector actors was a focus on five specific
goals of the Common Vision. By far the most commonly expressed intended impact was
to foster and support sustainable business, followed by the goal of reducing waste.
Other salient intended impacts included the desire to provide high-quality employment to
regional job-seekers, and help build a more sustainable and efficient energy system.
Strengthening the Local Economy
One entrepreneur explained how she hopes the electric utility for which she
works will help foster the local economy:
“It’s much better for the local economy if you’re not spending unnecessarily on electricity and you can spend it in other aspects of the community. In other words, that full cycle of supporting business and industry in general. Local retail, for example, still drives Entergy’s ability to increase its revenues through
159
increased electricity sales” (Anonymous, personal communication, August 24, 2012).
Altruism and Opportunism
One of the main markers of private sector entrepreneurs was a divergence on
the motivations of these actors. Although several business owners had lofty goals for
reaching a sustainable model and impacting their communities, some of their peers
viewed sustainability merely as a new opportunity to profit. This divergence between
altruism and opportunism confirms the distinction made by Tilley & Young (2009), who
acknowledge that self-interest may drive the adoption of SE, and validate the emphasis
of Porter & Kramer (2006) on using strategic business logic for truly effective CSR. This
perspective also shows the convergence of positive community impact and business
strategy based on self-interest and positive regional impacts. Other entrepreneurs
approached community impacts such as providing employment with a more altruistic
motivation:
“We take our role as a community member very seriously. I mean we try to provide a nice work environment for our staff. We try to treat them with respect, and create a safe environment for them to work in, and a place that they can be proud of” (Anonymous, personal communication, August 6, 2012).
Other business owners took a more middle-road approach between self-interest
and altruism, emphasizing the shared goals of bottom-line driven concerns such as cost
savings and the moral commitment driving them to follow such goals. These intended
impacts were prevalent among business owners, representing a strong commitment by
private sector entrepreneurs to enhance natural and economic capital in the region.
Although these entrepreneurs had some goals to impact conditions in other areas, such
as human capital through teaching skills and trades, the emphasis on the other areas of
community capital was somewhat low. Overall, business owners had a fairly low amount
of comprehensiveness in their intended impacts, although they were very enthusiastic
about the kinds of impacts they did want to have on the region.
Non-profit
Sustainability entrepreneurs from non-profit organizational models had a broader
array of intended impacts. Also most committed to sustainable business transitions,
160
these entrepreneurs shared this commitment with their private sector peers. However,
their other intended impacts were unique. Very important to non-profit sector leaders
were goals such as ecological restoration and increasing public appreciation for nature,
fostering community initiatives, attracting talent and investment, promoting equity and
intercultural healing, educating the community, and providing affordable housing. Given
the low emphasis on non-profit actors in the SE literature, these findings give new
contours to the nature of New Orleans’ sustainability entrepreneurs that can help expand
this underdeveloped area in the framework.
Supporting Economic Development
Although these entrepreneurs did not operate in the business world, they often
expressed a desire to support economic development through attracting talent and
investment to the region. One stakeholder works for an organization directly devoted to
attracting capital in-flow to the city via sporting events:
“The Sports Foundation is a non-profit organization. The point of it is to increase economic impact. Our mission is to bring events, major sporting events to New Orleans that will do what you just said. Fill hotel rooms, fill up restaurants, use taxis, use the flights at the end, things of that nature. And create a positive economic impact on the city” (Anonymous, personal communication, August 12, 2012).
Instilling Confidence
Related to the healing that comes with deconstructing social and racial barriers
described by this leader’s perspective is the desire to instil pride and confidence in
community members through education. Many non-profit entrepreneurs had an
educational component to their programs, and aspired to use their roles as educators to
empower marginalized communities and create greater agency among many community
members. This entrepreneur explained the goal of her organization in this way:
“I think confidence is a big [goal], and certainly the certifications we provide is another. And I think that the, making it through something is a big achievement for a lot of our students to actually come through a three month program and finish all these classes and get these certificates, and walk in a graduation ceremony and actually achieve something and finish something” (Anonymous, personal communication, August 8, 2012).
161
These characteristics of non-profit entrepreneurs provide novel findings for the
SE framework to enrich the currently undeveloped focus on NGOs as entrepreneurs.
However, the already existing focus from the social entrepreneurship literature on non-
profits shows that the goals of New Orleans’ sustainability non-profits play a similar role
as those of social entrepreneurs. Similar to the assertion of Dees (1998), the mission of
these actors defines their actions and drives the choice of approaches and techniques
used to achieve their intended community role. Also, the findings of CCEDN’s report on
social entrepreneurs in Winnipeg, MB, are given strength by the parallel to New Orleans
NGOs in their ability to fill the void left by market and state actors. Non-profit leaders in
New Orleans play pivotal roles in issues such as wetlands restoration and food security
that have largely been neglected by the private sector and, until very recently,
government, confirming the social entrepreneur’s role in filling institutional gaps.
Hybrid
The final entrepreneur group is a collection of individuals whose efforts are not
well represented by any single organizational model. These hybrid entrepreneurs
included an architect who is helping author and consult with community members
regarding a significant storm water management plan, the director of a local food market
that invests all of its profits in the nearby neighbourhood, and a kayaking outfitter who
supports local clean-ups and outdoor education. Although each of these individuals has
a job title that could be described by some combination of public, private, or non-profit
sectors, their vision for community impacts are a blend of all three that leads to their
characterization as hybrid entrepreneurs. The intended impacts of these leaders varied
greatly, ranging from the goal to promote and execute a more environmentally
sustainable storm water system to the desire to raise public awareness about outdoor
and recreational opportunities. A few examples of these intended impacts are given
below.
Improving Food Access
All of the hybrid entrepreneurs shared a commitment to improving the access of
community members to healthy and sustainably produced food. Although they come
from very different professional backgrounds, their missions all incorporated food access
into their vision for community impact. One hybrid entrepreneur has translated his
162
passion for vegetarian cuisine into a local restaurant and food collective to meet the
need for vegetarian food choice in New Orleans. He also explained this aspiration,
fulfilled outside of his planning role but still intended to meet community food needs:
“when I was in college I worked on a farm for a while, and from there I’ve had a few jobs, working professional and things like that. But when I moved here in 2009, I was amazed to see the lack of vegetarian options and vegetarian restaurants in town. I made that move, and so, and I was having lots of people over for dinner. I’ve always cooked for a lot of people, that’s just something that I do. And from there evolved the desire to see contribute to the community by providing a vegetarian option that didn’t exist” (Anonymous, personal communication, August 12, 2012).
Promoting Healing
An equally strong commitment to promoting healing between divided socio-
economic communities was expressed by hybrid stakeholders. One leader poignantly
expressed how he hoped his local food market to achieve this aim:
“people kind of have this idea of Hollygrove being this horrible, dangerous place, and…that’s not fair to residents who aren’t the select few who are causing those problems. We want to make sure we’re breaking down those barriers because there’s so many great people back here…I like to think of it as a welcome center, where people can come to the neighborhood, they get to meet residents, they get to see Hollygrove as not this gang-ridden, horrible place with shootings everywhere. There are real people here living their lives. I think that’s valuable, and…vice versa, for the residents and the people who come here to shop. Because I’m sure…there’s stereotypes going both ways, and we’re trying to break those down as much as possible. And…food is a great way to do that. Everyone needs food, you can kind of share stories about food, and all that other stuff kind of goes out the window” (Anonymous, personal communication, August 3, 2012).
6.1.8. Overview of SE Intended Impacts
This overview of the intended impacts of sustainability entrepreneurs has
highlighted the most salient ways that the individuals involved in this project hope to
make a positive impact on the Greater New Orleans region. Some key differences exist
between the different groups of entrepreneurs, but they share a common commitment to
advancing a more sustainable New Orleans through the multiple priorities that articulate
the vision for the region. Overall, their intended impacts are highly comprehensively, with
considerable balance in the emphasis that they place on the various forms of community
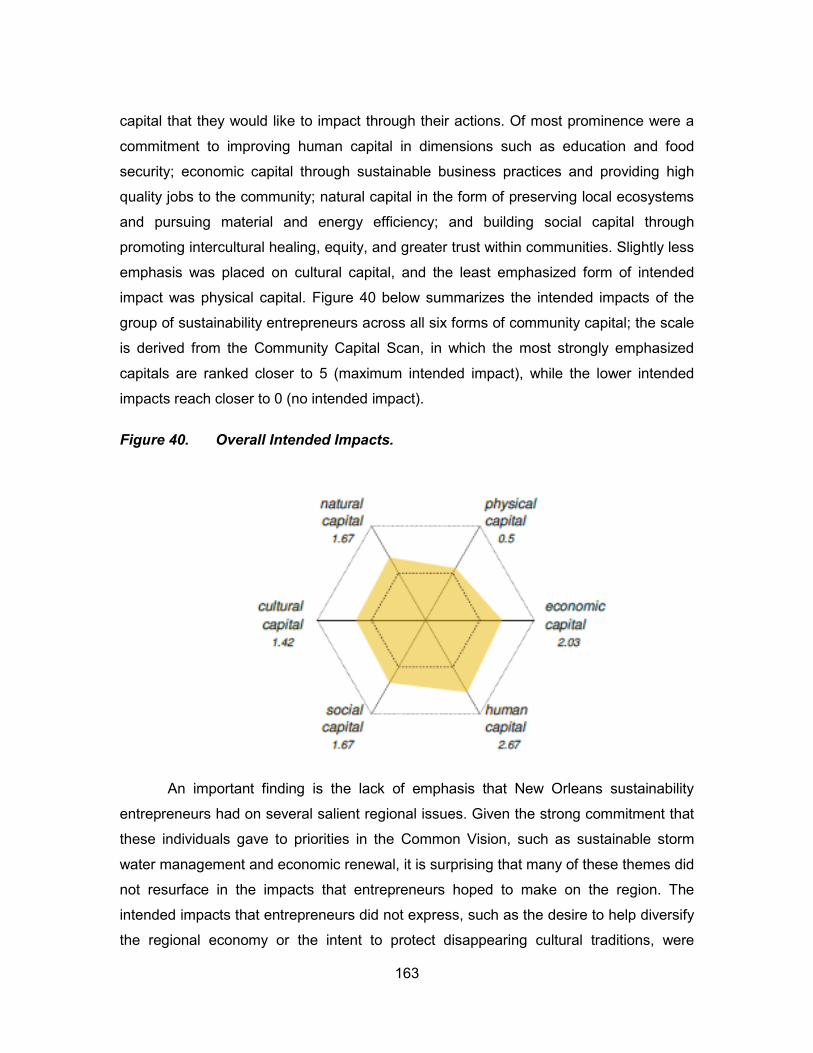
163
capital that they would like to impact through their actions. Of most prominence were a
commitment to improving human capital in dimensions such as education and food
security; economic capital through sustainable business practices and providing high
quality jobs to the community; natural capital in the form of preserving local ecosystems
and pursuing material and energy efficiency; and building social capital through
promoting intercultural healing, equity, and greater trust within communities. Slightly less
emphasis was placed on cultural capital, and the least emphasized form of intended
impact was physical capital. Figure 40 below summarizes the intended impacts of the
group of sustainability entrepreneurs across all six forms of community capital; the scale
is derived from the Community Capital Scan, in which the most strongly emphasized
capitals are ranked closer to 5 (maximum intended impact), while the lower intended
impacts reach closer to 0 (no intended impact).
Figure 40. Overall Intended Impacts.
An important finding is the lack of emphasis that New Orleans sustainability
entrepreneurs had on several salient regional issues. Given the strong commitment that
these individuals gave to priorities in the Common Vision, such as sustainable storm
water management and economic renewal, it is surprising that many of these themes did
not resurface in the impacts that entrepreneurs hoped to make on the region. The
intended impacts that entrepreneurs did not express, such as the desire to help diversify
the regional economy or the intent to protect disappearing cultural traditions, were
164
somewhat inconsistent with many elements expressed in the visions that they described.
Although most entrepreneurs described how their efforts intended to fulfill their specific
agency mission or personal values, often there was little or no integration between the
goals of one entrepreneur and the vision expressed by another. This lack of integration
between visions and impacts perhaps is explained by the entrenchment of these
individuals in their particular issue areas and their expertise within that part of the
Common Vision, implying that it is reasonable to expect a wetlands restoration advocate
to be mostly concerned with impacting soil integrity and ecosystems, and a community
garden owner to have goals for health and well-being. However, the goals in the
Common Vision that entrepreneurs were not concerned with do expose a weakness in
the SE movement’s relevance. Although business owners may not be directly able to
reduce crime, preserve culture, or protect biodiversity, it is ideal if they are conscious of
these regional priorities in order for their activities not to detract from the efforts of other
actors to improve them.
6.1.9. Sustainability Entrepreneurs in Theory and Practice
Now with an understanding of the range of impacts on regional sustainability that
these entrepreneurs intend to make, these impacts must be compared to the integrated
concept of sustainability entrepreneurship that has been offered. These stakeholders
have a wide range of goals for being agents of change in their communities, but how do
these goals compare to the ideal of a sustainability entrepreneur? This broader definition
of SE has offered a model of entrepreneurs committed to local sustainability goals but
also concerned with creating shared value across the full chain of their activities, their
use of strategy and business interests in conjunction with community goals, their
flexibility in organizational structure and sensitivity to local socio-economic conditions
and needs, and the need for supportive partnerships. How do the sustainability
entrepreneurs in Greater New Orleans live out the characteristics of SE as defined in
this concept?
This section shows to what extent these entrepreneurs embody the
characteristics of SE identified in the different frameworks discussed in Section 2. In this
concept, which blends the SE framework with Shared Value, Corporate Social
Responsibility, Value Chain Analysis, and Social Entrepreneurship with considerations of
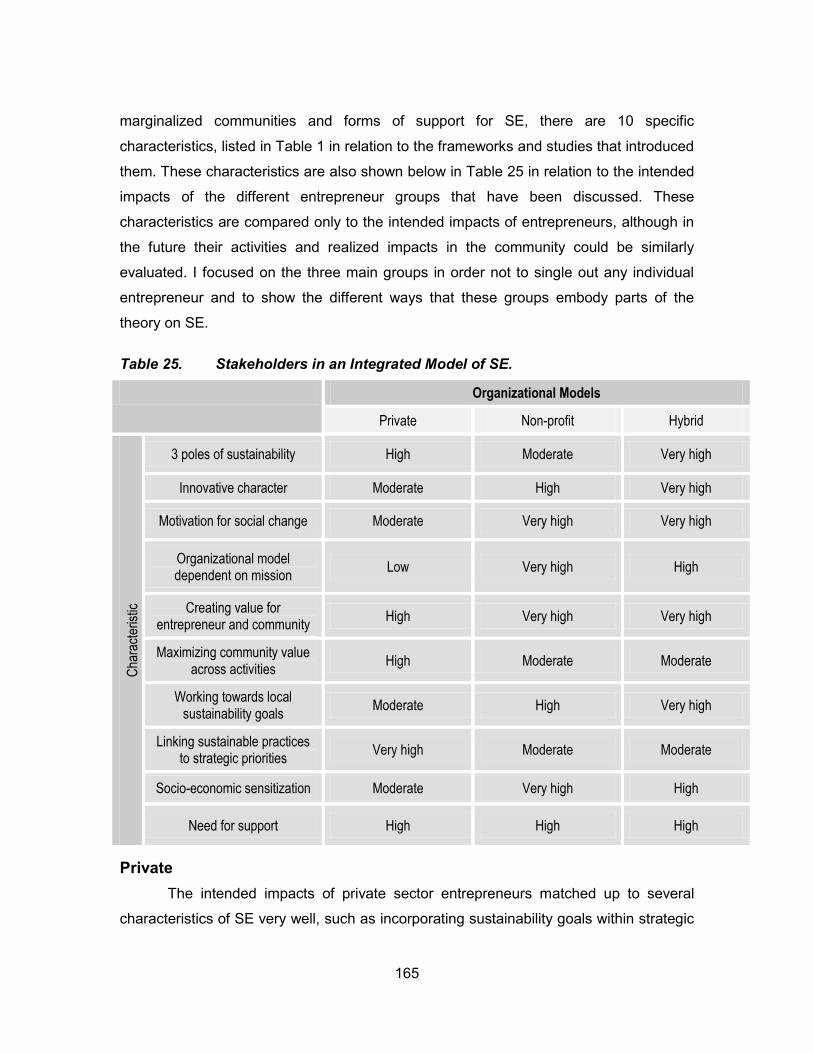
165
marginalized communities and forms of support for SE, there are 10 specific
characteristics, listed in Table 1 in relation to the frameworks and studies that introduced
them. These characteristics are also shown below in Table 25 in relation to the intended
impacts of the different entrepreneur groups that have been discussed. These
characteristics are compared only to the intended impacts of entrepreneurs, although in
the future their activities and realized impacts in the community could be similarly
evaluated. I focused on the three main groups in order not to single out any individual
entrepreneur and to show the different ways that these groups embody parts of the
theory on SE.
Table 25. Stakeholders in an Integrated Model of SE.
Organizational Models
Private Non-profit Hybrid
Cha
ract
eris
tic
3 poles of sustainability High Moderate Very high
Innovative character Moderate High Very high
Motivation for social change Moderate Very high Very high
Organizational model dependent on mission
Low Very high High
Creating value for entrepreneur and community
High Very high Very high
Maximizing community value across activities
High Moderate Moderate
Working towards local sustainability goals
Moderate High Very high
Linking sustainable practices to strategic priorities
Very high Moderate Moderate
Socio-economic sensitization Moderate Very high High
Need for support High High High
Private
The intended impacts of private sector entrepreneurs matched up to several
characteristics of SE very well, such as incorporating sustainability goals within strategic
166
business interests and creating shared value. These characteristics validated
propositions from Porter & Kramer (2006), in which the goals that business owners
expressed aligned closely with the authors’ description of effective corporate social
responsibility which must be wed to key business interests and not only be a peripheral
concern. The words of this stakeholder illustrate this relationship between business and
sustainability interests:
“a lot of times people will say “Why would an electric company care?” …you’ve got wetlands as a natural barrier to storms…if you don’t have those natural barriers, the powerlines come down, the electric service is interrupted, you’ve got the added cost of backup generators to emergency facilities. … it’s all a very dynamic, sort of organic working relationship between the environment and the business” (Anonymous, personal communication, August 24, 2012).
However, business owners did not express flexibility in their organizational
models, probably due to their intent to start a business or their inability to influence
corporate structure. These leaders showed a moderate level of innovation and, on
average, some interest in social change, although one entrepreneur, the owner of a
brewery, exemplified the community ethos of SE in Allen & Malin (2008). Overall, these
business leaders exemplified the strategic, value-oriented characteristics of SE, which
amplified their community impact goals despite lower emphasis on aspects such as
socio-economic sensitivity.
Non-profit
Entrepreneurs displayed different aspects of the SE model in their intended
impacts. These individuals showed a much stronger commitment to social change which
drove the structure of their organizations, very much in the vision of social
entrepreneurship in Austin et al. (2006). These leaders were also very sensitive to the
needs of communities, often targeting their efforts specifically at high-need populations
and seeking to harmonize their efforts with local cultural values as in O’Neill et al.
(2006). However, these entrepreneurs were also highly innovative, employing many
different models and approaches to their organizational mission. This entrepreneur
describes how her agency has achieved financial viability while continuing to strive
towards its goal of recycling building materials:
167
“we have a wonderful structure here, in that the more successful we are at putting building materials back into reuse, through sale to the public, the better our financial situation is. Which, you know the big buzzword in non-profits these days is to be financially sustainable and have a business model that helps you fund it. Which is great. So many of my friends are in the business, you know, struggling to find something that provides an income for the organization, but it’s really hard to find one that sometimes is exactly on mission” (Anonymous, personal communication, August 8, 2012).
Hybrid
Finally, hybrid entrepreneurs embodied the SE model better than the other two
groups. These leaders showed a strong validation of both the innovative character of SE
in Tilley & Young (2009) and the commitment to social change and shared value while
working directly toward regional sustainability goals. This strong overlap between
organizational and societal goals for sustainable development strongly validates
Dagevos & Evers (2008), as illustrated in the goal of this stakeholder whose
organizational mission is the same regional vision for improved storm water
management from the Common Vision:
“The vision we’re advocating isn’t a return to the swampland…but to understand [that]…the problem with water, in some ways [is] incredibly simply. You create a space for that water to go, and that water isn’t flooding your streets and your homes. So it’s a matter of…looking at the landscape, and creating those spaces for water…what we’re saying is we could learn from what existed before, the canals and bayous that existed before, and say we need a…city where water is, once again, part of the identity of the urban landscape” (Anonymous, personal communication, August 12, 2012).
At the same time, hybrid entrepreneurs were highly sensitive to local needs and
conditions, although not as much as their non-profit counterparts. These leaders had
less of an emphasis on maximizing their value chains than private sector entrepreneurs,
partly due to the fact that their activities are less characterized by the activities in
corporate value chains as defined by Fearne et al. (2012). However, this group
displayed the greatest amount of similarity with the SE model, perhaps due to their place
at the intersection of different organizational models and their ability to blend different
approaches and goals.
168
Overall SE Network
Overall, these entrepreneurs were highly consistent with the model that has been
proposed for sustainability entrepreneurship. Although some differences exist between
the stakeholder groups and the parts of the SE theory that they demonstrate, they share
a common reflection of strong characteristics of the framework. They each show a
concern for all three basic aspects of sustainability, and all expressed a need for greater
partnerships and support to achieve greater impacts. These leaders validate the
integrated theory that has been constructed in Section 2 in different ways. Sustainable
business leaders exemplify the strengths of corporate social responsibility as
approached from strategic calculus instead of cost avoidance or public relations; non-
profit leaders show aspects of the strong mission of social change and sensitization to
the needs of target communities while bringing sustainable innovations through their
varied approaches; and hybrid leaders bring these elements together while showing a
strong commitment to goals for regional sustainable development. Although these
different kinds of sustainability entrepreneurs demonstrate different aspects of SE, they
play to the strengths of their backgrounds and together represent a highly coherent
representation of a fuller model of SE.
6.2. Perceived Regional Impacts of Sustainability Entrepreneurs
Now that we know the ways that sustainability entrepreneurs wish to make
positive impacts on the New Orleans region, how well are they living up to those goals?
This section intends to provide an initial assessment of the outcomes of SE in New
Orleans using two approaches. The first is a self-assessment of entrepreneurs in which
the individuals who expressed the intended impacts analyzed above give an appraisal of
the extent to which they believe they are accomplishing these goals. This evaluation also
shows the kinds of impacts that entrepreneurs believe each other are making on
communities: the kinds of SE actors that were identified in interviews and the sorts of
impacts that were attributed to these actors. Finally, I identify the barriers that
stakeholders in these groups identified which prevented various actors from fully
achieving the impacts to which they aspired.
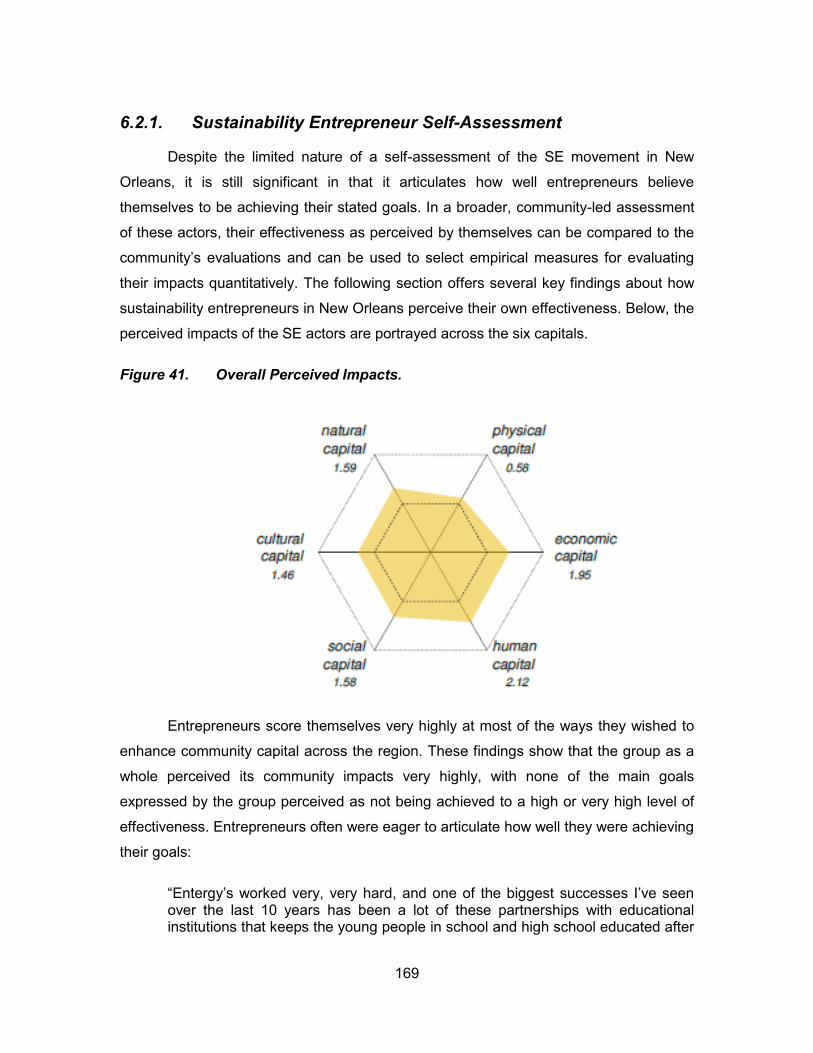
169
6.2.1. Sustainability Entrepreneur Self-Assessment
Despite the limited nature of a self-assessment of the SE movement in New
Orleans, it is still significant in that it articulates how well entrepreneurs believe
themselves to be achieving their stated goals. In a broader, community-led assessment
of these actors, their effectiveness as perceived by themselves can be compared to the
community’s evaluations and can be used to select empirical measures for evaluating
their impacts quantitatively. The following section offers several key findings about how
sustainability entrepreneurs in New Orleans perceive their own effectiveness. Below, the
perceived impacts of the SE actors are portrayed across the six capitals.
Figure 41. Overall Perceived Impacts.
Entrepreneurs score themselves very highly at most of the ways they wished to
enhance community capital across the region. These findings show that the group as a
whole perceived its community impacts very highly, with none of the main goals
expressed by the group perceived as not being achieved to a high or very high level of
effectiveness. Entrepreneurs often were eager to articulate how well they were achieving
their goals:
“Entergy’s worked very, very hard, and one of the biggest successes I’ve seen over the last 10 years has been a lot of these partnerships with educational institutions that keeps the young people in school and high school educated after
170
high school, destined for good, well-paying jobs, and hopefully through those partnerships, internship programs, things like that, a lot of them do come to work for us when they do start working” (Anonymous, personal communication, August 24, 2012).
This entrepreneur, as well as others, was very confident about her company’s
effectiveness at achieving the goals that they stated. This characteristic helps support
the need for CSR to focus on mutual benefit and for corporations to wed sustainability
with strategic investment (Porter & Kramer, 2006). Since Entergy was the only large
corporation with which I spoke, their attitude towards CSR is a small but very consistent
example of the strength of CSR when it is tied to corporate interests. However, there
was a considerable amount of humility in the self-evaluation of these leaders. This
stakeholder, despite becoming the director of a very well-known green jobs training
program and at a young age already having overseen the training of over 300 low-
income individuals in environmental job skills, perceived that:
“I think…encouraging elements of leadership to develop in our students is the most important thing that we could do. Again I’m thinking, we’re just scratching the surface, really” (Anonymous, personal communication, August 8, 2012).
These self-perceived evaluations became a fascinating exercise in the
psychological idea of congruence, or the extent to which these individuals’ ideal selves
matched their real selves in their own minds through the realization of self-expressed
identity and motivations (Hofer, Busch, Chasiotis, & Kiessling, 2006). Many
entrepreneurs believed their actions to be highly congruent with their goals, while others
identified key areas of unrealized intentions. This self-assessment became, for some, a
moment to hold a mirror up to the actions of the organizations in which these
entrepreneurs were involved, or of the individuals themselves. A few marked differences
emerged between the entrepreneurs across the organizational models in which these
leaders were involved. Since the hybrid actors had similar expressions of perceived
impact that did not differ significantly from the other two groups, I will discuss only the
non-profit and private sector groups.
Non-profit
The non-profit sector entrepreneurs expressed a largely congruent perception of
their efforts to impact regional sustainability. For the most part, they affirmed that their
171
organizations or individual efforts were essentially succeeding at impacting the goals
they had expressed and the forms of community capital that interested them. For their
goals in social, natural, and human capital, stakeholders expressed near congruence
between intended and realized impacts. Although some stakeholders believed that their
efforts were not fully realizing their full potential, there were only very small gaps in the
perceived effectiveness of non-profit impacts. For example, one entrepreneur admitted a
challenge that the organization needs to work on to improve their stated goal of
providing green jobs training:
“I think that’s our piece that we need to work on is the quality of the job placement. So, not everybody gets out and has a “green job” but we want them to have the environmental literacy level to understand what these industries are, and how their behavior affects the environment as well as the community” (Anonymous, personal communication, August 8, 2012).
Interestingly, there were several areas in which non-profit entrepreneurs
outmatched their intended goals for community impact. This occurrence happened
mostly in the areas of physical, economic, and cultural capitals, showing impacts that
entrepreneurs did not intend or that ended up being more positive than they expected.
Private
Compared to their non-profit peers, private sector entrepreneurs viewed
themselves as less effective overall at achieving their goals for regional sustainability.
Across all six capitals, the perceived impacts of business owners were lower than
intended impacts. However, these entrepreneurs perceived themselves to be relatively
effective at impacting economic, social, and natural capitals. Private sector
entrepreneurs believed to have a high level of congruence in areas such as embodying
sustainable business practices and confronting poverty. This entrepreneur, the owner of
a local and organic gelato shop, expressed her effectiveness in the following way: “within
that niche of sustainable things I think we’re pretty well known. People respect us for our
actual real green practices. They can see that we’re not greenwashing” (Anonymous,
personal communication, August 6, 2012).
However, several intended impacts of private sector leaders were not fully
realized. Many entrepreneurs expressed that their enterprises were too new to fully
172
achieve the companies’ goals, which were often far-reaching and elaborate. For
example, one entrepreneur had many detailed goals for other business plans and
initiatives, but had only begun her first recently and still was planning the next venture to
spread green building technology through a local ecotourism resort:
“we could even grow it to where it’s like, you know, it’s its own…little resort. You’ve got state of the art cabins. Super green. You know, all solar…all runoff…so hopefully people will go home and say, ‘My house could be more like this!’” (Anonymous, personal communication, August 10, 2012).
6.2.2. Sustainability Entrepreneurship Cross-evaluation
Having seen how SE leaders assessed their own progress at achieving regional
sustainability goals, now it is important to gauge the impacts of SE in another way. The
self-assessment is very subjective and bears the risk of showing the bias of
entrepreneurs to exaggerate their positive roles in the community and downplay their
weaknesses. In order to attain a more objective appraisal of SE actors, I also asked
stakeholders about the impacts of their colleagues across the SE network and the
impacts they believed were being made by these organizations. This section makes an
initial cross-assessment of sustainability entrepreneurs by analyzing the kinds of
entrepreneurial actors identified by stakeholders and the nature of the impacts on the
region that they were described to have by their peers.
The interviews with stakeholders revealed a wide array of actors. This array of
actors emerged from asking sustainability entrepreneurs which other individuals or
organizations they knew which were making positive community impacts through
environmentally sustainable actions. The group of SE actors that was identified was very
diverse and often very different from typical notions of sustainability entrepreneurs.
These actors included predictable groups such as entrepreneurs and green business
owners, as well as groups as diverse as sports-related environmental programs and
even the oil and gas industry. Interestingly, the most frequently mentioned set of actors
taking a role in regional sustainability were members of the community, followed by
municipal agencies, green business owners, non-profit organizations, and
entrepreneurs. Although some actors were mentioned many times, such as green
building agencies, which were alluded to 24 times, only two individuals pointed to their
173
role in SE, leaving this group not as salient as an actor that was mentioned by more
stakeholders. These actors were located across several different organizational models,
although many occupied hybrid roles not easily categorized into a single model.
How are these actors perceived by their peers as agents of advancing progress
towards a sustainable region? The various stakeholder groups that entrepreneurs
identified were described as having a wide range of impacts on the region, specific
communities or neighbourhoods, or particular issue areas and long-term goals for
sustainable development. The perceived impacts of these actors varied widely. Often, a
particular business or municipal department was praised by one individual only to be
harshly critiqued by another, and the confidentiality of these actors, since they did not
have a chance to state their own goals, is maintained by keeping them anonymous.
Another common difference between the perspectives of entrepreneurs was the scope
of community impacts which were relevant to a particular actor. Many individuals
expressed a broad array of impacts that they believed a certain agency or business
should make, while others only described the impacts that other actors were commonly
expected to make. Other common features of these perceived impacts are described in
detail below.
Community
By far the most frequently mentioned group of actors mentioned as part of SE
were members of the communities that are part of the New Orleans region. Community
members were described as having multiple impacts on regional sustainability and
playing a role in the actions of sustainability entrepreneurs. The impact of community
members was described in several ways, including the market role that individuals have
in driving demand for sustainable business, public pressure on political institutions, and
promoting sustainable choices and values in their communities.
Strengthening Green Markets
The role of community members in the market for green goods and services was
a major component of their perceived impact. Many stakeholders believed that
individuals were driving the increase in sustainable business practice through consumer
demand. By demanding more environmentally friendly products and services, these
residents were both helping create a viable market for these activities and attracting
174
sustainable businesses and green sectors. One green business owner explained their
impact in this way:
“I think that you have some people who are adopting more sustainable practices, and others who don’t see the value at all. And I think that’s where the consumer is going to really drive changes, and I think there are more consumers who are becoming more aware of sustainable practices” (Anonymous, personal communication, August 6, 2012).
Spreading Sustainability Values
Another way that the community was described as part of the SE movement was
in promoting and spreading sustainability to the rest of the population. Stakeholders
repeatedly referred to inspiring individuals and organizations, particularly in low-income
communities but throughout the region, who had begun to lead a consensus for
sustainable awareness and action in their neighbourhoods. Leaders in certain
neighbourhoods specifically lauded for this role: “there are definitely some natives,
specifically were in the Ninth Ward, right, that are leading a sustainability…movement
over there” (Anonymous, personal communication, August 7, 2012). However, this role
of spreading sustainable practices to the populace spread beyond the Lower Ninth Ward
into many other neighbourhoods and towns, with multiple stakeholders alluding to local
efforts to spread support for bicycle lane construction, volunteering opportunities for local
residents, wetlands restoration projects, and many other innovations. The roles played
by community members exposes another gap in the SE framework on the importance of
consumers in supporting SE. There is very little focus on the pivotal role played by
communities in their need to have pre-existing demand for the goods and services
offered by sustainability entrepreneurs, which in New Orleans has proven to be a major
limiting factor in the potential of SE.
Municipal Agencies
Second only to community leaders were the various departments of municipal
government who were described as playing a role in SE. Stakeholders repeatedly
alluded to local government actors as both contributors to and deterrents of a more
sustainable region. Most often, these actors were public servants within Orleans Parish,
but the lessons that the perspectives of their role in SE have region-wide implications.
175
Municipal Sustainability Champions
The first way that municipal agencies were described as having a role in SE was
by being champions of sustainability themselves. By implementing sustainable policies
and projects, agencies such as the Department of Sanitation, the Office of
Environmental Affairs, and other municipal organs were perceived as sustainability
entrepreneurs in their own right. Stakeholders described the impact of policies such as
reinstating an efficient and effective recycling system, creating a new Master Plan,
reducing municipal greenhouse gas emissions, and other improvements. Though the
momentum for municipal sustainability was often described as appearing post-Katrina,
one leader at the regional government level traced the shift to before the storm. “A lot of
the seeds for that momentum at that point had been planted before Katrina actually…in
the city, there was a small group of people who were really recycling advocates”
(Anonymous, personal communication, December 6, 2012).
Supporting Sustainability Partnerships
In addition to acting as sustainability entrepreneurs themselves, municipal actors
were perceived as supporting sustainable change being spearheaded by non-
governmental actors. Although not currently endowed with the resources or time to
address many issues related to regional sustainability, municipal agencies offered
support and coordination for other initiatives that were carrying out integrated storm
water management, small business incubation, vacant lot utilization, and other actions.
This non-profit leader candidly explained how this support is given:
“There’s no money…But governmental leaders…might go in on writing a grant, you know, if there’s some non-profit that’s doing some really good program, and the governmental leader wants to support that program, they might write a grant together to get money for whatever. So, just having the city saying “Yes, this is what we want to do.”, but then it’s that non-profit that actually does the program, with the City’s coordination or whatever” (Anonymous, personal communication, August 7, 2012).
Green Business Owners
A very different kind of role in SE was attributed to the owners of green
businesses in New Orleans. Not surprisingly, the most common way that these actors
participated in the movement was by following sustainable business practices. Actors
176
outside of the private sector described green businesses as fulfilling environmental and
community missions, while their peers often believed that any business can find a way to
apply sustainability and local community benefit to their practices. Sustainable business
owners were described as exceptional individuals with special personalities which gave
them a disposition to fulfill their social and environmental visions.
Support for Green Business
Often described as hardworking, visionary, and dynamic individuals, green
business owners were associated with many positive local impacts from low-income
assistance and poverty alleviation to ecological restoration, described at length in
Section 6.1. It was commonly perceived that many companies have started to show that
the green business movement can expand to an increasingly larger group of firms in the
region. However, many stakeholders believed that green businesses faced many
challenges and should be supported by local government as well as the community. “It
(rise in green business development) needs support, you know, it needs to be done
more quickly. It needs to have a sense of excitement around it. That we can make this
happen” (Anonymous, personal communication, August 19, 2012). This attitude that
green business needs to be supported confirms the need for partnerships and support of
SE from Dagevos & Evers (2008). Many stakeholders expressed the support that green
business owners need from governmental and non-governmental actors, from marketing
to certification. This characteristic shows that many best practices from other regions
could be used to fill this need.
Non-profit Organizations
The last group of actors identified as part of the SE movement was non-profit
organizations. These agencies, identified across various service areas such as
education, housing, job training, and other services, were most often defined as
sustainability entrepreneurs for their role in engaging community members in building
sustainable communities.
Engaging Communities
Non-profit leaders were identified as achieving widespread impact through
working with children to teach them to value sustainability, supporting wetlands
177
restoration and engaging the community in the process, understanding the interests and
goals of communities, and other forms of community engagement. This stakeholder,
who has witnessed the non-profit sustainability movement coalesce in the post-Katrina
period, recounted its community engagement process:
“a lot of different initiatives [are] starting to bubble up, and people from the outside started to talk about different ideas. There were plans and…sustainability discussions coming out of the Lower Ninth Ward about how to make it more sustainable, and they were kind of leading a lot of discussions…there was a lot of discussion in the community…but part of it was based on who was back and who wasn’t. In the same way as other places that I’d lived. So the guy who’s like a truck driver wasn’t part of these discussions, but there was a lot of fusion of ideas amongst a certain segment of the population” (Anonymous, personal communication, December 6, 2012).
Fostering Sustainable Change
Local non-profit entrepreneurs were also attributed with roles such as helping
foster local small business, fostering green building practices, and many other positive
influences. One form of non-profit actor, volunteers, were credited with great positive
influence by this stakeholder:
“I also very much believe the volunteerism, the sustainability-related volunteerism afterwards that helped a lot of people get their houses back together, but also to build them back green. So all those things just infused into the community after Katrina” (Anonymous, personal communication, August 7, 2012).
6.3. Barriers
Despite the widespread perceived impacts of different forms of SE on regional
sustainability, these successes did not come without a handful of significant limiting
factors. Most stakeholders identified a great number of barriers currently facing
sustainability entrepreneurs from various actor groups that kept them from realizing the
full potential of their role in regional sustainability. In the following section, I explain the
barriers faced by different groups of actors within the Greater New Orleans SE network.
178
6.3.1. Community Barriers
Although community-level actors were the most commonly mentioned group,
many of these initiatives were described as facing a myriad of barriers. The community
was said to have high impacts in areas such as increasing local food access and health,
increasing demand for public transit and affordable housing, while achieving a moderate
impact on ecosystem restoration and community decision-making. However, due to
multiple barriers, community actors were not perceived as fully achieving their intended
impacts on sustainable business demand, zero waste, and community mobilization.
These barriers are explained below.
Lack of Community Capacity
The foremost issue blocking a greater role of community members in SE was by
far the lack of capacity to become engaged in local initiatives. Many stakeholders
engrossed in grassroots initiatives described the low capacity of many neighbourhoods
in terms of time, money, awareness of issues, and more abstract limitations such as a
low sense of agency and confidence in many residents. A resident of the Lower Ninth
Ward explained this barrier very evocatively:
“if you’ve got a neighborhood where everybody’s house is demolished, and you don’t even have all your family back together and you’re trying to just survive on your own, what capacity do you have to reach out and help somebody else?” (Anonymous, personal communication, August 21, 2012).
Residents in marginalized communities were also described as lacking a sense
of agency to become involved in community-led initiatives. Stakeholders explained their
belief that low-income residents, particularly from minority backgrounds, felt a sense of
futility about local organizations and agencies that led to a feeling of powerlessness to
influence these institutions. This green jobs training program director described that
“sometimes people from marginalized communities don’t feel that they have the
influence” (Anonymous, personal communication, August 8, 2012). She also shared the
sentiment of many stakeholders that many community members lack awareness of
sustainability initiatives, describing that “on the individual level, I don’t think our
participants have, they probably have little to no knowledge of sustainability leadership
when they come to our program” (Anonymous, personal communication, August 8,
2012).
179
Unaffordability
Another major barrier facing community-level actors is the lack of affordability for
many services offered by sustainability entrepreneurs. Non-profit and for-profit actors
alike identified the limitations for community support of or benefit from their services due
to limited incomes. This entrepreneur described the problems imposed by affordability
issues illustratively:
“We work closely in trying to figure out what local residents want. We offer a 20% discount to neighborhood residents, which is pretty significant. I mean, we’re pretty much selling it to them pretty much at or slightly above what our purchase price is. So really, we’re losing money on it, because we want people so bad to come into our store. And even still, those prices are not what they’re used to paying. They’re used to paying even less than that” (Anonymous, personal communication, August 3, 2012).
Related to the lack of affordability that many community members face is the
barrier imposed by socio-economic divides between communities. Many entrepreneurs
expressed the difficulties they faced in reaching community members on the other side
of social, economic, and racial schisms. Despite these widespread barriers in community
capacity and access, there are significant impacts that community-level actors make on
regional sustainability.
6.3.2. Municipal Government Barriers
Although local government agencies were often described as sustainability
leaders, quite often their impact on regional sustainability was perceived as negative.
Overall, municipal agencies were perceived as having a low to moderate impact on
regional sustainability. Their support of other sustainability entrepreneurs and
government-led projects was associated with a moderately positive impact, although
stakeholders perceived a low ability to achieve lower corruption, sustainable waste and
storm water management. Stakeholders perceived an overall negative municipal impact
on goals such as green rebuilding and equity due to a number of barriers.
Misaligned Priorities
In many stakeholder interviews, local government was believed to have many
priorities that were misaligned with advancing sustainability goals. Perhaps the greatest
180
problem with government priorities, as described in length in Section 4, was the need to
commit to greater ethics and reduce corruption to regain the confidence of citizens. One
leader working in waste management explained how this lack of legitimacy affected
recycling efforts:
“one of the things that we’re trying to do…there is such skepticism and lack of faith in government action sometimes. I know people who don’t recycle because they believe that it’s all gonna be thrown away anyway” (Anonymous, personal communication, August 19, 2012).
This lack of faith in government exposes a limitation in the region that currently
prevents many of the essential partnerships between SE and other agencies. Due to this
lack of trust and the low capacity of many government agencies, the forms of support for
SE listed in Dagevos & Evers (2008) are currently not being offered by municipal
agencies. This finding is an example of a best practice that has been found in other
regions which the SE framework highlights as a key weakness in the region and
introduces the need for further investigation of how SE may be able to operate in
institutional voids or even fill them in the absence of government capacity.
Financial Constraints
In addition to problems arising from the priorities of government, there was
considerable mention of the practical limitations to greater municipal leadership in
sustainability. Much like community actors, local government suffers from low capacity
and resources. The greatest of these practical limitations was perceived to be low
financial capacity, as described candidly by this individual. “one of the problems here is
that the City is so broke, that [trying] to do things like buy those recycling bins is really
difficult for them” (Anonymous, personal communication, August 19, 2012).
Multiple instances of financial barriers to greater realization of sustainability
projects were described by stakeholders in areas such as waste management and storm
water planning. They also explained how many cost-saving measures had often been
implemented so recently that it was too early to reap their financial benefits. These
practical limitations of time and fiscal capacity often prevented a more long-term
planning perspective in critical areas. This stakeholder, whose personal involvement in
181
regional water systems planning has exposed him to limits in long-term planning,
described the problem with this example:
“That doesn’t really happen. All these entities, Sewerage and Water Board, Department of Public Works, they’re just trying to survive day to day, filling potholes, addressing complaints and trying to get the things done today that they need to take care of to reduce flooding or whatever. So they don’t have a lot of time or money to step back and look at the whole picture” (Anonymous, personal communication, August 12, 2012).
6.3.3. Green Business Barriers
Although green businesses play a strong role in advancing regional sustainability
goals, stakeholders identified that they are very limited in their overall impact on
communities. Their ability to advance sustainable business practices, waste reduction,
and other intended impacts were described as impeded by several factors. Like in other
actor groups, financial limitations were a large barrier keeping companies from doing all
of the sustainability projects they would like to do. However, the main impediment facing
green businesses resulted from a different barrier.
Irrelevance to Communities
The central barrier facing green businesses was a common perception by
community members that these businesses’ services were irrelevant or, at worst,
harmful to local ways of life which led to resistance and mistrust. A business owner
trying to spread kayaking to the community explained a common perception about the
sport that impedes the company’s activities. “Kayaking seems to be that, like, extreme
sport, or something that Northern people do. But I like that now it’s becoming really
popular, obviously a lot with the fishing crowds” (Anonymous, personal communication,
August 10, 2012). The perceived irrelevance of an activity that is commonly perceived as
belonging to a geographical other or an obscure user group prevented this entrepreneur
from gaining greater support. This perception was also associated with entrepreneurs
such as organic produce vendors, green building agencies, and sustainability
certification firms. In all of these cases, stakeholders spoke of the need for businesses to
gain a greater understanding of the needs and values of the communities that form both
their customer base and potential beneficiaries.
182
6.3.4. Non-profit Barriers
Finally, non-profit sustainability entrepreneurs are also limited in their current
realization of intended impacts on regional sustainability. The goals that these leaders
expressed, such as understanding community needs and improving food access, were
impeded by a handful of factors. As in every other case, the lack of financial resources
was a very high need, as well as the need for greater support from agencies that could
provide funding. However, stakeholders identified one barrier that was the most
debilitating for non-profit sustainability entrepreneurs.
Mission Silos
The major limitation facing these entrepreneurs was the perception that agencies
were not well connected to issues outside of their specific agency missions. A leader
working in youth development critiqued her peers in that sector of operating inside
mission silos, describing the problem in this way. “Our non-profit youth development or
social service agencies, I think are aware of the other non-profits out there that do
environmental stuff. I don’t know if there’s a strong connection with them” (Anonymous,
personal communication, August 8, 2012).
This sort of criticism was often made of organizations that were dedicated to one
specific issue or population and at times failed to make broader impact or appeal to a
broader group of supporters. The same stakeholder showed how organizations can
escape this narrow focus and reach broader appeal with an example of an agency using
energy efficiency to appeal to a wide range of community issues:
“it’s taking off and I think that it’s getting momentum and I think it has potential to grow and increase, so it’s not just being talked about in terms of, there’s this small topic of you know, we need to make sure things are more efficient, but it’s broader. Its, efficiency is small business development, it’s job creation, so I mean it has the potential to reach a lot of other topics besides this one…environmentalist rhetoric” (Anonymous, personal communication, August 10, 2012).
Overall, non-profit organizations were perceived as having a moderate but
significant impact on regional sustainability. Stakeholders believed a strong role for
these agencies in fostering local economic self-sufficiency, while their impact on
affordable housing and coastal restoration was moderate. However, the barriers
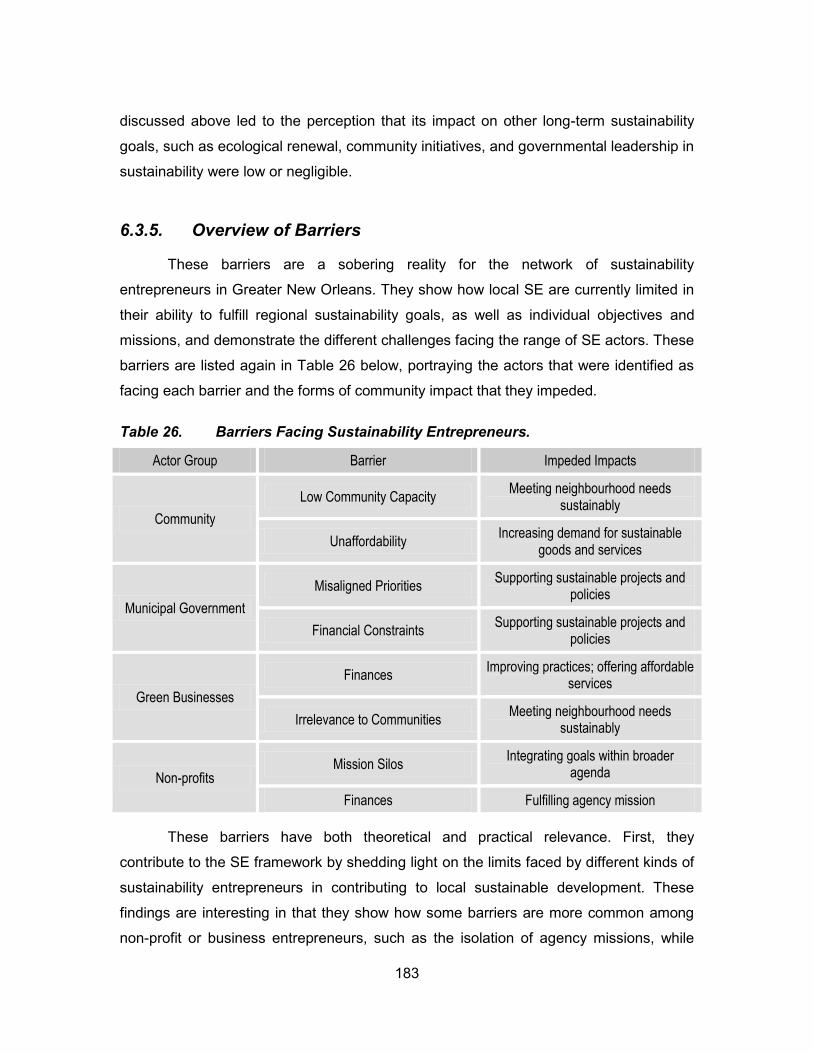
183
discussed above led to the perception that its impact on other long-term sustainability
goals, such as ecological renewal, community initiatives, and governmental leadership in
sustainability were low or negligible.
6.3.5. Overview of Barriers
These barriers are a sobering reality for the network of sustainability
entrepreneurs in Greater New Orleans. They show how local SE are currently limited in
their ability to fulfill regional sustainability goals, as well as individual objectives and
missions, and demonstrate the different challenges facing the range of SE actors. These
barriers are listed again in Table 26 below, portraying the actors that were identified as
facing each barrier and the forms of community impact that they impeded.
Table 26. Barriers Facing Sustainability Entrepreneurs.
Actor Group Barrier Impeded Impacts
Community
Low Community Capacity Meeting neighbourhood needs
sustainably
Unaffordability Increasing demand for sustainable
goods and services
Municipal Government
Misaligned Priorities Supporting sustainable projects and
policies
Financial Constraints Supporting sustainable projects and
policies
Green Businesses
Finances Improving practices; offering affordable
services
Irrelevance to Communities Meeting neighbourhood needs
sustainably
Non-profits Mission Silos
Integrating goals within broader agenda
Finances Fulfilling agency mission
These barriers have both theoretical and practical relevance. First, they
contribute to the SE framework by shedding light on the limits faced by different kinds of
sustainability entrepreneurs in contributing to local sustainable development. These
findings are interesting in that they show how some barriers are more common among
non-profit or business entrepreneurs, such as the isolation of agency missions, while
184
other barriers, such as financial limitations, are shared by all kinds of actors. Second,
these barriers provide insight for local stakeholders to use in designing new approaches
to support and foster SE, allowing groups such as entrepreneurs, supporting agencies
such as LifeCity, and local government to understand more fully how to target their
efforts at maximizing the ability of SE to advance local sustainable development goals.
This insight can be gained by expanding on these findings to highlight further distinctions
in the kinds of challenges most frequently faced by different entrepreneurs in Greater
New Orleans and employing different forms of support that can be aimed at reducing
some of these barriers.
6.4. Review of Findings
The initial assessment of sustainability entrepreneurs in Greater New Orleans
has revealed several important findings. First, these entrepreneurs have a wide variety
of goals for impacting regional sustainability, with common intended impacts including
sustainable business creation, waste reduction, habitat protection, healthy food access,
and community mobilization. In addition, these goals represented many different
requirements in the Common Vision, as well as showed different characteristics of SE
under an integrated theoretical model that these entrepreneurs are living out in practice.
A few differences exist between private sector entrepreneurs, who are more likely to use
strategic investment to follow sustainability goals than their non-profit counterparts, or
between hybrid actors who are more congruent with the SE theory than other groups
most likely due to their ability to blend the strengths of different organizational models.
Finally, these entrepreneurs assessed their realization of these intended impacts highly,
although they identified a number of barriers facing themselves as well as other parts of
the SE network, such as the lack of community capacity, unaffordability, low trust in
government institutions, low perceived relevance of some products and services, and
financial barriers. These barriers can offer an initial agenda for identifying more nuanced
barriers and crafting strategies to overcome them.
185
7. The Role of LifeCity in Regional Sustainable Development
With a better understanding of the current goals of sustainability entrepreneurs in
Greater New Orleans and the challenges they face, it is possible to assess the ways that
these agencies are being supported to overcome these barriers. As in Dagevos & Evers
(2008), SE must be enabled and promoted by local agencies to initiate, facilitate, and
direct its contribution to a sustainable community, which must be done in Greater New
Orleans in a way that helps overcome barriers such as lack of financial resources and
disconnected organizational missions. To that end, the final component of this project is
the consideration of the enterprise LifeCity and its role in supporting the network of
sustainability entrepreneurs in New Orleans. One of the main goals of this project is to
deliver practical and relevant findings to local actors, one of which, LifeCity, is not only
an important actor in the SE network but also a vital collaborator in this research. In the
evolution of the project, one of the main goals has been the assessment of the
enterprise in terms of the ways it intends to impact sustainability entrepreneurs and the
broader community. This assessment intends to achieve both the evaluation of an
organization that is actively trying to support and enhance SE in the region, and the
delivery of practical findings to a key partner in the study for the enterprise to understand
its perception by local entrepreneurs and reflect on strategies for improving its impacts
on regional sustainability. As mentioned in Section 6, the barriers facing SE in the region
provide insight into the ways that agencies can support these entrepreneurs to
overcome them, of which LifeCity is the foremost representative. In this section, which
concludes the outcomes of this study, I report on the perceived effectiveness of LifeCity
at key operational goals, the impacts of the enterprise on the various SE actors
identified, and its impact on community capital in the region.
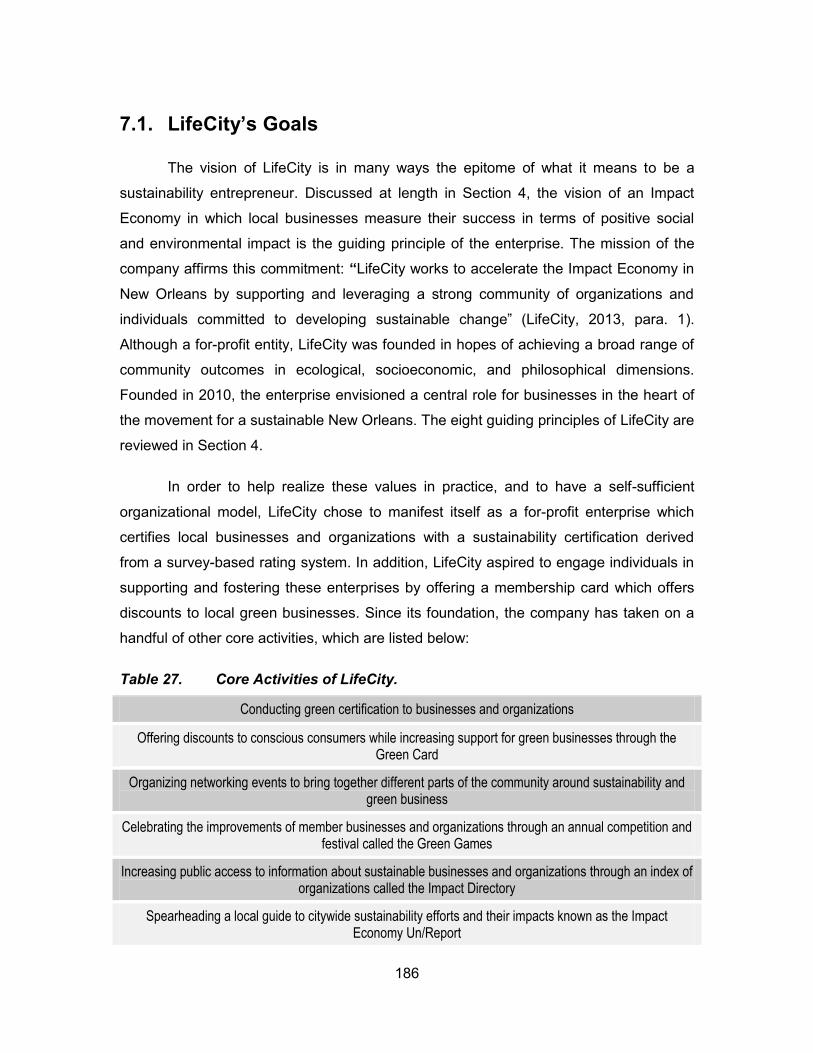
186
7.1. LifeCity’s Goals
The vision of LifeCity is in many ways the epitome of what it means to be a
sustainability entrepreneur. Discussed at length in Section 4, the vision of an Impact
Economy in which local businesses measure their success in terms of positive social
and environmental impact is the guiding principle of the enterprise. The mission of the
company affirms this commitment: “LifeCity works to accelerate the Impact Economy in
New Orleans by supporting and leveraging a strong community of organizations and
individuals committed to developing sustainable change” (LifeCity, 2013, para. 1).
Although a for-profit entity, LifeCity was founded in hopes of achieving a broad range of
community outcomes in ecological, socioeconomic, and philosophical dimensions.
Founded in 2010, the enterprise envisioned a central role for businesses in the heart of
the movement for a sustainable New Orleans. The eight guiding principles of LifeCity are
reviewed in Section 4.
In order to help realize these values in practice, and to have a self-sufficient
organizational model, LifeCity chose to manifest itself as a for-profit enterprise which
certifies local businesses and organizations with a sustainability certification derived
from a survey-based rating system. In addition, LifeCity aspired to engage individuals in
supporting and fostering these enterprises by offering a membership card which offers
discounts to local green businesses. Since its foundation, the company has taken on a
handful of other core activities, which are listed below:
Table 27. Core Activities of LifeCity.
Conducting green certification to businesses and organizations
Offering discounts to conscious consumers while increasing support for green businesses through the Green Card
Organizing networking events to bring together different parts of the community around sustainability and green business
Celebrating the improvements of member businesses and organizations through an annual competition and festival called the Green Games
Increasing public access to information about sustainable businesses and organizations through an index of organizations called the Impact Directory
Spearheading a local guide to citywide sustainability efforts and their impacts known as the Impact Economy Un/Report
187
7.2. Perceived Impacts of LifeCity
In order to understand the impacts of LifeCity on the broader SE movement in
New Orleans, I consulted the group of sustainability entrepreneurs about their
perceptions of the enterprise. Some of these entrepreneurs were directly affiliated with
LifeCity as clients of its certification service, and others had no affiliation with the
company. Of the individuals that had heard of LifeCity, I asked them to describe their
perspectives on the ways that its activities makes broader impacts in the region, the
kinds of actors that it supports, and which priorities for a sustainable region it affects
through its operations. Overall, the enterprise was perceived to have a relatively high but
narrow impact on regional sustainability through its various activities and support to
different sustainability entrepreneurs. Below I describe the main impacts that were
attributed to the enterprise.
7.2.1. Forms of Community Impact
The most telling perspectives offered about LifeCity’s community impacts were
about the kinds of activities conducted by the enterprise that impacted regional
sustainability. The way these actions are perceived by local sustainability entrepreneurs
triangulates the firm’s core activities with external perceptions to allow for a more
objective analysis of how these activities affect the SE in the region. For this reason, the
impacts of the company are gauged in terms of the activities that sustainability
entrepreneurs perceive LifeCity to be involved in, instead of the actions that are listed
above. The impacts that are included are also expressed quantitatively in graphic form
below, which was achieved by coding the level of impact perceived by stakeholders on a
range from very low to very high and displaying the perceived impact across a five-point
scale.
Building a Green Business Community
By far the most salient activity that affected regional sustainability was LifeCity’s
efforts to build a green business community. Consistent with the mission of the
company, the perspectives of most stakeholders who were familiar with the company
expressed its main community impact as one of supporting and promoting green
188
business. Entrepreneurs from all organizational backgrounds confirmed that the
enterprise’s efforts to celebrate and encourage sustainable business practices by
offering services, certification, and marketing to green companies was its strongest form
of community impact. For-profit members of LifeCity often spoke to the company’s ability
to market the environmental merits of their clients and reward their good deeds,
especially through one of the company’s early highlights, an awards ceremony that
celebrated the highest-performing companies after a year-long green business
competition known as the Green Games. “I like that they reward people or entrepreneurs
and businesses for their commitment to the community.” (Anonymous, personal
communication, August 10, 2012).
Reaching the Broader Community
A key element of LifeCity’s impact is reaching not only the sustainable business
community but also fostering a broader movement of sustainability in the community.
This impact included helping members of the community see green business in a
broader sense that could include a wide array of actors and communities. This leader
described this aspect in this way:
“I’m glad to see LifeCity expand the businesses that they work with and kind of creating this community because...people realize that green businesses aren’t just food or high-end shopping boutiques, there’s all businesses can be green. It exposes people and can break down some stereotypes about what a green business is” (Anonymous, personal communication, August 3, 2012).
This function of making green business a more inclusive and expanded concept
through widening the scope of what kinds of companies can be green businesses was a
very salient perceived impact among many individuals. This aspect of building a green
business community related to an expressed need for the company to expand not only
the concept of green business but also the message of corporate sustainability beyond
the typical purview of companies and sectors that are most likely to adopt green
practices.
Providing Expertise and Reflection
The second major perceived impact of LifeCity was expressed in terms of its
specific services which it offers to businesses and organizations. This area of impact
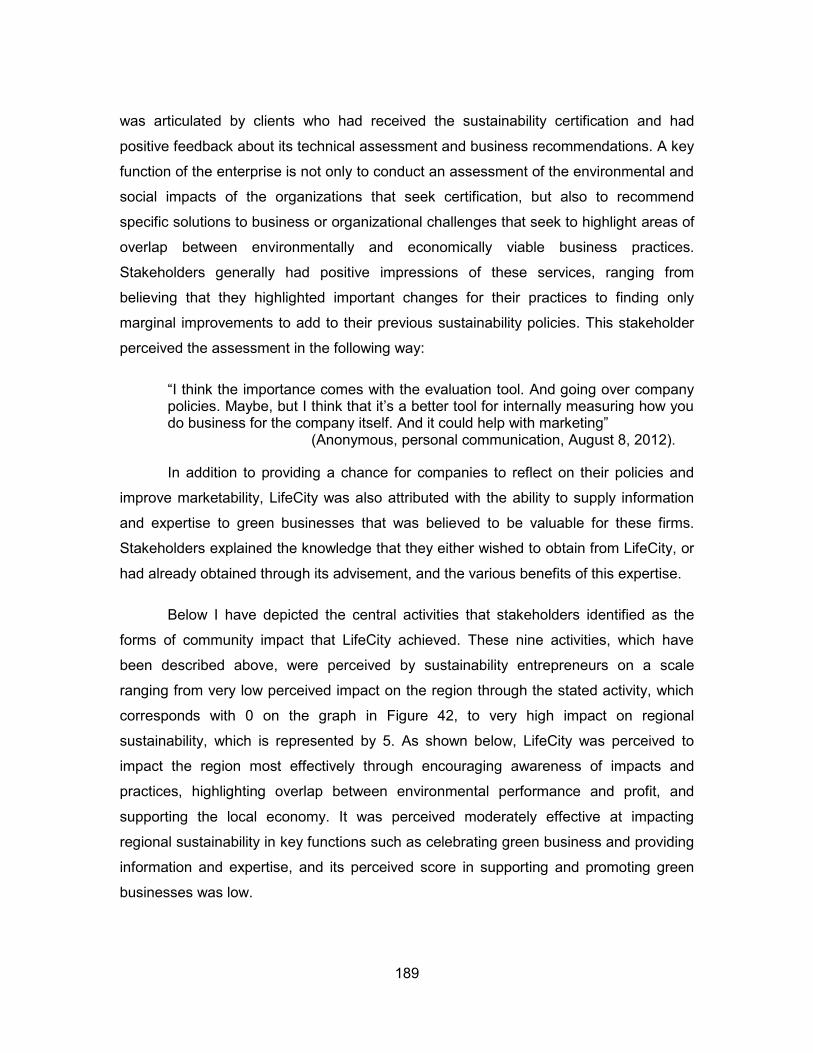
189
was articulated by clients who had received the sustainability certification and had
positive feedback about its technical assessment and business recommendations. A key
function of the enterprise is not only to conduct an assessment of the environmental and
social impacts of the organizations that seek certification, but also to recommend
specific solutions to business or organizational challenges that seek to highlight areas of
overlap between environmentally and economically viable business practices.
Stakeholders generally had positive impressions of these services, ranging from
believing that they highlighted important changes for their practices to finding only
marginal improvements to add to their previous sustainability policies. This stakeholder
perceived the assessment in the following way:
“I think the importance comes with the evaluation tool. And going over company policies. Maybe, but I think that it’s a better tool for internally measuring how you do business for the company itself. And it could help with marketing” (Anonymous, personal communication, August 8, 2012).
In addition to providing a chance for companies to reflect on their policies and
improve marketability, LifeCity was also attributed with the ability to supply information
and expertise to green businesses that was believed to be valuable for these firms.
Stakeholders explained the knowledge that they either wished to obtain from LifeCity, or
had already obtained through its advisement, and the various benefits of this expertise.
Below I have depicted the central activities that stakeholders identified as the
forms of community impact that LifeCity achieved. These nine activities, which have
been described above, were perceived by sustainability entrepreneurs on a scale
ranging from very low perceived impact on the region through the stated activity, which
corresponds with 0 on the graph in Figure 42, to very high impact on regional
sustainability, which is represented by 5. As shown below, LifeCity was perceived to
impact the region most effectively through encouraging awareness of impacts and
practices, highlighting overlap between environmental performance and profit, and
supporting the local economy. It was perceived moderately effective at impacting
regional sustainability in key functions such as celebrating green business and providing
information and expertise, and its perceived score in supporting and promoting green
businesses was low.
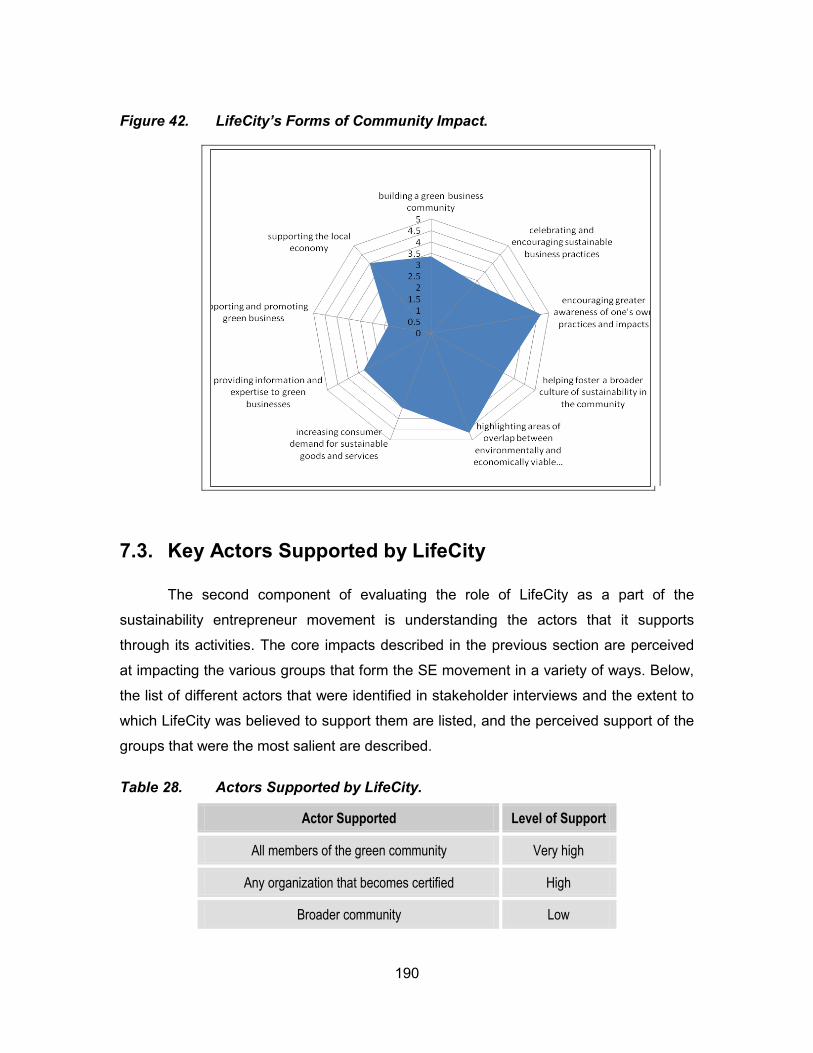
190
Figure 42. LifeCity’s Forms of Community Impact.
7.3. Key Actors Supported by LifeCity
The second component of evaluating the role of LifeCity as a part of the
sustainability entrepreneur movement is understanding the actors that it supports
through its activities. The core impacts described in the previous section are perceived
at impacting the various groups that form the SE movement in a variety of ways. Below,
the list of different actors that were identified in stakeholder interviews and the extent to
which LifeCity was believed to support them are listed, and the perceived support of the
groups that were the most salient are described.
Table 28. Actors Supported by LifeCity.
Actor Supported Level of Support
All members of the green community Very high
Any organization that becomes certified High
Broader community Low
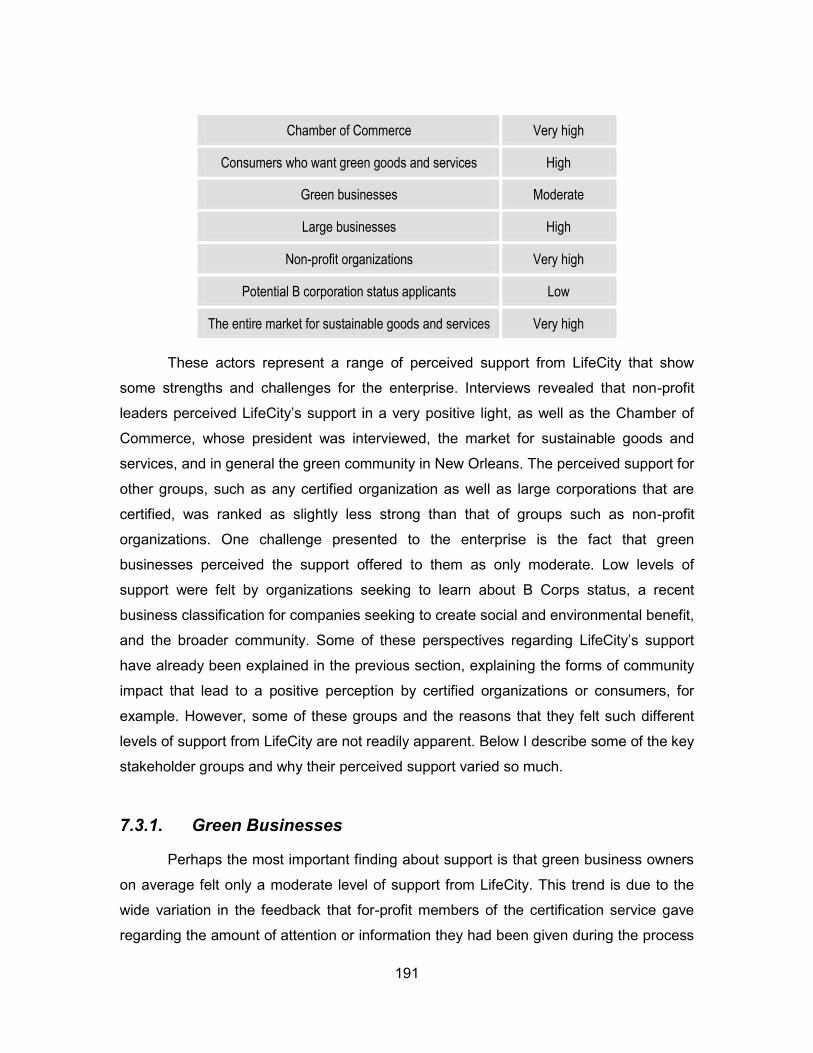
191
Chamber of Commerce Very high
Consumers who want green goods and services High
Green businesses Moderate
Large businesses High
Non-profit organizations Very high
Potential B corporation status applicants Low
The entire market for sustainable goods and services Very high
These actors represent a range of perceived support from LifeCity that show
some strengths and challenges for the enterprise. Interviews revealed that non-profit
leaders perceived LifeCity’s support in a very positive light, as well as the Chamber of
Commerce, whose president was interviewed, the market for sustainable goods and
services, and in general the green community in New Orleans. The perceived support for
other groups, such as any certified organization as well as large corporations that are
certified, was ranked as slightly less strong than that of groups such as non-profit
organizations. One challenge presented to the enterprise is the fact that green
businesses perceived the support offered to them as only moderate. Low levels of
support were felt by organizations seeking to learn about B Corps status, a recent
business classification for companies seeking to create social and environmental benefit,
and the broader community. Some of these perspectives regarding LifeCity’s support
have already been explained in the previous section, explaining the forms of community
impact that lead to a positive perception by certified organizations or consumers, for
example. However, some of these groups and the reasons that they felt such different
levels of support from LifeCity are not readily apparent. Below I describe some of the key
stakeholder groups and why their perceived support varied so much.
7.3.1. Green Businesses
Perhaps the most important finding about support is that green business owners
on average felt only a moderate level of support from LifeCity. This trend is due to the
wide variation in the feedback that for-profit members of the certification service gave
regarding the amount of attention or information they had been given during the process
192
of becoming a green business. On one hand, some companies appraised the support
they received very positively:
“It’s gone very well. I think it’s encouraging to be a part of that community and to meet other people who are trying to be sustainable. And it’s really been a good networking opportunity. So that’s all been really good” (Anonymous, personal communication, August 6, 2012).
In other instances, companies expressed dissatisfaction with some of the
supporting services offered in areas such as promoting companies. However, overall this
negative feedback was uncommon, and more generally it was felt that the initial
experience had been positive. In many cases, businesses have been members of the
LifeCity certification for a year or less, and expressed positive support during that time
but that more time was simply needed in order for that support to reach its full potential.
In some cases, companies candidly stated that the impact of LifeCity’s support has been
positive but modest. “I wouldn’t say it was a huge impact but I’d say it was a positive
one” (Anonymous, personal communication, August 6, 2012). Another form of feedback
was that the support offered in the form of expertise and recommendations was
informative but not always perceived as a company priority or given any incentive to
follow through on with recommended actions. This stakeholder expressed frustration
that:
“[Our organization is] too busy, there hasn’t been time for anyone to really focus on how to improve the way the office is doing. Not that people at the office don’t care, but it just becomes this extra thing. There’s no real incentive to do it” (Anonymous, personal communication, August 12, 2012).
7.3.2. Non-profits
Another form of support that is significant and at a different level from that of
businesses is the feedback from non-profit organizations. The review from non-profit
stakeholders was quite positive overall, resulting mostly from a perception that either the
certification that LifeCity had offered was helpful or that its services by and large did not
apply to these organizations. When considered applicable to organizational activities,
non-profits largely spoke very positively of LifeCity’s support of their sustainability
practices. This non-profit director described the support of LifeCity in this way:
193
“I thought that the survey tool was useful and we actually didn’t have any written policies at the time, but now we have written policies. Well we had the mission, vision, values of the organization, but actual policies in the office to turn off lights and those types of things. So that helped us do some nice agency reflection” (Anonymous, personal communication, August 8, 2012).
The other main feedback from non-profit actors was the conception that LifeCity’s
services were not relevant to the work of their particular organizations.
“I consider LifeCity’s role to be more in terms of…business-to-business relations than individual relations, and…I see the biggest impact as business-to-business relationships, and integrating the kind of labelled green companies, and the non-green, non-labeled green companies having some integration” (Anonymous, personal communication, August 8, 2012).
This feedback could be interpreted in a handful of ways. The perceived
irrelevance of LifeCity’s services to these agencies could be interpreted as a critique if it
is assumed that the company should strive for universal relevance to all kinds of actors
and agencies. However, it is likely to be more reasonable to judge the company against
its own stated goals, which put primary emphasis on the building of an economy of
positive impact through supporting businesses (LifeCity, 2013). Much like the
sustainability entrepreneurs in Section 6.1 were only assessed in terms of the impacts
they intended to have, it is only fair to appraise LifeCity for the impacts it intends to have.
7.4. Impacts on Community Capital in Greater New Orleans
The final component of the assessment of LifeCity’s role in advancing regional
sustainability is translating these impacts that have been reviewed into the areas of the
goals for a sustainable New Orleans. What implications do these roles have for the
broader outlook of a common vision of regional sustainable development and the long-
term goals that have been identified in attaining it?
The functions of LifeCity correspond with six long-term goals of the Common
Vision for regional sustainability, located within economic and natural capitals. These
goals were derived from the comments of stakeholders in the same way as the intended
impacts of other stakeholders in the previous sections. By far, the most frequently
mentioned long-term goal was the objective of creating a culture of sustainable business
194
region-wide (E8), which is not surprising since this is also the objective of the enterprise.
All of the other long-term goals were mentioned only sporadically by stakeholders,
including the impact of LifeCity on the region’s efforts for a new relationship between
people and nature (N15), the attraction of federal and state funding to organizations
(E15), reducing waste (N11), and reducing greenhouse gas emissions (N3). With the
exception of attracting government funding to the region, all of these long-term goals
experienced a high impact from LifeCity in the eyes of at least one stakeholder.
However, the only widespread sentiment was the company’s impact on sustainable
business creation.
7.5. Review of Findings
These impacts are small but significant. The long-term goals that LifeCity impacts
through its work are those that relate to its goals as a company and as a supporter of a
vision for a more sustainable region. It may be possible to criticize LifeCity for not taking
on a wider range of concerns into its mission in order to create balanced impacts in a
comprehensive way across all forms of community capital. Ideally, an actor whose role is
to support and foster the SE movement should be expected to impact all areas of
community capital in the region. However, once again these lofty expectations should be
tempered with the actual goals of LifeCity. Although it is necessary for actors to support
all segments of the SE movement for the deepest and most expansive impact on
regional sustainability, the only actors that LifeCity is explicitly trying to support are green
businesses, non-profit organizations, and consumers. It has a wide array of multifarious
side-projects, but the core function of the enterprise is building a green business
community. This limited but focused scope should temper the expectations of LifeCity’s
desired impact.
Another factor that limits the scope and reach of LifeCity is the enterprise’s
capacity. Firstly, the company was founded in 2011 and has barely had time to develop
a set of operating procedures and a staff. Often it is necessary for companies or non-
profit organizations to wait several years for their intended goals to start to be reached,
whether those goals be creating enough revenue to cover costs, raising a certain
amount of funds or awareness, or another indicator. In LifeCity’s case, these goals
195
would be expressed in terms of indicators such as the number of businesses certified,
number of Green Cards sold, GHG emissions reductions of clients, and other measures.
These kinds of goals need a certain amount of momentum in order to be attained, and in
the words of one member and friend of the company’s founder, “it’s too early to
say…you know, I think [LifeCity’s] really in the forming phase” (Anonymous, personal
communication, August 19, 2012). Another limit to capacity that cannot be overlooked is
the size of the company, which is under 10 full-time staff. Such a small staff, no matter
how dedicated, cannot reasonable expect to impact regional sustainability in any
reasonable way unless they aspire to do so in a few pointed and well implemented
objectives.
That being said, overall LifeCity is making a significant impact on the goals that it
sets out to achieve. There are a handful of findings that the company would be behoved
to observe and reflect on, such as the moderate level of support felt by green business
owners on average, and the perception that its message was not extending far beyond
the confines of the green business enclave. These challenges offer significant
opportunities for reflection, but should be considered alongside the numerous positive
perceptions from an array of actors. This evaluation can hopefully prompt further
evaluation by the staff of LifeCity, member organizations, and, most importantly,
community members, followed by informed action to further the enterprise’s role in
fostering a sustainability entrepreneurship movement that is viable, authentic, and
inclusive.
196
8. Recommendations and Conclusions
This project has found several significant findings about Greater New Orleans
regional sustainability. First, it has articulated a novel sustainability vision that has
sought to be more comprehensive and participatory than many of the existing visions
expressed in planning and policy documents. Pre-existing visions from a variety of
organizations were enriched and deepened by a wide range of priorities from local
community leaders who expressed visions for cross-cultural healing, water stewardship,
economic competitiveness, and many other goals. Integrated into the Community Capital
Framework, this vision calls for 66 specific long-term goals that can be measured and
monitored.
The second major finding is the result of an initial monitoring of these goals
through the Sustainable Region Balance Sheet. Though the Balance Sheet revealed
many strengths in the region, overall it demonstrated that New Orleans is, in many ways,
a region facing a great deal of vulnerability, marginalization, and inequality. Key
challenges were identified in stocks such as groundwater, soil, identity and diversity, and
financial resources, while stocks such as cultural heritage and labour were strong. In
light of the multiple challenges facing the region, from wetlands loss to educational
inequities, local actors should understand the full range of approaches that can be
supported to meet identified needs. Community members, non-profit organizations,
social services, government agencies, and other stakeholders would benefit from a full
understanding of the positive impacts of every potential solution that exists to address
these pressing challenges.
Third, this project has rendered an initial assessment of sustainability
entrepreneurs, who perceive themselves to have a high impact on a wide array of
regional sustainability goals and have identified a broad range of actors across the
region that are acting as sustainability entrepreneurs. These actors include community
members, municipal government, green businesses, non-profits, and many other
197
entities. The exploration of these actors also highlighted key barriers that impeded the
full realization of their community impacts, ranging from lack of affordability of goods and
services to a low level of relevance to community needs and interests. Finally, the
assessment of LifeCity’s impact on SE, and the region’s overall sustainable
development, shows that LifeCity is perceived to offer considerable support to a wide
range of actors within the SE network that is advancing regional sustainability through its
main activities, although in some instances, notably the support offered to businesses,
there are gaps between its goals and perceived impacts. Admittedly, LifeCity’s impacts
are small due to the enterprise’s size and age, but it can provide examples for other
agencies and organizations to support SE in similar ways.
The findings of this study are in many ways very preliminary. I do not intend or
expect to define the vision towards which Greater New Orleans should aspire in its
totality or measure the full impacts of any entity on progress towards it. Such an
objective would be more suited to the purview of a team of researchers rooted in long-
term community-based research and engaged with multiple levels of regional actors and
agencies, not a single researcher writing from afar. Ideally, I would have structured this
project in such a design, remaining in the community and working in collaboration with
local researchers, LifeCity, and other partners while obtaining municipal support and a
direct outcome of the project in local planning and policymaking with continual
community involvement and participatory project design. Of course, ideal conditions
never exist in research, especially graduate research, and my desires to execute ideals
of participatory action research and locally based visioning and monitoring had to be
tempered with these realities. The hope and challenge that this project concludes with is
the insistence of a full analysis of regional sustainable development and the role of
actors such as sustainability entrepreneurs also must meet the imperative of
participatory research and planning by engaging a fully representative cross-section of
dozens, if not hundreds, of community members. Though this ideal is what I would have
liked to achieve, this project should not and cannot aspire to this task, for to do so would
be inappropriate and unreasonable.
Instead, this study has hoped to initiate a dialogue about the process of defining
a sustainable New Orleans and to communicate the significance of assessing local
sustainability efforts in the context of the region’s ongoing discourse on renewal and
198
redevelopment. In the ongoing debate of how the region should rise from the ashes of
Hurricane Katrina and other successive disasters, the contribution I hope to make is a
modest but important challenge. This challenge is simply to urge New Orleans’ citizens,
policymakers, organizers, businesses, and other actors to ask the same sorts of
questions I have asked but to answer them in the most participatory way possible.
Ideally, these findings can pose these kinds of questions for local actors to answer: ‘why
should New Orleans care about regional sustainability?’ ‘How do we define what that
means?’ ‘Who is making progress towards that ideal and how can our communities
support them?’ Also, it is hoped that other regions and efforts to understand community
and regional sustainability, whether grassroots, policy, for-profit, or academic in nature,
can learn from what has been discovered about New Orleans and apply these lessons in
other contexts. A loftier goal, which may be somewhat unrealistic but is still my hope, is
to challenge New Orleanians, whether engaged in entrepreneurship or eking out a living
for their families, whether entertaining the intelligentsia of Magazine Street or rebuilding
their home in Braithwaite, to ask ‘how can I make a positive impact in my community?’
One cannot overstate the scope of this challenge, and we cannot expect a single
research project to make anything more than a small contribution to voicing it to local
actors and their compatriots in similar areas and inquiries. In order to concentrate the
impact of these findings, which are admittedly limited but potentially influential, I have
submitted a handful of recommendations, both practical and academic in nature, that are
directed toward local planning efforts, policymakers, sustainability entrepreneurs and
those who support them, and the academic community.
8.1. Practical Recommendations
The foremost recommendations that can be drawn from these findings are a
handful of practical lessons and challenges for local organizations and decision makers.
The practical application of this study intends not to advance a sweeping list of action
items aimed at the extremely wide array of policy arenas that are relevant here, but
instead to focus on a few specific considerations. These recommendations are voiced to
local stakeholders from community, government, and entrepreneur groups, as well as
199
the general business community.
8.1.1. Participatory Planning Framework
The main recommendation flowing from the findings about regional sustainability
in New Orleans is that there needs to be a fully participatory community-wide planning
process across the region. The goal of this study was in many ways to advance the
kinds of visions, priorities and indicators that are most appropriate for an official plan for
regional development using as participatory a process as possible given practical
constraints. This project, however, ultimately challenges community actors across the
region to employ a process to identify a vision for themselves and a locally appropriate
means of measuring the region’s location on the path to attaining it.
In many ways, the goals and methods of this study have been an exercise in
planning. Although not explicitly concerned with planning theory, its foundation in the
Community Capital Framework implies a concern for improved community and regional
decision-making that is best achieved by a process of collaborative planning. This
framework, and the current application of it, are committed to policymaking and planning
that support the enhancement of all forms of community capital, which is wed to the ideal
of maximizing citizen participation in, and ownership, of the decisions endorsed and
ways of making them (Roseland, 2012). In New Orleans and other locales, this form of
decision-making is analogous to participatory and collaborative approaches to regional
planning that emphasize the need for shared decision-making between all involved
stakeholder groups to collaborate to identify a common vision to guide decision-making
and determine how to assess the consistency of decisions with that vision (Gunton &
Day, 2003; Dagevos, 2011).
In this spirit of participatory and collaborative planning, the findings of this project
could serve as a small but illustrative model for a process to engage the region’s citizens
in a shared planning and monitoring process for Greater New Orleans. Like in the
construction of the Common Vision of this project, such an exercise would first need to
engage residents from across the region in defining what they believe to be an ideal
New Orleans. Local-level visioning could generate a multitude of common themes with a
priority for offering incentives and securing accessibility for all residents, relying on
200
neighbourhood-level organizers and community leaders to run meetings, and
maintaining the language and ideas of community members. Since the region’s
communities are much more diverse than the individuals involved in this project’s vision,
the themes and individual goals would likely be very different. Such a vision could be
synthesized in a similar way to this project’s, using the Community Capital Tool at the
neighbourhood level by thoroughly explaining its goals and principles and facilitating
residents in identifying the stocks and requirements of community capital in their
communities as well as the region as a whole. The compilation of these local visions
could be done in many ways, building off of the strengths of the New Orleans Master
Plan by generating neighbourhood-level studies and plans, creating an integrated but
representative list of long-term goals for region-wide community capital, or imagining
other approaches while maintaining full transparency and numerous opportunities for
public participation.
The outcome of such an undertaking could be a framework for monitoring
sustainability and assessing local decisions, guiding regional coordination, and
conducting region- and community-level plan-making to assess and prioritize goals and
strategies for a sustainable region. Although the Tool has not been employed in local
plan-making to date, municipal authorities and researchers in North Vancouver, B.C. are
considering a pilot project to employ the Balance Sheet methods in the revision of the
City’s Official Community Plan (City of North Vancouver, 2013). A similar approach could
be employed in Greater New Orleans, at either the neighbourhood, municipal, or
regional level to author or revise official plans such as the New Orleans Master Plan
using the vision, goals, indicators, and benchmarks shown in this project’s Balance
Sheet as a template form which to adapt to their needs. Of course, these efforts should
go hand in hand with a fully participatory monitoring agenda for regional sustainability.
This process implies the design of a region-wide Balance Sheet similar in form to the
one conducted in this project, but formed in a truly participatory process from beginning
to end. At all scales, community members should become engaged as both stakeholders
and experts in the crafting of requirements, indicators, norms, and continual monitoring
in order to track the region’s progress toward sustainable development. Citizen
participation would be especially important in the establishment of long-term goals, given
their role in describing the end goal of sustainability, and in setting norms to establish the
201
levels of acceptability for indicators that would be chosen. This process could borrow
best practices from previous regional monitoring processes, such as the use of multi-
stakeholder workshops to identify indicators and norms as in Hermans et al. (2011), the
revision of the Balance Sheet at periodic intervals, and the setting of a region-wide
agenda using findings from the Balance Sheet.
Ideally, decision makers could employ these insights not only in the planning
process, but also in everyday decisions such as the assessment of development
applications, zoning variances, bylaws, and a handful of other projects and policies. The
bylaw evaluation process employed in Lowry (2012), in which District of Sechelt, B.C.
staff gauged the perceived impacts of a local ordinance using the Community Capital
Scan, serves as an example of how this kind of evaluation could regularly be built into
municipal and regional decision-making. Other stakeholder groups such as
neighbourhood associations and businesses could also use these project assessment
approaches. Needless to say, there are considerable barriers to the implementation of a
process of this kind in Greater New Orleans at this time. Perhaps the greatest barrier is
the great disparity in capacity between different communities to participate, inherently
limiting the ability of many rural, minority, and low—income communities in their time
and personal buy-in to such a process. Another major barrier which is related to the first
is the aversion that many organizations have to evaluation and accountability. Given that
the process of designing a region-wide Balance Sheet would place certain agencies in
roles of accountability over certain goals either directly or indirectly, it is unlikely that
many actors that currently have little public accountability will be willing to participate in
such a monitoring process. If this process is implemented in the region, there must be
extensive efforts made to communicate to these actors, such as businesses in various
sectors and different municipal and state agencies, that the goal of such a process is to
include them in the creation and evaluation of solutions to regional challenges and not to
blame them for these problems or whistle-blow. Though this kind of decision-making
would have to adapt the Tool to the needs and priorities of the agencies considering its
use, the tools used in this project’s evaluation of sustainability entrepreneurs could serve
as an example to initiate discussion on adapting the Tool to these purposes.
202
8.1.2. Stakeholder Recommendations
Apart from the central recommendation calling for a region-wide participatory
planning and sustainability monitoring process, there are also a handful of points to
recommend to key stakeholder groups in light of this project’s findings. Given that
regional sustainability can only be meaningful if a wide variety of stakeholder groups
representing the region’s communities mobilize in a common effort, this project offers
recommendations to each of these key groups. The following recommended actions are
offered to citizen groups, sustainability entrepreneurs and the organizations in support of
them, the business community, and municipal and senior governments.
Citizen Organizations
All forms of community-based organizations in Greater New Orleans can become
engaged in starting dialogues and taking action for regional sustainability. This diverse
group of organizations, including social service agencies, arts and culture groups,
churches and other religious organizations, schools, neighbourhood associations,
community development corporations, and other NGOs, is directly composed of citizens
and in touch with their interests and needs. To initiate a more integrated dialogue about
a sustainable region and how to build it, these organizations are one of the most
important actors. They can play a vital role in helping neighbourhoods and towns to
consider their own specific sustainability vision, which could be quite different from that
of the broader region. This vision must begin by integrating the values and goals of
citizen groups in a more holistic exchange whereby many agencies and organizations
that have traditionally operated in isolation begin to interact with groups outside of their
mission silos to share goals and form partnerships. The collaboration between citizen
groups is also important to break down socio-economic barriers between many
communities and populations. In terms of setting an agenda for sustainable
development, these organizations also have an enormous role to play. Many NGOs
have the greatest available expertise in local needs such as food security and wetlands
ecology, necessitating that these organizations share their experience in helping
educate other actors about critical priorities. A future agenda for sustainable
development would most likely be one in which these organizations are often most
accountable for long-term goals that have long had little or no governmental
203
commitment, and which experienced organizations should be supported and consulted
for partnerships to manage solutions in these critical areas.
SE and Supporters of Sustainability Entrepreneurs
These findings also imply a recommendation for sustainability entrepreneurs
across the region and the organizations that support them. The SE network in Greater
New Orleans has many goals for making the region more sustainable, but these leaders
have a challenge to coordinate their efforts and ensure that they understand the impacts
of their organizations within a broad spectrum of the network. Given that this project
identified a fair level of silo-ing and lack of integration between actors dedicated to
certain community issues, especially in the non-profit area, there is a need for greater
community building between SE across its sectors and organization types. Also, given
the low level of relevance that some leaders identified in the broader community,
especially marginalized neighbourhoods, there is an impetus for sustainability
entrepreneurs to commit to greater cultural and socio-economic appropriateness and
ensure that their products and services are affordable and meet local needs.
Entrepreneurs within government have the challenge of building an agenda for
sustainability within their departments and across municipal and state agencies and to
push for strategic support of SE in whatever ways are possible.
Supporters of SE also can take lessons from this project. Although LifeCity is the
most noteworthy entity dedicated to supporting sustainability entrepreneurs, there are a
multitude of organizations, firms, and other mechanisms that are building momentum
behind the region’s new wave of SE. LifeCity’s key lessons from this project include the
barriers that members of the SE network identified to greater realization of their
sustainability goals and the perception that the company has in the community. The
company has a new opportunity to understand the limits that low community capacity,
affordability concerns and other barriers identified in Section 6 impose on their clients
and collect more information from entrepreneurs about how these barriers can be
overcome in collaborative efforts. The other challenge for LifeCity is for it to focus on the
gaps between its goals and its perception among its clients and the broader community,
which would involve a deeper investigation of ways that its mission is not being fulfilled
204
across goals such as supporting and marketing green businesses, and focusing efforts
on improving those services.
Other actors that support SE have an enormous role to play in fostering and
strengthening a sustainable movement of entrepreneurs in Greater New Orleans. These
organizations work in areas such as small business incubation, minority and women-
owned business services, affordable office-space collectives, and non-profit support
agencies. These organizations should be recognized for the extensive support they
already give to entrepreneurs, and the lessons learned about the impacts of SE and
LifeCity can help them take a role in ensuring greater positive community impacts of the
start-ups that they support. Specifically, these actors can consider ways to incentivize
social, ecological, cultural, and economic benefits from the entrepreneurs they support
and encourage these businesses to pursue B Corps status, green business certification,
and other ways of committing to community responsibility. A greater partnership
between local government and entrepreneurship support agencies could lead to shared
knowledge and delegating tasks to greatest capacity. In the evaluation of the community
impacts of the entrepreneurial activity sponsored by these agencies, an emphasis on
community-based evaluation would ensure strong assessments that do not rely solely on
external rating systems but also incorporate locally designed indicators of impact.
Business Community
The broader business community is currently very disconnected from the small
enclave of sustainability entrepreneurs and must be seen as a potential partner in setting
a regional sustainability agenda. Given that one of the major findings from Section 6 was
the low amount of impact that SE and LifeCity have had in the larger business
community to date, it is essential to understand what barriers prevent greater interest in
green business practices and community benefit among New Orleans area businesses.
There must be a greater effort for sustainable business leaders to demonstrate the
business case for adopting green practices and highlight feasible yet meaningful
operational changes to companies within their reach. However, the dissemination of
corporate sustainability can only go so far. The onus is truly on business owners across
the region to re-evaluate their firms and look for ways to improve their practices.
However, it must be acknowledged that many, if not most, businesses in New Orleans
205
and elsewhere are not altruistic and cannot be coerced to make meaningful
sustainability changes. Perhaps the most important recommendation for the broader
business community is the one made by Porter & Kramer (2006) to reconsider corporate
social responsibility as not a liability but as a new opportunity for strategic investment.
Businesses in the region must draw on their pre-existing skills and expertise in their
sectors to approach new overlaps between their corporate interests and community
priorities. Especially given the growing interest in New Orleans for an external image of
community-oriented business, as well as the long-held esteem for local family-owned
firms, there is already a cultural and marketing-based platform for exploring these
opportunities. Other advocates of sustainability must engage businesses as potential
allies and see their interests and tactics as strengths in finding mutually beneficial
solutions for business and the community.
Municipal Government
The findings of this project advance relevant implications mostly for local-level
policy actors and agencies. Having been emphasized heavily in the assessment of
sustainability entrepreneurs, municipal government has a pivotal role to play whose
importance cannot be overstated. The assessment from local sustainability leaders,
although at times quite critical, highlighted strengths that municipal agencies have
celebrated as well as opportunities for greater leadership. As mentioned in Section 6,
municipal government in Orleans Parish specifically has been a major leader in more
sustainable waste management, governmental greenhouse gas emissions reductions,
and New Orleans’ most participatory Master Plan to date. This leadership in local
sustainability should be recognized and lauded, as well as encouraged to continue in
other departments. At the same time, stakeholder comments also pointed to critical
areas of needed improvement in decision-making, ethics, transparency, and other
aspects of local governance. The leadership shown by municipal authorities in Orleans
as well as other parishes, although only a very small start to the policies that should be
implemented, should encourage the acknowledgment of government’s need to take a
new direction in key areas such as storm water management, public school governance,
ethics reform, criminal justice, and vacant lot management. Finally, supporting
sustainability entrepreneurs through strategies identified in Dagevos & Evers (2008),
such as creating incentives and training for responsible businesses and connecting them
206
to high-barriered job seekers for mutual benefit, should be a top municipal priority. Local
governments have begun to take considerable leadership in regional sustainable
development, and should be both supported and held accountable by residents and
senior governments to expand these forms of leadership and continue to regain public
legitimacy.
State and Federal Government
Higher levels of government are called upon to play a supportive and enabling
role to the municipal leadership that has been identified. The regional level of
government is not endowed under current Louisiana law with many powers outside of
planning and financing infrastructure projects using federal funding (LA Rev Stat §
38:33). However, the 10-parish Regional Planning Commission (RPC) already plays a
strong role in plan-making on economic development, transportation, and environmental
planning (RPC, 2013). Efforts should be made to create a stronger collaborative
relationship between the RPC and municipal-level planning commissions in creating and
implementing regional strategies for integrated sustainable development. At the state
level, regional sustainability can be greatly enabled by legislative acts which are able to
give force and legitimacy to local priorities. Several noteworthy legislative successes
have already shown Baton Rouge’s potential as a leader in sustainability, namely the
2012 Master Plan for statewide coastal restoration, the adoption of the nation’s largest
solar energy tax credit, and the recent passage of legislation to allow community-
oriented businesses to seek the new Social Benefit Corporation (B Corps) status,
making Louisiana the eighth state to adopt this status to recognize socially responsible
business (Benefit Corps Information Center, 2013).
At the federal level, a critical form of support for regional sustainability can be
offered by establishing a new relationship of mutual respect between federal and local
actors. Given multiple grievances surrounding the federal response to Hurricane Katrina
and the BP oil disaster, Washington has a new opportunity to heal some of these
wounds by ensuring adequate levee protection through the Army Corps of Engineers,
strengthening disaster relief through the Federal Emergency Management
Administration (FEMA), and continuing to provide recovery investments until local
agencies are more self-sufficient. Another federal opportunity to show support of
207
sustainability in New Orleans is to adopt strong climate change mitigation and adaptation
commitments, given the region’s high vulnerability to climate change. The recent
passage of the RESTORE Act, which will enable an ecosystem-based approach to
regional oil spill recovery by channelling BP fees into coastal restoration, is an enormous
victory for federal, state, and local governments that show how this new relationship can
begin to take shape.
8.2. Research Implications
Although the primary focus of this study is producing relevant findings for local
decision making, there are also a handful of lessons that are relevant for academic and
theoretical bodies of scholarship that are committed to understanding regional and
community sustainable development. Specifically, implications arise for the Community
Capital Framework, the Sustainability Entrepreneurship framework, and future research
in this subject area which relate to the limitations of this project.
8.2.1. Community Capital Framework
The application of the Community Capital Tool in Greater New Orleans
introduces several implications that arise from the use of the framework in a new
context. Overall, the Tool allowed for a rich and contextualized analysis in the region,
proving to be highly adaptable and accepted by most community members I
encountered. Many elements of the framework had high resonance for New Orleans
stakeholders, such as the emphasis on cultural heritage as a key community asset, the
importance of economic structure and diversification, and the need for trust and
community cohesion.
Applicability of the 6-Capital Model in New Orleans
Another strength of the Tool for use in Greater New Orleans was its use of six
forms of community capital, which allowed the nuances of the region’s strengths and
weaknesses to be portrayed and communicated to stakeholders more clearly. Although
the definition of the region’s sustainability would have been equally possible using three
capitals under the Telos Triangle, I found the expanded concept of sustainability in six
208
forms of community capital to be useful and relevant for New Orleans. Stakeholders
identified with the importance of cultural capital as an asset to the region, the challenges
of human capital in terms of the region’s education system, and spoke to its weaknesses
in physical capital and priorities for improving key systems and services. Granted, these
forms of capital are not as theoretically developed as natural, social, and economic
capital, and some forms of capital with only two stocks could presumably be further
developed. However, despite their need for further development in the Tool, they were
very appropriate for practical application in Greater New Orleans.
The Need for Equity Considerations
Despite its high level of versatility and applicability, the Tool could increase its
relevance in similar contexts with a few considerations. The first consideration is in the
area of equity. In cities and metropolitan regions facing similar socio-economic issues as
New Orleans, the applicability of the Tool could be enhanced by expanding on the
consideration of equity throughout its local application. As I asked local community
leaders what issues were most important to them, they repeatedly returned to the
region’s numerous social, economic, and cultural gaps and the need for greater equity.
This theme is explained in detail in Section 4, and its importance as an obstacle to many
of the Common Vision’s main priorities was almost ubiquitous. I also attempted to
represent the need for equity in many long-term requirements, as well as a handful of
indicators such as the GINI coefficient. However, I would challenge future applications of
the Tool to consider the implications of equity, or the lack thereof, in the communities
where it is applied. For communities facing similar social inequities, the Tool could
become more relevant by allowing for greater representation of the extremes that are not
represented by the aggregated data of the Balance Sheet. Although it is possible to use
neighbourhood-level data at times to represent the disparities in conditions and services
in a community, it would be very useful for other graphic or mapping-based tools such as
geographic information systems (GIS) to accompany analyses to show the gaps
between indicators across a region or community.
Considering the Governmental Context
The other implication for the Community Capital Framework concerns the
governmental context in which the Tool is employed. One of the key contributors to
209
sustainable development is strong leadership from government which, although all
different stakeholder groups must be involved in defining and implementing a local
sustainability vision, often play an indispensable role in either enabling or stifling
sustainable change. The findings in the analysis of Greater New Orleans’ regional
sustainability point to the need for future applications of the Tool to consider two specific
issues relating to government’s role in sustainable development: the level of public trust
of government and the governmental role in setting a sustainability agenda.
First, the great amount of mistrust in local government shown by many New
Orleans stakeholders highlights the need for future applications of the Tool to be
sensitive to the attitudes of community members to government institutions in the use of
the Tool itself. Researchers using the Balance Sheet in future projects should be aware
of how government is perceived in the community, both where high and low levels of
trust exist. This awareness can lead to a more contextualized selection of requirements
and indicators which reflects the strengths and weaknesses that the relationship
between government and the community creates. Especially in future applications in
developing countries, where often governments are constrained by neo-colonial
economic dependency and low accountability and transparency, it is essential to
sensitize the Tool to the institutional context of focus.
The second implication from this project is relevant for the setting of an agenda
for sustainable development in light of the Tool. Since the Balance Sheet is meant to be
the first step in formulating an agenda for different stakeholders to use to reach a
sustainable community, such as in the Common Vision, this process should anticipate
how government can play a role among other actors in fulfilling this agenda. In
establishing this agenda and anticipating how different actors will play a role in achieving
it, the role of government must be tempered with the community’s trust in government
and the capacity of other actors. Not all applications of the Tool can take for granted that
local municipal agencies will be a leader in helping organize different actors and ensure
that the vision for sustainable development is representative of the whole community.
Although many communities are blessed with high accountability and transparency at
the municipal level or in senior governments, those without these assets, such as
Greater New Orleans, must be approached in a way that recognizes the low level of trust
in government. In these contexts where government and community are divided by gaps
210
in trust and accountability, government must still be approached as a potential ally while
considering how other organizations and actors can fulfill parts of a sustainability vision if
government is not able or willing. The recommendations for different stakeholder groups
in this project has attempted to anticipate the potential voids left by municipal and state
governments, which non-profit and business actors are challenged to fulfil, but
government can still support or coordinate. In other contexts where the Tool is applied,
the vision that is established must be constructed in consideration of how government is
expected to contribute to it and to what extent their leadership can be counted on.
8.2.2. Implications for SE Framework
The findings of this study also have relevant lessons for the literature on
Sustainability Entrepreneurship. As a case study of a movement of SE, this project offers
several findings that expand the relevance and diversity of the concept of sustainability
entrepreneurs. The most significant implication for SE is the integrated definition of the
concept that has been put forward in light of the additional considerations of shared
value, CSR, value chains, and other important considerations. Without this broader
concept of SE, the framework relies on a vague definition of the term that is difficult to
operationalize. However, the characteristics that have been proposed are the first step
towards creating a more complete concept of what sustainability entrepreneurs are and
the roles they can ideally play in sustainable development. Additionally, the emphasis on
many entrepreneurs working in marginalized communities filled knowledge gaps that
had been identified concerning the areas where SE had struggled to spread and how
these entrepreneurs can become relevant to the needs and values of neighbourhoods
facing socio-economic barriers. Another related expansion of the literature on SE that
emerges from the case study in New Orleans is a broader concept of sustainability
entrepreneurs focused on more than for-profit actors. Although other SE literature
defined these entrepreneurs across different organizational models, they did not show
how leaders in non-profit, public sector, or hybrid roles could differ from businesses, a
gap that this study attempted to fill by focusing on entrepreneurs from multiple
organizational models and comparing and contrasting their intended and perceived
impacts. As discussed in Section 6, these novel findings include a more contoured
depiction of the motivations and activities of entrepreneurs in the non-profit sector, as
211
well as the tendency of these entrepreneurs to engage in non-market exchange to help
meet community needs outside of markets that currently do not do so. A related finding
that this project has revealed is the tendency for sustainability entrepreneurs to focus on
filling institutional voids left by government agencies without the capacity or agenda to
make progress in issues such as wetlands restoration or local food access. Another way
that these findings push the boundaries of SE is by expanding the scope of positive
impacts by using a more comprehensive definition of sustainability. The emphasis on
LifeCity offered a need for SE to consider the networking element of sustainable
business practices and the benefits of collaboration in building a community of
responsible business. LifeCity’s role in SE also showed that local government does not
always have to meet this need of supporting sustainable enterprise, and instead can
support and delegate the forms of support described in Dagevos & Evers (2008) to non-
governmental actors who may be better equipped to fulfill those roles.
8.3. Limitations
The implications of this study are admittedly hemmed in by a number of
important limitations that constrain its scope but leave a challenge for future efforts to
marshal further research efforts to fill these gaps. These limitations range from
methodological concerns to information gaps. The most considerable limitation is the
lack of a more community-based research process. From the beginning of the project, I
wished to engage a large cross-section of community members and root the vision for
regional sustainability in bottom-up community perspectives. However, multiple barriers
prevented this realization, most prominently the limits of time and financial resources, as
well as the decision to focus on entrepreneurs outright as the main stakeholder group of
interviews. Without the resources for a full process of community engagement, this
project was forced to select a strategic group of individuals to consult in order to
ascertain the intended impacts of SE. For a full, participatory process to assess how the
region’s communities perceive the role of these entrepreneurs, it is more appropriate for
locally-based organizations to design a long-term local research process than for a
single researcher to attempt this process with very limited resources. Nonetheless, in
hopes of an eventual research effort of this kind, this project aspires to provide such an
undertaking with an initial assessment based on the intended impacts of SE. This initial
212
evaluation of sustainability entrepreneurs is limited in scope but, ideally, can play a part
in ongoing future research to evaluate not only these leaders but a wide range of
sustainability initiatives in concert with the community.
Additionally, this project has a handful of limitations specific to the Balance Sheet
monitoring tool. The most serious limitation of the SRBS is its lack of participation, owing
to the fact that the Balance Sheet is intended to be designed and applied repeatedly by
community stakeholders and to the limits of my practical resources and the sample. One
of the most important reasons for the need of citizen participation in the Balance Sheet is
in the definition of norms, which cannot accurately represent the region’s expectations
and levels of acceptance for the indicators that are used here. Given this need for
participatory design, the lack of participation in the setting of norms in the SRBS is a
major limitation. Additionally, the indicators used expose a limited amount of
reproducibility, relying on many occasions on single studies or idiosyncratic phenomena
in New Orleans that are difficult or impossible to adapt to monitoring efforts in other
regions. Another limitation is that data often did not exist at the regional level
representing the populations of the seven parishes considered in this study, affecting the
accuracy of several indicators.
The final area of limitations is found in terms of the focus and scope of the
research. On one hand, the project’s focus on the regional level made its results very
general, without allowing for the representation of the many contrasts between
communities and socio-economic groups across Greater New Orleans. Especially given
the region’s high level of social and economic inequality, and the inclusion of both urban
and rural areas, the great differences between groups is a very important contour that
the SRBS cannot fully represent. In many indicators, I attempted to reflect the gaps
between levels of services, as well as social ills, between the region’s communities, but
the choice of the regional level inherently limited the ability to focus on these differences.
On the other hand, the project is constrained in its heavy focus on Orleans Parish, which
limits the applicability of many findings for suburban or rural communities. All but one
interviewee was based in Orleans Parish and many themes have limited applicability
outside of the city. A very important limitation in the assessment of sustainability
entrepreneurs is the use of qualitative data, which on one hand provides rich detail about
the goals of entrepreneurs but cannot provide an objective assessment of their true
213
community impacts. The cross-evaluation of SE in Section 6 attempted to show an initial
portrait of some of these impacts and barriers to achieving them, but they are only the
perspectives of stakeholders who have their own biases and not as reliable as
measurable data on the different value chain impacts of the organizations in question.
For a meaningful evaluation of the impacts of SE across the region, this kind of
quantitative, objective data is essential. Finally, my own researcher biases factored into
the study despite continuous efforts to remain objective, deriving from previous
involvement with non-profit organizations, origins in the area but long separation from
the region which limited my familiarity with many contemporary issues, and personal
values in social justice, equitable sustainability, and locally controlled development, of
which I tried to remain aware and put aside but, as with any research process, especially
qualitative research, can never be isolated entirely.
8.4. Suggestions for Future Research
These limitations offer many gaps that future research can fill. The primary area
where future study could augment these findings is in the area of the impacts of
sustainability entrepreneurs on New Orleans communities and other areas. As
mentioned in Section 6, the assessment done here is only an initial evaluation of these
organizations and its greatest potential impact is to inform a more in-depth community-
based research to widen the voices that articulate the perceived impacts of SE. Future
investigation of SE and its impacts, in New Orleans or other communities, should
expand on the findings generated in this project. The main implication for the SE
framework is for research to continue developing a concept of SE that is specific and
can be operationalized. This project has made an initial attempt at doing so with the
characteristics of SE, but future research should integrate these frameworks further and
test these traits against the real behaviours and goals of sustainability entrepreneurs in
different communities. Other findings can be expanded on, such as the differences
between private and non-profit sector leaders, the non-market exchanges of
entrepreneurs, and the tendency to fill institutional voids left by market and state agents.
Additionally, future research should take a deeper look at public sector sustainability
entrepreneurs, which this project was not able to adequately depict, and identify key
214
characteristics of municipal and state or provincial sustainability entrepreneurs and the
ways they interact with their communities and other parts of the SE network.
The second area where future research is in great need is in data that were used
for the Balance Sheet. As mentioned before, the lack of availability of data highlights a
need for research to focus explicitly on indicators for criteria such as food access,
economic leakage, and a long list of other parameters in the wider regional scope. There
were multiple indicators that are currently very data-poor and offer an agenda for new
research efforts to fill information gaps in the region. The most critical of these are
information on urban agriculture and its potential in the region; toxicology studies for air,
water, and soil quality that currently focus only within Orleans Parish but should extend
across the region; studies on neighbourhood access to services such as grocery stores
and financial providers, which currently only cover Orleans Parish; accurate data on
recycling and the waste stream; better land use data on regional density and sprawl; and
local efforts to identify appropriate indicators for more intangible cultural priorities such
as sense of place and identity.
In terms of the Community Capital Tool in general, this project highlights several
ways that its application in the future can learn and adapt. A tremendously helpful
resource in the New Orleans Model was the use of multiple planning and policy
documents in brainstorming preliminary requirements, as described in Section 4. These
documents also represent not only the governmental perspective shown in official
community plans, but visions from different actors in the community, which can be used
in future applications of the Tool to diversify the agenda for sustainability in a given
community. A very important adaptation for future iterations of the Balance Sheet to
make in New Orleans and other regions is to respond to the need to represent the socio-
economic and geographic disparities of communities where the Tool is applied. In future
research and monitoring, it would be optimal to consider creative ways to represent the
disparities in various indicators and stocks of community capital, in which the extremes
that occur in opposing ends of socio-economic, racial, and cultural groups are
highlighted through the use of more small-scale data, mapping technologies such as
Geographic Information Systems (GIS), the creation of neighbourhood-level resources
for practical use, and other tools. These and other creative approaches could yield
versatile ways to show the distribution of data for different indicators across a community
215
and facilitate the identification of target areas suffering from multiple issues. Another
future opportunity lies in tracking progress toward sustainability over time in Greater New
Orleans and other communities. Since this project only measured regional sustainability
in a single snapshot using the most recent data available for 2013, it would be beneficial
for future applications of the Balance Sheet to show how the region has changed since
2005, for example, or since after Hurricane Katrina. Other communities should also
approach the use of the Balance Sheet with time considerations, selecting appropriate
time intervals for their contexts to fulfill the monitoring function of the tool and show the
progress of communities over time. Additionally, it would be beneficial to future iterations
of the Balance Sheet in North America to have a common set of indicators and norms for
various indicators prepared which offers data for commonly used indicators and ranks
them in terms of North American cities and regions that constitute norms for these
indicators.
Another research need that is identified has a geographic element, highlighting
the need for greater understanding of the rural parishes of Greater New Orleans and
their community development issues. Although located only miles from the urban centre,
many rural communities face radically different challenges that this study did not
consider and should be researched in partnership with community actors. Finally, the
study’s findings also point to potential benefits of adapting certain elements of the
research design for applications in other regions. Specifically, communities facing similar
socio-economic and ecological issues, such as vulnerability to climate-change-induced
disaster, postcolonial legacies, and economic diversification, or Southern U.S. or
Caribbean metropolitan areas, could apply similar methods to assess regional
sustainability in their communities.
8.5. Conclusion
Much still remains to be understood about the fate of the New Orleans region
and the communities that call it home. Having captured global attention for the social
and ecological scars that floodwaters so ruthlessly exposed on August 29th, 2005, the
region is now left where it has, in many ways, always been: on its own. At the juncture of
deciding its destiny in a way that has never been possible before, the residents of “the
216
city that care forgot” now face an even greater challenge than the recovery from
successive social and environmental disasters. That challenge is the searing honesty
and self-evaluation of legitimately asking what the region’s future should be, asking all
residents in their diverse and divided communities to have a voice in answering that
question, and deciding what to do next. This effort has hopefully lent a small modicum of
understanding to this critical question, and it is hoped that residents and those in their
service can learn something of benefit, as well as decision makers and researchers in
regions facing similar challenges. However, understanding only goes so far in a debate
as contentious and protracted as the discourse over what New Orleans should be and
how it can become more congruent with the conceptual mirror to which it is held. In New
Orleans’ continual efforts for renewal, recovery, and, ultimately, the redefinition of one of
the world’s most unique urban gems, perhaps it is vision and imagination that are the
most powerful tools at hand in the construction of a more ecologically sound,
economically strong, and socially just region.
217
References
Written Report References
504 Health Net. (2013). Our key wins. Retrieved from http://www.504healthnet.org
Allen, C. & Malin, S. (2008). Green entrepreneurship: a method for managing natural resources? Society & Natural Resources, 21(9), 828-844.
Alliance for Biking and Walking. (2012). Cities: mode share. Retrieved from http://www.peoplepoweredmovement.org/site/index.php/site/memberservices/2012_benchmarking_report/#2012Report
Anonymous. (2012, September 25). “Hurricane Katrina.” The New York Times. Retrieved from http://topics.nytimes.com/top/reference/timestopics/subjects/h/hurricane_katrina/index.html
Ardani, K. B., Reith, C. C., & Donlan, C. J. (2009). Harnessing catastrophe to promote resource recovery and eco-industrial development. Journal of Industrial Ecology, 13(4), 579-591).
Austin, J., Stevenson, H., & Wei-Skillern, J. (2006). Social and commercial entrepreneurship: same, different, or both? Entrepreneurship Theory and Practice, 30(1), 1-22.
Bayou Rebirth. (2013). History. Retrieved from http://www.bayourebirth.org/about-us/history/
Bell, S. & Morse, S. (2008). Sustainability indicators: measuring the immeasurable? (second edition). Earthscan.
Benefit Corps Information Center. (2013) State by state legislative status. Retrieved from http://www.benefitcorp.net/state-by-state-legislative-status
Blankenship, H., Kulhavy, V., & Lagneryd, J. (2009). Introducing strategic sustainable development in a business incubator. Progress in Industrial Ecology, 6(3), 1-99.
Brinson, D., Boast, L., Hassel, B. C., & Kingsland, N. (2011). New Orleans-style education reform: A guide for cities: Lessons learned, 2004–2010. New Schools for New Orleans. Retrieved from www.newschoolsforneworleans.org/guide
Bryant, B. (2011). Deepwater Horizon and the Gulf oil spill—the key questions answered. Retrieved from http://www.guardian.co.uk/environment/2011/apr/20/deepwater-horizon-key-questions-answered
218
Bryner, J. (2012, March 7). The list: the most obese cities. Live Science. Retrieved from http://www.livescience.com/18886-obese-cities-list-2011.html
Campbell, L. M. & Vainio-Mattila, A. (2003). Participatory development and community-based conservation: opportunities missed or lessons learned? Human Ecology, 31(3), 417-437.
Canadian Community Economic Development Network, Manitoba Division. (2009). Creating a robust social enterprise sector in Winnipeg. Retrieved from http://ccednet-rcdec.ca/en/manitoba
Cardoso, F. & Faletto, E. (1979). Dependency and Development in Latin America. Siglo XXI Publishing.
Chamlee-Wright, E. & Storr, V. (2009). “There’s no place like New Orleans”: sense of place and community recovery in the Ninth Ward after Hurricane Katrina. Journal of Urban Affairs, 31(5), 615-634.
Chandler, M. J., & Lalonde, C. E. (2009). Cultural continuity as a moderator of suicide risk among Canada’s First Nations. In Healing traditions: the mental health of Aboriginal peoples of Canada. (Eds. L. J. Kirmayer & G. G. Valaskakis). Vancouver: University of British Columbia Press.
City Data. (2013). Population density (people per square mile). Retrieved from www.city-data.com
City of New Orleans (2009). City of New Orleans Carbon Footprint Report. [New Orleans]: Moore, J. and Stone, L.
City of New Orleans, City Planning Commission (2010). New Orleans 2030: Plan for the 21st century. [New Orleans]: Goody Clancy Architecture.
City of New Orleans, City Planning Commission. (2013). Applications. Retrieved from http://new.nola.gov/city-planning/applications/
City of New Orleans, City Planning Commission. (2013). Draft comprehensive zoning ordinance (CZO). Retrieved from http://new.nola.gov/city-planning/comprehensive-zoning-ordinance/
City of New Orleans, New Orleans Police Department. (2012). 2012 enhancements of NOPD crime-fighting strategy. [PowerPoint slides]. Serpas, R. Retrieved from www.nola.gov
City of New Orleans, Sewerage and Water Board. (2007). Quality water 2007: a report on the state of tap water in New Orleans. [New Orleans].
City of New Orleans. (2008). GreeNola: a strategy for a sustainable New Orleans. [New Orleans]: Nance, E., Fisher, W., Schwartz, J., and Quinn, D.
City of North Vancouver. (2008). Economic Development Strategy 2008. [North Vancouver, B.C.]. Retrieved from www.cnv.org
City of North Vancouver. (2013). The Community Capital Tool in the City of North Vancouver. Unpublished manuscript.
Coleman, J. S. (1988). Social capital in the creation of human capital. American Journal of Sociology, 94(supplement), S95-S120.
219
Community Capital Scan. (2012). CC Scan: mapping sustainability. Retrieved from http://ccscan.elicit.nl/
Congressional Research Service. (2010). The Deepwater Horizon oil spill: coastal wetland and wildlife impacts and response. [Washington, D.C.]: Corn, M. L., and Copeland, C.
Cornell, S., Curtis, C., & Jorgenson, M. (2004). The concept of governance and its implications for First Nations (Working Paper no. 2004-02). Udall Center of Studies in Public Policy. Retrieved from http://www.ksg.harvard.edu/hpaied
Costanza, R. (1991). Ecological economics: the science and management of sustainability. Columbia University Press.
Costanza, R., Mitsch, W. J., and Day, J. W., Jr. (2006). A new vision for New Orleans and the Mississippi delta: applying ecological economics and ecological engineering. Ecology & Environment, 4(9), 465–472.
Daddi, T., Testa, F., & Iraldo, F. (2010). A cluster-based approach as an effective way to implement the environmental compliance assistance programme: Evidence from some good practices. Local Environment, 15(1), 73-82.
Dagevos, J. (2011). Monitoring and assessing sustainable development at the regional level: the Telos method. [PowerPoint slides].
Dagevos, J., & Evers, G. (2008). Towards a sustainable, enterprising Tilburg. Telos Brabant Centre for Sustainable Development.
Database of State Incentives for Renewables and Efficiency. (2013). Renewable energy tax incentives. Retrieved from http://www.dsireusa.org/incentives/incentive.cfm?Incentive_Code=US37F&re=1&ee=0
Dees, J. G. (1998). The meaning of “social entrepreneurship”. Unpublished manuscript.
Diefendorf, J. M. (2009). Reconstructing devastated cities: Europe after World War II and New Orleans after Katrina. Journal of Urban Design, 14(3), 377-397.
Dixon T., Amelung F., & Ferretti A. (2006). Subsidence and flooding in New Orleans. Nature, 441, 587–588.
Dutch Social and Economic Council. (2000). De winst van warden. Den Haag: SDU.
Dyllick, T., & Hockerts, K. (2002). Beyond the business case for corporate sustainability.” Business Strategy and the Environment, 11(2), 130-141.
Entergy, Energy Smart Program. (2012). Year 1 annual report. Retrieved from www.entergy.com
Entergy. (2011). Measuring our progress: economic, environmental, and social performance. Retrieved from http://www.entergy.com/
Fearne, A., Martinez, M. G., & Dent, B. (2012). Dimensions of sustainable value chains: implications for value chain analysis. Supply Chain Management, 17(6), 575-581.
220
Foster, K. R. & Giegengack, R. (2006). Planning for a city on the brink. In R. J. Daniels, D. F. Kettl & H. Kunreuther (Eds.), On risk and disaster: lessons from Hurricane Katrina (pp. 41-58). Philadelphia: University of Pennsylvania Press.
Fraser, E. D. G., Dougill, A. J., Mabee, W. E., Reed, M., & McAlpine, P. (2006). Bottom up and top down: Analysis of participatory processes for sustainability indicator identification as a pathway to community empowerment and sustainable environmental management. Journal of Environmental Management, 78(2), 114-127.
Freire, P. (1970). Pedagogy of the oppressed. Seabury Press.
Glaser, B. & Strauss, A. (1967). The Discovery of Grounded Theory. New York: Aldine.
GNOInc. (2011). Greater New Orleans at the Inflection Point. Retrieved from http://gnoinc.org/wp-content/uploads/Greater_New_Orleans_at_the_Inflection_Point_2010_12_06.pdf
GNOInc. (2013). About us. Retrieved from http://gnoinc.org/about-us/
GNOInc. (2013). Overview. Retrieved from http://gnoinc.org/explore-the-region/
Goodland, R. (2002). Sustainability: human, social, economic, and environmental. In Encyclopedia of global environmental change. John Wiley & Sons Ltd.
Gotham, K. F. & Campanella, R. (2011). Coupled vulnerability and resilience: the dynamics of cross-scale interactions in post-Katrina New Orleans. Ecology and Society, 16(3), 12.
Gray, S. (2009). “Luring Buyers on Detroit’s ‘Lonely Homes’ Tour.” Time Magazine. Retrieved from http://www.time.com/time/nation/article/0,8599,1930006,00.html
Green, R., Bates, L. K., & Smyth, A. (2007). Impediments to recovery in New Orleans' Upper and Lower Ninth Ward: one year after Hurricane Katrina. Disasters, 31(4), 311-335.
Grossi, P. & Muir-Wood, R. (2006). Flood risk in New Orleans: implications for future management and insurability. Retrieved from Risk Management Solutions website: www.rms.com
Gunton, T. I. & Day, J.C. (2003). Theory and practice of collaborative planning in resource and environmental management. Environments, 31(2), 5-21.
Hancock, T. (2001). People, partnerships, and human progress: building community capital. Health Promotion International, 16(3), 275-280.
Hart, M. (1999). Guide to sustainable community indicators (second edition). Hart Environmental Data.
Hendrickson, D.J., Lindberg, C., Connelly, S., & Roseland, M. (2011). Pushing the envelope: market mechanisms for sustainable community development. Journal of Urbanism: International Research on Placemaking and Urban Sustainability, 4(2), 153-173.
Hermans, F., Haarmann, W., & Dagevos, J. (2011). Evaluation of stakeholder participation in monitoring regional sustainable development. Regional Environmental Change, 11, 805-815.
221
Hickey, S. & Mohan, G. (2005). Relocating participation within a radical politics of development. Development and Change, 36(2), 237-262.
Hockerts, K. (2003) Sustainability innovations, ecological and social entrepreneurship and the management of antagonistic assets. Bamberg, Germany: Difo-Druck.
Hodgson, F. (2011, April 1). New strategy to fight adult illiteracy in New Orleans. The Pelican Post. Retrieved from http://www.thepelicanpost.org/2011/04/01/new-strategy-to-fight-adult-illiteracy-in-new-orleans/
Hofer, J., Busch, H., Chasiotis, A., & Kiessling, F. (2006). Motive congruence and interpersonal identity status. Journal of Personality 74(2), 511-542.
Holt, J. (2009). A summary of the primary causes of the housing bubble and the resulting credit crisis: a non-technical paper. The Journal of Business Inquiry, 8(1), 120-129.
HSH. (2013). Louisiana mortgage rates and refinance rates. Retrieved from http://www.hsh.com/ls-la.html
Iacona, G. (2010). Going green to make green: necessary changes to promote and implement corporate social responsibility while increasing the bottom line. Unpublished manuscript.
Idea Village. (2013). The Idea Village: for entrepreneurs and those who believe in them. Retrieved from http://ideavillage.org/
Internet World Stats: Usage and population statistics. (2012). Louisiana. Retrieved from http://www.internetworldstats.com/unitedstates.htm
Jack, S.L., & Anderson, A.R. (2002). The effects of embeddedness on the entrepreneurial process. Journal of Business Venturing, 17, 467-487.
Jacobs, L. (2011, April 3). New Orleans dropout rate plummets 31%. Educate Now. Retrieved from http://educatenow.net/2011/04/03/new-orleans-dropout-rate-plummets-31/
Jansson, A.M., Hammer, M., Folke, C., & Costanza, R. (Eds.). (1994). Investing in natural capital: the ecological economics approach to sustainability. Washington, D.C.: Island Press.
Jones, V. (2008). The green collar economy: how one solution can fix our two biggest problems. New York: Harper Collins.
Kirzner, I.M. (1985). Discovery and the capital process. Chicago: University of Chicago Press.
Kiva. (2013). Kiva New Orleans. Retrieved from http://www.kiva.org/partners/200
Knight, F.H. (1921). Risk, uncertainty and profit. New York: Houghton Mifflin.
Lamb, L. (2011). Voluntary participation in Community Economic Development in Canada: an empirical analysis. Canadian Journal of Nonprofit and Social Economy Research 2(1), 75-96.
222
Lemmens, L., Ten Caten, H, & Tabibian N. (2001) The sustainable development Balance Sheet of Noord-Brabant 2001. Telos Brabant Centre for Sustainable Development.
Leonard, T. (2008). “Subprime crisis makes Cleveland a ghost town.” The Telegraph. Retrieved from http://www.telegraph.co.uk/news/worldnews/1576851/Subprime-crisis-makes-Cleveland-a-ghost-town.html
LifeCity (2013). LifeCity: helping individuals and businesses reach their sustainability potential. Retrieved from www.mylifecity.com
Lizano, R. (2006). Recursos biogeneticos y logicas mercantiles: la experiencia costariccense. Revista de Ciencias Sociales, 1-11(111-112): 13-22.
Louisiana Department of Culture, Recreation, and Tourism. (2013). Historic building recovery grant program. Retrieved from http://www.crt.state.la.us/hp/grants/historic_building_recovery_grant_program.aspx
Louisiana Department of Natural Resources. (2009). Cheniers and natural ridges study. Providence Engineering and Environmental Group. Retrieved from http://dnr.louisiana.gov/assets/docs/coastal/227-009-001NG-Chenier-Rpt-DNR.pdf
Louisiana Department of Wildlife and Fisheries. (2005). Louisiana comprehensive wildlife conservation strategy. [Baton Rouge]. Retrieved from http://www.wlf.louisiana.gov/
Louisiana Office of Juvenile Justice. (2012). Louisiana quarterly juvenile justice indicators: an up-to date view of juvenile custody and supervision populations. Retrieved from http://ojj.la.gov/
Lowry, J. A. (2012). Community capital pilot project in the District of Sechelt. (Master’s project). Available from ProQuest Dissertations and Theses database.
MacKendrick, N.A. & Parkins, J.R. (2004). Frameworks for assessing community sustainability: a synthesis of current research in British Columbia. (Information report NOR-X-392). Natural Resources Canada, Canadian Forest Service, Northern Forestry Centre.
Mardi Gras New Orleans. (2013). Krewe of Bacchus. Retrieved from http://www.mardigrasneworleans.com/schedule/parade-info/parades-bacchus.html
Martinez-Alier, J. (1992). From ecological economics to popular environmentalism. Icaria Editorial.
Martinez-Alier, J. (2004). Ecological distribution conflicts and indicators of sustainability. International Journal of Political Economy, 34(1), 13-30.
McGraw, D. (2012, January 18). Top 20 cities by per-capita GDP. Fuel Fix. Retrieved from http://fuelfix.com/blog/2012/01/18/top-20-cities-by-per-capita-gdp/#2555-1
McInturff, B., Harrington, E., Greenberg, A., & Walker, D. (2008). Perceived health challenges in the United States: national survey results. Public Opinion Strategies.
223
Meyer, S. M., & Konisky, D. M. (2007). Adopting local environmental institutions: environmental need and economic constraints. Political Research Quarterly, 60(1), 3-16.
Morgan, A. (2009). Learning communities, cities and regions for sustainable development and global citizenship. Local Environment, 14(5), 443-459.
Morran, C. (2010). The top 10 foreclosure hotspots in the U.S. Retrieved from the Consumerist website: http://consumerist.com/2011/02/02/the-top-10-foreclosure-hotspots-of-2010/
Natcher, D. C., & Hickey, C. G. (2002). Putting the community back into community-based resource management: A criteria and indicators approach to sustainability. Human Organization, 61(4), 350-363.
National Oceanic and Atmospheric Administration. (2007). Hurricane Katrina-most destructive hurricane ever to strike the U.S. Retrieved from http://www.katrina.noaa.gov/
National Round Table on the Environment and the Economy. (2003). Environment and sustainable development indicators for Canada. Ottowa: NRTEE.
New America Foundation. (2013). Louisiana. Retrieved from http://febp.newamerica.net/k12/LA
Nozick, M. (1992). No place like home: building sustainable communities. Ottawa: Canadian Council on Social Development.
O’Neill, G., Hershauer, J., & Jay, S. (2006). The cultural context of sustainability entrepreneurship. Greener Management International, 55, 33-48.
Organisation for European Cooperation and Development. (2001). The wellbeing of nations: the role of human and social capital organization for cooperation and development. OECD.
Ortiz, E. & Plyer, A. (2013). Economic synergies across Southeast Louisiana. Retrieved from GNOCDC website: www.gnocdc.org
Ortiz, E. & Plyer, A. (2012). Who lives in New Orleans and the metro area now? Retrieved from Greater New Orleans Community Data Center website: http://www.gnocdc.org
Ortiz, E. & Plyer, A. (2012). Who lives in New Orleans and the metro area now? Retrieved from Greater New Orleans Community Data Center website: http://www.gnocdc.org
Ostrom, E. (1993). Social capital and development projects. Prepared for Social capital and economic development, Cambridge, MA: American Academy of Arts and Sciences.
Oxfam America. (2008). Building common ground: how shared attitudes and concerns can create alliances between African-Americans and Latinos in a post-Katrina New Orleans. Retrieved from www.oxfamamerica.org
Parkins, J. R., Varghese, J., & Stedman, R. C. (2004). Identifying indicators of community sustainability in the Robson Valley, British Columbia. BC Journal of Ecosystem Management, 4(2), 1-19.
224
Pearce, D.W. & Barbier, E. (2000). Blueprint for a sustainable economy. London: Earthscan.
Perren, L., & Jennings, P.L. (2005). Government discourse on entrepreneurship: issues of legitimization, subjugation and power. Entrepreneurship Theory and Practice, 29(2), 173-184.
Plyer, A. & Ortiz, E. (2010). Benchmarks for blight: how many blighted properties does New Orleans really have and how can we eliminate 10,000 more? Retrieved from Greater New Orleans Community Data Center website: http://www.gnocdc.org
Plyer, A. & Ortiz, E. (2011). New Orleans Index at Six: measuring Greater New Orleans’ progress towards prosperity. Retrieved from Greater New Orleans Community Data Center website: http://www.gnocdc.org
Plyer, A. & Ortiz, E. (2011). Regional “export” industries: drivers of the New Orleans economy. Retrieved from Greater New Orleans Community Data Center website: http://www.gnocdc.org
Plyer, A. Ortiz, E., & Pettit, K.. (2010). Post-Katrina commuter patterns. Retrieved from Greater New Orleans Community Data Center website: http://www.gnocdc.org
Plyer, A., & Campanella, R. (2010). Coastal employment before the 2010 Deepwater Horizon oil disaster. Retrieved from Greater New Orleans Community Data Center website: http://www.gnocdc.org
Plyer, A., & Campanella, R. (2010). Job sprawl in Metro New Orleans. Retrieved from Greater New Orleans Community Data Center website: http://www.gnocdc.org
Plyer, A., Ortiz, E., & Horwitz, B. (2011). Housing development and abandonment in New Orleans since 1960. Retrieved from Greater New Orleans Community Data Center website: http://www.gnocdc.org
Plyer, A., Ortiz, E., & Pettit, K. (2009). Post-Katrina housing affordability challenges continue in 2008, worsening among Orleans Parish very low income renters. Retrieved from Greater New Orleans Community Data Center website: http://www.gnocdc.org
Police Executive Research Forum. (2001). An examination of homicide clearance rates: foundation for the development of a homicide clearance model. Richardson, D. & Kosa, R. Retrieved from http://www.policeforum.org/
Porter, M. (1985). Competitive advantage: creating and sustaining superior performance. New York: Free Press.
Porter, M. & Kramer, M . (2011). How to reinvent capitalism—and unleash a wave of innovation and growth.” Harvard Business Review, 1-17.
Porter, M. & Kramer, M. (2006). Strategy and society: the link between competitive advantage and corporate social responsibility. Harvard Business Review, 78-93.
Postlethwaite & Netterville Accounting. (2011). City of New Orleans, Louisiana: basic financial statements. Retrieved from www.nola.gov/BUSINESSES/.../CAFR%202011.ashx
225
Propellor. (2013). Propellor: a force for social innovation. Retrieved from http://gopropeller.org/
Putnam, R., Leonardi, R., & Nanetti, R. (1993). Making democracy work: civic traditions in modern Italy. Princeton University Press.
Rabito, F.A., Iqbal, S., Perry, S., Arroyave, W., & Rice, J. (2012). Environmental lead after Hurricane Katrina: Implications for future populations. Environmental Health Perspectives, 120(2), 180-184.
Rainey, D. V., Robinson, K. L., Allen, I., & Christy, R. D. (2003). Essential forms of capital for sustainable community development. American Journal of Agricultural Economics 85(3), 708-715.
Reed, M., Fraser, E., & Dougill, A. (2006). An adaptive learning process for developing and applying sustainability indicators with local communities. Ecological Economics, 59(4), 406-418.
Regional Planning Commission, Alternatives of Membership and Appointment, Tenure, Louisiana Revised Statutes § 38:33. Retrieved from http://www.legis.state.la.us/lss/lss.asp?doc=89032
Regional Planning Commission. (2013). Regional Planning Commission: Regional Transportation, Economic Development, and Environmental Planning. Retrieved from www.norpc.org
RESTORE. (2013). The RESTORE Act. Retrieved from http://www.mississippiriverdelta.org/restore-the-delta/public-policy/clean-water-act-penalties/restore-act/
Roper, W.E., Weiss, K. J., & Wheeler, J. F. (2006). Water quality assessment and monitoring in New Orleans following Hurricane Katrina. George Mason University.
Roseland, M. (2000). Sustainable community development: Integrating environmental, economic, and social objectives. Progress in Planning, 54(2), 73-132.
Roseland, M. (2012). Toward sustainable communities: solutions for citizens and their governments (fourth edition). Gabriola Island, B.C.: New Society Publishers.
Ross, B. (2012, May 6). “Louisiana is 3rd in the nation in private school enrollment.” The Times Picayune. Retrieved from http://www.nola.com/education/index.ssf/2012/05/louisiana_is_3rd_in_nation_in.html
Rotkin-Ellman, M., Somolon, G., Gonzales, C., Agwaramgbo, L., & Mielke, H. W. (2010). Arsenic contamination in New Orleans soil: temporal changes associated with flooding. Environmental Research, 1(10), 19-25.
Schaper, M. (2002). The essence of ecopreneurship. Greener Management International, 38, 26-30.
Schumpeter, J. (1954). Capitalism, socialism and democracy (fourth edition). London: Allen & Unwin.
226
Sellers, S., Perry, A., Sams-Abiodun, P., Plyer, A. & Ortiz, E. (2012). Building an inclusive, high-skilled workforce for New Orleans’ next economy. Retrieved from Greater New Orleans Community Data Center website: http://www.gnocdc.org
Simpson, D., Nowlan, J., Gradel, T. J., Zmuda, M. M., Sterrett, D., & Cantor, D. (2012). Chicago and Illinois, leading the pack in corruption (Anti-corruption report no. 5). University of Illinois at Chicago, Department of Political Science.
Smart Growth America. (2012). The sprawl index: New Orleans, LA. Retrieved from www.smartgrowthamerica.org
Smit, A. (2011, June 6). Wettest cities in America. Third Age. Retrieved from http://www.thirdage.com/news/wettest-cities-in-america_06-06-2011
Social Compact. (2010). City of New Orleans: Neighbourhood market drilldown-catalyzing business investment in inner-city neighbourhoods. Retrieved from http://www.socialcompact.org/
Spradley, J.P. (1979). The ethnographic interview. New York: Holt, Rinehart and Winston.
State of Louisiana. (2012). Louisiana’s comprehensive master plan for a sustainable coast: committed to our coast. [Baton Rouge, LA].
Stavins, R.N. (2001). “Lessons from the American experiment with market based environmental policies”. Retrieved from Resources for the Future website: http://www.rff.org/documents/RFF-DP-01-53.pdf
Swanton, J. R. (1953). The Indian Tribes of North America. Bureau of American Ethnology (Bulletin 145), US Government Printing Office. [Washington, D.C.].
Teaching Responsible Earth Education. (2013). About T.R.E.E. Retrieved from http://treetalk.org/
Tennessee Williams/New Orleans Literary Festival. (2013). Tennessee Williams/New Orleans Literary Festival. Retrieved from http://www.tennesseewilliams.net/
Tilley, F, and Young, W. (2009). Sustainability entrepreneurs: could they be the true wealth generators of the future? Greener Management International, 55, 79-92.
Tomalty, R. (2002). Growth management in the Vancouver region. Local Environment, 7(4), 431-445.
Tulane University, Cowen Institute for Public Education Initiatives. (2012). The state of public education in New Orleans: 2012 report. Retrieved from http://education.tulane.edu
United Health Foundation. (2011). America’s health rankings: Louisiana. Retrieved from http://www.americashealthrankings.org
United States Bankruptcy Court, Eastern District of Louisiana. (2013). Filing information. Retrieved from http://www.laeb.uscourts.gov/FilingInfo/FilingInfo.htm
United States Bureau of Labor Statistics. (2013). Census of fatal occupational injuries. Retrieved from http://www.bls.gov/news.release/cfoi.nr0.htm
227
United States Bureau of Labor Statistics. (2013). Civilian labor force and unemployment by state and metropolitan area. Retrieved from http://www.bls.gov/news.release/metro.t01.htm
United States Bureau of Labor Statistics. (2013). Economic news release. Retrieved from http://www.bls.gov/news.release/empsit.t18.htm
United States Bureau of Labor Statistics. (2013). Economy at a glance: New Orleans-Metairie-Kenner. Retrieved from http://www.bls.gov/eag/eag.la_neworleans_msa.htm
United States Bureau of Labor Statistics. (2013). Occupational employment statistics. Retrieved from http://www.bls.gov/oes/current/oes_ms.htm#00-0000
United States Census Bureau. (2011). U.S. neighbourhood income inequality in the 2005-2009 period. Weinberg, D. Retrieved from http://www.census.gov/prod/2011pubs/acs-16.pdf
United States Energy Information Administration. (2013). Louisiana field production of crude oil. Retrieved from http://www.eia.gov/dnav/pet/hist/LeafHandler.ashx?n=PET&s=MCRFPLA1&f=A
United States Environmental Protection Agency, Ground Water Center, Source Water Protection Branch. (2009). State of the groundwater report. [Dallas, TX]: Lister, C., Chesney, C., Revisto, A.
United States Environmental Protection Agency. (2009). Air Quality Index: a guide to air quality and your health. Retrieved from www.epa.gov
United States Environmental Protection Agency. (2010). Number of days with Air Quality Index values greater than 100 at trends sites, 2000-2010, and all sites in 2010. Retrieved from www.epa.gov
United States Federal Bureau of Investigation. (2010). Hate crime incidents per bias motivation and quarter by state and agency. [Washington, D.C.]. Retrieved from www.fbi.gov
United States Green Building Council. (2013). Directory. Retrieved from http://new.usgbc.org/projects
Urban Institute. (2012). A profile of nonprofit organizations in the Greater New Orleans metropolitan area. De Vita, C. J., Blackwood, A. S., and Roeger, K. L. Retrieved from http://www.urban.org/
Voogd, H. (1983). Multi-criteria evaluation for urban and regional planning. London: Pion.
Wackernagel, M. & Rees, B. (1996). Our ecological footprint: reducing human impact on the earth. Gabriola Island, B.C.: New Society Publishers.
Waggoner & Ball Architects. (2013). Living with water: sustainable urban water planning in New Orleans. Retrieved from http://livingwithwater.com/
Whitmore, E. (1998). Understanding and practicing participatory evaluation. San Francisco: Jossey-Bass Publishers.
Wilson Perkins Allen Opinion Research. (2012). NOCC citizen satisfaction survey. Retrieved from www.wparesearch.com
228
Witt, H. (2009, March 27). Most corrupt state: Louisiana ranked higher than Illinois. Chicago Tribune. Retrieved from http://www.chicagotribune.com/
Zip Atlas. (2013). Average commute time in Louisiana by city. Retrieved from http://zipatlas.com/us/la/city-comparison/average-commute-time.3.htm
Balance Sheet References
504 Health Net. (2013). Our key wins. Retrieved from http://www.504healthnet.org
Alliance for Affordable Energy. (2013). The Alliance for Affordable Energy. Retrieved from http://all4energy.org/
Alliance for Biking and Walking. (2012). Cities: mode share. Retrieved from http://www.peoplepoweredmovement.org/site/index.php/site/memberservices/2012_benchmarking_report/#2012Report
Andrews, S. (2012). Back to their roots: problems and solutions for urban farmers in New Orleans. Tulane University, School of Latin American Studies.
Anonymous. (2013). Canada’s greying workforce. Canadian Broadcasting Corporation. Retrieved from http://www.cbc.ca/news/interactives/map-canada-employment/
Barnes, S. & Schmidt, C. (2010). The greening of Louisiana’s economy [PowerPoint slides].
Bayou Rebirth. (2013). History. Retrieved from http://www.bayourebirth.org/about-us/history/
Bodor, J. N., Rice, J. C., Farley, T. A., Swalm, C. M., & Rose, D. (2010). The association between obesity and urban food environments. Journal of Urban Health, 87(5), 771-781.
Boston Redevelopment Authority, Research Division. (2005). Boston's creative economy. Retrieved from http://www.bostonredevelopmentauthority.org/pdf/ResearchPublications/CreateBoston.pdf
Brinson, D., Boast, L., Hassel, B. C., & Kingsland, N. (2011). New Orleans-style education reform: A guide for cities: Lessons learned, 2004–2010. New Schools for New Orleans. Retrieved from www.newschoolsforneworleans.org/guide
Bryant, B. (2011, April 20). Deepwater Horizon and the Gulf oil spill—the key questions answered. The Guardian. Retrieved from http://www.guardian.co.uk/environment/2011/apr/20/deepwater-horizon-key-questions-answered
Bryner, J. (2012, March 7). The list: the most obese cities. Live Science. Retrieved from http://www.livescience.com/18886-obese-cities-list-2011.html
Chamlee-Wright, E. & Storr, V. (2009). “There’s no place like New Orleans”: sense of place and community recovery in the Ninth Ward after hurricane Katrina. Journal of Urban Affairs, 31(5), 615-634.
229
City Data. (2013). Buncombe County, North Carolina. Retrieved from http://www.city-data.com/
City Data. (2013). Population density (people per square mile). Retrieved from www.city-data.com
City of Covington. (2013). Garbage and recycling. Retrieved from http://covla.com/
City of Mandeville. (2010). Recycling information. Retrieved from http://www.cityofmandeville.com/
City of Minneapolis. (2011). Urban agriculture policy plan. [Minneapolis]. Retrieved from http://www.minneapolismn.gov/cped/planning/plans/cped_urban_ag_plan
City of New Orleans, City Planning Commission. (2010). New Orleans 2030: Plan for the 21st century. [New Orleans]: Goody Clancy Architecture.
City of New Orleans, New Orleans Police Department. (2012). 2012 enhancements of NOPD crime-fighting strategy. [PowerPoint slides]. Serpas, R. Retrieved from www.nola.gov
City of New Orleans, ResultsNOLA. (2012). 2012 Year end report. [New Orleans].
City of New Orleans, Sewerage and Water Board. (2007). Quality water 2007: a report on the state of tap water in New Orleans. [New Orleans].
City of New Orleans, Sewerage and Water Board. (2013). Drainage system facts. Retrieved from http://www.swbno.org/history_drainage_facts.asp
City of New Orleans. (2009). City of New Orleans carbon footprint report. [New Orleans]: Moore, J. and Stone, L. Retrieved from http://new.nola.gov/home/
City of Philadelphia, Office of the Controller. (2012). Exploring Philadelphia's economic strengths. Retrieved from http://www.philadelphiacontroller.org/publications/fpau/LQ_Report.pdf
Connect 2 Educate. (2012). Connect 2 Educate notebook: a guide to community resources for public schools and their students. Retrieved from www.Connect2Educate.org
Costanza, R., Mitsch, W. J., & Day, J. W., Jr. (2006). A new vision for New Orleans and the Mississippi delta: applying ecological economics and ecological engineering. Ecology & Environment, 4(9), 465–472.
Dixon T., Amelung F., & Ferretti A. (2006). Subsidence and flooding in New Orleans. Nature, 441, 587–588.
Entergy, Energy Smart Program. (2012). Year 1 annual report. Retrieved from www.entergy.com
Entergy. (2011). Measuring our progress: economic, environmental, and social performance. Retrieved from http://www.entergy.com/
Environment Canada. (2011). 2011 Municipal water use report. [Ottawa]. Retrieved from http://www.ec.gc.ca/doc/publications/eau-water/COM1454/survey5-eng.htm
Good Work Network. (2013). Good Work Network: providing economic opportunity for all people. Retrieved from http://www.goodworknetwork.org/
230
Greater New Orleans Inc. (2008). Labor market assessment [PowerPoint slides].
Grossi, P. & Muir-Wood, R. (2006). Flood risk in New Orleans: implications for future management and insurability. Retrieved from Risk Management Solutions website: www.rms.com
Hodgson, F. (2011, April 1). New strategy to fight adult illiteracy in New Orleans. The Pelican Post. Retrieved from http://www.thepelicanpost.org/2011/04/01/new-strategy-to-fight-adult-illiteracy-in-new-orleans/
HSH. (2013). Louisiana mortgage rates and refinance rates. Retrieved from http://www.hsh.com/ls-la.html
Idea Village. (2013). The Idea Village: for entrepreneurs and those who believe in them. Retrieved from http://ideavillage.org/
Internet World Stats: Usage and population statistics. (2012). Louisiana. Retrieved from http://www.internetworldstats.com/unitedstates.htm
Jacobs, L. (2011, April 3). New Orleans dropout rate plummets 31%. Educate Now. Retrieved from http://educatenow.net/2011/04/03/new-orleans-dropout-rate-plummets-31/
Jefferson Parish Drainage Department. (2013). Drainage department. Retrieved from http://www.jeffparish.net/index.aspx?page=182
Kiva. (2013). Kiva New Orleans. Retrieved from http://www.kiva.org/partners/200
Levine, L. (2012). The US income distribution and mobility: trends and international comparisons. Retrieved from Congressional Research Service websire: www.crs.org
Louisiana Department of Culture, Recreation, and Tourism. (2013). Historic building recovery grant program. Retrieved from http://www.crt.state.la.us/hp/grants/historic_building_recovery_grant_program.aspx
Louisiana Department of Culture, Recreation, and Tourism. (2013). Louisiana state parks. Retrieved from http://www.crt.state.la.us/parks/
Louisiana Department of Education. (2013). Accountability. Retrieved from http://www.louisianabelieves.com/accountability
Louisiana Department of Natural Resources. (2009). Cheniers and natural ridges study. Providence Engineering and Environmental Group. Retrieved from http://dnr.louisiana.gov/assets/docs/coastal/227-009-001NG-Chenier-Rpt-DNR.pdf
Louisiana Department of Wildlife and Fisheries. (2005). Louisiana comprehensive wildlife conservation strategy. [Baton Rouge]. Retrieved from http://www.wlf.louisiana.gov/
Louisiana Office of Juvenile Justice. (2012). Louisiana quarterly juvenile justice indicators: an up-to date view of juvenile custody and supervision populations. Retrieved from http://ojj.la.gov/
Louisiana Paddle. (2013). New Orleans: popular paddling cities. Retrieved from http://www.louisianapaddle.com/content
231
Mardi Gras New Orleans. (2013). Krewe of Bacchus. Retrieved from http://www.mardigrasneworleans.com/schedule/parade-info/parades-bacchus.html
McGraw, D. (2012, January 18). Top 20 cities by per-capita GDP. Fuel Fix. Retrieved from http://fuelfix.com/blog/2012/01/18/top-20-cities-by-per-capita-gdp/#2555-1
McInturff, B., Harrington, E., Greenberg, A., and Walker, D. (2008). Perceived health challenges in the United States: national survey results. Public Opinion Strategies.
Metairie, LA. (2013). Welcome to Metairie. Retrieved from http://welcometo.metairie.com/
Miller, S. (2013). Leveraged loan default rate forecast trends lower: LCD’s quarterly survey. Retrieved from http://www.forbes.com/sites/spleverage/2012/09/25/loan-default-rate-forecast-trends-lower-in-lcds-quarterly-survey/
Mock, N. (2007). Health and health care. In Katrina and the women of New Orleans (pp. 54-58). New Orleans: Tulane University.
Morran, C. (2010). The top 10 foreclosure hotspots in the U.S. Retrieved from the Consumerist website: http://consumerist.com/2011/02/02/the-top-10-foreclosure-hotspots-of-2010/
Natural Resources Defense Council. (2003). What’s on tap? Drinking water in U.S. cities: New Orleans, LA. Washington, D.C.
New America Foundation. (2013). Louisiana. Retrieved from http://febp.newamerica.net/k12/LA
New America Foundation. (2013). North Carolina. Retrieved from http://febp.newamerica.net/k12/NC
New Orleans Events. (2013). New Orleans annual events. Retrieved from http://www.new-orleans.world-)guides.com/new_orleans_events.html
New Orleans Food and Farm Network. (2013). Urban growing sites. Retrieved from www.noffn.org
New Orleans Institute for Resilience and Innovation. (2011). New Orleans’ neighbourhood associations: civically similar but with varied capacity. Danley, S. Retrieved from http://www.neworleansinstitute.net/news/post/441/New-Orleans-Neighbourhood-Associations-Civically-Similar-but-with-Varied-Capacity
Ortiz, E. & Plyer, A. (2013). Economic synergies across Southeast Louisiana. Retrieved from GNOCDC website: www.gnocdc.org
Ortiz, E. & Plyer, A. (2012). Who lives in New Orleans and the metro area now? Retrieved from Greater New Orleans Community Data Center website: http://www.gnocdc.org
Oxfam America. (2008). Building common ground: how shared attitudes and concerns can create alliances between African-Americans and Latinos in a post-Katrina New Orleans. Retrieved from www.oxfamamerica.org
232
Plyer, A. & Ortiz, E. (2010). Benchmarks for blight: how many blighted properties does New Orleans really have and how can we eliminate 10,000 more? Retrieved from Greater New Orleans Community Data Center website: http://www.gnocdc.org
Plyer, A. & Ortiz, E. (2011). New Orleans Index at Six: measuring Greater New Orleans’ progress towards prosperity. Retrieved from Greater New Orleans Community Data Center website: http://www.gnocdc.org
Plyer, A. & Ortiz, E. (2011). Regional “export” industries: drivers of the New Orleans economy. Retrieved from Greater New Orleans Community Data Center website: http://www.gnocdc.org
Plyer, A. Ortiz, E., & Pettit, K.. (2010). Post-Katrina commuter patterns. Retrieved from Greater New Orleans Community Data Center website: http://www.gnocdc.org
Plyer, A., & Campanella, R. (2010). Coastal employment before the 2010 Deepwater Horizon oil disaster. Retrieved from Greater New Orleans Community Data Center website: http://www.gnocdc.org
Plyer, A., & Campanella, R. (2010). Job sprawl in Metro New Orleans. Retrieved from Greater New Orleans Community Data Center website: http://www.gnocdc.org
Plyer, A., Ortiz, E., & Horwitz, B. (2011). Housing development and abandonment in New Orleans since 1960. Retrieved from Greater New Orleans Community Data Center website: http://www.gnocdc.org
Plyer, A., Ortiz, E., & Pettit, K. (2009). Post-Katrina housing affordability challenges continue in 2008, worsening among Orleans Parish very low income renters. Retrieved from Greater New Orleans Community Data Center website: http://www.gnocdc.org
Police Executive Research Forum. (2001). An examination of homicide clearance rates: foundation for the development of a homicide clearance model. Richardson, D. & Kosa, R. Retrieved from http://www.policeforum.org/
Postlethwaite & Netterville Accounting. (2011). City of New Orleans, Louisiana: basic financial statements. Retrieved from www.nola.gov/BUSINESSES/.../CAFR%202011.ashx
Propellor. (2013). Propellor: a force for social innovation. Retrieved from http://gopropeller.org/
Rabito, F.A., Iqbal, S., Perry, S., Arroyave, W., & Rice, J. (2012). Environmental lead after Hurricane Katrina: Implications for future populations. Environmental Health Perspectives, 120(2), 180-184.
Regional Planning Commission. (2003). Regional land use by parish. Retrieved from http://www.norpc.org/assets/land_cover_maps/RPC_land_cover_maps_stats.pdf
Regional Planning Commission. (2009). Comprehensive economic development strategy, 2009 update: economic development district one. [New Orleans]. Retrieved from www.norpc.org
233
Regional Planning Commission. (2010). Citizens' guide to transportation planning. [New Orleans]. Retrieved from www.norpc.org
Roper, W.E., Weiss, K. J., & Wheeler, J. F. (2006). Water quality assessment and monitoring in New Orleans following Hurricane Katrina. George Mason University.
Ross, B. (2012, May 6). Louisiana is 3rd in the nation in private school enrolment. The Times Picayune. Retrieved from http://www.nola.com/education/index.ssf/2012/05/louisiana_is_3rd_in_nation_in.html
Rothwell, J. & Berube, A. (2011). Education, demand, and unemployment in metropolitan America. Brookings Institute, Metropolitan Policy Program. Retrieved from http://www.brookings. edu/~/media/Files/rc/papers/2011/0909_skills_ unemployment_rothwell/0909_skills_unemployment_rothwell.pdf
Rotkin-Ellman, M., Somolon, G., Gonzales, C., Agwaramgbo, L., & Mielke, H. W. (2010). Arsenic contamination in New Orleans soil: temporal changes associated with flooding. Environmental Research, 1(10), 19-25.
Sellers, S., Perry, A., Sams-Abiodun, P., Plyer, A. & Ortiz, E. (2012). Building an inclusive, high-skilled workforce for New Orleans’ next economy. Retrieved from Greater New Orleans Community Data Center website: http://www.gnocdc.org
Simpson, D., Nowlan, J., Gradel, T. J., Zmuda, M. M., Sterrett, D., & Cantor, D. (2012). Chicago and Illinois, leading the pack in corruption (Anti-corruption report no. 5). University of Illinois at Chicago, Department of Political Science.
Smart Growth America. (2012). Measuring sprawl and its impact: the character and consequences of metropolitan expansion. Retrieved from www.smartgrowthamerica.org
Smart Growth America. (2012). The sprawl index: New Orleans, LA. Retrieved from www.smartgrowthamerica.org
Smit, A. (2011, June 6). Wettest cities in America. Third Age. Retrieved from http://www.thirdage.com/news/wettest-cities-in-america_06-06-2011
Social Compact. (2010). City of New Orleans: Neighbourhood market drilldown-catalyzing business investment in inner-city neighbourhoods. Retrieved from http://www.socialcompact.org/
State of Louisiana. (2012). Louisiana’s comprehensive master plan for a sustainable coast: committed to our coast. [Baton Rouge, LA].
Teaching Responsible Earth Education. (2013). About T.R.E.E. Retrieved from http://treetalk.org/
Tennessee Williams/New Orleans Literary Festival. (2013). Tennessee Williams/New Orleans Literary Festival. Retrieved from http://www.tennesseewilliams.net/
Trust for Public Land. (2012). 2012 City Park facts. Retrieved from http://cloud.tpl.org/pubs/ccpe-cityparkfacts-2012.pdf
234
Tulane University, Cowen Institute for Public Education Initiatives. (2012). The state of public education in New Orleans: 2012 report. Retrieved from http://education.tulane.edu
United Health Foundation. (2011). America’s health rankings: Louisiana. Retrieved from http://www.americashealthrankings.org
United Health Foundation. (2013). Louisiana: obesity. Retrieved from http://www.americashealthrankings.org/LA/Obesity/2012
United Health Foundation. (2013). Louisiana: poor mental health days. Retrieved from http://www.americashealthrankings.org/LA/MentalHealth/2012
United Health Foundation. (2013). Louisiana: public health spending. Retrieved from http://www.americashealthrankings.org/NC/PH_Spending/2011
United States Army Corps of Engineers. (2010). Greater New Orleans area hurricane & storm damage risk reduction system. [PowerPoint slides]. Sinkler, R. Retrieved from http://www.mvn.usace.army.mil/hps2/
United States Bankruptcy Court, Eastern District of Louisiana. (2013). Filing information. Retrieved from http://www.laeb.uscourts.gov/FilingInfo/FilingInfo.htm
United States Bankruptcy Court. (2013). Report F-5A: U.S. Bankruptcy Courts business and non-business bankruptcy county cases commenced, by chapter of the Bankruptcy Code, during the 12-month period ending March 31, 2013.Retrieved from http://www.uscourts.gov/uscourts/Statistics/BankruptcyStatistics/BankruptcyFilings/2013/0313_f5a.pdf
United States Bureau of Labor Statistics. (2013). Census of fatal occupational injuries. Retrieved from http://www.bls.gov/news.release/cfoi.nr0.htm
United States Bureau of Labor Statistics. (2013). Civilian labor force and unemployment by state and metropolitan area. Retrieved from http://www.bls.gov/news.release/metro.t01.htm
United States Bureau of Labor Statistics. (2013). Economic news release. Retrieved from http://www.bls.gov/news.release/empsit.t18.htm
United States Bureau of Labor Statistics. (2013). Economy at a glance: New Orleans-Metairie-Kenner. Retrieved from http://www.bls.gov/eag/eag.la_neworleans_msa.htm
United States Bureau of Labor Statistics. (2013). Occupational employment statistics. Retrieved from http://www.bls.gov/oes/current/oes_ms.htm#00-0000
United States Census Bureau. (2011). U.S. neighbourhood income inequality in the 2005-2009 period. Weinberg, D. Retrieved from http://www.census.gov/prod/2011pubs/acs-16.pdf
United States Energy Information Administration. (2013). Louisiana field production of crude oil. Retrieved from http://www.eia.gov/dnav/pet/hist/LeafHandler.ashx?n=PET&s=MCRFPLA1&f=A
235
United States Environmental Protection Agency, Ground Water Center, Source Water Protection Branch. (2009). State of the groundwater report. [Dallas, TX]: Lister, C., Chesney, C., & Revisto, A.
United States Environmental Protection Agency. (2009). Air Quality Index: a guide to air quality and your health. Retrieved from www.epa.gov
United States Environmental Protection Agency. (2010). Number of days with Air Quality Index values greater than 100 at trends sites, 2000-2010, and all sites in 2010. Retrieved from www.epa.gov
United States Environmental Protection Agency. (2012). The national biennial RCRA hazardous waste report (based on 2011 data). [Washington, D.C.].
United States Federal Bureau of Investigation. (2010). Hate crime incidents per bias motivation and quarter by state and agency. [Washington, D.C.]. Retrieved from www.fbi.gov
United States Geological Survey. (2013). GAP viewer. Retrieved from http://gapanalysis.usgs.gov/gaplandcover/viewer/
United States Green Building Council. (2013). Directory. Retrieved from http://new.usgbc.org/projects
Urban Institute. (2012). A profile of nonprofit organizations in the Greater New Orleans metropolitan area. De Vita, C. J., Blackwood, A. S., and Roeger, K. L. Retrieved from http://www.urban.org/
Waggoner & Ball Architects. (2013). Living with water: sustainable urban water planning in New Orleans. Retrieved from http://livingwithwater.com/
Wilson Perkins Allen Opinion Research. (2012). NOCC citizen satisfaction survey. Retrieved from www.wparesearch.com
World Bank. (2013). GDP per capita. Retrieved from http://data.worldbank.org/indicator/NY.GDP.PCAP.CD
Zip Atlas. (2013). Average commute time in Louisiana by city. Retrieved from http://zipatlas.com/us/la/city-comparison/average-commute-time.3.htm
236
Appendices
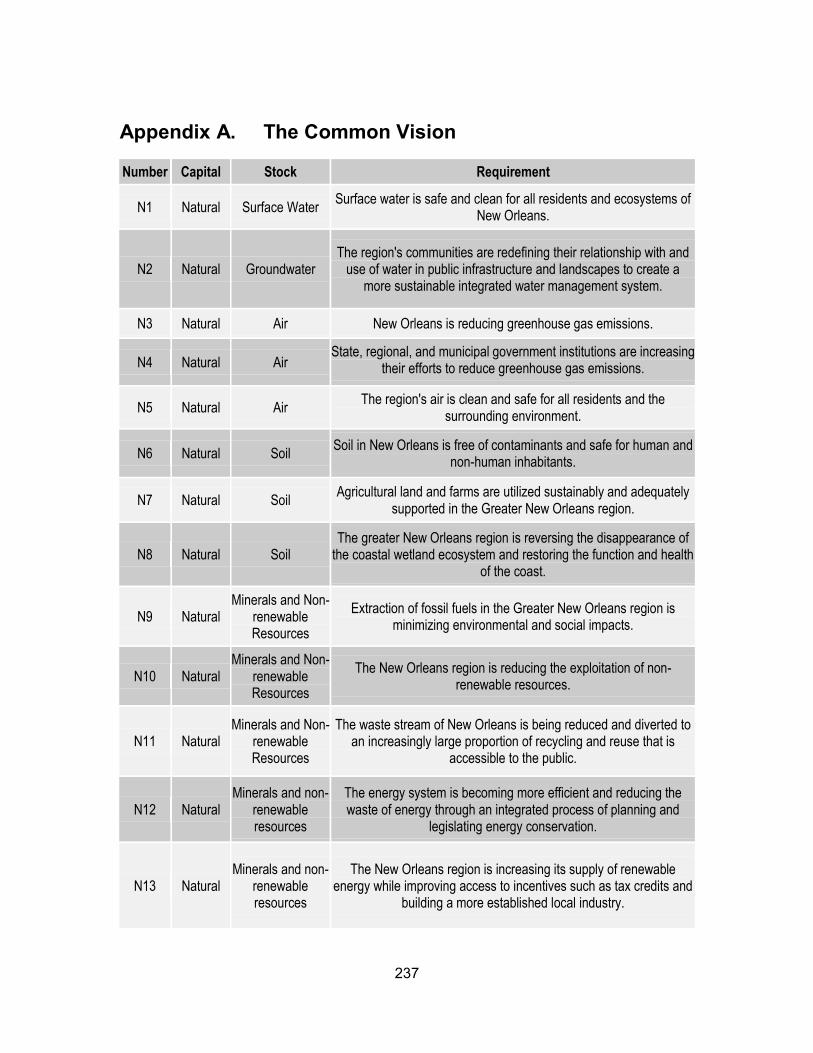
237
Appendix A. The Common Vision
Number Capital Stock Requirement
N1 Natural Surface Water Surface water is safe and clean for all residents and ecosystems of
New Orleans.
N2 Natural Groundwater The region's communities are redefining their relationship with and
use of water in public infrastructure and landscapes to create a more sustainable integrated water management system.
N3 Natural Air New Orleans is reducing greenhouse gas emissions.
N4 Natural Air State, regional, and municipal government institutions are increasing
their efforts to reduce greenhouse gas emissions.
N5 Natural Air The region's air is clean and safe for all residents and the
surrounding environment.
N6 Natural Soil Soil in New Orleans is free of contaminants and safe for human and
non-human inhabitants.
N7 Natural Soil Agricultural land and farms are utilized sustainably and adequately
supported in the Greater New Orleans region.
N8 Natural Soil The greater New Orleans region is reversing the disappearance of
the coastal wetland ecosystem and restoring the function and health of the coast.
N9 Natural Minerals and Non-
renewable Resources
Extraction of fossil fuels in the Greater New Orleans region is minimizing environmental and social impacts.
N10 Natural Minerals and Non-
renewable Resources
The New Orleans region is reducing the exploitation of non-renewable resources.
N11 Natural Minerals and Non-
renewable Resources
The waste stream of New Orleans is being reduced and diverted to an increasingly large proportion of recycling and reuse that is
accessible to the public.
N12 Natural Minerals and non-
renewable resources
The energy system is becoming more efficient and reducing the waste of energy through an integrated process of planning and
legislating energy conservation.
N13 Natural Minerals and non-
renewable resources
The New Orleans region is increasing its supply of renewable energy while improving access to incentives such as tax credits and
building a more established local industry.
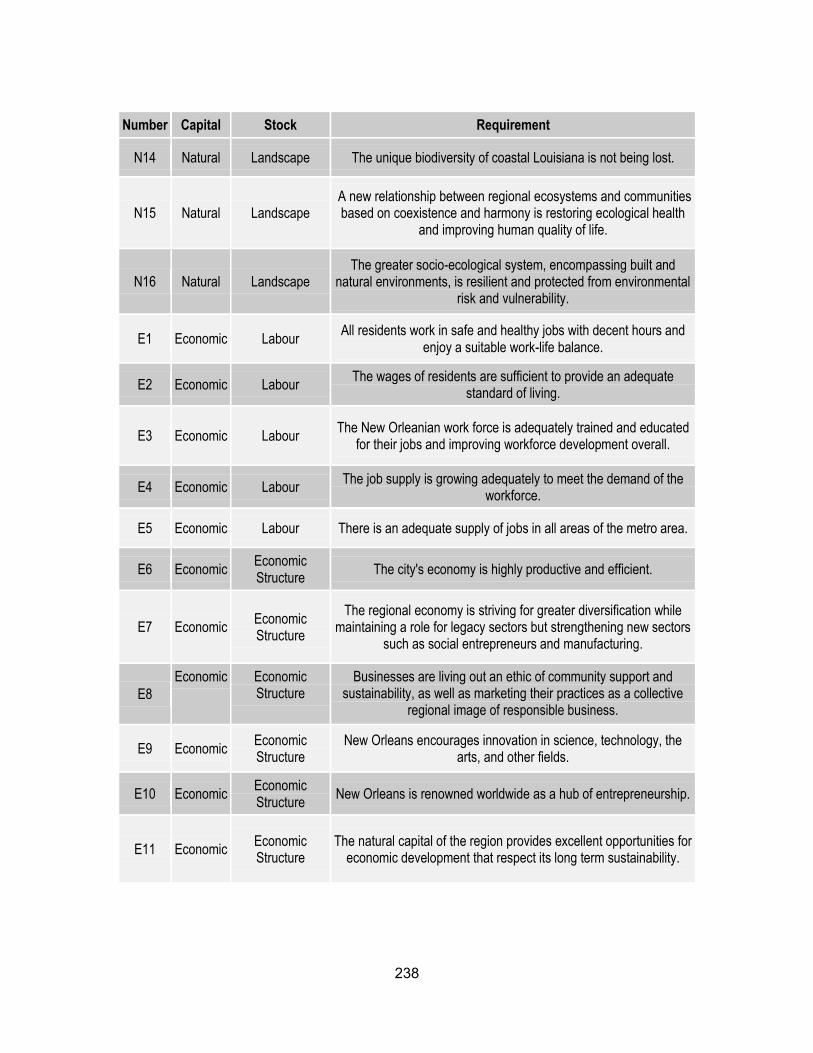
238
Number Capital Stock Requirement
N14 Natural Landscape The unique biodiversity of coastal Louisiana is not being lost.
N15 Natural Landscape A new relationship between regional ecosystems and communities based on coexistence and harmony is restoring ecological health
and improving human quality of life.
N16 Natural Landscape The greater socio-ecological system, encompassing built and
natural environments, is resilient and protected from environmental risk and vulnerability.
E1 Economic Labour All residents work in safe and healthy jobs with decent hours and
enjoy a suitable work-life balance.
E2 Economic Labour The wages of residents are sufficient to provide an adequate
standard of living.
E3 Economic Labour The New Orleanian work force is adequately trained and educated
for their jobs and improving workforce development overall.
E4 Economic Labour The job supply is growing adequately to meet the demand of the
workforce.
E5 Economic Labour There is an adequate supply of jobs in all areas of the metro area.
E6 Economic Economic Structure
The city's economy is highly productive and efficient.
E7 Economic Economic Structure
The regional economy is striving for greater diversification while maintaining a role for legacy sectors but strengthening new sectors
such as social entrepreneurs and manufacturing.
E8
Economic Economic Structure
Businesses are living out an ethic of community support and sustainability, as well as marketing their practices as a collective
regional image of responsible business.
E9 Economic Economic Structure
New Orleans encourages innovation in science, technology, the arts, and other fields.
E10 Economic Economic Structure
New Orleans is renowned worldwide as a hub of entrepreneurship.
E11 Economic Economic Structure
The natural capital of the region provides excellent opportunities for economic development that respect its long term sustainability.
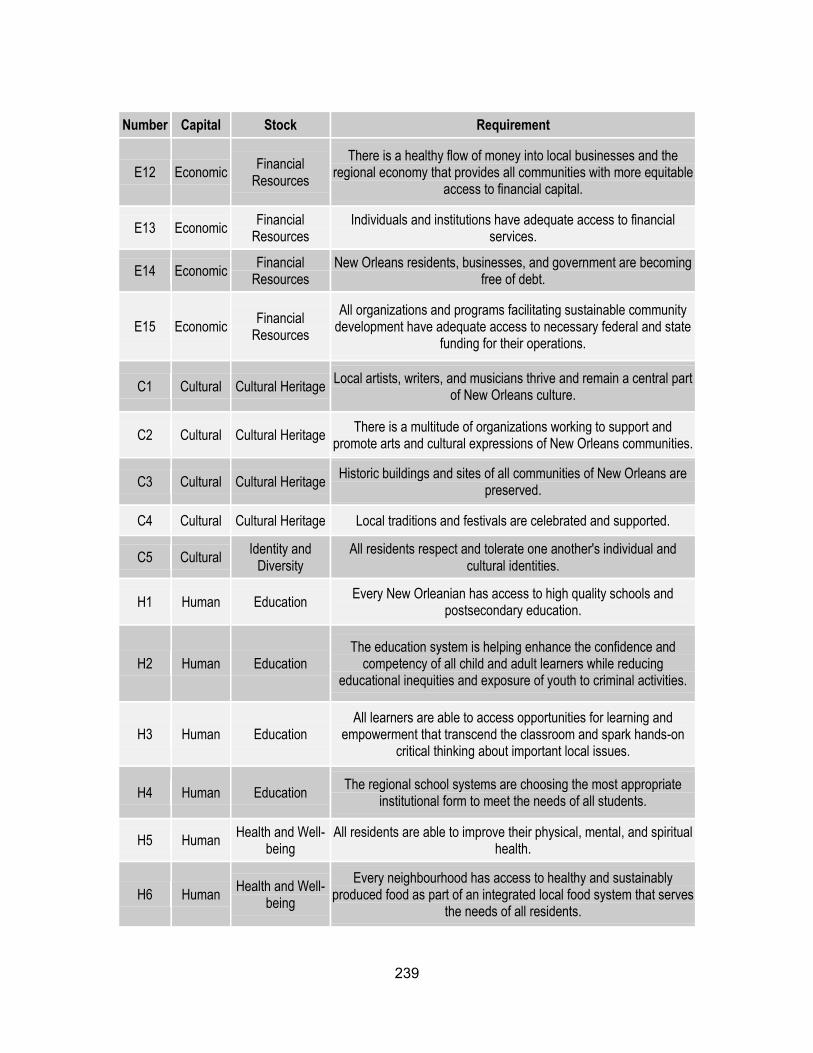
239
Number Capital Stock Requirement
E12 Economic Financial
Resources
There is a healthy flow of money into local businesses and the regional economy that provides all communities with more equitable
access to financial capital.
E13 Economic Financial
Resources Individuals and institutions have adequate access to financial
services.
E14 Economic Financial
Resources New Orleans residents, businesses, and government are becoming
free of debt.
E15 Economic Financial
Resources
All organizations and programs facilitating sustainable community development have adequate access to necessary federal and state
funding for their operations.
C1 Cultural Cultural Heritage Local artists, writers, and musicians thrive and remain a central part
of New Orleans culture.
C2 Cultural Cultural Heritage There is a multitude of organizations working to support and
promote arts and cultural expressions of New Orleans communities.
C3 Cultural Cultural Heritage Historic buildings and sites of all communities of New Orleans are
preserved.
C4 Cultural Cultural Heritage Local traditions and festivals are celebrated and supported.
C5 Cultural Identity and
Diversity All residents respect and tolerate one another's individual and
cultural identities.
H1 Human Education Every New Orleanian has access to high quality schools and
postsecondary education.
H2 Human Education The education system is helping enhance the confidence and
competency of all child and adult learners while reducing educational inequities and exposure of youth to criminal activities.
H3 Human Education All learners are able to access opportunities for learning and
empowerment that transcend the classroom and spark hands-on critical thinking about important local issues.
H4 Human Education The regional school systems are choosing the most appropriate
institutional form to meet the needs of all students.
H5 Human Health and Well-
being All residents are able to improve their physical, mental, and spiritual
health.
H6 Human Health and Well-
being
Every neighbourhood has access to healthy and sustainably produced food as part of an integrated local food system that serves
the needs of all residents.
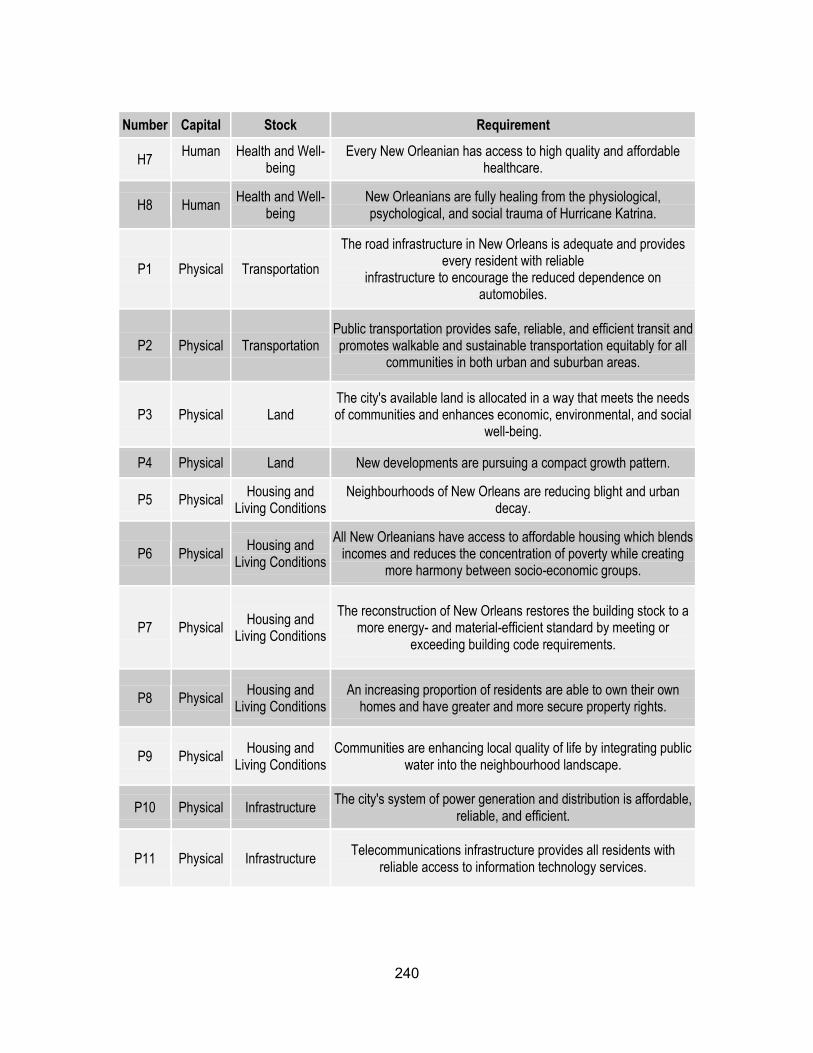
240
Number Capital Stock Requirement
H7 Human Health and Well-
being Every New Orleanian has access to high quality and affordable
healthcare.
H8 Human Health and Well-
being New Orleanians are fully healing from the physiological, psychological, and social trauma of Hurricane Katrina.
P1 Physical Transportation
The road infrastructure in New Orleans is adequate and provides every resident with reliable
infrastructure to encourage the reduced dependence on automobiles.
P2 Physical Transportation Public transportation provides safe, reliable, and efficient transit and promotes walkable and sustainable transportation equitably for all
communities in both urban and suburban areas.
P3 Physical Land The city's available land is allocated in a way that meets the needs of communities and enhances economic, environmental, and social
well-being.
P4 Physical Land New developments are pursuing a compact growth pattern.
P5 Physical Housing and
Living Conditions Neighbourhoods of New Orleans are reducing blight and urban
decay.
P6 Physical Housing and
Living Conditions
All New Orleanians have access to affordable housing which blends incomes and reduces the concentration of poverty while creating
more harmony between socio-economic groups.
P7 Physical Housing and
Living Conditions
The reconstruction of New Orleans restores the building stock to a more energy- and material-efficient standard by meeting or
exceeding building code requirements.
P8 Physical Housing and
Living Conditions An increasing proportion of residents are able to own their own
homes and have greater and more secure property rights.
P9 Physical Housing and
Living Conditions Communities are enhancing local quality of life by integrating public
water into the neighbourhood landscape.
P10 Physical Infrastructure The city's system of power generation and distribution is affordable,
reliable, and efficient.
P11 Physical Infrastructure Telecommunications infrastructure provides all residents with
reliable access to information technology services.
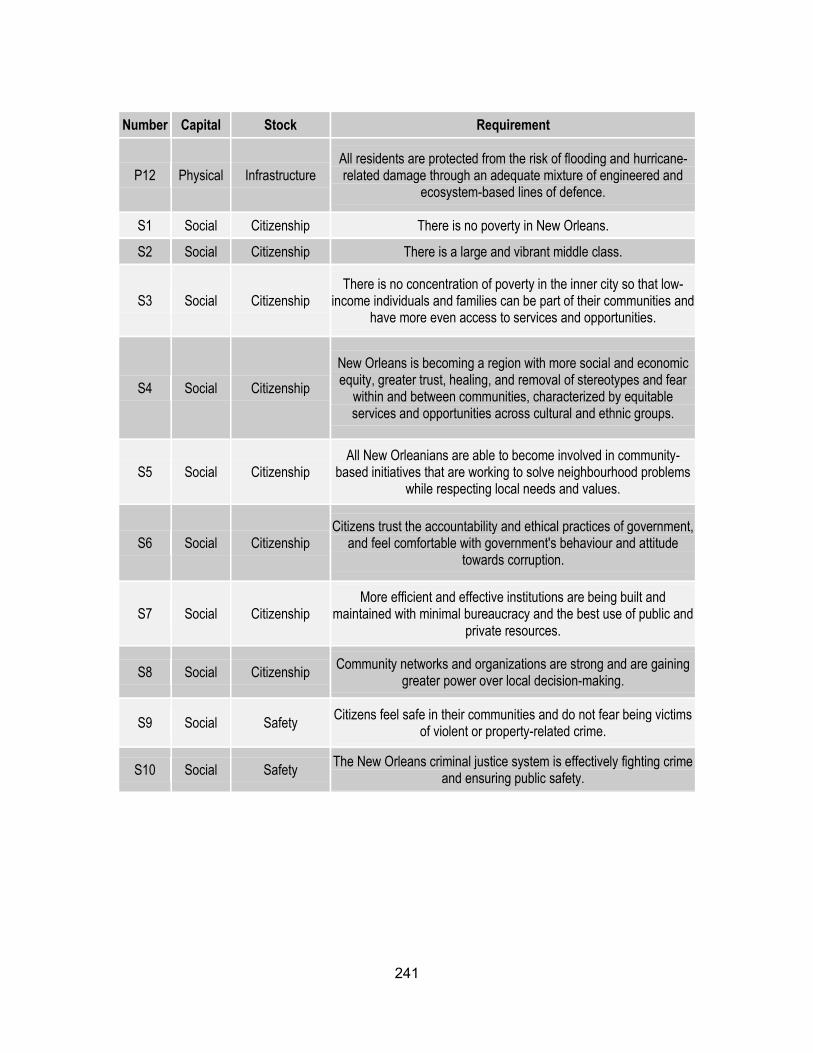
241
Number Capital Stock Requirement
P12 Physical Infrastructure All residents are protected from the risk of flooding and hurricane-related damage through an adequate mixture of engineered and
ecosystem-based lines of defence.
S1 Social Citizenship There is no poverty in New Orleans.
S2 Social Citizenship There is a large and vibrant middle class.
S3 Social Citizenship There is no concentration of poverty in the inner city so that low-
income individuals and families can be part of their communities and have more even access to services and opportunities.
S4 Social Citizenship
New Orleans is becoming a region with more social and economic equity, greater trust, healing, and removal of stereotypes and fear
within and between communities, characterized by equitable services and opportunities across cultural and ethnic groups.
S5 Social Citizenship All New Orleanians are able to become involved in community-
based initiatives that are working to solve neighbourhood problems while respecting local needs and values.
S6 Social Citizenship Citizens trust the accountability and ethical practices of government,
and feel comfortable with government's behaviour and attitude towards corruption.
S7 Social Citizenship More efficient and effective institutions are being built and
maintained with minimal bureaucracy and the best use of public and private resources.
S8 Social Citizenship Community networks and organizations are strong and are gaining
greater power over local decision-making.
S9 Social Safety Citizens feel safe in their communities and do not fear being victims
of violent or property-related crime.
S10 Social Safety The New Orleans criminal justice system is effectively fighting crime
and ensuring public safety.
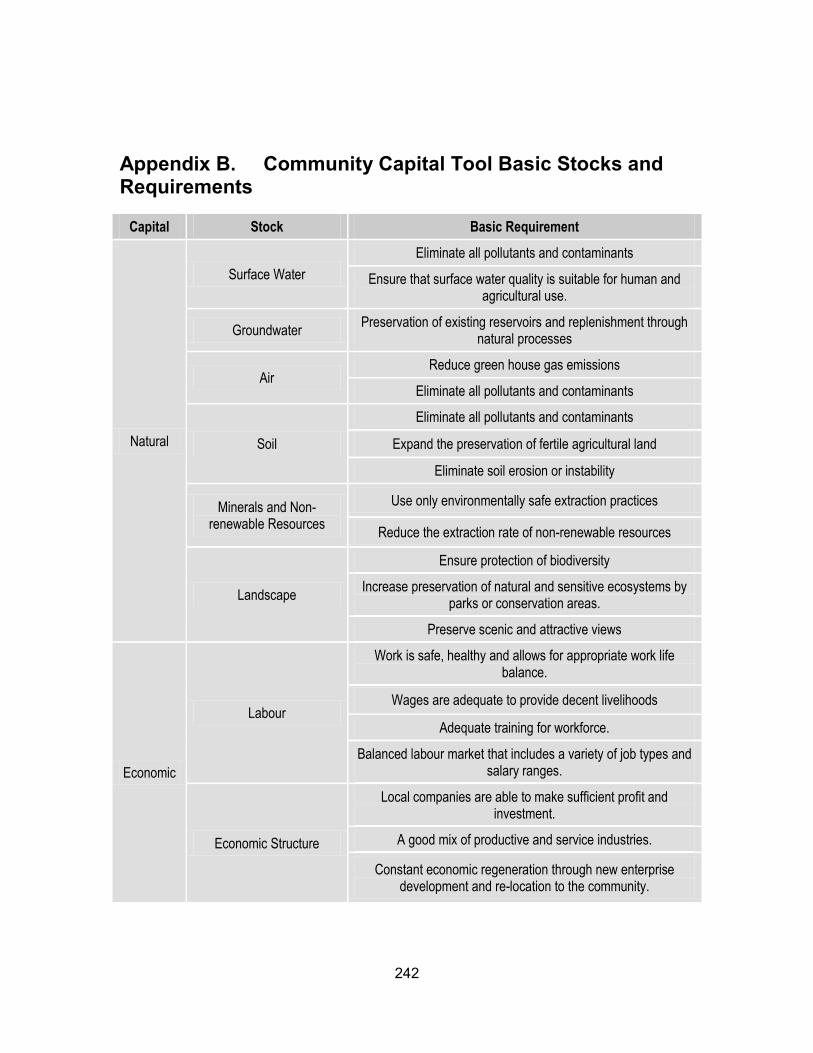
242
Appendix B. Community Capital Tool Basic Stocks and Requirements
Capital Stock Basic Requirement
Natural
Surface Water
Eliminate all pollutants and contaminants
Ensure that surface water quality is suitable for human and agricultural use.
Groundwater Preservation of existing reservoirs and replenishment through
natural processes
Air Reduce green house gas emissions
Eliminate all pollutants and contaminants
Soil
Eliminate all pollutants and contaminants
Expand the preservation of fertile agricultural land
Eliminate soil erosion or instability
Minerals and Non-renewable Resources
Use only environmentally safe extraction practices
Reduce the extraction rate of non-renewable resources
Landscape
Ensure protection of biodiversity
Increase preservation of natural and sensitive ecosystems by parks or conservation areas.
Preserve scenic and attractive views
Economic
Labour
Work is safe, healthy and allows for appropriate work life balance.
Wages are adequate to provide decent livelihoods
Adequate training for workforce.
Balanced labour market that includes a variety of job types and salary ranges.
Economic Structure
Local companies are able to make sufficient profit and investment.
A good mix of productive and service industries.
Constant economic regeneration through new enterprise development and re-location to the community.
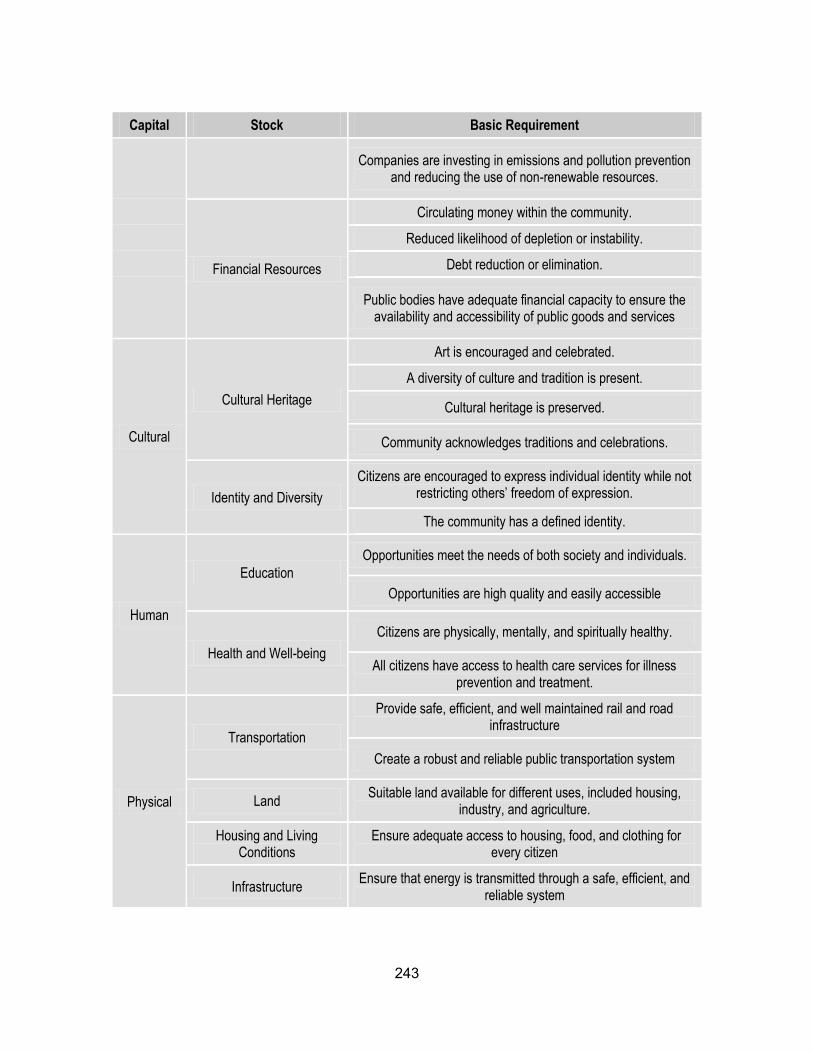
243
Capital Stock Basic Requirement
Companies are investing in emissions and pollution prevention and reducing the use of non-renewable resources.
Financial Resources
Circulating money within the community.
Reduced likelihood of depletion or instability.
Debt reduction or elimination.
Public bodies have adequate financial capacity to ensure the availability and accessibility of public goods and services
Cultural
Cultural Heritage
Art is encouraged and celebrated.
A diversity of culture and tradition is present.
Cultural heritage is preserved.
Community acknowledges traditions and celebrations.
Identity and Diversity
Citizens are encouraged to express individual identity while not restricting others’ freedom of expression.
The community has a defined identity.
Human
Education
Opportunities meet the needs of both society and individuals.
Opportunities are high quality and easily accessible
Health and Well-being
Citizens are physically, mentally, and spiritually healthy.
All citizens have access to health care services for illness prevention and treatment.
Physical
Transportation
Provide safe, efficient, and well maintained rail and road infrastructure
Create a robust and reliable public transportation system
Land Suitable land available for different uses, included housing,
industry, and agriculture.
Housing and Living Conditions
Ensure adequate access to housing, food, and clothing for every citizen
Infrastructure Ensure that energy is transmitted through a safe, efficient, and
reliable system
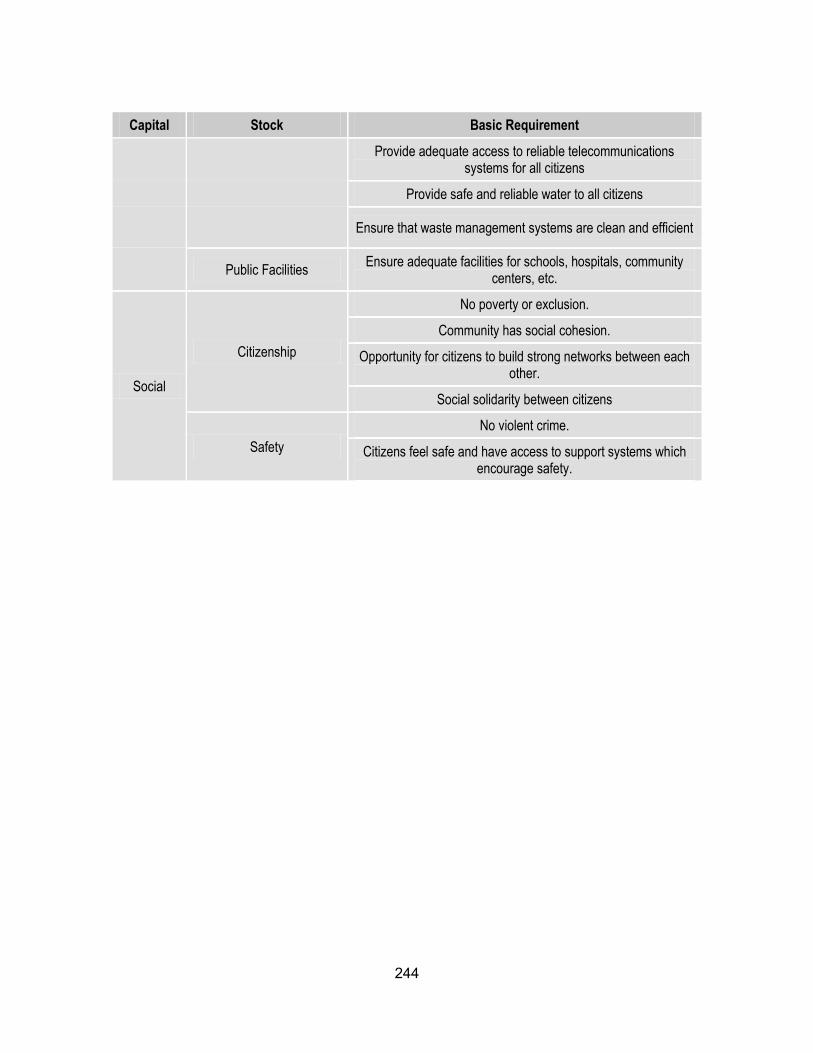
244
Capital Stock Basic Requirement
Provide adequate access to reliable telecommunications systems for all citizens
Provide safe and reliable water to all citizens
Ensure that waste management systems are clean and efficient
Public Facilities Ensure adequate facilities for schools, hospitals, community
centers, etc.
Social
Citizenship
No poverty or exclusion.
Community has social cohesion.
Opportunity for citizens to build strong networks between each other.
Social solidarity between citizens
Safety
No violent crime.
Citizens feel safe and have access to support systems which encourage safety.
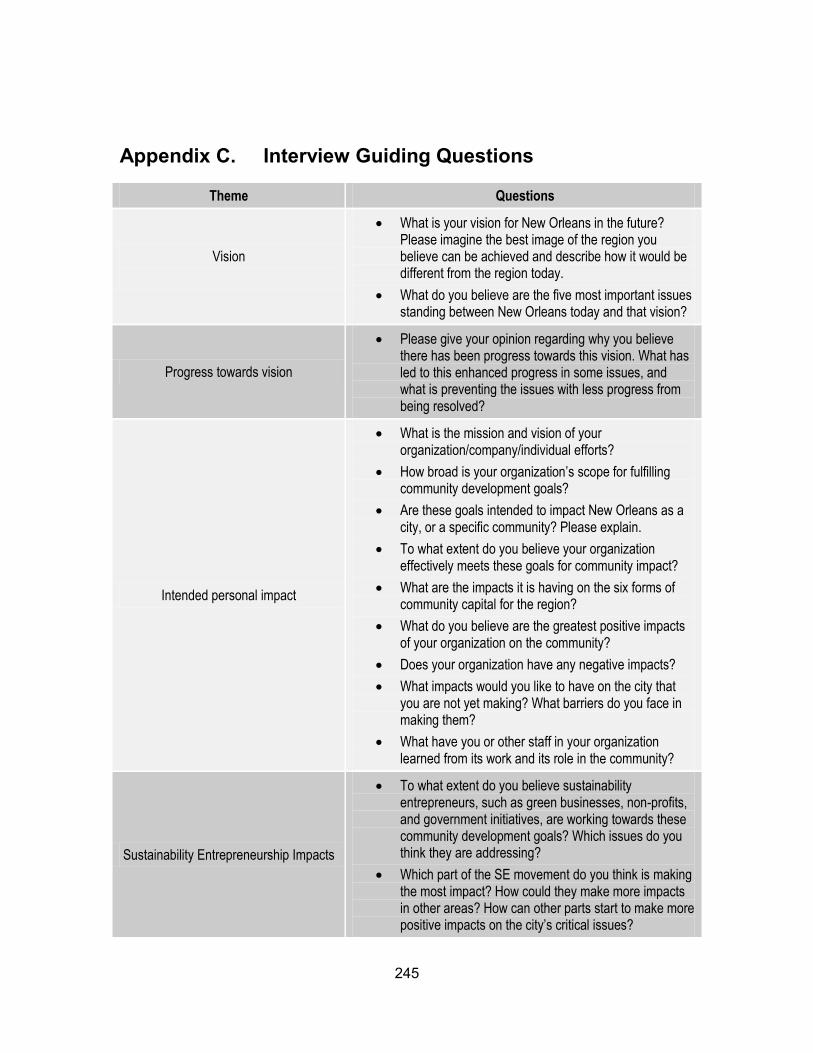
245
Appendix C. Interview Guiding Questions
Theme Questions
Vision
What is your vision for New Orleans in the future? Please imagine the best image of the region you believe can be achieved and describe how it would be different from the region today.
What do you believe are the five most important issues standing between New Orleans today and that vision?
Progress towards vision
Please give your opinion regarding why you believe there has been progress towards this vision. What has led to this enhanced progress in some issues, and what is preventing the issues with less progress from being resolved?
Intended personal impact
What is the mission and vision of your organization/company/individual efforts?
How broad is your organization’s scope for fulfilling community development goals?
Are these goals intended to impact New Orleans as a city, or a specific community? Please explain.
To what extent do you believe your organization effectively meets these goals for community impact?
What are the impacts it is having on the six forms of community capital for the region?
What do you believe are the greatest positive impacts of your organization on the community?
Does your organization have any negative impacts?
What impacts would you like to have on the city that you are not yet making? What barriers do you face in making them?
What have you or other staff in your organization learned from its work and its role in the community?
Sustainability Entrepreneurship Impacts
To what extent do you believe sustainability entrepreneurs, such as green businesses, non-profits, and government initiatives, are working towards these community development goals? Which issues do you think they are addressing?
Which part of the SE movement do you think is making the most impact? How could they make more impacts in other areas? How can other parts start to make more positive impacts on the city’s critical issues?
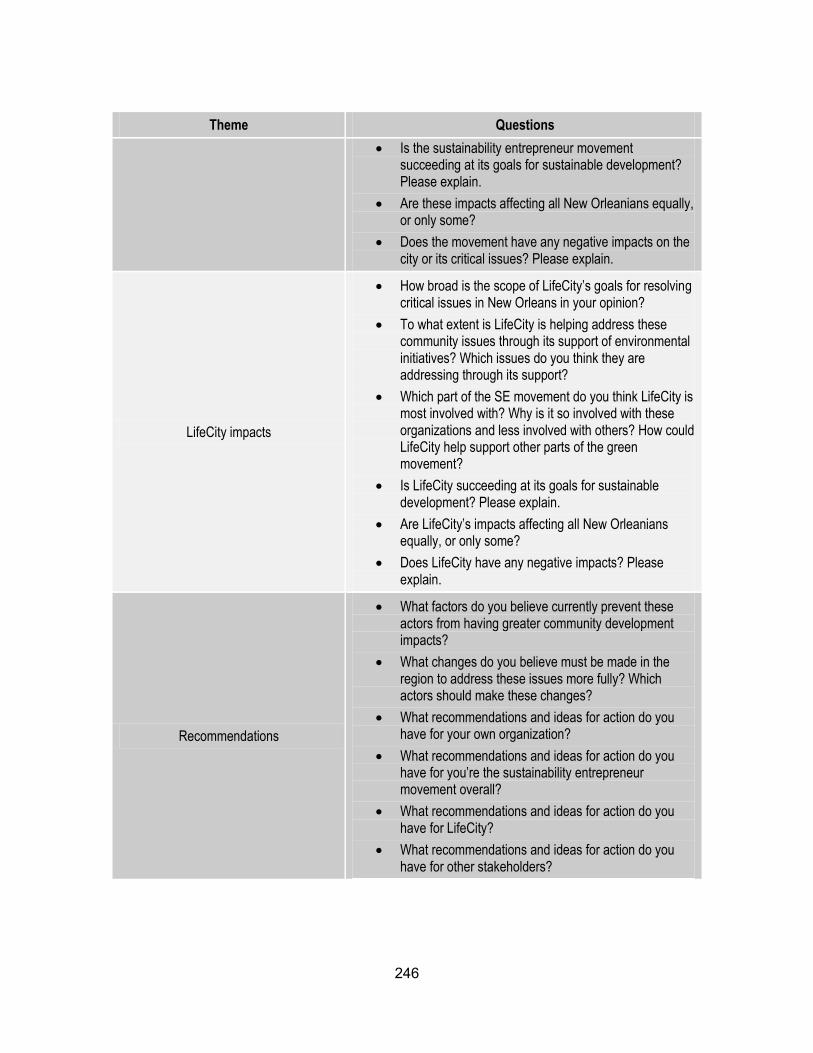
246
Theme Questions
Is the sustainability entrepreneur movement succeeding at its goals for sustainable development? Please explain.
Are these impacts affecting all New Orleanians equally, or only some?
Does the movement have any negative impacts on the city or its critical issues? Please explain.
LifeCity impacts
How broad is the scope of LifeCity’s goals for resolving critical issues in New Orleans in your opinion?
To what extent is LifeCity is helping address these community issues through its support of environmental initiatives? Which issues do you think they are addressing through its support?
Which part of the SE movement do you think LifeCity is most involved with? Why is it so involved with these organizations and less involved with others? How could LifeCity help support other parts of the green movement?
Is LifeCity succeeding at its goals for sustainable development? Please explain.
Are LifeCity’s impacts affecting all New Orleanians equally, or only some?
Does LifeCity have any negative impacts? Please explain.
Recommendations
What factors do you believe currently prevent these actors from having greater community development impacts?
What changes do you believe must be made in the region to address these issues more fully? Which actors should make these changes?
What recommendations and ideas for action do you have for your own organization?
What recommendations and ideas for action do you have for you’re the sustainability entrepreneur movement overall?
What recommendations and ideas for action do you have for LifeCity?
What recommendations and ideas for action do you have for other stakeholders?
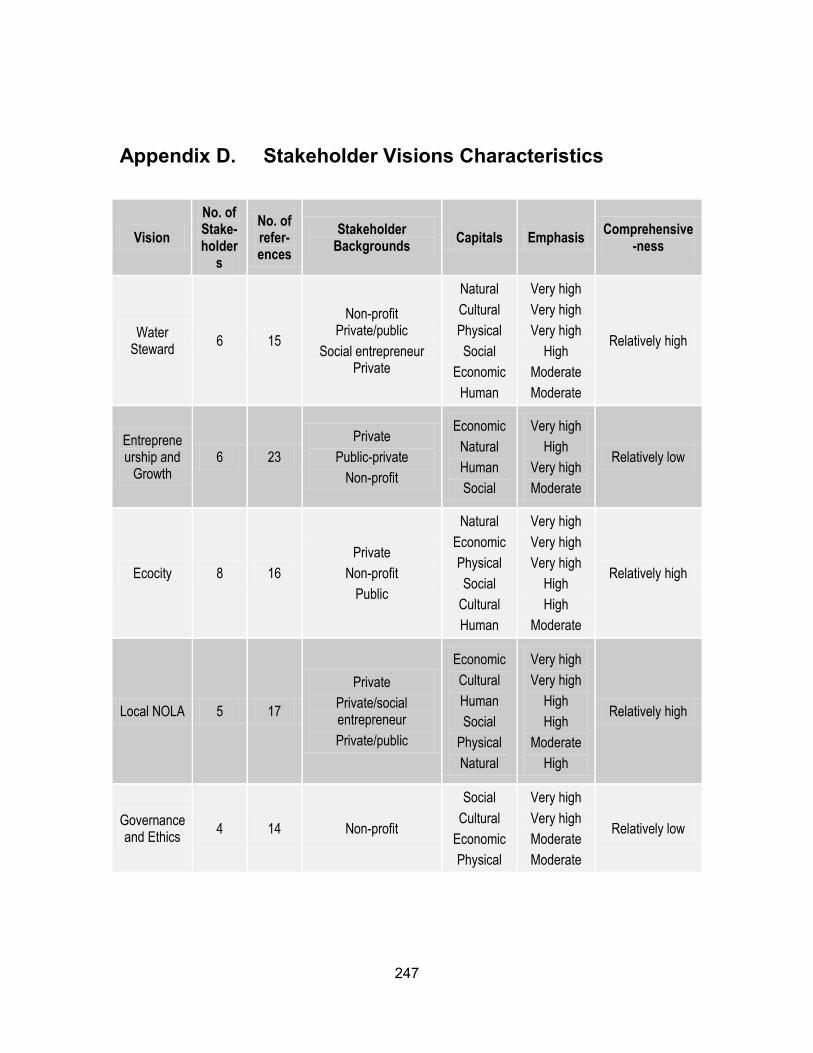
247
Appendix D. Stakeholder Visions Characteristics
Vision
No. of Stake-holder
s
No. of refer-ences
Stakeholder Backgrounds
Capitals Emphasis Comprehensive
-ness
Water Steward
6 15
Non-profit Private/public
Social entrepreneur Private
Natural
Cultural
Physical
Social
Economic
Human
Very high
Very high
Very high
High
Moderate
Moderate
Relatively high
Entrepreneurship and
Growth 6 23
Private
Public-private
Non-profit
Economic
Natural
Human
Social
Very high
High
Very high
Moderate
Relatively low
Ecocity 8 16
Private
Non-profit
Public
Natural
Economic
Physical
Social
Cultural
Human
Very high
Very high
Very high
High
High
Moderate
Relatively high
Local NOLA 5 17
Private
Private/social entrepreneur
Private/public
Economic
Cultural
Human
Social
Physical
Natural
Very high
Very high
High
High
Moderate
High
Relatively high
Governance and Ethics
4 14 Non-profit
Social
Cultural
Economic
Physical
Very high
Very high
Moderate
Moderate
Relatively low
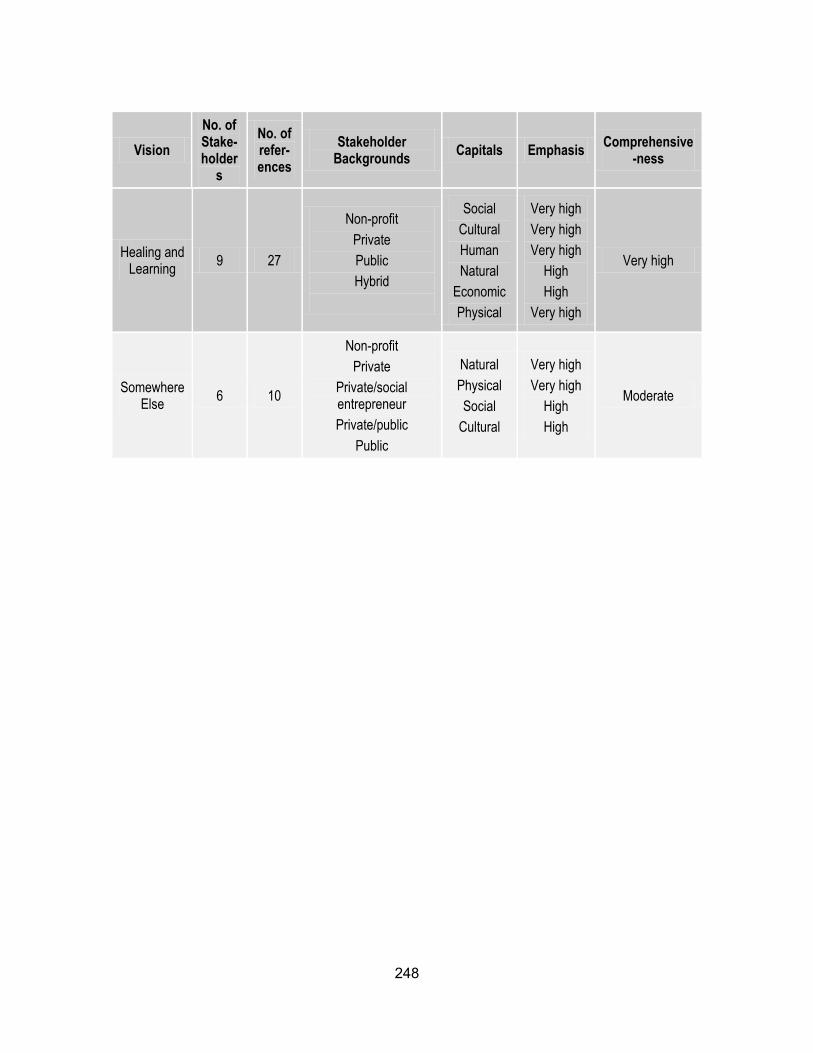
248
Vision
No. of Stake-holder
s
No. of refer-ences
Stakeholder Backgrounds
Capitals Emphasis Comprehensive
-ness
Healing and Learning
9 27
Non-profit
Private
Public
Hybrid
Social
Cultural
Human
Natural
Economic
Physical
Very high
Very high
Very high
High
High
Very high
Very high
Somewhere Else
6 10
Non-profit
Private
Private/social entrepreneur
Private/public
Public
Natural
Physical
Social
Cultural
Very high
Very high
High
High
Moderate
249
Appendix E. Balance Sheet Detailed Methodology
The first step involved in creating the Balance Sheet is the identification of a comprehensive sustainable development vision for the area in question. This vision should emerge from a mixture of planning documents, government initiatives, community-based research, and most importantly, the perspectives of citizens (Dagevos, 2011). This vision has been derived in other analyses from municipal planning documents and other official reports. In Lowry (2012), the Balance Sheet for the District of Sechelt, B.C. was built on a vision for the district emerging from its Official Community Plan. In this study, the vision for regional sustainability is derived from the construction of the Common Vision, which incorporates local planning and policy documents, stakeholder perspectives, and insights from the Community Capital Framework into a integrated articulation of the desired future state for the region. The previous section has described how this vision was created.
In contrast to this locally derived vision is the theoretical basis of community capital into which the Balance Sheet methodology moves during the second stage. In creating the measurement tool, community values and goals are analyzed in terms of the six community capitals and their respective stocks, which emerge from the established basis of social and natural scientific literature described in Section 2 (Dagevos & Evers, 2008). The Community Capital Tool has also offered a basic list of long-term goals which can be contextualized into specific community contexts (Elicit, 2013). Please see Appendix B for a full list of these capitals, stocks, and basic requirements. These stocks are uniform in every use of the CCT, but they must be defined and contextualized uniquely by each community. One critical step in this process is determining the quantitative weight that each stock will carry in its respective capital; in other words, communities must decide whether it is best to represent each stock as an equal proportion of its capital, or to give some stocks more weight and others less. In its application in New Orleans, these stocks and basic requirements were integrated with visioning priorities through the process described above. For example, the stock Housing and Living Conditions, under physical capital, was put into local context by using the basic requirement “Ensure adequate access to housing, food, and clothing for every citizen” as an umbrella for goals that responded to priorities on urban blight, mixed-income housing, green building, and home ownership. In the designation of stocks for New Orleans, it was assumed that each stock was equally important.
In the next step of the Balance Sheet, these stocks are put into local context through the means of long-term goals, or requirements (Dagevos & Evers, 2008). These requirements are perhaps the most vital step in the monitoring of regional or community sustainability, in that they define the specific objectives that enrich the area’s definition of sustainable development (Hermans et al., 2011). The identification of requirements is meant to be done in tandem between researchers and community members to define a list of the region’s most important goals for SCD (Dagevos, 2011). These requirements are intended to reflect the most relevant goals for SCD that represent the priorities arising from community perspectives, policy documents, research, and other relevant sources. The nature and number of these requirements varies with each community. In Lowry (2012), the District of Sechelt defined 20 requirements for its local sustainability planning framework, but larger communities in the Netherlands and other locales have identified larger lists of requirements (Dagevos, 2011). In the New Orleans context, the requirements emerged out of the end phase of the Common Vision, as previously described. These requirements were largely validated by community input and blended locally articulated goals within the Community Capital framework in a list of 66 long-term goals. Please see Appendix A for a full list of these requirements.
Next, the requirements that have been identified are assigned indicators (Dagevos, 2011). These indicators are meant to provide a measurable quantitative way to verify to what extent the
250
requirement it represents is being met. Ideally, most requirements should have more than one indicator so that all of the facets of these goals are represented adequately. The New Orleans Balance Sheet rendered a list of 122 indicators, which were identified by an iterative process involving policy and planning documents, community perspectives and input, revision of several draft lists of goals and indicators, and consultation with academic studies from the region and other locales. However, the appropriate number of indicators varies per requirement. For example, some requirements in this study’s stock of Education are very complex, due to the high level of community input and concern for educational systems, with some requirements having up to four indicators, while other requirements have only one. It must be decided how much weight each indicator carries within its respective requirement.
Next, benchmarks must be selected to place normative boundaries on the indicators that represent requirements for community sustainability. This process is vital to the assessment function of the Balance Sheet, in that it aspires to reflect social norms regarding the desired level that the community or region would ultimately seek of a given indicator and determines the way that the eventual measurement is ranked according to those norms (Dagevos, 2011; Hermans et al., 2011). These norms are identified for each indicator, across four ranges which dictate whether the current measurement for that indicator is considered socially optimal, acceptable, alarming, or unacceptable. The ideal level of each indicator is expressed in its target value, and the limit between the alarming and unacceptable ranges often represents a minimum or maximum level mandated by regulation but by no means desired by society (Dagevos, 2011). These norms are selected very subjectively, due to the reality that what is a socially acceptable level for various indicators is often very locally or regionally specific and it must be determined against what benchmark the local level should be compared. For example, in the New Orleans Balance Sheet, many values are measured not against the national average or the amount of a given indicator in a large city such as New York, but instead against another Southern state or a city with a similar socio-economic and demographic context.
Finally, the indicators are measured using all using existing data, which can range from scientific studies to planning documents and media sources. Data for the measurement of indicators are very important, in that the selection of the correct data point ensures an accurate measurement. In the New Orleans Balance Sheet, effort was made to ensure that data from the most recent available year and the most local scale as possible was found, and this process is not always capable of rendering values for the exact fit of the study. For example, I often had to draw on values from the scale of Louisiana instead of Metro New Orleans, when more local data were not available; in contrast, often only one parish had collected the necessary data to measure an indicator, when all seven parishes should ideally have these figures.
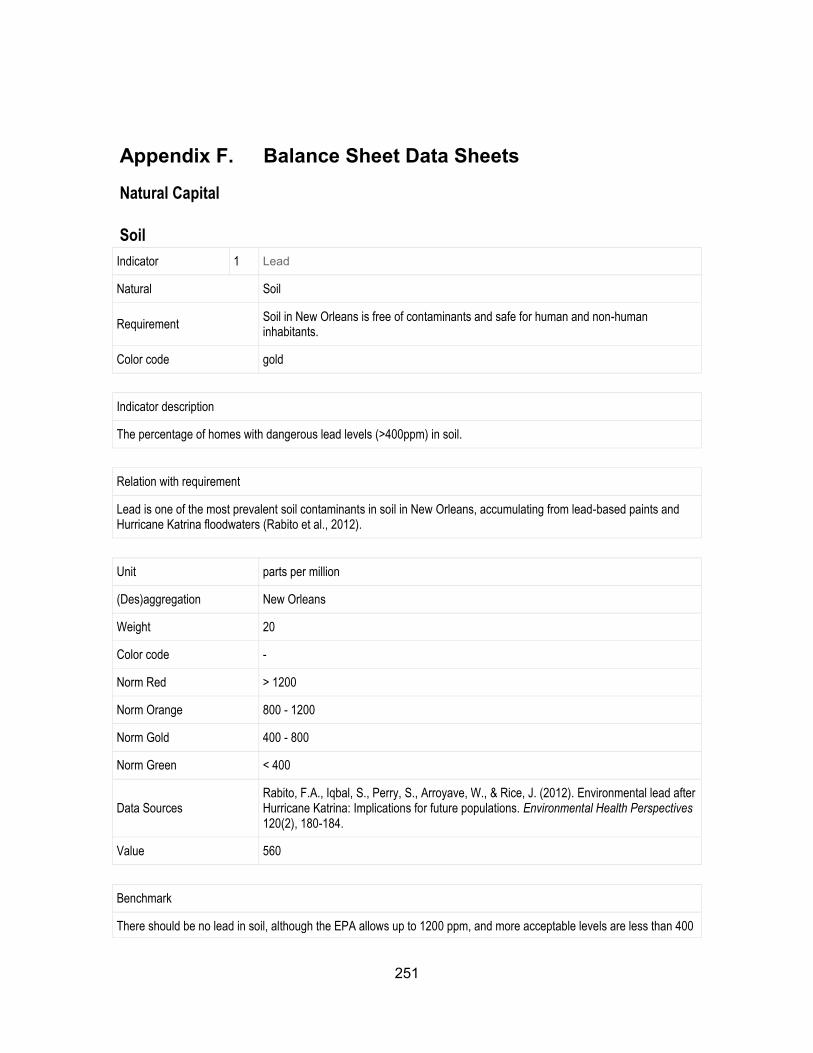
251
Appendix F. Balance Sheet Data Sheets
Natural Capital
Soil
Indicator 1 Lead
Natural Soil
Requirement Soil in New Orleans is free of contaminants and safe for human and non-human inhabitants.
Color code gold
Indicator description
The percentage of homes with dangerous lead levels (>400ppm) in soil.
Relation with requirement
Lead is one of the most prevalent soil contaminants in soil in New Orleans, accumulating from lead-based paints and Hurricane Katrina floodwaters (Rabito et al., 2012).
Unit parts per million
(Des)aggregation New Orleans
Weight 20
Color code -
Norm Red > 1200
Norm Orange 800 - 1200
Norm Gold 400 - 800
Norm Green < 400
Data Sources Rabito, F.A., Iqbal, S., Perry, S., Arroyave, W., & Rice, J. (2012). Environmental lead after Hurricane Katrina: Implications for future populations. Environmental Health Perspectives 120(2), 180-184.
Value 560
Benchmark
There should be no lead in soil, although the EPA allows up to 1200 ppm, and more acceptable levels are less than 400
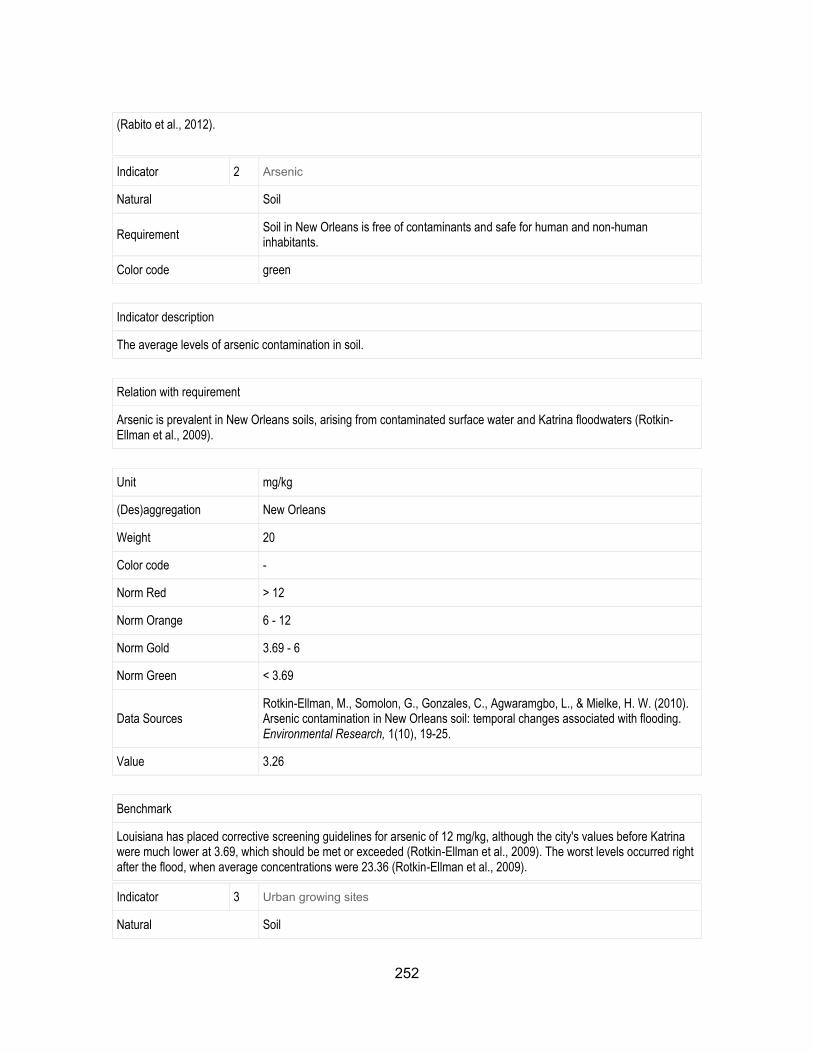
252
(Rabito et al., 2012).
Indicator 2 Arsenic
Natural Soil
Requirement Soil in New Orleans is free of contaminants and safe for human and non-human inhabitants.
Color code green
Indicator description
The average levels of arsenic contamination in soil.
Relation with requirement
Arsenic is prevalent in New Orleans soils, arising from contaminated surface water and Katrina floodwaters (Rotkin-Ellman et al., 2009).
Unit mg/kg
(Des)aggregation New Orleans
Weight 20
Color code -
Norm Red > 12
Norm Orange 6 - 12
Norm Gold 3.69 - 6
Norm Green < 3.69
Data Sources Rotkin-Ellman, M., Somolon, G., Gonzales, C., Agwaramgbo, L., & Mielke, H. W. (2010). Arsenic contamination in New Orleans soil: temporal changes associated with flooding. Environmental Research, 1(10), 19-25.
Value 3.26
Benchmark
Louisiana has placed corrective screening guidelines for arsenic of 12 mg/kg, although the city's values before Katrina were much lower at 3.69, which should be met or exceeded (Rotkin-Ellman et al., 2009). The worst levels occurred right after the flood, when average concentrations were 23.36 (Rotkin-Ellman et al., 2009).
Indicator 3 Urban growing sites
Natural Soil
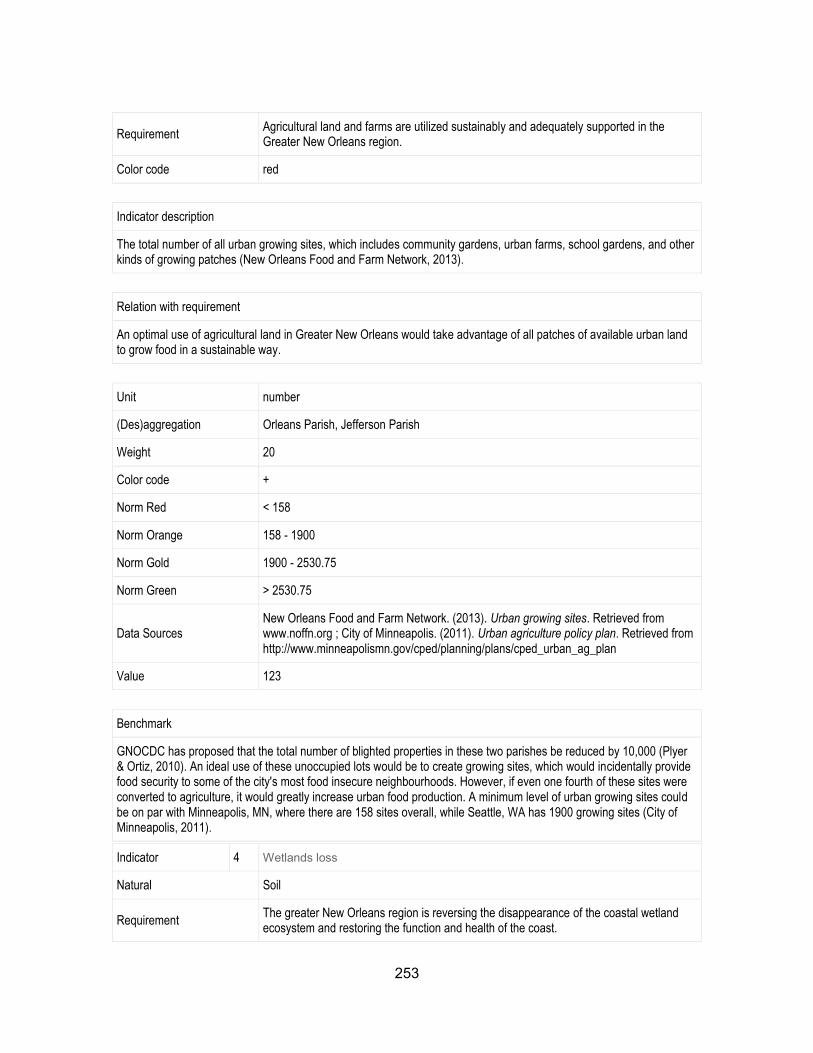
253
Requirement Agricultural land and farms are utilized sustainably and adequately supported in the Greater New Orleans region.
Color code red
Indicator description
The total number of all urban growing sites, which includes community gardens, urban farms, school gardens, and other kinds of growing patches (New Orleans Food and Farm Network, 2013).
Relation with requirement
An optimal use of agricultural land in Greater New Orleans would take advantage of all patches of available urban land to grow food in a sustainable way.
Unit number
(Des)aggregation Orleans Parish, Jefferson Parish
Weight 20
Color code +
Norm Red < 158
Norm Orange 158 - 1900
Norm Gold 1900 - 2530.75
Norm Green > 2530.75
Data Sources New Orleans Food and Farm Network. (2013). Urban growing sites. Retrieved from www.noffn.org ; City of Minneapolis. (2011). Urban agriculture policy plan. Retrieved from http://www.minneapolismn.gov/cped/planning/plans/cped_urban_ag_plan
Value 123
Benchmark
GNOCDC has proposed that the total number of blighted properties in these two parishes be reduced by 10,000 (Plyer & Ortiz, 2010). An ideal use of these unoccupied lots would be to create growing sites, which would incidentally provide food security to some of the city's most food insecure neighbourhoods. However, if even one fourth of these sites were converted to agriculture, it would greatly increase urban food production. A minimum level of urban growing sites could be on par with Minneapolis, MN, where there are 158 sites overall, while Seattle, WA has 1900 growing sites (City of Minneapolis, 2011).
Indicator 4 Wetlands loss
Natural Soil
Requirement The greater New Orleans region is reversing the disappearance of the coastal wetland ecosystem and restoring the function and health of the coast.
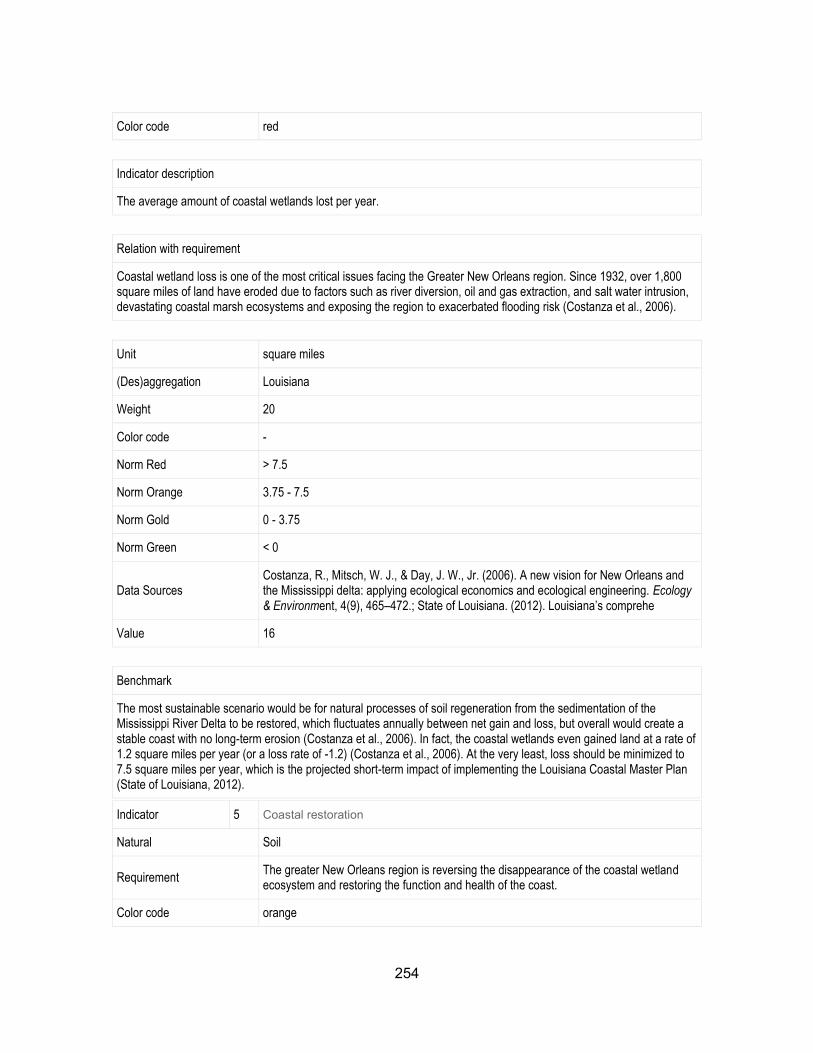
254
Color code red
Indicator description
The average amount of coastal wetlands lost per year.
Relation with requirement
Coastal wetland loss is one of the most critical issues facing the Greater New Orleans region. Since 1932, over 1,800 square miles of land have eroded due to factors such as river diversion, oil and gas extraction, and salt water intrusion, devastating coastal marsh ecosystems and exposing the region to exacerbated flooding risk (Costanza et al., 2006).
Unit square miles
(Des)aggregation Louisiana
Weight 20
Color code -
Norm Red > 7.5
Norm Orange 3.75 - 7.5
Norm Gold 0 - 3.75
Norm Green < 0
Data Sources Costanza, R., Mitsch, W. J., & Day, J. W., Jr. (2006). A new vision for New Orleans and the Mississippi delta: applying ecological economics and ecological engineering. Ecology & Environment, 4(9), 465–472.; State of Louisiana. (2012). Louisiana’s comprehe
Value 16
Benchmark
The most sustainable scenario would be for natural processes of soil regeneration from the sedimentation of the Mississippi River Delta to be restored, which fluctuates annually between net gain and loss, but overall would create a stable coast with no long-term erosion (Costanza et al., 2006). In fact, the coastal wetlands even gained land at a rate of 1.2 square miles per year (or a loss rate of -1.2) (Costanza et al., 2006). At the very least, loss should be minimized to 7.5 square miles per year, which is the projected short-term impact of implementing the Louisiana Coastal Master Plan (State of Louisiana, 2012).
Indicator 5 Coastal restoration
Natural Soil
Requirement The greater New Orleans region is reversing the disappearance of the coastal wetland ecosystem and restoring the function and health of the coast.
Color code orange
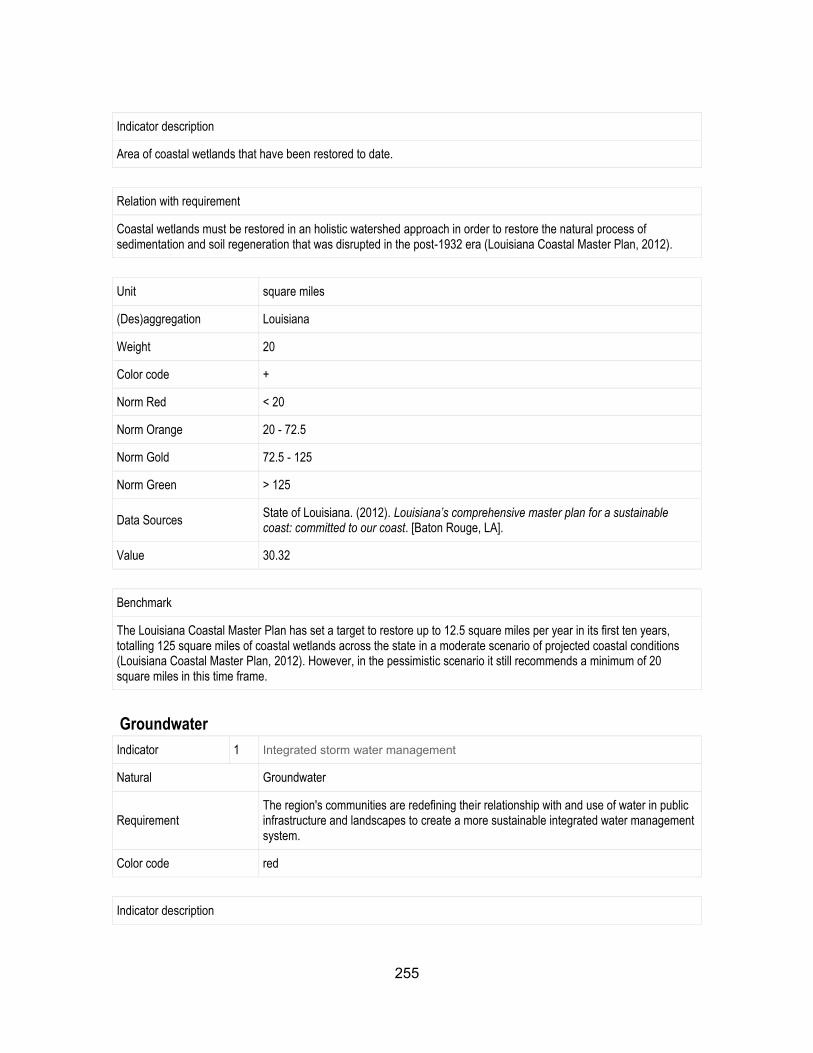
255
Indicator description
Area of coastal wetlands that have been restored to date.
Relation with requirement
Coastal wetlands must be restored in an holistic watershed approach in order to restore the natural process of sedimentation and soil regeneration that was disrupted in the post-1932 era (Louisiana Coastal Master Plan, 2012).
Unit square miles
(Des)aggregation Louisiana
Weight 20
Color code +
Norm Red < 20
Norm Orange 20 - 72.5
Norm Gold 72.5 - 125
Norm Green > 125
Data Sources State of Louisiana. (2012). Louisiana’s comprehensive master plan for a sustainable coast: committed to our coast. [Baton Rouge, LA].
Value 30.32
Benchmark
The Louisiana Coastal Master Plan has set a target to restore up to 12.5 square miles per year in its first ten years, totalling 125 square miles of coastal wetlands across the state in a moderate scenario of projected coastal conditions (Louisiana Coastal Master Plan, 2012). However, in the pessimistic scenario it still recommends a minimum of 20 square miles in this time frame.
Groundwater
Indicator 1 Integrated storm water management
Natural Groundwater
Requirement The region's communities are redefining their relationship with and use of water in public infrastructure and landscapes to create a more sustainable integrated water management system.
Color code red
Indicator description
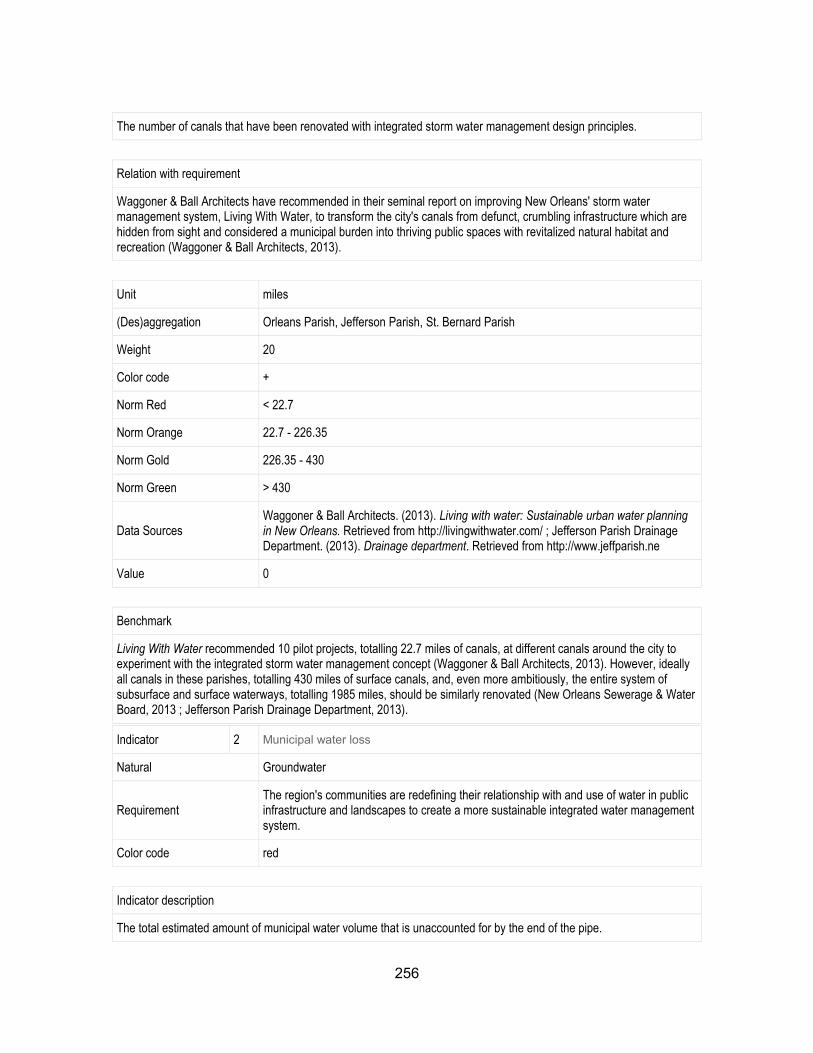
256
The number of canals that have been renovated with integrated storm water management design principles.
Relation with requirement
Waggoner & Ball Architects have recommended in their seminal report on improving New Orleans' storm water management system, Living With Water, to transform the city's canals from defunct, crumbling infrastructure which are hidden from sight and considered a municipal burden into thriving public spaces with revitalized natural habitat and recreation (Waggoner & Ball Architects, 2013).
Unit miles
(Des)aggregation Orleans Parish, Jefferson Parish, St. Bernard Parish
Weight 20
Color code +
Norm Red < 22.7
Norm Orange 22.7 - 226.35
Norm Gold 226.35 - 430
Norm Green > 430
Data Sources Waggoner & Ball Architects. (2013). Living with water: Sustainable urban water planning in New Orleans. Retrieved from http://livingwithwater.com/ ; Jefferson Parish Drainage Department. (2013). Drainage department. Retrieved from http://www.jeffparish.ne
Value 0
Benchmark
Living With Water recommended 10 pilot projects, totalling 22.7 miles of canals, at different canals around the city to experiment with the integrated storm water management concept (Waggoner & Ball Architects, 2013). However, ideally all canals in these parishes, totalling 430 miles of surface canals, and, even more ambitiously, the entire system of subsurface and surface waterways, totalling 1985 miles, should be similarly renovated (New Orleans Sewerage & Water Board, 2013 ; Jefferson Parish Drainage Department, 2013).
Indicator 2 Municipal water loss
Natural Groundwater
Requirement The region's communities are redefining their relationship with and use of water in public infrastructure and landscapes to create a more sustainable integrated water management system.
Color code red
Indicator description
The total estimated amount of municipal water volume that is unaccounted for by the end of the pipe.
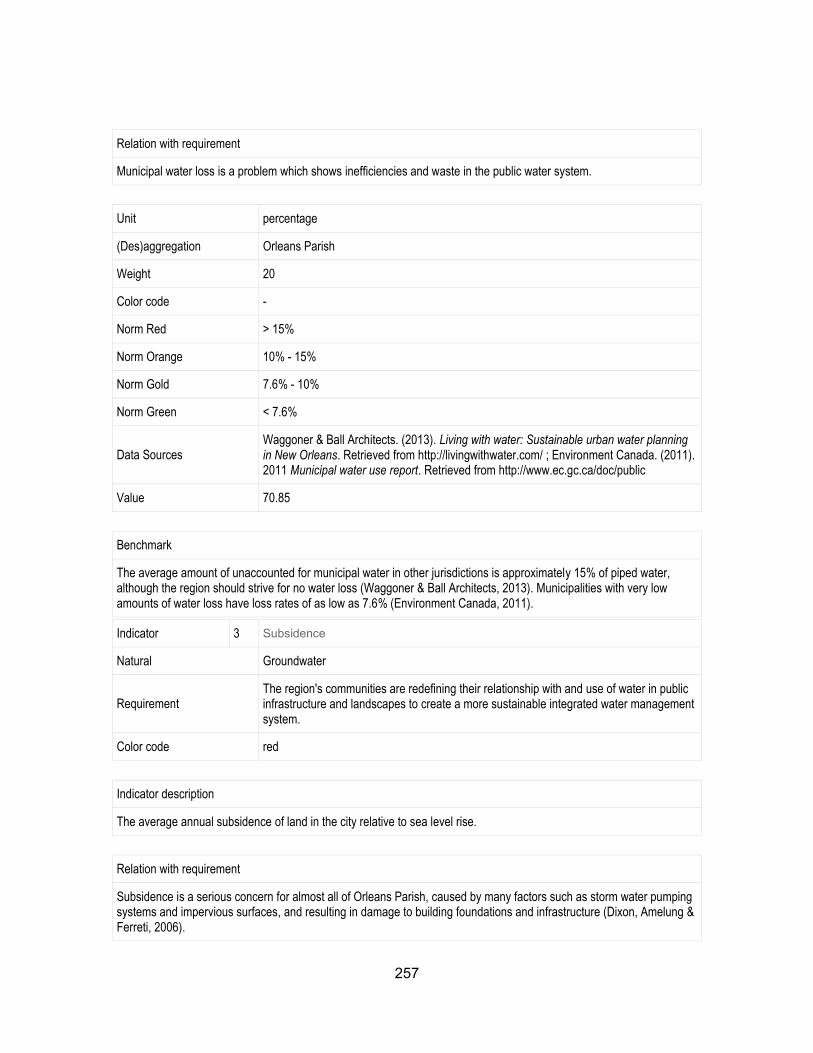
257
Relation with requirement
Municipal water loss is a problem which shows inefficiencies and waste in the public water system.
Unit percentage
(Des)aggregation Orleans Parish
Weight 20
Color code -
Norm Red > 15%
Norm Orange 10% - 15%
Norm Gold 7.6% - 10%
Norm Green < 7.6%
Data Sources Waggoner & Ball Architects. (2013). Living with water: Sustainable urban water planning in New Orleans. Retrieved from http://livingwithwater.com/ ; Environment Canada. (2011). 2011 Municipal water use report. Retrieved from http://www.ec.gc.ca/doc/public
Value 70.85
Benchmark
The average amount of unaccounted for municipal water in other jurisdictions is approximately 15% of piped water, although the region should strive for no water loss (Waggoner & Ball Architects, 2013). Municipalities with very low amounts of water loss have loss rates of as low as 7.6% (Environment Canada, 2011).
Indicator 3 Subsidence
Natural Groundwater
Requirement The region's communities are redefining their relationship with and use of water in public infrastructure and landscapes to create a more sustainable integrated water management system.
Color code red
Indicator description
The average annual subsidence of land in the city relative to sea level rise.
Relation with requirement
Subsidence is a serious concern for almost all of Orleans Parish, caused by many factors such as storm water pumping systems and impervious surfaces, and resulting in damage to building foundations and infrastructure (Dixon, Amelung & Ferreti, 2006).
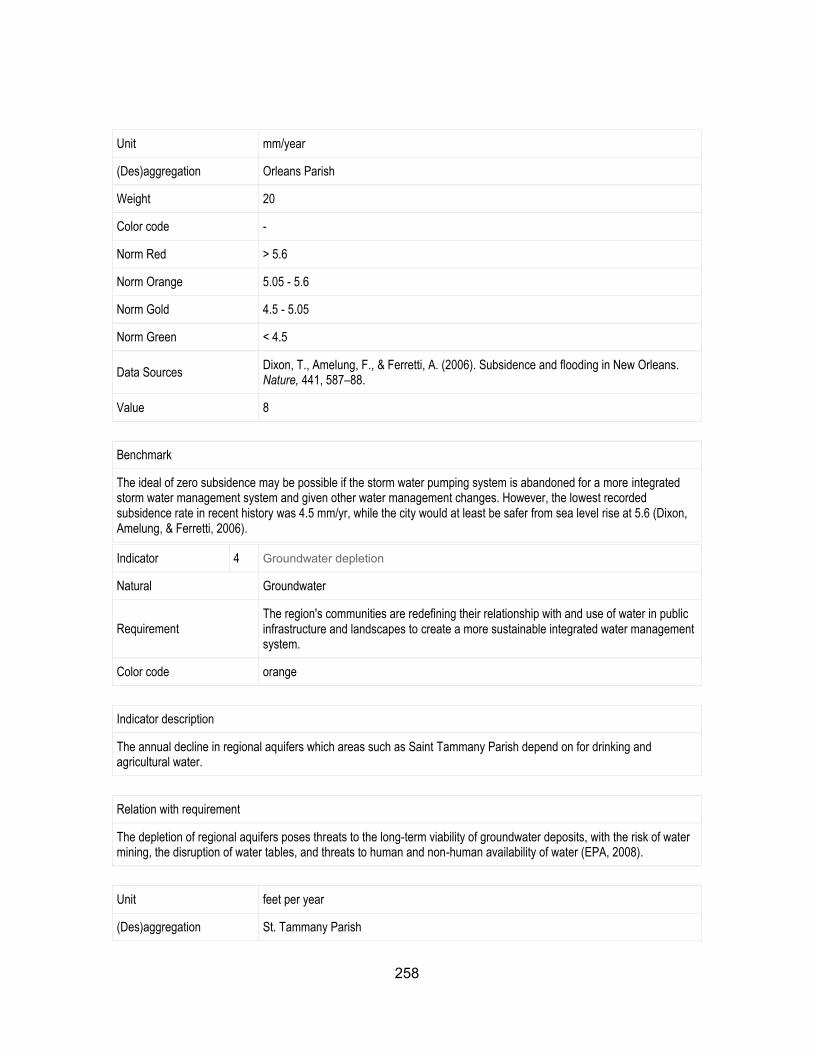
258
Unit mm/year
(Des)aggregation Orleans Parish
Weight 20
Color code -
Norm Red > 5.6
Norm Orange 5.05 - 5.6
Norm Gold 4.5 - 5.05
Norm Green < 4.5
Data Sources Dixon, T., Amelung, F., & Ferretti, A. (2006). Subsidence and flooding in New Orleans. Nature, 441, 587–88.
Value 8
Benchmark
The ideal of zero subsidence may be possible if the storm water pumping system is abandoned for a more integrated storm water management system and given other water management changes. However, the lowest recorded subsidence rate in recent history was 4.5 mm/yr, while the city would at least be safer from sea level rise at 5.6 (Dixon, Amelung, & Ferretti, 2006).
Indicator 4 Groundwater depletion
Natural Groundwater
Requirement The region's communities are redefining their relationship with and use of water in public infrastructure and landscapes to create a more sustainable integrated water management system.
Color code orange
Indicator description
The annual decline in regional aquifers which areas such as Saint Tammany Parish depend on for drinking and agricultural water.
Relation with requirement
The depletion of regional aquifers poses threats to the long-term viability of groundwater deposits, with the risk of water mining, the disruption of water tables, and threats to human and non-human availability of water (EPA, 2008).
Unit feet per year
(Des)aggregation St. Tammany Parish
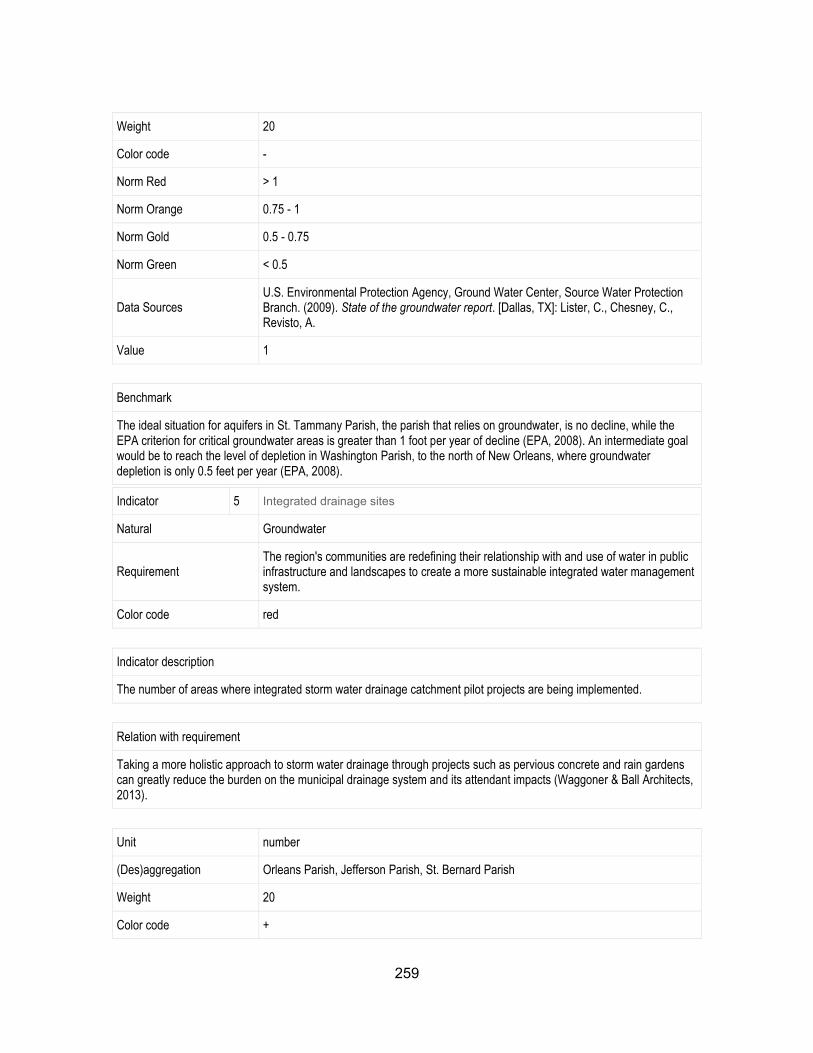
259
Weight 20
Color code -
Norm Red > 1
Norm Orange 0.75 - 1
Norm Gold 0.5 - 0.75
Norm Green < 0.5
Data Sources U.S. Environmental Protection Agency, Ground Water Center, Source Water Protection Branch. (2009). State of the groundwater report. [Dallas, TX]: Lister, C., Chesney, C., Revisto, A.
Value 1
Benchmark
The ideal situation for aquifers in St. Tammany Parish, the parish that relies on groundwater, is no decline, while the EPA criterion for critical groundwater areas is greater than 1 foot per year of decline (EPA, 2008). An intermediate goal would be to reach the level of depletion in Washington Parish, to the north of New Orleans, where groundwater depletion is only 0.5 feet per year (EPA, 2008).
Indicator 5 Integrated drainage sites
Natural Groundwater
Requirement The region's communities are redefining their relationship with and use of water in public infrastructure and landscapes to create a more sustainable integrated water management system.
Color code red
Indicator description
The number of areas where integrated storm water drainage catchment pilot projects are being implemented.
Relation with requirement
Taking a more holistic approach to storm water drainage through projects such as pervious concrete and rain gardens can greatly reduce the burden on the municipal drainage system and its attendant impacts (Waggoner & Ball Architects, 2013).
Unit number
(Des)aggregation Orleans Parish, Jefferson Parish, St. Bernard Parish
Weight 20
Color code +
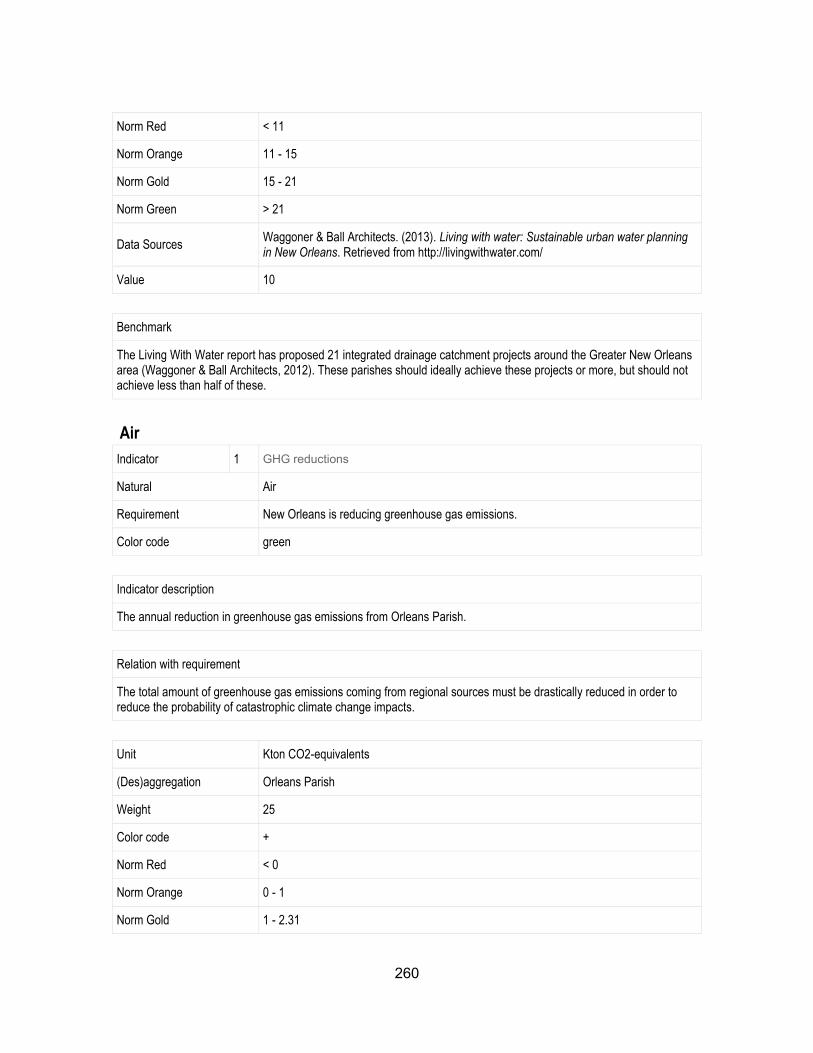
260
Norm Red < 11
Norm Orange 11 - 15
Norm Gold 15 - 21
Norm Green > 21
Data Sources Waggoner & Ball Architects. (2013). Living with water: Sustainable urban water planning in New Orleans. Retrieved from http://livingwithwater.com/
Value 10
Benchmark
The Living With Water report has proposed 21 integrated drainage catchment projects around the Greater New Orleans area (Waggoner & Ball Architects, 2012). These parishes should ideally achieve these projects or more, but should not achieve less than half of these.
Air
Indicator 1 GHG reductions
Natural Air
Requirement New Orleans is reducing greenhouse gas emissions.
Color code green
Indicator description
The annual reduction in greenhouse gas emissions from Orleans Parish.
Relation with requirement
The total amount of greenhouse gas emissions coming from regional sources must be drastically reduced in order to reduce the probability of catastrophic climate change impacts.
Unit Kton CO2-equivalents
(Des)aggregation Orleans Parish
Weight 25
Color code +
Norm Red < 0
Norm Orange 0 - 1
Norm Gold 1 - 2.31
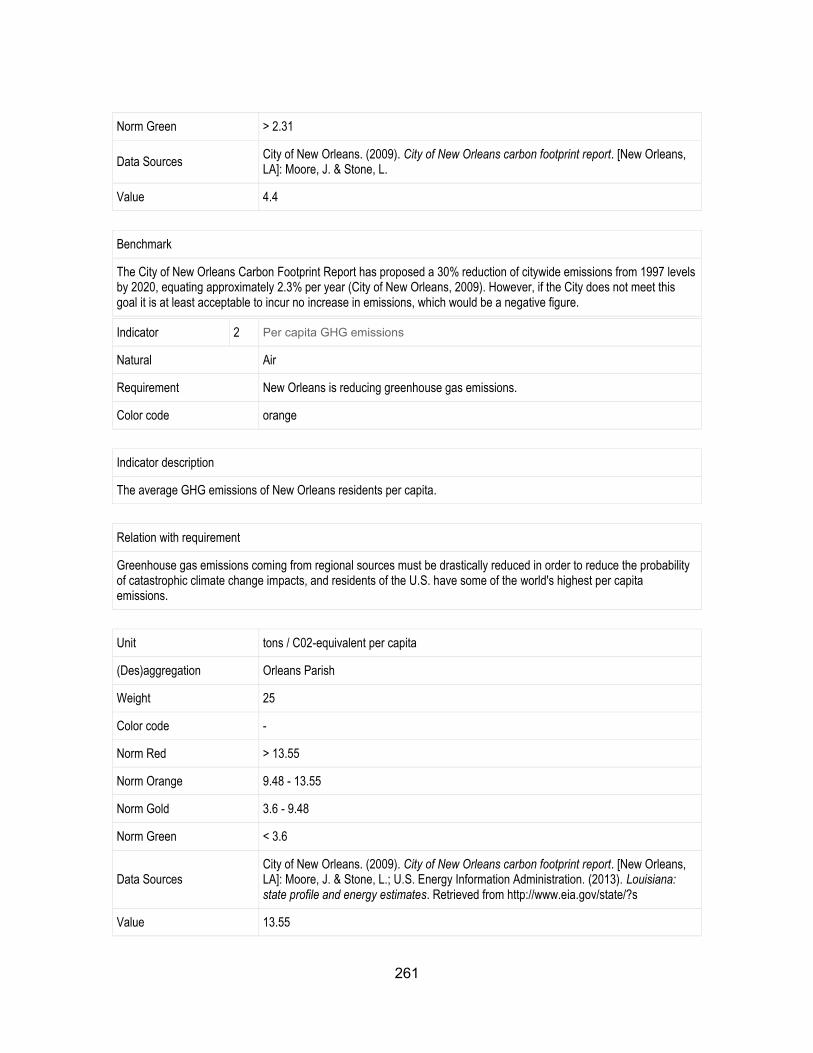
261
Norm Green > 2.31
Data Sources City of New Orleans. (2009). City of New Orleans carbon footprint report. [New Orleans, LA]: Moore, J. & Stone, L.
Value 4.4
Benchmark
The City of New Orleans Carbon Footprint Report has proposed a 30% reduction of citywide emissions from 1997 levels by 2020, equating approximately 2.3% per year (City of New Orleans, 2009). However, if the City does not meet this goal it is at least acceptable to incur no increase in emissions, which would be a negative figure.
Indicator 2 Per capita GHG emissions
Natural Air
Requirement New Orleans is reducing greenhouse gas emissions.
Color code orange
Indicator description
The average GHG emissions of New Orleans residents per capita.
Relation with requirement
Greenhouse gas emissions coming from regional sources must be drastically reduced in order to reduce the probability of catastrophic climate change impacts, and residents of the U.S. have some of the world's highest per capita emissions.
Unit tons / C02-equivalent per capita
(Des)aggregation Orleans Parish
Weight 25
Color code -
Norm Red > 13.55
Norm Orange 9.48 - 13.55
Norm Gold 3.6 - 9.48
Norm Green < 3.6
Data Sources City of New Orleans. (2009). City of New Orleans carbon footprint report. [New Orleans, LA]: Moore, J. & Stone, L.; U.S. Energy Information Administration. (2013). Louisiana: state profile and energy estimates. Retrieved from http://www.eia.gov/state/?s
Value 13.55
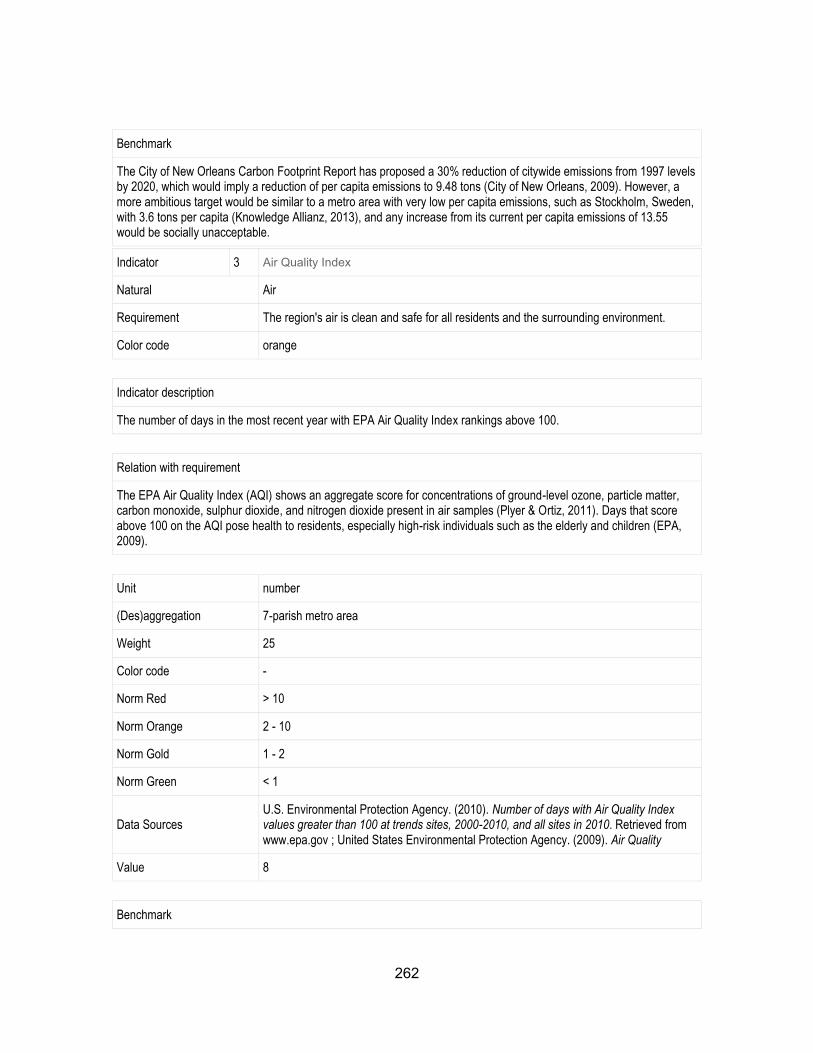
262
Benchmark
The City of New Orleans Carbon Footprint Report has proposed a 30% reduction of citywide emissions from 1997 levels by 2020, which would imply a reduction of per capita emissions to 9.48 tons (City of New Orleans, 2009). However, a more ambitious target would be similar to a metro area with very low per capita emissions, such as Stockholm, Sweden, with 3.6 tons per capita (Knowledge Allianz, 2013), and any increase from its current per capita emissions of 13.55 would be socially unacceptable.
Indicator 3 Air Quality Index
Natural Air
Requirement The region's air is clean and safe for all residents and the surrounding environment.
Color code orange
Indicator description
The number of days in the most recent year with EPA Air Quality Index rankings above 100.
Relation with requirement
The EPA Air Quality Index (AQI) shows an aggregate score for concentrations of ground-level ozone, particle matter, carbon monoxide, sulphur dioxide, and nitrogen dioxide present in air samples (Plyer & Ortiz, 2011). Days that score above 100 on the AQI pose health to residents, especially high-risk individuals such as the elderly and children (EPA, 2009).
Unit number
(Des)aggregation 7-parish metro area
Weight 25
Color code -
Norm Red > 10
Norm Orange 2 - 10
Norm Gold 1 - 2
Norm Green < 1
Data Sources U.S. Environmental Protection Agency. (2010). Number of days with Air Quality Index values greater than 100 at trends sites, 2000-2010, and all sites in 2010. Retrieved from www.epa.gov ; United States Environmental Protection Agency. (2009). Air Quality
Value 8
Benchmark
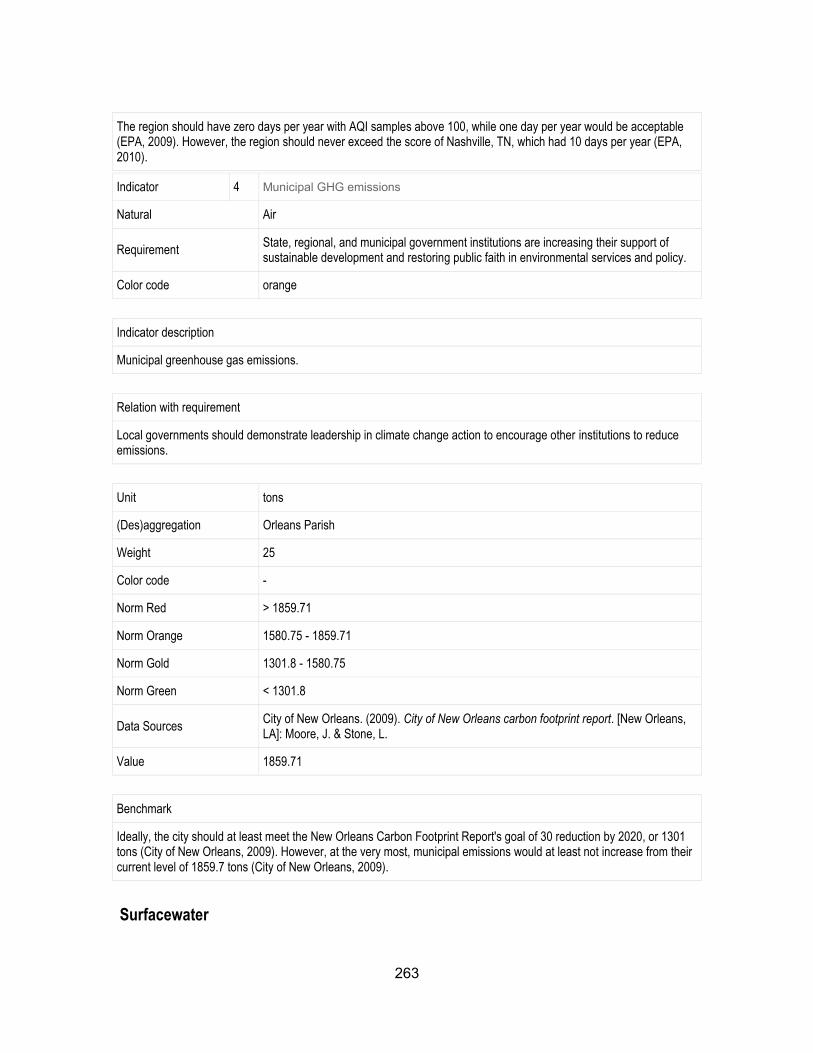
263
The region should have zero days per year with AQI samples above 100, while one day per year would be acceptable (EPA, 2009). However, the region should never exceed the score of Nashville, TN, which had 10 days per year (EPA, 2010).
Indicator 4 Municipal GHG emissions
Natural Air
Requirement State, regional, and municipal government institutions are increasing their support of sustainable development and restoring public faith in environmental services and policy.
Color code orange
Indicator description
Municipal greenhouse gas emissions.
Relation with requirement
Local governments should demonstrate leadership in climate change action to encourage other institutions to reduce emissions.
Unit tons
(Des)aggregation Orleans Parish
Weight 25
Color code -
Norm Red > 1859.71
Norm Orange 1580.75 - 1859.71
Norm Gold 1301.8 - 1580.75
Norm Green < 1301.8
Data Sources City of New Orleans. (2009). City of New Orleans carbon footprint report. [New Orleans, LA]: Moore, J. & Stone, L.
Value 1859.71
Benchmark
Ideally, the city should at least meet the New Orleans Carbon Footprint Report's goal of 30 reduction by 2020, or 1301 tons (City of New Orleans, 2009). However, at the very most, municipal emissions would at least not increase from their current level of 1859.7 tons (City of New Orleans, 2009).
Surfacewater
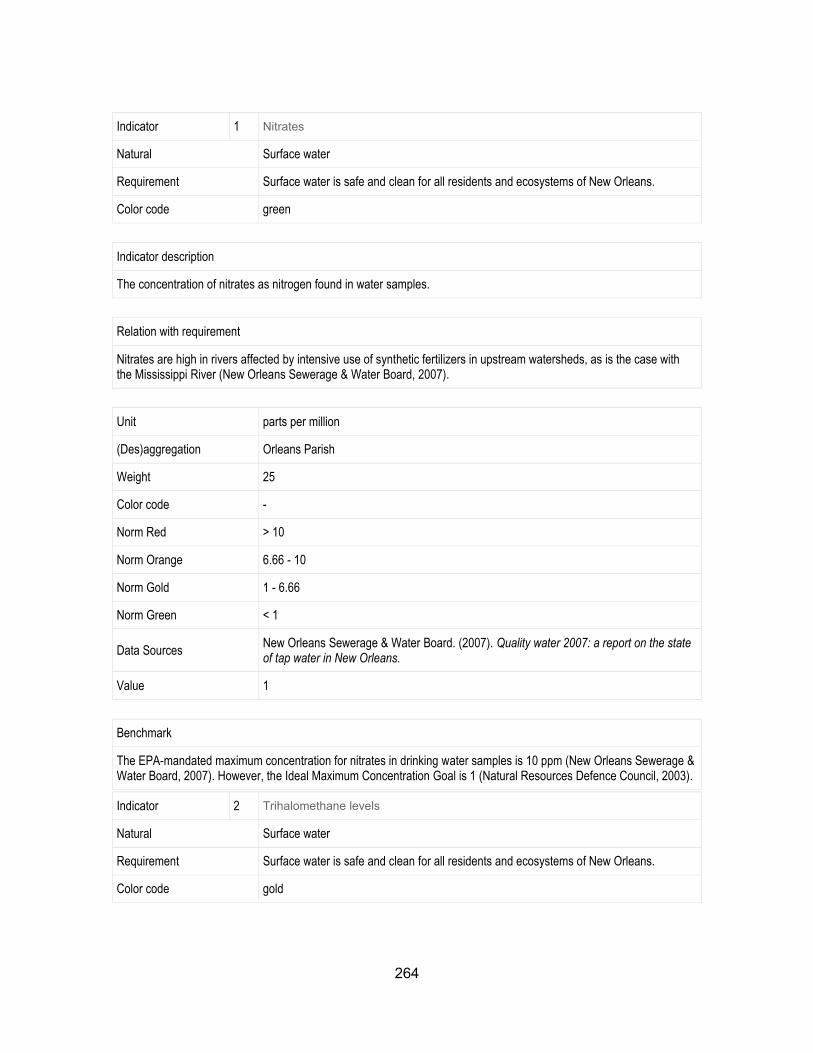
264
Indicator 1 Nitrates
Natural Surface water
Requirement Surface water is safe and clean for all residents and ecosystems of New Orleans.
Color code green
Indicator description
The concentration of nitrates as nitrogen found in water samples.
Relation with requirement
Nitrates are high in rivers affected by intensive use of synthetic fertilizers in upstream watersheds, as is the case with the Mississippi River (New Orleans Sewerage & Water Board, 2007).
Unit parts per million
(Des)aggregation Orleans Parish
Weight 25
Color code -
Norm Red > 10
Norm Orange 6.66 - 10
Norm Gold 1 - 6.66
Norm Green < 1
Data Sources New Orleans Sewerage & Water Board. (2007). Quality water 2007: a report on the state of tap water in New Orleans.
Value 1
Benchmark
The EPA-mandated maximum concentration for nitrates in drinking water samples is 10 ppm (New Orleans Sewerage & Water Board, 2007). However, the Ideal Maximum Concentration Goal is 1 (Natural Resources Defence Council, 2003).
Indicator 2 Trihalomethane levels
Natural Surface water
Requirement Surface water is safe and clean for all residents and ecosystems of New Orleans.
Color code gold
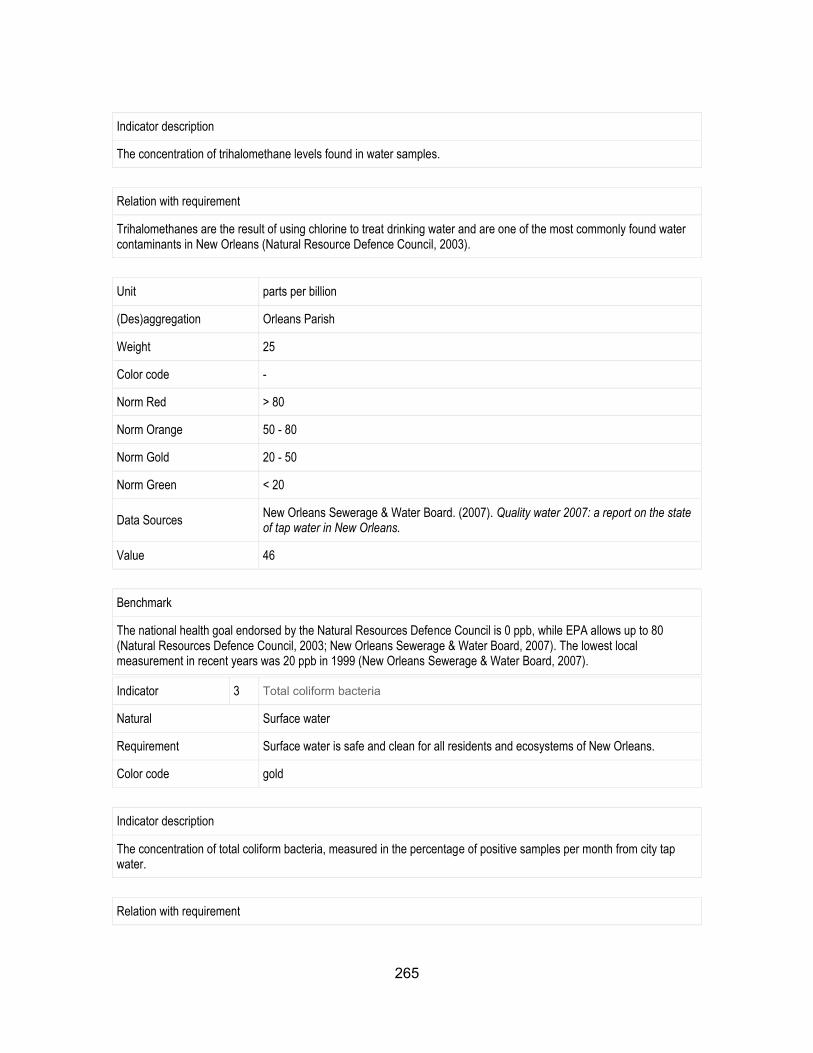
265
Indicator description
The concentration of trihalomethane levels found in water samples.
Relation with requirement
Trihalomethanes are the result of using chlorine to treat drinking water and are one of the most commonly found water contaminants in New Orleans (Natural Resource Defence Council, 2003).
Unit parts per billion
(Des)aggregation Orleans Parish
Weight 25
Color code -
Norm Red > 80
Norm Orange 50 - 80
Norm Gold 20 - 50
Norm Green < 20
Data Sources New Orleans Sewerage & Water Board. (2007). Quality water 2007: a report on the state of tap water in New Orleans.
Value 46
Benchmark
The national health goal endorsed by the Natural Resources Defence Council is 0 ppb, while EPA allows up to 80 (Natural Resources Defence Council, 2003; New Orleans Sewerage & Water Board, 2007). The lowest local measurement in recent years was 20 ppb in 1999 (New Orleans Sewerage & Water Board, 2007).
Indicator 3 Total coliform bacteria
Natural Surface water
Requirement Surface water is safe and clean for all residents and ecosystems of New Orleans.
Color code gold
Indicator description
The concentration of total coliform bacteria, measured in the percentage of positive samples per month from city tap water.
Relation with requirement
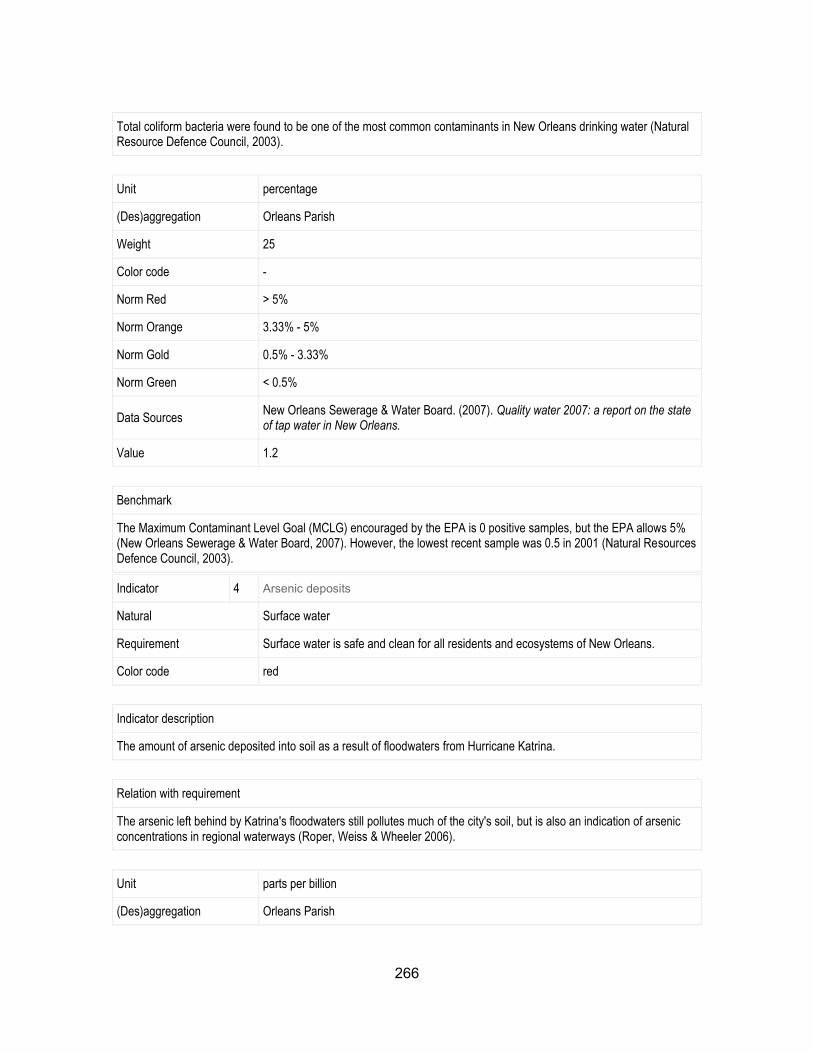
266
Total coliform bacteria were found to be one of the most common contaminants in New Orleans drinking water (Natural Resource Defence Council, 2003).
Unit percentage
(Des)aggregation Orleans Parish
Weight 25
Color code -
Norm Red > 5%
Norm Orange 3.33% - 5%
Norm Gold 0.5% - 3.33%
Norm Green < 0.5%
Data Sources New Orleans Sewerage & Water Board. (2007). Quality water 2007: a report on the state of tap water in New Orleans.
Value 1.2
Benchmark
The Maximum Contaminant Level Goal (MCLG) encouraged by the EPA is 0 positive samples, but the EPA allows 5% (New Orleans Sewerage & Water Board, 2007). However, the lowest recent sample was 0.5 in 2001 (Natural Resources Defence Council, 2003).
Indicator 4 Arsenic deposits
Natural Surface water
Requirement Surface water is safe and clean for all residents and ecosystems of New Orleans.
Color code red
Indicator description
The amount of arsenic deposited into soil as a result of floodwaters from Hurricane Katrina.
Relation with requirement
The arsenic left behind by Katrina's floodwaters still pollutes much of the city's soil, but is also an indication of arsenic concentrations in regional waterways (Roper, Weiss & Wheeler 2006).
Unit parts per billion
(Des)aggregation Orleans Parish
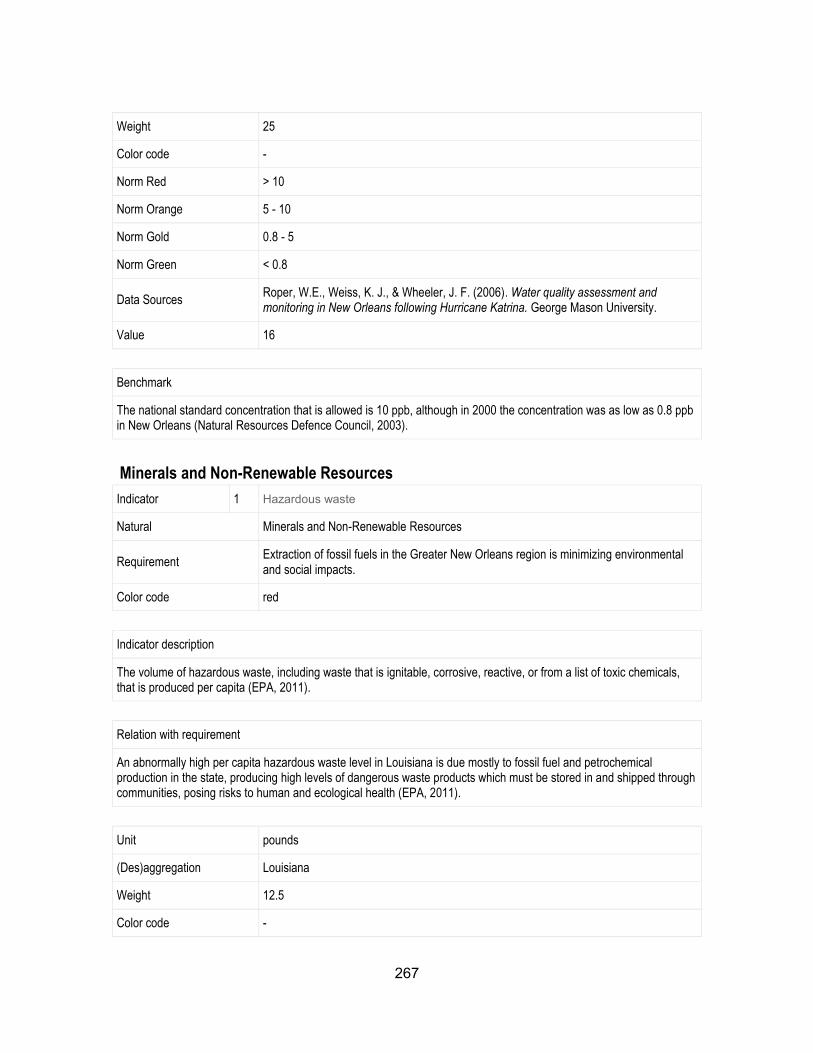
267
Weight 25
Color code -
Norm Red > 10
Norm Orange 5 - 10
Norm Gold 0.8 - 5
Norm Green < 0.8
Data Sources Roper, W.E., Weiss, K. J., & Wheeler, J. F. (2006). Water quality assessment and monitoring in New Orleans following Hurricane Katrina. George Mason University.
Value 16
Benchmark
The national standard concentration that is allowed is 10 ppb, although in 2000 the concentration was as low as 0.8 ppb in New Orleans (Natural Resources Defence Council, 2003).
Minerals and Non-Renewable Resources
Indicator 1 Hazardous waste
Natural Minerals and Non-Renewable Resources
Requirement Extraction of fossil fuels in the Greater New Orleans region is minimizing environmental and social impacts.
Color code red
Indicator description
The volume of hazardous waste, including waste that is ignitable, corrosive, reactive, or from a list of toxic chemicals, that is produced per capita (EPA, 2011).
Relation with requirement
An abnormally high per capita hazardous waste level in Louisiana is due mostly to fossil fuel and petrochemical production in the state, producing high levels of dangerous waste products which must be stored in and shipped through communities, posing risks to human and ecological health (EPA, 2011).
Unit pounds
(Des)aggregation Louisiana
Weight 12.5
Color code -
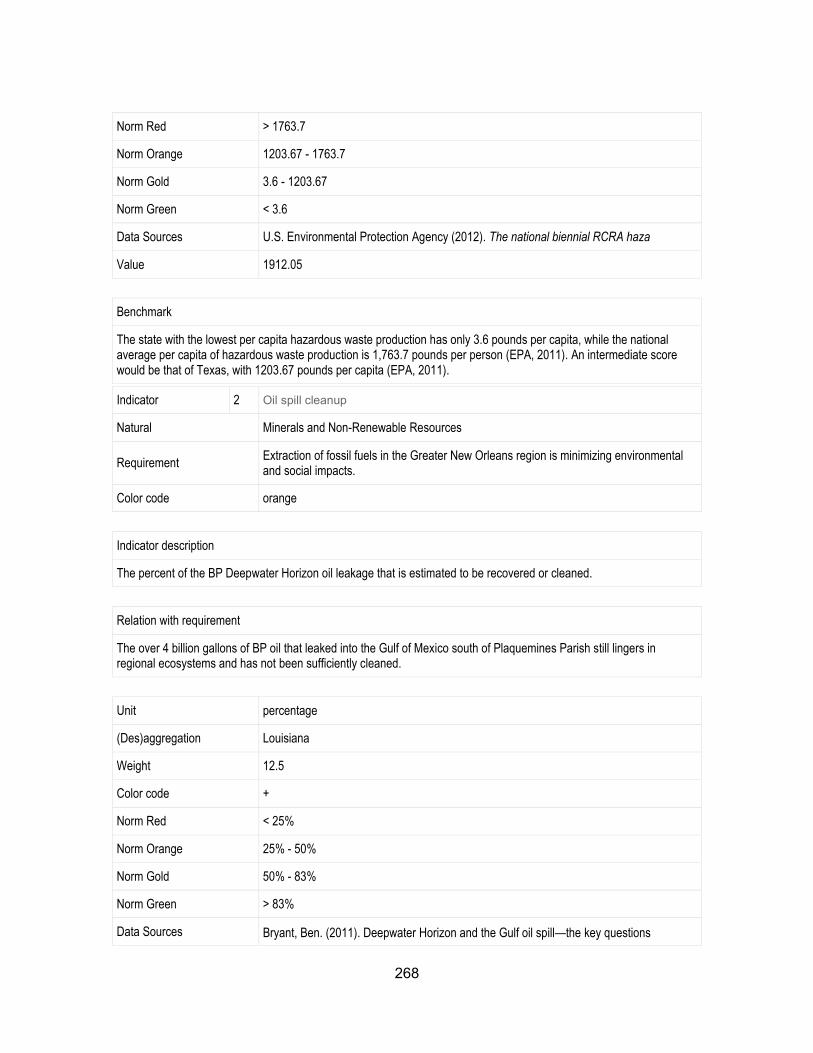
268
Norm Red > 1763.7
Norm Orange 1203.67 - 1763.7
Norm Gold 3.6 - 1203.67
Norm Green < 3.6
Data Sources U.S. Environmental Protection Agency (2012). The national biennial RCRA haza
Value 1912.05
Benchmark
The state with the lowest per capita hazardous waste production has only 3.6 pounds per capita, while the national average per capita of hazardous waste production is 1,763.7 pounds per person (EPA, 2011). An intermediate score would be that of Texas, with 1203.67 pounds per capita (EPA, 2011).
Indicator 2 Oil spill cleanup
Natural Minerals and Non-Renewable Resources
Requirement Extraction of fossil fuels in the Greater New Orleans region is minimizing environmental and social impacts.
Color code orange
Indicator description
The percent of the BP Deepwater Horizon oil leakage that is estimated to be recovered or cleaned.
Relation with requirement
The over 4 billion gallons of BP oil that leaked into the Gulf of Mexico south of Plaquemines Parish still lingers in regional ecosystems and has not been sufficiently cleaned.
Unit percentage
(Des)aggregation Louisiana
Weight 12.5
Color code +
Norm Red < 25%
Norm Orange 25% - 50%
Norm Gold 50% - 83%
Norm Green > 83%
Data Sources Bryant, Ben. (2011). Deepwater Horizon and the Gulf oil spill—the key questions
269
answered. The Guardian. Retrieved from http://www.guardian.co.uk/environment/2011/apr/20/deepwater-horizon-key-questions-answered
Value 41
Benchmark
The total amount of recoverable oil that was spilled, which is estimated to be approximately 83% of the spillage, should ideally be collected (Bryant, 2011). However, no less than 25% should be collected to be acceptable.
Indicator 3 Oil production
Natural Minerals and Non-Renewable Resources
Requirement The New Orleans region is reducing the exploitation of non-renewable resources.
Color code green
Indicator description
The average annual percent change in oil production from Louisiana over the past decade (2002-2012) .
Relation with requirement
Oil production contributes to the further depletion of the region's non-renewable resources as well as the production of hazardous wastes from its manufacture, and prevents necessary GHG reductions. Oil production should decrease and although its decrease is not necessarily a sign of deliberate policies to shift to renewable energy, potentially reflecting decreasing demand due to price hikes or other economic changes, it should decrease as long as the resulting job losses are compensated for in new sector employment (see indicator I50).
Unit average percent change per decade
(Des)aggregation Louisiana
Weight 12.5
Color code -
Norm Red > 0
Norm Orange -1 - 0
Norm Gold -1.67 - -1
Norm Green < -1.67
Data Sources U.S. Energy Information Administration. (2013). Louisiana field production of crude oil. Retrieved from http://www.eia.gov/dnav/pet/hist/LeafHandler.ashx?n=PET&s=MCRFPLA1&f=A
Value -2.42
270
Benchmark
In order for New Orleans to meet its greenhouse gas reduction targets, oil production should be reduced by 30% by 2030, or a reduction of 1.67% per year state-wide. Although totally eliminating oil production would be ecologically optimal, its economic impacts would be too severe, resulting in a need for any job losses to be replaced in new sectors. However, the oil sector should at least not begin to grow, which would be a negative figure for this indicator.
Indicator 4 Recycling per capita
Natural Minerals and Non-Renewable Resources
Requirement The waste stream of New Orleans is being reduced and diverted to an increasingly large proportion of recycling and reuse that is accessible to the public.
Color code green
Indicator description
The total weight, in pounds, of recyclable material collected per capita per year.
Relation with requirement
The amount of recycled material per capita should increase with the expansion of recycling service to reduce the overall waste stream.
Unit pounds
(Des)aggregation Orleans Parish
Weight 12.5
Color code +
Norm Red < 21.1
Norm Orange 21.1 - 28
Norm Gold 28 - 34.9
Norm Green > 34.9
Data Sources City of New Orleans, ResultsNOLA. (2012). 2012 Year end report. [New Orleans, LA].
Value 35.7
Benchmark
The city should meet or beat the ResultsNOLA target for 2012 of 34.9 pounds of recycling per capita (6000 tons), although at the very least recycling should not drop below the 2011 level of 21.1 pounds per capita (ResultsNOLA, 2012). However, ideally recycling would increase to 3726.13 pounds per capita, which is the amount of garbage created by the city annually (City of New Orleans, 2010).
271
Indicator 5 Recycling service
Natural Minerals and Non-Renewable Resources
Requirement The waste stream of New Orleans is being reduced and diverted to an increasingly large proportion of recycling and reuse that is accessible to the public.
Color code red
Indicator description
The percentage of residents with regular recycling service.
Relation with requirement
Curbside recycling service, which were not reinstated until four years after Hurricane Katrina in Orleans Parish and many parishes still do not have, is the main way that residents can access recycling to reduce the waste stream.
Unit percentage
(Des)aggregation 7-parish metro area
Weight 12.5
Color code +
Norm Red < 50%
Norm Orange 50% - 70%
Norm Gold 70% - 90%
Norm Green > 90%
Data Sources City of New Orleans. (2013). Retrieved from http://new.nola.gov/home/ ; City of Covington. (2013). Retrieved from http://covla.com/ ; Metairie, LA. (2013). Retrieved from http://welcometo.metairie.com/ ; City of Mandeville. (2013). Retrieved from http://
Value 41.91
Benchmark
All residents within the metropolitan area should have access to curbside recycling services, although no fewer than half of the region's residents would have recycling services. However, if at least 90% of residents have recycling services, the indicator would be in good condition.
Indicator 6 Energy use per capita
Natural Minerals and Non-Renewable Resources
Requirement The energy system is becoming more efficient and reducing the waste of energy through an integrated process of planning and legislating energy conservation.
272
Color code orange
Indicator description
The average amount of energy used per resident.
Relation with requirement
One of the main ways to reduce energy waste is to promote reduced per capita energy use through energy efficiency.
Unit BTUs
(Des)aggregation Louisiana
Weight 12.5
Color code -
Norm Red > 948
Norm Orange 786.9 - 948
Norm Gold 625.8 - 786.9
Norm Green < 625.8
Data Sources U.S. Energy Information Administration. (2013). Louisiana: state profile and energy estimates. Retrieved from http://www.eia.gov/state/?sid=LA
Value 894
Benchmark
The Carbon Footprint Report set out to reduce greenhouse gas emissions by 30% by 2020, which would imply per capita energy reduction to 625.8 BTUs per person (City of New Orleans, 2009). However, energy use per capita should at least stay below the worst performing state's value of 948 BTUs per capita, and would ideally reach the highest-performing state's consumption of 187 (Energy Information Administration, 2013).
Indicator 7 Energy conservation
Natural Minerals and Non-Renewable Resources
Requirement The energy system is becoming more efficient and reducing the waste of energy through an integrated process of planning and legislating energy conservation.
Color code green
Indicator description
The amount of electricity saved through the Energy Smart program in year 2011.
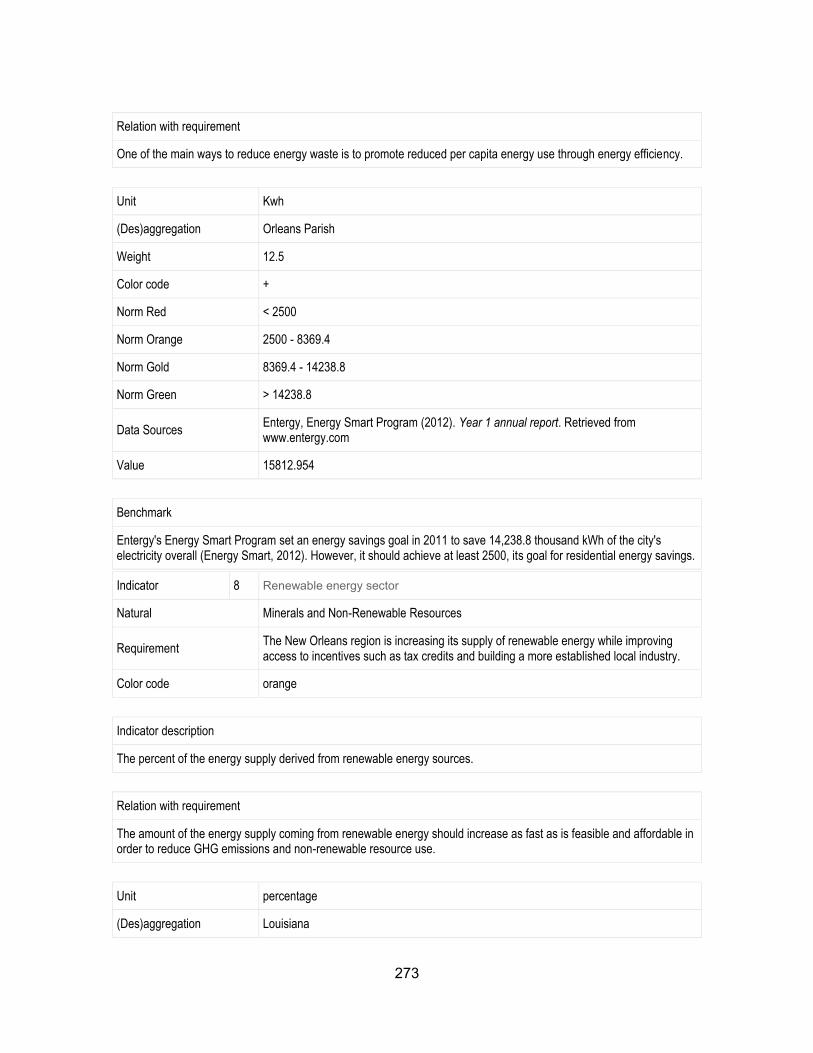
273
Relation with requirement
One of the main ways to reduce energy waste is to promote reduced per capita energy use through energy efficiency.
Unit Kwh
(Des)aggregation Orleans Parish
Weight 12.5
Color code +
Norm Red < 2500
Norm Orange 2500 - 8369.4
Norm Gold 8369.4 - 14238.8
Norm Green > 14238.8
Data Sources Entergy, Energy Smart Program (2012). Year 1 annual report. Retrieved from www.entergy.com
Value 15812.954
Benchmark
Entergy's Energy Smart Program set an energy savings goal in 2011 to save 14,238.8 thousand kWh of the city's electricity overall (Energy Smart, 2012). However, it should achieve at least 2500, its goal for residential energy savings.
Indicator 8 Renewable energy sector
Natural Minerals and Non-Renewable Resources
Requirement The New Orleans region is increasing its supply of renewable energy while improving access to incentives such as tax credits and building a more established local industry.
Color code orange
Indicator description
The percent of the energy supply derived from renewable energy sources.
Relation with requirement
The amount of the energy supply coming from renewable energy should increase as fast as is feasible and affordable in order to reduce GHG emissions and non-renewable resource use.
Unit percentage
(Des)aggregation Louisiana
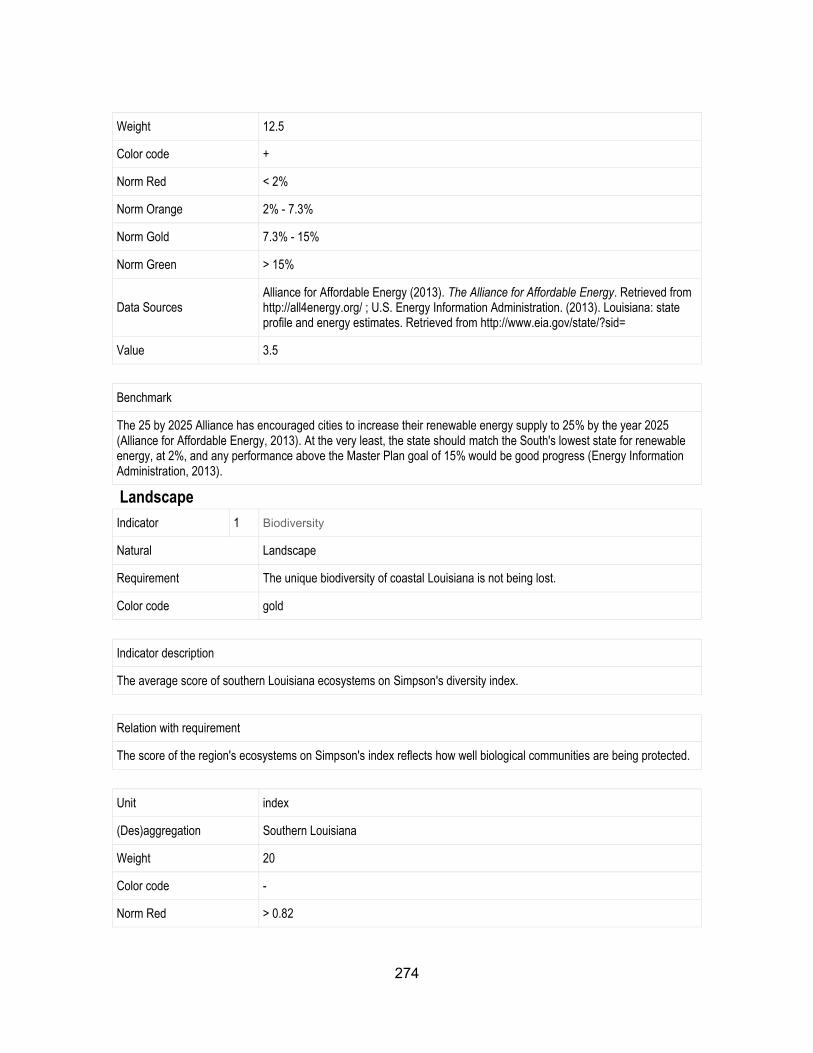
274
Weight 12.5
Color code +
Norm Red < 2%
Norm Orange 2% - 7.3%
Norm Gold 7.3% - 15%
Norm Green > 15%
Data Sources Alliance for Affordable Energy (2013). The Alliance for Affordable Energy. Retrieved from http://all4energy.org/ ; U.S. Energy Information Administration. (2013). Louisiana: state profile and energy estimates. Retrieved from http://www.eia.gov/state/?sid=
Value 3.5
Benchmark
The 25 by 2025 Alliance has encouraged cities to increase their renewable energy supply to 25% by the year 2025 (Alliance for Affordable Energy, 2013). At the very least, the state should match the South's lowest state for renewable energy, at 2%, and any performance above the Master Plan goal of 15% would be good progress (Energy Information Administration, 2013).
Landscape
Indicator 1 Biodiversity
Natural Landscape
Requirement The unique biodiversity of coastal Louisiana is not being lost.
Color code gold
Indicator description
The average score of southern Louisiana ecosystems on Simpson's diversity index.
Relation with requirement
The score of the region's ecosystems on Simpson's index reflects how well biological communities are being protected.
Unit index
(Des)aggregation Southern Louisiana
Weight 20
Color code -
Norm Red > 0.82
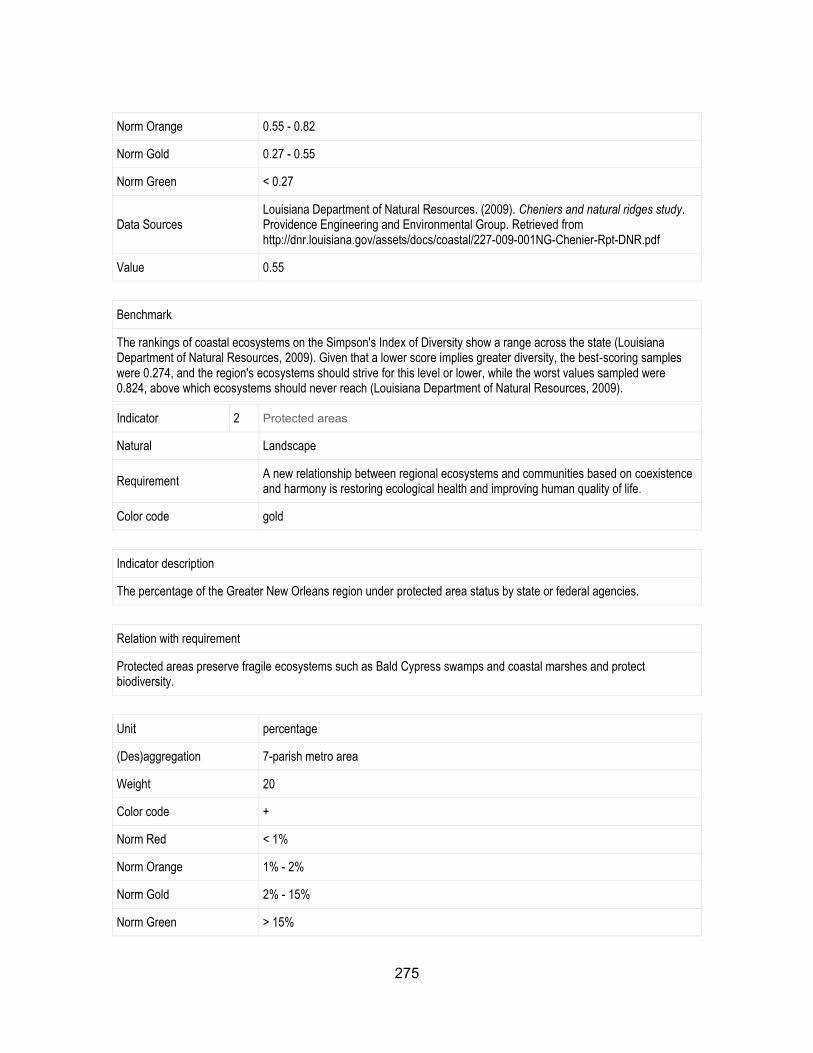
275
Norm Orange 0.55 - 0.82
Norm Gold 0.27 - 0.55
Norm Green < 0.27
Data Sources Louisiana Department of Natural Resources. (2009). Cheniers and natural ridges study. Providence Engineering and Environmental Group. Retrieved from http://dnr.louisiana.gov/assets/docs/coastal/227-009-001NG-Chenier-Rpt-DNR.pdf
Value 0.55
Benchmark
The rankings of coastal ecosystems on the Simpson's Index of Diversity show a range across the state (Louisiana Department of Natural Resources, 2009). Given that a lower score implies greater diversity, the best-scoring samples were 0.274, and the region's ecosystems should strive for this level or lower, while the worst values sampled were 0.824, above which ecosystems should never reach (Louisiana Department of Natural Resources, 2009).
Indicator 2 Protected areas
Natural Landscape
Requirement A new relationship between regional ecosystems and communities based on coexistence and harmony is restoring ecological health and improving human quality of life.
Color code gold
Indicator description
The percentage of the Greater New Orleans region under protected area status by state or federal agencies.
Relation with requirement
Protected areas preserve fragile ecosystems such as Bald Cypress swamps and coastal marshes and protect biodiversity.
Unit percentage
(Des)aggregation 7-parish metro area
Weight 20
Color code +
Norm Red < 1%
Norm Orange 1% - 2%
Norm Gold 2% - 15%
Norm Green > 15%
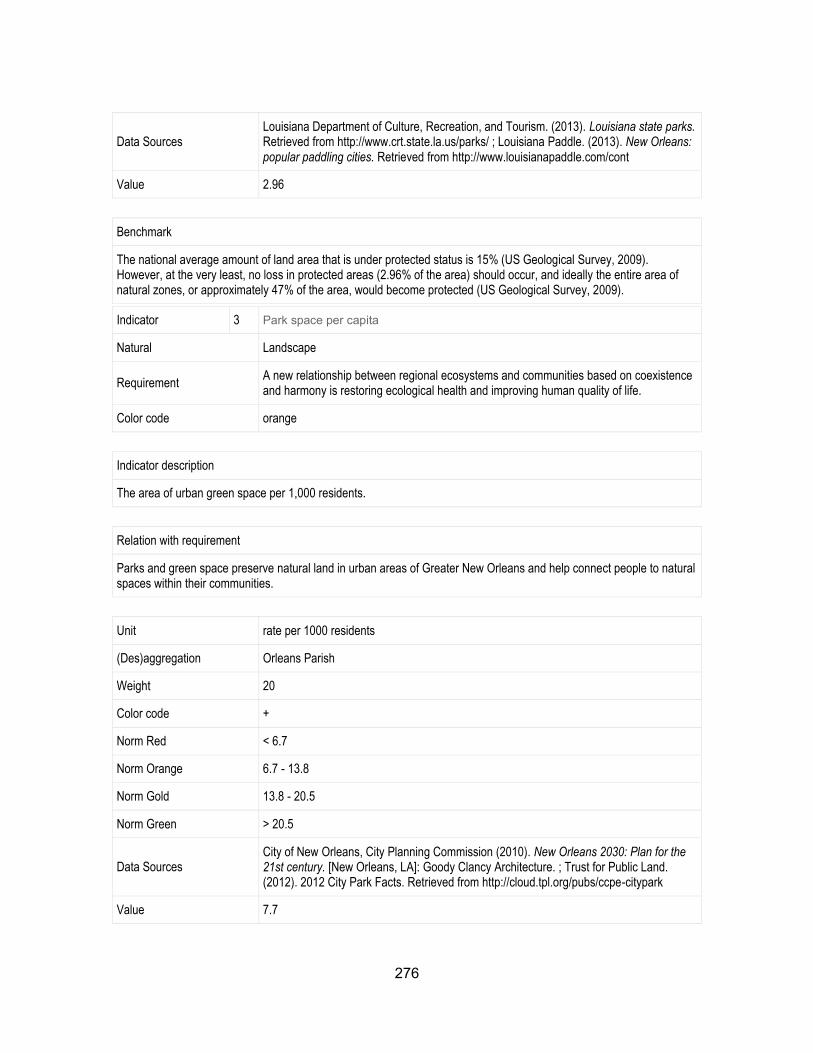
276
Data Sources Louisiana Department of Culture, Recreation, and Tourism. (2013). Louisiana state parks. Retrieved from http://www.crt.state.la.us/parks/ ; Louisiana Paddle. (2013). New Orleans: popular paddling cities. Retrieved from http://www.louisianapaddle.com/cont
Value 2.96
Benchmark
The national average amount of land area that is under protected status is 15% (US Geological Survey, 2009). However, at the very least, no loss in protected areas (2.96% of the area) should occur, and ideally the entire area of natural zones, or approximately 47% of the area, would become protected (US Geological Survey, 2009).
Indicator 3 Park space per capita
Natural Landscape
Requirement A new relationship between regional ecosystems and communities based on coexistence and harmony is restoring ecological health and improving human quality of life.
Color code orange
Indicator description
The area of urban green space per 1,000 residents.
Relation with requirement
Parks and green space preserve natural land in urban areas of Greater New Orleans and help connect people to natural spaces within their communities.
Unit rate per 1000 residents
(Des)aggregation Orleans Parish
Weight 20
Color code +
Norm Red < 6.7
Norm Orange 6.7 - 13.8
Norm Gold 13.8 - 20.5
Norm Green > 20.5
Data Sources City of New Orleans, City Planning Commission (2010). New Orleans 2030: Plan for the 21st century. [New Orleans, LA]: Goody Clancy Architecture. ; Trust for Public Land. (2012). 2012 City Park Facts. Retrieved from http://cloud.tpl.org/pubs/ccpe-citypark
Value 7.7
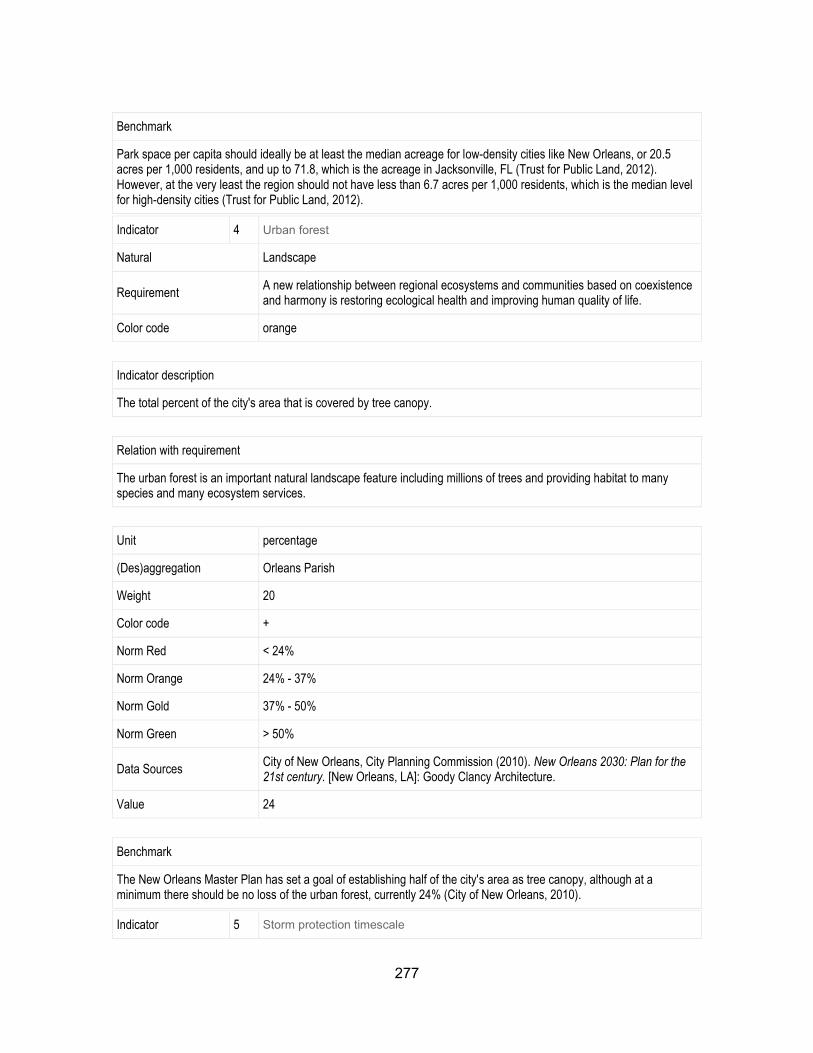
277
Benchmark
Park space per capita should ideally be at least the median acreage for low-density cities like New Orleans, or 20.5 acres per 1,000 residents, and up to 71.8, which is the acreage in Jacksonville, FL (Trust for Public Land, 2012). However, at the very least the region should not have less than 6.7 acres per 1,000 residents, which is the median level for high-density cities (Trust for Public Land, 2012).
Indicator 4 Urban forest
Natural Landscape
Requirement A new relationship between regional ecosystems and communities based on coexistence and harmony is restoring ecological health and improving human quality of life.
Color code orange
Indicator description
The total percent of the city's area that is covered by tree canopy.
Relation with requirement
The urban forest is an important natural landscape feature including millions of trees and providing habitat to many species and many ecosystem services.
Unit percentage
(Des)aggregation Orleans Parish
Weight 20
Color code +
Norm Red < 24%
Norm Orange 24% - 37%
Norm Gold 37% - 50%
Norm Green > 50%
Data Sources City of New Orleans, City Planning Commission (2010). New Orleans 2030: Plan for the 21st century. [New Orleans, LA]: Goody Clancy Architecture.
Value 24
Benchmark
The New Orleans Master Plan has set a goal of establishing half of the city's area as tree canopy, although at a minimum there should be no loss of the urban forest, currently 24% (City of New Orleans, 2010).
Indicator 5 Storm protection timescale
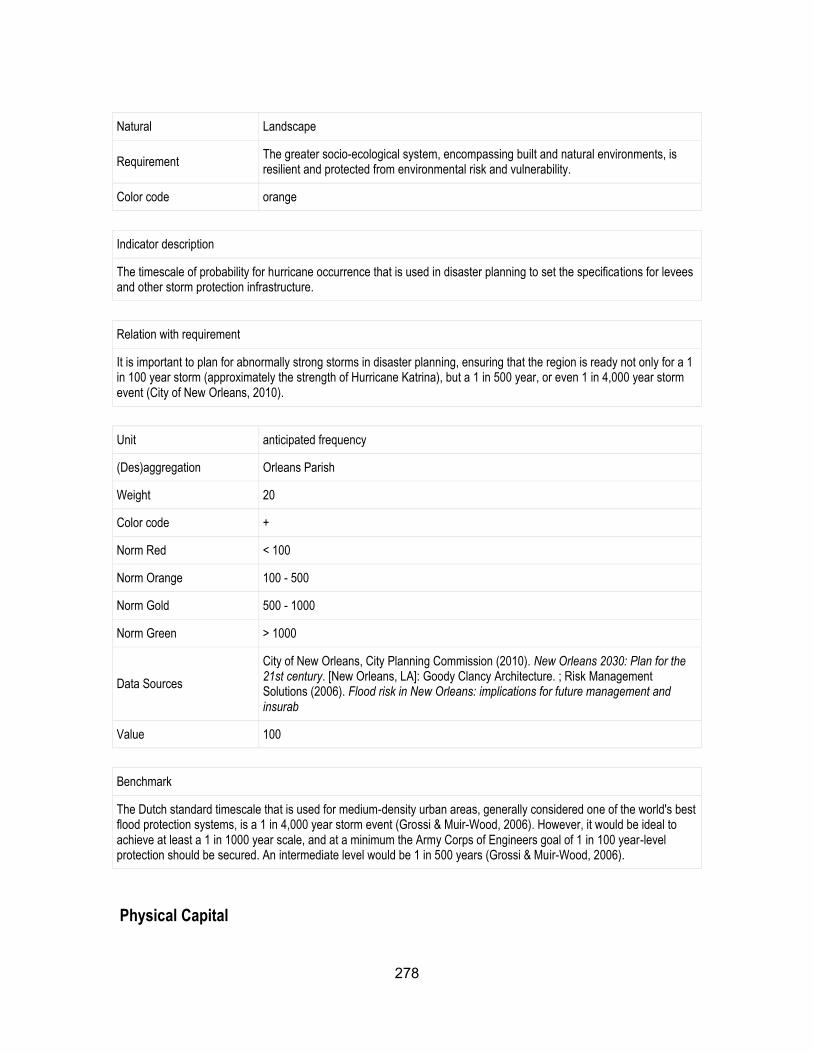
278
Natural Landscape
Requirement The greater socio-ecological system, encompassing built and natural environments, is resilient and protected from environmental risk and vulnerability.
Color code orange
Indicator description
The timescale of probability for hurricane occurrence that is used in disaster planning to set the specifications for levees and other storm protection infrastructure.
Relation with requirement
It is important to plan for abnormally strong storms in disaster planning, ensuring that the region is ready not only for a 1 in 100 year storm (approximately the strength of Hurricane Katrina), but a 1 in 500 year, or even 1 in 4,000 year storm event (City of New Orleans, 2010).
Unit anticipated frequency
(Des)aggregation Orleans Parish
Weight 20
Color code +
Norm Red < 100
Norm Orange 100 - 500
Norm Gold 500 - 1000
Norm Green > 1000
Data Sources
City of New Orleans, City Planning Commission (2010). New Orleans 2030: Plan for the 21st century. [New Orleans, LA]: Goody Clancy Architecture. ; Risk Management Solutions (2006). Flood risk in New Orleans: implications for future management and insurab
Value 100
Benchmark
The Dutch standard timescale that is used for medium-density urban areas, generally considered one of the world's best flood protection systems, is a 1 in 4,000 year storm event (Grossi & Muir-Wood, 2006). However, it would be ideal to achieve at least a 1 in 1000 year scale, and at a minimum the Army Corps of Engineers goal of 1 in 100 year-level protection should be secured. An intermediate level would be 1 in 500 years (Grossi & Muir-Wood, 2006).
Physical Capital
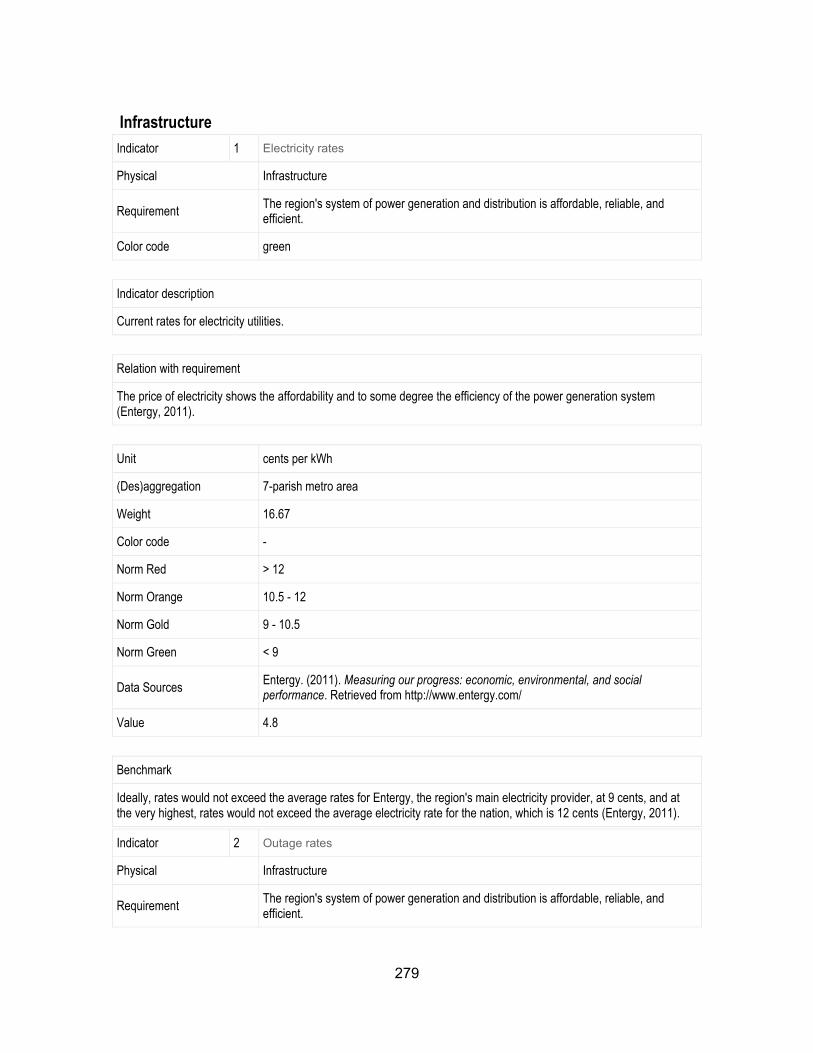
279
Infrastructure
Indicator 1 Electricity rates
Physical Infrastructure
Requirement The region's system of power generation and distribution is affordable, reliable, and efficient.
Color code green
Indicator description
Current rates for electricity utilities.
Relation with requirement
The price of electricity shows the affordability and to some degree the efficiency of the power generation system (Entergy, 2011).
Unit cents per kWh
(Des)aggregation 7-parish metro area
Weight 16.67
Color code -
Norm Red > 12
Norm Orange 10.5 - 12
Norm Gold 9 - 10.5
Norm Green < 9
Data Sources Entergy. (2011). Measuring our progress: economic, environmental, and social performance. Retrieved from http://www.entergy.com/
Value 4.8
Benchmark
Ideally, rates would not exceed the average rates for Entergy, the region's main electricity provider, at 9 cents, and at the very highest, rates would not exceed the average electricity rate for the nation, which is 12 cents (Entergy, 2011).
Indicator 2 Outage rates
Physical Infrastructure
Requirement The region's system of power generation and distribution is affordable, reliable, and efficient.
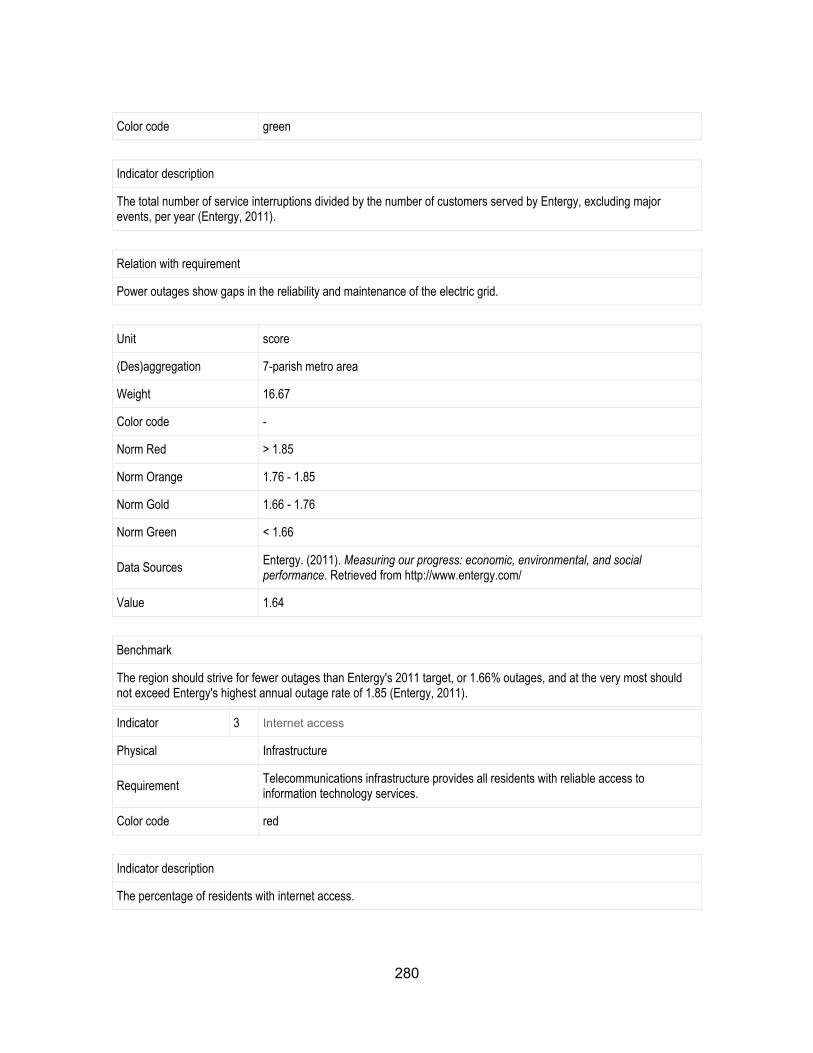
280
Color code green
Indicator description
The total number of service interruptions divided by the number of customers served by Entergy, excluding major events, per year (Entergy, 2011).
Relation with requirement
Power outages show gaps in the reliability and maintenance of the electric grid.
Unit score
(Des)aggregation 7-parish metro area
Weight 16.67
Color code -
Norm Red > 1.85
Norm Orange 1.76 - 1.85
Norm Gold 1.66 - 1.76
Norm Green < 1.66
Data Sources Entergy. (2011). Measuring our progress: economic, environmental, and social performance. Retrieved from http://www.entergy.com/
Value 1.64
Benchmark
The region should strive for fewer outages than Entergy's 2011 target, or 1.66% outages, and at the very most should not exceed Entergy's highest annual outage rate of 1.85 (Entergy, 2011).
Indicator 3 Internet access
Physical Infrastructure
Requirement Telecommunications infrastructure provides all residents with reliable access to information technology services.
Color code red
Indicator description
The percentage of residents with internet access.
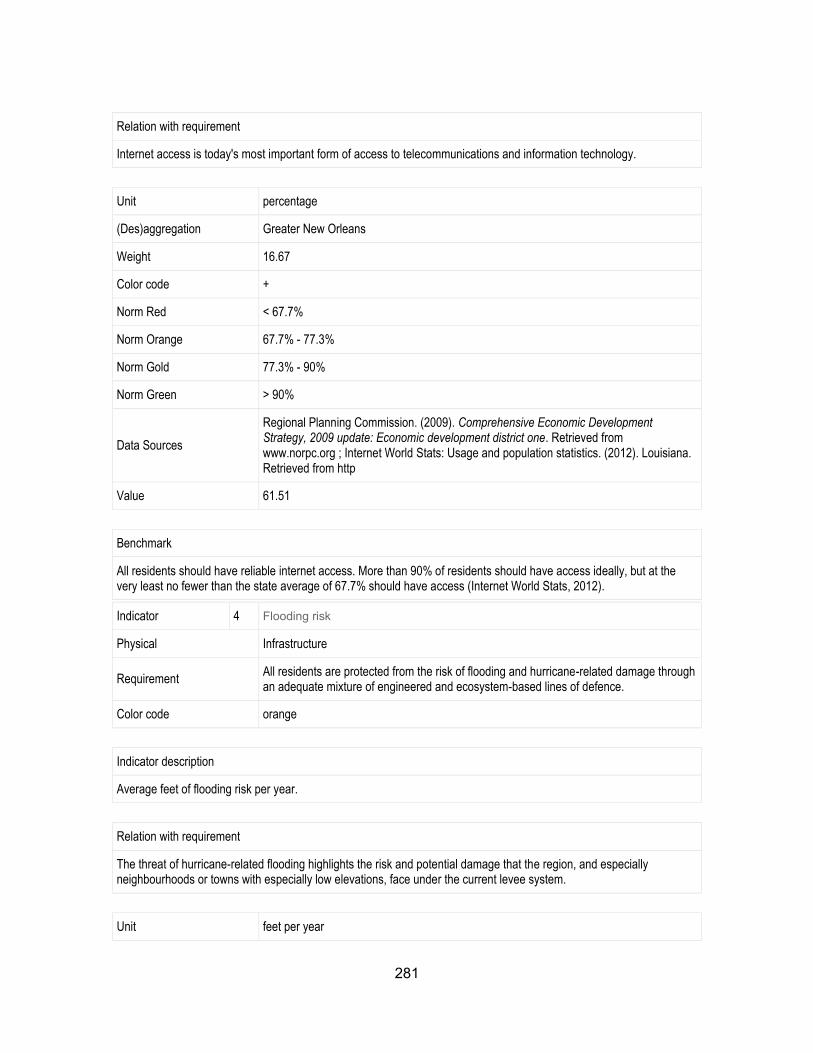
281
Relation with requirement
Internet access is today's most important form of access to telecommunications and information technology.
Unit percentage
(Des)aggregation Greater New Orleans
Weight 16.67
Color code +
Norm Red < 67.7%
Norm Orange 67.7% - 77.3%
Norm Gold 77.3% - 90%
Norm Green > 90%
Data Sources
Regional Planning Commission. (2009). Comprehensive Economic Development Strategy, 2009 update: Economic development district one. Retrieved from www.norpc.org ; Internet World Stats: Usage and population statistics. (2012). Louisiana. Retrieved from http
Value 61.51
Benchmark
All residents should have reliable internet access. More than 90% of residents should have access ideally, but at the very least no fewer than the state average of 67.7% should have access (Internet World Stats, 2012).
Indicator 4 Flooding risk
Physical Infrastructure
Requirement All residents are protected from the risk of flooding and hurricane-related damage through an adequate mixture of engineered and ecosystem-based lines of defence.
Color code orange
Indicator description
Average feet of flooding risk per year.
Relation with requirement
The threat of hurricane-related flooding highlights the risk and potential damage that the region, and especially neighbourhoods or towns with especially low elevations, face under the current levee system.
Unit feet per year
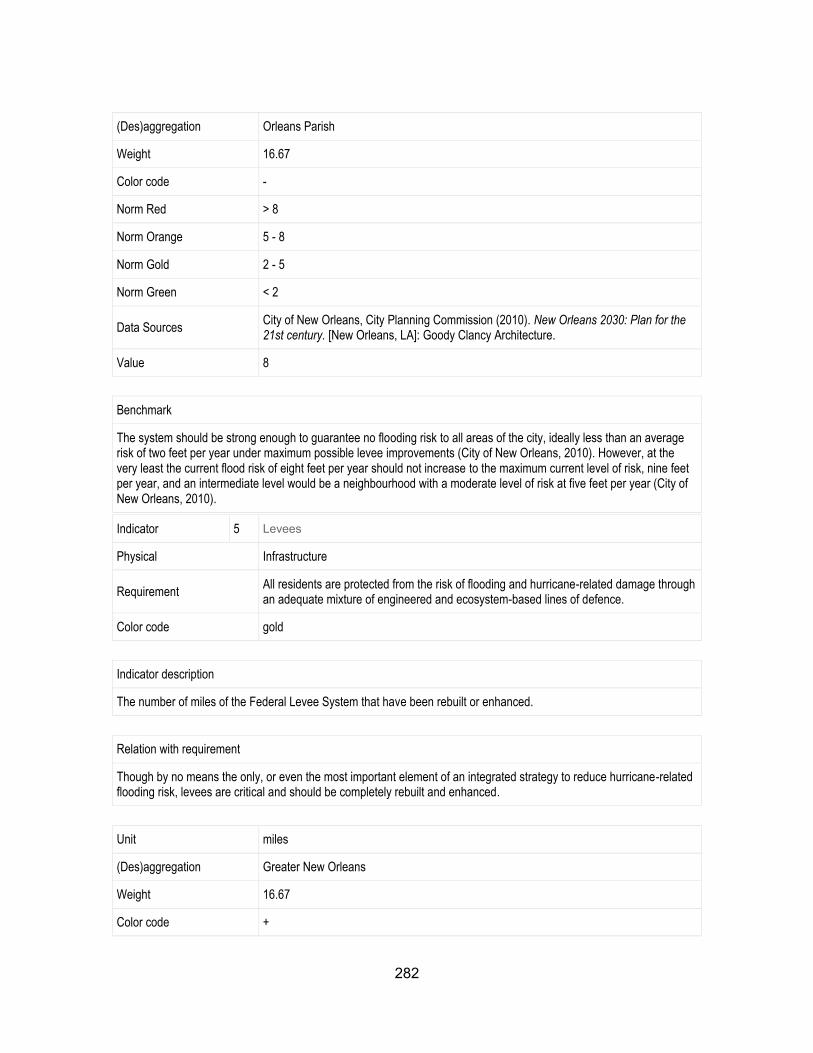
282
(Des)aggregation Orleans Parish
Weight 16.67
Color code -
Norm Red > 8
Norm Orange 5 - 8
Norm Gold 2 - 5
Norm Green < 2
Data Sources City of New Orleans, City Planning Commission (2010). New Orleans 2030: Plan for the 21st century. [New Orleans, LA]: Goody Clancy Architecture.
Value 8
Benchmark
The system should be strong enough to guarantee no flooding risk to all areas of the city, ideally less than an average risk of two feet per year under maximum possible levee improvements (City of New Orleans, 2010). However, at the very least the current flood risk of eight feet per year should not increase to the maximum current level of risk, nine feet per year, and an intermediate level would be a neighbourhood with a moderate level of risk at five feet per year (City of New Orleans, 2010).
Indicator 5 Levees
Physical Infrastructure
Requirement All residents are protected from the risk of flooding and hurricane-related damage through an adequate mixture of engineered and ecosystem-based lines of defence.
Color code gold
Indicator description
The number of miles of the Federal Levee System that have been rebuilt or enhanced.
Relation with requirement
Though by no means the only, or even the most important element of an integrated strategy to reduce hurricane-related flooding risk, levees are critical and should be completely rebuilt and enhanced.
Unit miles
(Des)aggregation Greater New Orleans
Weight 16.67
Color code +
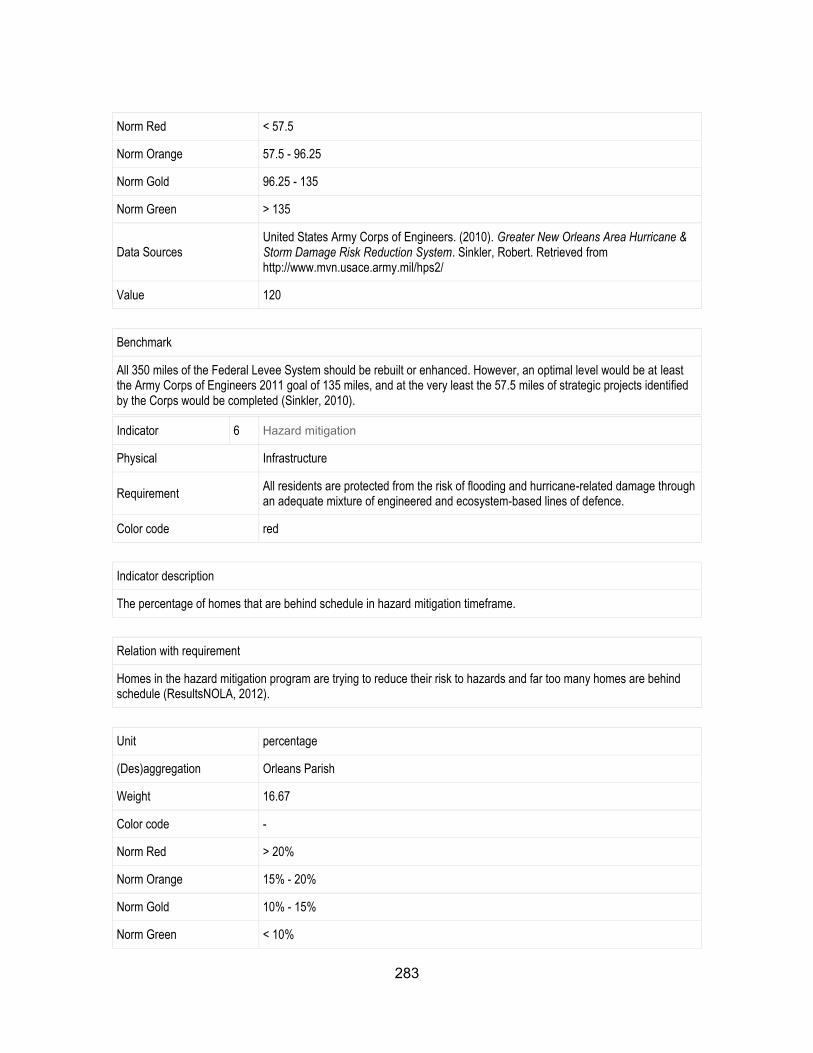
283
Norm Red < 57.5
Norm Orange 57.5 - 96.25
Norm Gold 96.25 - 135
Norm Green > 135
Data Sources United States Army Corps of Engineers. (2010). Greater New Orleans Area Hurricane & Storm Damage Risk Reduction System. Sinkler, Robert. Retrieved from http://www.mvn.usace.army.mil/hps2/
Value 120
Benchmark
All 350 miles of the Federal Levee System should be rebuilt or enhanced. However, an optimal level would be at least the Army Corps of Engineers 2011 goal of 135 miles, and at the very least the 57.5 miles of strategic projects identified by the Corps would be completed (Sinkler, 2010).
Indicator 6 Hazard mitigation
Physical Infrastructure
Requirement All residents are protected from the risk of flooding and hurricane-related damage through an adequate mixture of engineered and ecosystem-based lines of defence.
Color code red
Indicator description
The percentage of homes that are behind schedule in hazard mitigation timeframe.
Relation with requirement
Homes in the hazard mitigation program are trying to reduce their risk to hazards and far too many homes are behind schedule (ResultsNOLA, 2012).
Unit percentage
(Des)aggregation Orleans Parish
Weight 16.67
Color code -
Norm Red > 20%
Norm Orange 15% - 20%
Norm Gold 10% - 15%
Norm Green < 10%
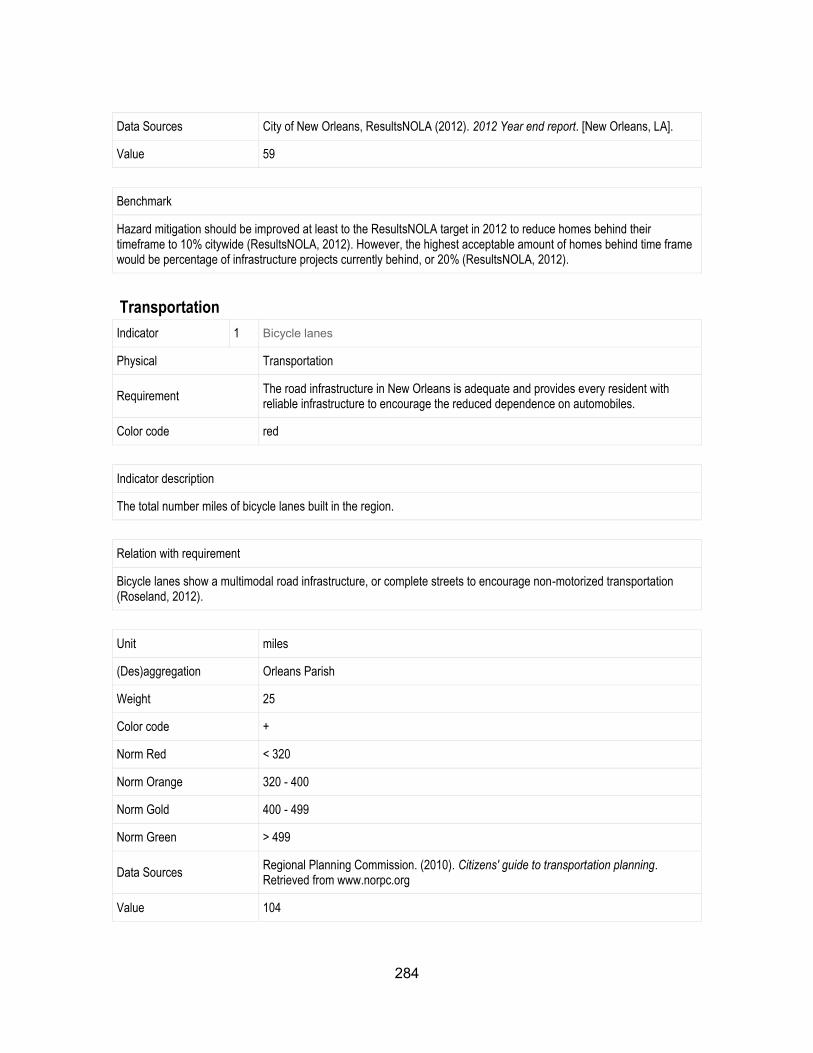
284
Data Sources City of New Orleans, ResultsNOLA (2012). 2012 Year end report. [New Orleans, LA].
Value 59
Benchmark
Hazard mitigation should be improved at least to the ResultsNOLA target in 2012 to reduce homes behind their timeframe to 10% citywide (ResultsNOLA, 2012). However, the highest acceptable amount of homes behind time frame would be percentage of infrastructure projects currently behind, or 20% (ResultsNOLA, 2012).
Transportation
Indicator 1 Bicycle lanes
Physical Transportation
Requirement The road infrastructure in New Orleans is adequate and provides every resident with reliable infrastructure to encourage the reduced dependence on automobiles.
Color code red
Indicator description
The total number miles of bicycle lanes built in the region.
Relation with requirement
Bicycle lanes show a multimodal road infrastructure, or complete streets to encourage non-motorized transportation (Roseland, 2012).
Unit miles
(Des)aggregation Orleans Parish
Weight 25
Color code +
Norm Red < 320
Norm Orange 320 - 400
Norm Gold 400 - 499
Norm Green > 499
Data Sources Regional Planning Commission. (2010). Citizens' guide to transportation planning. Retrieved from www.norpc.org
Value 104
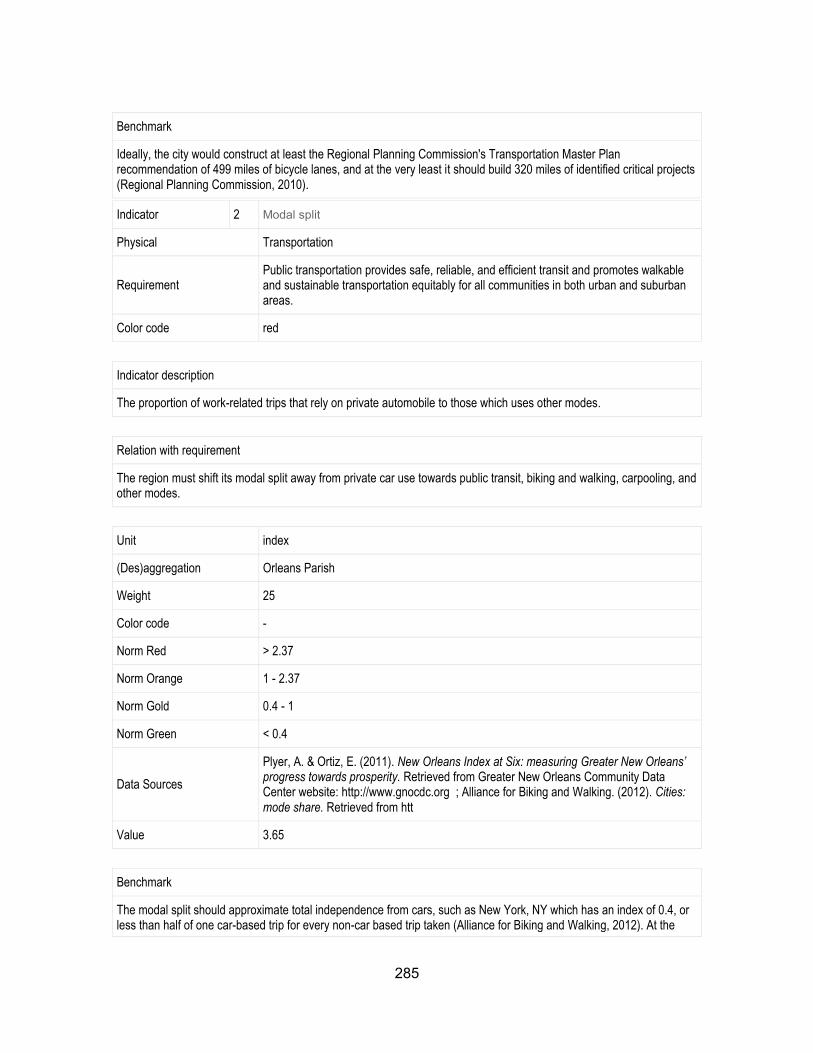
285
Benchmark
Ideally, the city would construct at least the Regional Planning Commission's Transportation Master Plan recommendation of 499 miles of bicycle lanes, and at the very least it should build 320 miles of identified critical projects (Regional Planning Commission, 2010).
Indicator 2 Modal split
Physical Transportation
Requirement Public transportation provides safe, reliable, and efficient transit and promotes walkable and sustainable transportation equitably for all communities in both urban and suburban areas.
Color code red
Indicator description
The proportion of work-related trips that rely on private automobile to those which uses other modes.
Relation with requirement
The region must shift its modal split away from private car use towards public transit, biking and walking, carpooling, and other modes.
Unit index
(Des)aggregation Orleans Parish
Weight 25
Color code -
Norm Red > 2.37
Norm Orange 1 - 2.37
Norm Gold 0.4 - 1
Norm Green < 0.4
Data Sources
Plyer, A. & Ortiz, E. (2011). New Orleans Index at Six: measuring Greater New Orleans’ progress towards prosperity. Retrieved from Greater New Orleans Community Data Center website: http://www.gnocdc.org ; Alliance for Biking and Walking. (2012). Cities: mode share. Retrieved from htt
Value 3.65
Benchmark
The modal split should approximate total independence from cars, such as New York, NY which has an index of 0.4, or less than half of one car-based trip for every non-car based trip taken (Alliance for Biking and Walking, 2012). At the
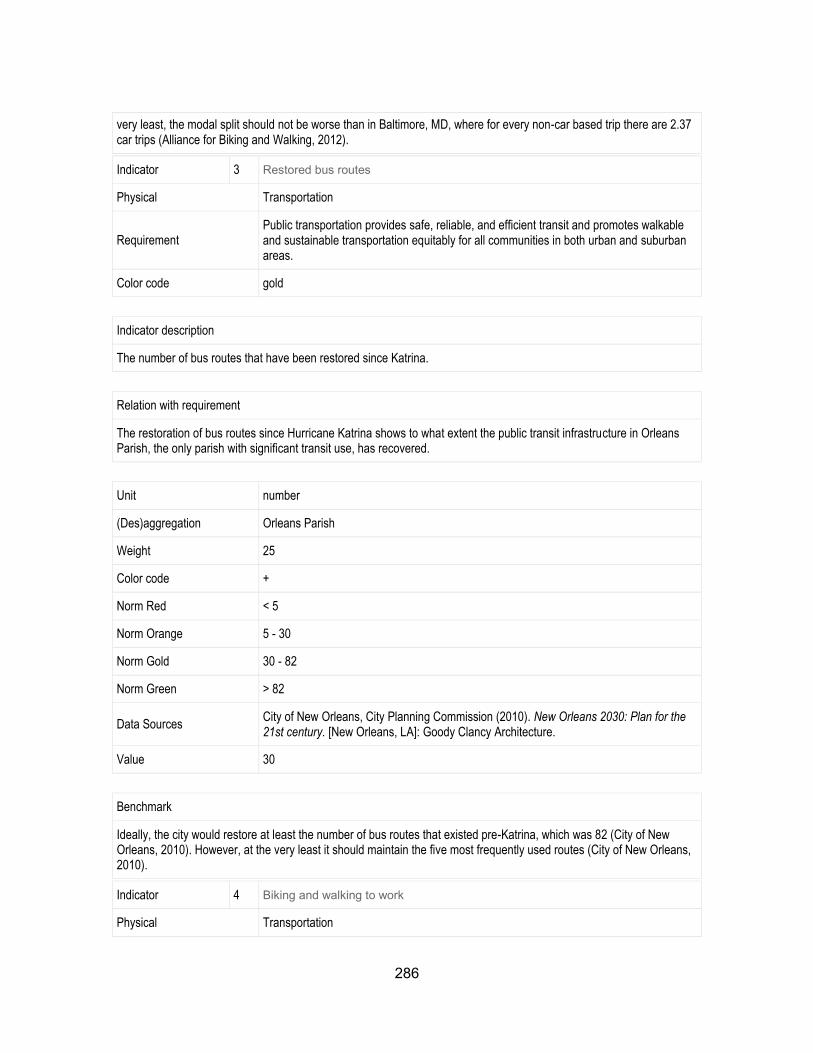
286
very least, the modal split should not be worse than in Baltimore, MD, where for every non-car based trip there are 2.37 car trips (Alliance for Biking and Walking, 2012).
Indicator 3 Restored bus routes
Physical Transportation
Requirement Public transportation provides safe, reliable, and efficient transit and promotes walkable and sustainable transportation equitably for all communities in both urban and suburban areas.
Color code gold
Indicator description
The number of bus routes that have been restored since Katrina.
Relation with requirement
The restoration of bus routes since Hurricane Katrina shows to what extent the public transit infrastructure in Orleans Parish, the only parish with significant transit use, has recovered.
Unit number
(Des)aggregation Orleans Parish
Weight 25
Color code +
Norm Red < 5
Norm Orange 5 - 30
Norm Gold 30 - 82
Norm Green > 82
Data Sources City of New Orleans, City Planning Commission (2010). New Orleans 2030: Plan for the 21st century. [New Orleans, LA]: Goody Clancy Architecture.
Value 30
Benchmark
Ideally, the city would restore at least the number of bus routes that existed pre-Katrina, which was 82 (City of New Orleans, 2010). However, at the very least it should maintain the five most frequently used routes (City of New Orleans, 2010).
Indicator 4 Biking and walking to work
Physical Transportation
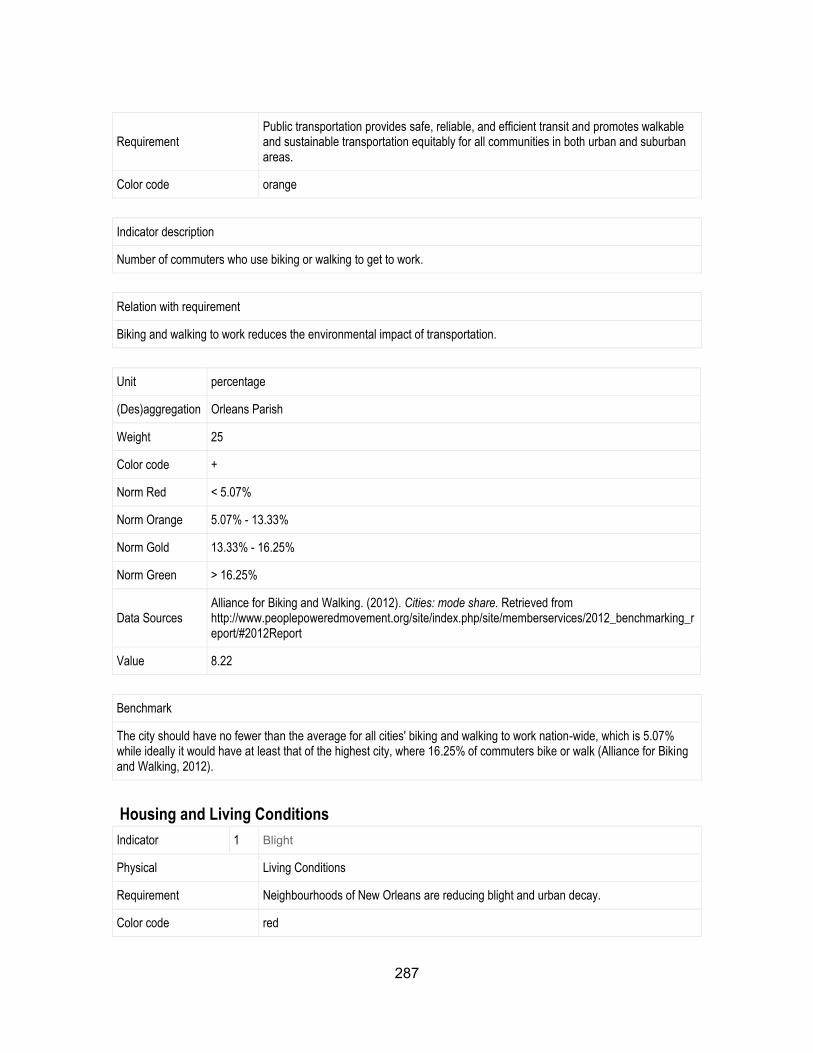
287
Requirement Public transportation provides safe, reliable, and efficient transit and promotes walkable and sustainable transportation equitably for all communities in both urban and suburban areas.
Color code orange
Indicator description
Number of commuters who use biking or walking to get to work.
Relation with requirement
Biking and walking to work reduces the environmental impact of transportation.
Unit percentage
(Des)aggregation Orleans Parish
Weight 25
Color code +
Norm Red < 5.07%
Norm Orange 5.07% - 13.33%
Norm Gold 13.33% - 16.25%
Norm Green > 16.25%
Data Sources Alliance for Biking and Walking. (2012). Cities: mode share. Retrieved from http://www.peoplepoweredmovement.org/site/index.php/site/memberservices/2012_benchmarking_report/#2012Report
Value 8.22
Benchmark
The city should have no fewer than the average for all cities' biking and walking to work nation-wide, which is 5.07% while ideally it would have at least that of the highest city, where 16.25% of commuters bike or walk (Alliance for Biking and Walking, 2012).
Housing and Living Conditions
Indicator 1 Blight
Physical Living Conditions
Requirement Neighbourhoods of New Orleans are reducing blight and urban decay.
Color code red
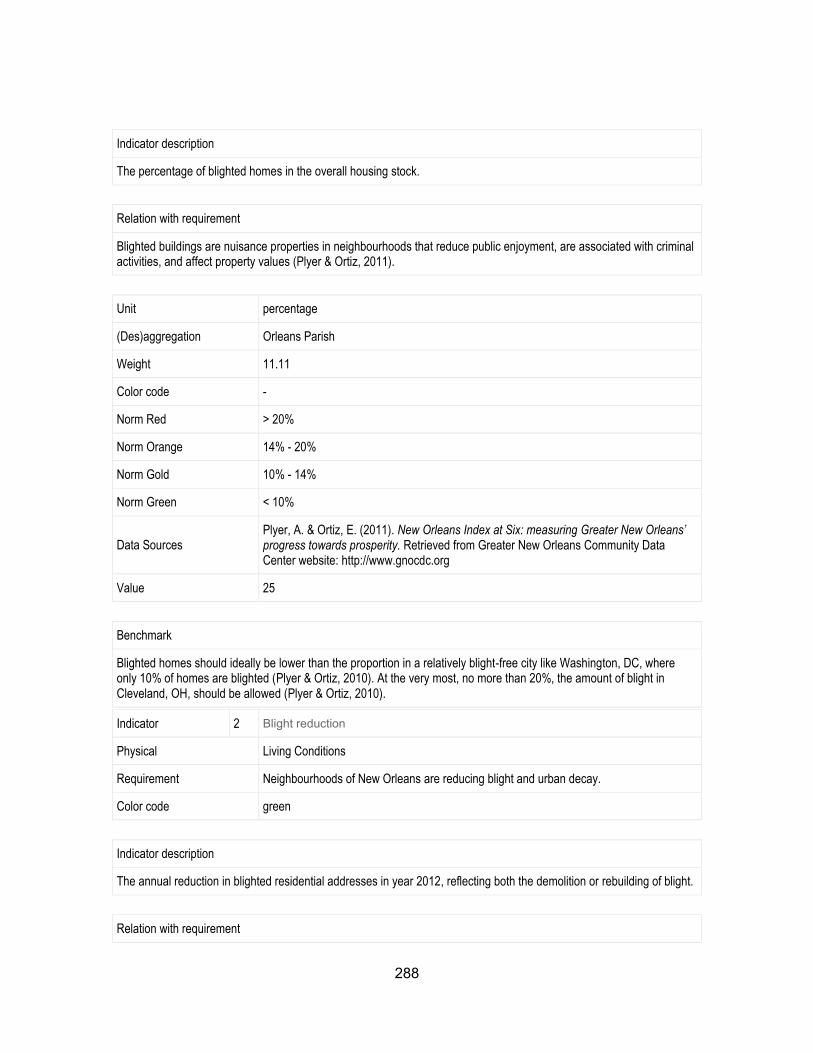
288
Indicator description
The percentage of blighted homes in the overall housing stock.
Relation with requirement
Blighted buildings are nuisance properties in neighbourhoods that reduce public enjoyment, are associated with criminal activities, and affect property values (Plyer & Ortiz, 2011).
Unit percentage
(Des)aggregation Orleans Parish
Weight 11.11
Color code -
Norm Red > 20%
Norm Orange 14% - 20%
Norm Gold 10% - 14%
Norm Green < 10%
Data Sources Plyer, A. & Ortiz, E. (2011). New Orleans Index at Six: measuring Greater New Orleans’ progress towards prosperity. Retrieved from Greater New Orleans Community Data Center website: http://www.gnocdc.org
Value 25
Benchmark
Blighted homes should ideally be lower than the proportion in a relatively blight-free city like Washington, DC, where only 10% of homes are blighted (Plyer & Ortiz, 2010). At the very most, no more than 20%, the amount of blight in Cleveland, OH, should be allowed (Plyer & Ortiz, 2010).
Indicator 2 Blight reduction
Physical Living Conditions
Requirement Neighbourhoods of New Orleans are reducing blight and urban decay.
Color code green
Indicator description
The annual reduction in blighted residential addresses in year 2012, reflecting both the demolition or rebuilding of blight.
Relation with requirement
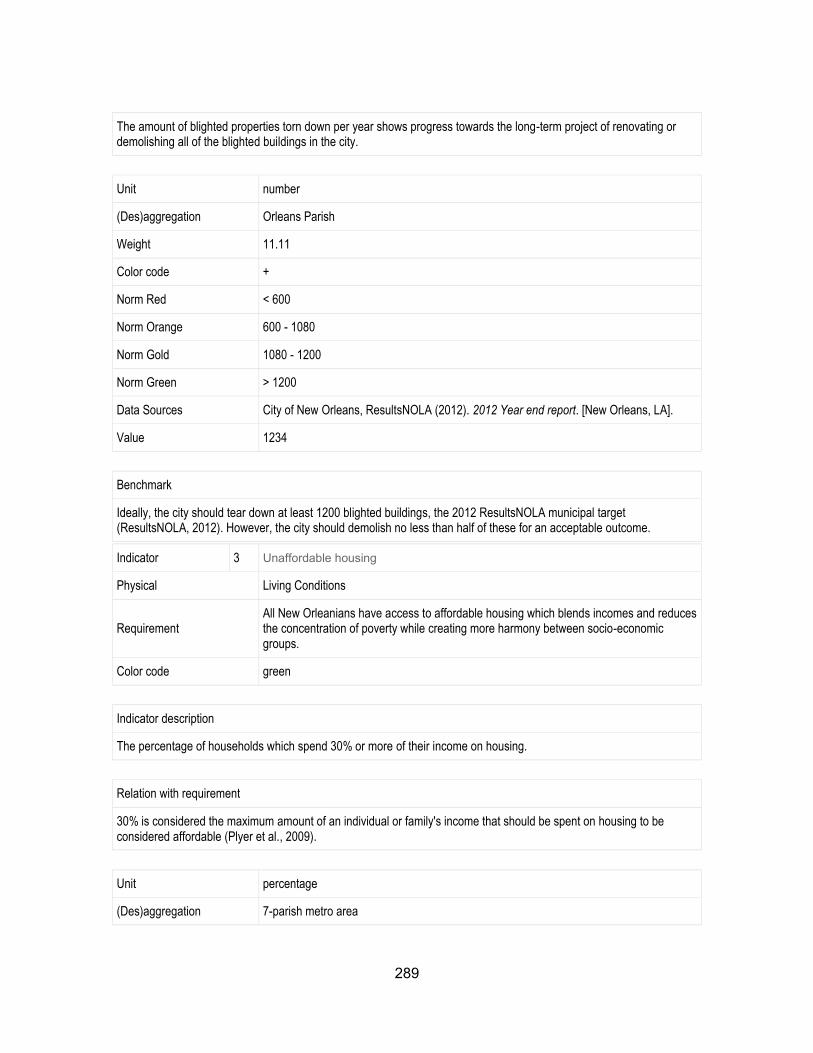
289
The amount of blighted properties torn down per year shows progress towards the long-term project of renovating or demolishing all of the blighted buildings in the city.
Unit number
(Des)aggregation Orleans Parish
Weight 11.11
Color code +
Norm Red < 600
Norm Orange 600 - 1080
Norm Gold 1080 - 1200
Norm Green > 1200
Data Sources City of New Orleans, ResultsNOLA (2012). 2012 Year end report. [New Orleans, LA].
Value 1234
Benchmark
Ideally, the city should tear down at least 1200 blighted buildings, the 2012 ResultsNOLA municipal target (ResultsNOLA, 2012). However, the city should demolish no less than half of these for an acceptable outcome.
Indicator 3 Unaffordable housing
Physical Living Conditions
Requirement All New Orleanians have access to affordable housing which blends incomes and reduces the concentration of poverty while creating more harmony between socio-economic groups.
Color code green
Indicator description
The percentage of households which spend 30% or more of their income on housing.
Relation with requirement
30% is considered the maximum amount of an individual or family's income that should be spent on housing to be considered affordable (Plyer et al., 2009).
Unit percentage
(Des)aggregation 7-parish metro area
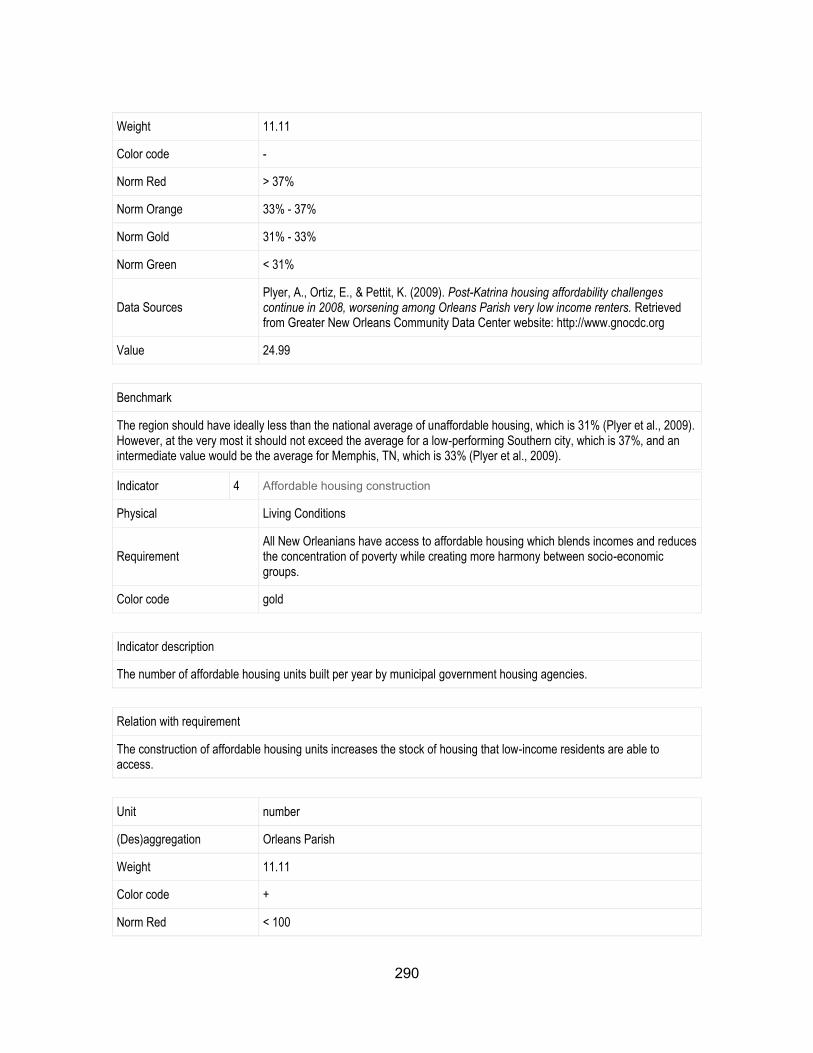
290
Weight 11.11
Color code -
Norm Red > 37%
Norm Orange 33% - 37%
Norm Gold 31% - 33%
Norm Green < 31%
Data Sources Plyer, A., Ortiz, E., & Pettit, K. (2009). Post-Katrina housing affordability challenges continue in 2008, worsening among Orleans Parish very low income renters. Retrieved from Greater New Orleans Community Data Center website: http://www.gnocdc.org
Value 24.99
Benchmark
The region should have ideally less than the national average of unaffordable housing, which is 31% (Plyer et al., 2009). However, at the very most it should not exceed the average for a low-performing Southern city, which is 37%, and an intermediate value would be the average for Memphis, TN, which is 33% (Plyer et al., 2009).
Indicator 4 Affordable housing construction
Physical Living Conditions
Requirement All New Orleanians have access to affordable housing which blends incomes and reduces the concentration of poverty while creating more harmony between socio-economic groups.
Color code gold
Indicator description
The number of affordable housing units built per year by municipal government housing agencies.
Relation with requirement
The construction of affordable housing units increases the stock of housing that low-income residents are able to access.
Unit number
(Des)aggregation Orleans Parish
Weight 11.11
Color code +
Norm Red < 100
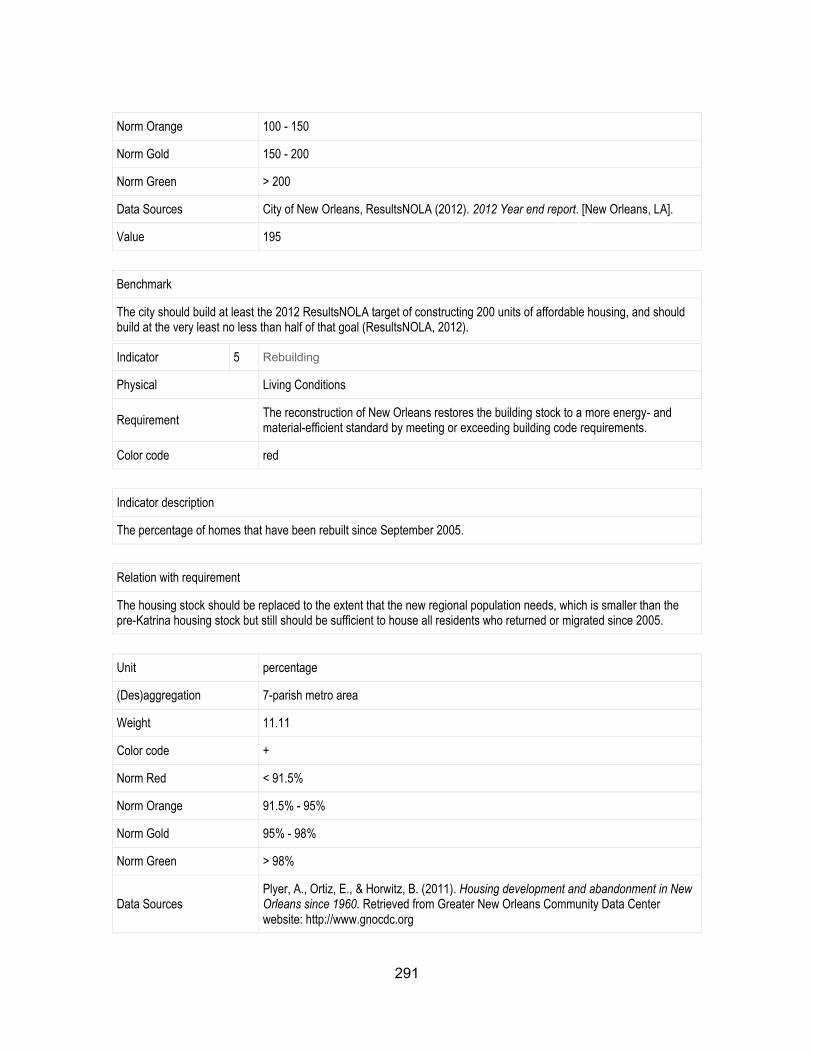
291
Norm Orange 100 - 150
Norm Gold 150 - 200
Norm Green > 200
Data Sources City of New Orleans, ResultsNOLA (2012). 2012 Year end report. [New Orleans, LA].
Value 195
Benchmark
The city should build at least the 2012 ResultsNOLA target of constructing 200 units of affordable housing, and should build at the very least no less than half of that goal (ResultsNOLA, 2012).
Indicator 5 Rebuilding
Physical Living Conditions
Requirement The reconstruction of New Orleans restores the building stock to a more energy- and material-efficient standard by meeting or exceeding building code requirements.
Color code red
Indicator description
The percentage of homes that have been rebuilt since September 2005.
Relation with requirement
The housing stock should be replaced to the extent that the new regional population needs, which is smaller than the pre-Katrina housing stock but still should be sufficient to house all residents who returned or migrated since 2005.
Unit percentage
(Des)aggregation 7-parish metro area
Weight 11.11
Color code +
Norm Red < 91.5%
Norm Orange 91.5% - 95%
Norm Gold 95% - 98%
Norm Green > 98%
Data Sources Plyer, A., Ortiz, E., & Horwitz, B. (2011). Housing development and abandonment in New Orleans since 1960. Retrieved from Greater New Orleans Community Data Center website: http://www.gnocdc.org
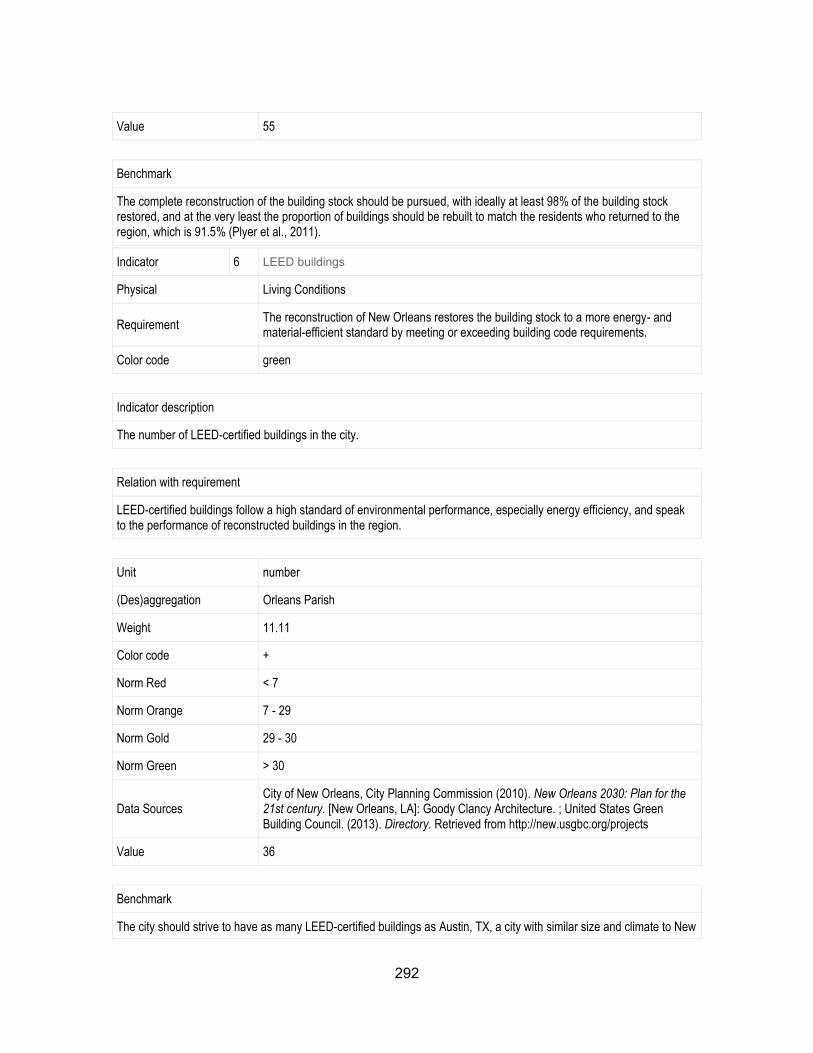
292
Value 55
Benchmark
The complete reconstruction of the building stock should be pursued, with ideally at least 98% of the building stock restored, and at the very least the proportion of buildings should be rebuilt to match the residents who returned to the region, which is 91.5% (Plyer et al., 2011).
Indicator 6 LEED buildings
Physical Living Conditions
Requirement The reconstruction of New Orleans restores the building stock to a more energy- and material-efficient standard by meeting or exceeding building code requirements.
Color code green
Indicator description
The number of LEED-certified buildings in the city.
Relation with requirement
LEED-certified buildings follow a high standard of environmental performance, especially energy efficiency, and speak to the performance of reconstructed buildings in the region.
Unit number
(Des)aggregation Orleans Parish
Weight 11.11
Color code +
Norm Red < 7
Norm Orange 7 - 29
Norm Gold 29 - 30
Norm Green > 30
Data Sources City of New Orleans, City Planning Commission (2010). New Orleans 2030: Plan for the 21st century. [New Orleans, LA]: Goody Clancy Architecture. ; United States Green Building Council. (2013). Directory. Retrieved from http://new.usgbc.org/projects
Value 36
Benchmark
The city should strive to have as many LEED-certified buildings as Austin, TX, a city with similar size and climate to New
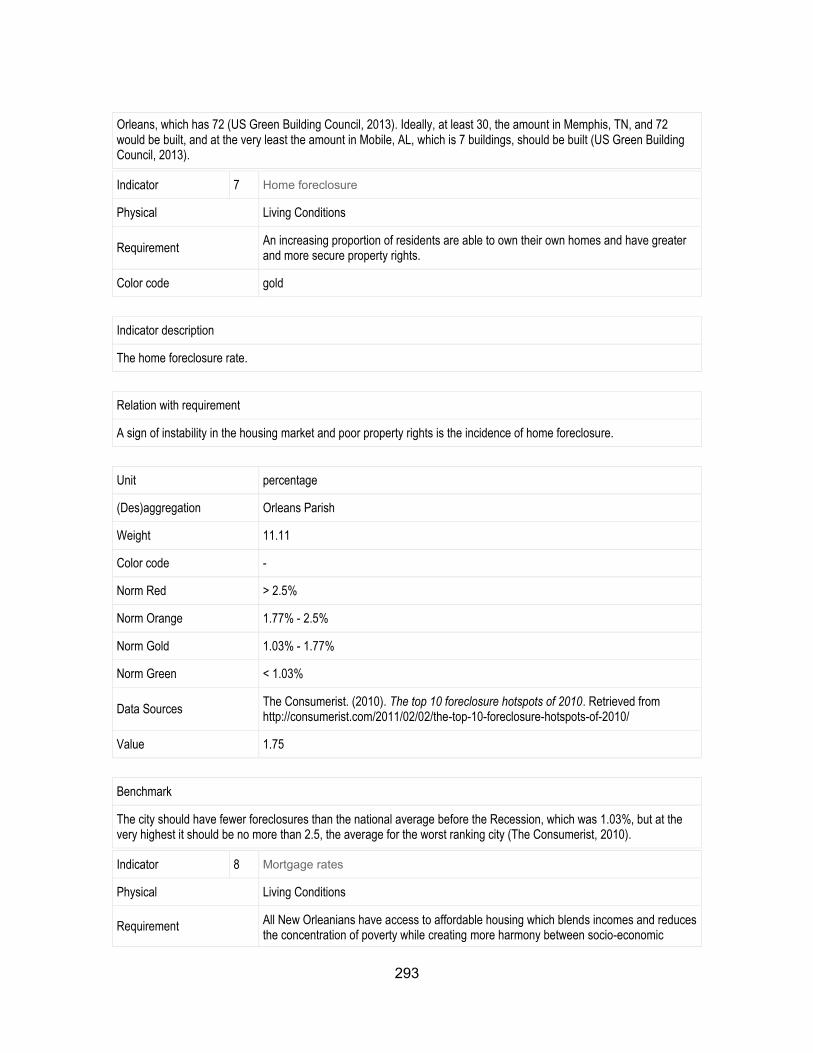
293
Orleans, which has 72 (US Green Building Council, 2013). Ideally, at least 30, the amount in Memphis, TN, and 72 would be built, and at the very least the amount in Mobile, AL, which is 7 buildings, should be built (US Green Building Council, 2013).
Indicator 7 Home foreclosure
Physical Living Conditions
Requirement An increasing proportion of residents are able to own their own homes and have greater and more secure property rights.
Color code gold
Indicator description
The home foreclosure rate.
Relation with requirement
A sign of instability in the housing market and poor property rights is the incidence of home foreclosure.
Unit percentage
(Des)aggregation Orleans Parish
Weight 11.11
Color code -
Norm Red > 2.5%
Norm Orange 1.77% - 2.5%
Norm Gold 1.03% - 1.77%
Norm Green < 1.03%
Data Sources The Consumerist. (2010). The top 10 foreclosure hotspots of 2010. Retrieved from http://consumerist.com/2011/02/02/the-top-10-foreclosure-hotspots-of-2010/
Value 1.75
Benchmark
The city should have fewer foreclosures than the national average before the Recession, which was 1.03%, but at the very highest it should be no more than 2.5, the average for the worst ranking city (The Consumerist, 2010).
Indicator 8 Mortgage rates
Physical Living Conditions
Requirement All New Orleanians have access to affordable housing which blends incomes and reduces the concentration of poverty while creating more harmony between socio-economic
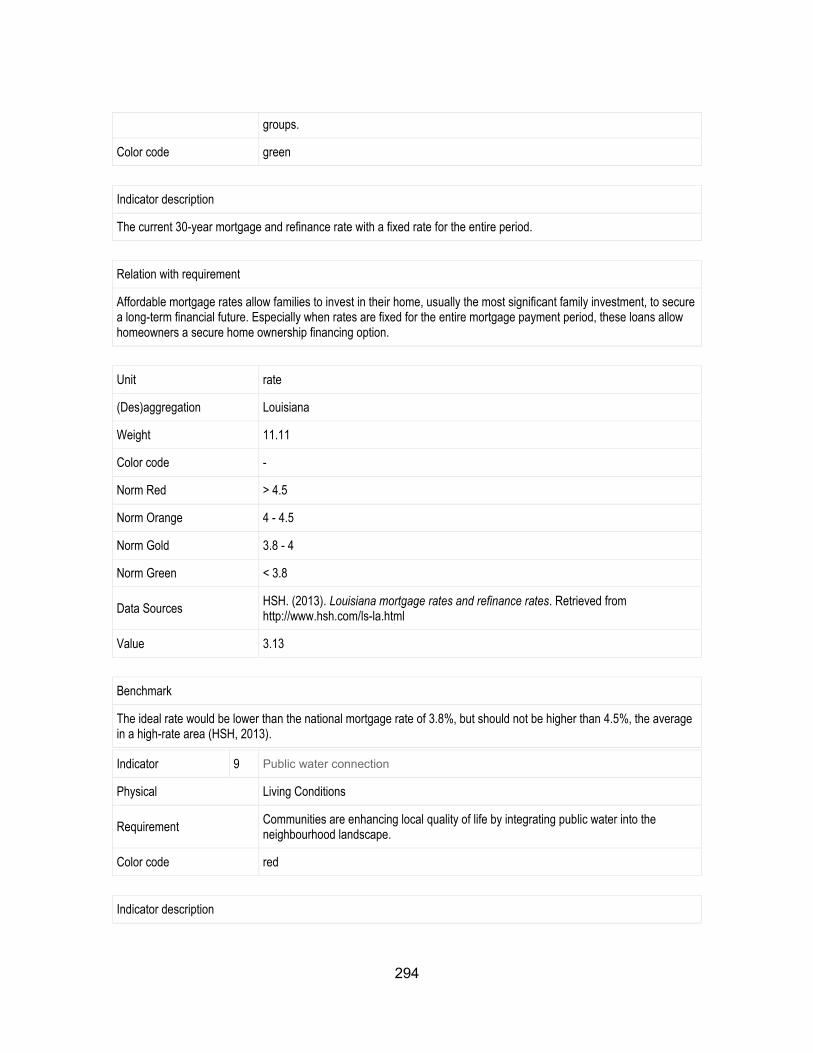
294
groups.
Color code green
Indicator description
The current 30-year mortgage and refinance rate with a fixed rate for the entire period.
Relation with requirement
Affordable mortgage rates allow families to invest in their home, usually the most significant family investment, to secure a long-term financial future. Especially when rates are fixed for the entire mortgage payment period, these loans allow homeowners a secure home ownership financing option.
Unit rate
(Des)aggregation Louisiana
Weight 11.11
Color code -
Norm Red > 4.5
Norm Orange 4 - 4.5
Norm Gold 3.8 - 4
Norm Green < 3.8
Data Sources HSH. (2013). Louisiana mortgage rates and refinance rates. Retrieved from http://www.hsh.com/ls-la.html
Value 3.13
Benchmark
The ideal rate would be lower than the national mortgage rate of 3.8%, but should not be higher than 4.5%, the average in a high-rate area (HSH, 2013).
Indicator 9 Public water connection
Physical Living Conditions
Requirement Communities are enhancing local quality of life by integrating public water into the neighbourhood landscape.
Color code red
Indicator description
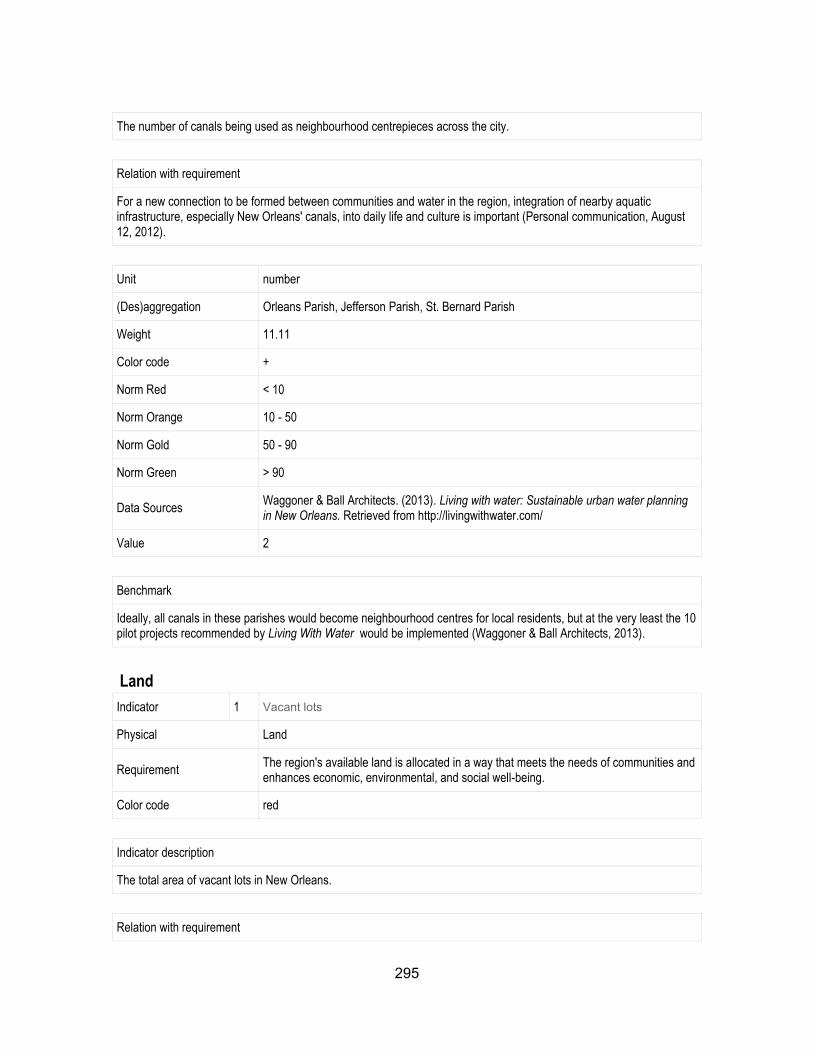
295
The number of canals being used as neighbourhood centrepieces across the city.
Relation with requirement
For a new connection to be formed between communities and water in the region, integration of nearby aquatic infrastructure, especially New Orleans' canals, into daily life and culture is important (Personal communication, August 12, 2012).
Unit number
(Des)aggregation Orleans Parish, Jefferson Parish, St. Bernard Parish
Weight 11.11
Color code +
Norm Red < 10
Norm Orange 10 - 50
Norm Gold 50 - 90
Norm Green > 90
Data Sources Waggoner & Ball Architects. (2013). Living with water: Sustainable urban water planning in New Orleans. Retrieved from http://livingwithwater.com/
Value 2
Benchmark
Ideally, all canals in these parishes would become neighbourhood centres for local residents, but at the very least the 10 pilot projects recommended by Living With Water would be implemented (Waggoner & Ball Architects, 2013).
Land
Indicator 1 Vacant lots
Physical Land
Requirement The region's available land is allocated in a way that meets the needs of communities and enhances economic, environmental, and social well-being.
Color code red
Indicator description
The total area of vacant lots in New Orleans.
Relation with requirement
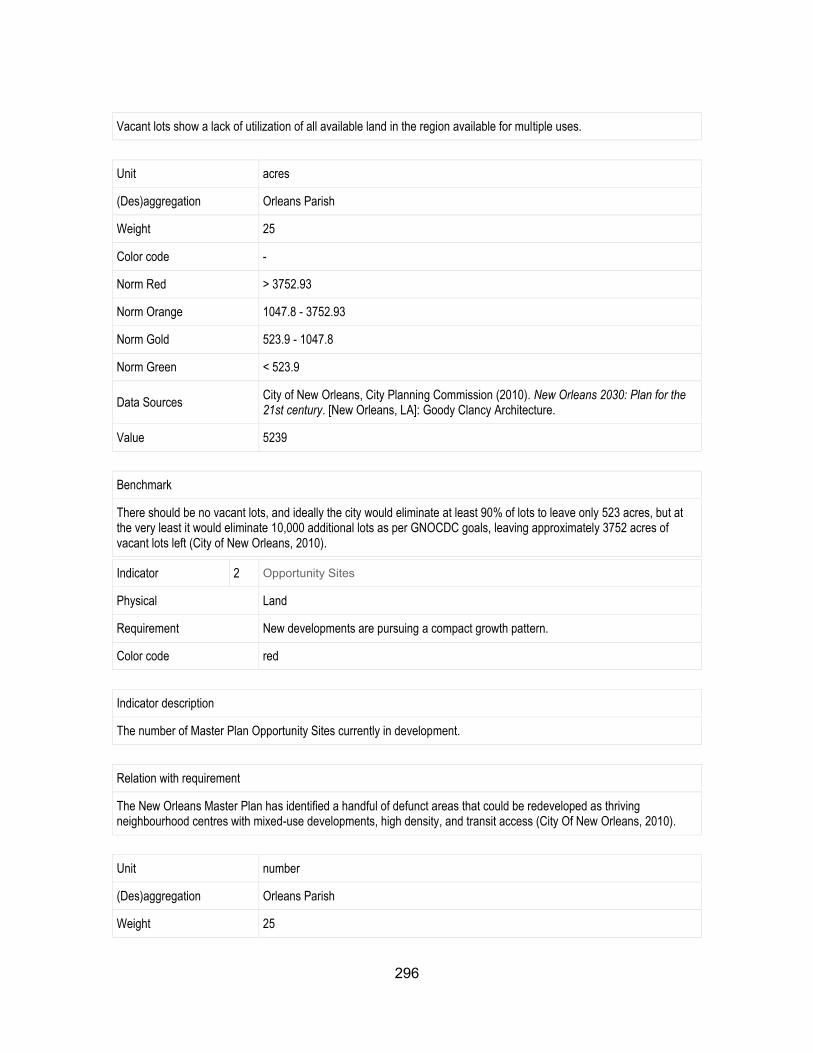
296
Vacant lots show a lack of utilization of all available land in the region available for multiple uses.
Unit acres
(Des)aggregation Orleans Parish
Weight 25
Color code -
Norm Red > 3752.93
Norm Orange 1047.8 - 3752.93
Norm Gold 523.9 - 1047.8
Norm Green < 523.9
Data Sources City of New Orleans, City Planning Commission (2010). New Orleans 2030: Plan for the 21st century. [New Orleans, LA]: Goody Clancy Architecture.
Value 5239
Benchmark
There should be no vacant lots, and ideally the city would eliminate at least 90% of lots to leave only 523 acres, but at the very least it would eliminate 10,000 additional lots as per GNOCDC goals, leaving approximately 3752 acres of vacant lots left (City of New Orleans, 2010).
Indicator 2 Opportunity Sites
Physical Land
Requirement New developments are pursuing a compact growth pattern.
Color code red
Indicator description
The number of Master Plan Opportunity Sites currently in development.
Relation with requirement
The New Orleans Master Plan has identified a handful of defunct areas that could be redeveloped as thriving neighbourhood centres with mixed-use developments, high density, and transit access (City Of New Orleans, 2010).
Unit number
(Des)aggregation Orleans Parish
Weight 25
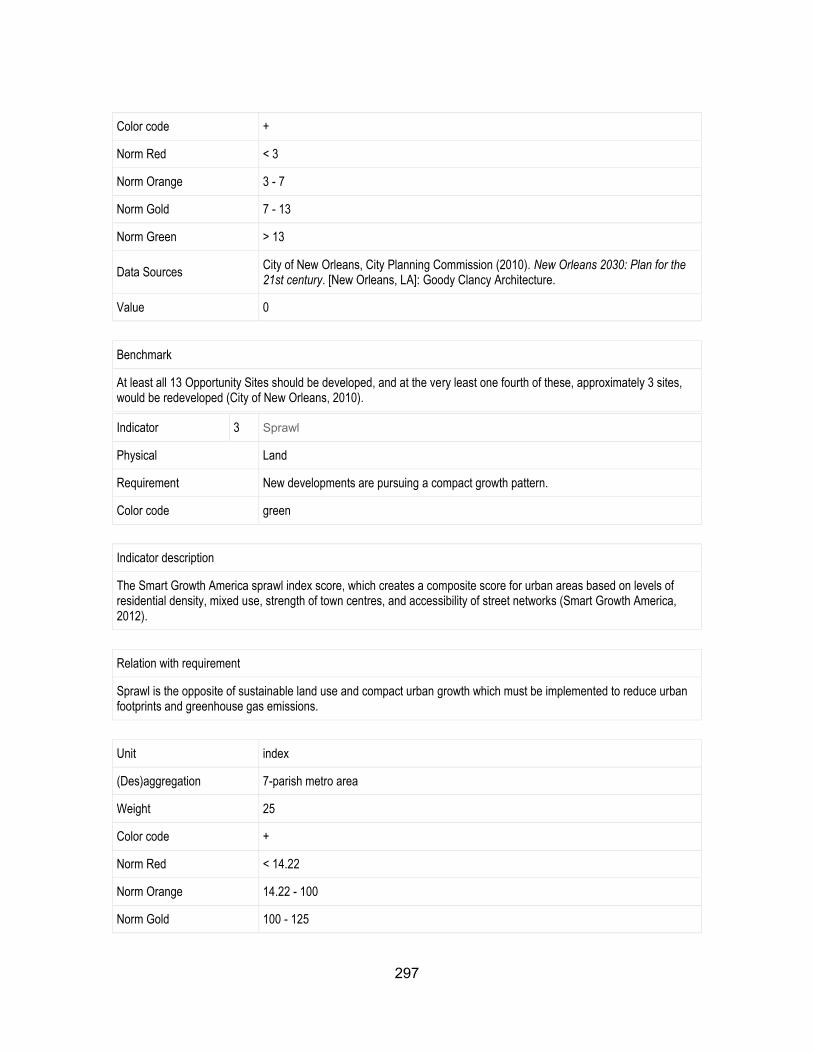
297
Color code +
Norm Red < 3
Norm Orange 3 - 7
Norm Gold 7 - 13
Norm Green > 13
Data Sources City of New Orleans, City Planning Commission (2010). New Orleans 2030: Plan for the 21st century. [New Orleans, LA]: Goody Clancy Architecture.
Value 0
Benchmark
At least all 13 Opportunity Sites should be developed, and at the very least one fourth of these, approximately 3 sites, would be redeveloped (City of New Orleans, 2010).
Indicator 3 Sprawl
Physical Land
Requirement New developments are pursuing a compact growth pattern.
Color code green
Indicator description
The Smart Growth America sprawl index score, which creates a composite score for urban areas based on levels of residential density, mixed use, strength of town centres, and accessibility of street networks (Smart Growth America, 2012).
Relation with requirement
Sprawl is the opposite of sustainable land use and compact urban growth which must be implemented to reduce urban footprints and greenhouse gas emissions.
Unit index
(Des)aggregation 7-parish metro area
Weight 25
Color code +
Norm Red < 14.22
Norm Orange 14.22 - 100
Norm Gold 100 - 125
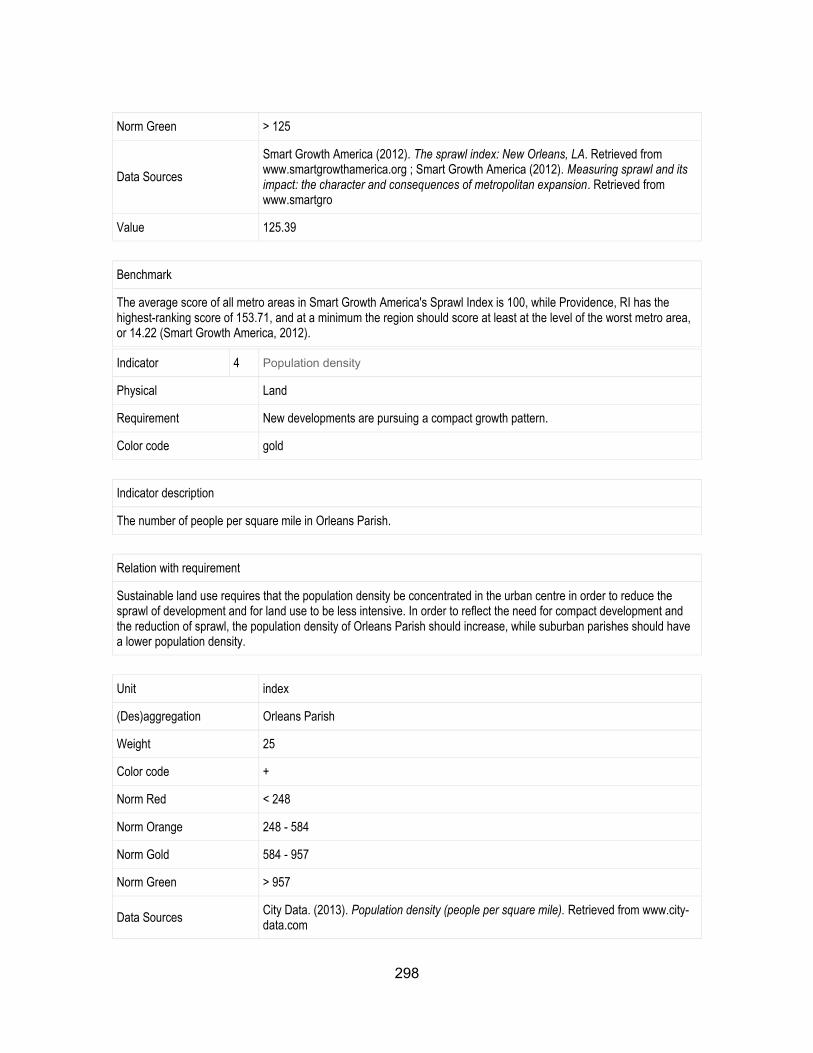
298
Norm Green > 125
Data Sources
Smart Growth America (2012). The sprawl index: New Orleans, LA. Retrieved from www.smartgrowthamerica.org ; Smart Growth America (2012). Measuring sprawl and its impact: the character and consequences of metropolitan expansion. Retrieved from www.smartgro
Value 125.39
Benchmark
The average score of all metro areas in Smart Growth America's Sprawl Index is 100, while Providence, RI has the highest-ranking score of 153.71, and at a minimum the region should score at least at the level of the worst metro area, or 14.22 (Smart Growth America, 2012).
Indicator 4 Population density
Physical Land
Requirement New developments are pursuing a compact growth pattern.
Color code gold
Indicator description
The number of people per square mile in Orleans Parish.
Relation with requirement
Sustainable land use requires that the population density be concentrated in the urban centre in order to reduce the sprawl of development and for land use to be less intensive. In order to reflect the need for compact development and the reduction of sprawl, the population density of Orleans Parish should increase, while suburban parishes should have a lower population density.
Unit index
(Des)aggregation Orleans Parish
Weight 25
Color code +
Norm Red < 248
Norm Orange 248 - 584
Norm Gold 584 - 957
Norm Green > 957
Data Sources City Data. (2013). Population density (people per square mile). Retrieved from www.city-data.com
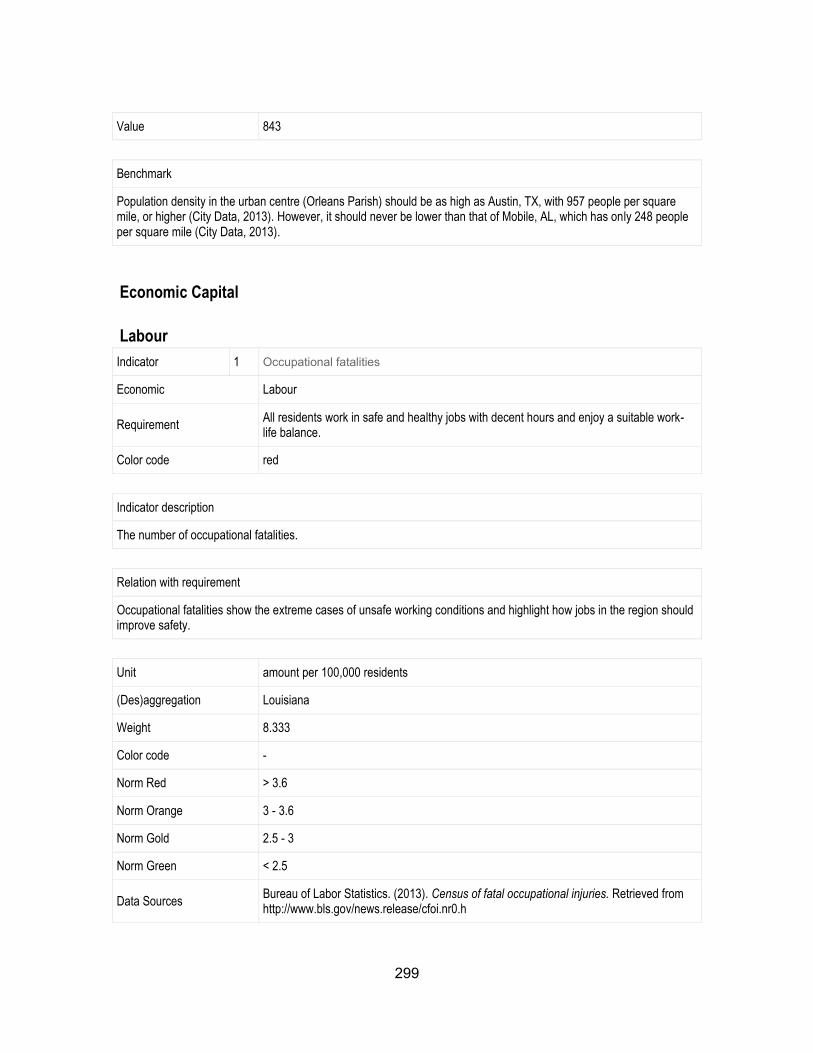
299
Value 843
Benchmark
Population density in the urban centre (Orleans Parish) should be as high as Austin, TX, with 957 people per square mile, or higher (City Data, 2013). However, it should never be lower than that of Mobile, AL, which has only 248 people per square mile (City Data, 2013).
Economic Capital
Labour
Indicator 1 Occupational fatalities
Economic Labour
Requirement All residents work in safe and healthy jobs with decent hours and enjoy a suitable work-life balance.
Color code red
Indicator description
The number of occupational fatalities.
Relation with requirement
Occupational fatalities show the extreme cases of unsafe working conditions and highlight how jobs in the region should improve safety.
Unit amount per 100,000 residents
(Des)aggregation Louisiana
Weight 8.333
Color code -
Norm Red > 3.6
Norm Orange 3 - 3.6
Norm Gold 2.5 - 3
Norm Green < 2.5
Data Sources Bureau of Labor Statistics. (2013). Census of fatal occupational injuries. Retrieved from http://www.bls.gov/news.release/cfoi.nr0.h
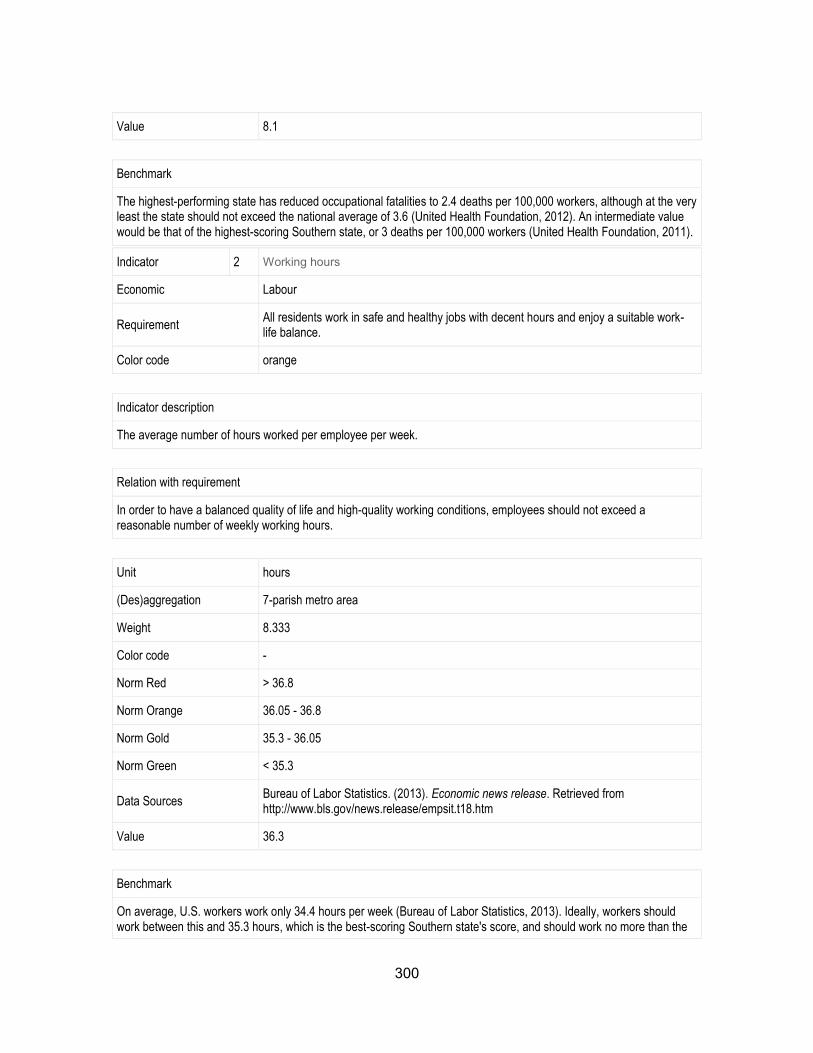
300
Value 8.1
Benchmark
The highest-performing state has reduced occupational fatalities to 2.4 deaths per 100,000 workers, although at the very least the state should not exceed the national average of 3.6 (United Health Foundation, 2012). An intermediate value would be that of the highest-scoring Southern state, or 3 deaths per 100,000 workers (United Health Foundation, 2011).
Indicator 2 Working hours
Economic Labour
Requirement All residents work in safe and healthy jobs with decent hours and enjoy a suitable work-life balance.
Color code orange
Indicator description
The average number of hours worked per employee per week.
Relation with requirement
In order to have a balanced quality of life and high-quality working conditions, employees should not exceed a reasonable number of weekly working hours.
Unit hours
(Des)aggregation 7-parish metro area
Weight 8.333
Color code -
Norm Red > 36.8
Norm Orange 36.05 - 36.8
Norm Gold 35.3 - 36.05
Norm Green < 35.3
Data Sources Bureau of Labor Statistics. (2013). Economic news release. Retrieved from http://www.bls.gov/news.release/empsit.t18.htm
Value 36.3
Benchmark
On average, U.S. workers work only 34.4 hours per week (Bureau of Labor Statistics, 2013). Ideally, workers should work between this and 35.3 hours, which is the best-scoring Southern state's score, and should work no more than the
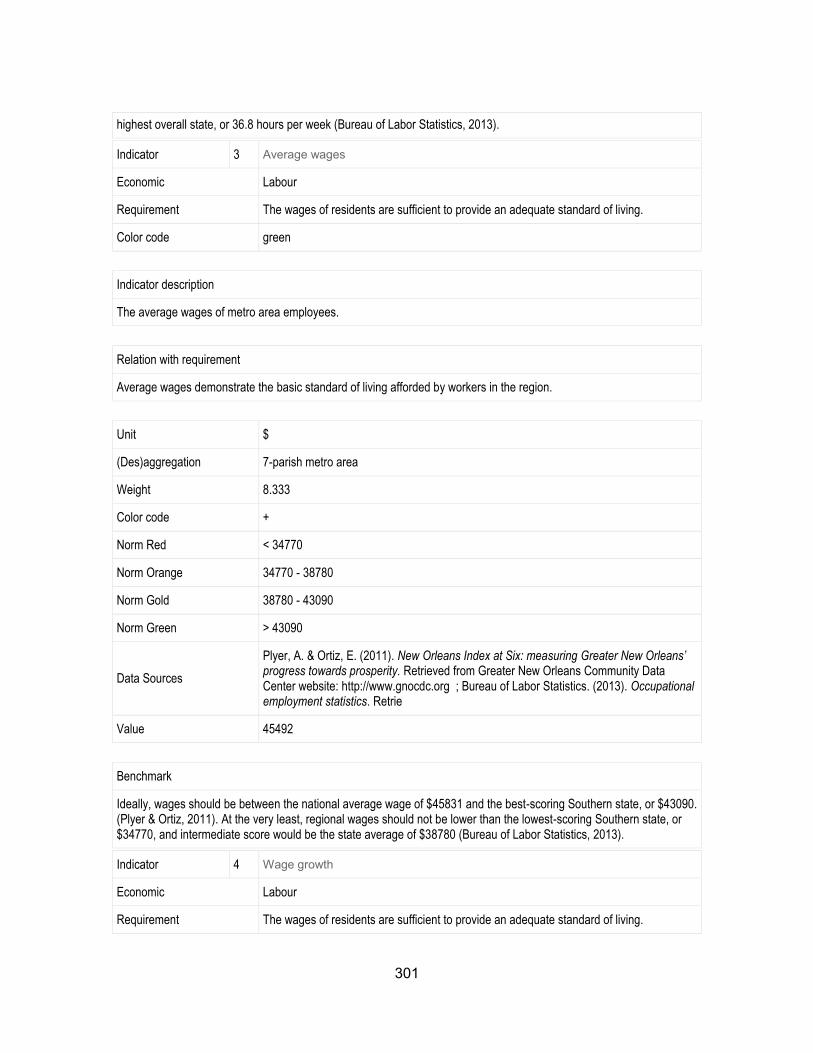
301
highest overall state, or 36.8 hours per week (Bureau of Labor Statistics, 2013).
Indicator 3 Average wages
Economic Labour
Requirement The wages of residents are sufficient to provide an adequate standard of living.
Color code green
Indicator description
The average wages of metro area employees.
Relation with requirement
Average wages demonstrate the basic standard of living afforded by workers in the region.
Unit $
(Des)aggregation 7-parish metro area
Weight 8.333
Color code +
Norm Red < 34770
Norm Orange 34770 - 38780
Norm Gold 38780 - 43090
Norm Green > 43090
Data Sources
Plyer, A. & Ortiz, E. (2011). New Orleans Index at Six: measuring Greater New Orleans’ progress towards prosperity. Retrieved from Greater New Orleans Community Data Center website: http://www.gnocdc.org ; Bureau of Labor Statistics. (2013). Occupational employment statistics. Retrie
Value 45492
Benchmark
Ideally, wages should be between the national average wage of $45831 and the best-scoring Southern state, or $43090. (Plyer & Ortiz, 2011). At the very least, regional wages should not be lower than the lowest-scoring Southern state, or $34770, and intermediate score would be the state average of $38780 (Bureau of Labor Statistics, 2013).
Indicator 4 Wage growth
Economic Labour
Requirement The wages of residents are sufficient to provide an adequate standard of living.
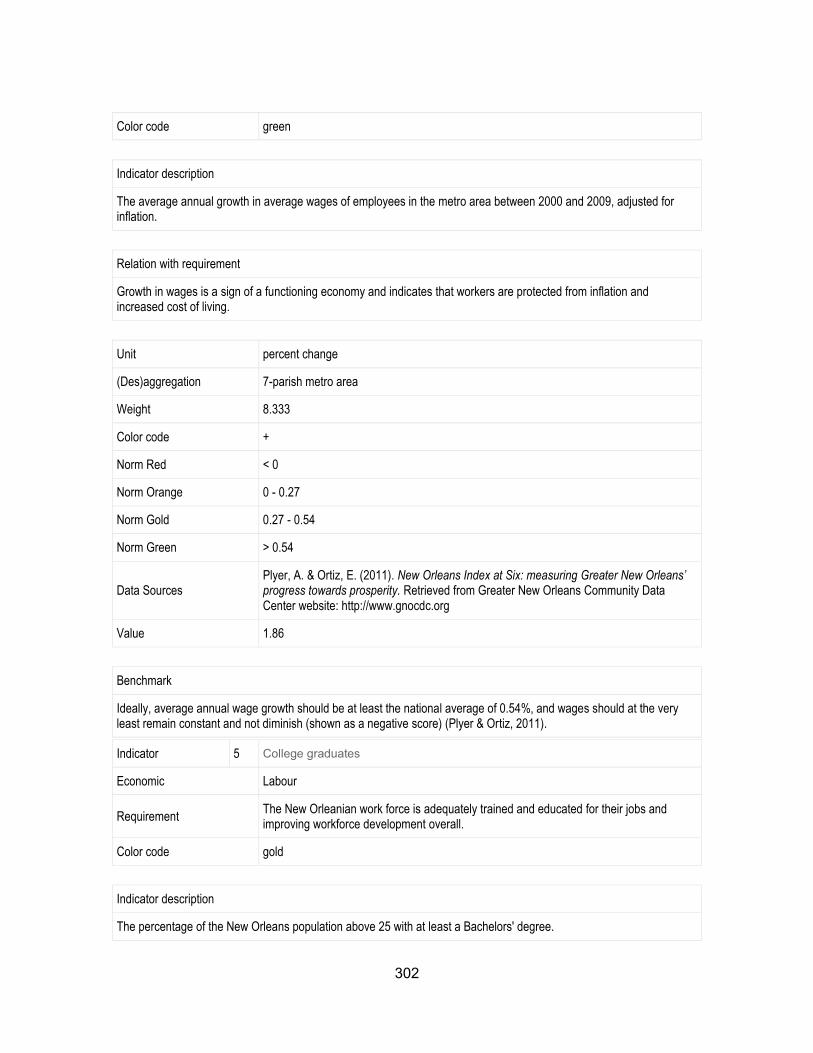
302
Color code green
Indicator description
The average annual growth in average wages of employees in the metro area between 2000 and 2009, adjusted for inflation.
Relation with requirement
Growth in wages is a sign of a functioning economy and indicates that workers are protected from inflation and increased cost of living.
Unit percent change
(Des)aggregation 7-parish metro area
Weight 8.333
Color code +
Norm Red < 0
Norm Orange 0 - 0.27
Norm Gold 0.27 - 0.54
Norm Green > 0.54
Data Sources Plyer, A. & Ortiz, E. (2011). New Orleans Index at Six: measuring Greater New Orleans’ progress towards prosperity. Retrieved from Greater New Orleans Community Data Center website: http://www.gnocdc.org
Value 1.86
Benchmark
Ideally, average annual wage growth should be at least the national average of 0.54%, and wages should at the very least remain constant and not diminish (shown as a negative score) (Plyer & Ortiz, 2011).
Indicator 5 College graduates
Economic Labour
Requirement The New Orleanian work force is adequately trained and educated for their jobs and improving workforce development overall.
Color code gold
Indicator description
The percentage of the New Orleans population above 25 with at least a Bachelors' degree.
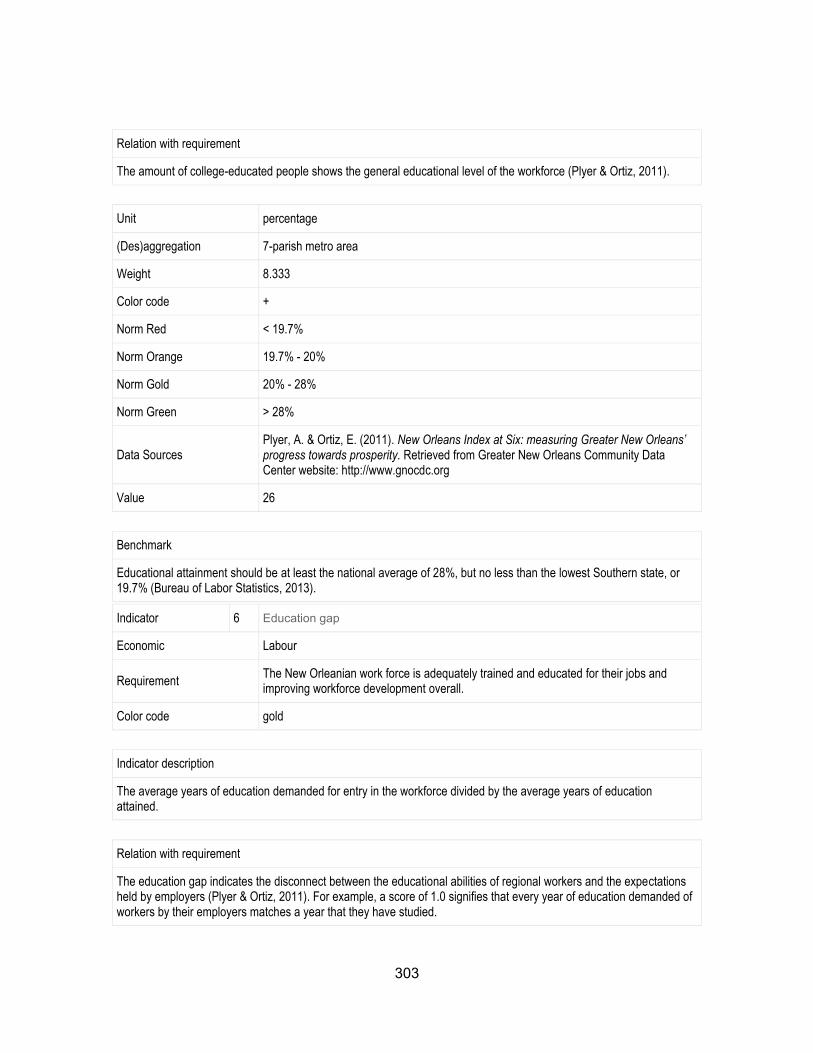
303
Relation with requirement
The amount of college-educated people shows the general educational level of the workforce (Plyer & Ortiz, 2011).
Unit percentage
(Des)aggregation 7-parish metro area
Weight 8.333
Color code +
Norm Red < 19.7%
Norm Orange 19.7% - 20%
Norm Gold 20% - 28%
Norm Green > 28%
Data Sources Plyer, A. & Ortiz, E. (2011). New Orleans Index at Six: measuring Greater New Orleans’ progress towards prosperity. Retrieved from Greater New Orleans Community Data Center website: http://www.gnocdc.org
Value 26
Benchmark
Educational attainment should be at least the national average of 28%, but no less than the lowest Southern state, or 19.7% (Bureau of Labor Statistics, 2013).
Indicator 6 Education gap
Economic Labour
Requirement The New Orleanian work force is adequately trained and educated for their jobs and improving workforce development overall.
Color code gold
Indicator description
The average years of education demanded for entry in the workforce divided by the average years of education attained.
Relation with requirement
The education gap indicates the disconnect between the educational abilities of regional workers and the expectations held by employers (Plyer & Ortiz, 2011). For example, a score of 1.0 signifies that every year of education demanded of workers by their employers matches a year that they have studied.
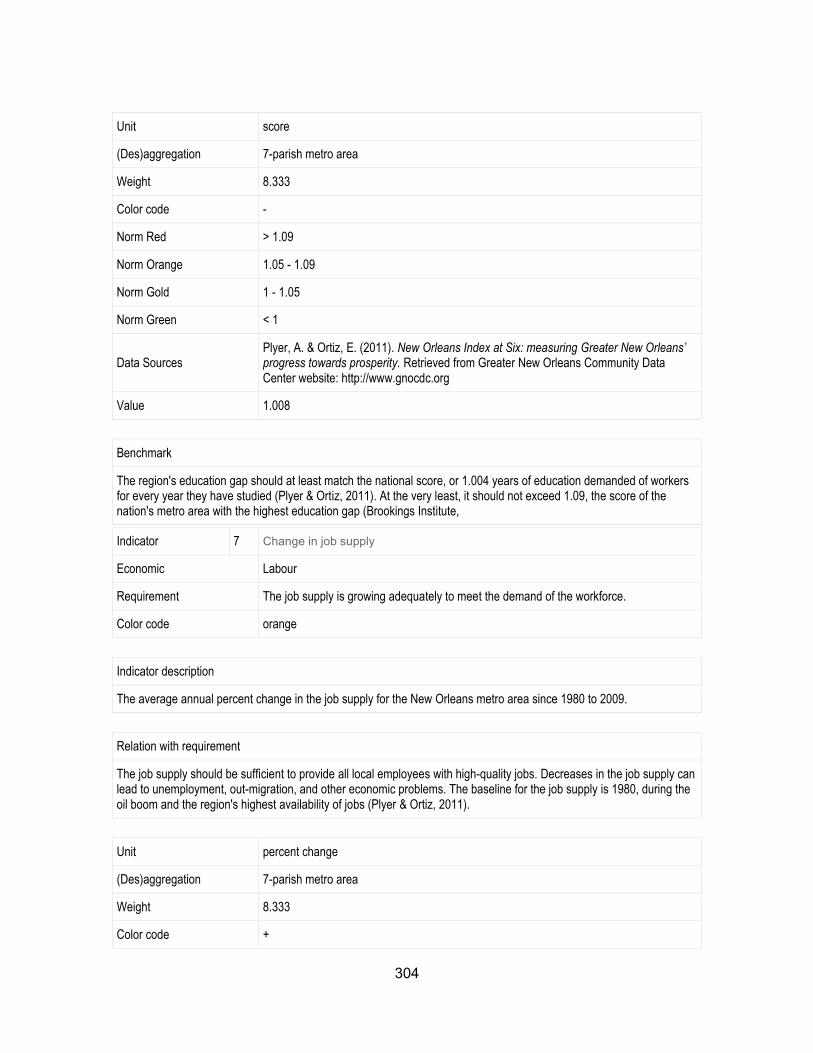
304
Unit score
(Des)aggregation 7-parish metro area
Weight 8.333
Color code -
Norm Red > 1.09
Norm Orange 1.05 - 1.09
Norm Gold 1 - 1.05
Norm Green < 1
Data Sources Plyer, A. & Ortiz, E. (2011). New Orleans Index at Six: measuring Greater New Orleans’ progress towards prosperity. Retrieved from Greater New Orleans Community Data Center website: http://www.gnocdc.org
Value 1.008
Benchmark
The region's education gap should at least match the national score, or 1.004 years of education demanded of workers for every year they have studied (Plyer & Ortiz, 2011). At the very least, it should not exceed 1.09, the score of the nation's metro area with the highest education gap (Brookings Institute,
Indicator 7 Change in job supply
Economic Labour
Requirement The job supply is growing adequately to meet the demand of the workforce.
Color code orange
Indicator description
The average annual percent change in the job supply for the New Orleans metro area since 1980 to 2009.
Relation with requirement
The job supply should be sufficient to provide all local employees with high-quality jobs. Decreases in the job supply can lead to unemployment, out-migration, and other economic problems. The baseline for the job supply is 1980, during the oil boom and the region's highest availability of jobs (Plyer & Ortiz, 2011).
Unit percent change
(Des)aggregation 7-parish metro area
Weight 8.333
Color code +
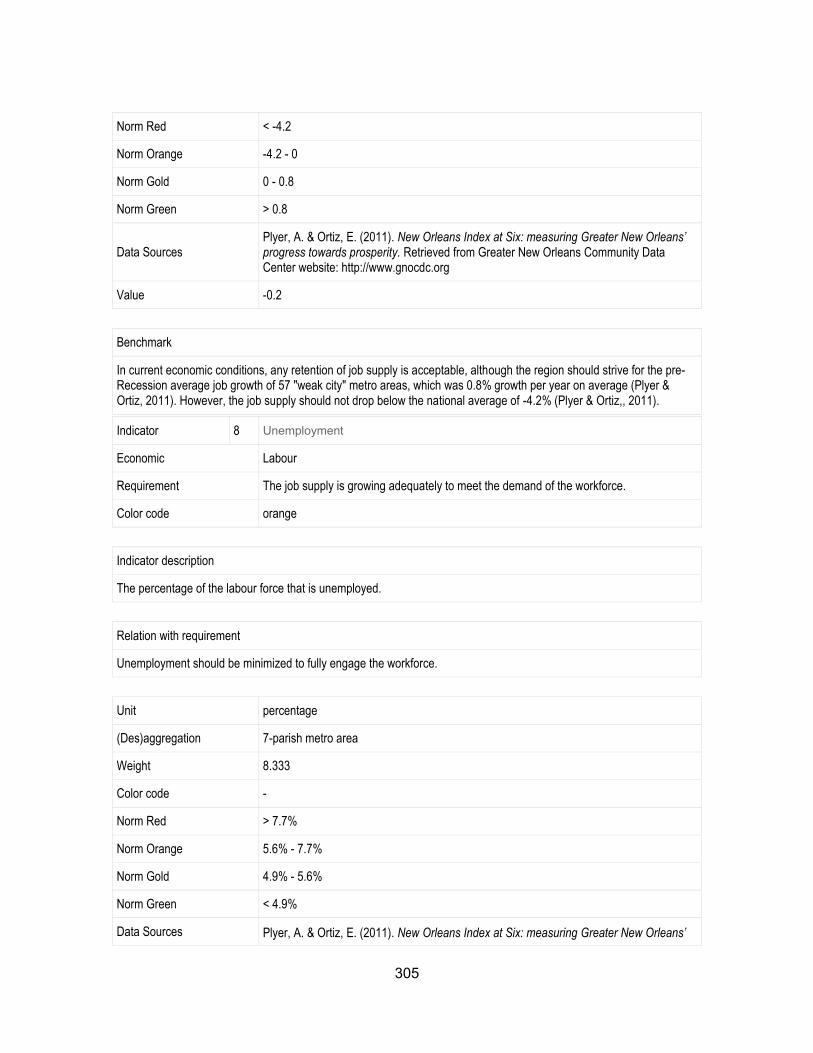
305
Norm Red < -4.2
Norm Orange -4.2 - 0
Norm Gold 0 - 0.8
Norm Green > 0.8
Data Sources Plyer, A. & Ortiz, E. (2011). New Orleans Index at Six: measuring Greater New Orleans’ progress towards prosperity. Retrieved from Greater New Orleans Community Data Center website: http://www.gnocdc.org
Value -0.2
Benchmark
In current economic conditions, any retention of job supply is acceptable, although the region should strive for the pre-Recession average job growth of 57 "weak city" metro areas, which was 0.8% growth per year on average (Plyer & Ortiz, 2011). However, the job supply should not drop below the national average of -4.2% (Plyer & Ortiz,, 2011).
Indicator 8 Unemployment
Economic Labour
Requirement The job supply is growing adequately to meet the demand of the workforce.
Color code orange
Indicator description
The percentage of the labour force that is unemployed.
Relation with requirement
Unemployment should be minimized to fully engage the workforce.
Unit percentage
(Des)aggregation 7-parish metro area
Weight 8.333
Color code -
Norm Red > 7.7%
Norm Orange 5.6% - 7.7%
Norm Gold 4.9% - 5.6%
Norm Green < 4.9%
Data Sources Plyer, A. & Ortiz, E. (2011). New Orleans Index at Six: measuring Greater New Orleans’
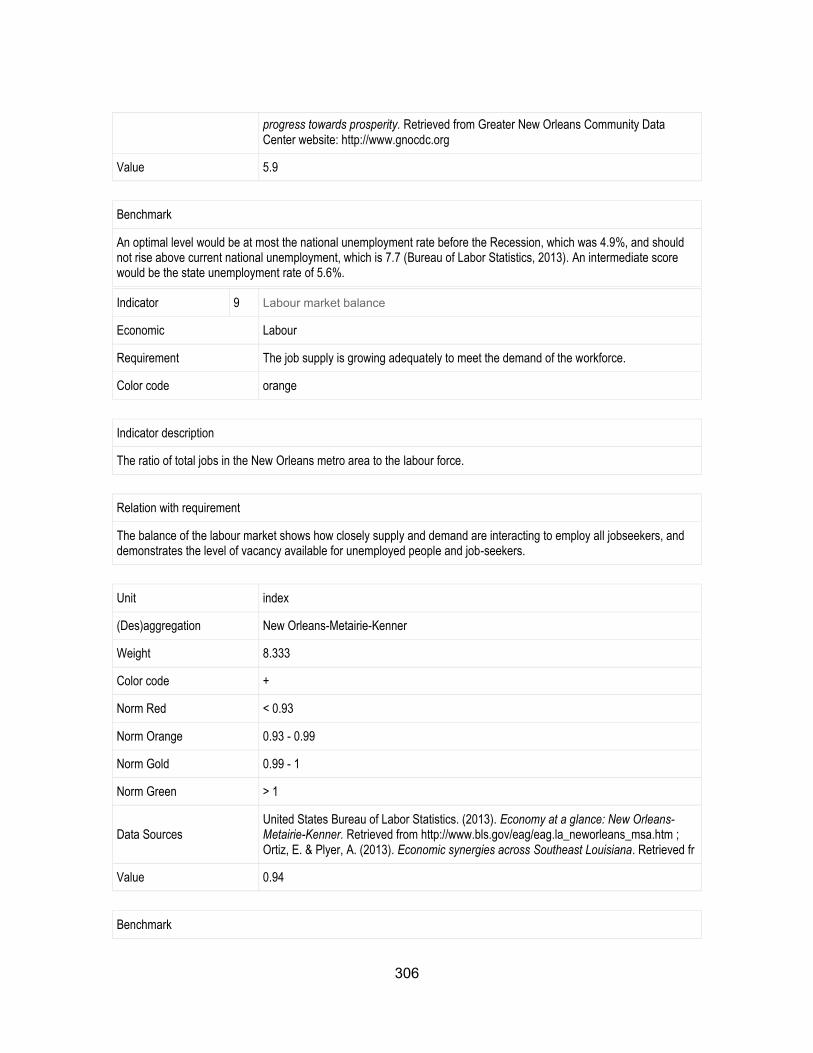
306
progress towards prosperity. Retrieved from Greater New Orleans Community Data Center website: http://www.gnocdc.org
Value 5.9
Benchmark
An optimal level would be at most the national unemployment rate before the Recession, which was 4.9%, and should not rise above current national unemployment, which is 7.7 (Bureau of Labor Statistics, 2013). An intermediate score would be the state unemployment rate of 5.6%.
Indicator 9 Labour market balance
Economic Labour
Requirement The job supply is growing adequately to meet the demand of the workforce.
Color code orange
Indicator description
The ratio of total jobs in the New Orleans metro area to the labour force.
Relation with requirement
The balance of the labour market shows how closely supply and demand are interacting to employ all jobseekers, and demonstrates the level of vacancy available for unemployed people and job-seekers.
Unit index
(Des)aggregation New Orleans-Metairie-Kenner
Weight 8.333
Color code +
Norm Red < 0.93
Norm Orange 0.93 - 0.99
Norm Gold 0.99 - 1
Norm Green > 1
Data Sources United States Bureau of Labor Statistics. (2013). Economy at a glance: New Orleans-Metairie-Kenner. Retrieved from http://www.bls.gov/eag/eag.la_neworleans_msa.htm ; Ortiz, E. & Plyer, A. (2013). Economic synergies across Southeast Louisiana. Retrieved fr
Value 0.94
Benchmark
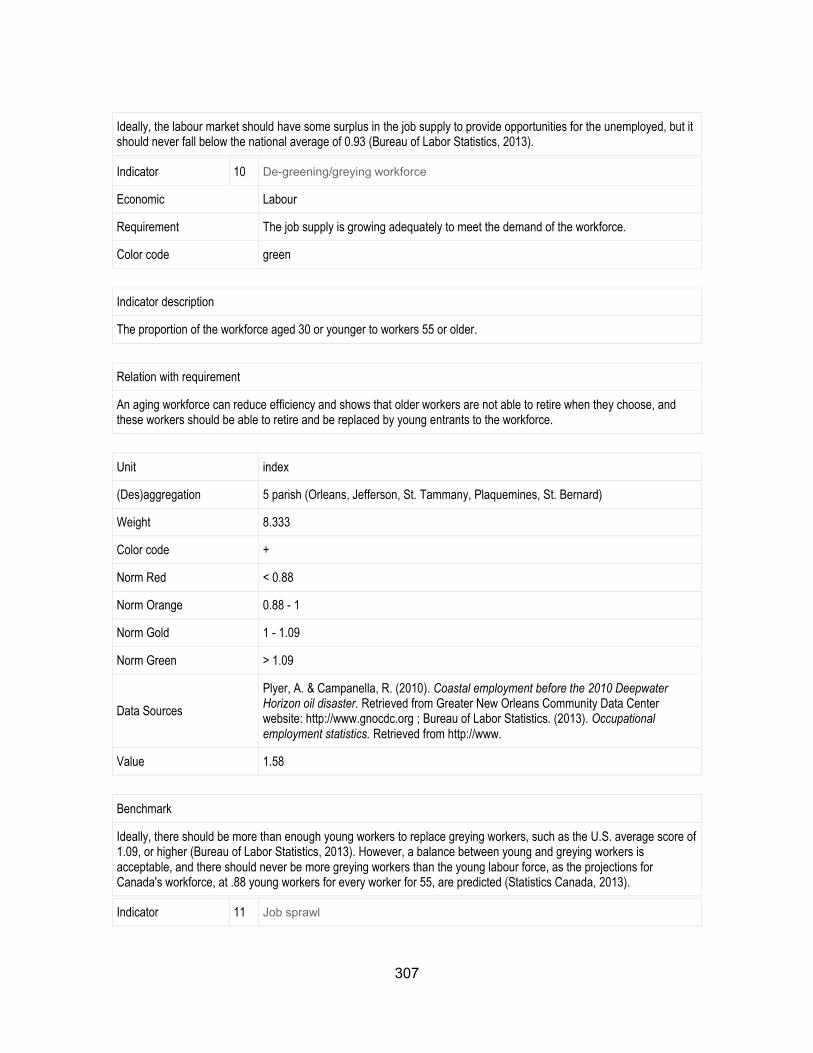
307
Ideally, the labour market should have some surplus in the job supply to provide opportunities for the unemployed, but it should never fall below the national average of 0.93 (Bureau of Labor Statistics, 2013).
Indicator 10 De-greening/greying workforce
Economic Labour
Requirement The job supply is growing adequately to meet the demand of the workforce.
Color code green
Indicator description
The proportion of the workforce aged 30 or younger to workers 55 or older.
Relation with requirement
An aging workforce can reduce efficiency and shows that older workers are not able to retire when they choose, and these workers should be able to retire and be replaced by young entrants to the workforce.
Unit index
(Des)aggregation 5 parish (Orleans, Jefferson, St. Tammany, Plaquemines, St. Bernard)
Weight 8.333
Color code +
Norm Red < 0.88
Norm Orange 0.88 - 1
Norm Gold 1 - 1.09
Norm Green > 1.09
Data Sources
Plyer, A. & Campanella, R. (2010). Coastal employment before the 2010 Deepwater Horizon oil disaster. Retrieved from Greater New Orleans Community Data Center website: http://www.gnocdc.org ; Bureau of Labor Statistics. (2013). Occupational employment statistics. Retrieved from http://www.
Value 1.58
Benchmark
Ideally, there should be more than enough young workers to replace greying workers, such as the U.S. average score of 1.09, or higher (Bureau of Labor Statistics, 2013). However, a balance between young and greying workers is acceptable, and there should never be more greying workers than the young labour force, as the projections for Canada's workforce, at .88 young workers for every worker for 55, are predicted (Statistics Canada, 2013).
Indicator 11 Job sprawl
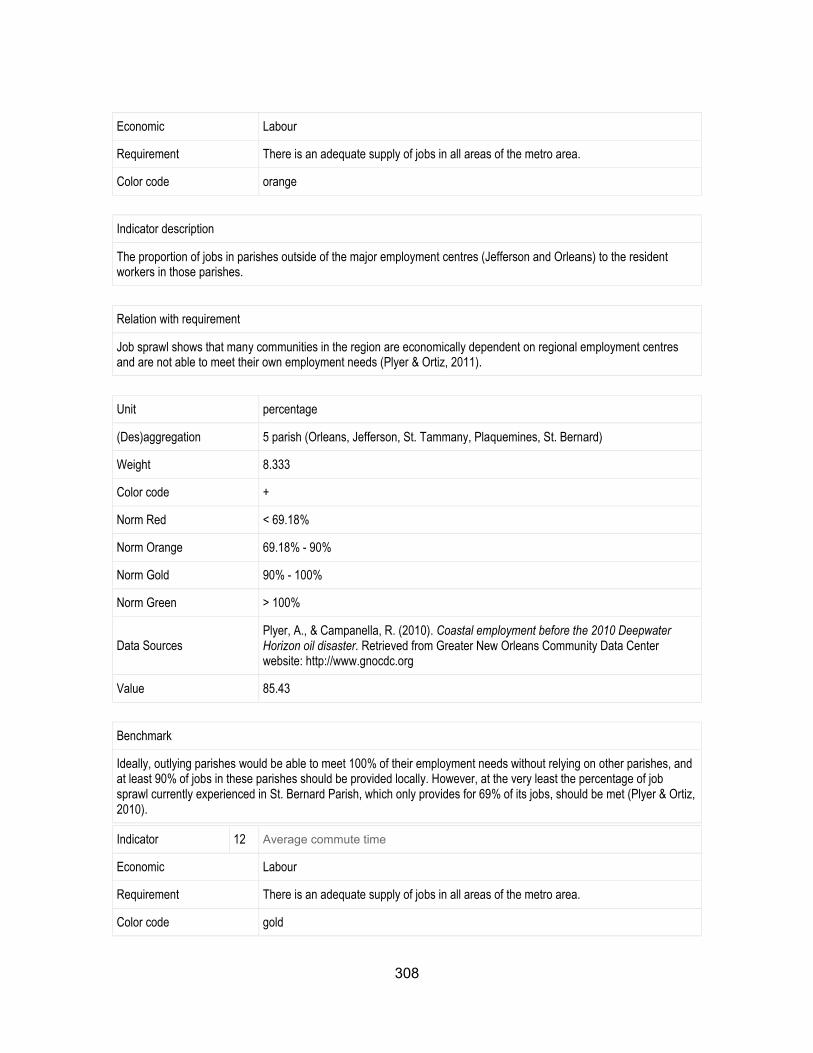
308
Economic Labour
Requirement There is an adequate supply of jobs in all areas of the metro area.
Color code orange
Indicator description
The proportion of jobs in parishes outside of the major employment centres (Jefferson and Orleans) to the resident workers in those parishes.
Relation with requirement
Job sprawl shows that many communities in the region are economically dependent on regional employment centres and are not able to meet their own employment needs (Plyer & Ortiz, 2011).
Unit percentage
(Des)aggregation 5 parish (Orleans, Jefferson, St. Tammany, Plaquemines, St. Bernard)
Weight 8.333
Color code +
Norm Red < 69.18%
Norm Orange 69.18% - 90%
Norm Gold 90% - 100%
Norm Green > 100%
Data Sources Plyer, A., & Campanella, R. (2010). Coastal employment before the 2010 Deepwater Horizon oil disaster. Retrieved from Greater New Orleans Community Data Center website: http://www.gnocdc.org
Value 85.43
Benchmark
Ideally, outlying parishes would be able to meet 100% of their employment needs without relying on other parishes, and at least 90% of jobs in these parishes should be provided locally. However, at the very least the percentage of job sprawl currently experienced in St. Bernard Parish, which only provides for 69% of its jobs, should be met (Plyer & Ortiz, 2010).
Indicator 12 Average commute time
Economic Labour
Requirement There is an adequate supply of jobs in all areas of the metro area.
Color code gold
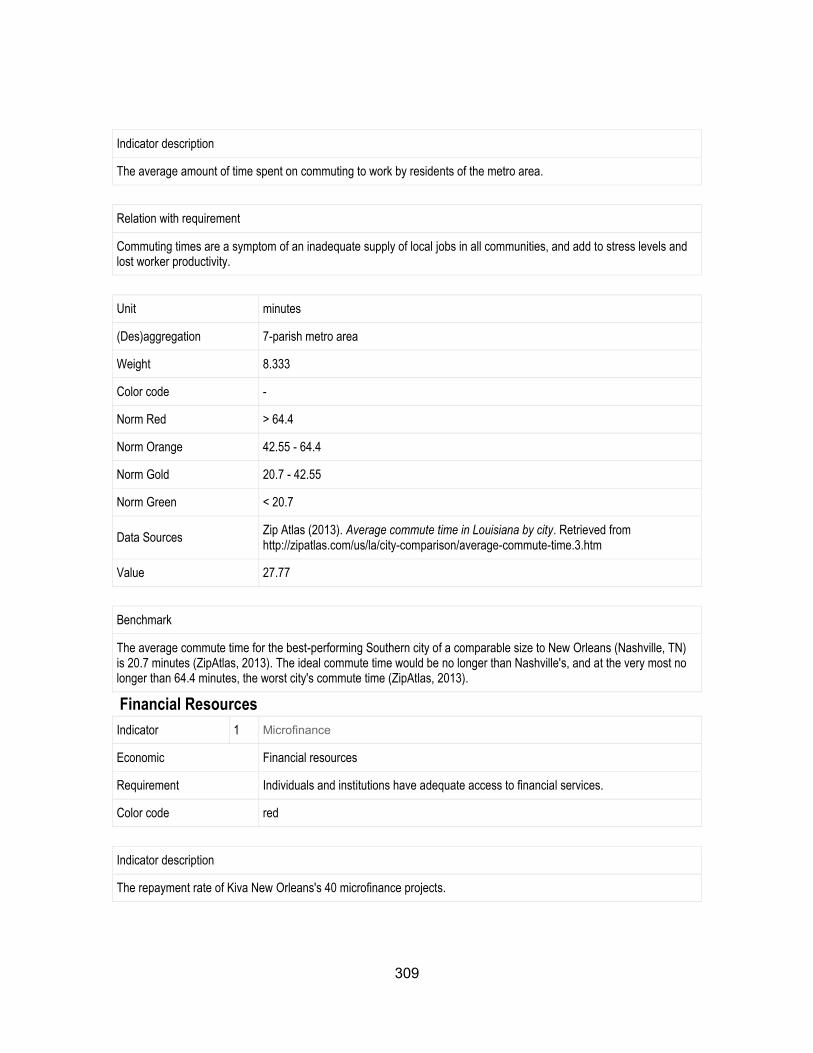
309
Indicator description
The average amount of time spent on commuting to work by residents of the metro area.
Relation with requirement
Commuting times are a symptom of an inadequate supply of local jobs in all communities, and add to stress levels and lost worker productivity.
Unit minutes
(Des)aggregation 7-parish metro area
Weight 8.333
Color code -
Norm Red > 64.4
Norm Orange 42.55 - 64.4
Norm Gold 20.7 - 42.55
Norm Green < 20.7
Data Sources Zip Atlas (2013). Average commute time in Louisiana by city. Retrieved from http://zipatlas.com/us/la/city-comparison/average-commute-time.3.htm
Value 27.77
Benchmark
The average commute time for the best-performing Southern city of a comparable size to New Orleans (Nashville, TN) is 20.7 minutes (ZipAtlas, 2013). The ideal commute time would be no longer than Nashville's, and at the very most no longer than 64.4 minutes, the worst city's commute time (ZipAtlas, 2013).
Financial Resources
Indicator 1 Microfinance
Economic Financial resources
Requirement Individuals and institutions have adequate access to financial services.
Color code red
Indicator description
The repayment rate of Kiva New Orleans's 40 microfinance projects.
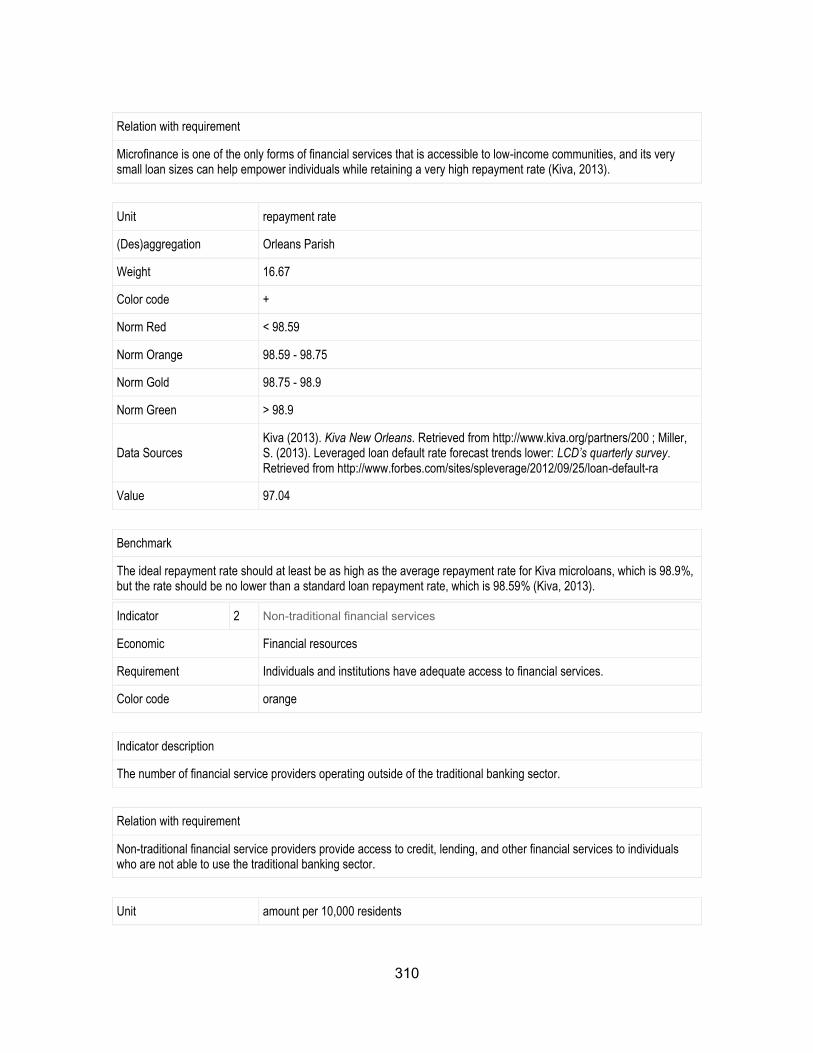
310
Relation with requirement
Microfinance is one of the only forms of financial services that is accessible to low-income communities, and its very small loan sizes can help empower individuals while retaining a very high repayment rate (Kiva, 2013).
Unit repayment rate
(Des)aggregation Orleans Parish
Weight 16.67
Color code +
Norm Red < 98.59
Norm Orange 98.59 - 98.75
Norm Gold 98.75 - 98.9
Norm Green > 98.9
Data Sources Kiva (2013). Kiva New Orleans. Retrieved from http://www.kiva.org/partners/200 ; Miller, S. (2013). Leveraged loan default rate forecast trends lower: LCD’s quarterly survey. Retrieved from http://www.forbes.com/sites/spleverage/2012/09/25/loan-default-ra
Value 97.04
Benchmark
The ideal repayment rate should at least be as high as the average repayment rate for Kiva microloans, which is 98.9%, but the rate should be no lower than a standard loan repayment rate, which is 98.59% (Kiva, 2013).
Indicator 2 Non-traditional financial services
Economic Financial resources
Requirement Individuals and institutions have adequate access to financial services.
Color code orange
Indicator description
The number of financial service providers operating outside of the traditional banking sector.
Relation with requirement
Non-traditional financial service providers provide access to credit, lending, and other financial services to individuals who are not able to use the traditional banking sector.
Unit amount per 10,000 residents
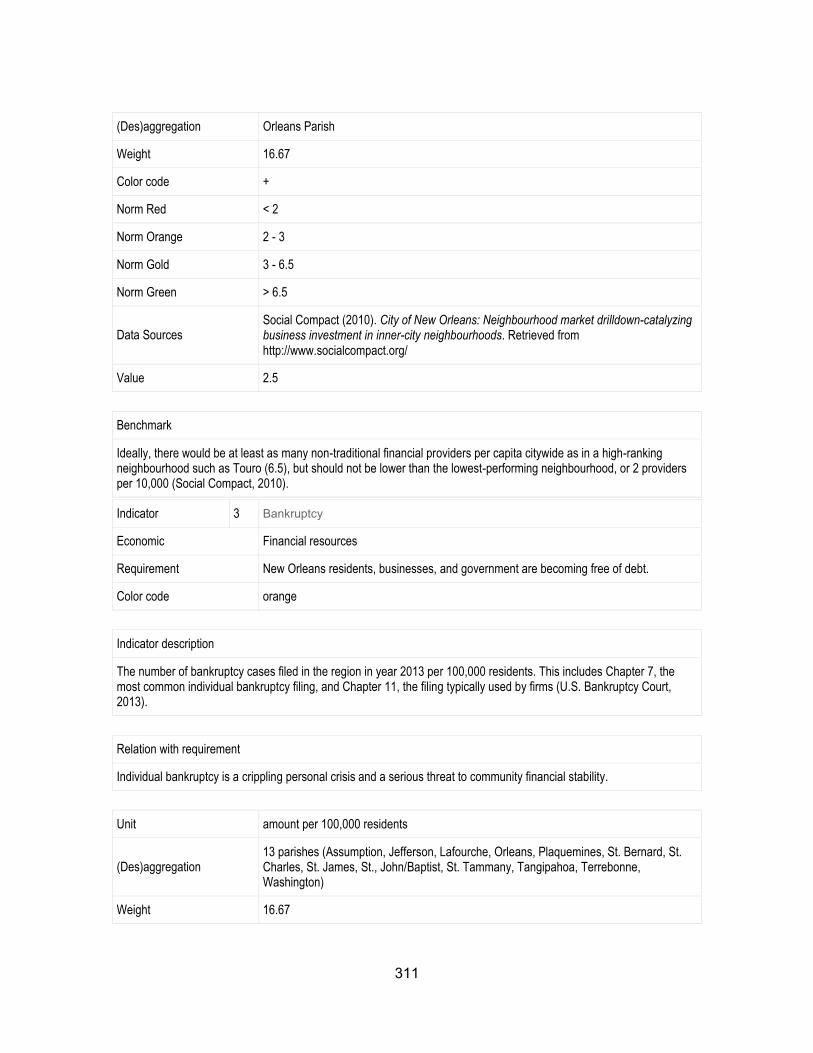
311
(Des)aggregation Orleans Parish
Weight 16.67
Color code +
Norm Red < 2
Norm Orange 2 - 3
Norm Gold 3 - 6.5
Norm Green > 6.5
Data Sources Social Compact (2010). City of New Orleans: Neighbourhood market drilldown-catalyzing business investment in inner-city neighbourhoods. Retrieved from http://www.socialcompact.org/
Value 2.5
Benchmark
Ideally, there would be at least as many non-traditional financial providers per capita citywide as in a high-ranking neighbourhood such as Touro (6.5), but should not be lower than the lowest-performing neighbourhood, or 2 providers per 10,000 (Social Compact, 2010).
Indicator 3 Bankruptcy
Economic Financial resources
Requirement New Orleans residents, businesses, and government are becoming free of debt.
Color code orange
Indicator description
The number of bankruptcy cases filed in the region in year 2013 per 100,000 residents. This includes Chapter 7, the most common individual bankruptcy filing, and Chapter 11, the filing typically used by firms (U.S. Bankruptcy Court, 2013).
Relation with requirement
Individual bankruptcy is a crippling personal crisis and a serious threat to community financial stability.
Unit amount per 100,000 residents
(Des)aggregation 13 parishes (Assumption, Jefferson, Lafourche, Orleans, Plaquemines, St. Bernard, St. Charles, St. James, St., John/Baptist, St. Tammany, Tangipahoa, Terrebonne, Washington)
Weight 16.67
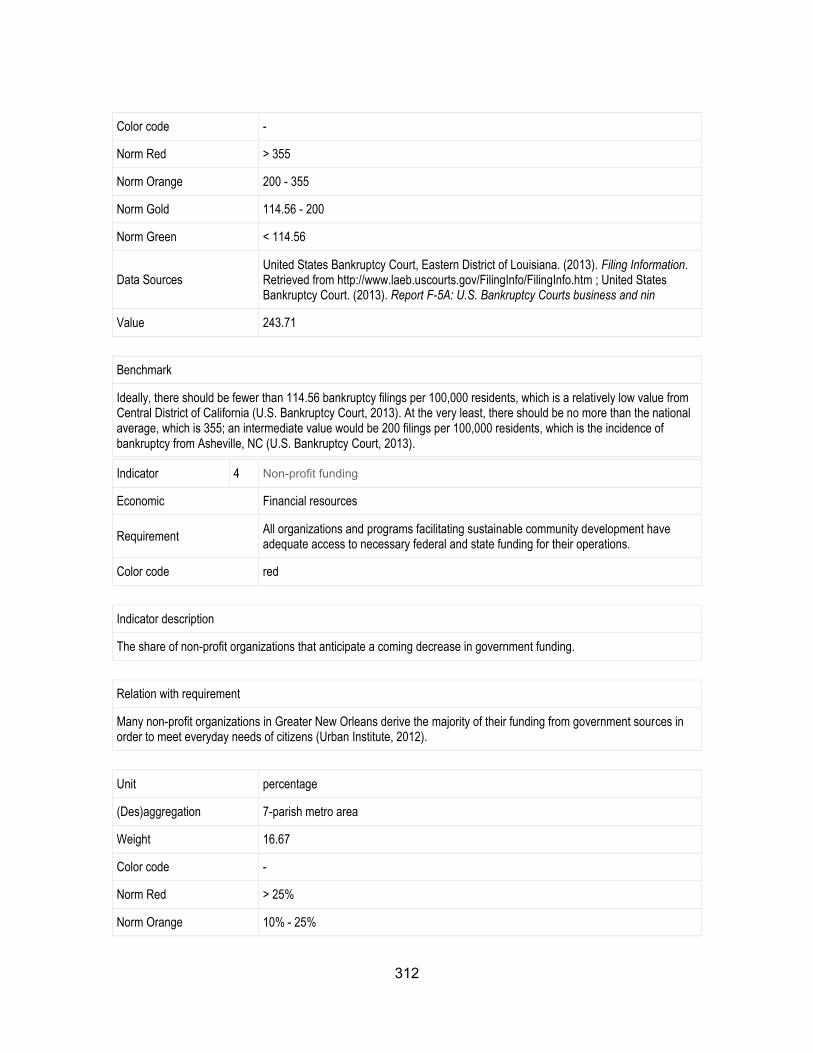
312
Color code -
Norm Red > 355
Norm Orange 200 - 355
Norm Gold 114.56 - 200
Norm Green < 114.56
Data Sources United States Bankruptcy Court, Eastern District of Louisiana. (2013). Filing Information. Retrieved from http://www.laeb.uscourts.gov/FilingInfo/FilingInfo.htm ; United States Bankruptcy Court. (2013). Report F-5A: U.S. Bankruptcy Courts business and nin
Value 243.71
Benchmark
Ideally, there should be fewer than 114.56 bankruptcy filings per 100,000 residents, which is a relatively low value from Central District of California (U.S. Bankruptcy Court, 2013). At the very least, there should be no more than the national average, which is 355; an intermediate value would be 200 filings per 100,000 residents, which is the incidence of bankruptcy from Asheville, NC (U.S. Bankruptcy Court, 2013).
Indicator 4 Non-profit funding
Economic Financial resources
Requirement All organizations and programs facilitating sustainable community development have adequate access to necessary federal and state funding for their operations.
Color code red
Indicator description
The share of non-profit organizations that anticipate a coming decrease in government funding.
Relation with requirement
Many non-profit organizations in Greater New Orleans derive the majority of their funding from government sources in order to meet everyday needs of citizens (Urban Institute, 2012).
Unit percentage
(Des)aggregation 7-parish metro area
Weight 16.67
Color code -
Norm Red > 25%
Norm Orange 10% - 25%
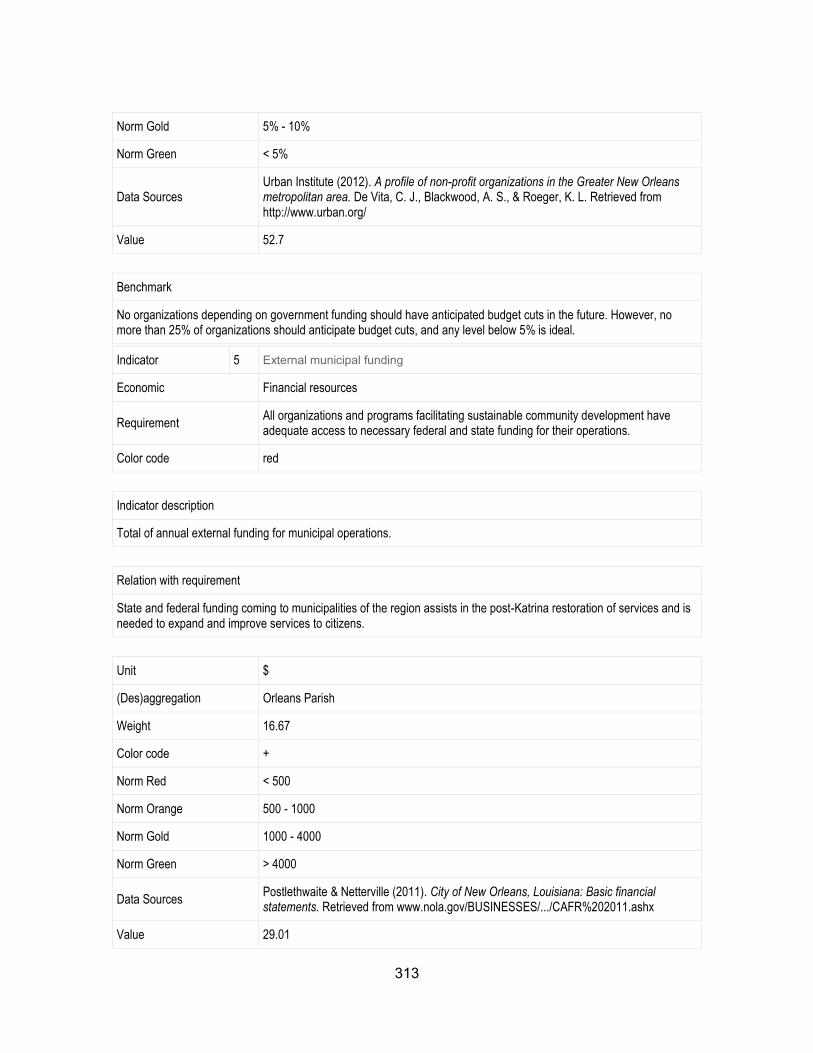
313
Norm Gold 5% - 10%
Norm Green < 5%
Data Sources Urban Institute (2012). A profile of non-profit organizations in the Greater New Orleans metropolitan area. De Vita, C. J., Blackwood, A. S., & Roeger, K. L. Retrieved from http://www.urban.org/
Value 52.7
Benchmark
No organizations depending on government funding should have anticipated budget cuts in the future. However, no more than 25% of organizations should anticipate budget cuts, and any level below 5% is ideal.
Indicator 5 External municipal funding
Economic Financial resources
Requirement All organizations and programs facilitating sustainable community development have adequate access to necessary federal and state funding for their operations.
Color code red
Indicator description
Total of annual external funding for municipal operations.
Relation with requirement
State and federal funding coming to municipalities of the region assists in the post-Katrina restoration of services and is needed to expand and improve services to citizens.
Unit $
(Des)aggregation Orleans Parish
Weight 16.67
Color code +
Norm Red < 500
Norm Orange 500 - 1000
Norm Gold 1000 - 4000
Norm Green > 4000
Data Sources Postlethwaite & Netterville (2011). City of New Orleans, Louisiana: Basic financial statements. Retrieved from www.nola.gov/BUSINESSES/.../CAFR%202011.ashx
Value 29.01
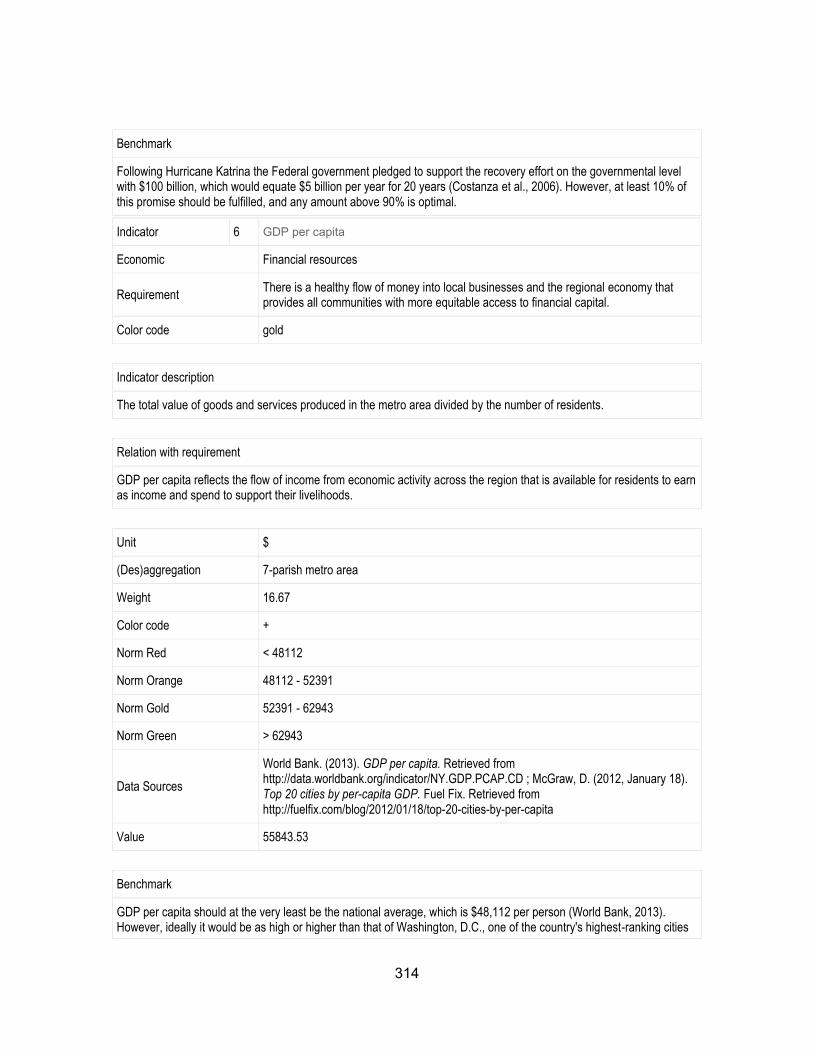
314
Benchmark
Following Hurricane Katrina the Federal government pledged to support the recovery effort on the governmental level with $100 billion, which would equate $5 billion per year for 20 years (Costanza et al., 2006). However, at least 10% of this promise should be fulfilled, and any amount above 90% is optimal.
Indicator 6 GDP per capita
Economic Financial resources
Requirement There is a healthy flow of money into local businesses and the regional economy that provides all communities with more equitable access to financial capital.
Color code gold
Indicator description
The total value of goods and services produced in the metro area divided by the number of residents.
Relation with requirement
GDP per capita reflects the flow of income from economic activity across the region that is available for residents to earn as income and spend to support their livelihoods.
Unit $
(Des)aggregation 7-parish metro area
Weight 16.67
Color code +
Norm Red < 48112
Norm Orange 48112 - 52391
Norm Gold 52391 - 62943
Norm Green > 62943
Data Sources
World Bank. (2013). GDP per capita. Retrieved from http://data.worldbank.org/indicator/NY.GDP.PCAP.CD ; McGraw, D. (2012, January 18). Top 20 cities by per-capita GDP. Fuel Fix. Retrieved from http://fuelfix.com/blog/2012/01/18/top-20-cities-by-per-capita
Value 55843.53
Benchmark
GDP per capita should at the very least be the national average, which is $48,112 per person (World Bank, 2013). However, ideally it would be as high or higher than that of Washington, D.C., one of the country's highest-ranking cities
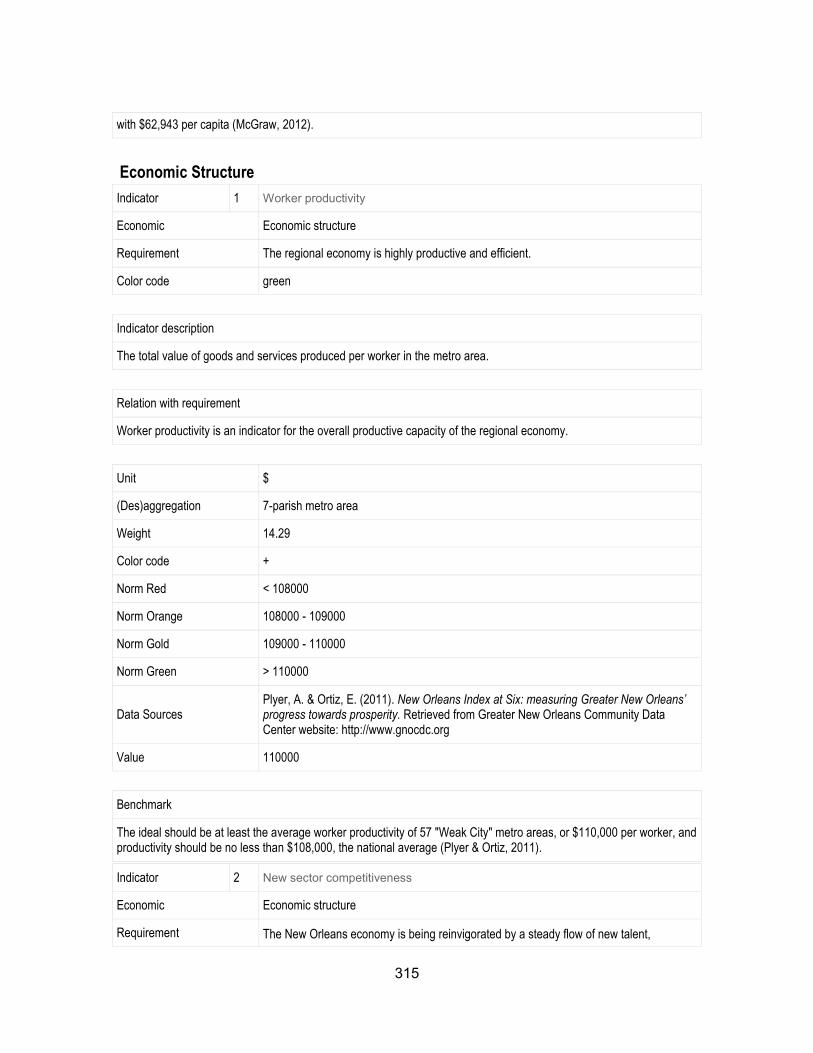
315
with $62,943 per capita (McGraw, 2012).
Economic Structure
Indicator 1 Worker productivity
Economic Economic structure
Requirement The regional economy is highly productive and efficient.
Color code green
Indicator description
The total value of goods and services produced per worker in the metro area.
Relation with requirement
Worker productivity is an indicator for the overall productive capacity of the regional economy.
Unit $
(Des)aggregation 7-parish metro area
Weight 14.29
Color code +
Norm Red < 108000
Norm Orange 108000 - 109000
Norm Gold 109000 - 110000
Norm Green > 110000
Data Sources Plyer, A. & Ortiz, E. (2011). New Orleans Index at Six: measuring Greater New Orleans’ progress towards prosperity. Retrieved from Greater New Orleans Community Data Center website: http://www.gnocdc.org
Value 110000
Benchmark
The ideal should be at least the average worker productivity of 57 "Weak City" metro areas, or $110,000 per worker, and productivity should be no less than $108,000, the national average (Plyer & Ortiz, 2011).
Indicator 2 New sector competitiveness
Economic Economic structure
Requirement The New Orleans economy is being reinvigorated by a steady flow of new talent,
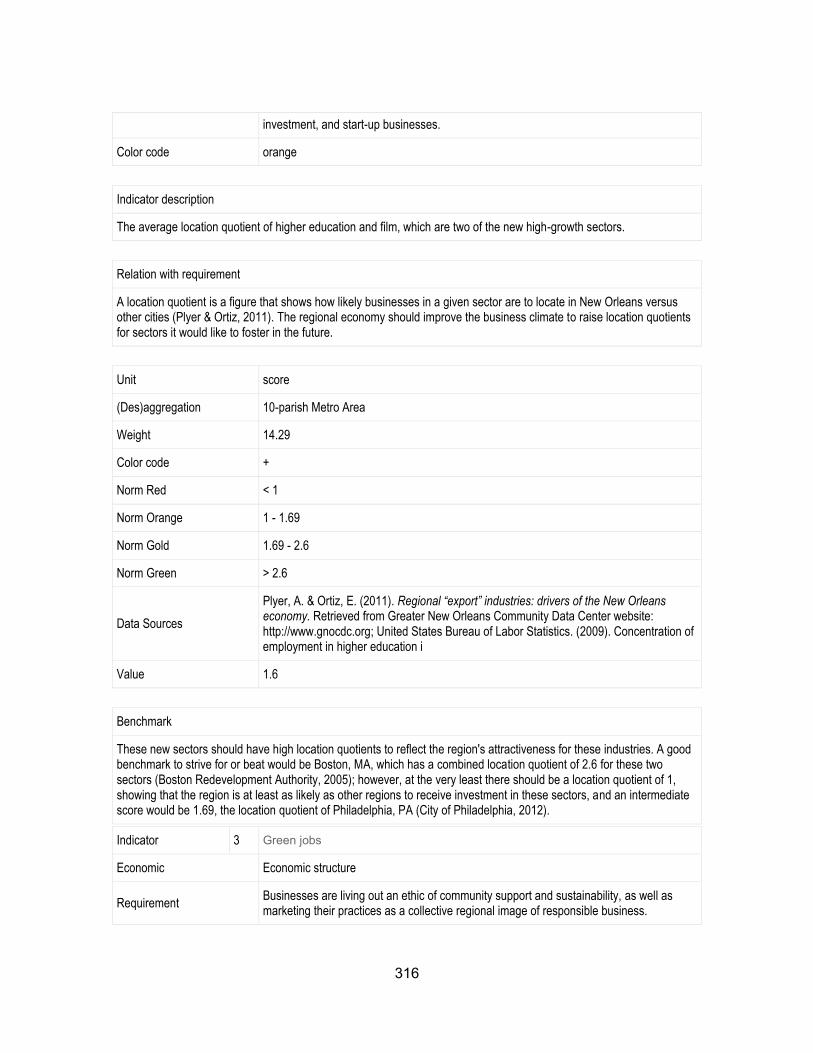
316
investment, and start-up businesses.
Color code orange
Indicator description
The average location quotient of higher education and film, which are two of the new high-growth sectors.
Relation with requirement
A location quotient is a figure that shows how likely businesses in a given sector are to locate in New Orleans versus other cities (Plyer & Ortiz, 2011). The regional economy should improve the business climate to raise location quotients for sectors it would like to foster in the future.
Unit score
(Des)aggregation 10-parish Metro Area
Weight 14.29
Color code +
Norm Red < 1
Norm Orange 1 - 1.69
Norm Gold 1.69 - 2.6
Norm Green > 2.6
Data Sources
Plyer, A. & Ortiz, E. (2011). Regional “export” industries: drivers of the New Orleans economy. Retrieved from Greater New Orleans Community Data Center website: http://www.gnocdc.org; United States Bureau of Labor Statistics. (2009). Concentration of employment in higher education i
Value 1.6
Benchmark
These new sectors should have high location quotients to reflect the region's attractiveness for these industries. A good benchmark to strive for or beat would be Boston, MA, which has a combined location quotient of 2.6 for these two sectors (Boston Redevelopment Authority, 2005); however, at the very least there should be a location quotient of 1, showing that the region is at least as likely as other regions to receive investment in these sectors, and an intermediate score would be 1.69, the location quotient of Philadelphia, PA (City of Philadelphia, 2012).
Indicator 3 Green jobs
Economic Economic structure
Requirement Businesses are living out an ethic of community support and sustainability, as well as marketing their practices as a collective regional image of responsible business.
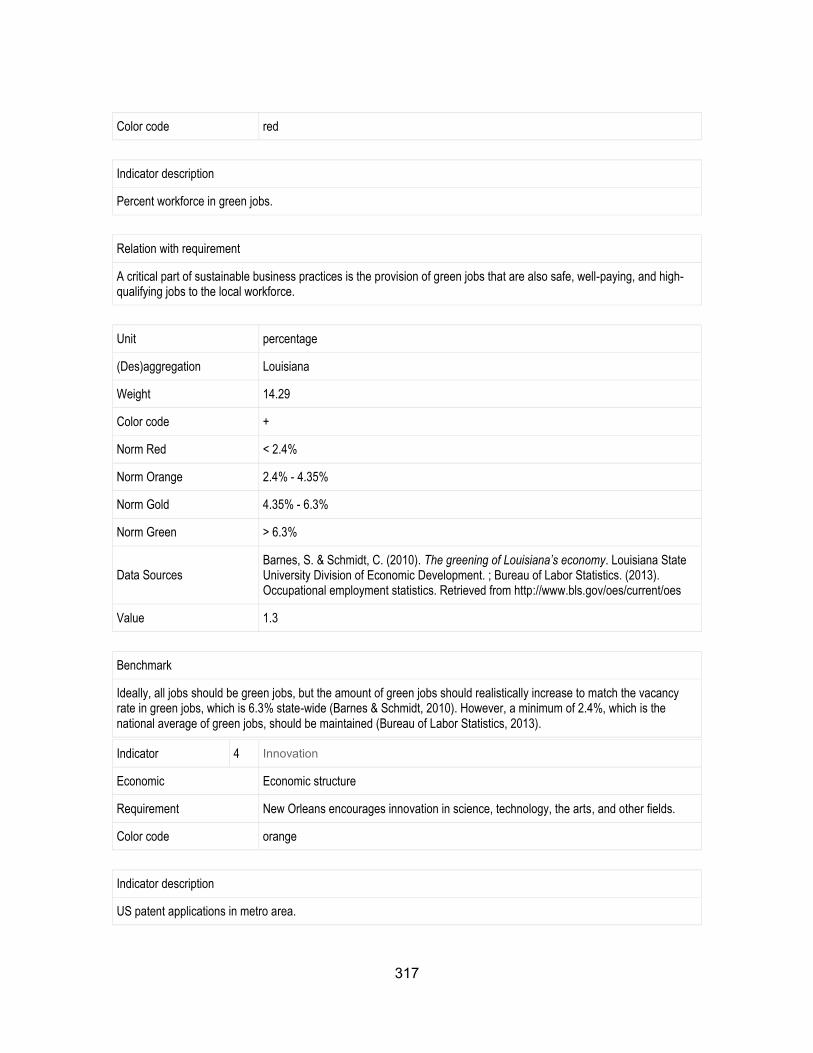
317
Color code red
Indicator description
Percent workforce in green jobs.
Relation with requirement
A critical part of sustainable business practices is the provision of green jobs that are also safe, well-paying, and high-qualifying jobs to the local workforce.
Unit percentage
(Des)aggregation Louisiana
Weight 14.29
Color code +
Norm Red < 2.4%
Norm Orange 2.4% - 4.35%
Norm Gold 4.35% - 6.3%
Norm Green > 6.3%
Data Sources Barnes, S. & Schmidt, C. (2010). The greening of Louisiana’s economy. Louisiana State University Division of Economic Development. ; Bureau of Labor Statistics. (2013). Occupational employment statistics. Retrieved from http://www.bls.gov/oes/current/oes
Value 1.3
Benchmark
Ideally, all jobs should be green jobs, but the amount of green jobs should realistically increase to match the vacancy rate in green jobs, which is 6.3% state-wide (Barnes & Schmidt, 2010). However, a minimum of 2.4%, which is the national average of green jobs, should be maintained (Bureau of Labor Statistics, 2013).
Indicator 4 Innovation
Economic Economic structure
Requirement New Orleans encourages innovation in science, technology, the arts, and other fields.
Color code orange
Indicator description
US patent applications in metro area.
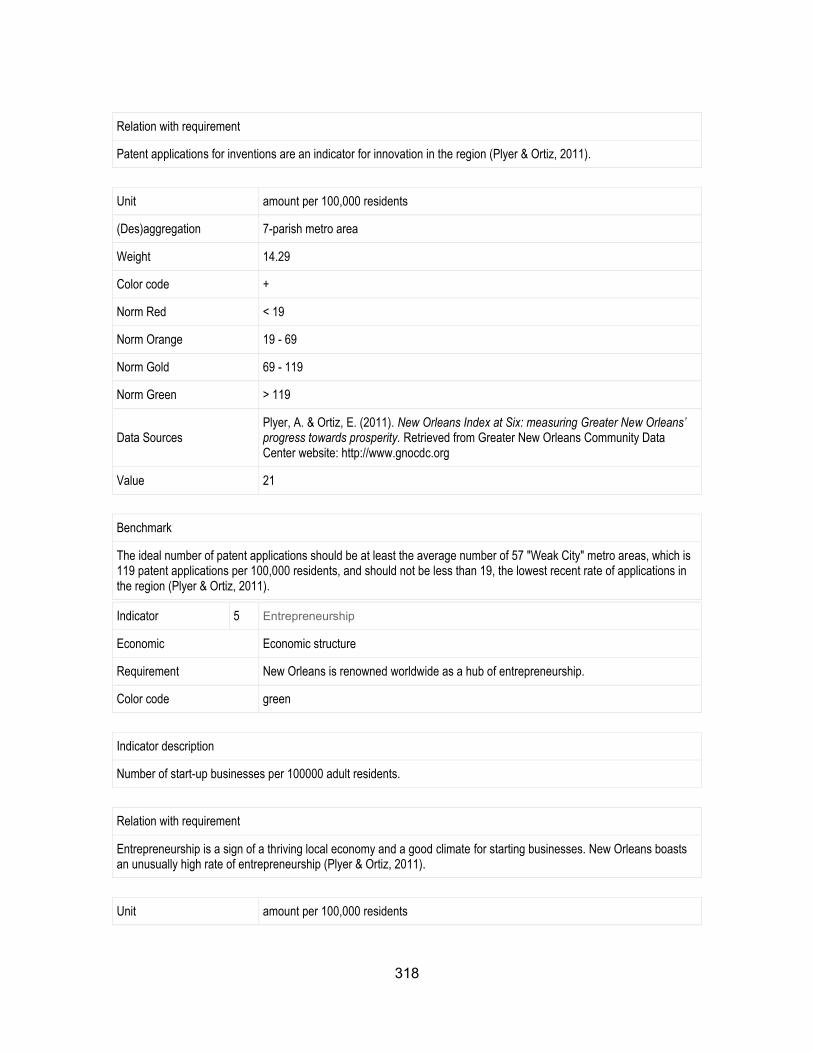
318
Relation with requirement
Patent applications for inventions are an indicator for innovation in the region (Plyer & Ortiz, 2011).
Unit amount per 100,000 residents
(Des)aggregation 7-parish metro area
Weight 14.29
Color code +
Norm Red < 19
Norm Orange 19 - 69
Norm Gold 69 - 119
Norm Green > 119
Data Sources Plyer, A. & Ortiz, E. (2011). New Orleans Index at Six: measuring Greater New Orleans’ progress towards prosperity. Retrieved from Greater New Orleans Community Data Center website: http://www.gnocdc.org
Value 21
Benchmark
The ideal number of patent applications should be at least the average number of 57 "Weak City" metro areas, which is 119 patent applications per 100,000 residents, and should not be less than 19, the lowest recent rate of applications in the region (Plyer & Ortiz, 2011).
Indicator 5 Entrepreneurship
Economic Economic structure
Requirement New Orleans is renowned worldwide as a hub of entrepreneurship.
Color code green
Indicator description
Number of start-up businesses per 100000 adult residents.
Relation with requirement
Entrepreneurship is a sign of a thriving local economy and a good climate for starting businesses. New Orleans boasts an unusually high rate of entrepreneurship (Plyer & Ortiz, 2011).
Unit amount per 100,000 residents
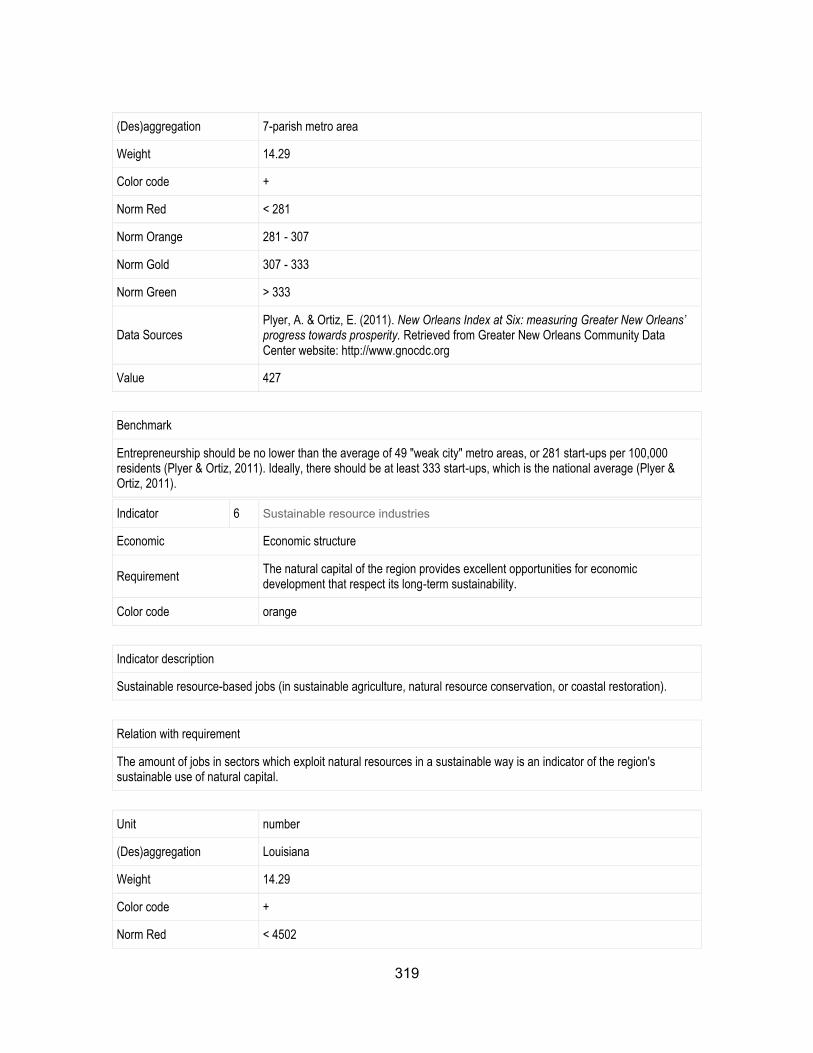
319
(Des)aggregation 7-parish metro area
Weight 14.29
Color code +
Norm Red < 281
Norm Orange 281 - 307
Norm Gold 307 - 333
Norm Green > 333
Data Sources Plyer, A. & Ortiz, E. (2011). New Orleans Index at Six: measuring Greater New Orleans’ progress towards prosperity. Retrieved from Greater New Orleans Community Data Center website: http://www.gnocdc.org
Value 427
Benchmark
Entrepreneurship should be no lower than the average of 49 "weak city" metro areas, or 281 start-ups per 100,000 residents (Plyer & Ortiz, 2011). Ideally, there should be at least 333 start-ups, which is the national average (Plyer & Ortiz, 2011).
Indicator 6 Sustainable resource industries
Economic Economic structure
Requirement The natural capital of the region provides excellent opportunities for economic development that respect its long-term sustainability.
Color code orange
Indicator description
Sustainable resource-based jobs (in sustainable agriculture, natural resource conservation, or coastal restoration).
Relation with requirement
The amount of jobs in sectors which exploit natural resources in a sustainable way is an indicator of the region's sustainable use of natural capital.
Unit number
(Des)aggregation Louisiana
Weight 14.29
Color code +
Norm Red < 4502
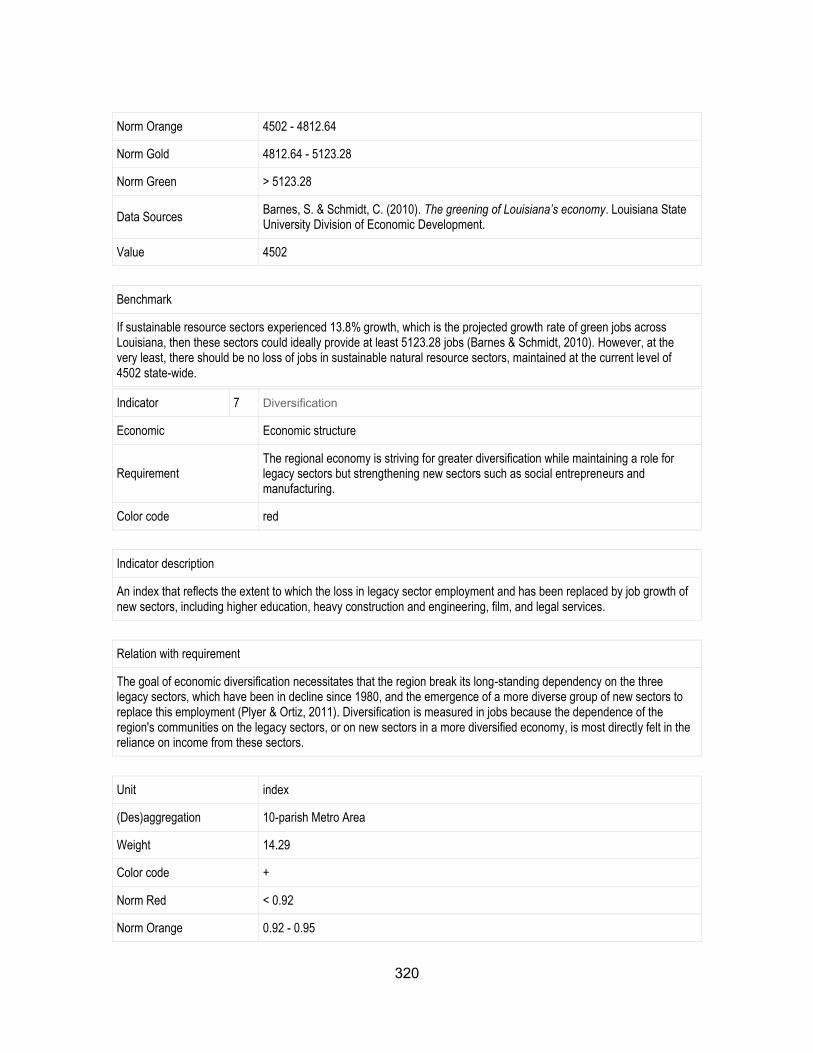
320
Norm Orange 4502 - 4812.64
Norm Gold 4812.64 - 5123.28
Norm Green > 5123.28
Data Sources Barnes, S. & Schmidt, C. (2010). The greening of Louisiana’s economy. Louisiana State University Division of Economic Development.
Value 4502
Benchmark
If sustainable resource sectors experienced 13.8% growth, which is the projected growth rate of green jobs across Louisiana, then these sectors could ideally provide at least 5123.28 jobs (Barnes & Schmidt, 2010). However, at the very least, there should be no loss of jobs in sustainable natural resource sectors, maintained at the current level of 4502 state-wide.
Indicator 7 Diversification
Economic Economic structure
Requirement The regional economy is striving for greater diversification while maintaining a role for legacy sectors but strengthening new sectors such as social entrepreneurs and manufacturing.
Color code red
Indicator description
An index that reflects the extent to which the loss in legacy sector employment and has been replaced by job growth of new sectors, including higher education, heavy construction and engineering, film, and legal services.
Relation with requirement
The goal of economic diversification necessitates that the region break its long-standing dependency on the three legacy sectors, which have been in decline since 1980, and the emergence of a more diverse group of new sectors to replace this employment (Plyer & Ortiz, 2011). Diversification is measured in jobs because the dependence of the region's communities on the legacy sectors, or on new sectors in a more diversified economy, is most directly felt in the reliance on income from these sectors.
Unit index
(Des)aggregation 10-parish Metro Area
Weight 14.29
Color code +
Norm Red < 0.92
Norm Orange 0.92 - 0.95
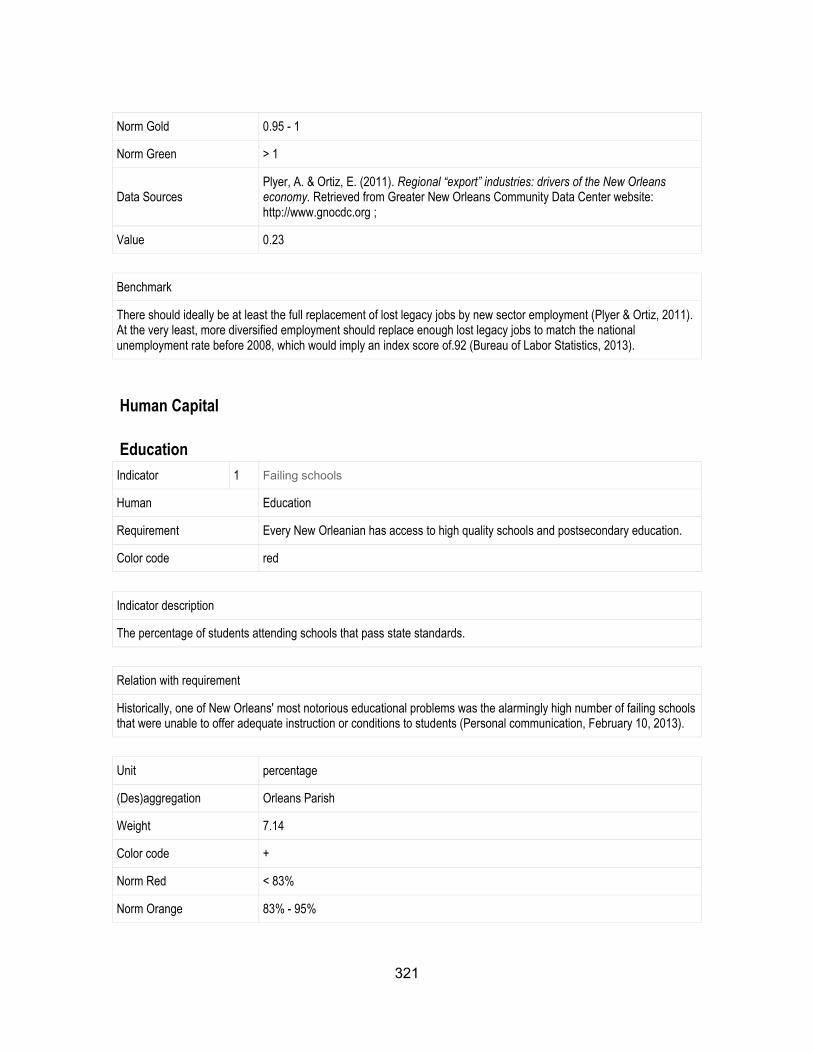
321
Norm Gold 0.95 - 1
Norm Green > 1
Data Sources Plyer, A. & Ortiz, E. (2011). Regional “export” industries: drivers of the New Orleans economy. Retrieved from Greater New Orleans Community Data Center website: http://www.gnocdc.org ;
Value 0.23
Benchmark
There should ideally be at least the full replacement of lost legacy jobs by new sector employment (Plyer & Ortiz, 2011). At the very least, more diversified employment should replace enough lost legacy jobs to match the national unemployment rate before 2008, which would imply an index score of.92 (Bureau of Labor Statistics, 2013).
Human Capital
Education
Indicator 1 Failing schools
Human Education
Requirement Every New Orleanian has access to high quality schools and postsecondary education.
Color code red
Indicator description
The percentage of students attending schools that pass state standards.
Relation with requirement
Historically, one of New Orleans' most notorious educational problems was the alarmingly high number of failing schools that were unable to offer adequate instruction or conditions to students (Personal communication, February 10, 2013).
Unit percentage
(Des)aggregation Orleans Parish
Weight 7.14
Color code +
Norm Red < 83%
Norm Orange 83% - 95%
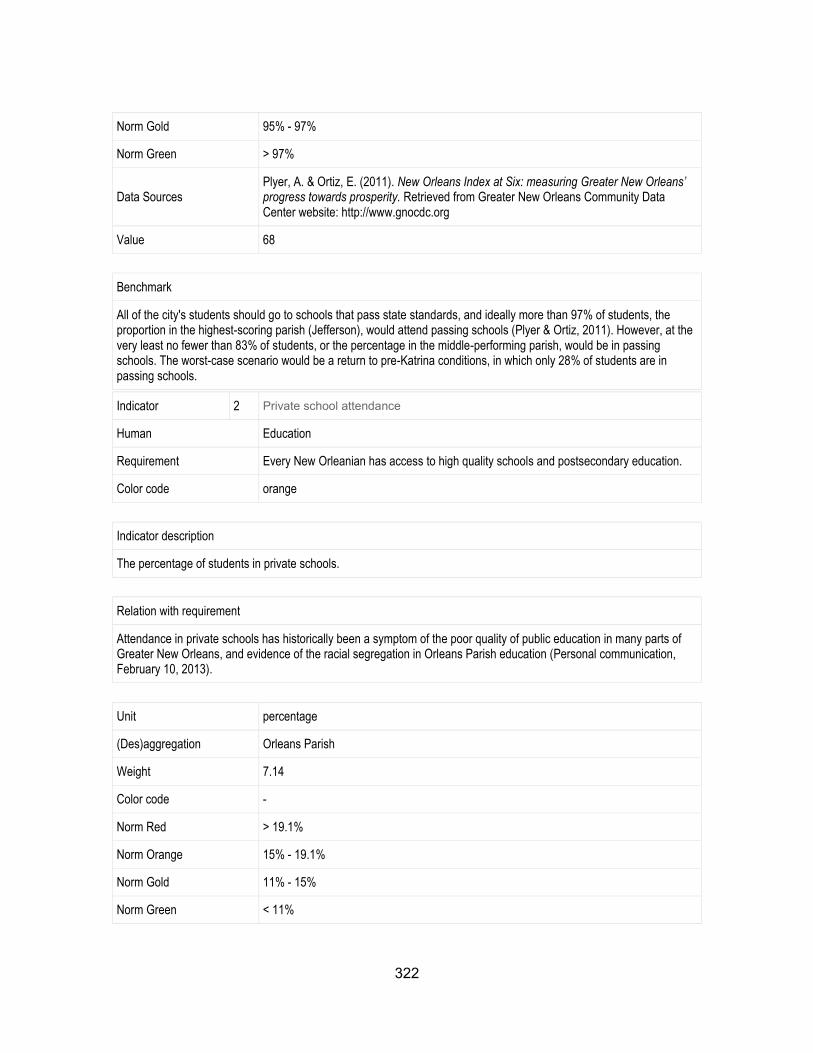
322
Norm Gold 95% - 97%
Norm Green > 97%
Data Sources Plyer, A. & Ortiz, E. (2011). New Orleans Index at Six: measuring Greater New Orleans’ progress towards prosperity. Retrieved from Greater New Orleans Community Data Center website: http://www.gnocdc.org
Value 68
Benchmark
All of the city's students should go to schools that pass state standards, and ideally more than 97% of students, the proportion in the highest-scoring parish (Jefferson), would attend passing schools (Plyer & Ortiz, 2011). However, at the very least no fewer than 83% of students, or the percentage in the middle-performing parish, would be in passing schools. The worst-case scenario would be a return to pre-Katrina conditions, in which only 28% of students are in passing schools.
Indicator 2 Private school attendance
Human Education
Requirement Every New Orleanian has access to high quality schools and postsecondary education.
Color code orange
Indicator description
The percentage of students in private schools.
Relation with requirement
Attendance in private schools has historically been a symptom of the poor quality of public education in many parts of Greater New Orleans, and evidence of the racial segregation in Orleans Parish education (Personal communication, February 10, 2013).
Unit percentage
(Des)aggregation Orleans Parish
Weight 7.14
Color code -
Norm Red > 19.1%
Norm Orange 15% - 19.1%
Norm Gold 11% - 15%
Norm Green < 11%
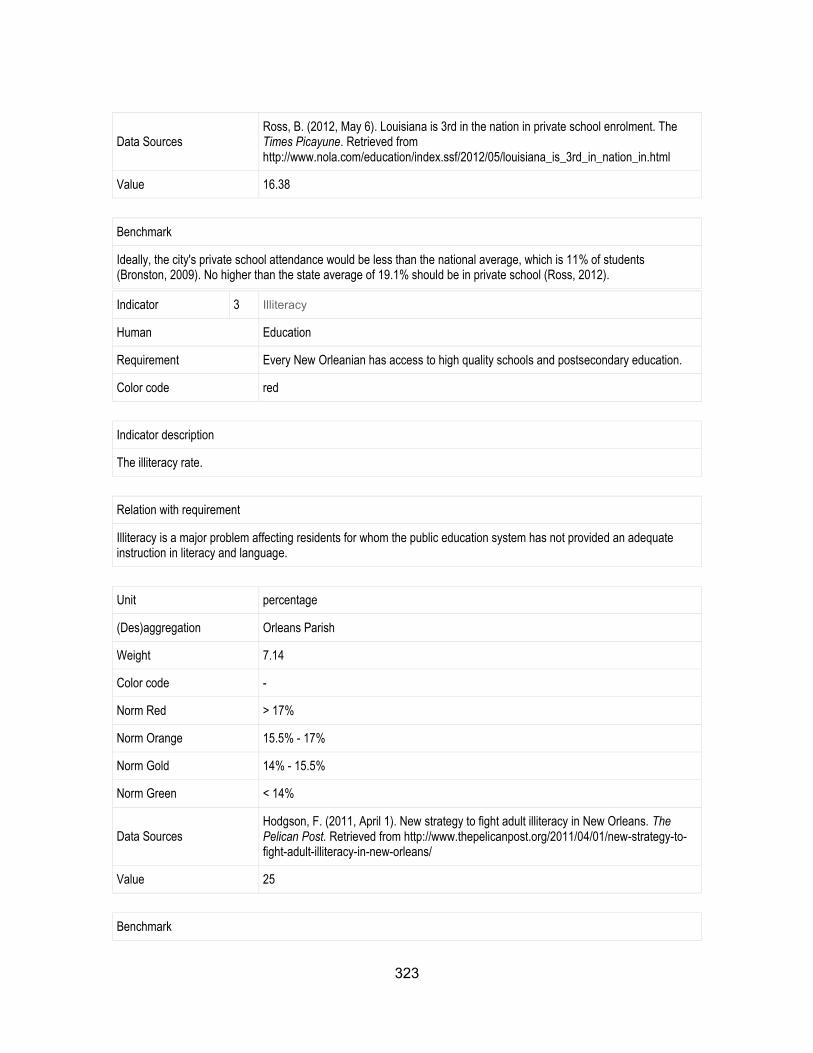
323
Data Sources Ross, B. (2012, May 6). Louisiana is 3rd in the nation in private school enrolment. The Times Picayune. Retrieved from http://www.nola.com/education/index.ssf/2012/05/louisiana_is_3rd_in_nation_in.html
Value 16.38
Benchmark
Ideally, the city's private school attendance would be less than the national average, which is 11% of students (Bronston, 2009). No higher than the state average of 19.1% should be in private school (Ross, 2012).
Indicator 3 Illiteracy
Human Education
Requirement Every New Orleanian has access to high quality schools and postsecondary education.
Color code red
Indicator description
The illiteracy rate.
Relation with requirement
Illiteracy is a major problem affecting residents for whom the public education system has not provided an adequate instruction in literacy and language.
Unit percentage
(Des)aggregation Orleans Parish
Weight 7.14
Color code -
Norm Red > 17%
Norm Orange 15.5% - 17%
Norm Gold 14% - 15.5%
Norm Green < 14%
Data Sources Hodgson, F. (2011, April 1). New strategy to fight adult illiteracy in New Orleans. The Pelican Post. Retrieved from http://www.thepelicanpost.org/2011/04/01/new-strategy-to-fight-adult-illiteracy-in-new-orleans/
Value 25
Benchmark
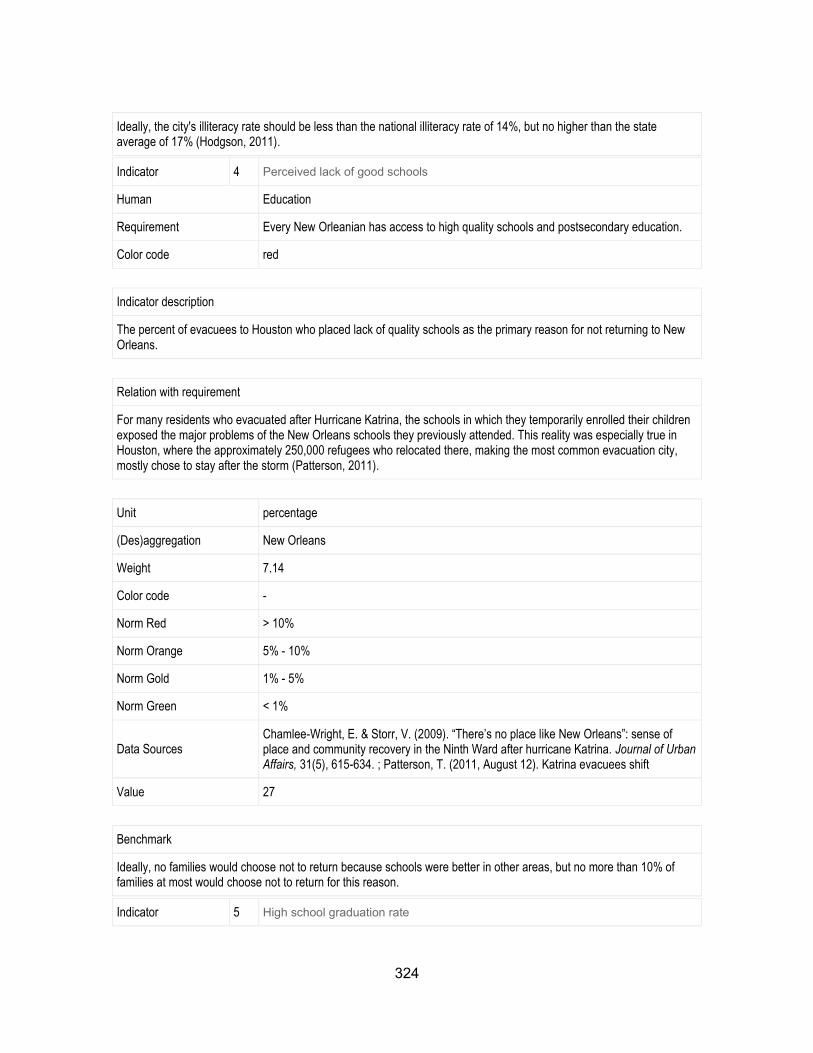
324
Ideally, the city's illiteracy rate should be less than the national illiteracy rate of 14%, but no higher than the state average of 17% (Hodgson, 2011).
Indicator 4 Perceived lack of good schools
Human Education
Requirement Every New Orleanian has access to high quality schools and postsecondary education.
Color code red
Indicator description
The percent of evacuees to Houston who placed lack of quality schools as the primary reason for not returning to New Orleans.
Relation with requirement
For many residents who evacuated after Hurricane Katrina, the schools in which they temporarily enrolled their children exposed the major problems of the New Orleans schools they previously attended. This reality was especially true in Houston, where the approximately 250,000 refugees who relocated there, making the most common evacuation city, mostly chose to stay after the storm (Patterson, 2011).
Unit percentage
(Des)aggregation New Orleans
Weight 7.14
Color code -
Norm Red > 10%
Norm Orange 5% - 10%
Norm Gold 1% - 5%
Norm Green < 1%
Data Sources Chamlee-Wright, E. & Storr, V. (2009). “There’s no place like New Orleans”: sense of place and community recovery in the Ninth Ward after hurricane Katrina. Journal of Urban Affairs, 31(5), 615-634. ; Patterson, T. (2011, August 12). Katrina evacuees shift
Value 27
Benchmark
Ideally, no families would choose not to return because schools were better in other areas, but no more than 10% of families at most would choose not to return for this reason.
Indicator 5 High school graduation rate
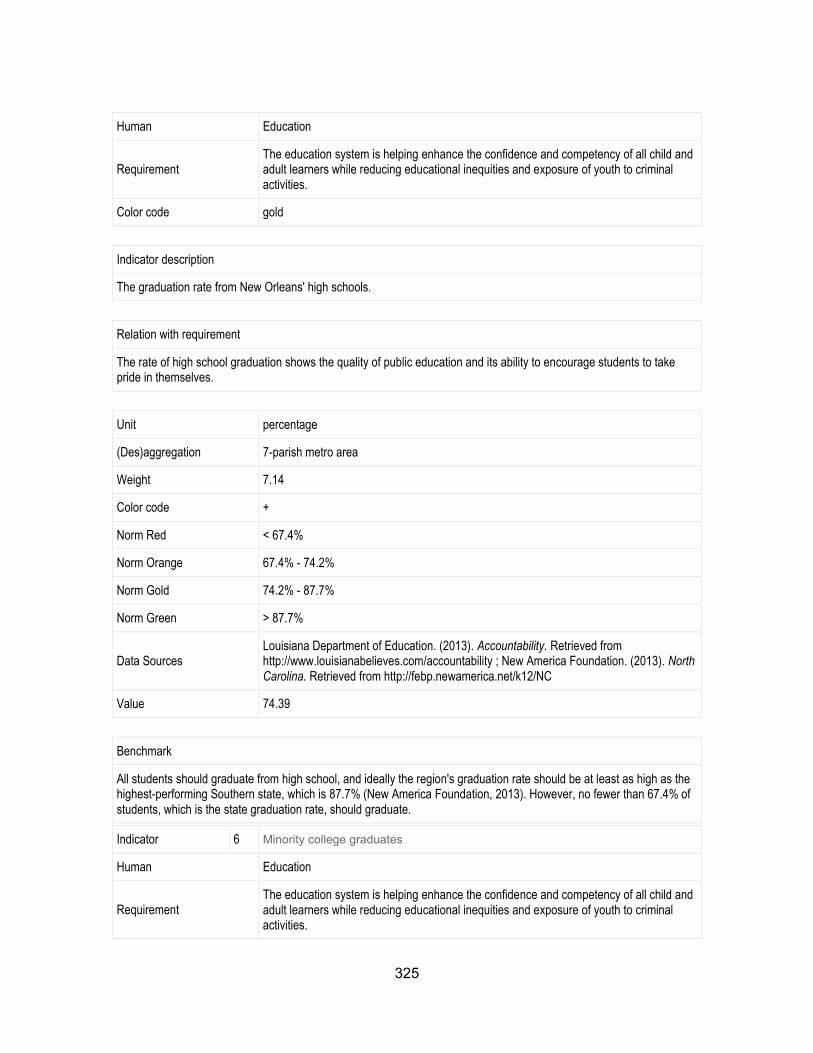
325
Human Education
Requirement The education system is helping enhance the confidence and competency of all child and adult learners while reducing educational inequities and exposure of youth to criminal activities.
Color code gold
Indicator description
The graduation rate from New Orleans' high schools.
Relation with requirement
The rate of high school graduation shows the quality of public education and its ability to encourage students to take pride in themselves.
Unit percentage
(Des)aggregation 7-parish metro area
Weight 7.14
Color code +
Norm Red < 67.4%
Norm Orange 67.4% - 74.2%
Norm Gold 74.2% - 87.7%
Norm Green > 87.7%
Data Sources Louisiana Department of Education. (2013). Accountability. Retrieved from http://www.louisianabelieves.com/accountability ; New America Foundation. (2013). North Carolina. Retrieved from http://febp.newamerica.net/k12/NC
Value 74.39
Benchmark
All students should graduate from high school, and ideally the region's graduation rate should be at least as high as the highest-performing Southern state, which is 87.7% (New America Foundation, 2013). However, no fewer than 67.4% of students, which is the state graduation rate, should graduate.
Indicator 6 Minority college graduates
Human Education
Requirement The education system is helping enhance the confidence and competency of all child and adult learners while reducing educational inequities and exposure of youth to criminal activities.
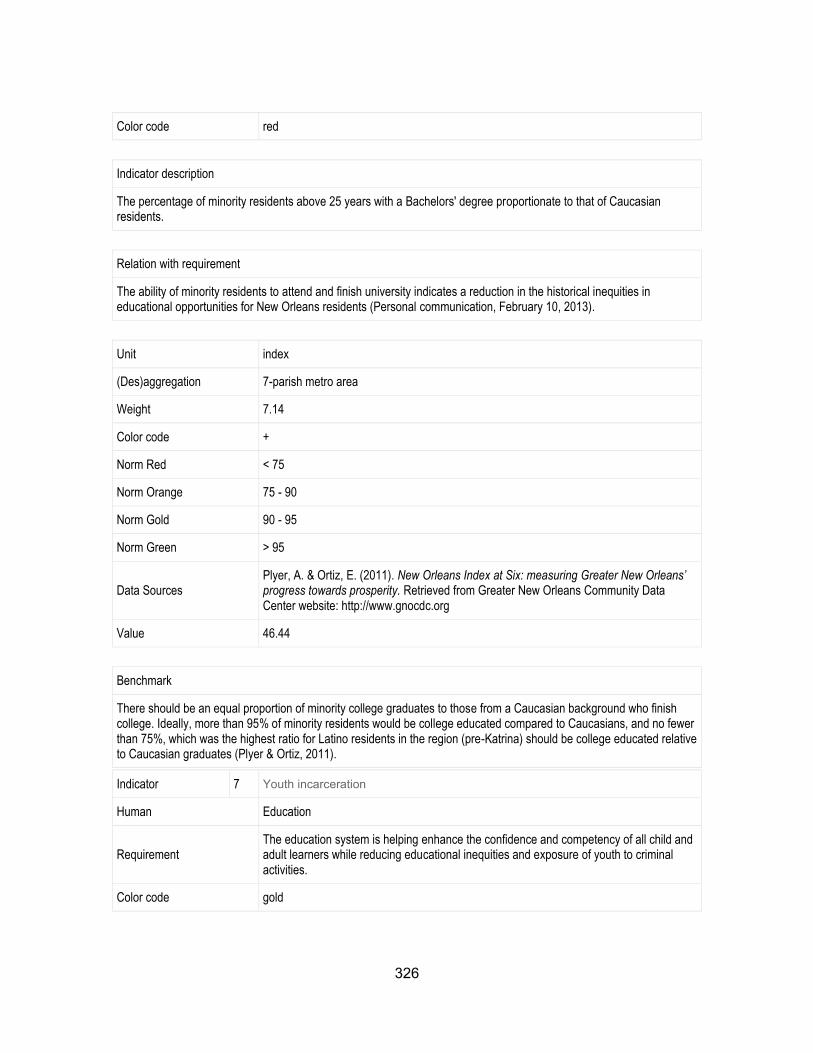
326
Color code red
Indicator description
The percentage of minority residents above 25 years with a Bachelors' degree proportionate to that of Caucasian residents.
Relation with requirement
The ability of minority residents to attend and finish university indicates a reduction in the historical inequities in educational opportunities for New Orleans residents (Personal communication, February 10, 2013).
Unit index
(Des)aggregation 7-parish metro area
Weight 7.14
Color code +
Norm Red < 75
Norm Orange 75 - 90
Norm Gold 90 - 95
Norm Green > 95
Data Sources Plyer, A. & Ortiz, E. (2011). New Orleans Index at Six: measuring Greater New Orleans’ progress towards prosperity. Retrieved from Greater New Orleans Community Data Center website: http://www.gnocdc.org
Value 46.44
Benchmark
There should be an equal proportion of minority college graduates to those from a Caucasian background who finish college. Ideally, more than 95% of minority residents would be college educated compared to Caucasians, and no fewer than 75%, which was the highest ratio for Latino residents in the region (pre-Katrina) should be college educated relative to Caucasian graduates (Plyer & Ortiz, 2011).
Indicator 7 Youth incarceration
Human Education
Requirement The education system is helping enhance the confidence and competency of all child and adult learners while reducing educational inequities and exposure of youth to criminal activities.
Color code gold
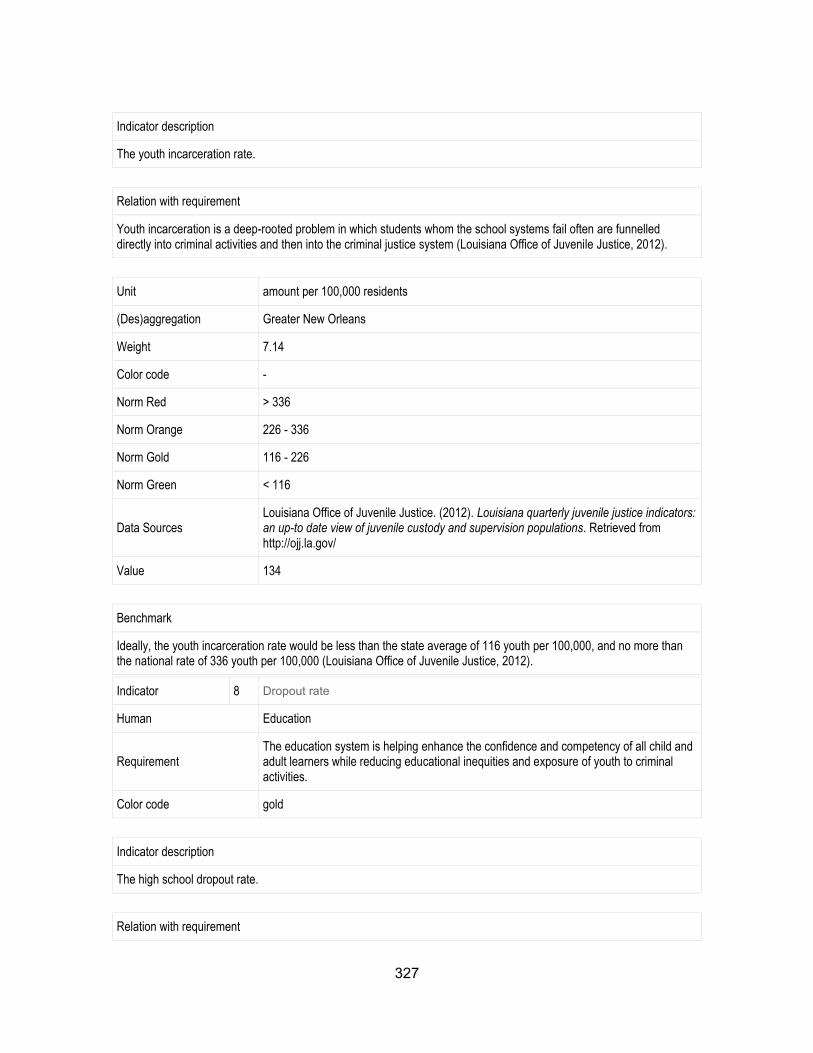
327
Indicator description
The youth incarceration rate.
Relation with requirement
Youth incarceration is a deep-rooted problem in which students whom the school systems fail often are funnelled directly into criminal activities and then into the criminal justice system (Louisiana Office of Juvenile Justice, 2012).
Unit amount per 100,000 residents
(Des)aggregation Greater New Orleans
Weight 7.14
Color code -
Norm Red > 336
Norm Orange 226 - 336
Norm Gold 116 - 226
Norm Green < 116
Data Sources Louisiana Office of Juvenile Justice. (2012). Louisiana quarterly juvenile justice indicators: an up-to date view of juvenile custody and supervision populations. Retrieved from http://ojj.la.gov/
Value 134
Benchmark
Ideally, the youth incarceration rate would be less than the state average of 116 youth per 100,000, and no more than the national rate of 336 youth per 100,000 (Louisiana Office of Juvenile Justice, 2012).
Indicator 8 Dropout rate
Human Education
Requirement The education system is helping enhance the confidence and competency of all child and adult learners while reducing educational inequities and exposure of youth to criminal activities.
Color code gold
Indicator description
The high school dropout rate.
Relation with requirement
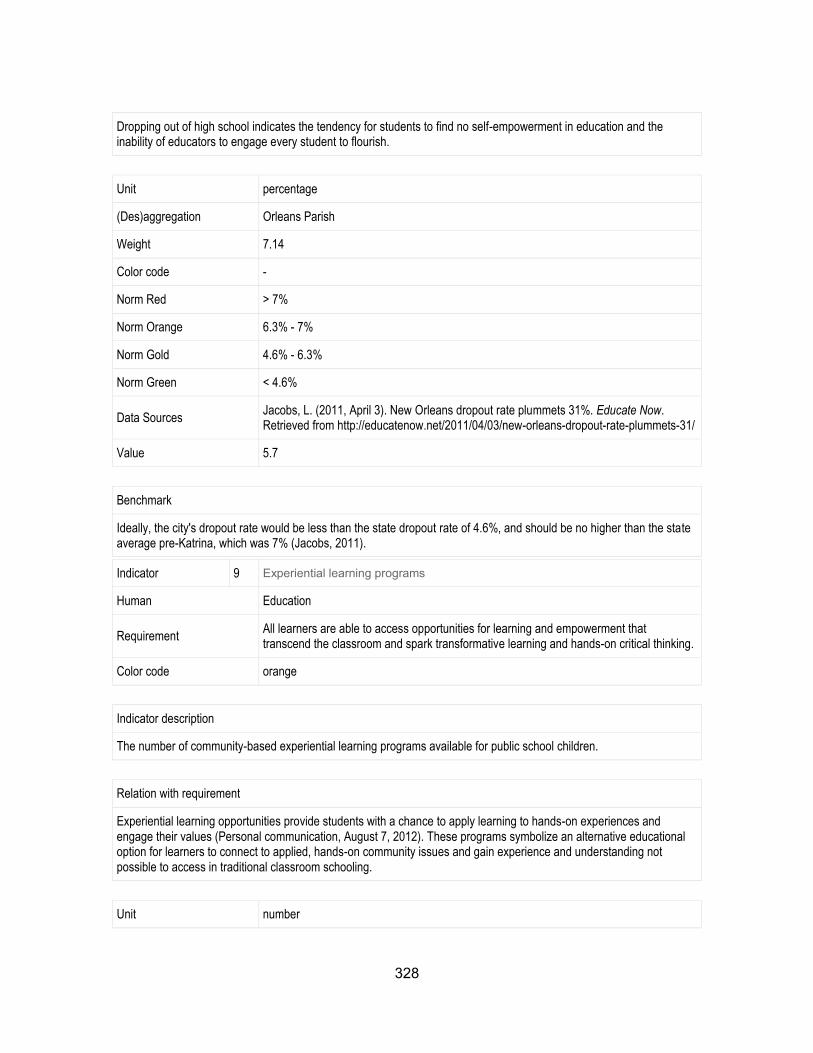
328
Dropping out of high school indicates the tendency for students to find no self-empowerment in education and the inability of educators to engage every student to flourish.
Unit percentage
(Des)aggregation Orleans Parish
Weight 7.14
Color code -
Norm Red > 7%
Norm Orange 6.3% - 7%
Norm Gold 4.6% - 6.3%
Norm Green < 4.6%
Data Sources Jacobs, L. (2011, April 3). New Orleans dropout rate plummets 31%. Educate Now. Retrieved from http://educatenow.net/2011/04/03/new-orleans-dropout-rate-plummets-31/
Value 5.7
Benchmark
Ideally, the city's dropout rate would be less than the state dropout rate of 4.6%, and should be no higher than the state average pre-Katrina, which was 7% (Jacobs, 2011).
Indicator 9 Experiential learning programs
Human Education
Requirement All learners are able to access opportunities for learning and empowerment that transcend the classroom and spark transformative learning and hands-on critical thinking.
Color code orange
Indicator description
The number of community-based experiential learning programs available for public school children.
Relation with requirement
Experiential learning opportunities provide students with a chance to apply learning to hands-on experiences and engage their values (Personal communication, August 7, 2012). These programs symbolize an alternative educational option for learners to connect to applied, hands-on community issues and gain experience and understanding not possible to access in traditional classroom schooling.
Unit number
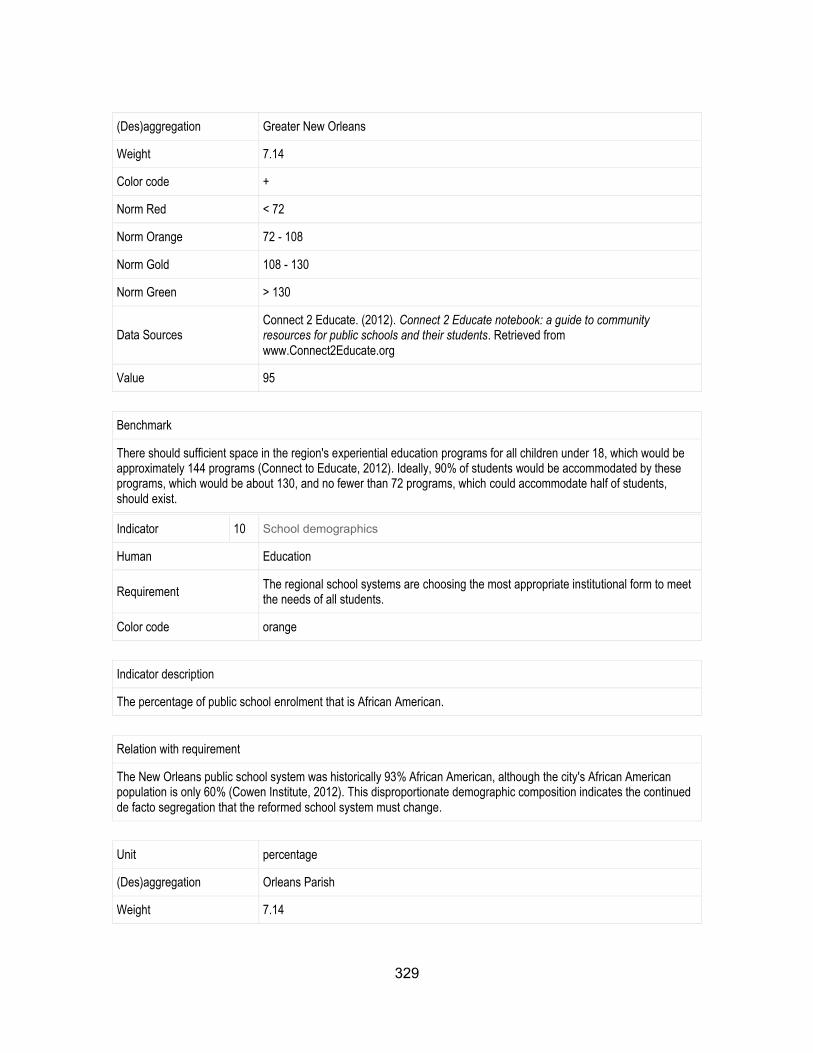
329
(Des)aggregation Greater New Orleans
Weight 7.14
Color code +
Norm Red < 72
Norm Orange 72 - 108
Norm Gold 108 - 130
Norm Green > 130
Data Sources Connect 2 Educate. (2012). Connect 2 Educate notebook: a guide to community resources for public schools and their students. Retrieved from www.Connect2Educate.org
Value 95
Benchmark
There should sufficient space in the region's experiential education programs for all children under 18, which would be approximately 144 programs (Connect to Educate, 2012). Ideally, 90% of students would be accommodated by these programs, which would be about 130, and no fewer than 72 programs, which could accommodate half of students, should exist.
Indicator 10 School demographics
Human Education
Requirement The regional school systems are choosing the most appropriate institutional form to meet the needs of all students.
Color code orange
Indicator description
The percentage of public school enrolment that is African American.
Relation with requirement
The New Orleans public school system was historically 93% African American, although the city's African American population is only 60% (Cowen Institute, 2012). This disproportionate demographic composition indicates the continued de facto segregation that the reformed school system must change.
Unit percentage
(Des)aggregation Orleans Parish
Weight 7.14
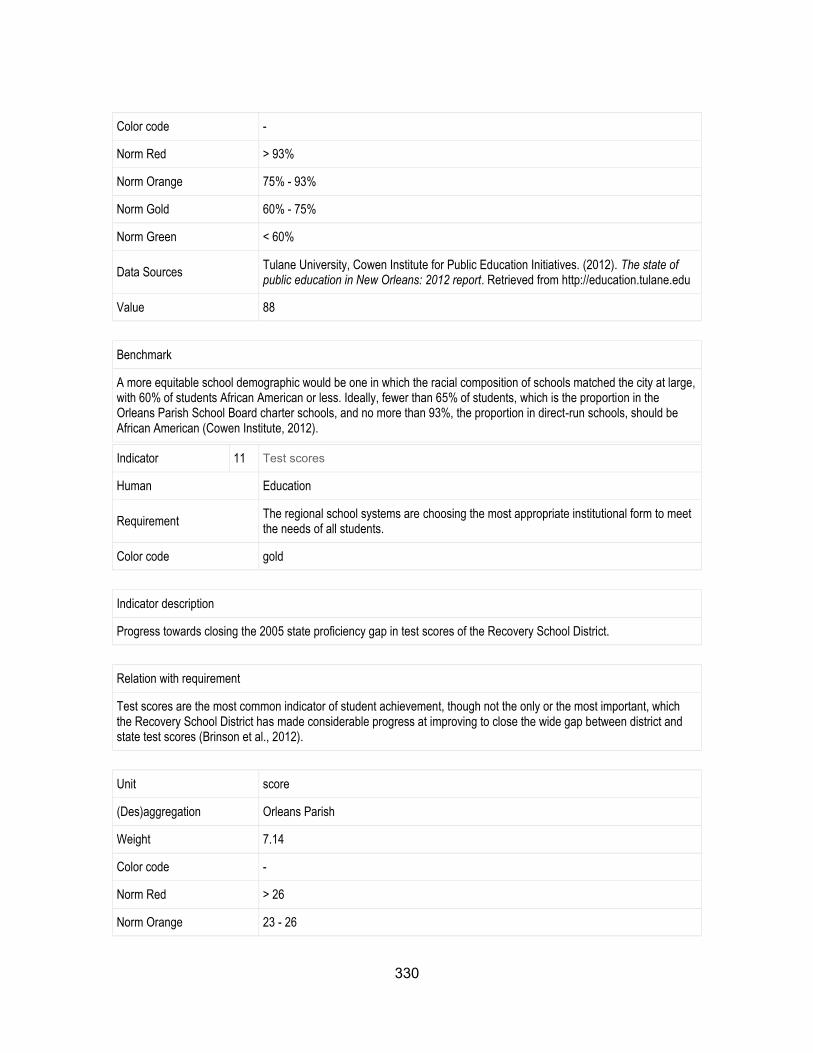
330
Color code -
Norm Red > 93%
Norm Orange 75% - 93%
Norm Gold 60% - 75%
Norm Green < 60%
Data Sources Tulane University, Cowen Institute for Public Education Initiatives. (2012). The state of public education in New Orleans: 2012 report. Retrieved from http://education.tulane.edu
Value 88
Benchmark
A more equitable school demographic would be one in which the racial composition of schools matched the city at large, with 60% of students African American or less. Ideally, fewer than 65% of students, which is the proportion in the Orleans Parish School Board charter schools, and no more than 93%, the proportion in direct-run schools, should be African American (Cowen Institute, 2012).
Indicator 11 Test scores
Human Education
Requirement The regional school systems are choosing the most appropriate institutional form to meet the needs of all students.
Color code gold
Indicator description
Progress towards closing the 2005 state proficiency gap in test scores of the Recovery School District.
Relation with requirement
Test scores are the most common indicator of student achievement, though not the only or the most important, which the Recovery School District has made considerable progress at improving to close the wide gap between district and state test scores (Brinson et al., 2012).
Unit score
(Des)aggregation Orleans Parish
Weight 7.14
Color code -
Norm Red > 26
Norm Orange 23 - 26
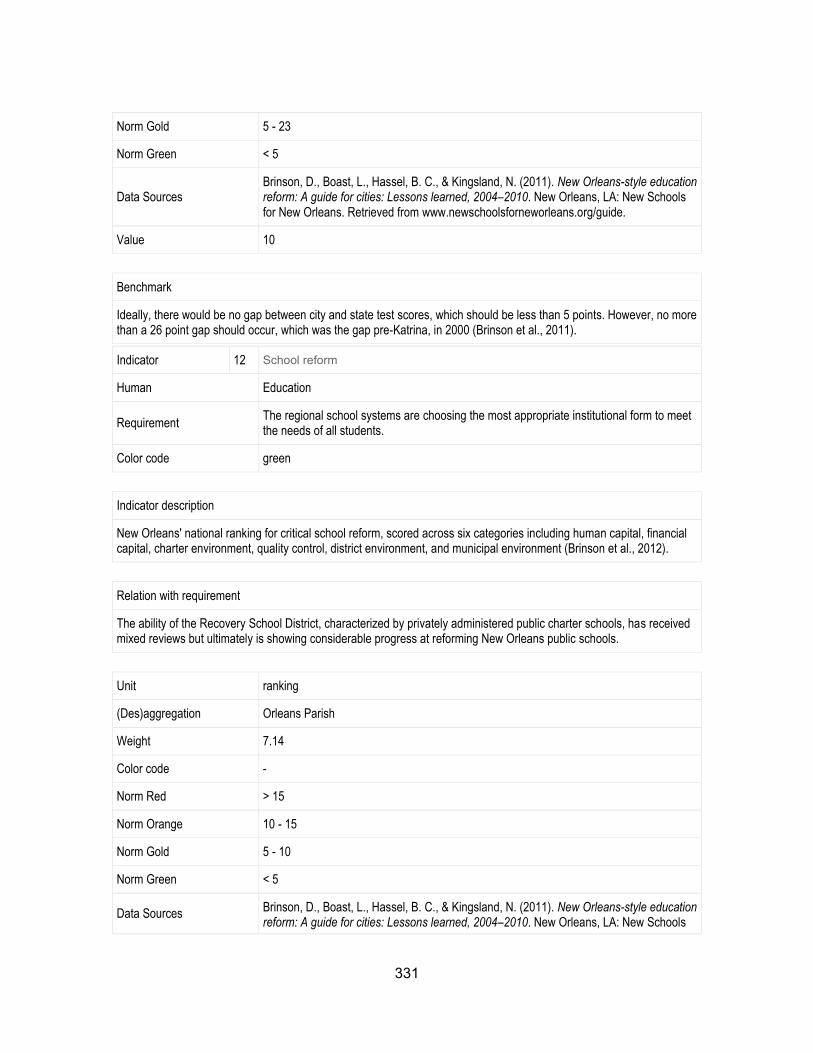
331
Norm Gold 5 - 23
Norm Green < 5
Data Sources Brinson, D., Boast, L., Hassel, B. C., & Kingsland, N. (2011). New Orleans-style education reform: A guide for cities: Lessons learned, 2004–2010. New Orleans, LA: New Schools for New Orleans. Retrieved from www.newschoolsforneworleans.org/guide.
Value 10
Benchmark
Ideally, there would be no gap between city and state test scores, which should be less than 5 points. However, no more than a 26 point gap should occur, which was the gap pre-Katrina, in 2000 (Brinson et al., 2011).
Indicator 12 School reform
Human Education
Requirement The regional school systems are choosing the most appropriate institutional form to meet the needs of all students.
Color code green
Indicator description
New Orleans' national ranking for critical school reform, scored across six categories including human capital, financial capital, charter environment, quality control, district environment, and municipal environment (Brinson et al., 2012).
Relation with requirement
The ability of the Recovery School District, characterized by privately administered public charter schools, has received mixed reviews but ultimately is showing considerable progress at reforming New Orleans public schools.
Unit ranking
(Des)aggregation Orleans Parish
Weight 7.14
Color code -
Norm Red > 15
Norm Orange 10 - 15
Norm Gold 5 - 10
Norm Green < 5
Data Sources Brinson, D., Boast, L., Hassel, B. C., & Kingsland, N. (2011). New Orleans-style education reform: A guide for cities: Lessons learned, 2004–2010. New Orleans, LA: New Schools
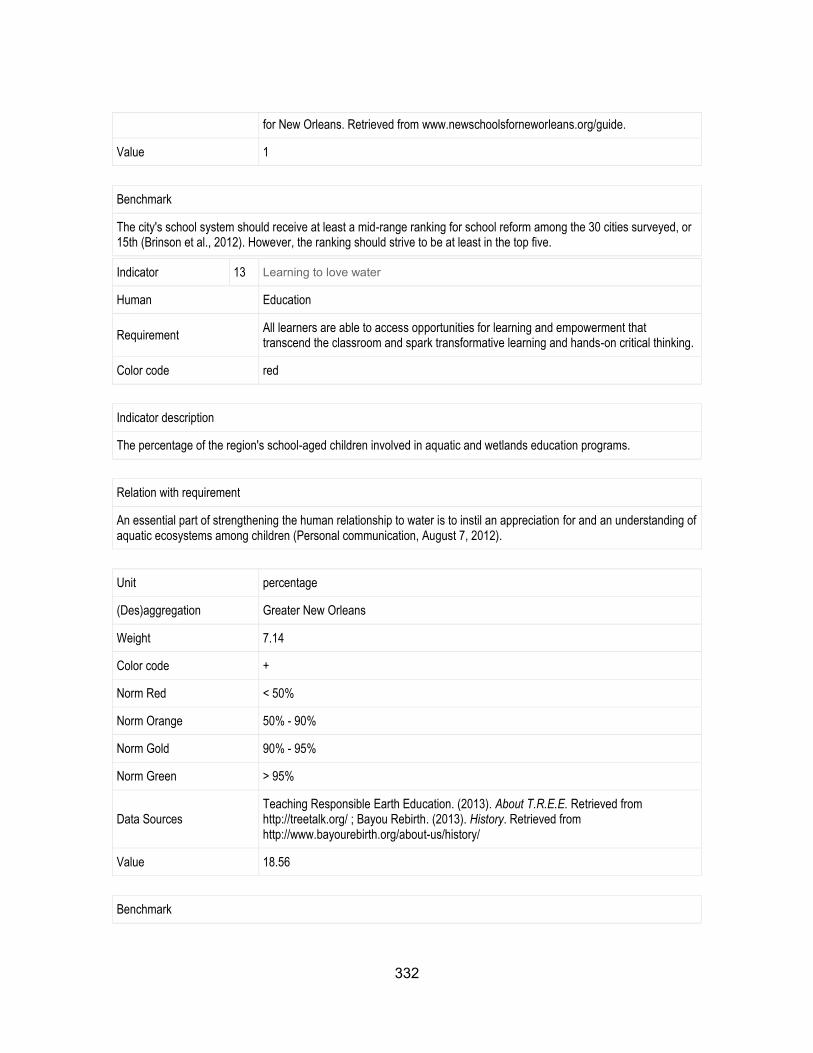
332
for New Orleans. Retrieved from www.newschoolsforneworleans.org/guide.
Value 1
Benchmark
The city's school system should receive at least a mid-range ranking for school reform among the 30 cities surveyed, or 15th (Brinson et al., 2012). However, the ranking should strive to be at least in the top five.
Indicator 13 Learning to love water
Human Education
Requirement All learners are able to access opportunities for learning and empowerment that transcend the classroom and spark transformative learning and hands-on critical thinking.
Color code red
Indicator description
The percentage of the region's school-aged children involved in aquatic and wetlands education programs.
Relation with requirement
An essential part of strengthening the human relationship to water is to instil an appreciation for and an understanding of aquatic ecosystems among children (Personal communication, August 7, 2012).
Unit percentage
(Des)aggregation Greater New Orleans
Weight 7.14
Color code +
Norm Red < 50%
Norm Orange 50% - 90%
Norm Gold 90% - 95%
Norm Green > 95%
Data Sources Teaching Responsible Earth Education. (2013). About T.R.E.E. Retrieved from http://treetalk.org/ ; Bayou Rebirth. (2013). History. Retrieved from http://www.bayourebirth.org/about-us/history/
Value 18.56
Benchmark
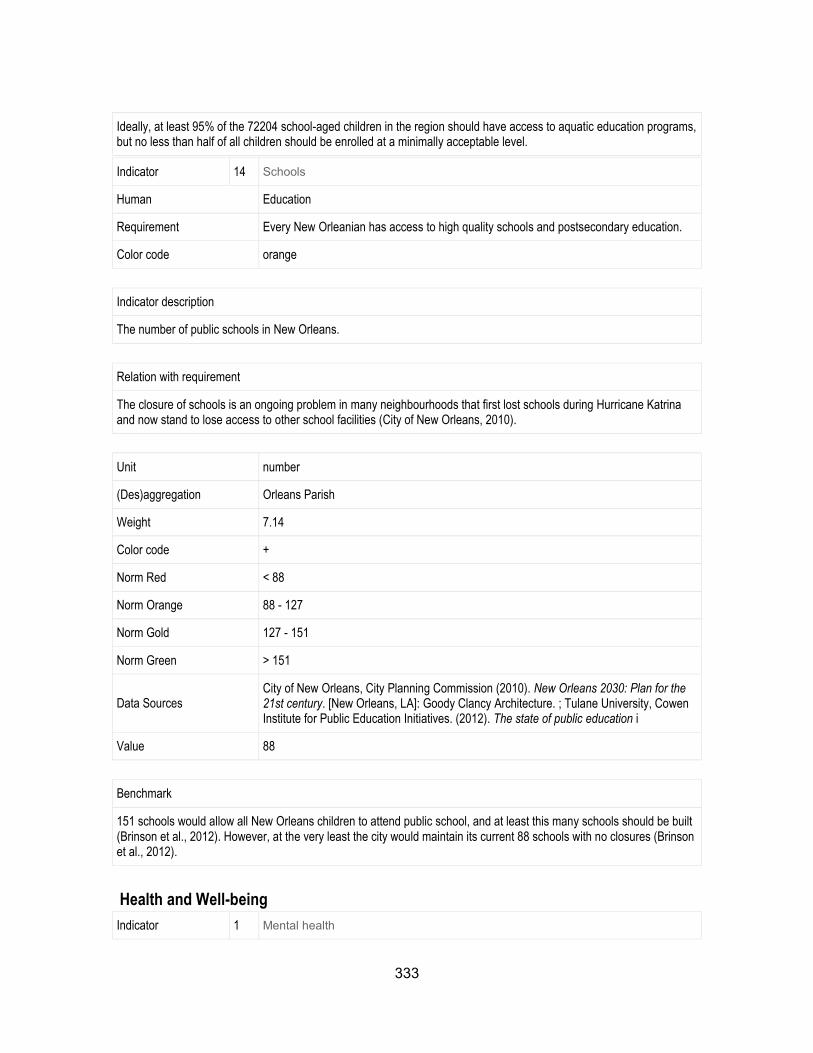
333
Ideally, at least 95% of the 72204 school-aged children in the region should have access to aquatic education programs, but no less than half of all children should be enrolled at a minimally acceptable level.
Indicator 14 Schools
Human Education
Requirement Every New Orleanian has access to high quality schools and postsecondary education.
Color code orange
Indicator description
The number of public schools in New Orleans.
Relation with requirement
The closure of schools is an ongoing problem in many neighbourhoods that first lost schools during Hurricane Katrina and now stand to lose access to other school facilities (City of New Orleans, 2010).
Unit number
(Des)aggregation Orleans Parish
Weight 7.14
Color code +
Norm Red < 88
Norm Orange 88 - 127
Norm Gold 127 - 151
Norm Green > 151
Data Sources City of New Orleans, City Planning Commission (2010). New Orleans 2030: Plan for the 21st century. [New Orleans, LA]: Goody Clancy Architecture. ; Tulane University, Cowen Institute for Public Education Initiatives. (2012). The state of public education i
Value 88
Benchmark
151 schools would allow all New Orleans children to attend public school, and at least this many schools should be built (Brinson et al., 2012). However, at the very least the city would maintain its current 88 schools with no closures (Brinson et al., 2012).
Health and Well-being
Indicator 1 Mental health
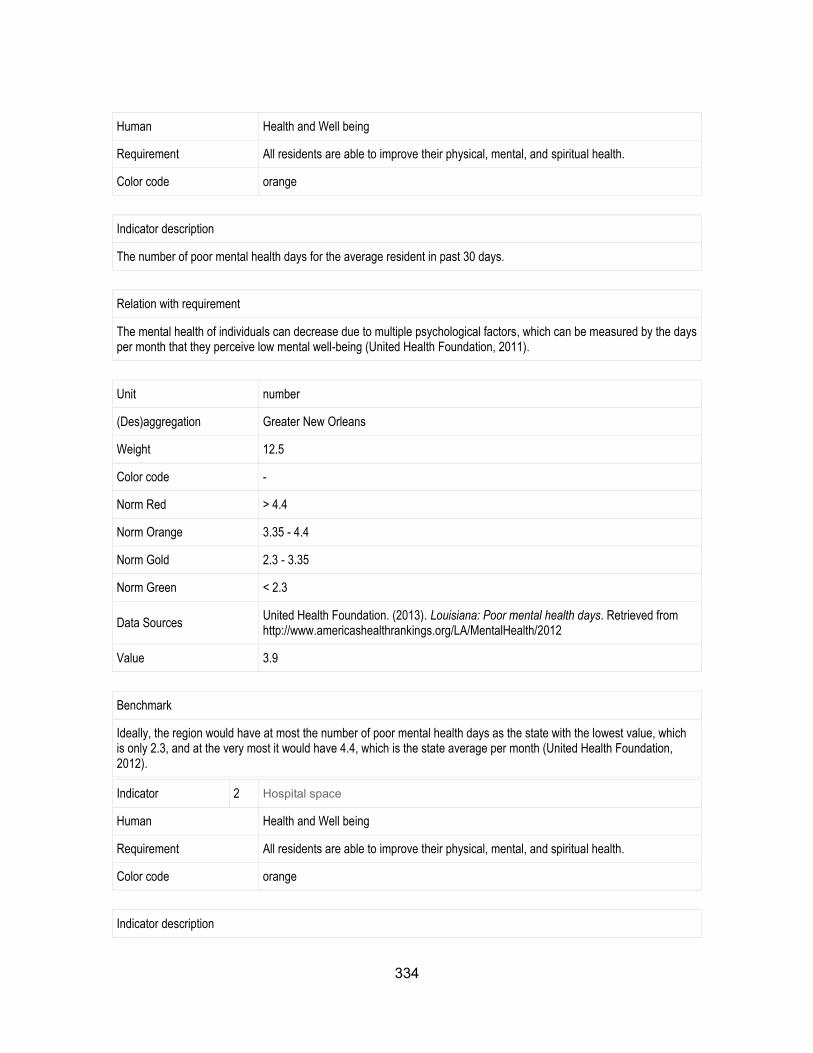
334
Human Health and Well being
Requirement All residents are able to improve their physical, mental, and spiritual health.
Color code orange
Indicator description
The number of poor mental health days for the average resident in past 30 days.
Relation with requirement
The mental health of individuals can decrease due to multiple psychological factors, which can be measured by the days per month that they perceive low mental well-being (United Health Foundation, 2011).
Unit number
(Des)aggregation Greater New Orleans
Weight 12.5
Color code -
Norm Red > 4.4
Norm Orange 3.35 - 4.4
Norm Gold 2.3 - 3.35
Norm Green < 2.3
Data Sources United Health Foundation. (2013). Louisiana: Poor mental health days. Retrieved from http://www.americashealthrankings.org/LA/MentalHealth/2012
Value 3.9
Benchmark
Ideally, the region would have at most the number of poor mental health days as the state with the lowest value, which is only 2.3, and at the very most it would have 4.4, which is the state average per month (United Health Foundation, 2012).
Indicator 2 Hospital space
Human Health and Well being
Requirement All residents are able to improve their physical, mental, and spiritual health.
Color code orange
Indicator description
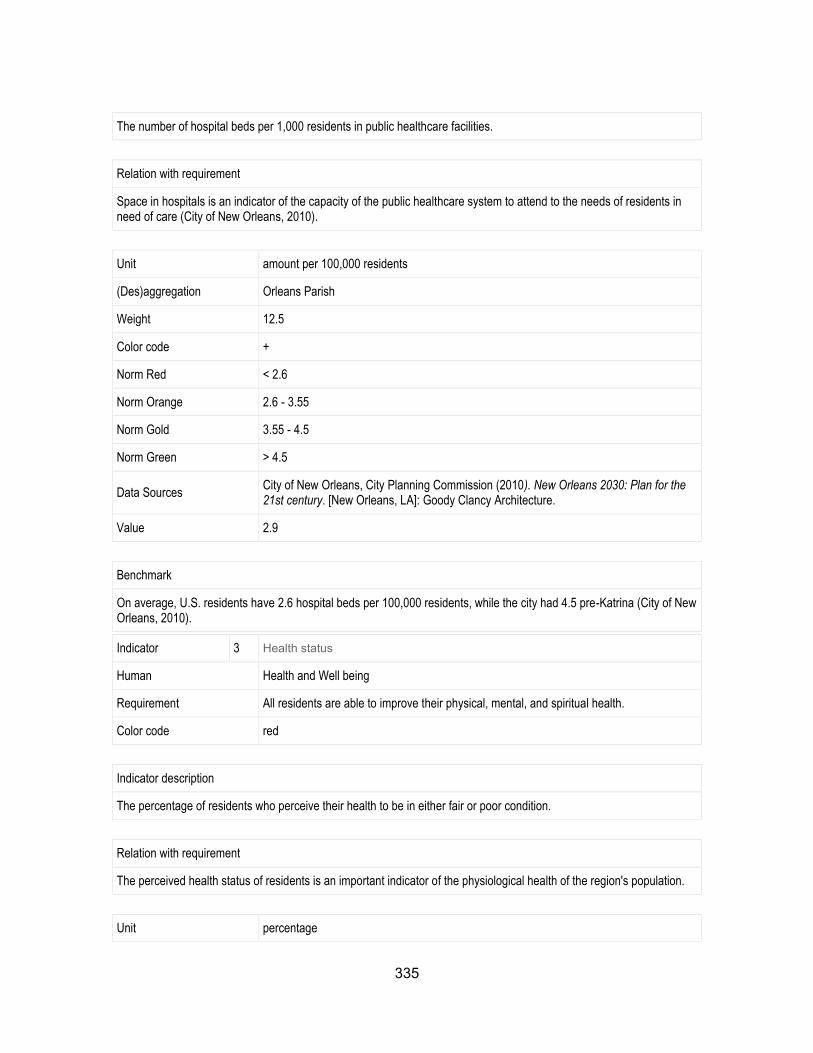
335
The number of hospital beds per 1,000 residents in public healthcare facilities.
Relation with requirement
Space in hospitals is an indicator of the capacity of the public healthcare system to attend to the needs of residents in need of care (City of New Orleans, 2010).
Unit amount per 100,000 residents
(Des)aggregation Orleans Parish
Weight 12.5
Color code +
Norm Red < 2.6
Norm Orange 2.6 - 3.55
Norm Gold 3.55 - 4.5
Norm Green > 4.5
Data Sources City of New Orleans, City Planning Commission (2010). New Orleans 2030: Plan for the 21st century. [New Orleans, LA]: Goody Clancy Architecture.
Value 2.9
Benchmark
On average, U.S. residents have 2.6 hospital beds per 100,000 residents, while the city had 4.5 pre-Katrina (City of New Orleans, 2010).
Indicator 3 Health status
Human Health and Well being
Requirement All residents are able to improve their physical, mental, and spiritual health.
Color code red
Indicator description
The percentage of residents who perceive their health to be in either fair or poor condition.
Relation with requirement
The perceived health status of residents is an important indicator of the physiological health of the region's population.
Unit percentage
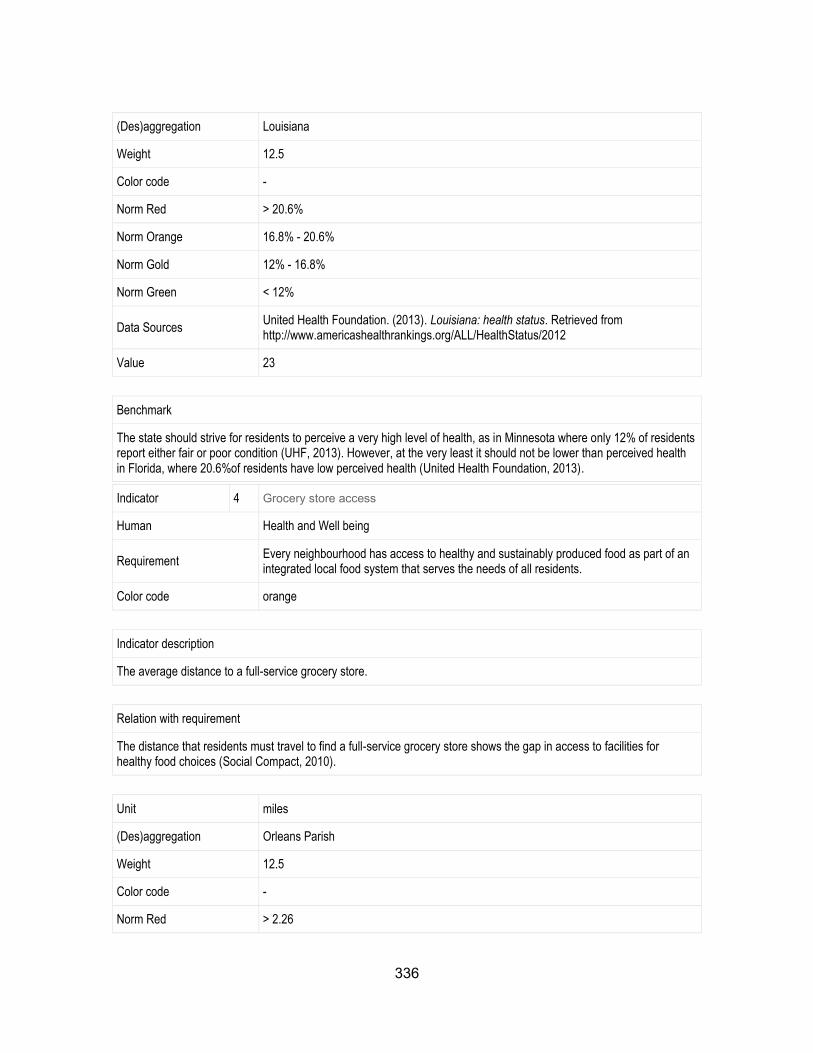
336
(Des)aggregation Louisiana
Weight 12.5
Color code -
Norm Red > 20.6%
Norm Orange 16.8% - 20.6%
Norm Gold 12% - 16.8%
Norm Green < 12%
Data Sources United Health Foundation. (2013). Louisiana: health status. Retrieved from http://www.americashealthrankings.org/ALL/HealthStatus/2012
Value 23
Benchmark
The state should strive for residents to perceive a very high level of health, as in Minnesota where only 12% of residents report either fair or poor condition (UHF, 2013). However, at the very least it should not be lower than perceived health in Florida, where 20.6%of residents have low perceived health (United Health Foundation, 2013).
Indicator 4 Grocery store access
Human Health and Well being
Requirement Every neighbourhood has access to healthy and sustainably produced food as part of an integrated local food system that serves the needs of all residents.
Color code orange
Indicator description
The average distance to a full-service grocery store.
Relation with requirement
The distance that residents must travel to find a full-service grocery store shows the gap in access to facilities for healthy food choices (Social Compact, 2010).
Unit miles
(Des)aggregation Orleans Parish
Weight 12.5
Color code -
Norm Red > 2.26
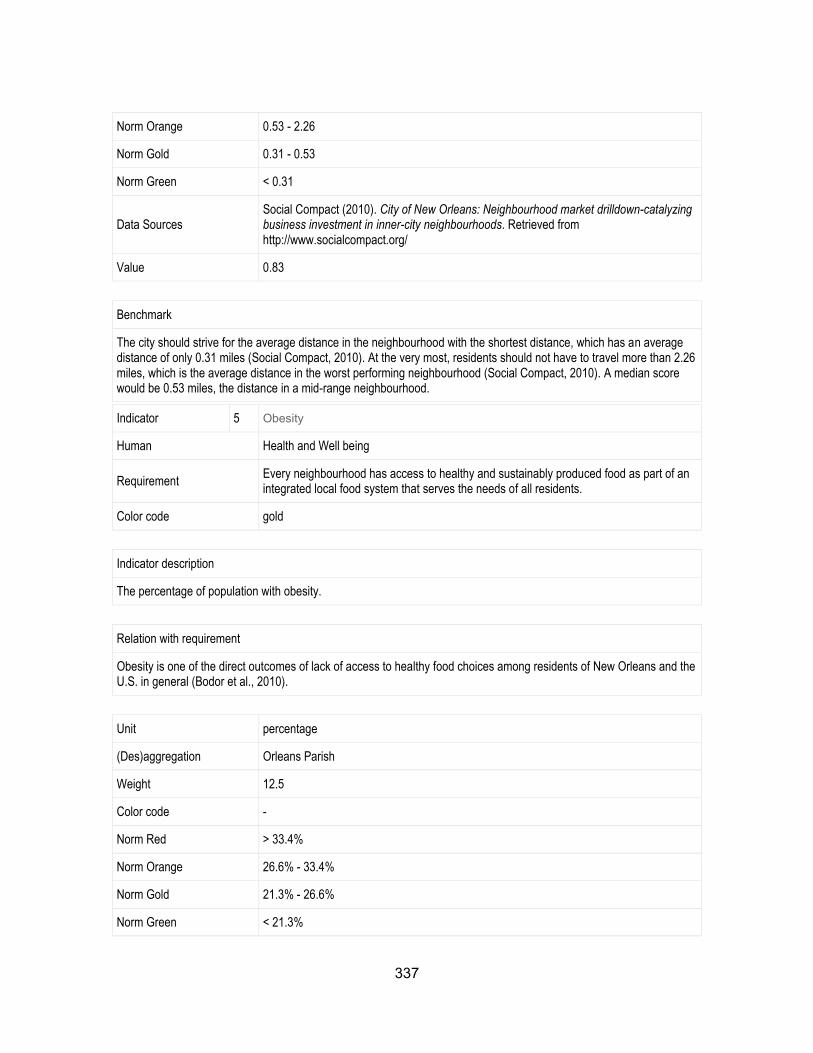
337
Norm Orange 0.53 - 2.26
Norm Gold 0.31 - 0.53
Norm Green < 0.31
Data Sources Social Compact (2010). City of New Orleans: Neighbourhood market drilldown-catalyzing business investment in inner-city neighbourhoods. Retrieved from http://www.socialcompact.org/
Value 0.83
Benchmark
The city should strive for the average distance in the neighbourhood with the shortest distance, which has an average distance of only 0.31 miles (Social Compact, 2010). At the very most, residents should not have to travel more than 2.26 miles, which is the average distance in the worst performing neighbourhood (Social Compact, 2010). A median score would be 0.53 miles, the distance in a mid-range neighbourhood.
Indicator 5 Obesity
Human Health and Well being
Requirement Every neighbourhood has access to healthy and sustainably produced food as part of an integrated local food system that serves the needs of all residents.
Color code gold
Indicator description
The percentage of population with obesity.
Relation with requirement
Obesity is one of the direct outcomes of lack of access to healthy food choices among residents of New Orleans and the U.S. in general (Bodor et al., 2010).
Unit percentage
(Des)aggregation Orleans Parish
Weight 12.5
Color code -
Norm Red > 33.4%
Norm Orange 26.6% - 33.4%
Norm Gold 21.3% - 26.6%
Norm Green < 21.3%
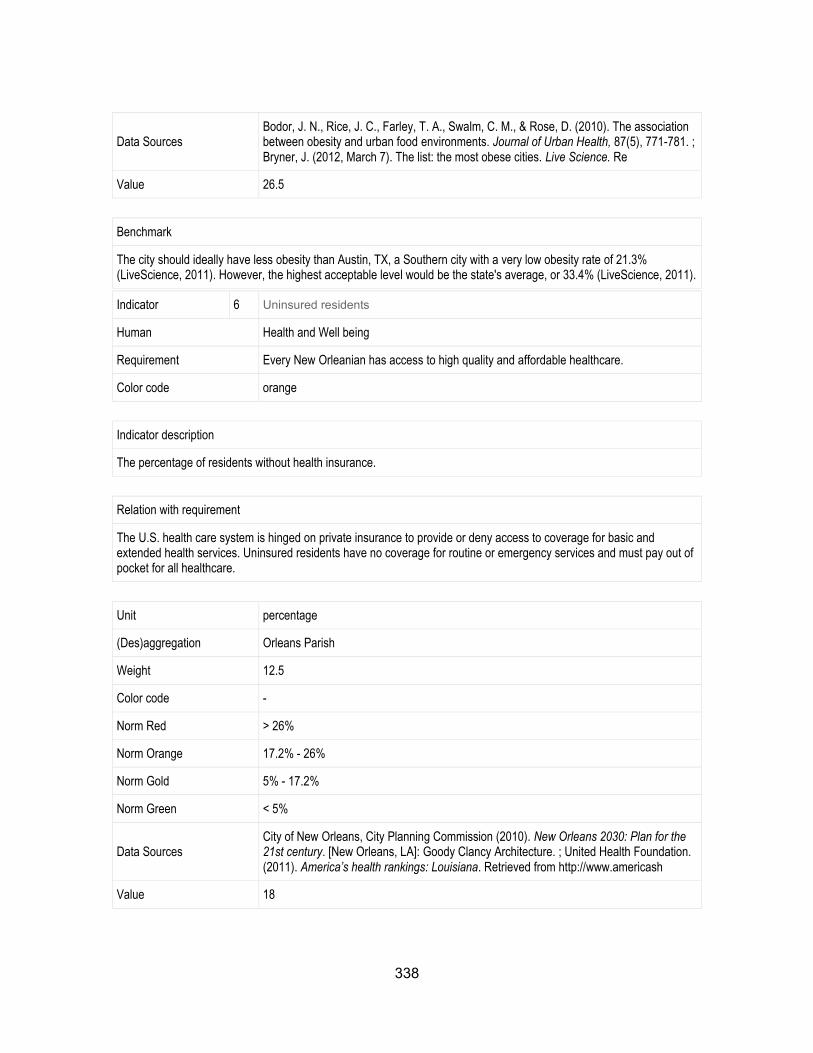
338
Data Sources Bodor, J. N., Rice, J. C., Farley, T. A., Swalm, C. M., & Rose, D. (2010). The association between obesity and urban food environments. Journal of Urban Health, 87(5), 771-781. ; Bryner, J. (2012, March 7). The list: the most obese cities. Live Science. Re
Value 26.5
Benchmark
The city should ideally have less obesity than Austin, TX, a Southern city with a very low obesity rate of 21.3% (LiveScience, 2011). However, the highest acceptable level would be the state's average, or 33.4% (LiveScience, 2011).
Indicator 6 Uninsured residents
Human Health and Well being
Requirement Every New Orleanian has access to high quality and affordable healthcare.
Color code orange
Indicator description
The percentage of residents without health insurance.
Relation with requirement
The U.S. health care system is hinged on private insurance to provide or deny access to coverage for basic and extended health services. Uninsured residents have no coverage for routine or emergency services and must pay out of pocket for all healthcare.
Unit percentage
(Des)aggregation Orleans Parish
Weight 12.5
Color code -
Norm Red > 26%
Norm Orange 17.2% - 26%
Norm Gold 5% - 17.2%
Norm Green < 5%
Data Sources City of New Orleans, City Planning Commission (2010). New Orleans 2030: Plan for the 21st century. [New Orleans, LA]: Goody Clancy Architecture. ; United Health Foundation. (2011). America’s health rankings: Louisiana. Retrieved from http://www.americash
Value 18
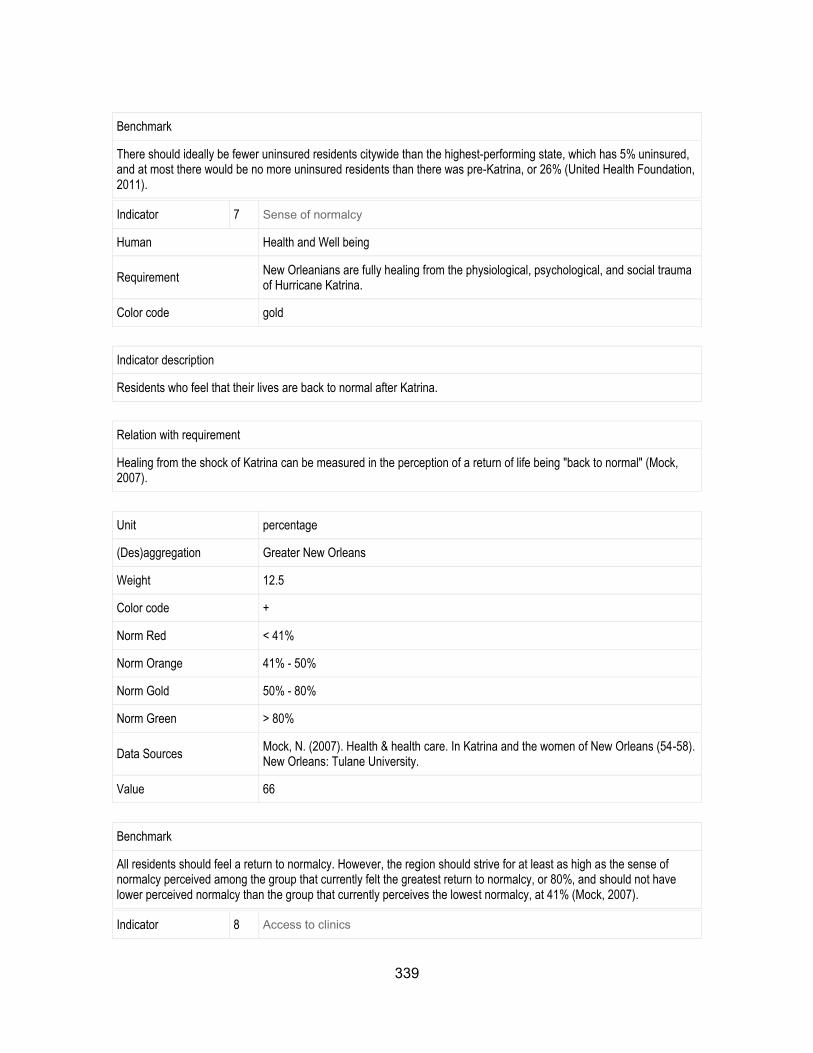
339
Benchmark
There should ideally be fewer uninsured residents citywide than the highest-performing state, which has 5% uninsured, and at most there would be no more uninsured residents than there was pre-Katrina, or 26% (United Health Foundation, 2011).
Indicator 7 Sense of normalcy
Human Health and Well being
Requirement New Orleanians are fully healing from the physiological, psychological, and social trauma of Hurricane Katrina.
Color code gold
Indicator description
Residents who feel that their lives are back to normal after Katrina.
Relation with requirement
Healing from the shock of Katrina can be measured in the perception of a return of life being "back to normal" (Mock, 2007).
Unit percentage
(Des)aggregation Greater New Orleans
Weight 12.5
Color code +
Norm Red < 41%
Norm Orange 41% - 50%
Norm Gold 50% - 80%
Norm Green > 80%
Data Sources Mock, N. (2007). Health & health care. In Katrina and the women of New Orleans (54-58). New Orleans: Tulane University.
Value 66
Benchmark
All residents should feel a return to normalcy. However, the region should strive for at least as high as the sense of normalcy perceived among the group that currently felt the greatest return to normalcy, or 80%, and should not have lower perceived normalcy than the group that currently perceives the lowest normalcy, at 41% (Mock, 2007).
Indicator 8 Access to clinics
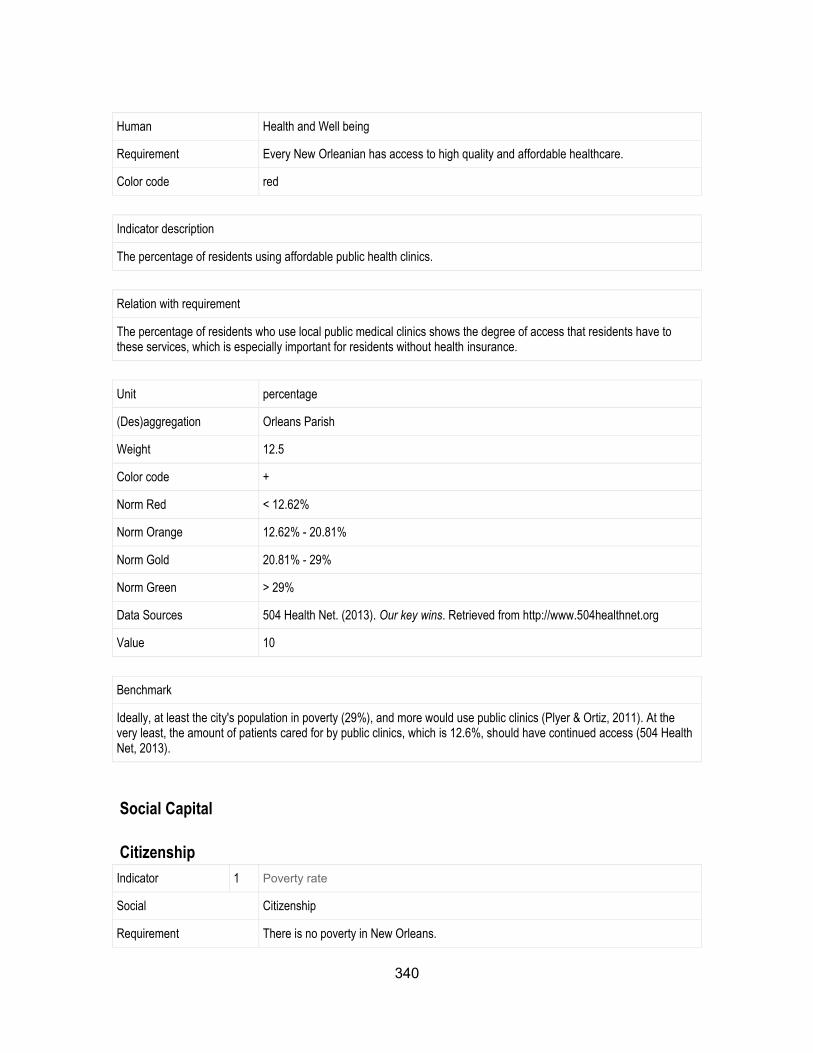
340
Human Health and Well being
Requirement Every New Orleanian has access to high quality and affordable healthcare.
Color code red
Indicator description
The percentage of residents using affordable public health clinics.
Relation with requirement
The percentage of residents who use local public medical clinics shows the degree of access that residents have to these services, which is especially important for residents without health insurance.
Unit percentage
(Des)aggregation Orleans Parish
Weight 12.5
Color code +
Norm Red < 12.62%
Norm Orange 12.62% - 20.81%
Norm Gold 20.81% - 29%
Norm Green > 29%
Data Sources 504 Health Net. (2013). Our key wins. Retrieved from http://www.504healthnet.org
Value 10
Benchmark
Ideally, at least the city's population in poverty (29%), and more would use public clinics (Plyer & Ortiz, 2011). At the very least, the amount of patients cared for by public clinics, which is 12.6%, should have continued access (504 Health Net, 2013).
Social Capital
Citizenship
Indicator 1 Poverty rate
Social Citizenship
Requirement There is no poverty in New Orleans.
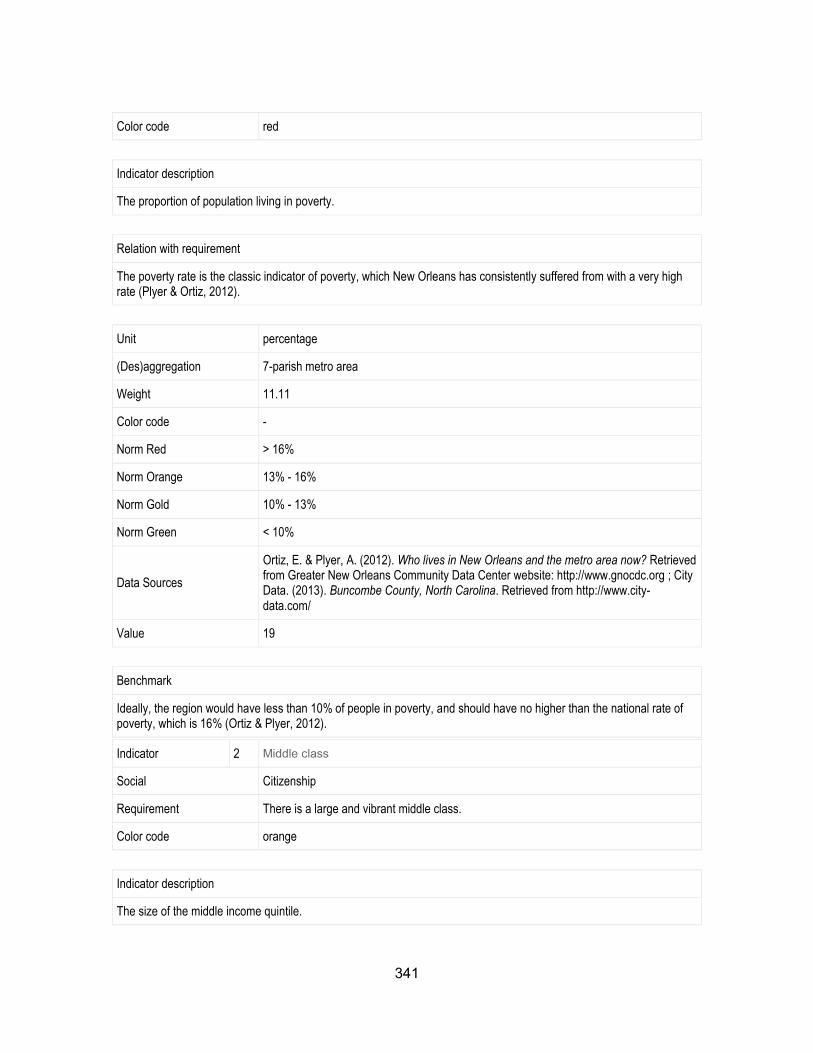
341
Color code red
Indicator description
The proportion of population living in poverty.
Relation with requirement
The poverty rate is the classic indicator of poverty, which New Orleans has consistently suffered from with a very high rate (Plyer & Ortiz, 2012).
Unit percentage
(Des)aggregation 7-parish metro area
Weight 11.11
Color code -
Norm Red > 16%
Norm Orange 13% - 16%
Norm Gold 10% - 13%
Norm Green < 10%
Data Sources
Ortiz, E. & Plyer, A. (2012). Who lives in New Orleans and the metro area now? Retrieved from Greater New Orleans Community Data Center website: http://www.gnocdc.org ; City Data. (2013). Buncombe County, North Carolina. Retrieved from http://www.city-data.com/
Value 19
Benchmark
Ideally, the region would have less than 10% of people in poverty, and should have no higher than the national rate of poverty, which is 16% (Ortiz & Plyer, 2012).
Indicator 2 Middle class
Social Citizenship
Requirement There is a large and vibrant middle class.
Color code orange
Indicator description
The size of the middle income quintile.
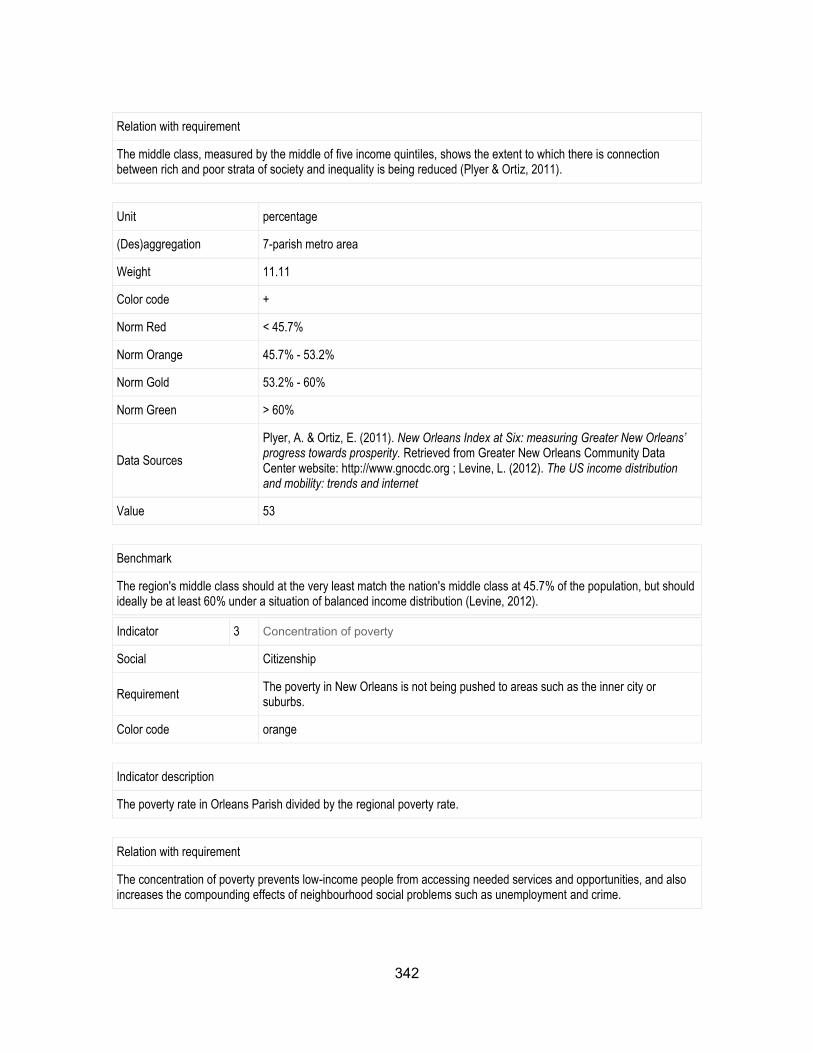
342
Relation with requirement
The middle class, measured by the middle of five income quintiles, shows the extent to which there is connection between rich and poor strata of society and inequality is being reduced (Plyer & Ortiz, 2011).
Unit percentage
(Des)aggregation 7-parish metro area
Weight 11.11
Color code +
Norm Red < 45.7%
Norm Orange 45.7% - 53.2%
Norm Gold 53.2% - 60%
Norm Green > 60%
Data Sources
Plyer, A. & Ortiz, E. (2011). New Orleans Index at Six: measuring Greater New Orleans’ progress towards prosperity. Retrieved from Greater New Orleans Community Data Center website: http://www.gnocdc.org ; Levine, L. (2012). The US income distribution and mobility: trends and internet
Value 53
Benchmark
The region's middle class should at the very least match the nation's middle class at 45.7% of the population, but should ideally be at least 60% under a situation of balanced income distribution (Levine, 2012).
Indicator 3 Concentration of poverty
Social Citizenship
Requirement The poverty in New Orleans is not being pushed to areas such as the inner city or suburbs.
Color code orange
Indicator description
The poverty rate in Orleans Parish divided by the regional poverty rate.
Relation with requirement
The concentration of poverty prevents low-income people from accessing needed services and opportunities, and also increases the compounding effects of neighbourhood social problems such as unemployment and crime.
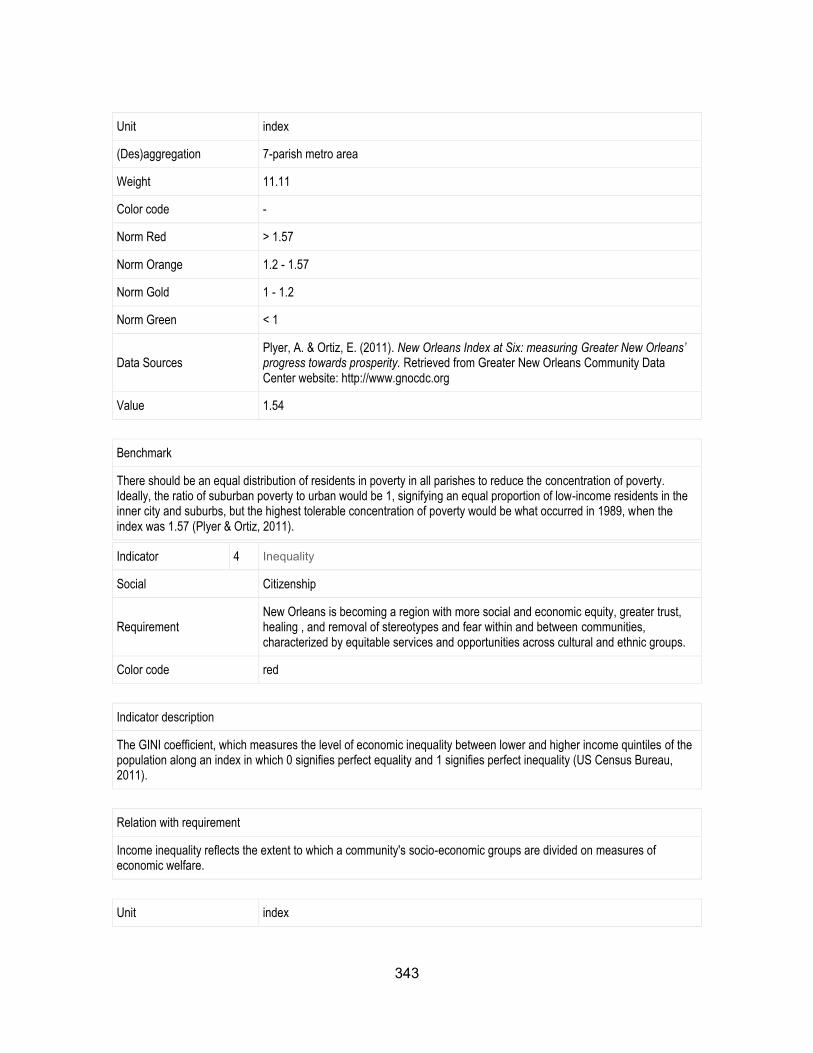
343
Unit index
(Des)aggregation 7-parish metro area
Weight 11.11
Color code -
Norm Red > 1.57
Norm Orange 1.2 - 1.57
Norm Gold 1 - 1.2
Norm Green < 1
Data Sources Plyer, A. & Ortiz, E. (2011). New Orleans Index at Six: measuring Greater New Orleans’ progress towards prosperity. Retrieved from Greater New Orleans Community Data Center website: http://www.gnocdc.org
Value 1.54
Benchmark
There should be an equal distribution of residents in poverty in all parishes to reduce the concentration of poverty. Ideally, the ratio of suburban poverty to urban would be 1, signifying an equal proportion of low-income residents in the inner city and suburbs, but the highest tolerable concentration of poverty would be what occurred in 1989, when the index was 1.57 (Plyer & Ortiz, 2011).
Indicator 4 Inequality
Social Citizenship
Requirement New Orleans is becoming a region with more social and economic equity, greater trust, healing , and removal of stereotypes and fear within and between communities, characterized by equitable services and opportunities across cultural and ethnic groups.
Color code red
Indicator description
The GINI coefficient, which measures the level of economic inequality between lower and higher income quintiles of the population along an index in which 0 signifies perfect equality and 1 signifies perfect inequality (US Census Bureau, 2011).
Relation with requirement
Income inequality reflects the extent to which a community's socio-economic groups are divided on measures of economic welfare.
Unit index
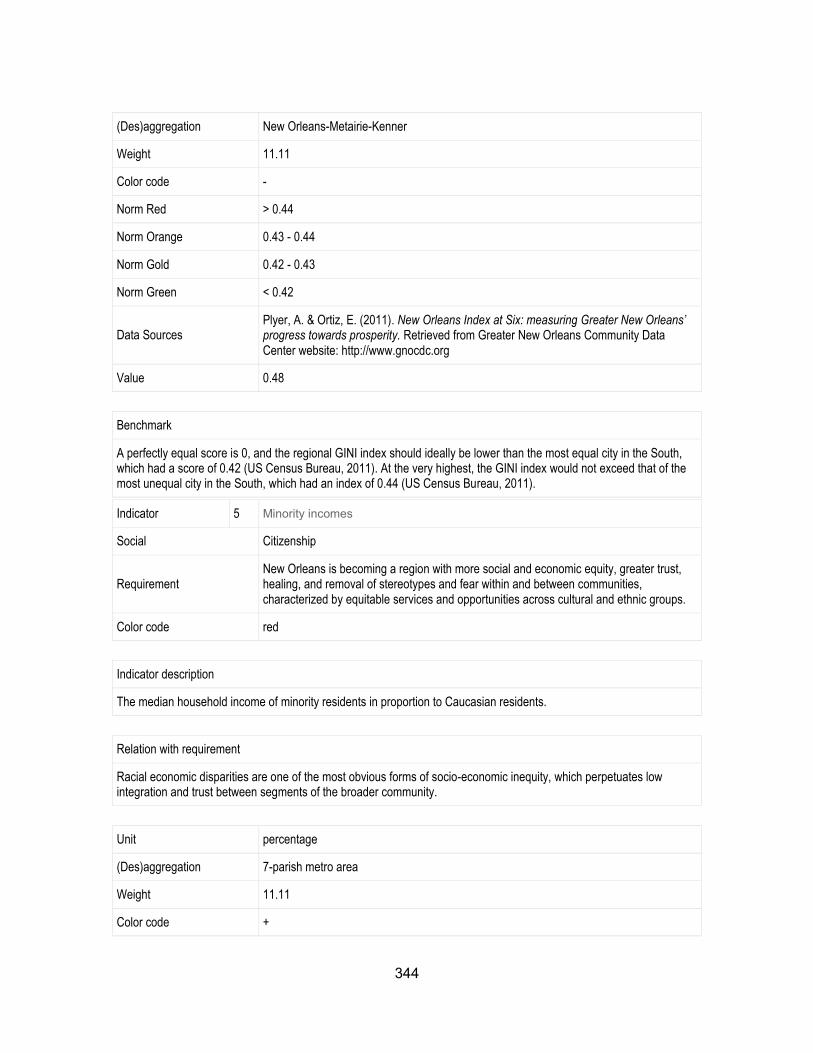
344
(Des)aggregation New Orleans-Metairie-Kenner
Weight 11.11
Color code -
Norm Red > 0.44
Norm Orange 0.43 - 0.44
Norm Gold 0.42 - 0.43
Norm Green < 0.42
Data Sources Plyer, A. & Ortiz, E. (2011). New Orleans Index at Six: measuring Greater New Orleans’ progress towards prosperity. Retrieved from Greater New Orleans Community Data Center website: http://www.gnocdc.org
Value 0.48
Benchmark
A perfectly equal score is 0, and the regional GINI index should ideally be lower than the most equal city in the South, which had a score of 0.42 (US Census Bureau, 2011). At the very highest, the GINI index would not exceed that of the most unequal city in the South, which had an index of 0.44 (US Census Bureau, 2011).
Indicator 5 Minority incomes
Social Citizenship
Requirement New Orleans is becoming a region with more social and economic equity, greater trust, healing, and removal of stereotypes and fear within and between communities, characterized by equitable services and opportunities across cultural and ethnic groups.
Color code red
Indicator description
The median household income of minority residents in proportion to Caucasian residents.
Relation with requirement
Racial economic disparities are one of the most obvious forms of socio-economic inequity, which perpetuates low integration and trust between segments of the broader community.
Unit percentage
(Des)aggregation 7-parish metro area
Weight 11.11
Color code +
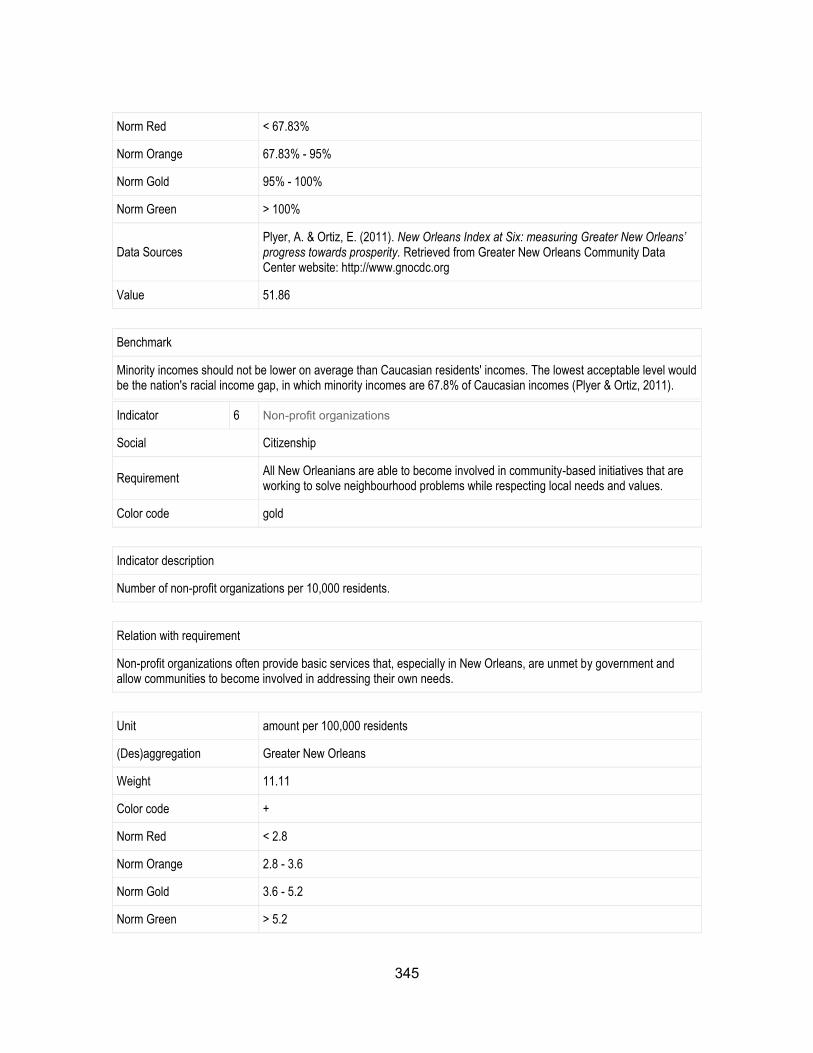
345
Norm Red < 67.83%
Norm Orange 67.83% - 95%
Norm Gold 95% - 100%
Norm Green > 100%
Data Sources Plyer, A. & Ortiz, E. (2011). New Orleans Index at Six: measuring Greater New Orleans’ progress towards prosperity. Retrieved from Greater New Orleans Community Data Center website: http://www.gnocdc.org
Value 51.86
Benchmark
Minority incomes should not be lower on average than Caucasian residents' incomes. The lowest acceptable level would be the nation's racial income gap, in which minority incomes are 67.8% of Caucasian incomes (Plyer & Ortiz, 2011).
Indicator 6 Non-profit organizations
Social Citizenship
Requirement All New Orleanians are able to become involved in community-based initiatives that are working to solve neighbourhood problems while respecting local needs and values.
Color code gold
Indicator description
Number of non-profit organizations per 10,000 residents.
Relation with requirement
Non-profit organizations often provide basic services that, especially in New Orleans, are unmet by government and allow communities to become involved in addressing their own needs.
Unit amount per 100,000 residents
(Des)aggregation Greater New Orleans
Weight 11.11
Color code +
Norm Red < 2.8
Norm Orange 2.8 - 3.6
Norm Gold 3.6 - 5.2
Norm Green > 5.2
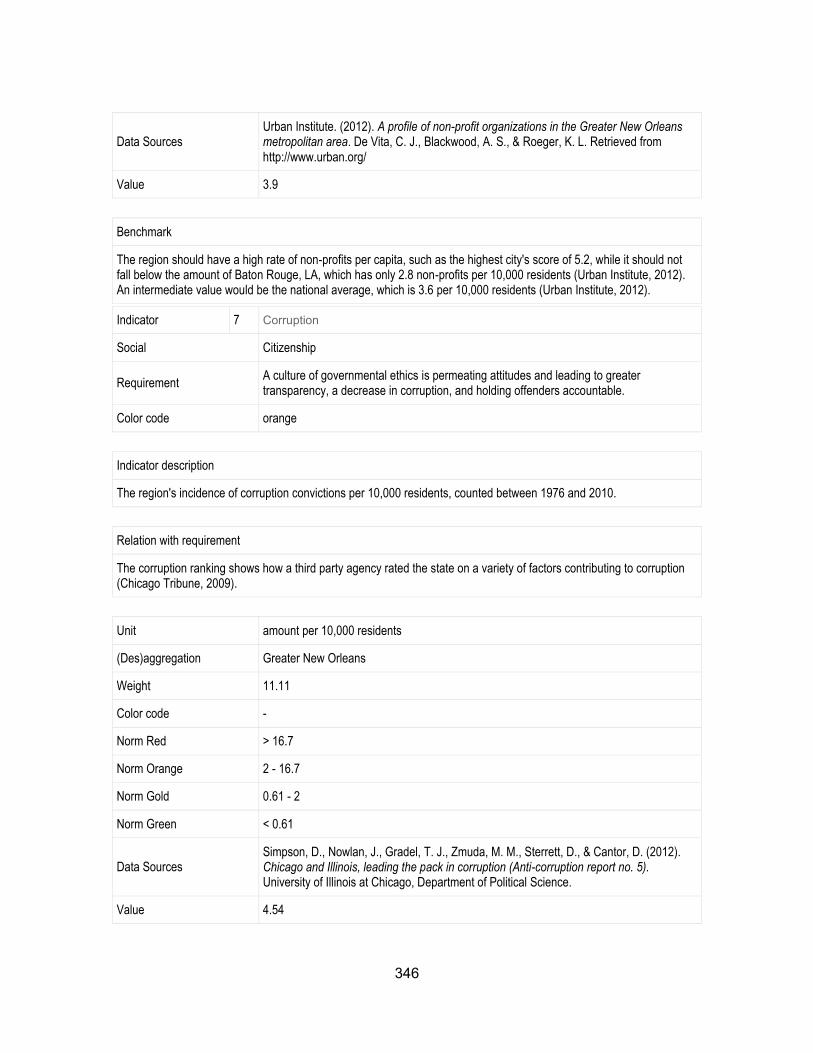
346
Data Sources Urban Institute. (2012). A profile of non-profit organizations in the Greater New Orleans metropolitan area. De Vita, C. J., Blackwood, A. S., & Roeger, K. L. Retrieved from http://www.urban.org/
Value 3.9
Benchmark
The region should have a high rate of non-profits per capita, such as the highest city's score of 5.2, while it should not fall below the amount of Baton Rouge, LA, which has only 2.8 non-profits per 10,000 residents (Urban Institute, 2012). An intermediate value would be the national average, which is 3.6 per 10,000 residents (Urban Institute, 2012).
Indicator 7 Corruption
Social Citizenship
Requirement A culture of governmental ethics is permeating attitudes and leading to greater transparency, a decrease in corruption, and holding offenders accountable.
Color code orange
Indicator description
The region's incidence of corruption convictions per 10,000 residents, counted between 1976 and 2010.
Relation with requirement
The corruption ranking shows how a third party agency rated the state on a variety of factors contributing to corruption (Chicago Tribune, 2009).
Unit amount per 10,000 residents
(Des)aggregation Greater New Orleans
Weight 11.11
Color code -
Norm Red > 16.7
Norm Orange 2 - 16.7
Norm Gold 0.61 - 2
Norm Green < 0.61
Data Sources Simpson, D., Nowlan, J., Gradel, T. J., Zmuda, M. M., Sterrett, D., & Cantor, D. (2012). Chicago and Illinois, leading the pack in corruption (Anti-corruption report no. 5). University of Illinois at Chicago, Department of Political Science.
Value 4.54
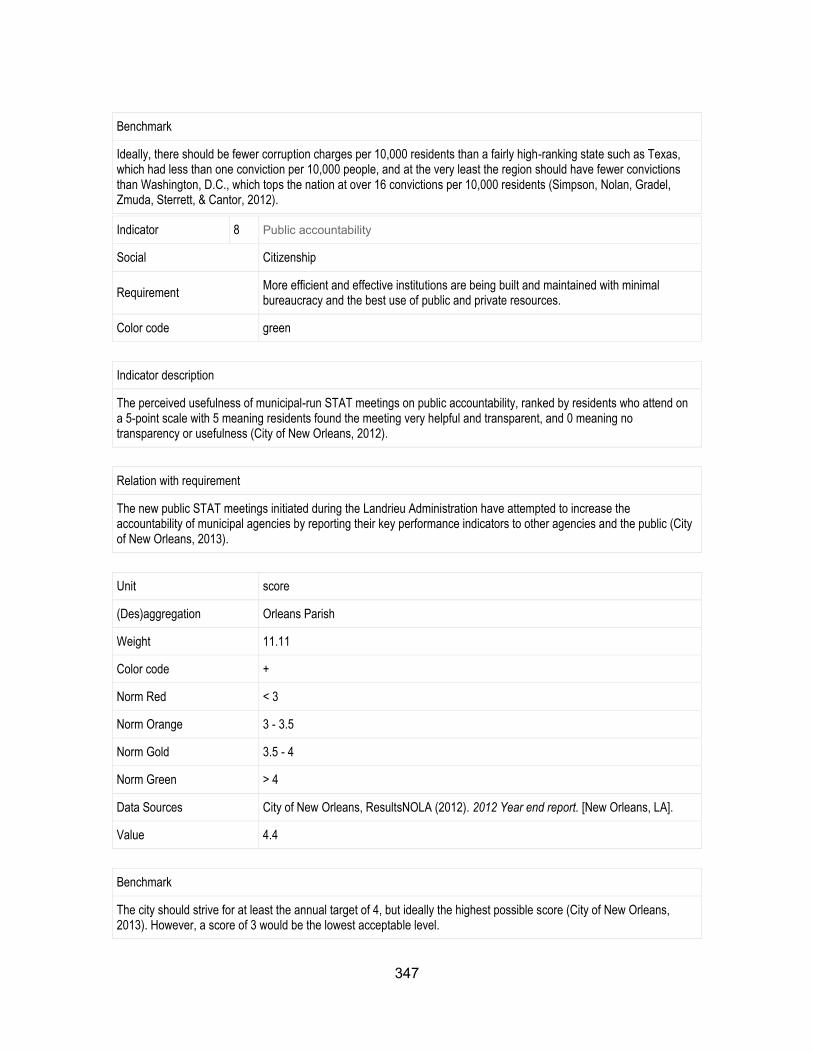
347
Benchmark
Ideally, there should be fewer corruption charges per 10,000 residents than a fairly high-ranking state such as Texas, which had less than one conviction per 10,000 people, and at the very least the region should have fewer convictions than Washington, D.C., which tops the nation at over 16 convictions per 10,000 residents (Simpson, Nolan, Gradel, Zmuda, Sterrett, & Cantor, 2012).
Indicator 8 Public accountability
Social Citizenship
Requirement More efficient and effective institutions are being built and maintained with minimal bureaucracy and the best use of public and private resources.
Color code green
Indicator description
The perceived usefulness of municipal-run STAT meetings on public accountability, ranked by residents who attend on a 5-point scale with 5 meaning residents found the meeting very helpful and transparent, and 0 meaning no transparency or usefulness (City of New Orleans, 2012).
Relation with requirement
The new public STAT meetings initiated during the Landrieu Administration have attempted to increase the accountability of municipal agencies by reporting their key performance indicators to other agencies and the public (City of New Orleans, 2013).
Unit score
(Des)aggregation Orleans Parish
Weight 11.11
Color code +
Norm Red < 3
Norm Orange 3 - 3.5
Norm Gold 3.5 - 4
Norm Green > 4
Data Sources City of New Orleans, ResultsNOLA (2012). 2012 Year end report. [New Orleans, LA].
Value 4.4
Benchmark
The city should strive for at least the annual target of 4, but ideally the highest possible score (City of New Orleans, 2013). However, a score of 3 would be the lowest acceptable level.
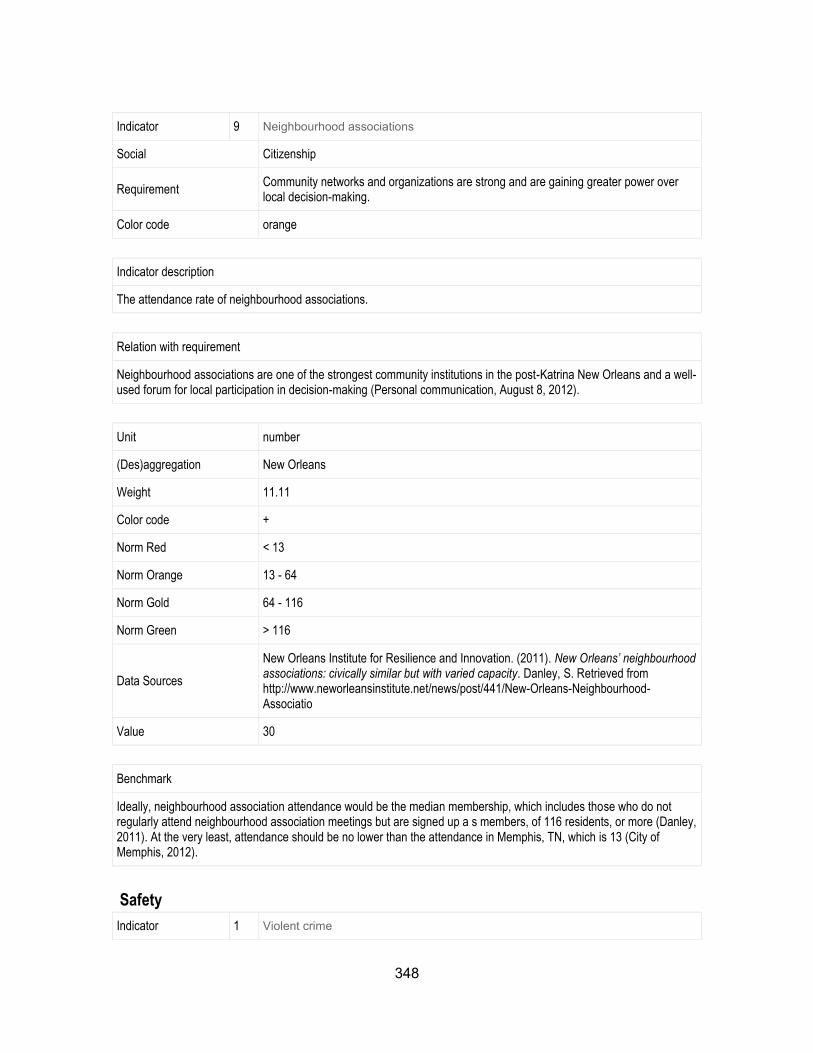
348
Indicator 9 Neighbourhood associations
Social Citizenship
Requirement Community networks and organizations are strong and are gaining greater power over local decision-making.
Color code orange
Indicator description
The attendance rate of neighbourhood associations.
Relation with requirement
Neighbourhood associations are one of the strongest community institutions in the post-Katrina New Orleans and a well-used forum for local participation in decision-making (Personal communication, August 8, 2012).
Unit number
(Des)aggregation New Orleans
Weight 11.11
Color code +
Norm Red < 13
Norm Orange 13 - 64
Norm Gold 64 - 116
Norm Green > 116
Data Sources
New Orleans Institute for Resilience and Innovation. (2011). New Orleans’ neighbourhood associations: civically similar but with varied capacity. Danley, S. Retrieved from http://www.neworleansinstitute.net/news/post/441/New-Orleans-Neighbourhood-Associatio
Value 30
Benchmark
Ideally, neighbourhood association attendance would be the median membership, which includes those who do not regularly attend neighbourhood association meetings but are signed up a s members, of 116 residents, or more (Danley, 2011). At the very least, attendance should be no lower than the attendance in Memphis, TN, which is 13 (City of Memphis, 2012).
Safety
Indicator 1 Violent crime
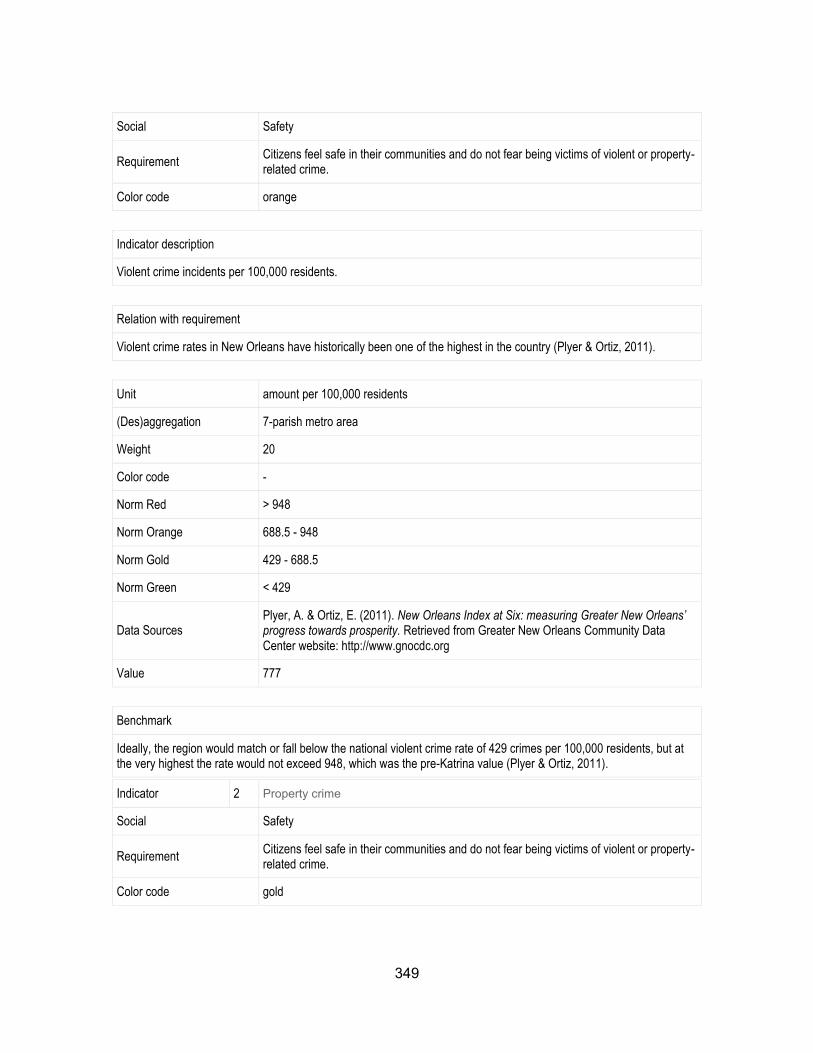
349
Social Safety
Requirement Citizens feel safe in their communities and do not fear being victims of violent or property-related crime.
Color code orange
Indicator description
Violent crime incidents per 100,000 residents.
Relation with requirement
Violent crime rates in New Orleans have historically been one of the highest in the country (Plyer & Ortiz, 2011).
Unit amount per 100,000 residents
(Des)aggregation 7-parish metro area
Weight 20
Color code -
Norm Red > 948
Norm Orange 688.5 - 948
Norm Gold 429 - 688.5
Norm Green < 429
Data Sources Plyer, A. & Ortiz, E. (2011). New Orleans Index at Six: measuring Greater New Orleans’ progress towards prosperity. Retrieved from Greater New Orleans Community Data Center website: http://www.gnocdc.org
Value 777
Benchmark
Ideally, the region would match or fall below the national violent crime rate of 429 crimes per 100,000 residents, but at the very highest the rate would not exceed 948, which was the pre-Katrina value (Plyer & Ortiz, 2011).
Indicator 2 Property crime
Social Safety
Requirement Citizens feel safe in their communities and do not fear being victims of violent or property-related crime.
Color code gold
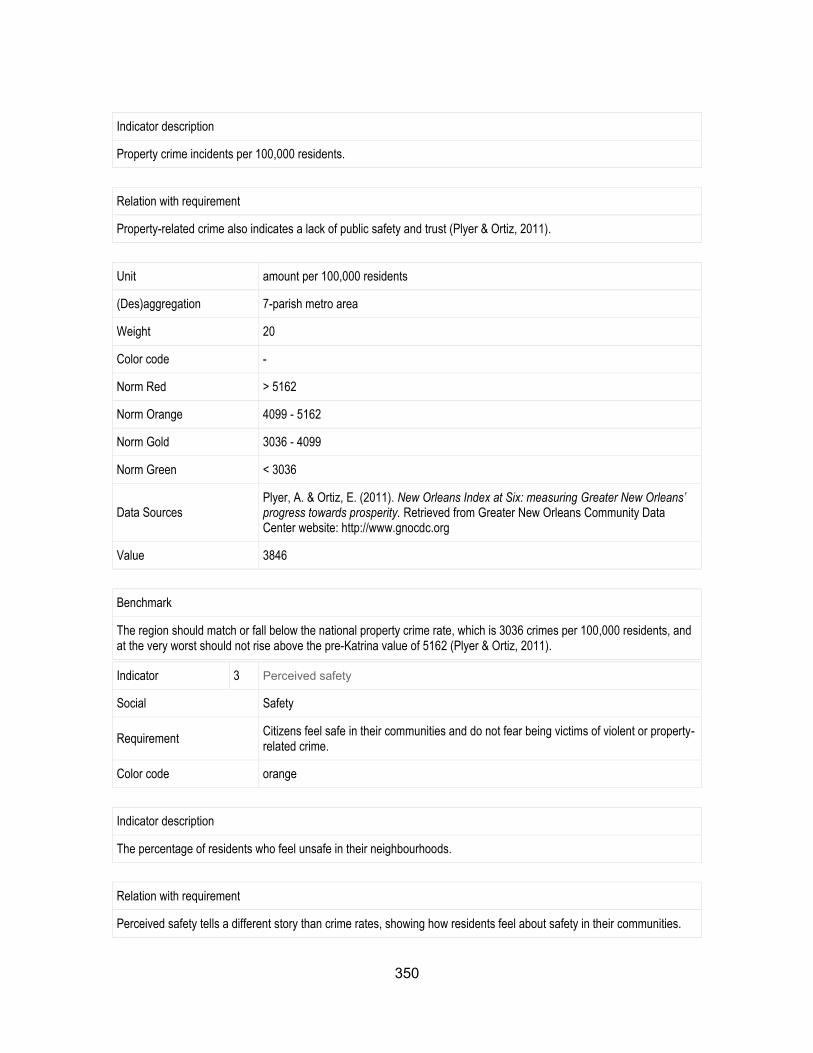
350
Indicator description
Property crime incidents per 100,000 residents.
Relation with requirement
Property-related crime also indicates a lack of public safety and trust (Plyer & Ortiz, 2011).
Unit amount per 100,000 residents
(Des)aggregation 7-parish metro area
Weight 20
Color code -
Norm Red > 5162
Norm Orange 4099 - 5162
Norm Gold 3036 - 4099
Norm Green < 3036
Data Sources Plyer, A. & Ortiz, E. (2011). New Orleans Index at Six: measuring Greater New Orleans’ progress towards prosperity. Retrieved from Greater New Orleans Community Data Center website: http://www.gnocdc.org
Value 3846
Benchmark
The region should match or fall below the national property crime rate, which is 3036 crimes per 100,000 residents, and at the very worst should not rise above the pre-Katrina value of 5162 (Plyer & Ortiz, 2011).
Indicator 3 Perceived safety
Social Safety
Requirement Citizens feel safe in their communities and do not fear being victims of violent or property-related crime.
Color code orange
Indicator description
The percentage of residents who feel unsafe in their neighbourhoods.
Relation with requirement
Perceived safety tells a different story than crime rates, showing how residents feel about safety in their communities.
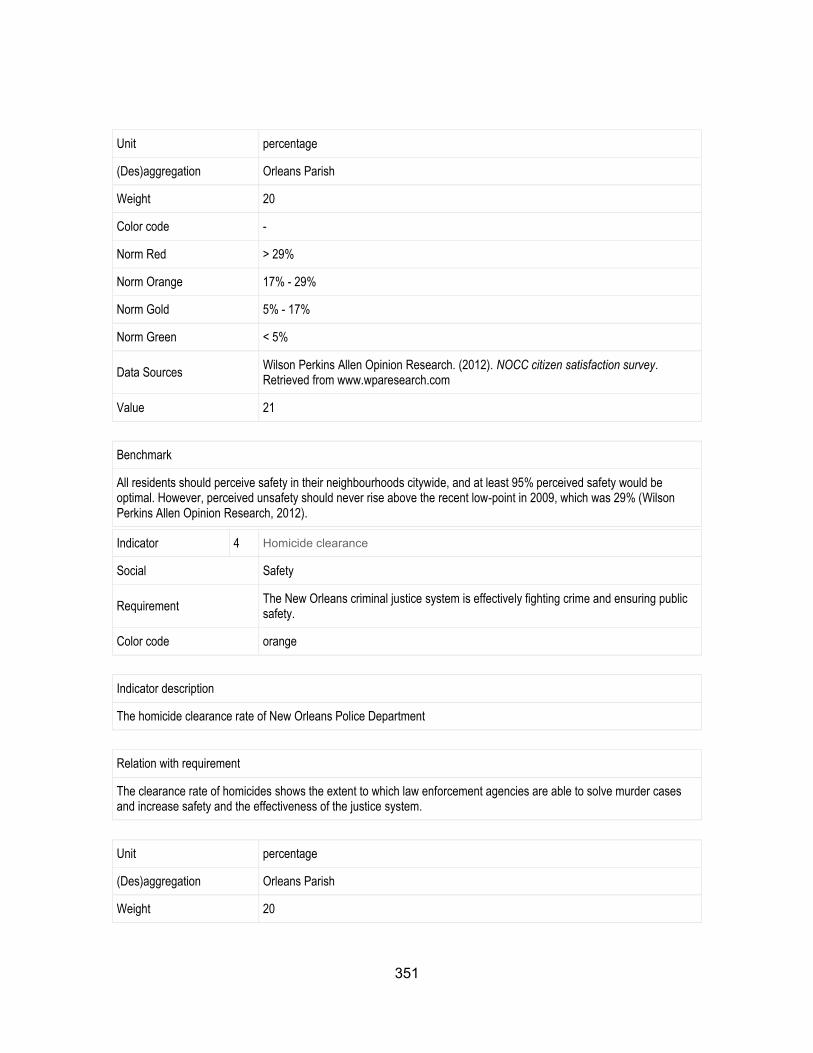
351
Unit percentage
(Des)aggregation Orleans Parish
Weight 20
Color code -
Norm Red > 29%
Norm Orange 17% - 29%
Norm Gold 5% - 17%
Norm Green < 5%
Data Sources Wilson Perkins Allen Opinion Research. (2012). NOCC citizen satisfaction survey. Retrieved from www.wparesearch.com
Value 21
Benchmark
All residents should perceive safety in their neighbourhoods citywide, and at least 95% perceived safety would be optimal. However, perceived unsafety should never rise above the recent low-point in 2009, which was 29% (Wilson Perkins Allen Opinion Research, 2012).
Indicator 4 Homicide clearance
Social Safety
Requirement The New Orleans criminal justice system is effectively fighting crime and ensuring public safety.
Color code orange
Indicator description
The homicide clearance rate of New Orleans Police Department
Relation with requirement
The clearance rate of homicides shows the extent to which law enforcement agencies are able to solve murder cases and increase safety and the effectiveness of the justice system.
Unit percentage
(Des)aggregation Orleans Parish
Weight 20
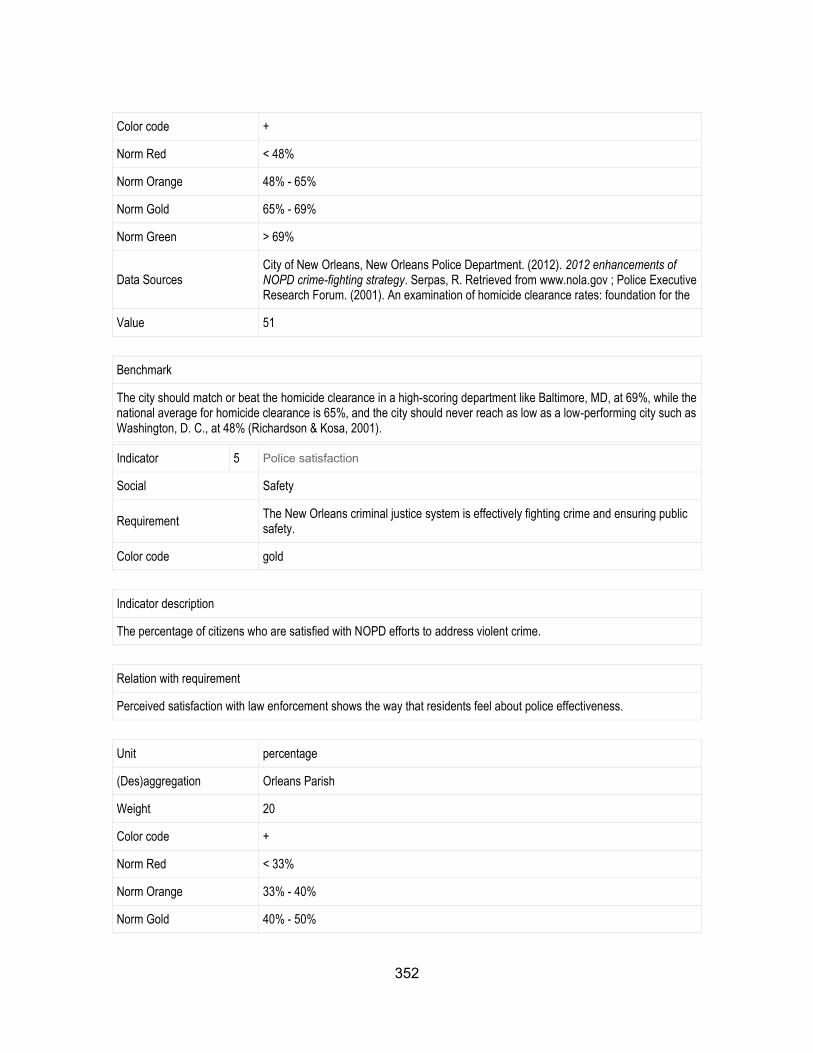
352
Color code +
Norm Red < 48%
Norm Orange 48% - 65%
Norm Gold 65% - 69%
Norm Green > 69%
Data Sources City of New Orleans, New Orleans Police Department. (2012). 2012 enhancements of NOPD crime-fighting strategy. Serpas, R. Retrieved from www.nola.gov ; Police Executive Research Forum. (2001). An examination of homicide clearance rates: foundation for the
Value 51
Benchmark
The city should match or beat the homicide clearance in a high-scoring department like Baltimore, MD, at 69%, while the national average for homicide clearance is 65%, and the city should never reach as low as a low-performing city such as Washington, D. C., at 48% (Richardson & Kosa, 2001).
Indicator 5 Police satisfaction
Social Safety
Requirement The New Orleans criminal justice system is effectively fighting crime and ensuring public safety.
Color code gold
Indicator description
The percentage of citizens who are satisfied with NOPD efforts to address violent crime.
Relation with requirement
Perceived satisfaction with law enforcement shows the way that residents feel about police effectiveness.
Unit percentage
(Des)aggregation Orleans Parish
Weight 20
Color code +
Norm Red < 33%
Norm Orange 33% - 40%
Norm Gold 40% - 50%
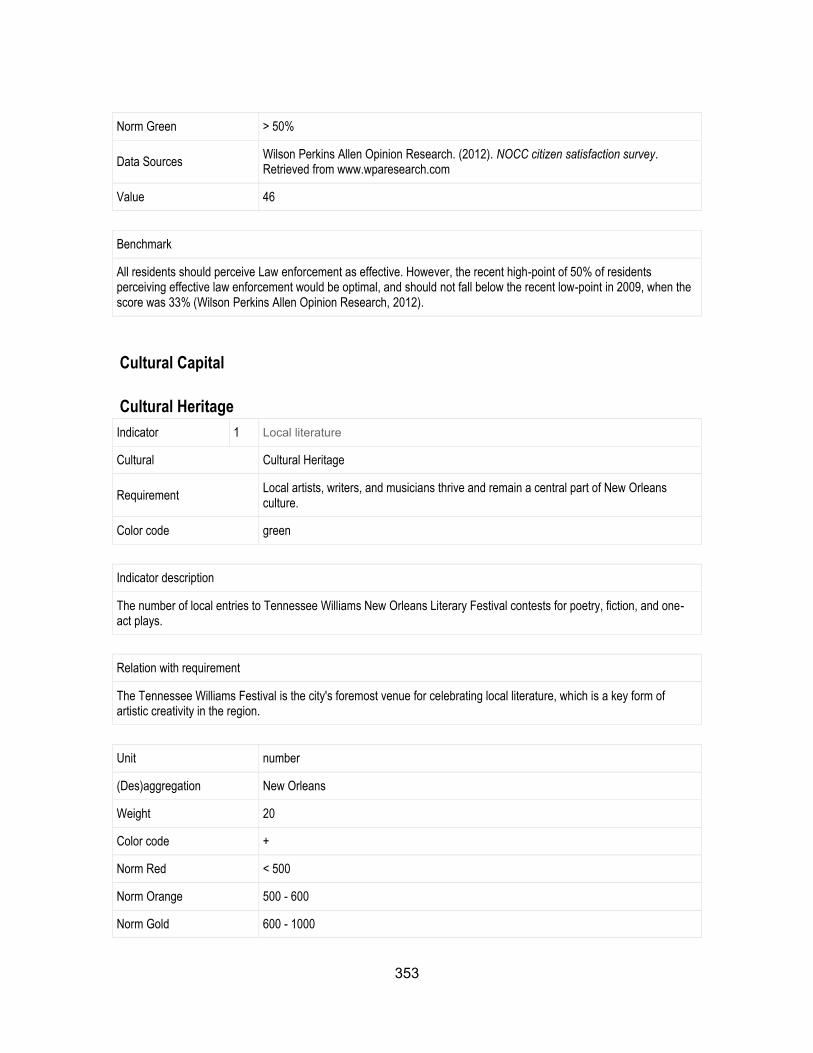
353
Norm Green > 50%
Data Sources Wilson Perkins Allen Opinion Research. (2012). NOCC citizen satisfaction survey. Retrieved from www.wparesearch.com
Value 46
Benchmark
All residents should perceive Law enforcement as effective. However, the recent high-point of 50% of residents perceiving effective law enforcement would be optimal, and should not fall below the recent low-point in 2009, when the score was 33% (Wilson Perkins Allen Opinion Research, 2012).
Cultural Capital
Cultural Heritage
Indicator 1 Local literature
Cultural Cultural Heritage
Requirement Local artists, writers, and musicians thrive and remain a central part of New Orleans culture.
Color code green
Indicator description
The number of local entries to Tennessee Williams New Orleans Literary Festival contests for poetry, fiction, and one-act plays.
Relation with requirement
The Tennessee Williams Festival is the city's foremost venue for celebrating local literature, which is a key form of artistic creativity in the region.
Unit number
(Des)aggregation New Orleans
Weight 20
Color code +
Norm Red < 500
Norm Orange 500 - 600
Norm Gold 600 - 1000
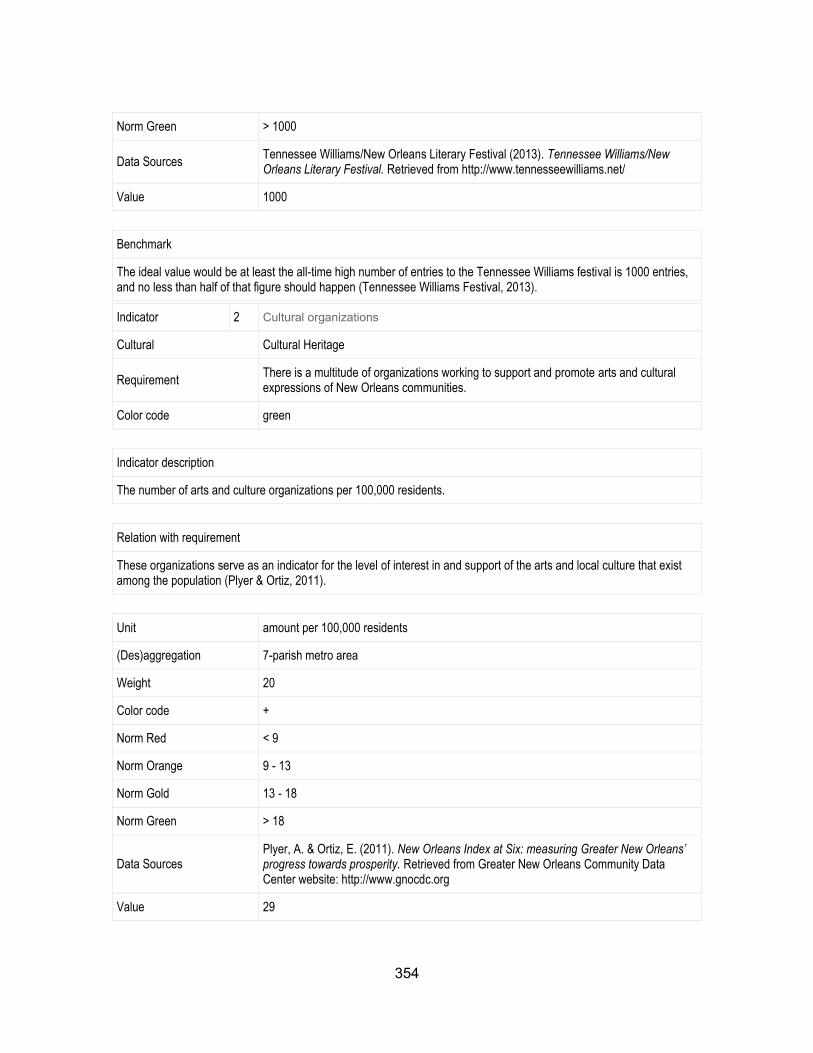
354
Norm Green > 1000
Data Sources Tennessee Williams/New Orleans Literary Festival (2013). Tennessee Williams/New Orleans Literary Festival. Retrieved from http://www.tennesseewilliams.net/
Value 1000
Benchmark
The ideal value would be at least the all-time high number of entries to the Tennessee Williams festival is 1000 entries, and no less than half of that figure should happen (Tennessee Williams Festival, 2013).
Indicator 2 Cultural organizations
Cultural Cultural Heritage
Requirement There is a multitude of organizations working to support and promote arts and cultural expressions of New Orleans communities.
Color code green
Indicator description
The number of arts and culture organizations per 100,000 residents.
Relation with requirement
These organizations serve as an indicator for the level of interest in and support of the arts and local culture that exist among the population (Plyer & Ortiz, 2011).
Unit amount per 100,000 residents
(Des)aggregation 7-parish metro area
Weight 20
Color code +
Norm Red < 9
Norm Orange 9 - 13
Norm Gold 13 - 18
Norm Green > 18
Data Sources Plyer, A. & Ortiz, E. (2011). New Orleans Index at Six: measuring Greater New Orleans’ progress towards prosperity. Retrieved from Greater New Orleans Community Data Center website: http://www.gnocdc.org
Value 29
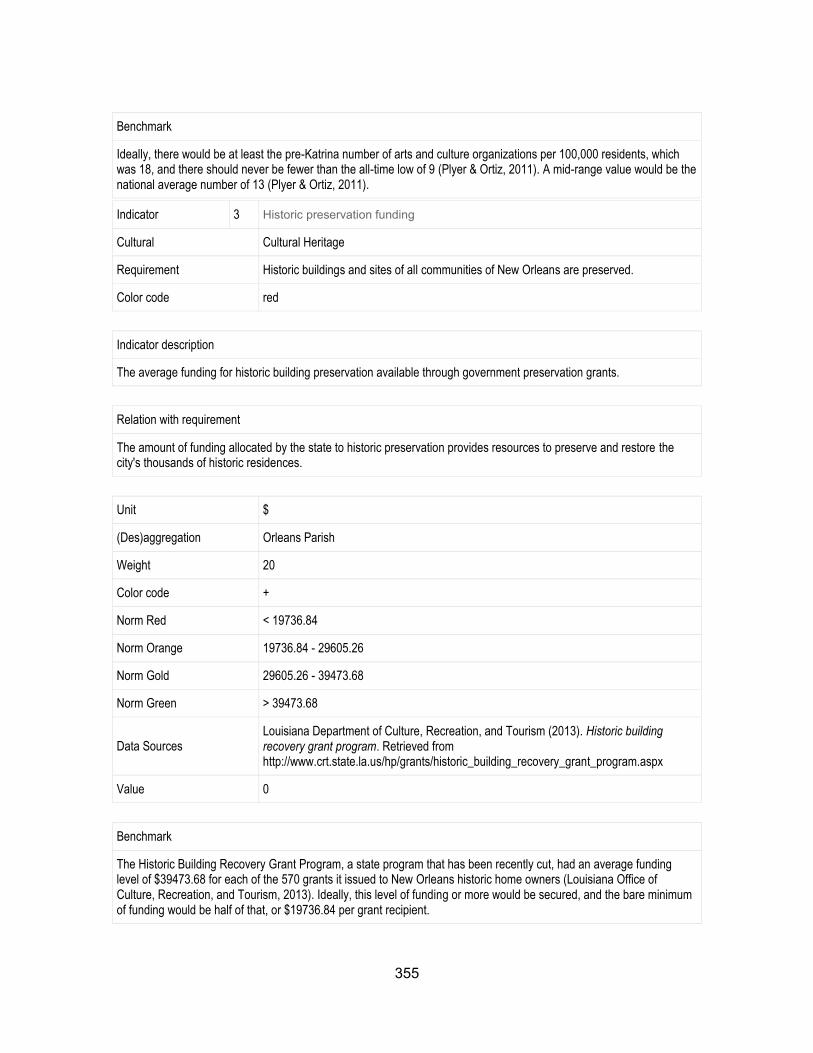
355
Benchmark
Ideally, there would be at least the pre-Katrina number of arts and culture organizations per 100,000 residents, which was 18, and there should never be fewer than the all-time low of 9 (Plyer & Ortiz, 2011). A mid-range value would be the national average number of 13 (Plyer & Ortiz, 2011).
Indicator 3 Historic preservation funding
Cultural Cultural Heritage
Requirement Historic buildings and sites of all communities of New Orleans are preserved.
Color code red
Indicator description
The average funding for historic building preservation available through government preservation grants.
Relation with requirement
The amount of funding allocated by the state to historic preservation provides resources to preserve and restore the city's thousands of historic residences.
Unit $
(Des)aggregation Orleans Parish
Weight 20
Color code +
Norm Red < 19736.84
Norm Orange 19736.84 - 29605.26
Norm Gold 29605.26 - 39473.68
Norm Green > 39473.68
Data Sources Louisiana Department of Culture, Recreation, and Tourism (2013). Historic building recovery grant program. Retrieved from http://www.crt.state.la.us/hp/grants/historic_building_recovery_grant_program.aspx
Value 0
Benchmark
The Historic Building Recovery Grant Program, a state program that has been recently cut, had an average funding level of $39473.68 for each of the 570 grants it issued to New Orleans historic home owners (Louisiana Office of Culture, Recreation, and Tourism, 2013). Ideally, this level of funding or more would be secured, and the bare minimum of funding would be half of that, or $19736.84 per grant recipient.
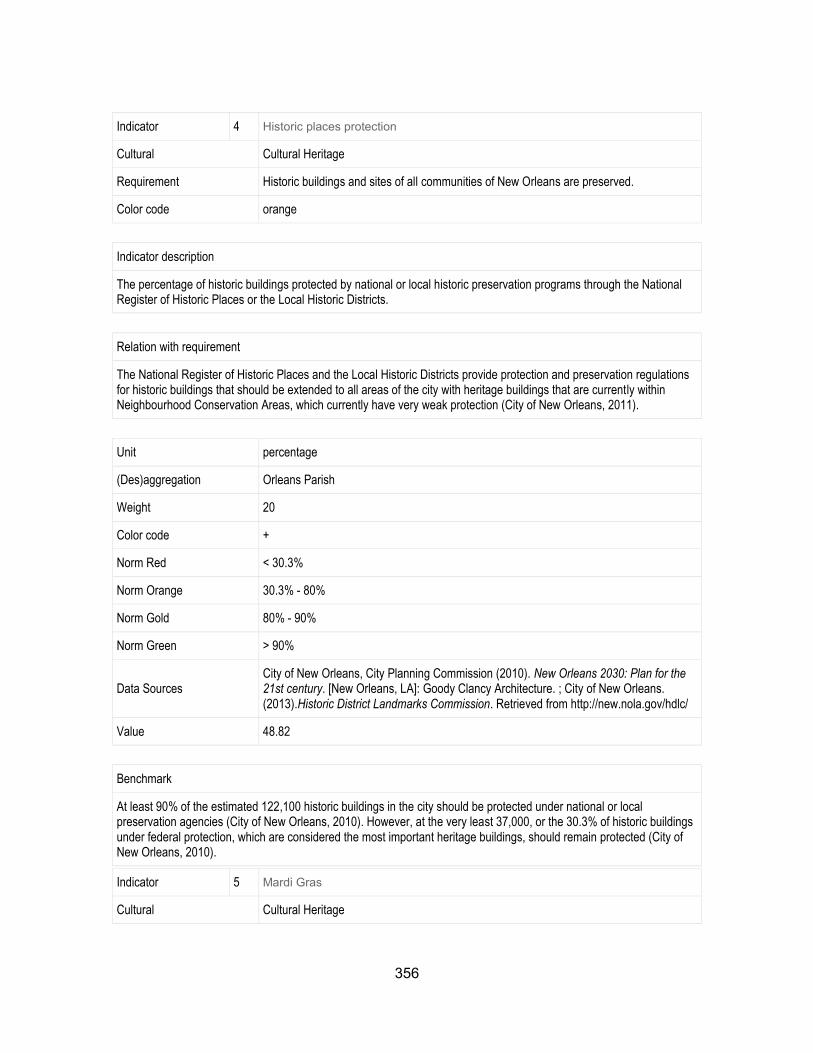
356
Indicator 4 Historic places protection
Cultural Cultural Heritage
Requirement Historic buildings and sites of all communities of New Orleans are preserved.
Color code orange
Indicator description
The percentage of historic buildings protected by national or local historic preservation programs through the National Register of Historic Places or the Local Historic Districts.
Relation with requirement
The National Register of Historic Places and the Local Historic Districts provide protection and preservation regulations for historic buildings that should be extended to all areas of the city with heritage buildings that are currently within Neighbourhood Conservation Areas, which currently have very weak protection (City of New Orleans, 2011).
Unit percentage
(Des)aggregation Orleans Parish
Weight 20
Color code +
Norm Red < 30.3%
Norm Orange 30.3% - 80%
Norm Gold 80% - 90%
Norm Green > 90%
Data Sources City of New Orleans, City Planning Commission (2010). New Orleans 2030: Plan for the 21st century. [New Orleans, LA]: Goody Clancy Architecture. ; City of New Orleans. (2013).Historic District Landmarks Commission. Retrieved from http://new.nola.gov/hdlc/
Value 48.82
Benchmark
At least 90% of the estimated 122,100 historic buildings in the city should be protected under national or local preservation agencies (City of New Orleans, 2010). However, at the very least 37,000, or the 30.3% of historic buildings under federal protection, which are considered the most important heritage buildings, should remain protected (City of New Orleans, 2010).
Indicator 5 Mardi Gras
Cultural Cultural Heritage
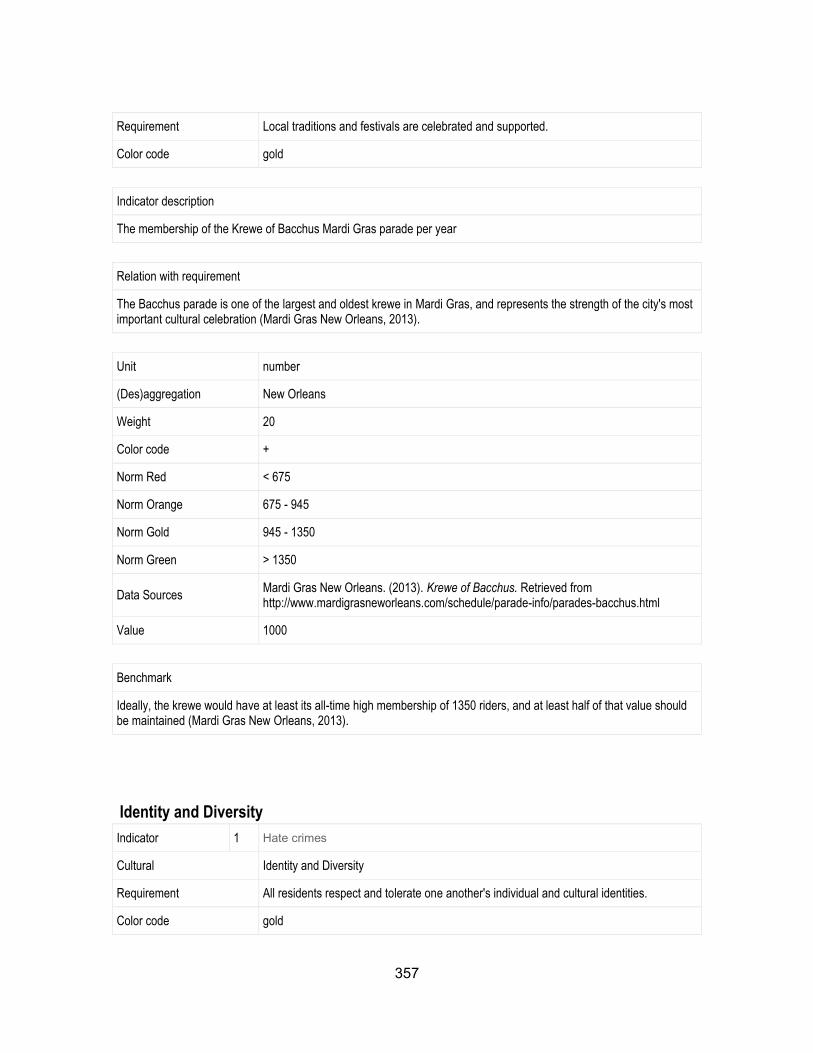
357
Requirement Local traditions and festivals are celebrated and supported.
Color code gold
Indicator description
The membership of the Krewe of Bacchus Mardi Gras parade per year
Relation with requirement
The Bacchus parade is one of the largest and oldest krewe in Mardi Gras, and represents the strength of the city's most important cultural celebration (Mardi Gras New Orleans, 2013).
Unit number
(Des)aggregation New Orleans
Weight 20
Color code +
Norm Red < 675
Norm Orange 675 - 945
Norm Gold 945 - 1350
Norm Green > 1350
Data Sources Mardi Gras New Orleans. (2013). Krewe of Bacchus. Retrieved from http://www.mardigrasneworleans.com/schedule/parade-info/parades-bacchus.html
Value 1000
Benchmark
Ideally, the krewe would have at least its all-time high membership of 1350 riders, and at least half of that value should be maintained (Mardi Gras New Orleans, 2013).
Identity and Diversity
Indicator 1 Hate crimes
Cultural Identity and Diversity
Requirement All residents respect and tolerate one another's individual and cultural identities.
Color code gold
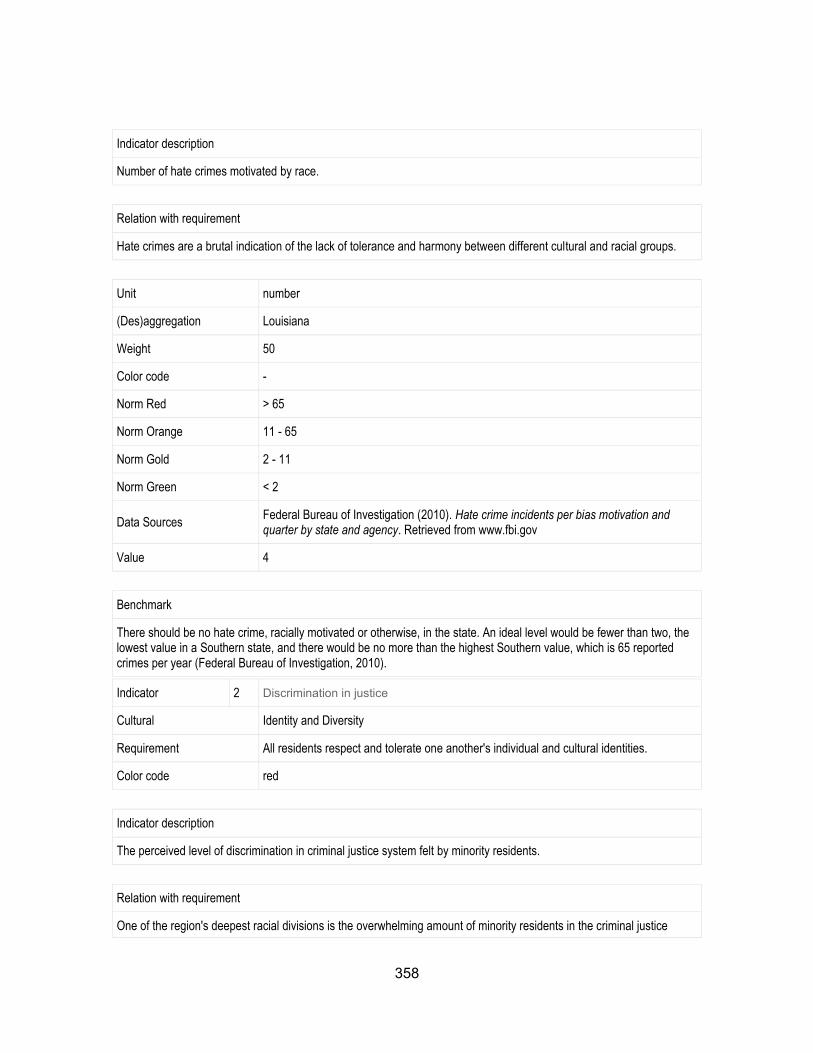
358
Indicator description
Number of hate crimes motivated by race.
Relation with requirement
Hate crimes are a brutal indication of the lack of tolerance and harmony between different cultural and racial groups.
Unit number
(Des)aggregation Louisiana
Weight 50
Color code -
Norm Red > 65
Norm Orange 11 - 65
Norm Gold 2 - 11
Norm Green < 2
Data Sources Federal Bureau of Investigation (2010). Hate crime incidents per bias motivation and quarter by state and agency. Retrieved from www.fbi.gov
Value 4
Benchmark
There should be no hate crime, racially motivated or otherwise, in the state. An ideal level would be fewer than two, the lowest value in a Southern state, and there would be no more than the highest Southern value, which is 65 reported crimes per year (Federal Bureau of Investigation, 2010).
Indicator 2 Discrimination in justice
Cultural Identity and Diversity
Requirement All residents respect and tolerate one another's individual and cultural identities.
Color code red
Indicator description
The perceived level of discrimination in criminal justice system felt by minority residents.
Relation with requirement
One of the region's deepest racial divisions is the overwhelming amount of minority residents in the criminal justice
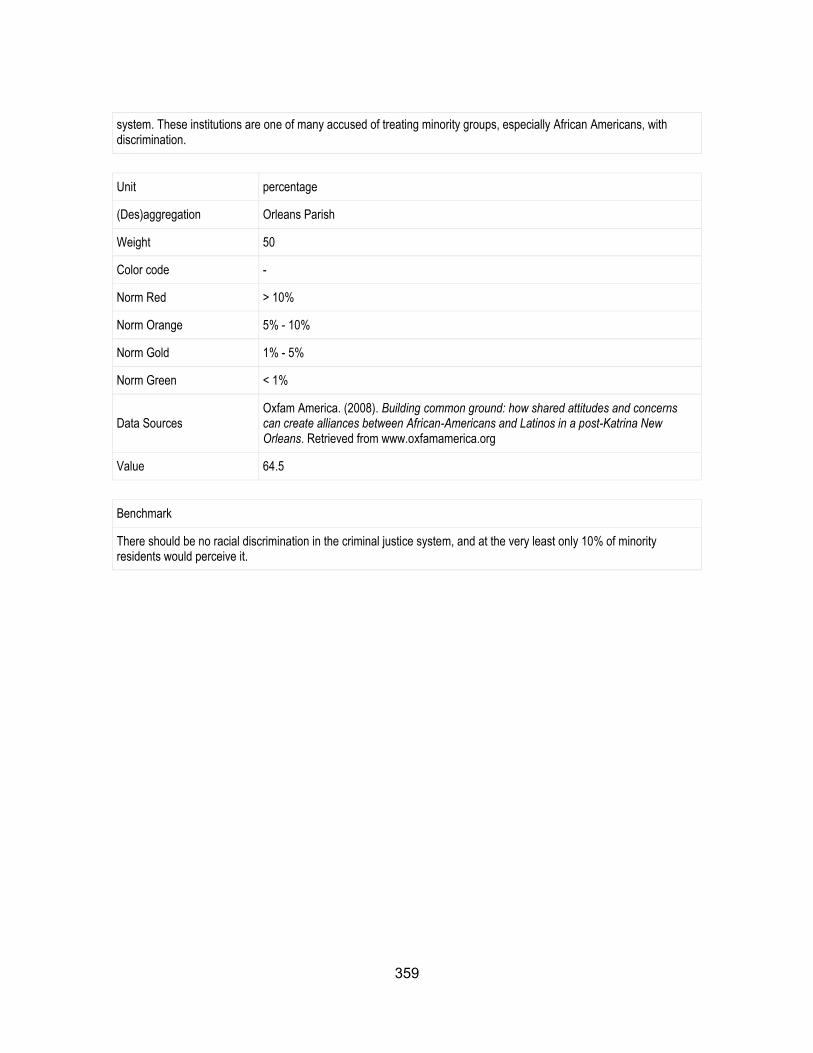
359
system. These institutions are one of many accused of treating minority groups, especially African Americans, with discrimination.
Unit percentage
(Des)aggregation Orleans Parish
Weight 50
Color code -
Norm Red > 10%
Norm Orange 5% - 10%
Norm Gold 1% - 5%
Norm Green < 1%
Data Sources Oxfam America. (2008). Building common ground: how shared attitudes and concerns can create alliances between African-Americans and Latinos in a post-Katrina New Orleans. Retrieved from www.oxfamamerica.org
Value 64.5
Benchmark
There should be no racial discrimination in the criminal justice system, and at the very least only 10% of minority residents would perceive it.
Top Related