
![TABLE OF CONTENTS€¦ · [ii] Target Company and Industry Profile . . . . . . . . . 1-18 [b] Organizational Records . . . . . . . . . 1-18 [i] Charter Documents . . . . . . . . 1-18](https://static.fdocuments.us/doc/165x107/5f41b9192d13750b786f031f/table-of-contents-ii-target-company-and-industry-profile-1-18.jpg)


Languages
Pages
Legal

budget.qld.gov.au
Service Delivery StatementsDepartment of Employment, Small Business and Training
© Crown copyright All rights reservedQueensland Government 2018
Excerpts from this publication may be reproduced, with appropriate acknowledgement, as permitted under the Copyright Act.
Service Delivery StatementsISSN 1445-4890 (Print)ISSN 1445-4904 (Online)
2018–19 Queensland Budget Papers1. Budget Speech
2. Budget Strategy and Outlook
3. Capital Statement
4. Budget Measures
5. Service Delivery Statements
Appropriation Bills
Budget Highlights
The Budget Papers are available online at budget.qld.gov.au
Department of Employment, Small Business and Training
Summary of portfolio
Page Department of Employment, Small Business and Training
2 Department of Employment, Small Business and Training - controlled
Department of Employment, Small Business and Training - administered
28 TAFE Queensland
Portfolio overview
Ministerial and portfolio responsibilities
The table below represents the agencies and services which are the responsibility of the Minister for Employment and Small Business and Minister for Training and Skills Development:
Minister for Employment and Small Business and Minister for Training and Skills Development
The Honourable Shannon Fentiman MP
Department of Employment, Small Business and Training
Director-General: Mary-Anne Curtis
Service area 1: Employment
Service area 2: Small Business Services
Service area 3: Training and Skills
The Minister for Employment and Small Business and Minister for Training and Skills Development is also responsible for:
TAFE Queensland
Interim CEO: Mary Campbell
Objective: To be an efficient, effective, sustainable and responsive organisation that develops skills and employment opportunities for individuals to meet employer, industry and community demands.
Additional information about these agencies can be sourced from:
www.desbt.qld.gov.au
www.tafeqld.edu.au
2018-19 - Queensland State Budget - Service Delivery Statements -Department of Employment, Small Business and Training
1
Departmental overview The Department of Employment, Small Business and Training's (DESBT) vision is for all Queenslanders to have the skills and opportunities to participate and prosper in the economy. The department's purpose is to increase economic participation by providing the trusted advice and support that enables both sustainable small business opportunities and a skilled workforce now and into the future.
DESBT's services and initiatives play a key role in the Queensland Government's plan to create jobs in a strong economy and be a responsive Government by supporting businesses to reach their full potential and by providing individuals with training and employment opportunities aligned with Queensland's employment, skilling and economic priorities.
DESBT's strategic objectives are:
empower Queenslanders and small businesses to be able to take full advantage of economic prospects
ensure Queenslanders and small businesses have access to the skills, training and employment enablers thatsustain, connect and cultivate economic participation
provide sector leadership in recognising and considering optimal regulatory levers, market and policy settings forsmall business, employment and training and skilling Queenslanders
an agile organisation that delivers increased value to our customers.
DESBT's key priorities for 2018-19 include:
Employment
Delivering employment policies and programs to support Queenslanders, in particular disadvantaged cohorts to gainemployment, including:
- continuing to deliver the Back to Work initiative designed to give Queensland employers the confidence to hire eligible unemployed jobseekers
- continuing to support employment opportunities for mature-aged jobseekers, including through the appointment of an Ambassador for mature aged workers
- continuing to deliver the $5 million North Stradbroke Island Workers Assistance Scheme
- continuing to deliver the $900,000 Sticking Together Pilot, an innovative coaching and mentoring approach aimed at supporting young people to find and retain employment.
Small Business
Building Queensland's small businesses through the $22.7 million Advancing Small Business Queensland Strategy2016-20 by providing advocacy to champion the interests of small businesses, making it easier to do business through simplified and coordinated service delivery, and improving access to small business services.
Continuing to enhance online service delivery through Business Queensland online by working with QueenslandGovernment agencies and the Australian Government to improve the quality and accessibility of information, services for and obligations on businesses.
Establishing small business consultations panels to provide Government departments with easier access toexperienced small business owners and operators to inform policy and legislation.
Training and Skills
Investing $777.9 million to support Queenslanders in undertaking training and skills development that leads toincreased job opportunities and continuing to support public training providers to deliver quality training services.
Delivering a vocational education and training strategy for Queensland that empowers a skilled workforce needed toattract investment and encourage job creation.
Continuing to support Queenslanders into work through the Skilling Queenslanders for Work initiative
Ensuring individuals, employers and others continue to have access to confidential, free advice through theQueensland Training Ombudsman.
Reinvigorating Queensland's training assets including investing up to $85 million over three years to deliver theAdvancing Our Training Infrastructure initiative across several training sites as part of the long-term plan to revitalisethe state's training portfolio.
Setting standards for high quality training delivery through the Queensland Vocational Education and Training QualityFramework.
Collaborating with Jobs Queensland, an independent statutory entity providing strategic industry advice toGovernment on skills demand and workforce planning.
Overseeing pre-qualified supplier requirements to provide consumer confidence in choosing a training provider.
2018-19 - Queensland State Budget - Service Delivery Statements -Department of Employment, Small Business and Training
2
Service performance The service area structure presented reflects the machinery-of-government changes, effective 12 December 2017, under which the Department of Employment, Small Business and Training (DESBT) was created.
As part of the machinery-of government changes, the following functions were transferred to DESBT:
the Employment function within the Economic and Fiscal Coordination service area was transferred from QueenslandTreasury
Small Business Services was transferred from the former Department of Tourism, Major Events, Small Business andthe Commonwealth Games
Training and Skills was transferred from the former Department of Education and Training.
Employment
Service area objective
To increase Queenslanders' participation in the labour market.
Service area description
This service area focuses on increasing employment opportunities for Queenslanders, in particular, disadvantaged cohorts. This area undertakes both policy and strategic engagement activities, as well as the delivery of key Government employment programs. The service area also has responsibility for business and skilled migration policy, in consultation with Business and Skilled Migration Queensland.
2018-19 service area highlights
Service area highlights for 2018-19 include:
providing funding of $20.5 million from 2018-19 over three years to continue Back to Work in areas of South EastQueensland with significant labour market challenges
increased funding of $155 million over four years from 2017-18 to extend the Back to Work regional program tocontinue to provide employer support payments to employers hiring eligible unemployed jobseekers
continuing to support workers to upskill and reskill and transition to new employment opportunities due to cessationof sand mining on North Stradbroke Island through the North Stradbroke Island Workers Assistance Scheme
continuing to deliver the Sticking Together Pilot to mentor and support 90 young disadvantaged jobseekers andrecently-employed young people in Cairns, Townsville and Logan
continuing to support employment opportunities for mature-aged jobseekers, including through the appointment of anAmbassador for mature aged workers
continuing to provide policy oversight to Queensland nominated business and/or skilled migration visas in partnershipwith Business and Skilled Migration Queensland.
Department of Employment, Small Business and Training
Notes 2017-18
Target/Est.
2017-18
Est. Actual
2018-19
Target/Est.
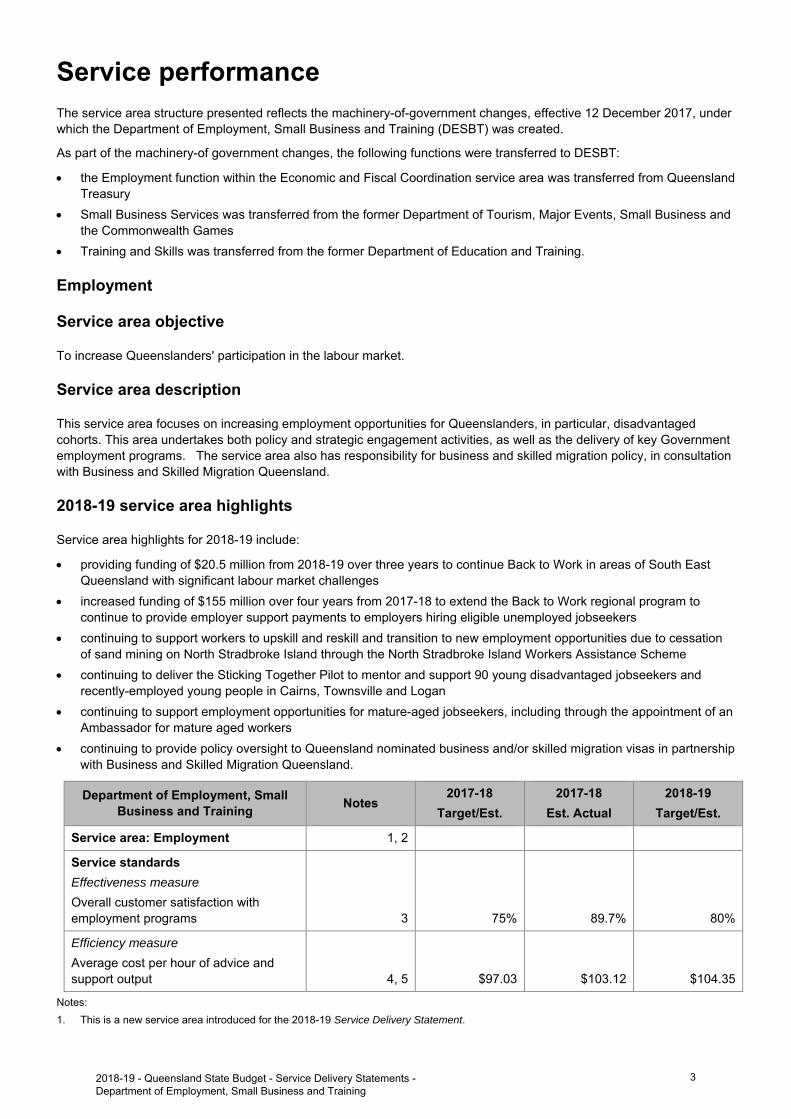
Service area: Employment 1, 2
Service standards
Effectiveness measure
Overall customer satisfaction with employment programs 3 75% 89.7% 80%
Efficiency measure
Average cost per hour of advice and support output 4, 5 $97.03 $103.12 $104.35
Notes:
1. This is a new service area introduced for the 2018-19 Service Delivery Statement.
2018-19 - Queensland State Budget - Service Delivery Statements -Department of Employment, Small Business and Training
3
2. This service standard was previously presented under the 'Economic and Fiscal Coordination' service area of Queensland Treasury in the2017-18 Service Delivery Statement and was transferred to DESBT following machinery-of-government changes in December 2017.
3. This service standard measures overall client satisfaction with employment programs considering quality, timeliness, staff knowledge,access and outcome. It is derived from a survey of employers who have accessed the Back to Work program.
4. This service standard measures the efficiency of providing employment services with the goal of ensuring that, over time, changes in thecost per hour to serve clients does not exceed the Queensland Government wages policy. The measure has been calculated using theannual Employment Policy budget, including a corporate services allocation divided by annual FTE work hours.
5. The increase between the 2017-18 Target/Estimate and the 2017-18 Estimated Actual is due to higher corporate services allocations.
2018-19 - Queensland State Budget - Service Delivery Statements -Department of Employment, Small Business and Training
4
Small Business Services
Service area objective
To ensure small businesses can seamlessly interact with Government and are better supported to manage and grow
their business.
Service area description
This service area focuses on products and services that are delivered to small business to better enable them to grow and make it easier to interact with Government, including:
enhancing the capacity of business to engage with markets, attract investors, navigate the business/regulatoryenvironment and access tools, resources and expertise to grow and succeed
engaging other business-focused government agencies to facilitate the delivery of online services for small businessvia Business Queensland online at www.business.qld.gov.au
proactively employing strategies to streamline regulation to make it easier to do business.
2018-19 service area highlights
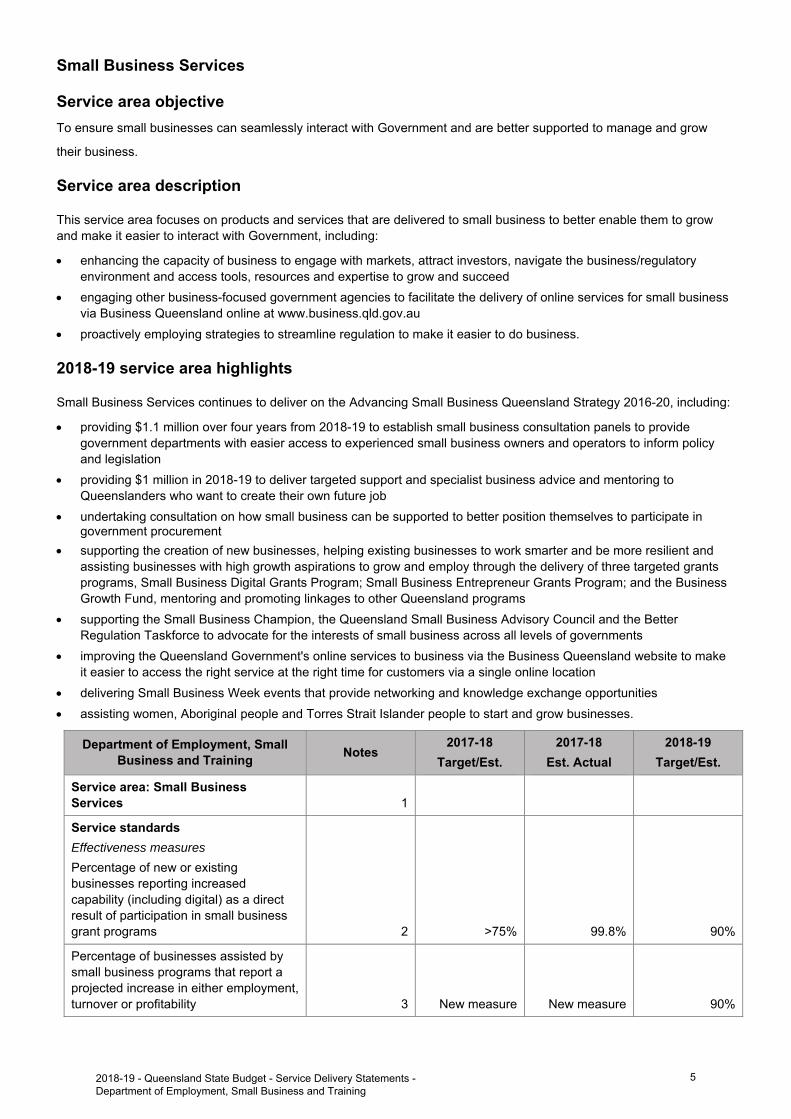
Small Business Services continues to deliver on the Advancing Small Business Queensland Strategy 2016-20, including:
providing $1.1 million over four years from 2018-19 to establish small business consultation panels to providegovernment departments with easier access to experienced small business owners and operators to inform policyand legislation
providing $1 million in 2018-19 to deliver targeted support and specialist business advice and mentoring toQueenslanders who want to create their own future job
undertaking consultation on how small business can be supported to better position themselves to participate ingovernment procurement
supporting the creation of new businesses, helping existing businesses to work smarter and be more resilient andassisting businesses with high growth aspirations to grow and employ through the delivery of three targeted grantsprograms, Small Business Digital Grants Program; Small Business Entrepreneur Grants Program; and the BusinessGrowth Fund, mentoring and promoting linkages to other Queensland programs
supporting the Small Business Champion, the Queensland Small Business Advisory Council and the BetterRegulation Taskforce to advocate for the interests of small business across all levels of governments
improving the Queensland Government's online services to business via the Business Queensland website to makeit easier to access the right service at the right time for customers via a single online location
delivering Small Business Week events that provide networking and knowledge exchange opportunities
assisting women, Aboriginal people and Torres Strait Islander people to start and grow businesses.
Department of Employment, Small Business and Training
Notes 2017-18
Target/Est.
2017-18
Est. Actual
2018-19
Target/Est.
Service area: Small Business Services 1
Service standards
Effectiveness measures
Percentage of new or existing businesses reporting increased capability (including digital) as a direct result of participation in small business grant programs 2 >75% 99.8% 90%
Percentage of businesses assisted by small business programs that report a projected increase in either employment, turnover or profitability 3 New measure New measure 90%
2018-19 - Queensland State Budget - Service Delivery Statements -Department of Employment, Small Business and Training
5
Department of Employment, Small Business and Training
Notes 2017-18
Target/Est.
2017-18
Est. Actual
2018-19
Target/Est.
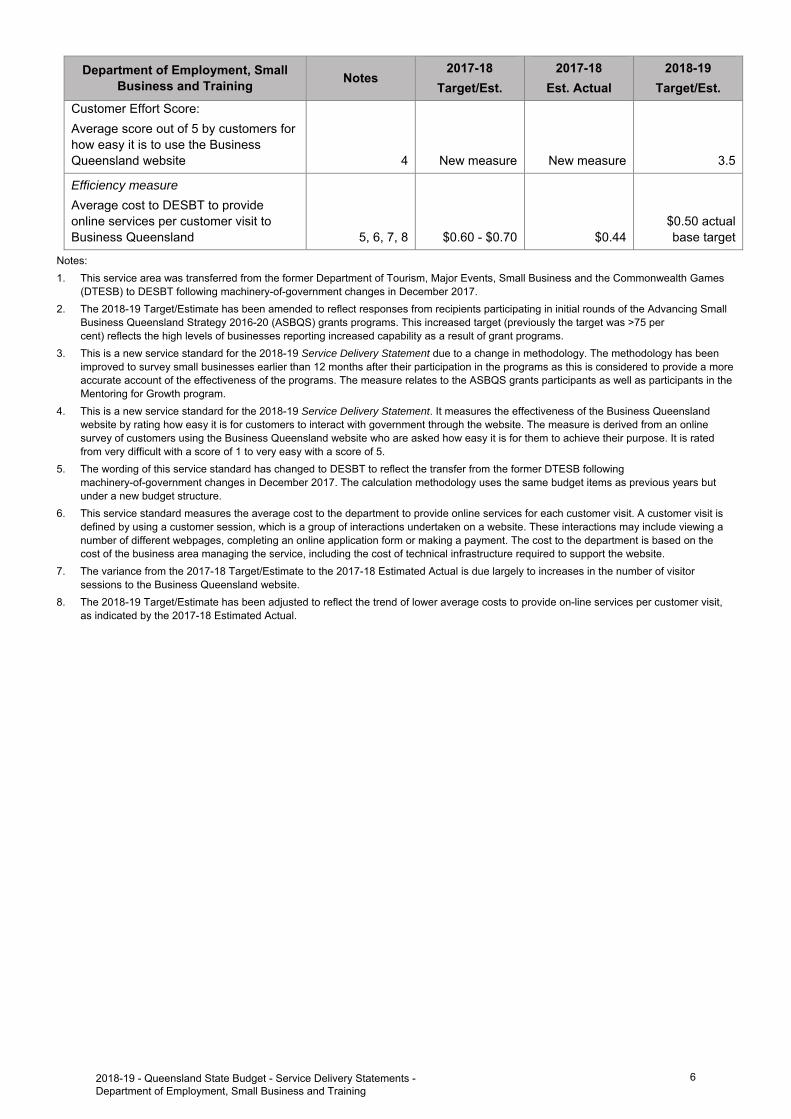
Customer Effort Score:
Average score out of 5 by customers for how easy it is to use the Business Queensland website 4 New measure New measure 3.5
Efficiency measure
Average cost to DESBT to provide online services per customer visit to Business Queensland 5, 6, 7, 8 $0.60 - $0.70 $0.44
$0.50 actual base target
Notes:
1. This service area was transferred from the former Department of Tourism, Major Events, Small Business and the Commonwealth Games(DTESB) to DESBT following machinery-of-government changes in December 2017.
2. The 2018-19 Target/Estimate has been amended to reflect responses from recipients participating in initial rounds of the Advancing SmallBusiness Queensland Strategy 2016-20 (ASBQS) grants programs. This increased target (previously the target was >75 per cent) reflects the high levels of businesses reporting increased capability as a result of grant programs.
3. This is a new service standard for the 2018-19 Service Delivery Statement due to a change in methodology. The methodology has beenimproved to survey small businesses earlier than 12 months after their participation in the programs as this is considered to provide a more accurate account of the effectiveness of the programs. The measure relates to the ASBQS grants participants as well as participants in the Mentoring for Growth program.
4. This is a new service standard for the 2018-19 Service Delivery Statement. It measures the effectiveness of the Business Queenslandwebsite by rating how easy it is for customers to interact with government through the website. The measure is derived from an online survey of customers using the Business Queensland website who are asked how easy it is for them to achieve their purpose. It is rated from very difficult with a score of 1 to very easy with a score of 5.
5. The wording of this service standard has changed to DESBT to reflect the transfer from the former DTESB followingmachinery-of-government changes in December 2017. The calculation methodology uses the same budget items as previous years but under a new budget structure.
6. This service standard measures the average cost to the department to provide online services for each customer visit. A customer visit isdefined by using a customer session, which is a group of interactions undertaken on a website. These interactions may include viewing a number of different webpages, completing an online application form or making a payment. The cost to the department is based on the cost of the business area managing the service, including the cost of technical infrastructure required to support the website.
7. The variance from the 2017-18 Target/Estimate to the 2017-18 Estimated Actual is due largely to increases in the number of visitorsessions to the Business Queensland website.
8. The 2018-19 Target/Estimate has been adjusted to reflect the trend of lower average costs to provide on-line services per customer visit,as indicated by the 2017-18 Estimated Actual.
2018-19 - Queensland State Budget - Service Delivery Statements -Department of Employment, Small Business and Training
6
Training and Skills
Service area objective
Queenslanders skilled to participate in the economy and the broader community.
Service area description
Improving the skills profile of Queensland through delivery of a diverse and inclusive vocational education and training investment program that delivers on industry skills demands of today and the future, and supports publicly funded training providers to deliver high quality training.
2018-19 service area highlights
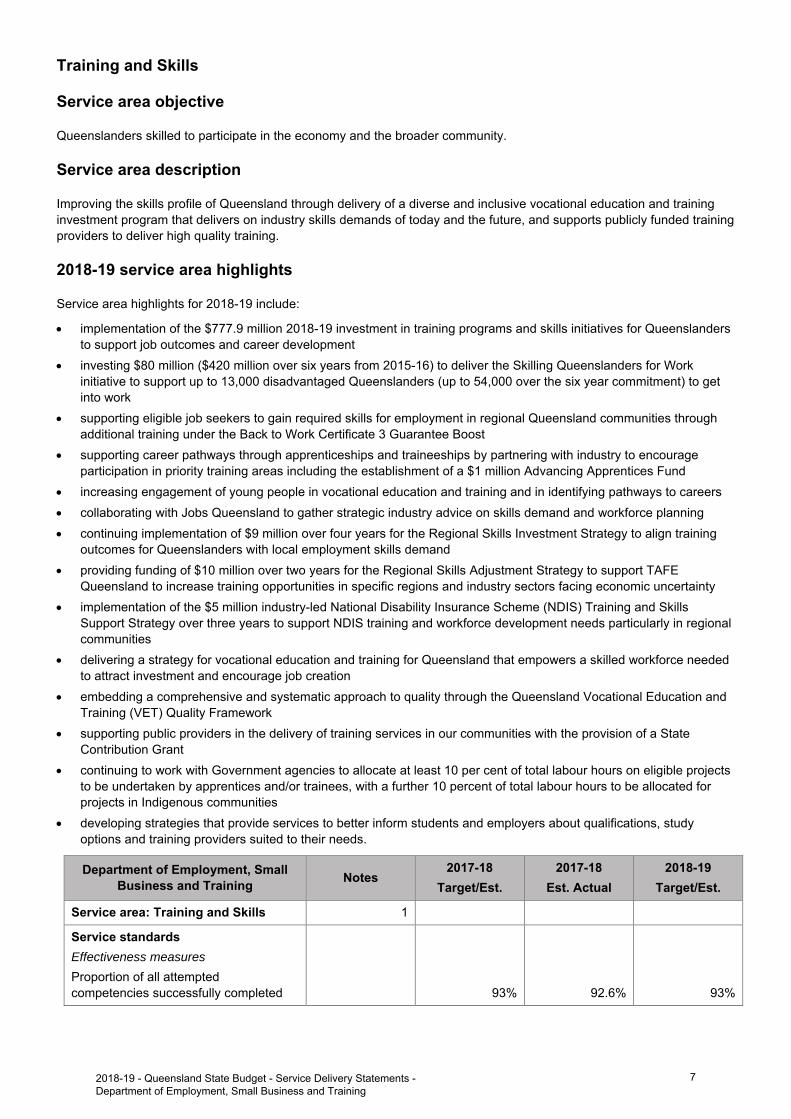
Service area highlights for 2018-19 include:
implementation of the $777.9 million 2018-19 investment in training programs and skills initiatives for Queenslandersto support job outcomes and career development
investing $80 million ($420 million over six years from 2015-16) to deliver the Skilling Queenslanders for Workinitiative to support up to 13,000 disadvantaged Queenslanders (up to 54,000 over the six year commitment) to getinto work
supporting eligible job seekers to gain required skills for employment in regional Queensland communities throughadditional training under the Back to Work Certificate 3 Guarantee Boost
supporting career pathways through apprenticeships and traineeships by partnering with industry to encourageparticipation in priority training areas including the establishment of a $1 million Advancing Apprentices Fund
increasing engagement of young people in vocational education and training and in identifying pathways to careers
collaborating with Jobs Queensland to gather strategic industry advice on skills demand and workforce planning
continuing implementation of $9 million over four years for the Regional Skills Investment Strategy to align trainingoutcomes for Queenslanders with local employment skills demand
providing funding of $10 million over two years for the Regional Skills Adjustment Strategy to support TAFEQueensland to increase training opportunities in specific regions and industry sectors facing economic uncertainty
implementation of the $5 million industry-led National Disability Insurance Scheme (NDIS) Training and SkillsSupport Strategy over three years to support NDIS training and workforce development needs particularly in regionalcommunities
delivering a strategy for vocational education and training for Queensland that empowers a skilled workforce neededto attract investment and encourage job creation
embedding a comprehensive and systematic approach to quality through the Queensland Vocational Education andTraining (VET) Quality Framework
supporting public providers in the delivery of training services in our communities with the provision of a StateContribution Grant
continuing to work with Government agencies to allocate at least 10 per cent of total labour hours on eligible projectsto be undertaken by apprentices and/or trainees, with a further 10 percent of total labour hours to be allocated forprojects in Indigenous communities
developing strategies that provide services to better inform students and employers about qualifications, studyoptions and training providers suited to their needs.
Department of Employment, Small Business and Training
Notes 2017-18
Target/Est.
2017-18
Est. Actual
2018-19
Target/Est.
Service area: Training and Skills 1
Service standards
Effectiveness measures
Proportion of all attempted competencies successfully completed 93% 92.6% 93%
2018-19 - Queensland State Budget - Service Delivery Statements -Department of Employment, Small Business and Training
7
Department of Employment, Small Business and Training
Notes 2017-18
Target/Est.
2017-18
Est. Actual
2018-19
Target/Est.
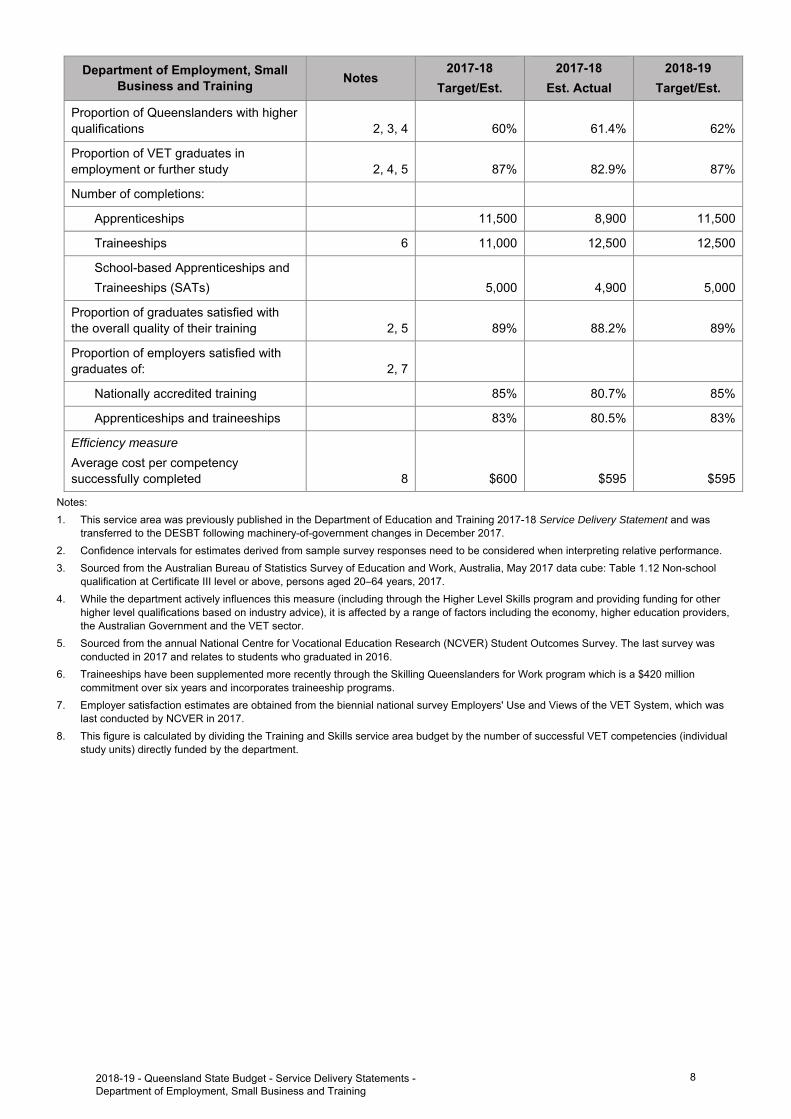
Proportion of Queenslanders with higher qualifications 2, 3, 4 60% 61.4% 62%
Proportion of VET graduates in employment or further study 2, 4, 5 87% 82.9% 87%
Number of completions:
Apprenticeships 11,500 8,900 11,500
Traineeships 6 11,000 12,500 12,500
School-based Apprenticeships and
Traineeships (SATs) 5,000 4,900 5,000
Proportion of graduates satisfied with the overall quality of their training 2, 5 89% 88.2% 89%
Proportion of employers satisfied with graduates of: 2, 7
Nationally accredited training 85% 80.7% 85%
Apprenticeships and traineeships 83% 80.5% 83%
Efficiency measure
Average cost per competency successfully completed 8 $600 $595 $595
Notes:
1. This service area was previously published in the Department of Education and Training 2017-18 Service Delivery Statement and wastransferred to the DESBT following machinery-of-government changes in December 2017.
2. Confidence intervals for estimates derived from sample survey responses need to be considered when interpreting relative performance.
3. Sourced from the Australian Bureau of Statistics Survey of Education and Work, Australia, May 2017 data cube: Table 1.12 Non-schoolqualification at Certificate III level or above, persons aged 20–64 years, 2017.
4. While the department actively influences this measure (including through the Higher Level Skills program and providing funding for otherhigher level qualifications based on industry advice), it is affected by a range of factors including the economy, higher education providers,the Australian Government and the VET sector.
5. Sourced from the annual National Centre for Vocational Education Research (NCVER) Student Outcomes Survey. The last survey wasconducted in 2017 and relates to students who graduated in 2016.
6. Traineeships have been supplemented more recently through the Skilling Queenslanders for Work program which is a $420 millioncommitment over six years and incorporates traineeship programs.
7. Employer satisfaction estimates are obtained from the biennial national survey Employers' Use and Views of the VET System, which waslast conducted by NCVER in 2017.
8. This figure is calculated by dividing the Training and Skills service area budget by the number of successful VET competencies (individualstudy units) directly funded by the department.
2018-19 - Queensland State Budget - Service Delivery Statements -Department of Employment, Small Business and Training
8
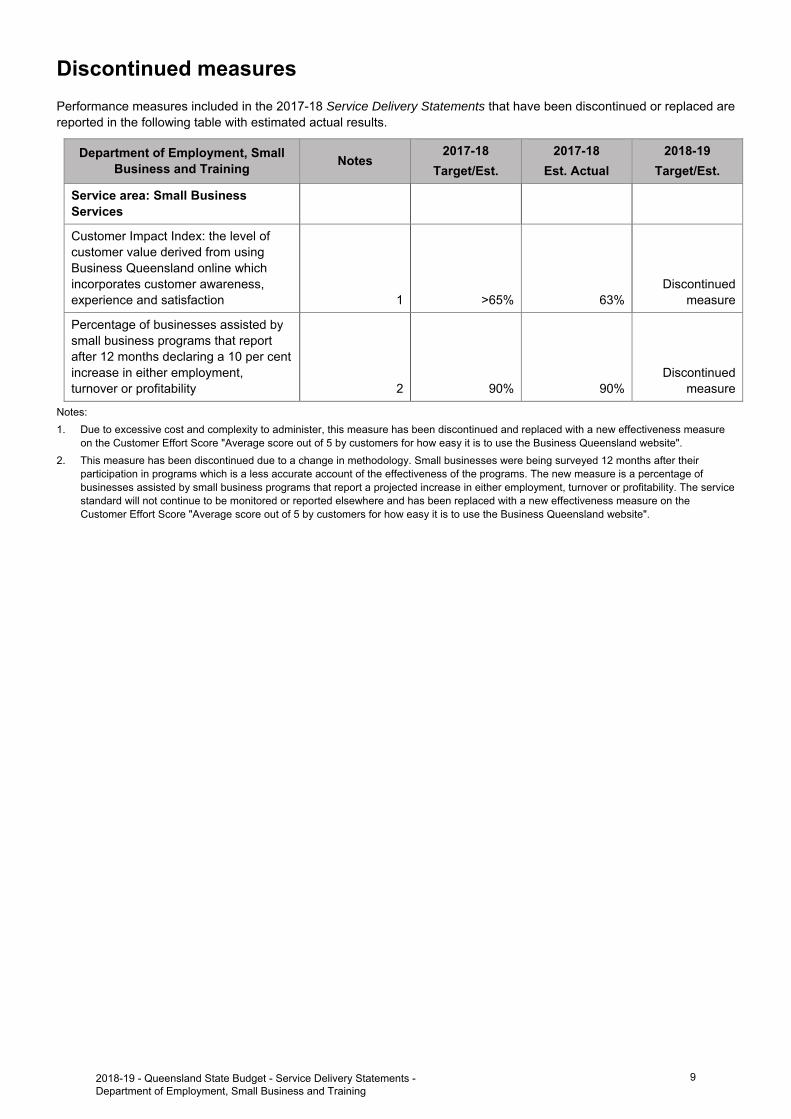
Discontinued measures
Performance measures included in the 2017-18 Service Delivery Statements that have been discontinued or replaced are reported in the following table with estimated actual results.
Department of Employment, Small Business and Training
Notes 2017-18
Target/Est.
2017-18
Est. Actual
2018-19
Target/Est.
Service area: Small Business Services
Customer Impact Index: the level of customer value derived from using Business Queensland online which incorporates customer awareness, experience and satisfaction 1 >65% 63%
Discontinued measure
Percentage of businesses assisted by small business programs that report after 12 months declaring a 10 per cent increase in either employment, turnover or profitability 2 90% 90%
Discontinued measure
Notes:
1. Due to excessive cost and complexity to administer, this measure has been discontinued and replaced with a new effectiveness measureon the Customer Effort Score "Average score out of 5 by customers for how easy it is to use the Business Queensland website".
2. This measure has been discontinued due to a change in methodology. Small businesses were being surveyed 12 months after theirparticipation in programs which is a less accurate account of the effectiveness of the programs. The new measure is a percentage of businesses assisted by small business programs that report a projected increase in either employment, turnover or profitability. The service standard will not continue to be monitored or reported elsewhere and has been replaced with a new effectiveness measure on the Customer Effort Score "Average score out of 5 by customers for how easy it is to use the Business Queensland website".
2018-19 - Queensland State Budget - Service Delivery Statements -Department of Employment, Small Business and Training
9
Administered items
Administered activities are those undertaken by departments on behalf of the Government.
The Department of Employment, Small Business and Training was transferred administered funds from Queensland Treasury for the delivery of the Back to Work program and North Stradbroke Island Workers Assistance Scheme as part of the machinery-of-government changes, effective 12 December 2017. These funds have subsequently been transferred to the department's controlled accounts.
Financial statements and variance explanations in relation to administered items appear in the departmental financial statements.
2018-19 - Queensland State Budget - Service Delivery Statements -Department of Employment, Small Business and Training
10
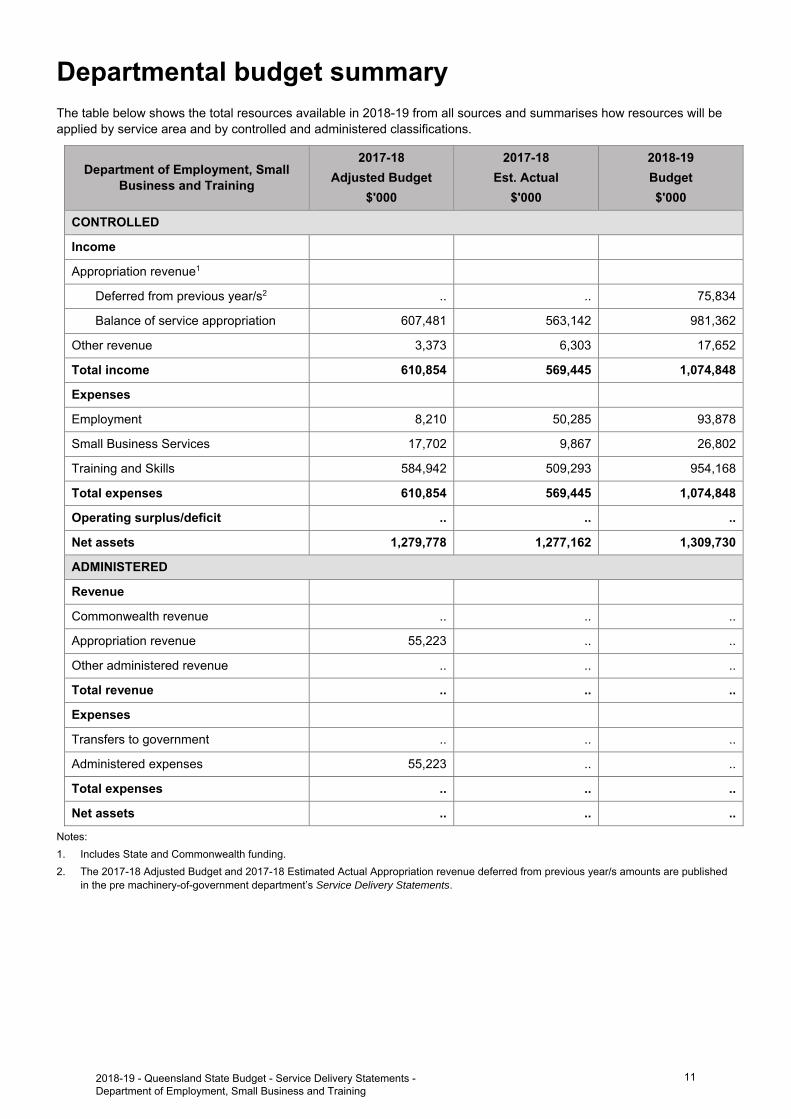
Departmental budget summary The table below shows the total resources available in 2018-19 from all sources and summarises how resources will be applied by service area and by controlled and administered classifications.
Department of Employment, Small Business and Training
2017-18
Adjusted Budget
$'000
2017-18
Est. Actual
$'000
2018-19
Budget
$'000
CONTROLLED
Income
Appropriation revenue1
Deferred from previous year/s2 .. .. 75,834
Balance of service appropriation 607,481 563,142 981,362
Other revenue 3,373 6,303 17,652
Total income 610,854 569,445 1,074,848
Expenses
Employment 8,210 50,285 93,878
Small Business Services 17,702 9,867 26,802
Training and Skills 584,942 509,293 954,168
Total expenses 610,854 569,445 1,074,848
Operating surplus/deficit .. .. ..
Net assets 1,279,778 1,277,162 1,309,730
ADMINISTERED
Revenue
Commonwealth revenue .. .. ..
Appropriation revenue 55,223 .. ..
Other administered revenue .. .. ..
Total revenue .. .. ..
Expenses
Transfers to government .. .. ..
Administered expenses 55,223 .. ..
Total expenses .. .. ..
Net assets .. .. ..
Notes:
1. Includes State and Commonwealth funding.
2. The 2017-18 Adjusted Budget and 2017-18 Estimated Actual Appropriation revenue deferred from previous year/s amounts are publishedin the pre machinery-of-government department’s Service Delivery Statements.
2018-19 - Queensland State Budget - Service Delivery Statements -Department of Employment, Small Business and Training
11
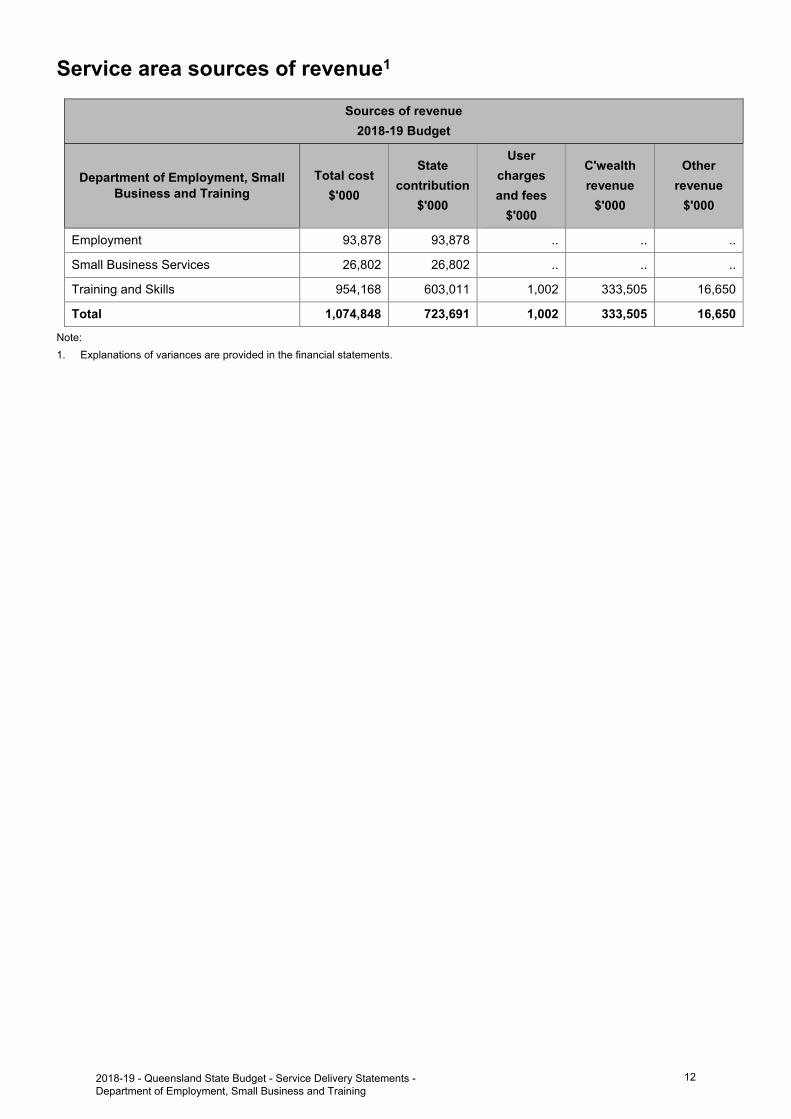
Service area sources of revenue1
Sources of revenue
2018-19 Budget
Department of Employment, Small Business and Training
Total cost
$'000
State
contribution
$'000
User
charges
and fees
$'000
C'wealth
revenue
$'000
Other
revenue
$'000
Employment 93,878 93,878 .. .. ..
Small Business Services 26,802 26,802 .. .. ..
Training and Skills 954,168 603,011 1,002 333,505 16,650
Total 1,074,848 723,691 1,002 333,505 16,650
Note:
1. Explanations of variances are provided in the financial statements.
2018-19 - Queensland State Budget - Service Delivery Statements -Department of Employment, Small Business and Training
12
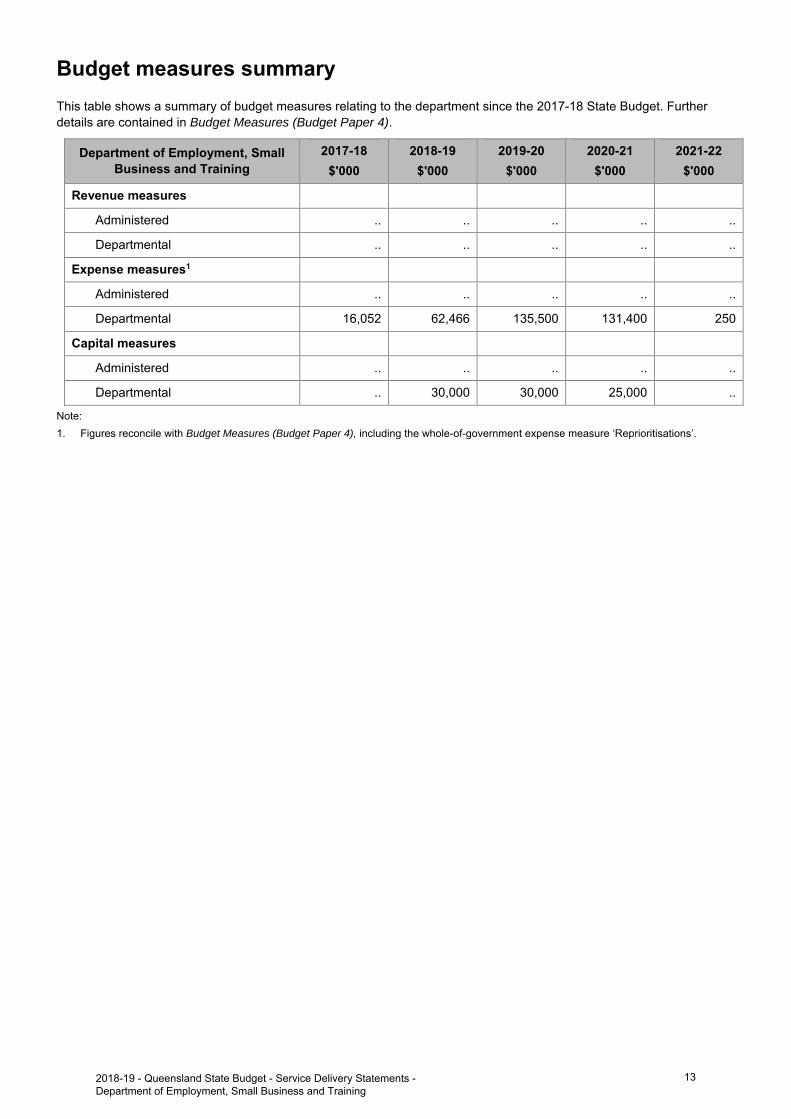
Budget measures summary
This table shows a summary of budget measures relating to the department since the 2017-18 State Budget. Further details are contained in Budget Measures (Budget Paper 4).
Department of Employment, Small Business and Training
2017-18
$'000
2018-19
$'000
2019-20
$'000
2020-21
$'000
2021-22
$'000
Revenue measures
Administered .. .. .. .. ..
Departmental .. .. .. .. ..
Expense measures1
Administered .. .. .. .. ..
Departmental 16,052 62,466 135,500 131,400 250
Capital measures
Administered .. .. .. .. ..
Departmental .. 30,000 30,000 25,000 ..
Note:
1. Figures reconcile with Budget Measures (Budget Paper 4), including the whole-of-government expense measure ‘Reprioritisations’.
2018-19 - Queensland State Budget - Service Delivery Statements -Department of Employment, Small Business and Training
13
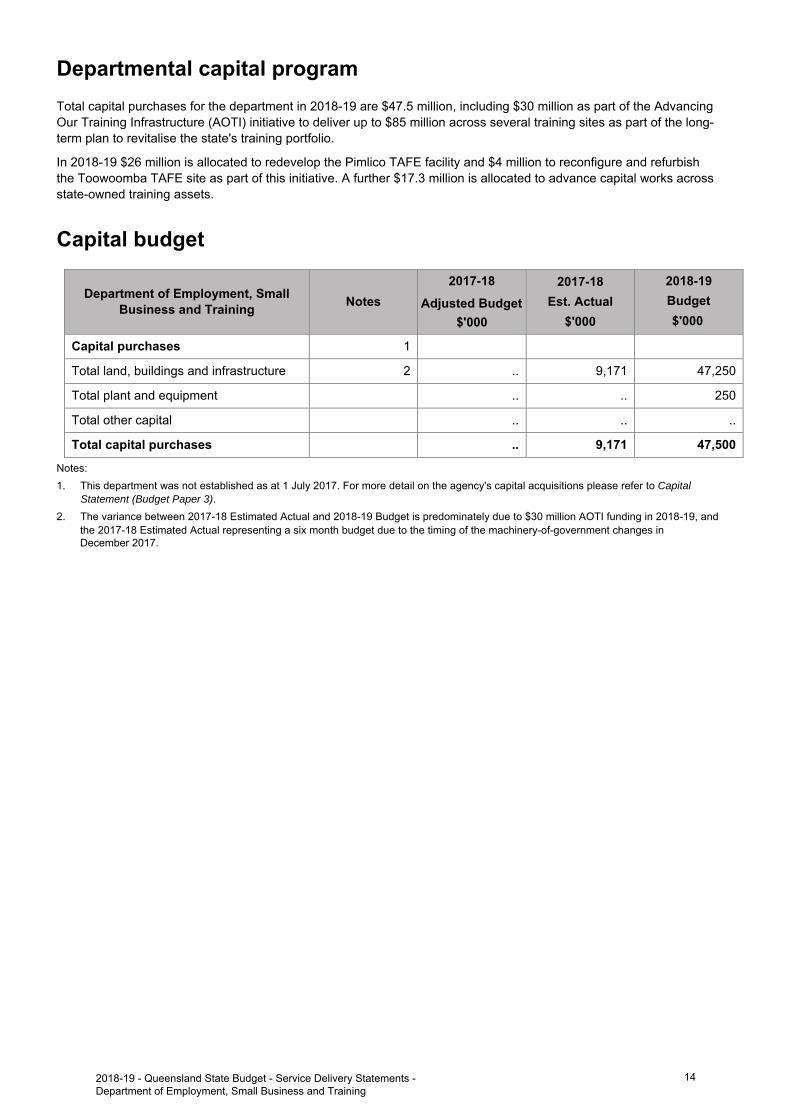
Departmental capital program
Total capital purchases for the department in 2018-19 are $47.5 million, including $30 million as part of the Advancing Our Training Infrastructure (AOTI) initiative to deliver up to $85 million across several training sites as part of the long-term plan to revitalise the state's training portfolio.
In 2018-19 $26 million is allocated to redevelop the Pimlico TAFE facility and $4 million to reconfigure and refurbish the Toowoomba TAFE site as part of this initiative. A further $17.3 million is allocated to advance capital works across state-owned training assets.
Capital budget
Department of Employment, Small Business and Training
Notes
2017-18
Adjusted Budget$'000
2017-18
Est. Actual
$'000
2018-19
Budget
Capital purchases 1
Total land, buildings and infrastructure 2 .. 9,171 47,250
Total plant and equipment .. .. 250
Total other capital .. .. ..
Total capital purchases .. 9,171 47,500
Notes:
1. This department was not established as at 1 July 2017. For more detail on the agency's capital acquisitions please refer to CapitalStatement (Budget Paper 3).
2. The variance between 2017-18 Estimated Actual and 2018-19 Budget is predominately due to $30 million AOTI funding in 2018-19, andthe 2017-18 Estimated Actual representing a six month budget due to the timing of the machinery-of-government changes in December 2017.
2018-19 - Queensland State Budget - Service Delivery Statements -Department of Employment, Small Business and Training
14
$'000
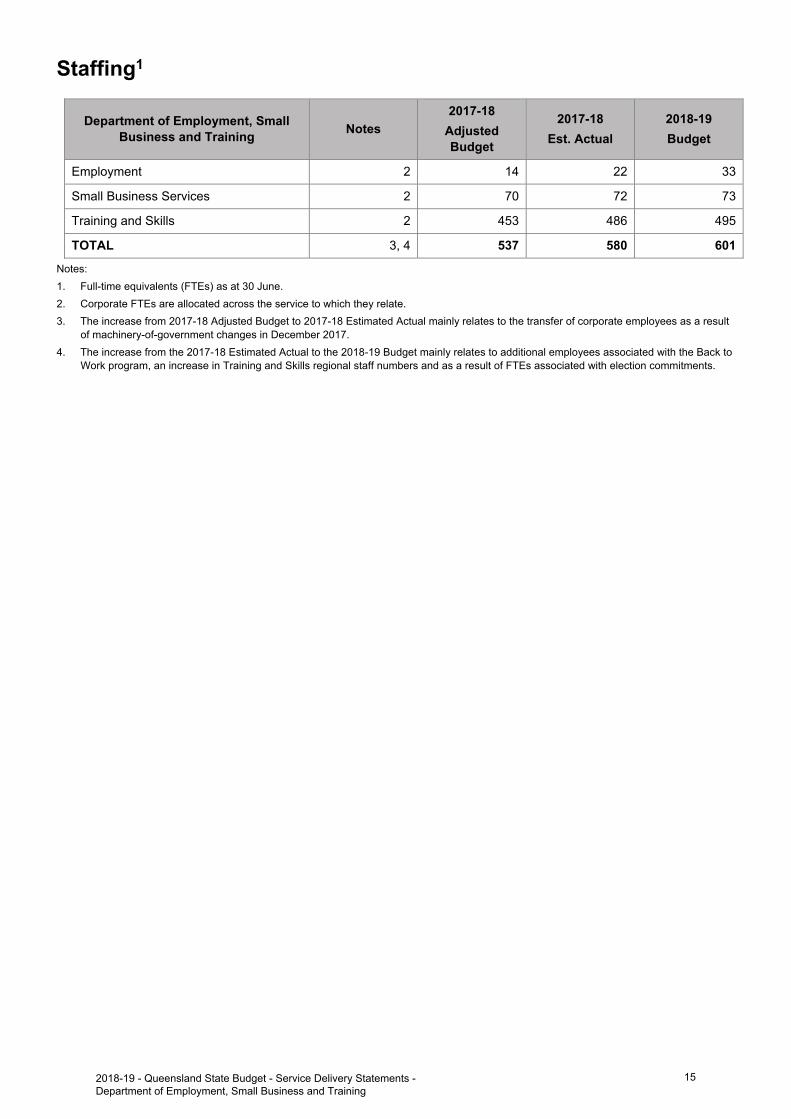
Staffing1
Department of Employment, Small Business and Training
Notes
2017-18
Adjusted Budget
2017-18
Est. Actual
2018-19
Budget
Employment 2 14 22 33
Small Business Services 2 70 72 73
Training and Skills 2 453 486 495
TOTAL 3, 4 537 580 601
Notes:
1. Full-time equivalents (FTEs) as at 30 June.
2. Corporate FTEs are allocated across the service to which they relate.
3. The increase from 2017-18 Adjusted Budget to 2017-18 Estimated Actual mainly relates to the transfer of corporate employees as a resultof machinery-of-government changes in December 2017.
4. The increase from the 2017-18 Estimated Actual to the 2018-19 Budget mainly relates to additional employees associated with the Back toWork program, an increase in Training and Skills regional staff numbers and as a result of FTEs associated with election commitments.
2018-19 - Queensland State Budget - Service Delivery Statements -Department of Employment, Small Business and Training
15
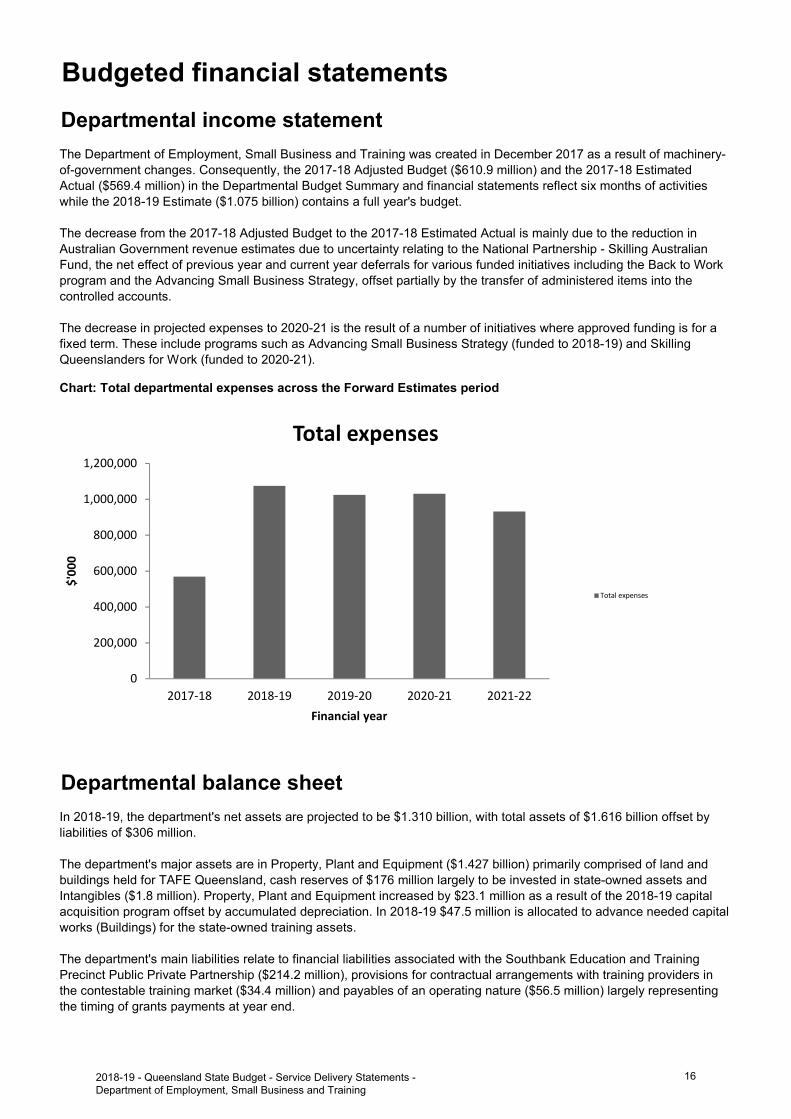
Chart: Total departmental expenses across the Forward Estimates period
Budgeted financial statements
Departmental income statement
The Department of Employment, Small Business and Training was created in December 2017 as a result of machinery-of-government changes. Consequently, the 2017-18 Adjusted Budget ($610.9 million) and the 2017-18 Estimated Actual ($569.4 million) in the Departmental Budget Summary and financial statements reflect six months of activities while the 2018-19 Estimate ($1.075 billion) contains a full year's budget.
The decrease from the 2017-18 Adjusted Budget to the 2017-18 Estimated Actual is mainly due to the reduction in Australian Government revenue estimates due to uncertainty relating to the National Partnership - Skilling Australian Fund, the net effect of previous year and current year deferrals for various funded initiatives including the Back to Work program and the Advancing Small Business Strategy, offset partially by the transfer of administered items into the controlled accounts.
The decrease in projected expenses to 2020-21 is the result of a number of initiatives where approved funding is for a fixed term. These include programs such as Advancing Small Business Strategy (funded to 2018-19) and Skilling Queenslanders for Work (funded to 2020-21).
Departmental balance sheet
In 2018-19, the department's net assets are projected to be $1.310 billion, with total assets of $1.616 billion offset by liabilities of $306 million.
The department's major assets are in Property, Plant and Equipment ($1.427 billion) primarily comprised of land and buildings held for TAFE Queensland, cash reserves of $176 million largely to be invested in state-owned assets and Intangibles ($1.8 million). Property, Plant and Equipment increased by $23.1 million as a result of the 2018-19 capital acquisition program offset by accumulated depreciation. In 2018-19 $47.5 million is allocated to advance needed capital works (Buildings) for the state-owned training assets.
The department's main liabilities relate to financial liabilities associated with the Southbank Education and Training Precinct Public Private Partnership ($214.2 million), provisions for contractual arrangements with training providers in the contestable training market ($34.4 million) and payables of an operating nature ($56.5 million) largely representing the timing of grants payments at year end.
0
200,000
400,000
600,000
800,000
1,000,000
1,200,000
2017-18 2018-19 2019-20 2020-21 2021-22
$'00
0
Financial year
Total expenses
Total expenses
2018-19 - Queensland State Budget - Service Delivery Statements -Department of Employment, Small Business and Training
16
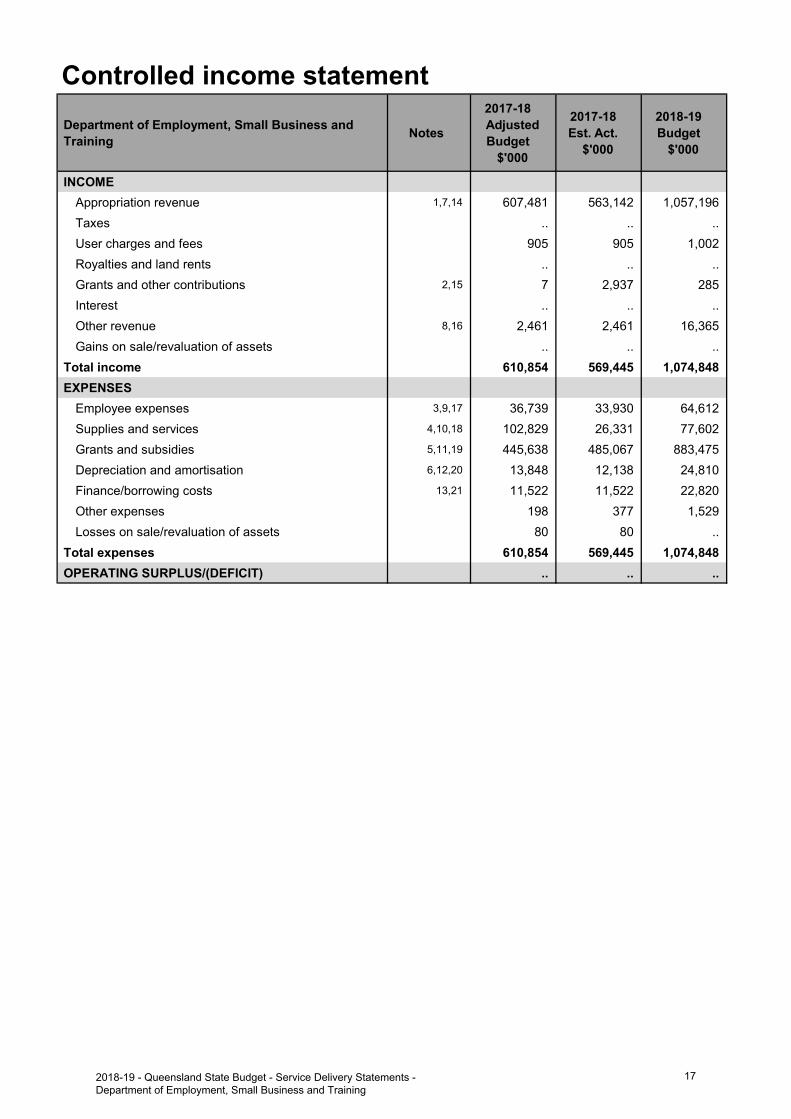
Controlled income statement
Department of Employment, Small Business and Training
Notes
2017-18Adjusted
Budget$'000
2017-18 Est. Act.
$'000
2018-19 Budget
$'000
INCOME
Appropriation revenue 1,7,14 607,481 563,142 1,057,196
Taxes .. .. ..
User charges and fees 905 905 1,002
Royalties and land rents .. .. ..
Grants and other contributions 2,15 7 2,937 285
Interest .. .. ..
Other revenue 8,16 2,461 2,461 16,365
Gains on sale/revaluation of assets .. .. ..
Total income 610,854 569,445 1,074,848
EXPENSES
Employee expenses 3,9,17 36,739 33,930 64,612
Supplies and services 4,10,18 102,829 26,331 77,602
Grants and subsidies 5,11,19 445,638 485,067 883,475
Depreciation and amortisation 6,12,20 13,848 12,138 24,810
Finance/borrowing costs 13,21 11,522 11,522 22,820
Other expenses 198 377 1,529
Losses on sale/revaluation of assets 80 80 ..
Total expenses 610,854 569,445 1,074,848
OPERATING SURPLUS/(DEFICIT) .. .. ..
2018-19 - Queensland State Budget - Service Delivery Statements -Department of Employment, Small Business and Training
17
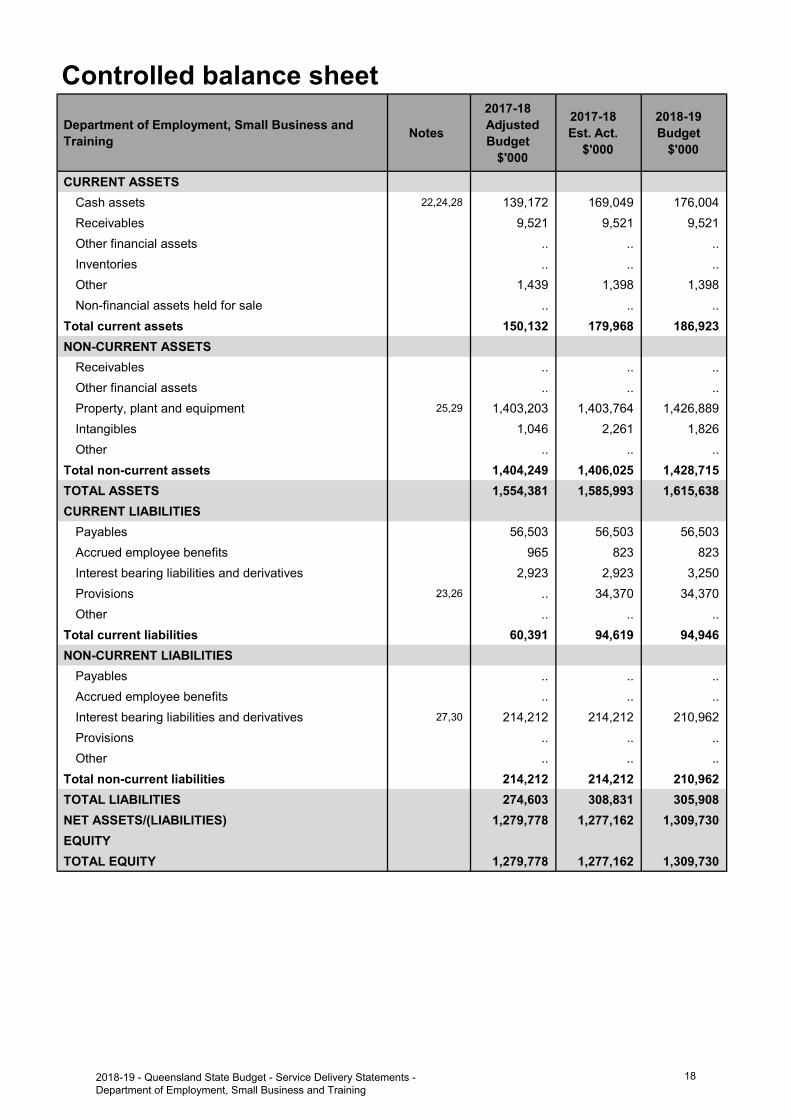
Controlled balance sheet
Department of Employment, Small Business and Training
Notes
2017-18Adjusted
Budget$'000
2017-18 Est. Act.
$'000
2018-19 Budget
$'000
CURRENT ASSETS
Cash assets 22,24,28 139,172 169,049 176,004
Receivables 9,521 9,521 9,521
Other financial assets .. .. ..
Inventories .. .. ..
Other 1,439 1,398 1,398
Non-financial assets held for sale .. .. ..
Total current assets 150,132 179,968 186,923
NON-CURRENT ASSETS
Receivables .. .. ..
Other financial assets .. .. ..
Property, plant and equipment 25,29 1,403,203 1,403,764 1,426,889
Intangibles 1,046 2,261 1,826
Other .. .. ..
Total non-current assets 1,404,249 1,406,025 1,428,715
TOTAL ASSETS 1,554,381 1,585,993 1,615,638
CURRENT LIABILITIES
Payables 56,503 56,503 56,503
Accrued employee benefits 965 823 823
Interest bearing liabilities and derivatives 2,923 2,923 3,250
Provisions 23,26 .. 34,370 34,370
Other .. .. ..
Total current liabilities 60,391 94,619 94,946
NON-CURRENT LIABILITIES
Payables .. .. ..
Accrued employee benefits .. .. ..
Interest bearing liabilities and derivatives 27,30 214,212 214,212 210,962
Provisions .. .. ..
Other .. .. ..
Total non-current liabilities 214,212 214,212 210,962
TOTAL LIABILITIES 274,603 308,831 305,908
NET ASSETS/(LIABILITIES) 1,279,778 1,277,162 1,309,730
EQUITY
TOTAL EQUITY 1,279,778 1,277,162 1,309,730
2018-19 - Queensland State Budget - Service Delivery Statements -Department of Employment, Small Business and Training
18
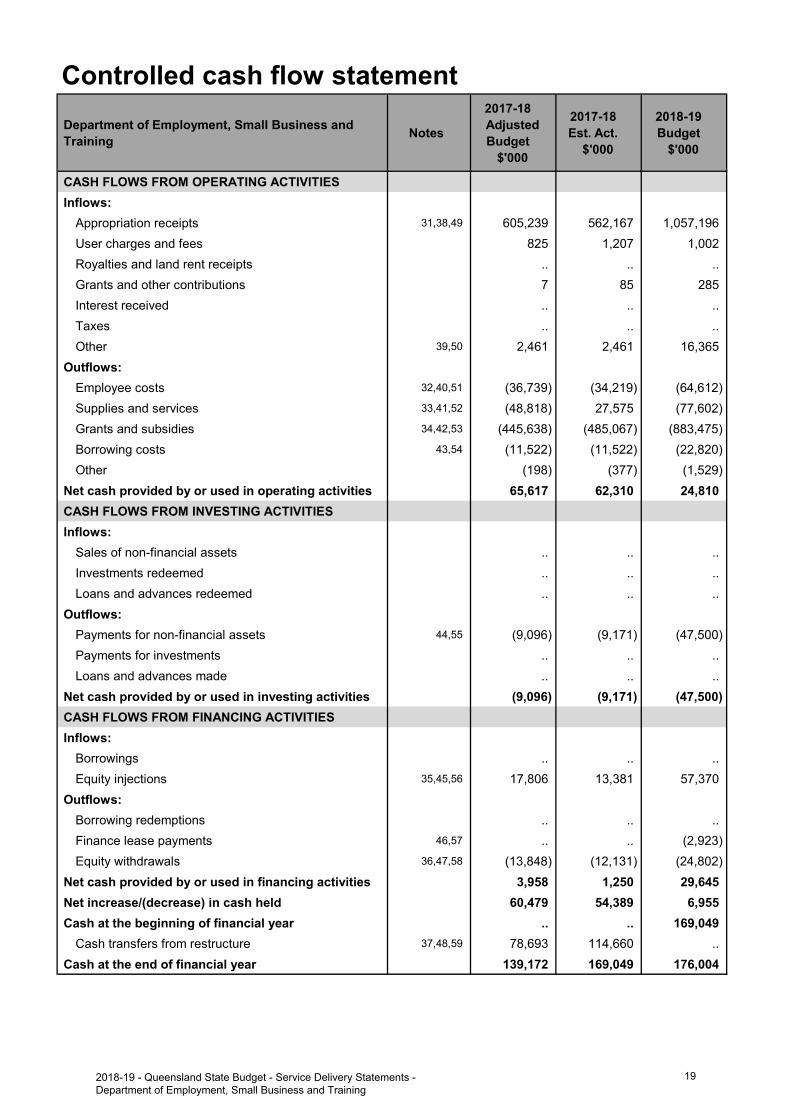
Controlled cash flow statement
Department of Employment, Small Business and Training
Notes
2017-18Adjusted
Budget$'000
2017-18 Est. Act.
$'000
2018-19 Budget
$'000
CASH FLOWS FROM OPERATING ACTIVITIES
Inflows:
Appropriation receipts 31,38,49 605,239 562,167 1,057,196
User charges and fees 825 1,207 1,002
Royalties and land rent receipts .. .. ..
Grants and other contributions 7 85 285
Interest received .. .. ..
Taxes .. .. ..
Other 39,50 2,461 2,461 16,365
Outflows:
Employee costs 32,40,51 (36,739) (34,219) (64,612)
Supplies and services 33,41,52 (48,818) 27,575 (77,602)
Grants and subsidies 34,42,53 (445,638) (485,067) (883,475)
Borrowing costs 43,54 (11,522) (11,522) (22,820)
Other (198) (377) (1,529)
Net cash provided by or used in operating activities 65,617 62,310 24,810
CASH FLOWS FROM INVESTING ACTIVITIES
Inflows:
Sales of non-financial assets .. .. ..
Investments redeemed .. .. ..
Loans and advances redeemed .. .. ..
Outflows:
Payments for non-financial assets 44,55 (9,096) (9,171) (47,500)
Payments for investments .. .. ..
Loans and advances made .. .. ..
Net cash provided by or used in investing activities (9,096) (9,171) (47,500)
CASH FLOWS FROM FINANCING ACTIVITIES
Inflows:
Borrowings .. .. ..
Equity injections 35,45,56 17,806 13,381 57,370
Outflows:
Borrowing redemptions .. .. ..
Finance lease payments 46,57 .. .. (2,923)
Equity withdrawals 36,47,58 (13,848) (12,131) (24,802)
Net cash provided by or used in financing activities 3,958 1,250 29,645
Net increase/(decrease) in cash held 60,479 54,389 6,955
Cash at the beginning of financial year .. .. 169,049
Cash transfers from restructure 37,48,59 78,693 114,660 ..
Cash at the end of financial year 139,172 169,049 176,004
2018-19 - Queensland State Budget - Service Delivery Statements -Department of Employment, Small Business and Training
19
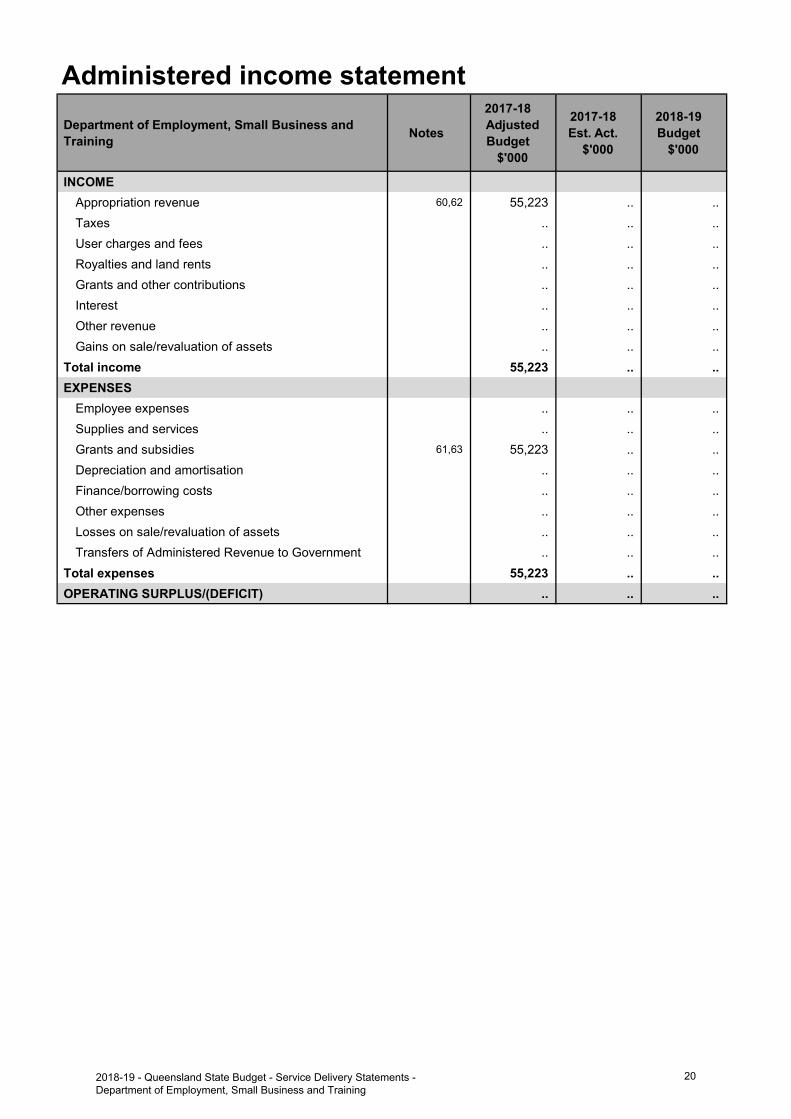
Administered income statement
Department of Employment, Small Business and Training
Notes
2017-18Adjusted
Budget$'000
2017-18 Est. Act.
$'000
2018-19 Budget
$'000
INCOME
Appropriation revenue 60,62 55,223 .. ..
Taxes .. .. ..
User charges and fees .. .. ..
Royalties and land rents .. .. ..
Grants and other contributions .. .. ..
Interest .. .. ..
Other revenue .. .. ..
Gains on sale/revaluation of assets .. .. ..
Total income 55,223 .. ..
EXPENSES
Employee expenses .. .. ..
Supplies and services .. .. ..
Grants and subsidies 61,63 55,223 .. ..
Depreciation and amortisation .. .. ..
Finance/borrowing costs .. .. ..
Other expenses .. .. ..
Losses on sale/revaluation of assets .. .. ..
Transfers of Administered Revenue to Government .. .. ..
Total expenses 55,223 .. ..
OPERATING SURPLUS/(DEFICIT) .. .. ..
2018-19 - Queensland State Budget - Service Delivery Statements -Department of Employment, Small Business and Training
20
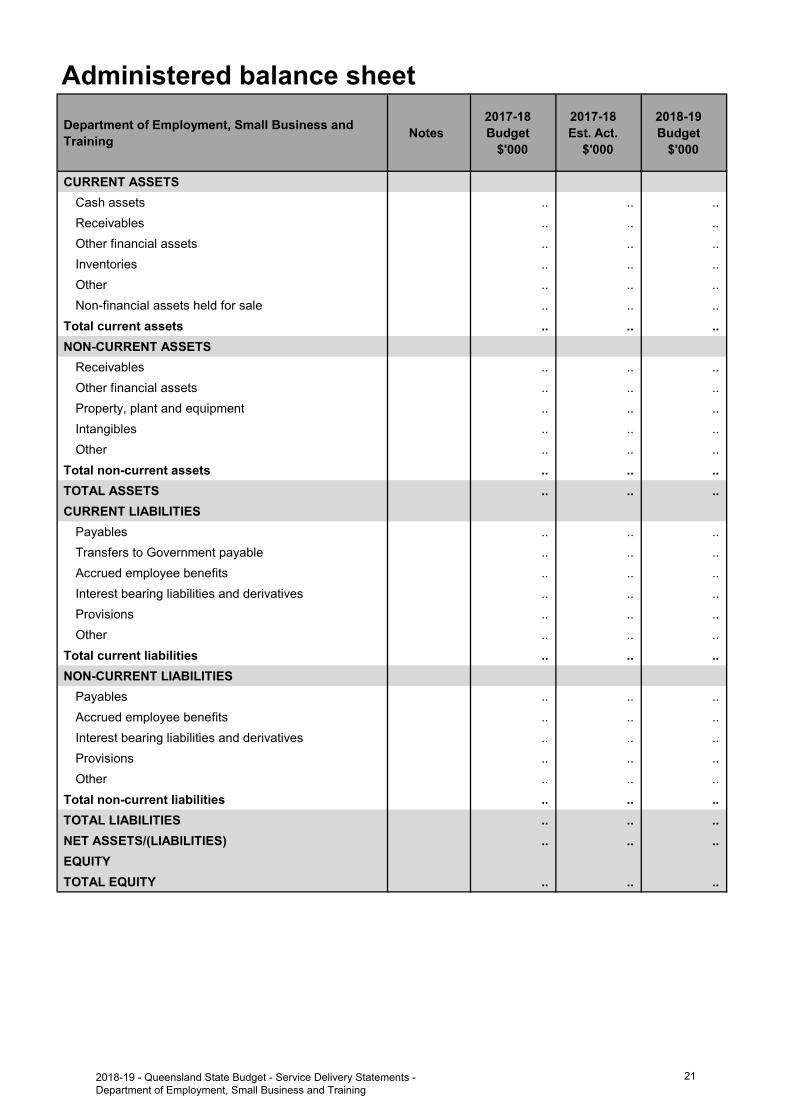
Administered balance sheet
Department of Employment, Small Business and Training
Notes 2017-18 Budget
$'000
2017-18 Est. Act.
$'000
2018-19 Budget
$'000
CURRENT ASSETS
Cash assets .. .. ..
Receivables .. .. ..
Other financial assets .. .. ..
Inventories .. .. ..
Other .. .. ..
Non-financial assets held for sale .. .. ..
Total current assets .. .. ..
NON-CURRENT ASSETS
Receivables .. .. ..
Other financial assets .. .. ..
Property, plant and equipment .. .. ..
Intangibles .. .. ..
Other .. .. ..
Total non-current assets .. .. ..
TOTAL ASSETS .. .. ..
CURRENT LIABILITIES
Payables .. .. ..
Transfers to Government payable .. .. ..
Accrued employee benefits .. .. ..
Interest bearing liabilities and derivatives .. .. ..
Provisions .. .. ..
Other .. .. ..
Total current liabilities .. .. ..
NON-CURRENT LIABILITIES
Payables .. .. ..
Accrued employee benefits .. .. ..
Interest bearing liabilities and derivatives .. .. ..
Provisions .. .. ..
Other .. .. ..
Total non-current liabilities .. .. ..
TOTAL LIABILITIES .. .. ..
NET ASSETS/(LIABILITIES) .. .. ..
EQUITY
TOTAL EQUITY .. .. ..
2018-19 - Queensland State Budget - Service Delivery Statements -Department of Employment, Small Business and Training
21
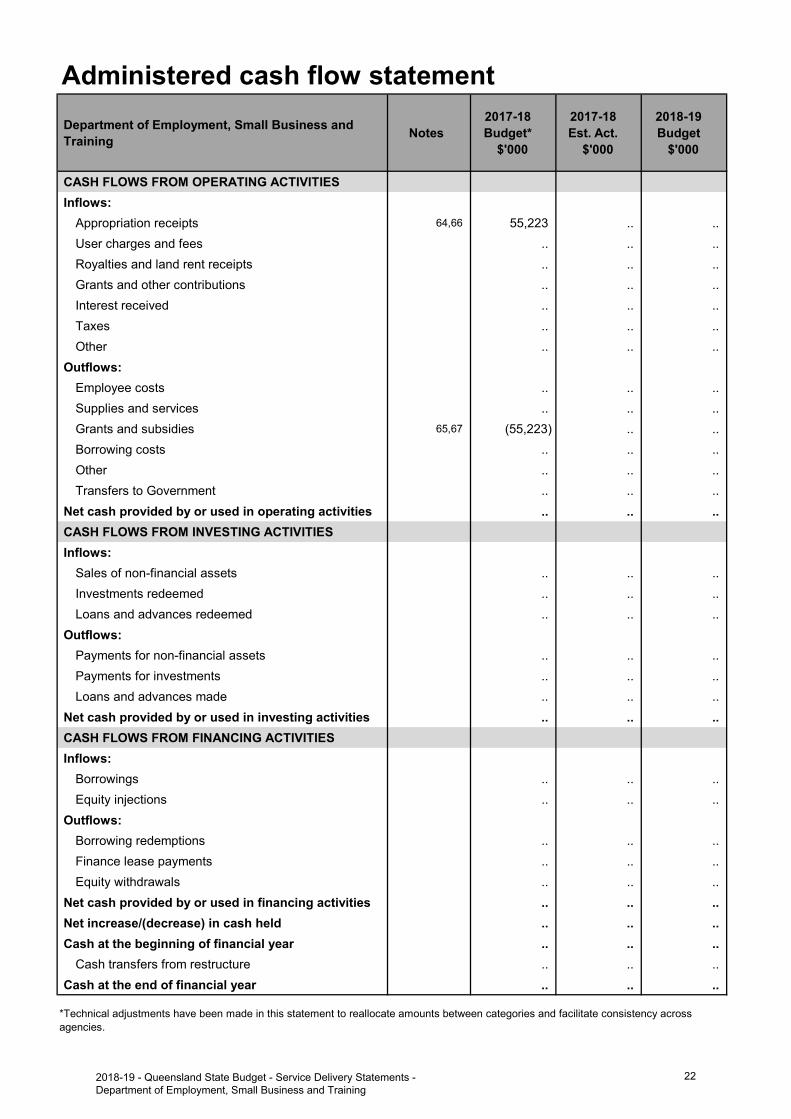
Administered cash flow statement
Department of Employment, Small Business and Training
Notes 2017-18 Budget*
$'000
2017-18 Est. Act.
$'000
2018-19 Budget
$'000
CASH FLOWS FROM OPERATING ACTIVITIES
Inflows:
Appropriation receipts 64,66 55,223 .. ..
User charges and fees .. .. ..
Royalties and land rent receipts .. .. ..
Grants and other contributions .. .. ..
Interest received .. .. ..
Taxes .. .. ..
Other .. .. ..
Outflows:
Employee costs .. .. ..
Supplies and services .. .. ..
Grants and subsidies 65,67 (55,223) .. ..
Borrowing costs .. .. ..
Other .. .. ..
Transfers to Government .. .. ..
Net cash provided by or used in operating activities .. .. ..
CASH FLOWS FROM INVESTING ACTIVITIES
Inflows:
Sales of non-financial assets .. .. ..
Investments redeemed .. .. ..
Loans and advances redeemed .. .. ..
Outflows:
Payments for non-financial assets .. .. ..
Payments for investments .. .. ..
Loans and advances made .. .. ..
Net cash provided by or used in investing activities .. .. ..
CASH FLOWS FROM FINANCING ACTIVITIES
Inflows:
Borrowings .. .. ..
Equity injections .. .. ..
Outflows:
Borrowing redemptions .. .. ..
Finance lease payments .. .. ..
Equity withdrawals .. .. ..
Net cash provided by or used in financing activities .. .. ..
Net increase/(decrease) in cash held .. .. ..
Cash at the beginning of financial year .. .. ..
Cash transfers from restructure .. .. ..
Cash at the end of financial year .. .. ..
*Technical adjustments have been made in this statement to reallocate amounts between categories and facilitate consistency acrossagencies.
2018-19 - Queensland State Budget - Service Delivery Statements -Department of Employment, Small Business and Training
22
Income statementMajor variations between 2017-18 Adjusted Budget and 2017-18 Estimated Actual include:
1. The decrease is mainly due to the removal of Australian Government funding for the National Partnership SkillingAustralian Fund initiative, the net effect of previous year deferrals and 2017-18 deferrals for various limited lifefunded initiatives including the Back to Work program and the Advancing Small Business Strategy, offset partiallyby the transfer of administered items into the controlled accounts.
2. The increase is due to funding received from the Department of Transport and Main Roads for the Taxi andLimousine Industry Business Advisory services program.
3. The decrease relates to a reclassification of employee expenditure to supplies and services for the Back to Workprogram offset by the transfer in of Corporate employees as a result of the machinery-of-government changes inDecember 2017.
4. The decrease is mainly due to the removal of the Australian Government funding for the National PartnershipSkilling Australian Fund initiative offset by a reclassification of expenditure from employee expenses for the Backto Work program.
5. The increase is mainly due to the transfer of administered items into the controlled accounts offset partially by thenet effect of previous year deferrals and 2017-18 deferrals for various limited life funded initiatives including theBack to Work program and the Advancing Small Business Strategy.
6. The decrease is due to a reassessment of scheduled depreciation as part of the machinery-of-governmenttransfer for Training assets.
Major variations between 2017-18 Adjusted Budget and 2018-19 Budget include:
7. The increase is predominately due to the 2017-18 revenue figure reflecting resource transfers for a six monthperiod resulting from the machinery-of-government changes effective December 2017. The 2018-19 estimate isfor the full year with adjustments including the transfer of Administered items into the controlled accounts, theremoval of Australian Government funding for the National Partnership Skilling Australian Fund initiative, deferralsfrom previous years for various limited life funded initiatives including the Back to Work program and theAdvancing Small Business Strategy.
8. The increase is due to the timing of Training assets revenues received from TAFE Queensland, resulting in aminimal revenue budget transfer at the date of the machinery-of-government changes. The 2018-19 estimate isfor the full year.
9. The increase is predominately due to the 2017-18 expense figure reflecting resource transfers for a six monthperiod resulting from the machinery-of-government changes effective December 2017. The 2018-19 estimateis for the full year and includes adjustments for the Advancing Our Training Infrastructure election commitmentand an increase in training and skills regional staff numbers.
10. The 2017-18 supplies and services expense figure reflects resource transfers for a six month period resultingfrom the machinery-of-government changes effective December 2017. The 2018-19estimate is for the full year adjusted for the removal of Australian Government funding for the National
Partnership Skilling Australian Fund Initiative, a reclassification of expenditure from grants and subsidies anddeferrals from previous years for various limited life funded initiatives including Rescuing TAFE and the AustralianGovernment funded Skills Reform initiative.
11. The increase predominately relates to the 2017-18 grants expense figure reflecting resource transfers for asix month period resulting from the machinery-of-government changes effective December 2017. The2018-19 estimate is for the full year adjusted for the transfer of administered items into the controlledaccounts and additional funding for various initiatives including Back to Work and Skilling Queenslanders forWork, various limited life deferrals including Back to Work and the Advancing Small Business Strategy offsetby a reclassification of expenditure to supplies and services.
12. The 2017-18 expense figure reflects depreciation for a six month period resulting from the machinery-of-government changes effective December 2017. The 2018-19 estimate is for the full year.
13. The 2017-18 interest expense figure relating to the Southbank Education and Training Precinct Public PrivatePartnership leased assets reflects a six month period resulting from the machinery-of-government changeseffective December 2017. The 2018-19 estimate is for the full year.
Explanation of variances in the financial statements
2018-19 - Queensland State Budget - Service Delivery Statements -Department of Employment, Small Business and Training
23
Major variations between 2017-18 Estimated Actual and the 2018-19 Budget include:
14. The 2017-18 revenue figure reflects resource transfers for a six month period resulting from the machinery-of-government changes effective December 2017 and adjustments including deferrals for various limited life fundedinitiatives including the Back to Work program and the Advancing Small Business Strategy. The 2018-19 estimateis for the full year with adjustments including deferrals from previous years for various limited life funded initiativesincluding the Back to Work program and the Advancing Small Business Strategy.
15. The decrease is due to the finalisation of the Department of Transport and Main Roads funded Taxi andLimousine Industry Business Advisory services program.
16. The increase is due to the timing of Training assets revenues received from TAFE Queensland, resulting in aminimal revenue budget transfer at the date of the machinery-of-government changes. The 2018-19 estimate isfor the full year.
17. The 2017-18 expense figure reflects resource transfers for a six month period resulting from the machinery-of-government changes effective December 2017 adjusted for a reclassification of employee expenditure to suppliesand services for the Back to Work program offset by the transfer in of Corporate employees as a result of themachinery-of-government changes. The 2018-19 estimate is for the full year and includes adjustments for theAdvancing Our Training Infrastructure election commitment and an increase in training and skills regional staffnumbers.
18. The 2017-18 expense figure reflects resource transfers for a six month period resulting from the machinery-of-government changes effective December 2017 adjusted for a reclassification of expenditure from employeeexpenses for the Back to Work program. The 2018-19 estimate is for the full year adjusted for a reclassification ofexpenditure from grants and subsidies and deferrals from previous years for various limited life funded initiativesincluding Rescuing TAFE and the Australian Government funded Skills Reform initiative.
19. The 2017-18 grants expense figure reflects resource transfers for a six month period resulting from the machinery-of-government changes effective December 2017 adjusted for deferrals for various limited life funded initiativesincluding the Back to Work program and the Advancing Small Business Strategy. The 2018-19 estimate is for thefull year adjusted for additional funding for various initiatives including Back to Work and Skilling Queenslandersfor Work, various limited life deferrals including Back to Work and the Advancing Small Business Strategy offsetby a reclassification of expenditure to supplies and services.
20. The 2017-18 expense figure reflects depreciation for a six month period including a reassessment of scheduleddepreciation as part of the machinery-of-government transfer for Training assets effective December 2017. The2018-19 estimate is for the full year.
21. The 2017-18 interest expense figure relating to the Southbank Education and Training Precinct Public PrivatePartnership leased assets reflects a six month period resulting from the machinery-of-government changeseffective December 2017. The 2018-19 estimate is for the full year.
Balance sheetMajor variations between 2017-18 Adjusted Budget and 2017-18 Estimated Actual include:
22. The increase is due to the establishment of a provision for contractual arrangements with training providers in thecontestable training market.
23. The increase is due to the establishment of a provision for contractual arrangements with training providers in thecontestable training market.
Major variations between 2017-18 Adjusted Budget and 2018-19 Budget include:
24. The increase is due to the establishment of a year end grants provision for contractual arrangements with trainingproviders in the contestable training market and funding yet to be invested into the Training assets capitalprogram.
25. The increase is due to the investment in the Training assets capital program, including the Advancing OurTraining Infrastructure initiative, and adjusted for annual depreciation.
26. The increase is due to the establishment of a provision for contractual arrangements with training providers in thecontestable training market.
27. The decrease is due to the annual reclassification of non-current finance lease payments to current paymentsrelating to the Southbank Education and Training Precinct Public Private Partnership.
2018-19 - Queensland State Budget - Service Delivery Statements -Department of Employment, Small Business and Training
24
Major variations between 2017-18 Estimated Actual and the 2018-19 Budget include:
28. The increase is due to funding to be invested into the Training assets capital program.
29. The increase is due to the investment in the Training assets capital program, including the Advancing OurTraining Infrastructure initiative, and adjusted for annual depreciation.
30. The decrease is due to the annual reclassification of non-current finance lease payments to current paymentsrelating to the Southbank Education and Training Precinct Public Private Partnership.
Cash flow statementMajor variations between 2017-18 Adjusted Budget and 2017-18 Estimated Actual include:
31. The decrease is mainly due to the removal of Australian Government funding for the National Partnership SkillingAustralian Fund initiative, the net effect of previous year deferrals and 2017-18 deferrals for various limited lifefunded initiatives including the Back to Work program and the Advancing Small Business Strategy, offset partiallyby the transfer of administered items into the controlled accounts.
32. The decrease relates to a reclassification of employee expenditure to supplies and services for the Back to Workprogram offset by the transfer in of Corporate employees as a result of the machinery-of-government changes inDecember 2017.
33. The decrease is mainly due to the removal of the Australian Government funding for the National PartnershipSkilling Australian Fund initiative offset by a reclassification of expenditure from employee expenses for the Backto Work program.
34. The increase is mainly due to the transfer of administered items into the controlled accounts offset partially by thenet effect of previous year deferrals and 2017-18 deferrals for various limited life funded initiatives including theBack to Work program and the Advancing Small Business Strategy.
35. The decrease reflects a conversion of equity to appropriation revenue related to the TAFE Queensland rental subsidy and Training assets capital investment program.
36. The decrease is due to a reassessment of scheduled depreciation as part of the machinery-of-governmenttransfer for Training assets.
37. The increase is mainly due to the establishment of a provision for contractual arrangements with training providersin the contestable training market.
Major variations between 2017-18 Adjusted Budget and 2018-19 Budget include:
38. The increase is predominately due to the 2017-18 revenue figure reflecting resource transfers for a six monthperiod resulting from the machinery-of-government changes effective December 2017. The 2018-19 estimate isfor the full year with adjustments including the transfer of Administered items into the controlled accounts, theremoval of Australian Government funding for the National Partnership Skilling Australian Fund initiative anddeferrals from previous years for various limited life funded initiatives including the Back to Work program and theAdvancing Small Business Strategy.
39. The increase is due to the timing of Training assets revenues received from TAFE Queensland, resulting in aminimal revenue budget transfer at the date of the machinery-of-government changes. The 2018-19 estimate isfor the full year.
40. The 2017-18 outflow for supplies and services reflects resource transfers for a six month period resulting from themachinery-of-government changes effective December 2017. The 2018-19 estimate is for the full year adjustedfor the removal of Australian Government funding for the National Partnership Skilling Australian Fund Initiative, areclassification of expenditure from grants and subsidies and deferrals from previous years for various limited lifefunded initiatives including Rescuing TAFE and the Australian Government funded Skills Reform initiative.
41. The 2017-18 supplies and services outflows reflects resource transfers for a six month period resulting from themachinery-of-government changes effective December 2017. The 2018-19 estimate is for the full year adjustedfor the removal of Australian Government funding for the National Partnership Skilling Australian Fund Initiative, areclassification of expenditure from grants and subsidies and deferrals from previous years for various limited lifefunded initiatives including Rescuing TAFE and the Australian Government funded Skills Reform initiative.
2018-19 - Queensland State Budget - Service Delivery Statements -Department of Employment, Small Business and Training
25
42. The increase predominately relates to the 2017-18 grants outflow reflects resource transfers for a six monthperiod resulting from the machinery-of-government changes effective December 2017. The 2018-19 estimate isfor the full year adjusted for the transfer of administered items into the controlled accounts and additional fundingfor various initiatives including Back to Work and Skilling Queenslanders for Work, various limited life deferralsincluding Back to Work and the Advancing Small Business Strategy offset by a reclassification of expenditure tosupplies and services.
43. The 2017-18 borrowing cost outflow relates to the Southbank Education and Training Precinct Public PrivatePartnership leased assets reflecting a six month period resulting from the machinery-of-government changeseffective December 2017. The 2018-19 estimate is for the full year.
44. The increase is mainly due to 2018-19 estimate is a full year including new investment in the Advancing OurTraining Infrastructure initiative, with 2017-18 reflecting a six month estimate resulting from the machinery-of-government changes effective December 2017.
45. The increase is mainly due to the capital investment in the Advancing Our Training Assets initiative in 2018-19,with 2017-18 reflecting a six month estimate resulting from the machinery-of-government changes effectiveDecember 2017.
46. The increase reflects finance lease payments relating to Southbank Education and Training Precinct PublicPrivate Partnership.
47. The 2017-18 equity withdrawal is associated with depreciation for a six month period resulting from the machinery-of-government changes effective December 2017. The 2018-19estimate is for the full year.
48. The decrease is the result of cash transfers in 2017-18 due to the machinery-of-government changes inDecember 2017 comparing with nil cash transfers from restructure in 2018-19.
Major variations between 2017-18 Estimated Actual and the 2018-19 Budget include:
49. The 2017-18 appropriation inflow reflects resource transfers for a six month period resulting from the machinery-of-government changes effective December 2017 and adjustments including deferrals for various limited lifefunded initiatives including the Back to Work program and the Advancing Small Business Strategy. The 2018-19estimate is for the full year with adjustments including deferrals from previous years for various limited life fundedinitiatives including the Back to Work program and the Advancing Small Business Strategy.
50. The increase is due to the timing of Training assets revenues received from TAFE Queensland, resulting in aminimal revenue budget transfer at the date of the machinery-of-government changes. The 2018-19 estimate isfor the full year.
51. The 2017-18 outflows for employee costs reflects resource transfers for a six month period resulting from themachinery-of-government changes effective December 2017 adjusted for a reclassification of employeeexpenditure to supplies and services for the Back to Work program offset by the transfer in of Corporateemployees as a result of the machinery-of-government changes. The 2018-19 estimate is for the full year andincludes adjustments for the Advancing Our Training Infrastructure election commitment and an increase inTraining and Skills regional staff numbers.
52. The 2017-18 supplies and services outflows reflects resource transfers for a six month period resulting from themachinery-of-government changes effective December 2017 adjusted for a reclassification of expenditure fromemployee expenses for the Back to Work program. The 2018-19 estimate is for the full year adjusted for areclassification of expenditure from grants and subsidies and deferrals from previous years for various limited lifefunded initiatives including Rescuing TAFE and the Australian Government funded Skills Reform initiative and amovement in payables of an operating nature.
53. The 2017-18 grants outflow reflects resource transfers for a six month period resulting from the machinery-of-government changes effective December 2017 adjusted for deferrals for various limited life funded initiativesincluding the Back to Work program and the Advancing Small Business Strategy. The 2018-19 estimate is for thefull year adjusted for additional funding for various initiatives including Back to Work and Skilling Queenslandersfor Work, various limited life deferrals including Back to Work and the Advancing Small Business Strategy offsetby a reclassification of expenditure to supplies and services.
54. The 2017-18 borrowing cost outflow relates to the Southbank Education and Training Precinct Public PrivatePartnership leased assets reflecting a six month period resulting from the machinery-of-government changeseffective December 2017. The 2018-19 estimate is for the full year.
55. The increase is mainly due to 2018-19 estimate is a full year including new investment in the Advancing OurTraining Infrastructure initiative, with 2017-18 reflecting a six month estimate resulting from the machinery-of-government changes effective December 2017.
2018-19 - Queensland State Budget - Service Delivery Statements -Department of Employment, Small Business and Training
26
56. The increase is mainly due to the capital investment in the Advancing Our Training Assets initiative in 2018-19,with 2017-18 reflecting a six month estimate resulting from the machinery-of-government changes effectiveDecember 2017 adjusted for a conversion of equity to appropriation funding related to the TAFE Queenslandrental subsidy and Training assets capital investment program.
57. The increase reflects finance lease payments relating to Southbank Education and Training Precinct PublicPrivate Partnership.
58. The 2017-18 equity withdrawal is associated with depreciation for a six month period resulting from the machinery-of-government changes effective December 2017 adjusted for an additional reassessment of scheduleddepreciation as part of the machinery-of-government transfer for Training assets. The 2018-19estimate is for the full year.
59. The decrease is the result of cash transfers in 2017-18 due to the machinery-of-government changes inDecember 2017 comparing with nil cash transfers from restructure in 2018-19.
Administered income statementMajor variations between 2017-18 Adjusted Budget and 2017-18 Estimated Actual include:
60. The decrease is a result of the transfer of administered items into the controlled accounts.
61. The decrease is a result of the transfer of administered items into the controlled accounts.
Major variations between 2017-18 Adjusted Budget and 2018-19 Budget include:
62. The decrease is a result of the transfer of administered items into the controlled accounts.
63. The decrease is a result of the transfer of administered items into the controlled accounts.
Administered cash flow statementMajor variations between 2017-18 Budget* and 2017-18 Estimated Actual include:
64. The decrease is a result of the transfer of administered items into the controlled accounts.
65. The decrease is a result of the transfer of administered items into the controlled accounts.
Major variations between 2017-18 Budget* and 2018-19 Budget include:
66. The decrease is a result of the transfer of administered items into the controlled accounts.
67. The decrease is a result of the transfer of administered items into the controlled accounts.
2018-19 - Queensland State Budget - Service Delivery Statements -Department of Employment, Small Business and Training
27
Statutory body
TAFE Queensland
Overview
The Vocational Education and Training (VET) sector in Queensland is critical to the supply of skills for occupations linked to growth sectors that will contribute to the State’s future economic prosperity. TAFE Queensland’s vision is to be the leading provider of VET that is at the heart of community success.
TAFE Queensland supports the Queensland Government to create jobs in a strong economy and be a responsive Government through the delivery of education and training that enables the careers of our students and the development of industries and communities.
During 2017-18, TAFE Queensland has experienced some great success and increased recognition as a respected VET provider. Challenges experienced as a result of shifts in the VET sector, such as the introduction of VET Student Loans, has impacted on the overall financial position. With ongoing changes to market settings, these challenges will continue for 2018-19.
In 2018-19, TAFE Queensland’s key priorities include:
partnering with Government, industry and local communities to contribute to the economic success of the State
access to quality training for Queenslanders
building on TAFE Queensland's strong reputation for innovative and technology-enhanced training solutions
market leading educators that enhance our training delivery and equip our students with skills for now and into thefuture.
Service summary
TAFE Queensland offers practical, industry-relevant training from foundation skills and entry level qualifications to higher education degrees, providing individuals with training options at every stage of their career and employers with skilling solutions that respond to complex workforce needs.
In 2018-19, TAFE Queensland will continue working alongside the Queensland Government to improve the quality of, access to and affordability of VET for all Queenslanders. Above all, TAFE Queensland will maintain its focus on building a financially strong and community-minded public provider that addresses skills needs to support the economic growth of the State.
2018-19 - Queensland State Budget - Service Delivery Statements -Department of Employment, Small Business and Training
28

Service performance
Performance statement
TAFE Queensland
Service area objective
To be an efficient, effective, sustainable and responsive organisation that develops skills and employment opportunities for individuals to meet employer, industry and community demands.
Service area description
Delivering sustainable and responsive Vocational Education and Training services needed by Queenslanders.
TAFE Queensland Notes 2017-18
Target/Est.
2017-18
Est. Actual
2018-19
Target/Est.
Service standards
Effectiveness measures
Proportion of all attempted competencies successfully completed 1 90% 90% 91%
Student post training outcome (employed or in further study after training) 1 88% 85% 88%
Proportion of graduates satisfied with the overall quality of their training 1 89% 88% 89%
Proportion of employers satisfied with the overall quality of training 1 89% 89% 89%
Efficiency measure
Average cost per competency successfully completed 2 $770 $808 $805
Notes:
1. Survey results reported in 2018-19 will relate to student and employer activity in the 2018 calendar year.
2. Average cost per competency successfully completed (total operating expenses/total units of competency) is impacted by a number ofvariables, including completion rates, volume of training activity, type and duration of competencies delivered, class sizes and general costincreases (wage and Consumer Price Index increases).
2018-19 - Queensland State Budget - Service Delivery Statements - Department of Employment, Small Business and Training
29
Staffing1
TAFE Queensland Notes 2017-18
Budget
2017-18
Est. Actual
2018-19
Budget
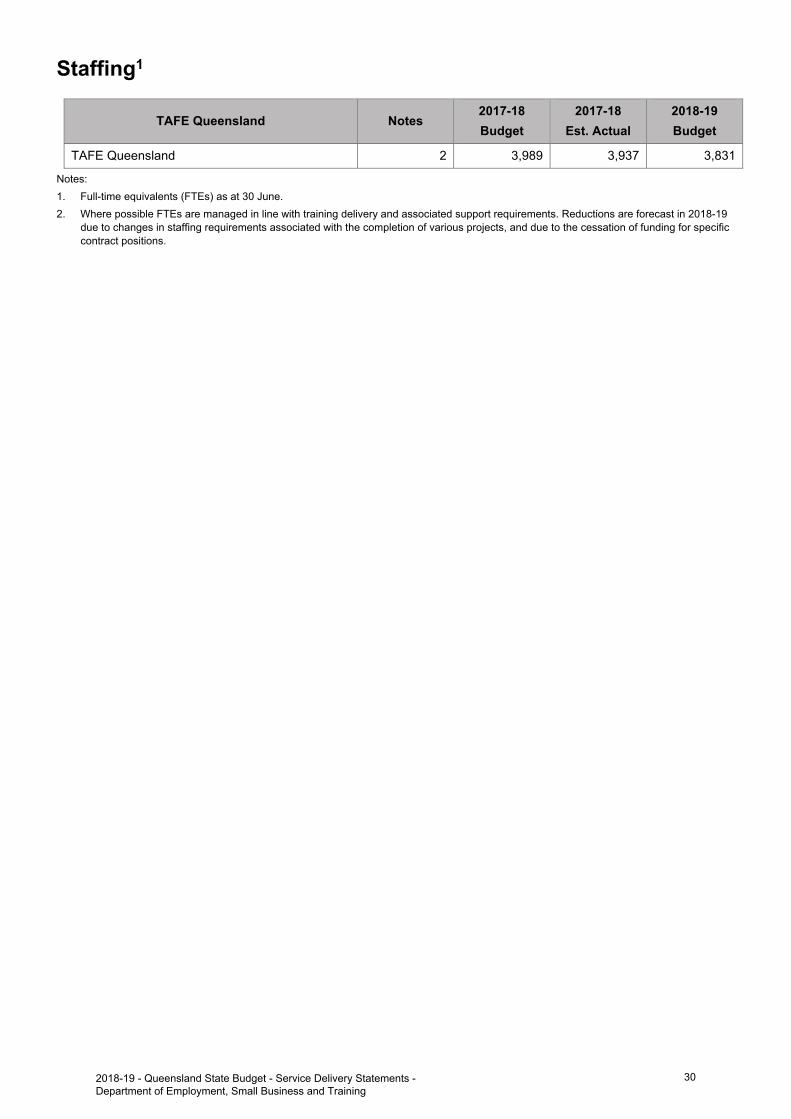
TAFE Queensland 2 3,989 3,937 3,831
Notes:
1. Full-time equivalents (FTEs) as at 30 June.
2. Where possible FTEs are managed in line with training delivery and associated support requirements. Reductions are forecast in 2018-19due to changes in staffing requirements associated with the completion of various projects, and due to the cessation of funding for specificcontract positions.
2018-19 - Queensland State Budget - Service Delivery Statements - Department of Employment, Small Business and Training
30
Income statement
TAFE Queensland Notes 2017-18 Budget
$'000
2017-18 Est. Act.
$'000
2018-19 Budget
$'000
INCOME
Taxes .. .. ..
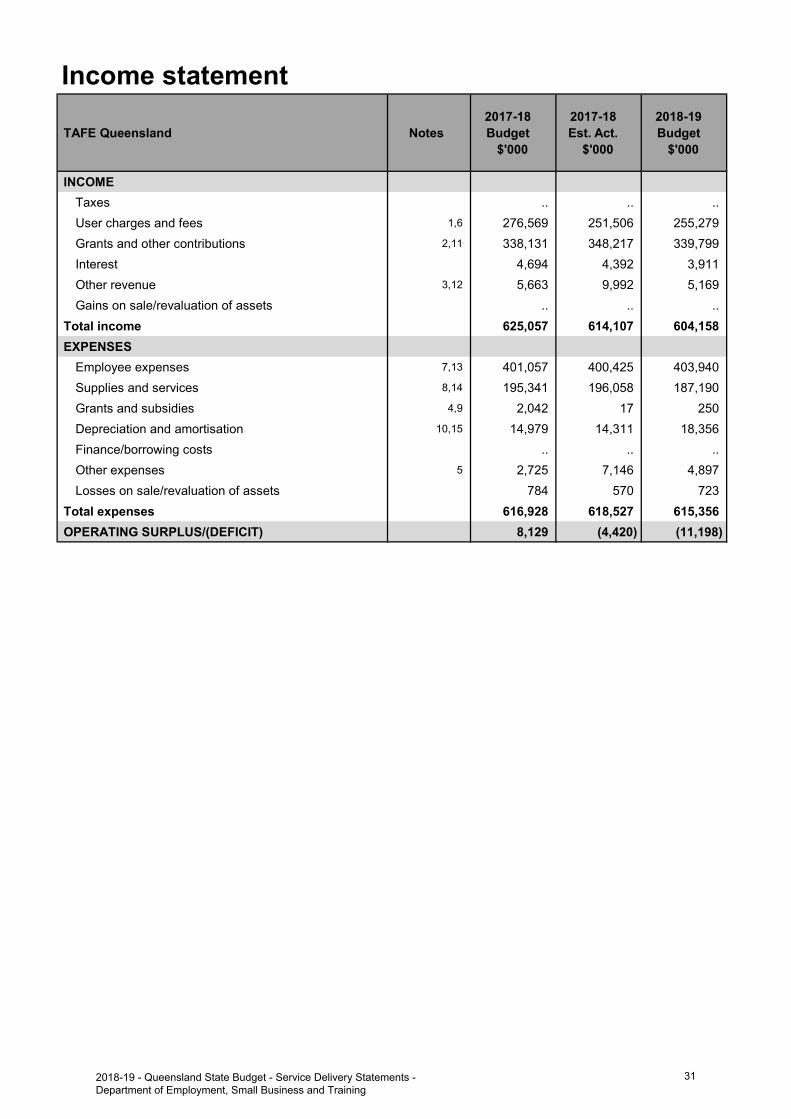
User charges and fees 1,6 276,569 251,506 255,279
Grants and other contributions 2,11 338,131 348,217 339,799
Interest 4,694 4,392 3,911
Other revenue 3,12 5,663 9,992 5,169
Gains on sale/revaluation of assets .. .. ..
Total income 625,057 614,107 604,158
EXPENSES
Employee expenses 7,13 401,057 400,425 403,940
Supplies and services 8,14 195,341 196,058 187,190
Grants and subsidies 4,9 2,042 17 250
Depreciation and amortisation 10,15 14,979 14,311 18,356
Finance/borrowing costs .. .. ..
Other expenses 5 2,725 7,146 4,897
Losses on sale/revaluation of assets 784 570 723
Total expenses 616,928 618,527 615,356
OPERATING SURPLUS/(DEFICIT) 8,129 (4,420) (11,198)
2018-19 - Queensland State Budget - Service Delivery Statements - Department of Employment, Small Business and Training
31
Balance sheet
TAFE Queensland Notes 2017-18 Budget
$'000
2017-18 Est. Act.
$'000
2018-19 Budget
$'000
CURRENT ASSETS
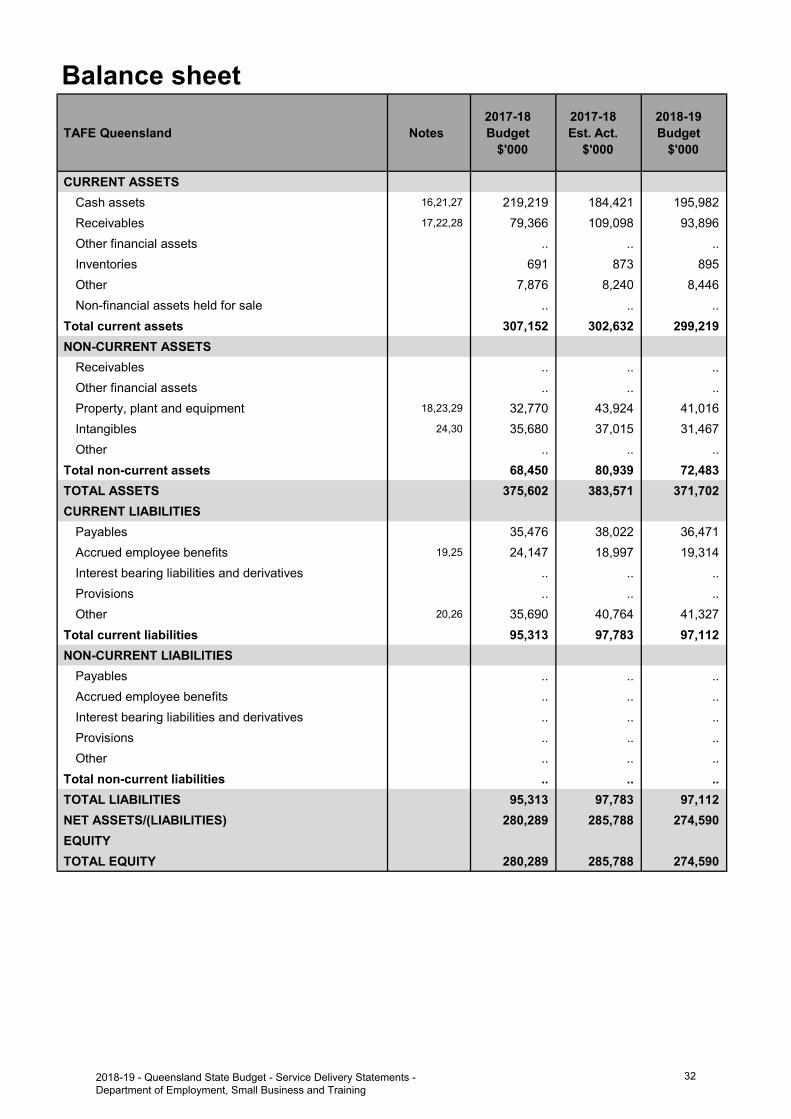
Cash assets 16,21,27 219,219 184,421 195,982
Receivables 17,22,28 79,366 109,098 93,896
Other financial assets .. .. ..
Inventories 691 873 895
Other 7,876 8,240 8,446
Non-financial assets held for sale .. .. ..
Total current assets 307,152 302,632 299,219
NON-CURRENT ASSETS
Receivables .. .. ..
Other financial assets .. .. ..
Property, plant and equipment 18,23,29 32,770 43,924 41,016
Intangibles 24,30 35,680 37,015 31,467
Other .. .. ..
Total non-current assets 68,450 80,939 72,483
TOTAL ASSETS 375,602 383,571 371,702
CURRENT LIABILITIES
Payables 35,476 38,022 36,471
Accrued employee benefits 19,25 24,147 18,997 19,314
Interest bearing liabilities and derivatives .. .. ..
Provisions .. .. ..
Other 20,26 35,690 40,764 41,327
Total current liabilities 95,313 97,783 97,112
NON-CURRENT LIABILITIES
Payables .. .. ..
Accrued employee benefits .. .. ..
Interest bearing liabilities and derivatives .. .. ..
Provisions .. .. ..
Other .. .. ..
Total non-current liabilities .. .. ..
TOTAL LIABILITIES 95,313 97,783 97,112
NET ASSETS/(LIABILITIES) 280,289 285,788 274,590
EQUITY
TOTAL EQUITY 280,289 285,788 274,590
2018-19 - Queensland State Budget - Service Delivery Statements - Department of Employment, Small Business and Training
32
Cash flow statement
TAFE Queensland Notes 2017-18 Budget
$'000
2017-18 Est. Act.
$'000
2018-19 Budget
$'000
CASH FLOWS FROM OPERATING ACTIVITIES
Inflows:
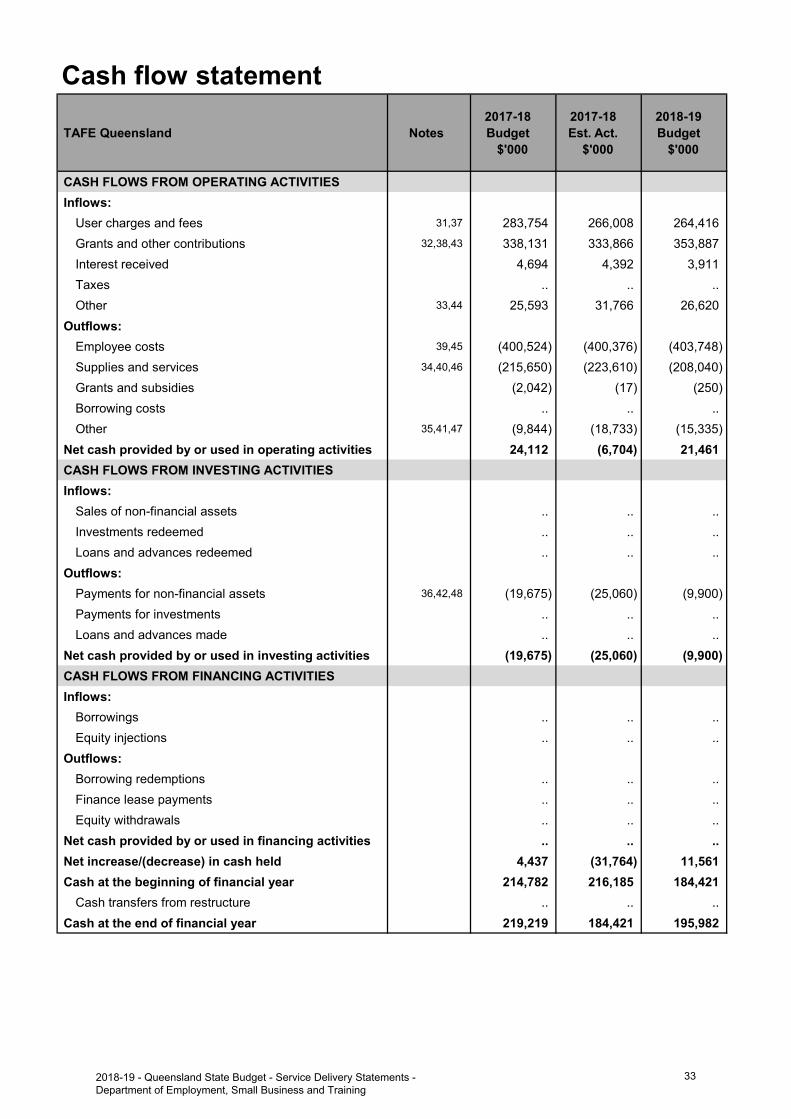
User charges and fees 31,37 283,754 266,008 264,416
Grants and other contributions 32,38,43 338,131 333,866 353,887
Interest received 4,694 4,392 3,911
Taxes .. .. ..
Other 33,44 25,593 31,766 26,620
Outflows:
Employee costs 39,45 (400,524) (400,376) (403,748)
Supplies and services 34,40,46 (215,650) (223,610) (208,040)
Grants and subsidies (2,042) (17) (250)
Borrowing costs .. .. ..
Other 35,41,47 (9,844) (18,733) (15,335)
Net cash provided by or used in operating activities 24,112 (6,704) 21,461
CASH FLOWS FROM INVESTING ACTIVITIES
Inflows:
Sales of non-financial assets .. .. ..
Investments redeemed .. .. ..
Loans and advances redeemed .. .. ..
Outflows:
Payments for non-financial assets 36,42,48 (19,675) (25,060) (9,900)
Payments for investments .. .. ..
Loans and advances made .. .. ..
Net cash provided by or used in investing activities (19,675) (25,060) (9,900)
CASH FLOWS FROM FINANCING ACTIVITIES
Inflows:
Borrowings .. .. ..
Equity injections .. .. ..
Outflows:
Borrowing redemptions .. .. ..
Finance lease payments .. .. ..
Equity withdrawals .. .. ..
Net cash provided by or used in financing activities .. .. ..
Net increase/(decrease) in cash held 4,437 (31,764) 11,561
Cash at the beginning of financial year 214,782 216,185 184,421
Cash transfers from restructure .. .. ..
Cash at the end of financial year 219,219 184,421 195,982
2018-19 - Queensland State Budget - Service Delivery Statements - Department of Employment, Small Business and Training
33
Income statementMajor variations between 2017-18 Budget and 2017-18 Estimated Actual include:
1. The decrease in user charges and fees mainly relates to reduced training revenue as a result of changes arising from the VET Student loan program introduced by the Australian Government on 1 January 2017 (replacing the previous VET FEE-HELP program). Lower revenues have also been received from student fees as well as a reduction in revenues under the Australian Governments Skills for Education and Employment (SEE) program.
2. The increase in grants and other contributions mainly relates to a one-off contribution from the Department ofEmployment, Training and Small Business (DESBT) for the reimbursement of expenses and funding receivedunder the Regional Skills Adjustment Strategy. This was partially offset by lower than projected revenues fromstudents enrolled in government subsidised training programs, particularly Certificate 3 Guarantee programs.
3. The increase in other revenue mainly relates to recognition of one-off revenue relating to the treatment of value in kind services provided under a Gold Coast 2018 Commonwealth Games sponsorship agreement.
4. The decrease in grants and subsidies mainly relates to scholarship and sponsorship expenses initially budgetedas grants.
5. The increase in other expenses is predominantly due to the Gold Coast 2018 Commonwealth Games sponsorship.
Major variations between 2017-18 Budget and 2018-19 Budget include:
6. The decrease in user charges and fees mainly relates to reduced training revenue as a result of changes arisingfrom the VET Student loan program, lower revenues projected to be received from student fees and a reduction inrevenues under the SEE program.
7. The increase in employee expenses relates to wage increases offset by changes in staffing levels.
8. The decrease in supplies and services is largely driven by costs incurred in 2017-18 relating to key projects including the Gold Coast 2018 Commonwealth Games sponsorship, as well as expected savings from new payroll processing arrangements and hosting and support costs for the new student management system.
9. The decrease in grants and subsidies mainly relates to scholarship and sponsorship expenses initially budgetedas grants in the 2017-18 budget.
10. The increase in depreciation and amortisation charges mainly relates to the capitalisation of product developmentprograms and the student management system.
Major variations between 2017-18 Estimated Actual and the 2018-19 Budget include:
11. The decrease in grants and other contributions relates mainly one-off funding from DESBT in 2017-18 and cessation of 457 visa training benchmark contributions. This is partially offset by a projected increase in revenues from government subsidised training.
12. The decrease in other revenue mainly relates to recognition of one-off revenue in 2017-18 relating to the treatment of value in kind services provided under a Gold Coast 2018 Commonwealth Games sponsorship agreement.
13. The increase in employee expenses relates to wage increases offset by changes in staffing levels.
14. The decrease in supplies and services is largely driven by costs incurred in 2017-18 relating to key projects including the Gold Coast 2018 Commonwealth Games sponsorship, as well as expected savings from new payroll processing arrangements and hosting and support costs for the new student management system.
15. The increase in depreciation and amortisation charges mainly relates to the capitalisation of product developmentprograms and the student management system.
Balance sheetMajor variations between 2017-18 Budget and 2017-18 Estimated Actual include:
16. The decrease in cash assets relates to lower receipt of training revenues and subsidies, higher payments tosuppliers and goods and services tax (GST) remitted to the Australian Taxation Office (ATO), as well as additionalcapital expenditure relating to the fit-out of training facilities to support a new training contract.
17. The increase in receivables is due to the contribution from DESBT and higher levels of training subsidies andstudent receivables expected at year end.
Explanation of variances in the financial statements
2018-19 - Queensland State Budget - Service Delivery Statements - Department of Employment, Small Business and Training
34
18. The increase in property, plant and equipment mainly relates to the additional fit-out of training facilities to support a new training contract, higher opening balances carried forward from 2016-17 as a result of additional purchases in 2016-17 and recognition of a share of assets under the Sunshine Coast Health Institute (SCHI) joint arrangement.
19. The decrease in accrued employee benefits mainly relates to lower levels of payables expected to be carried atyear end for annual leave and long service leave levies.
20. The increase in other current liabilities is mainly due to higher levels of unearned revenue expected to be carriedat year end for training to be completed in 2018-19.
Major variations between 2017-18 Budget and 2018-19 Budget include:
21. The decrease in cash assets in 2018-19 is predominately due to the forecast operating losses in 2017-18 and2018-19.
22. The increase in receivables is due to higher levels of training subsidies and student receivables expected at yearend.
23. The increase in property, plant and equipment mainly relates to the fit-out of training facilities in 2017-18 to support a new training contract, higher opening balances carried forward from 2016-17 as a result of additional purchases in 2016-17 and recognition of a share of assets under the SCHI joint arrangement.
24. The decrease in intangibles mainly relates to amortisation of master product and the student managementsystem.
25. The decrease in accrued employee benefits mainly relates to lower levels of payables expected to be carried atyear end for annual leave and long service leave levies.
26. The increase in other current liabilities is mainly due to higher levels of unearned revenue expected to be carriedat year end for training to be completed in 2019-20.
Major variations between 2017-18 Estimated Actual and the 2018-19 Budget include:
27. The increase in cash assets is predominately due to the receipt of the contribution from DESBT relating to2017-18, partially offset by the forecast operating losses in 2018-19.
28. The decrease in receivables is due to the receipt of the contribution from DESBT relating to 2017-18.
29. The decrease in property, plant and equipment mainly relates to the depreciation of assets.
30. The decrease in intangibles relates mainly amortisation of master product and student management system.
Cash flow statementMajor variations between 2017-18 Budget and 2017-18 Estimated Actual include:
31. The decrease in user charges and fees relates to lower than budgeted training based revenues.
32. The decrease in grants and other contributions mainly relates to lower than budgeted government subsidisedtraining revenues.
33. The increase in other operating inflows mainly relates to one-off revenues recognised under the Gold Coast 2018 Commonwealth Games sponsorship and an increase in input tax credits received from the ATO.
34. The increase in supplies and services outflows mainly relates to timing of the settlement of payables.
35. The increase in other operating outflows mainly relates to an increase in GST remitted to the ATO and expenses relating to the Gold Coast 2018 Commonwealth Games sponsorship.
36. The increase in payments for non financial assets mainly relates to the fit-out of training facilities to support a newtraining contract and purchase of perpetual licences for the finance system.
Major variations between 2017-18 Budget and 2018-19 Budget include:
37. The decrease in user charges and fees relates to a reduction in budgeted training based revenues.
38. The increase in grants and other contributions mainly relates to the receipt of the contribution from DESBTrelating to 2017-18 and funding received under the Regional Skills Adjustment Strategy, partially offset by thecessation of 457 visa training benchmark contributions.
39. The increase in employee costs mainly relates to wage increase offset by changes in staffing levels.
2018-19 - Queensland State Budget - Service Delivery Statements - Department of Employment, Small Business and Training
35
40. The decrease in supplies and services mainly relates to costs incurred in 2017-18 relating to key projects including the Gold Coast 2018 Commonwealth Games sponsorship, as well as expected savings from new payroll processing arrangements and hosting and support costs for the new student management system.
41. The increase in other operating outflows mainly relates to an increase in GST remitted to the ATO during the year.
42. The decrease in payments for non financial assets relates to lower budgeted spend due to the completion of thestudent management system implementation and lower expenditure on product development as the programmoves into a maintenance rather than development cycle.
Major variations between 2017-18 Estimated Actual and the 2018-19 Budget include:
43. The increase in grants and other contributions is mainly due to the receipt of the contribution from DESBT relatingto 2017-18 and a projected increase in revenues from government subsidised training, partially offset by thecessation of 457 visa training benchmark contributions.
44. The decrease in other operating inflows mainly relates to the additional one-off revenues recognised under the Gold Coast 2018 Commonwealth Games sponsorship in 2017-18.
45. The increase in employee costs mainly relates to wage increase offset by changes in staffing levels.
46. The decrease in supplies and services outflows is largely driven by costs incurred in 2017-18 relating to key projects including the Gold Coast 2018 Commonwealth Games sponsorship, savings from new payroll processing arrangements and hosting and support costs for the new student management system, and settlement of payables from 2016-17 in 2017-18.
47. The decrease in other operating outflows is mainly related to expenses for the Gold Coast 2018 Commonwealth Games sponsorship.
48. The decrease in payments for non-financial assets relates to lower budgeted spend due to the completion of the student management system implementation and lower expenditure on product development as the program moves into a maintenance cycle, and one-off expenditure in 2017-18 relating to a fit-out and perpetual licences.
2018-19 - Queensland State Budget - Service Delivery Statements - Department of Employment, Small Business and Training
36
Glossary of terms
Accrual accounting Recognition of economic events and other financial transactions involving revenue, expenses, assets, liabilities and equity as they occur and reporting in financial statements in the period to which they relate, rather than when a flow of cash occurs.
Administered items Assets, liabilities, revenues and expenses an entity administers, without discretion, on behalf of the Government.
Agency/entity Used generically to refer to the various organisational units within Government that deliver services or otherwise service Government objectives. The term can include departments, commercialised business units, statutory bodies or other organisations established by Executive decision.
Appropriation Funds issued by the Treasurer, under Parliamentary authority, to agencies during a financial year for: • delivery of agreed services• administered items• adjustment of the Government’s equity in agencies, including acquiring of
capital.
Balance sheet A financial statement that reports the assets, liabilities and equity of an entity as at a particular date.
Capital A term used to refer to an entity’s stock of assets and the capital grants it makes to other agencies. Assets include property, plant and equipment, intangible items and inventories that an entity owns/controls and uses in the delivery of services.
Cash Flow Statement A financial statement reporting the cash inflows and outflows for an entity’s operating, investing and financing activities in a particular period.
Controlled items Assets, liabilities, revenues and expenses that are controlled by departments. These relate directly to the departmental operational objectives and arise at the discretion and direction of that department.
Depreciation The periodic allocation of the cost of physical assets, representing the amount of the asset consumed during a specified time.
Equity Equity is the residual interest in the assets of the entity after deduction of its liabilities. It usually comprises the entity’s accumulated surpluses/losses, capital injections and any reserves.
Equity injection An increase in the investment of the Government in a public sector agency.
2018-19 - Queensland State Budget - Service Delivery Statements -Department of Employment, Small Business and Training
37
Financial statements Collective description of the Income Statement, the Balance Sheet and the Cash Flow Statement for an entity’s controlled and administered activities.
Income statement A financial statement highlighting the accounting surplus or deficit of an entity. It provides an indication of whether the entity has sufficient revenue to meet expenses in the current year, including non-cash costs such as depreciation.
Outcomes Whole-of-government outcomes are intended to cover all dimensions of community wellbeing. They express the current needs and future aspirations of communities, within a social, economic and environment context.
Own-source revenue Revenue that is generated by an agency, generally through the sale of goods and services, but it may also include some Commonwealth funding.
Priorities Key policy areas that will be the focus of Government activity.
Services The actions or activities (including policy development) of an agency which contribute to the achievement of the agency’s objectives.
Service area Related services grouped into a high level service area for communicating the broad types of services delivered by an agency.
Service standard Define a level of performance that is expected to be achieved appropriate for the service area or service. Service standards are measures of efficiency or effectiveness.
2018-19 - Queensland State Budget - Service Delivery Statements - Department of Employment, Small Business and Training
38


Queensland Budget 2018–19 Service Delivery Statements
Queensland Budget 2018–19
Service Delivery Statements
budget.qld.gov.au
Top Related